
The Effect of High Glass Fiber Content and Reinforcement Combination on Pulse-Echo Ultrasonic Measurement of Composite Ship Structures


Abstract
1. Introduction
2. Background
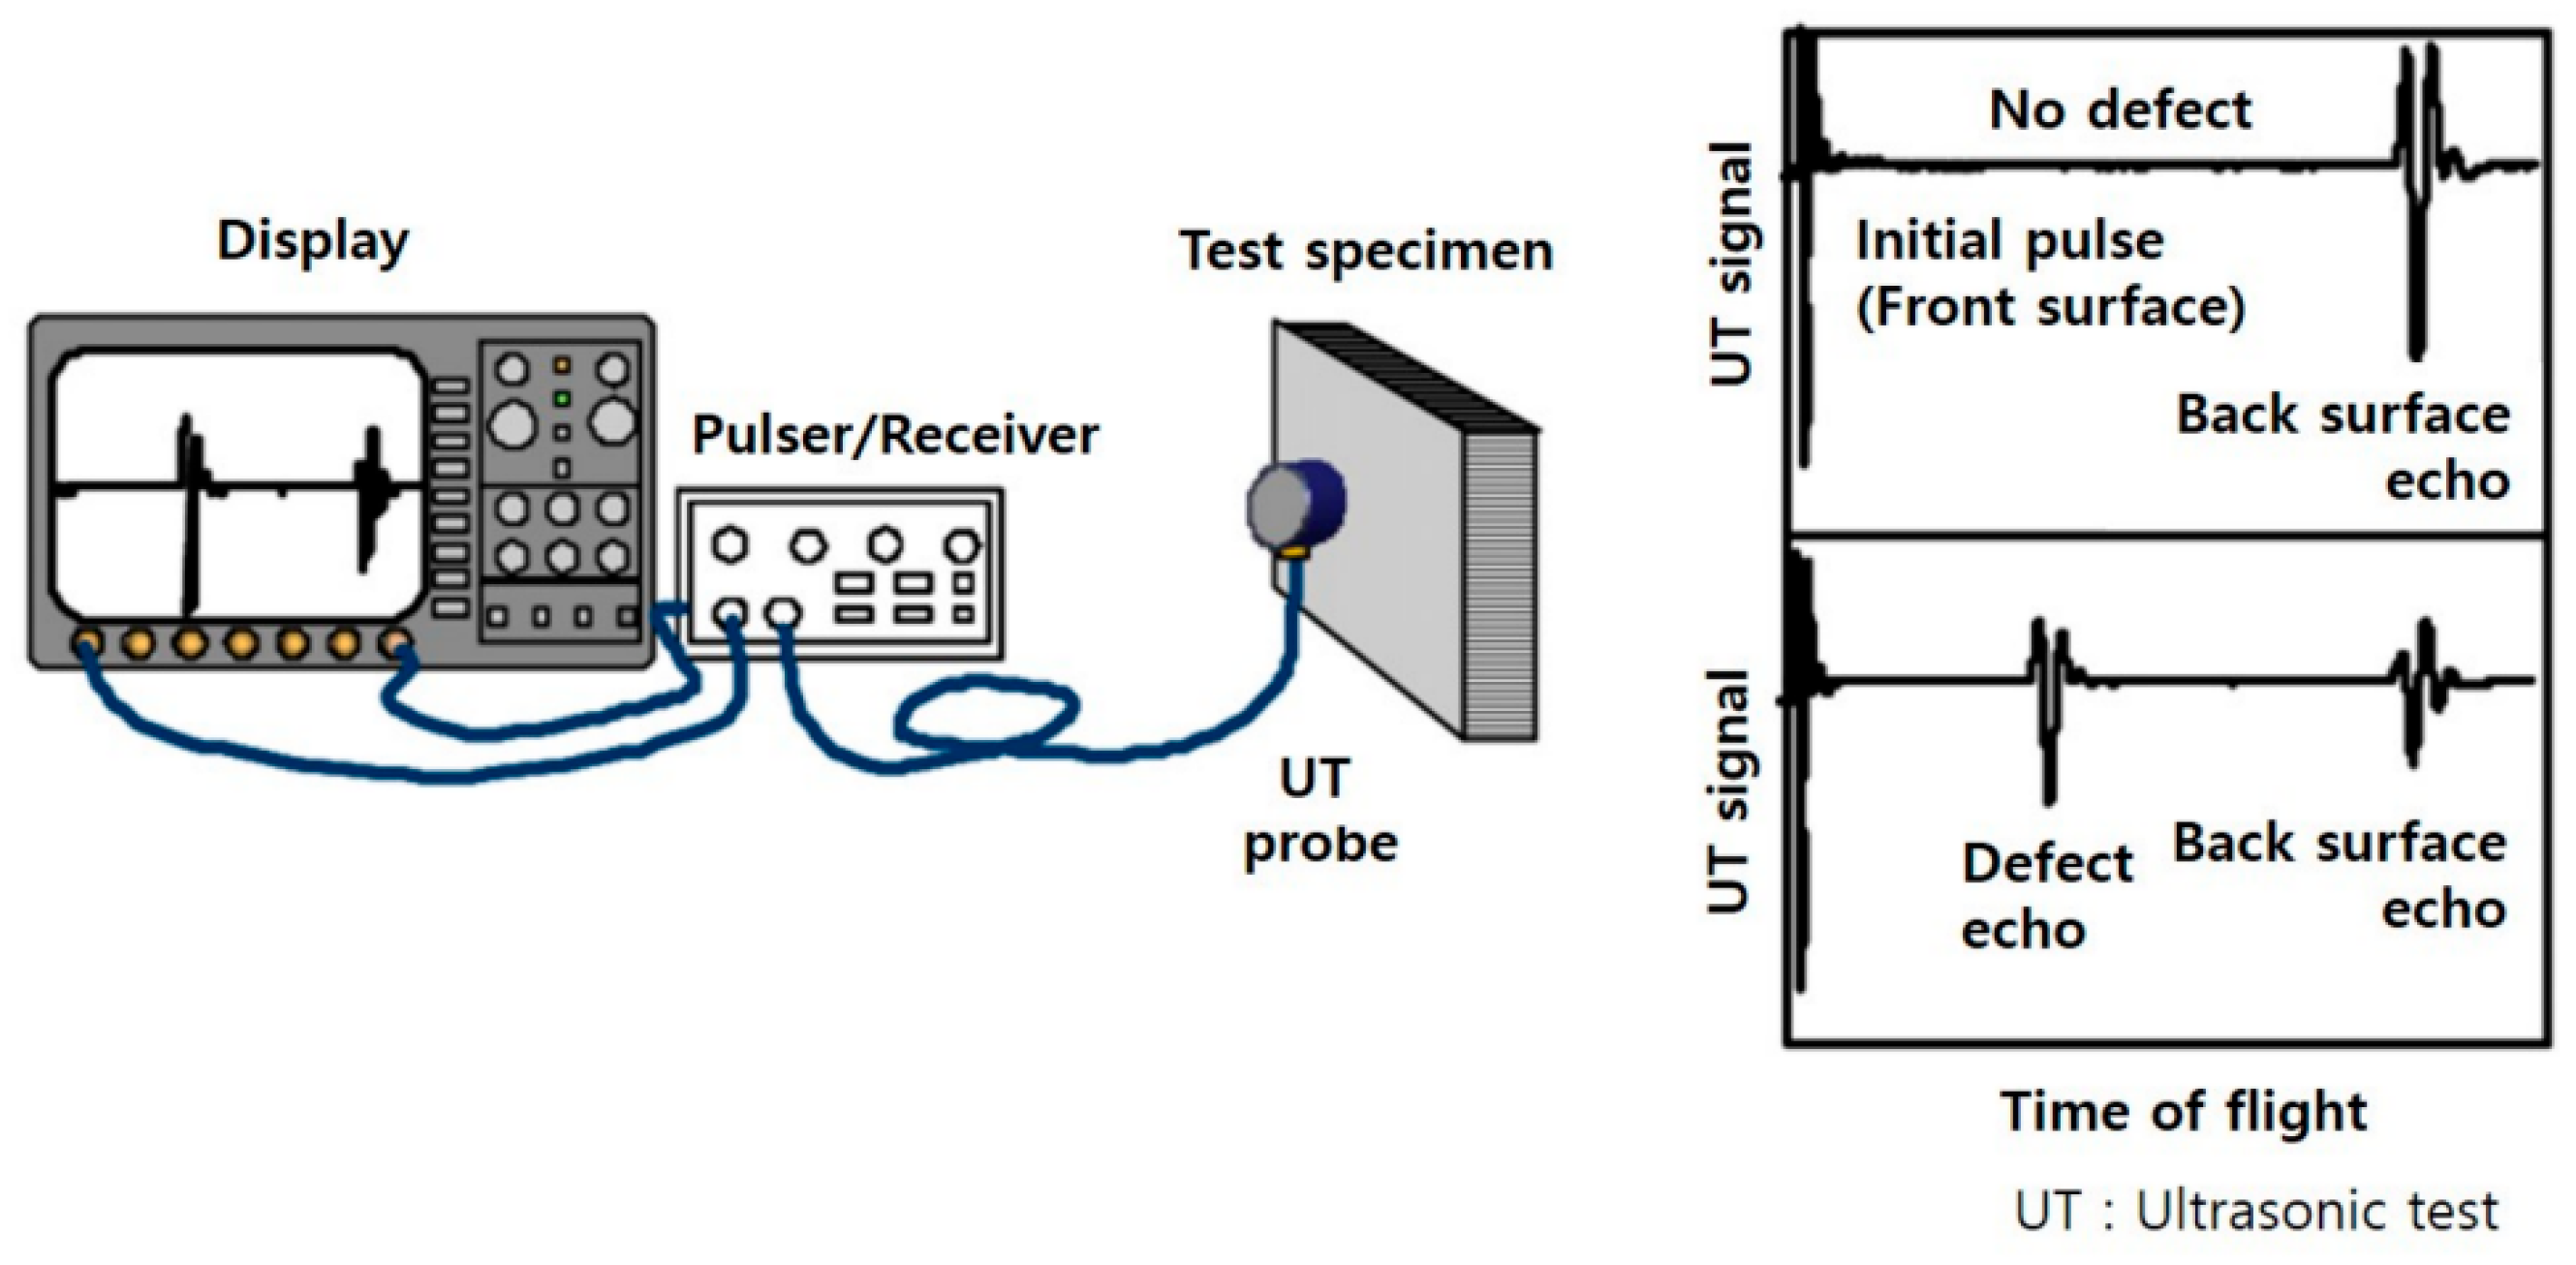
2.1. Pulse-Echo Ultrasonics
2.2. Effect of GFRP Laminate Quality on Ultrasonic NDE
3. Experiments and Results
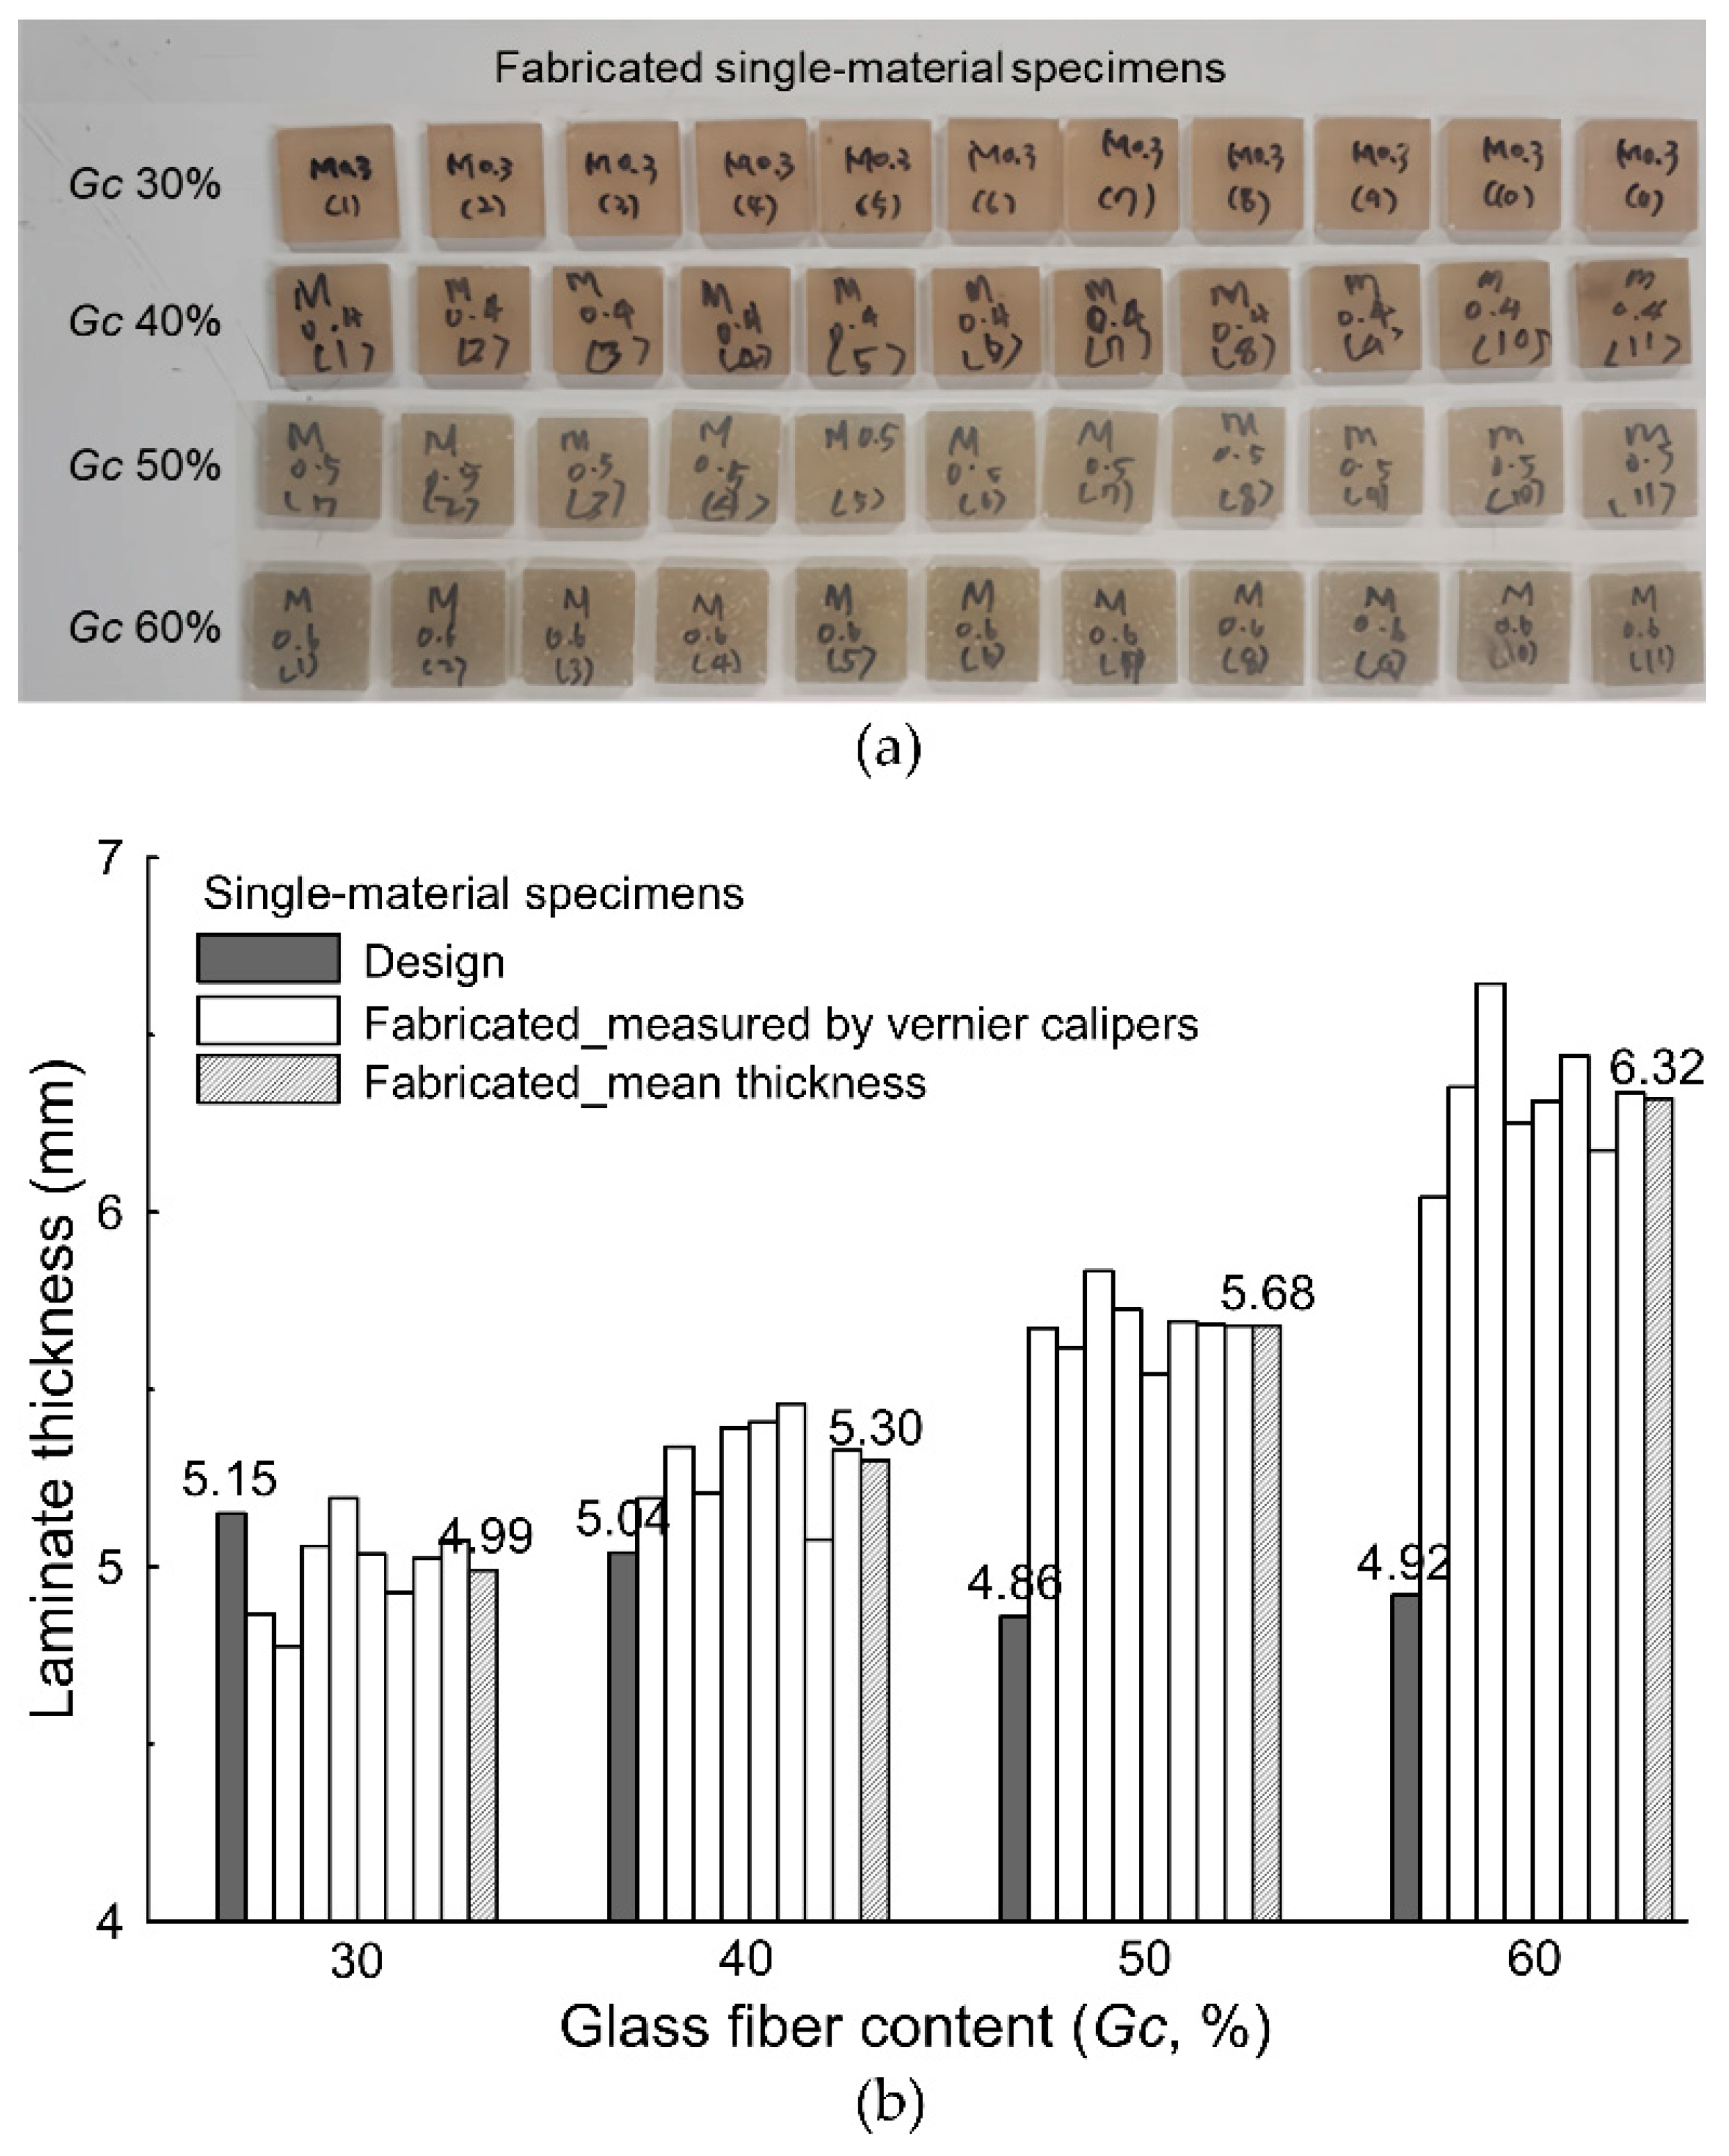
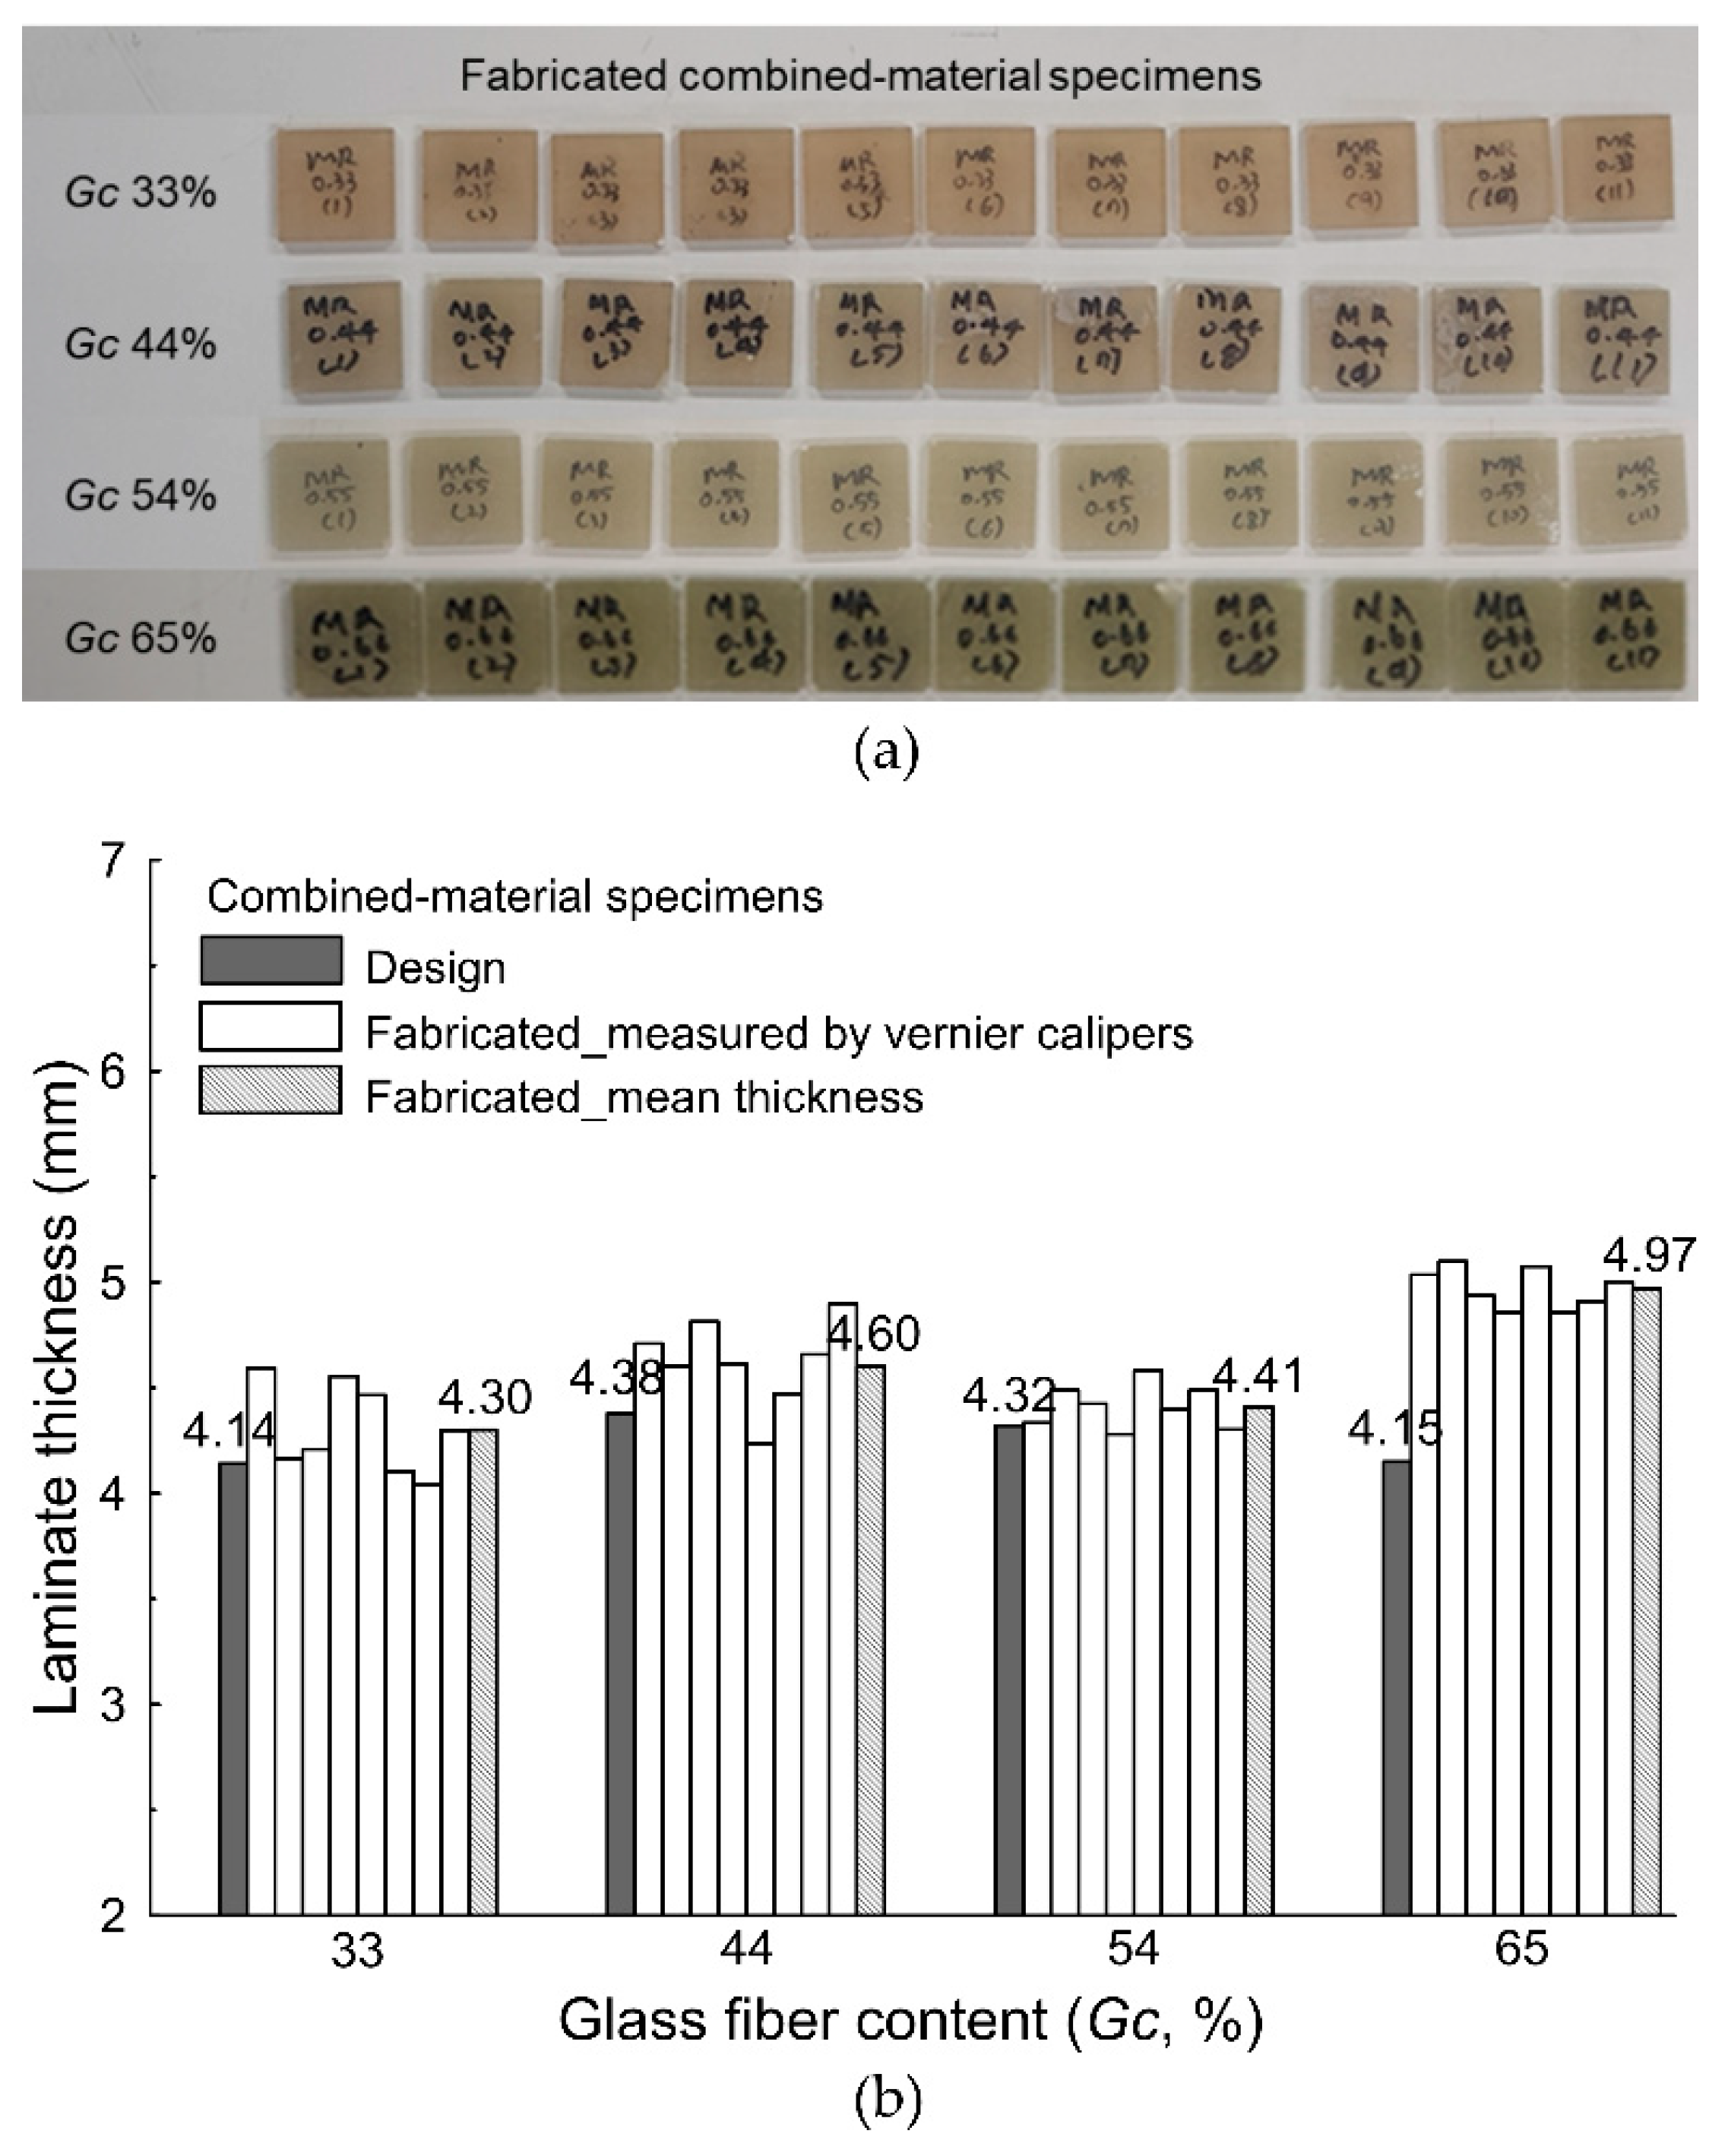
3.1. Design and Fabrication of GFRP Hull Plate
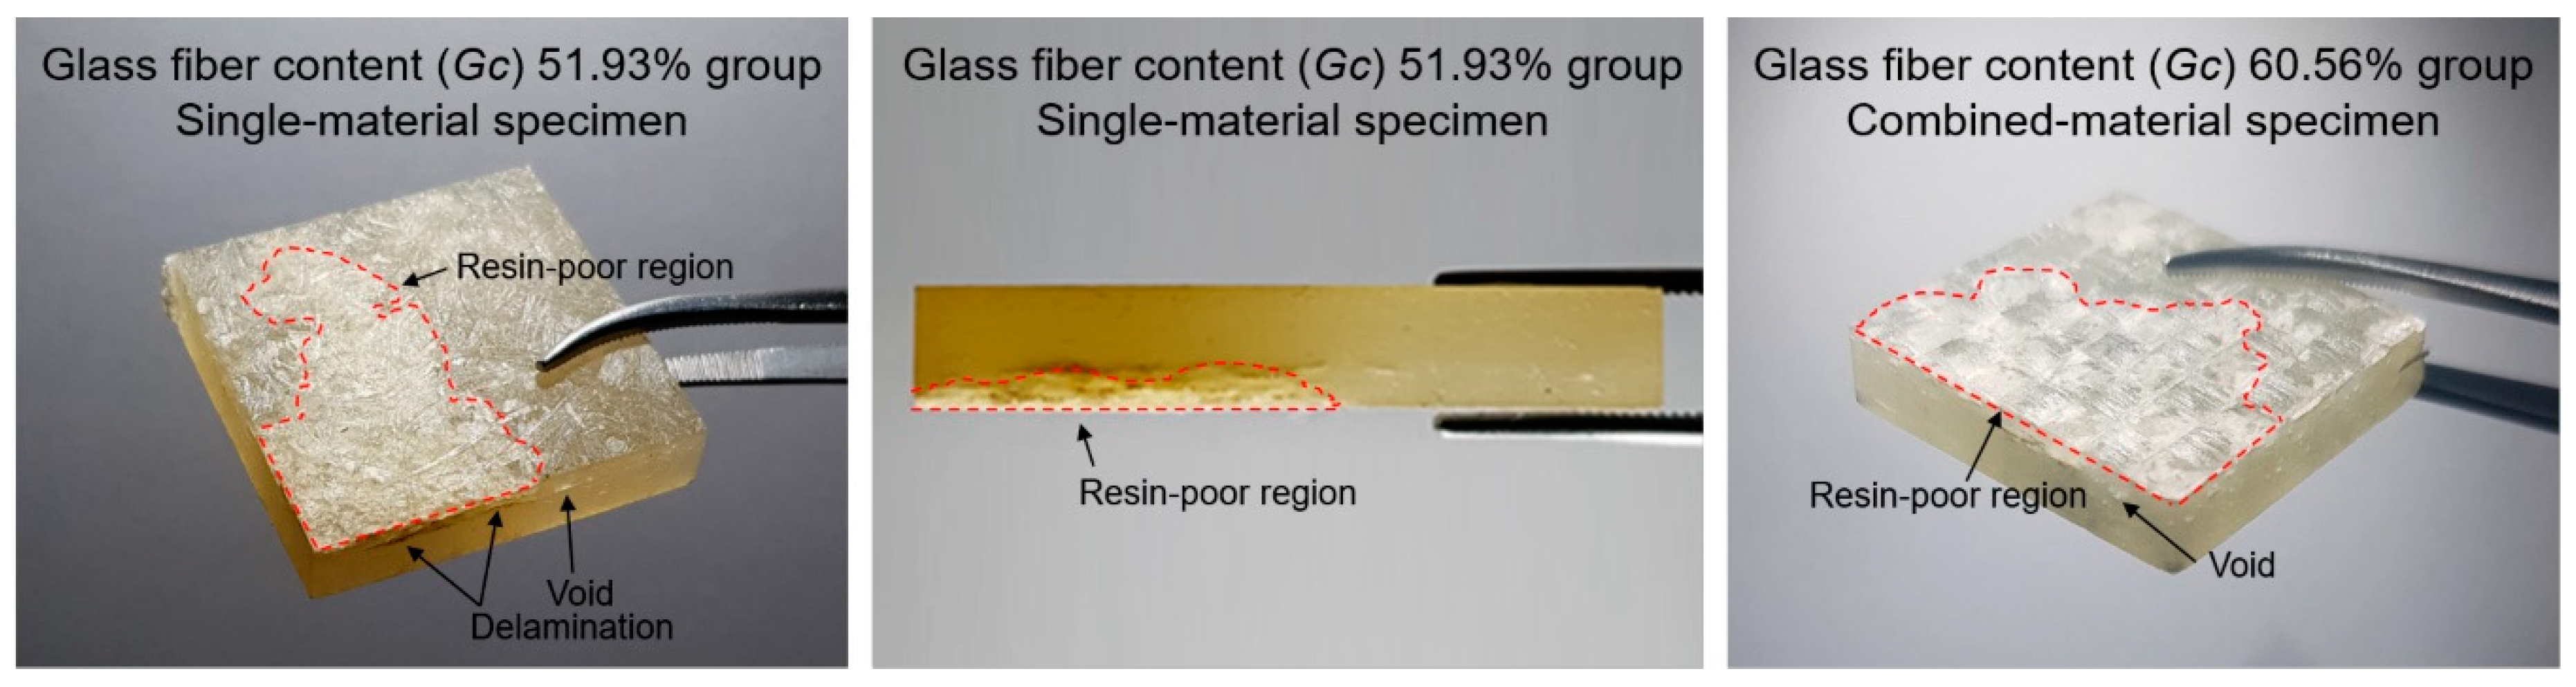
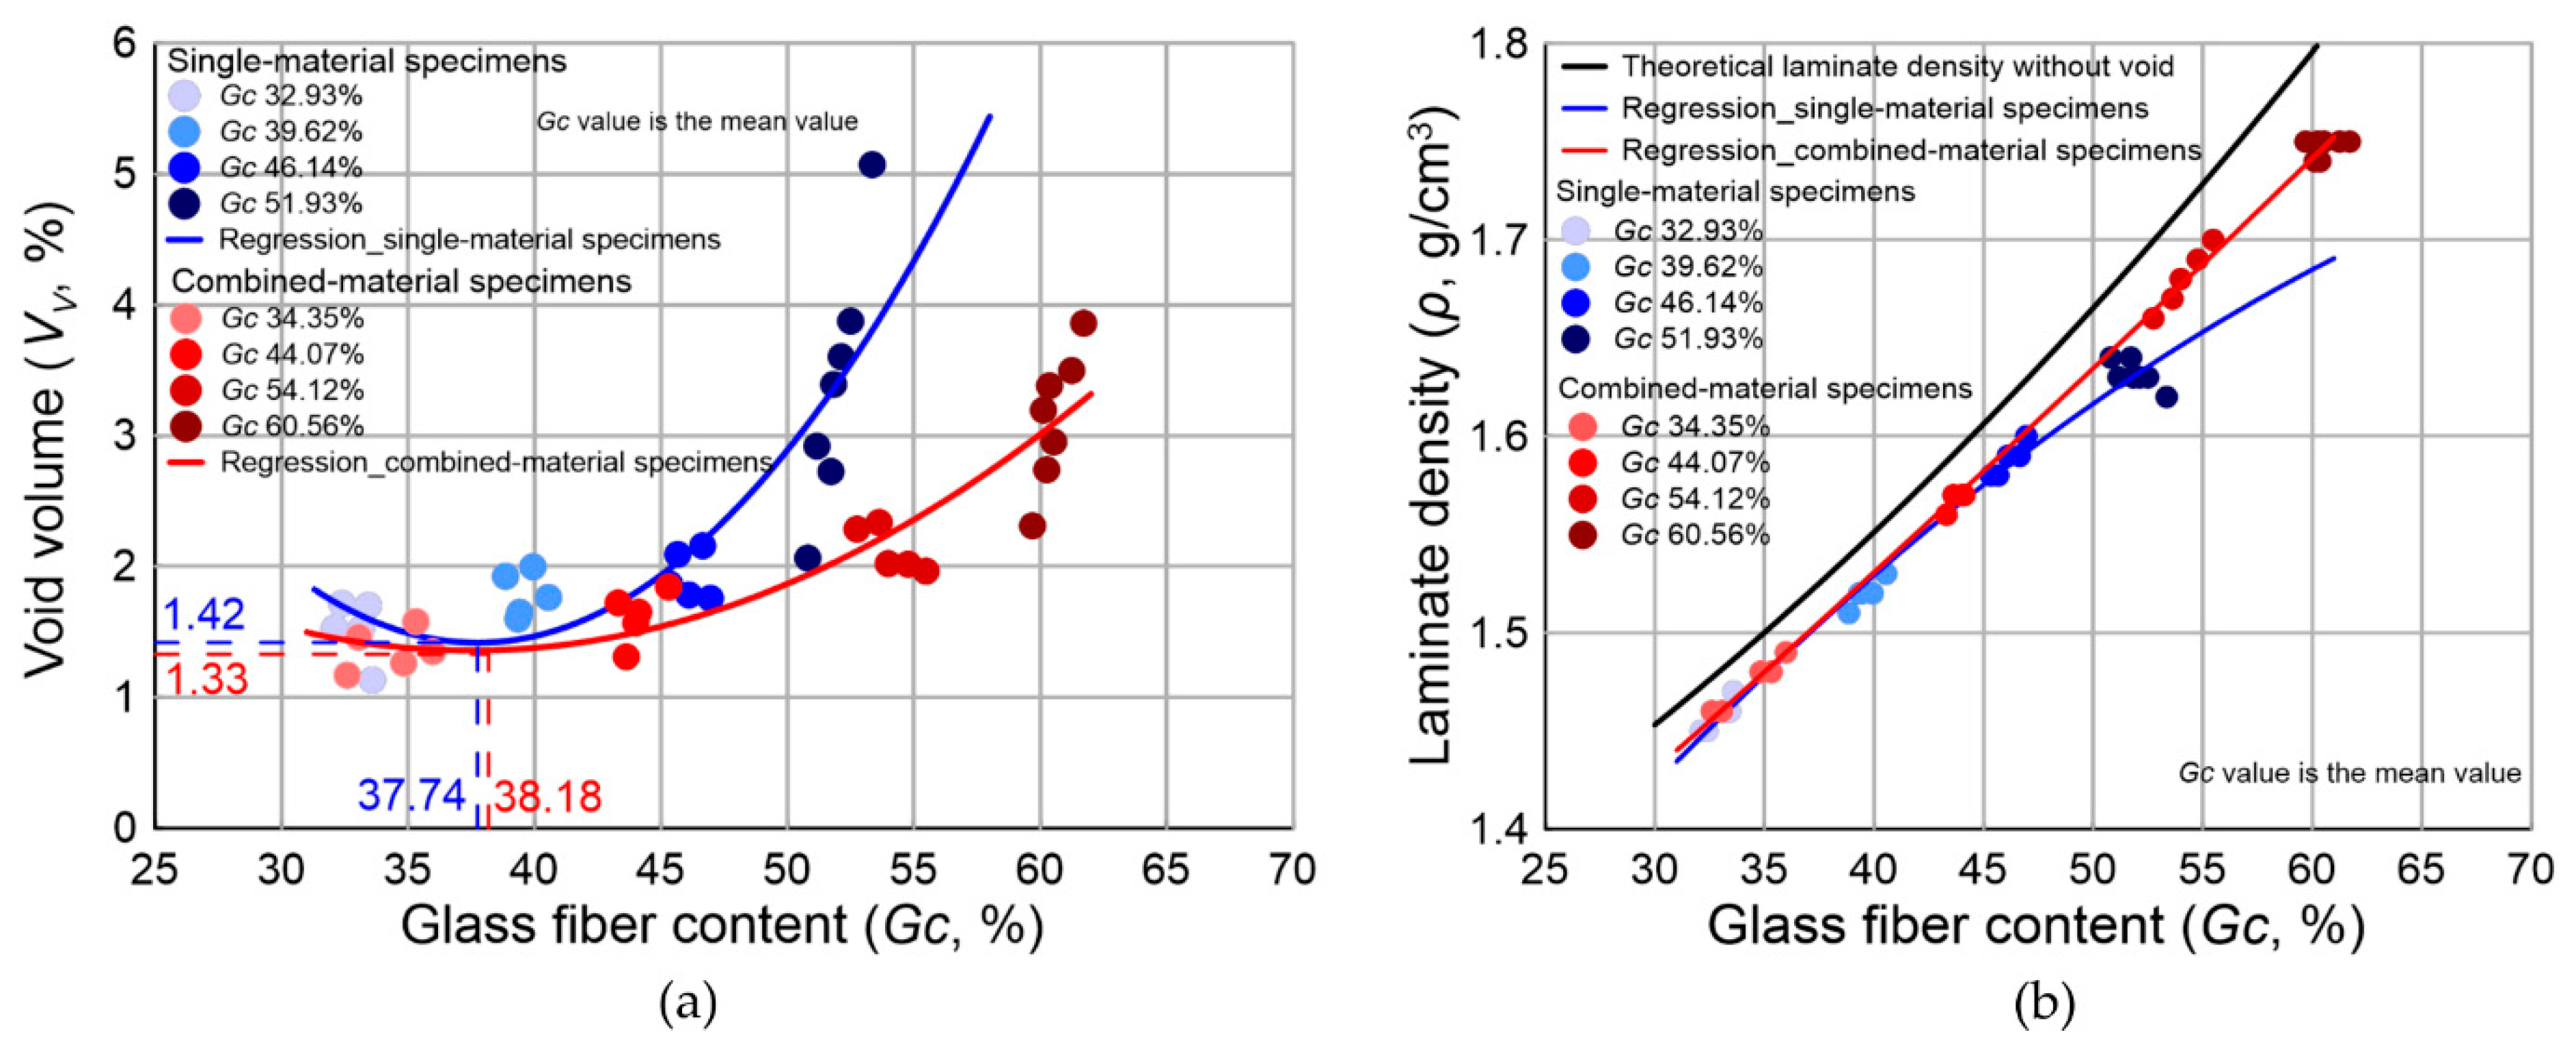
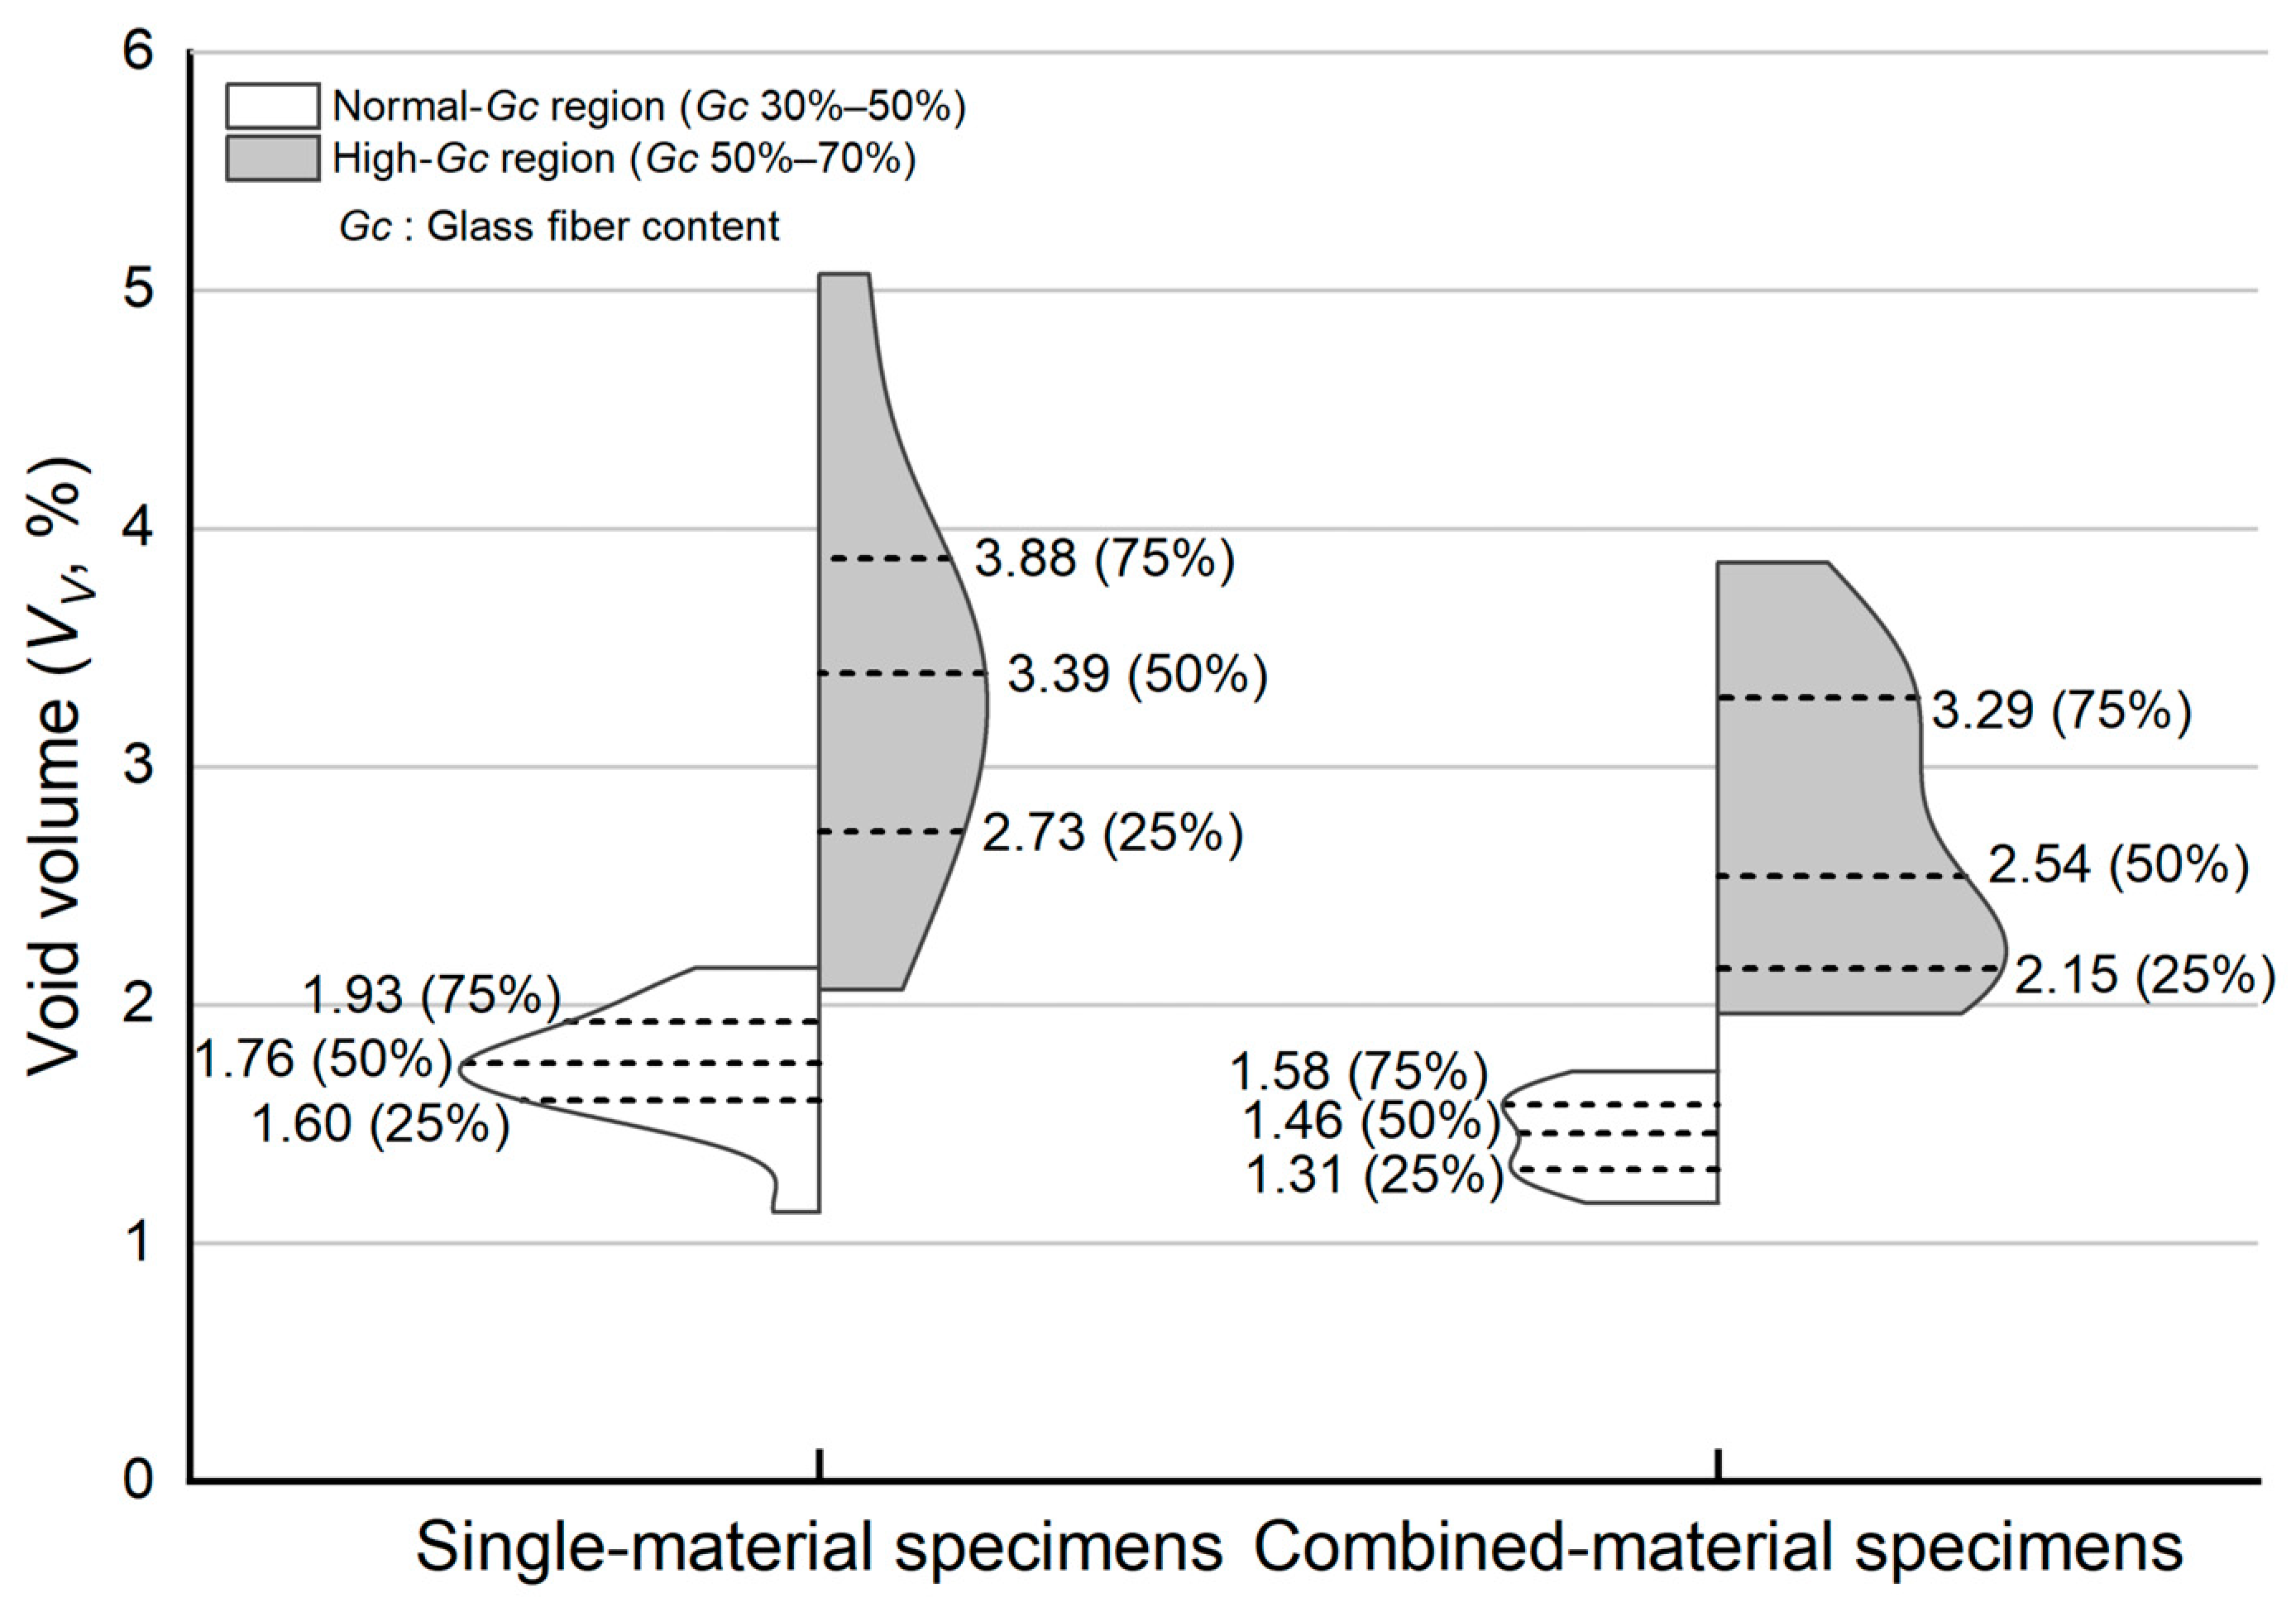
3.2. Void Volume Determined by Burn-Off Test
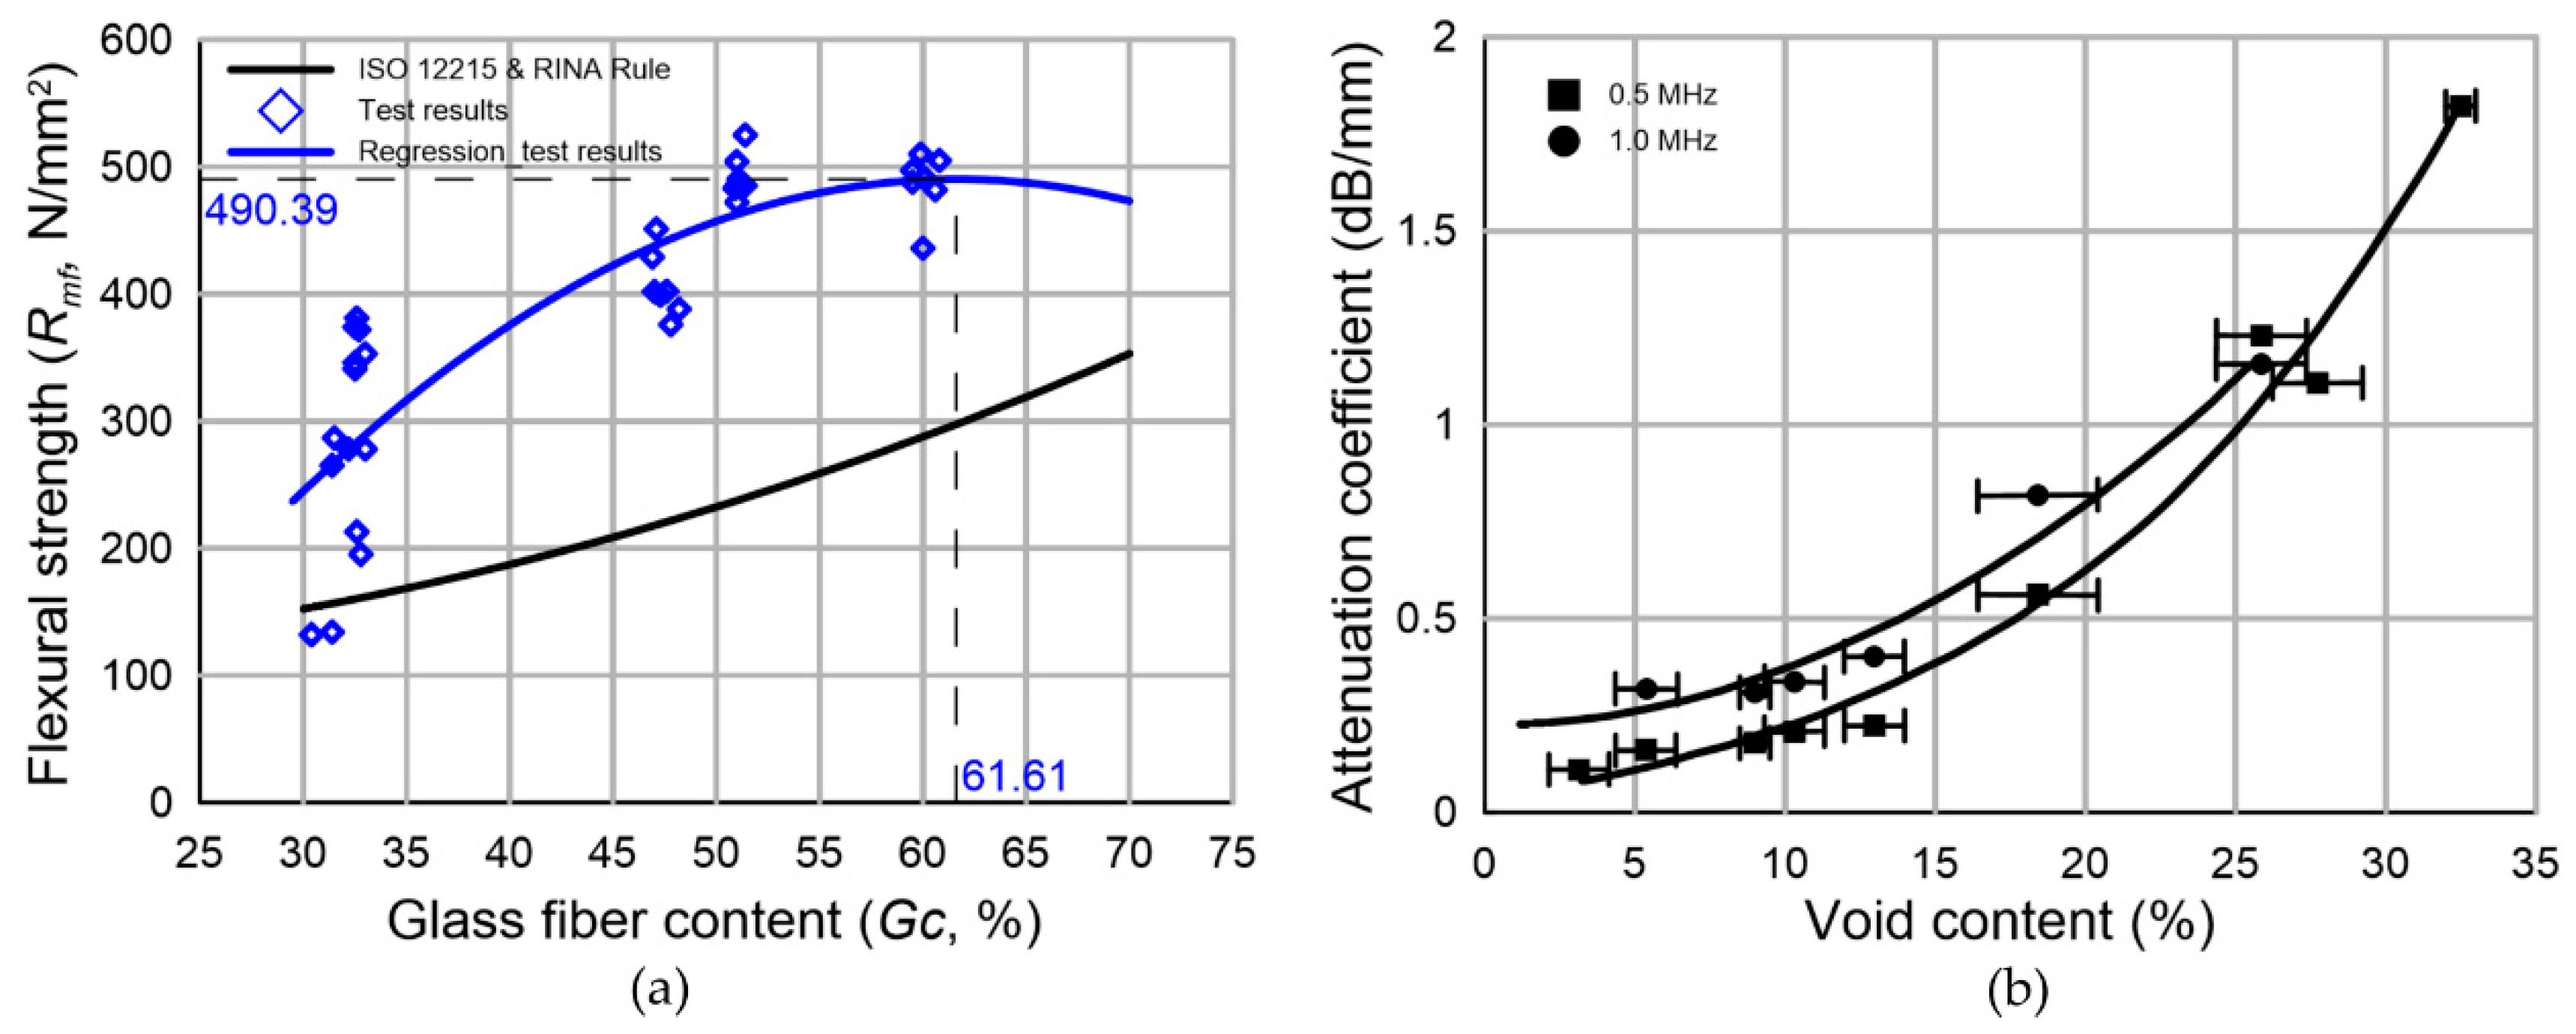
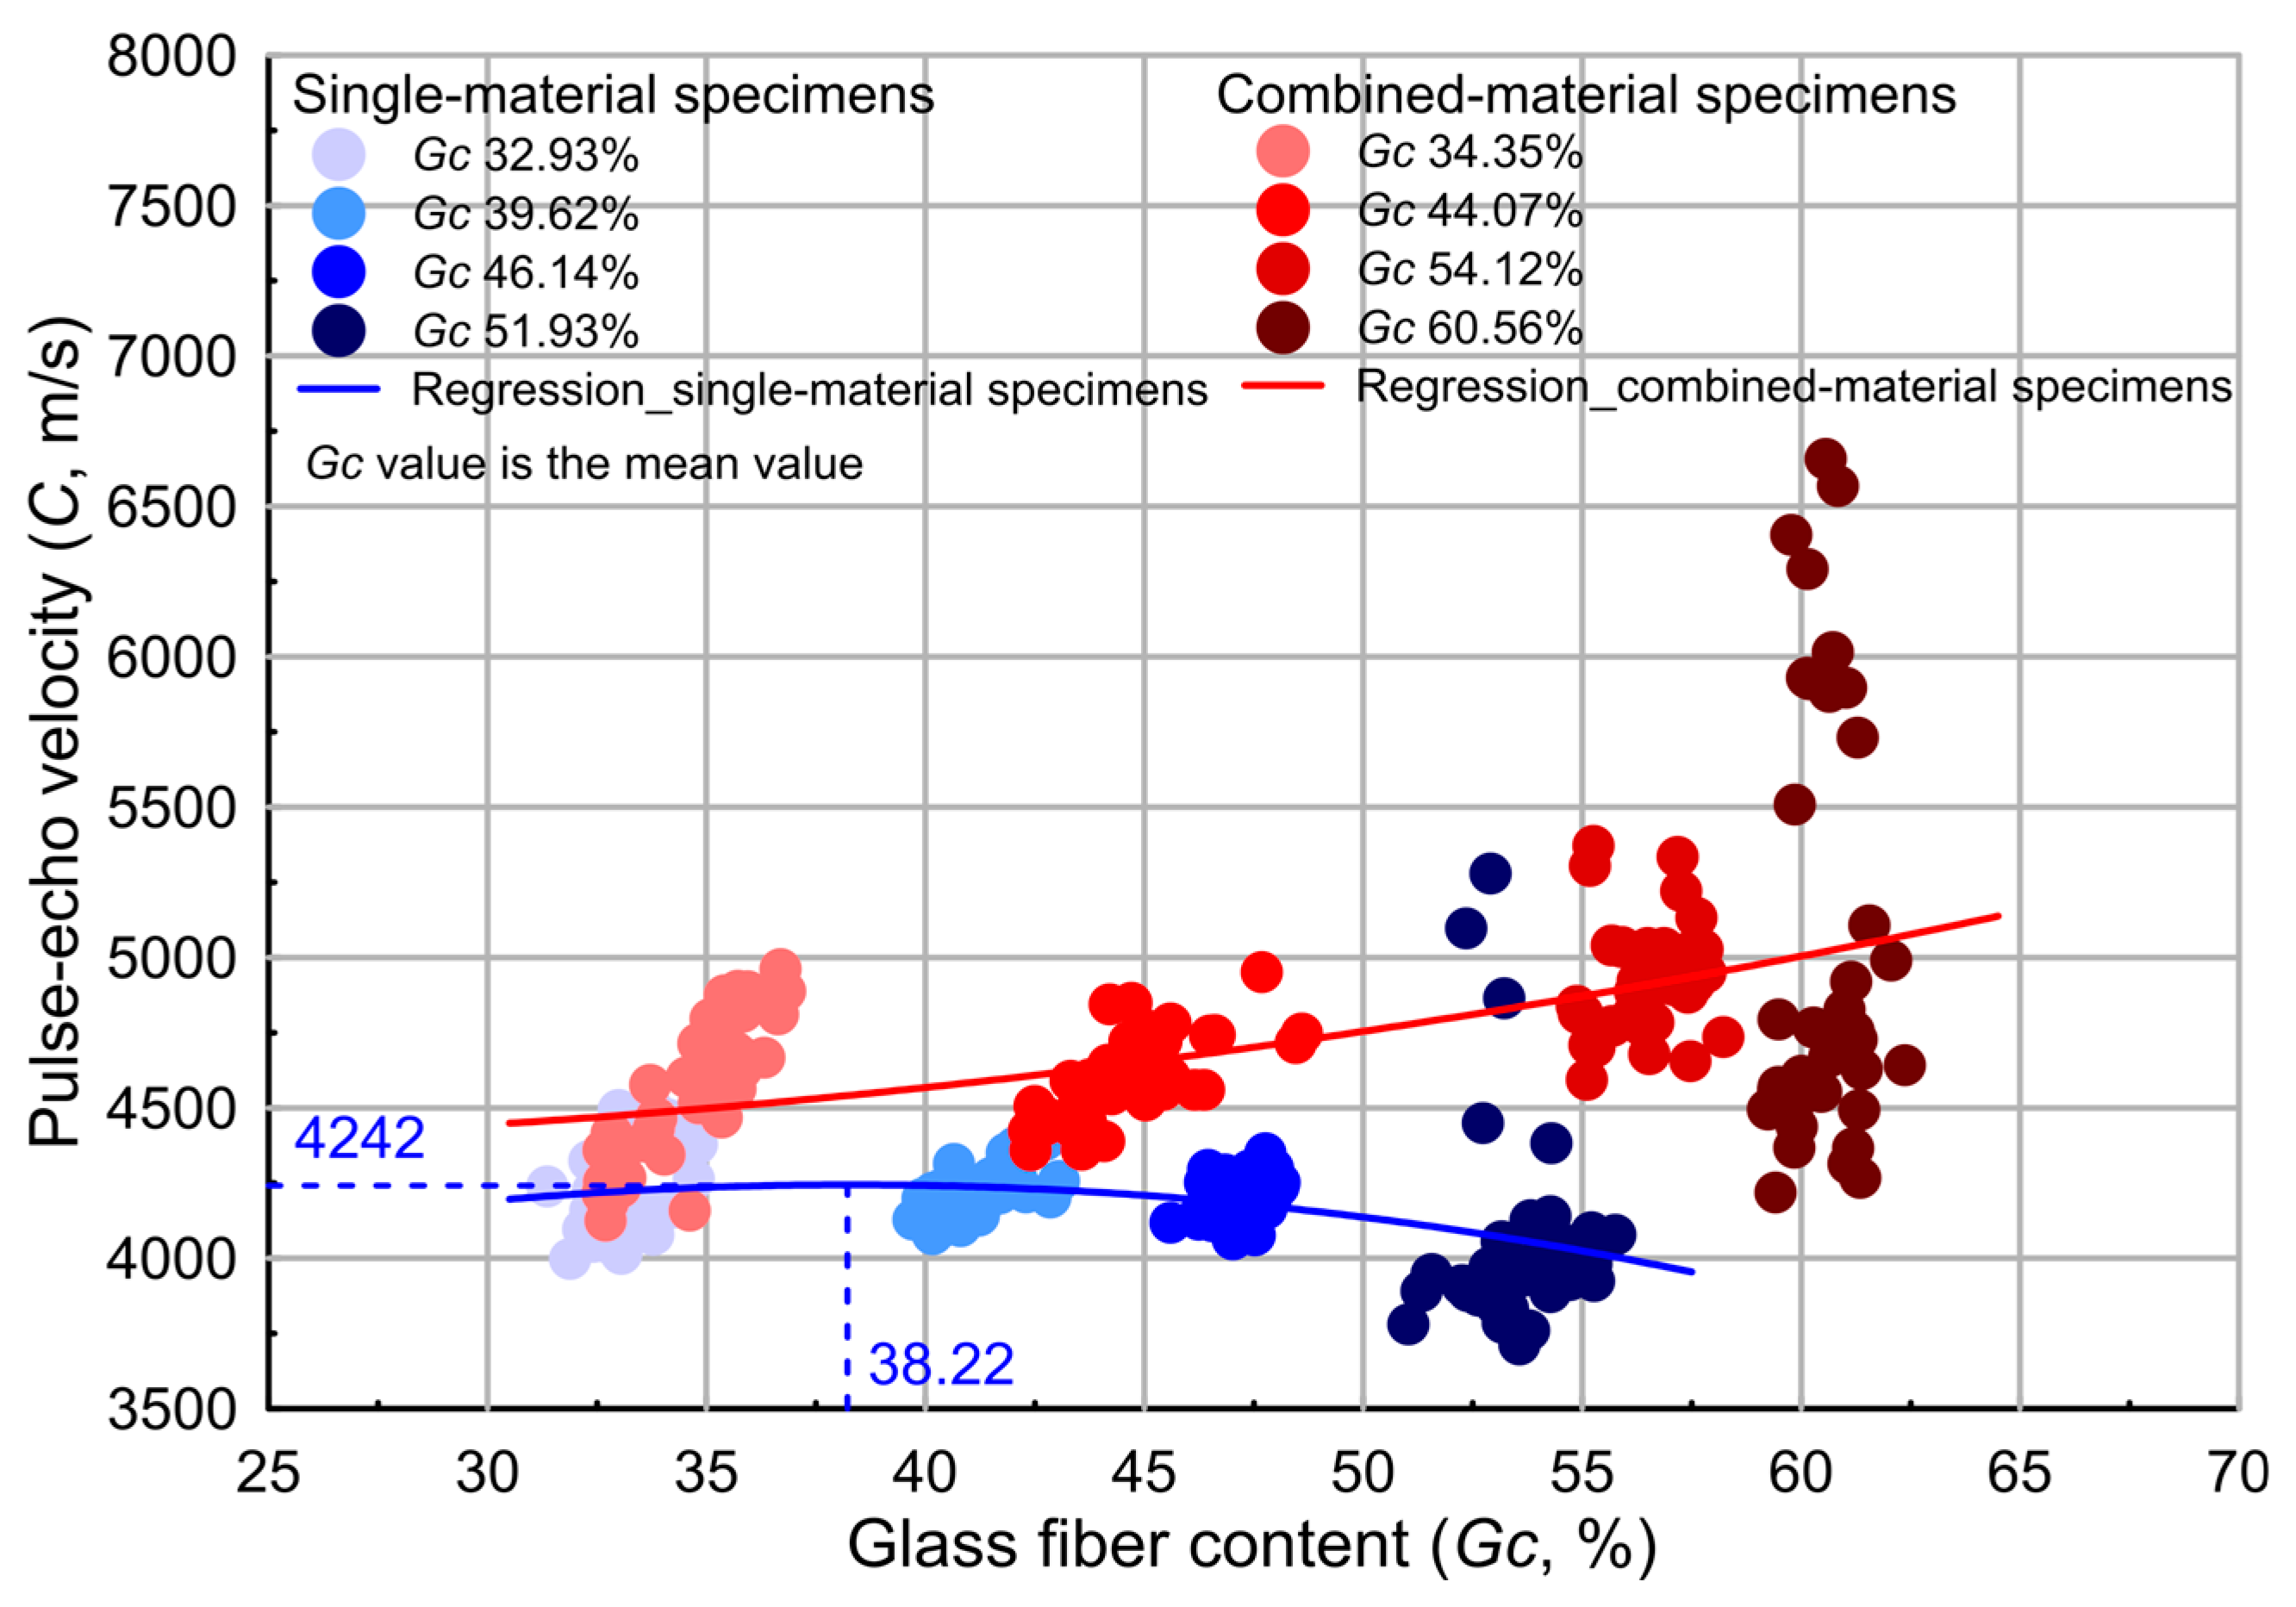
3.3. Variation of Pulse-Echo Velocity with Glass Fiber Content
4. Discussion
5. Conclusions
Author Contributions
Funding
Institutional Review Board Statement
Informed Consent Statement
Data Availability Statement
Conflicts of Interest
References
- Shenoi, R.A.; Dulieu-Barton, J.M.; Quinn, S.; Blake, J.I.R.; Boyd, S.W. Composite materials for marine applications: Key challenges for the future. In Composite Materials, 1st ed.; Nicolais, L., Meo, M., Milella, E., Eds.; Springer: London, UK, 2011; pp. 69–89. ISBN 978-0-85729-165-3. [Google Scholar]
- Oh, D.K. Marine Composites, FRP Small craft, and Eco-Friendliness. The Society of Naval Architects of Korea Webzine. Available online: http://www.snak.or.kr/newsletter/webzine/news.html?Item=board21&mode=view&s_t=1&No=645 (accessed on 14 December 2020).
- Kudela, P.; Żak, A.; Krawczuk, M.; Ostachowicz, W. Modelling of wave propagation in composite plates using the time domain spectral element method. J. Sound Vib. 2007, 302, 728–745. [Google Scholar] [CrossRef]
- Jeong, S.H.; Woo, J.H.; Oh, D.K. Simulation of greenhouse gas emissions of small ships considering operating conditions for environmental performance evaluation. Int. J. Nav. Archit. Ocean Eng. 2020, 12, 636–643. [Google Scholar] [CrossRef]
- Scott, R.J. Fiberglass Boat Design and Construction, 2nd ed.; The Society of Naval Architects and Marine Engineers: Jersey City, NJ, USA, 1996; p. 21. [Google Scholar]
- Cao, M.; Su, Z.; Xu, H.; Radzieński, M.; Xu, M.R.; Ostachowicz, W. A novel damage characterization approach for laminated composites in the absence of material and structural information. Mech. Syst. Signal Process. 2020, 143, 106831. [Google Scholar] [CrossRef]
- Sha, G.; Xu, H.; Radzieński, M.; Cao, M.; Ostachowicz, W. Guided wavefield curvature imaging of invisible damage in composite structures. Mech. Syst. Signal Process. 2021, 150, 107240. [Google Scholar] [CrossRef]
- Hakim, I.A.; Donaldson, S.L.; Meyendorf, N.G.; Browning, C.E. Porosity effects on interlaminar fracture behavior in carbon fiber-reinforced polymer composites. Mater. Sci. Appl. 2017, 8, 170–187. [Google Scholar] [CrossRef]
- Lee, S.G.; Han, Z.Q.; Lee, C.W.; Oh, D.K. Correlation between probe frequency and pulse-echo velocity for ultrasonic testing of a fiber-reinforced plastic hull plate. J. Korean Soc. Mar. Environ. Saf. 2020, 26, 219–226. [Google Scholar] [CrossRef]
- Harris, B. Fatigue in Composites, 1st ed.; Woodhead Publishing: Cambridge, UK, 2003; pp. 243–244. ISBN 978-1-85573-608-5. [Google Scholar]
- Greene, E. Marine composites non-destructive evaluation. In Proceedings of the SSC Ship Structure Symposium: Vessel Safety & Longevity through Ship Structure Research, Linthicum Heights, MD, USA, 18–20 May 2014. [Google Scholar]
- Kudela, P.; Wandowski, T.; Malinowski, P.; Ostachowicz, W. Application of scanning laser dopper vibrometry for delamination detection in composite structures. Opt. Lasers Eng. 2017, 99, 46–57. [Google Scholar] [CrossRef]
- Mouritz, A.P. Ultrasonic and interlaminar properties of highly porous composites. J. Compos. Mater. 2000, 34, 218–239. [Google Scholar] [CrossRef]
- Oh, D.K.; Han, Z.Q.; Noh, J.K.; Jeong, S.H. Laminate weight optimization of composite ship structures based on experimental data. J. Soc. Nav. Archit. Korea 2020, 57, 104–113. [Google Scholar] [CrossRef]
- Han, Z.Q.; Jeong, S.H.; Noh, J.K.; Oh, D.K. Comparative study of glass fiber content measurement methods for inspecting fabrication quality of composite ship structures. Appl. Sci. 2020, 10, 5130. [Google Scholar] [CrossRef]
- Wróbel, G.; Pawlak, S. A comparison study of the pulse-echo and through-transmission ultrasonics in glass/epoxy composites. J. Achiev. Mater. Manuf. Eng. 2007, 22, 51–54. [Google Scholar]
- Botelho, E.C.; Figiel, L.; Rezende, M.C.; Lauke, B. Mechanical behavior of carbon fiber reinforced polyamide composites. Compos. Sci. Technol. 2003, 63, 1843–1855. [Google Scholar] [CrossRef]
- Dong, Y.; Ansari, F. Non-destructive testing and evaluation (NDT/NDE) of civil structures rehabilitated using fiber reinforced polymer (FRP) composites. In Service Life Estimation and Extension of Civil Engineering Structures, 1st ed.; Karbhari, V.M., Lee, L.S., Eds.; Woodhead Publishing: Cambridge, UK, 2011; pp. 193–222. ISBN 978-1-84569-398-5. [Google Scholar]
- Mohamed, A.; Thameur, M.; Chedly, A. Ultrasonic velocity as a tool for physical and mechanical parameters prediction within geo-materials: Application on cement mortar. Russ. J. Nondestr. Test 2018, 54, 345–355. [Google Scholar] [CrossRef]
- Ibrahim, M.E. Nondestructive testing and structural health monitoring of marine composite structures. In Marine Applications of Advanced Fiber-Reinforced Composite; Graham-Jones, J., Summerscales, J., Eds.; Woodhead Publishing: Cambridge, UK, 2016; pp. 147–183. ISBN 978-1-78242-250-1. [Google Scholar]
- Lee, S.G.; Oh, D.K.; Woo, J.H. Experimental study on the characteristics of the change in glass-fiber weight content in ultrasonic inspection of GFRP hull structures. In Proceedings of the 2020 General Meeting & Annual Autumn Conference of The Society of Naval Architects of Korea, Changwon, Korea, 5–6 November 2020. [Google Scholar]
- Kenderian, S.; Esquivel, O.; Olson, K.R.; Johnson, E.C. A general overview of some nondestructive evaluation (NDE) techniques for materials characterization. Proc. Opt. Mater. Struct. Technol. IV SPIE 2009, 7425. [Google Scholar] [CrossRef]
- American Society for Testing and Materials. Standard Practice for Ultrasonics Velocity in Materials (ASTM E494-15); ASTM International: West Conshohocken, PA, USA, 2015. [Google Scholar]
- Fahad, B.M.; Naser, A.A. Enhance some insulation properties of epoxy by using waste materials. Al Nahrain J. Eng. Sci. 2018, 21, 259–265. [Google Scholar] [CrossRef]
- Lee, J.; Soutis, C. Thickness effect on the compressive strength of T800/924C carbon fiber–epoxy laminates. Compos. Part A Appl. Sci. Manuf. 2005, 36, 213–227. [Google Scholar] [CrossRef]
- Skain, R.; Ay, I.; Yaman, R. An investigation of bending fatigue behavior for glass-fiber reinforced polyester composite materials. Mater. Des. 2008, 29, 212–217. [Google Scholar] [CrossRef]
- Owens Corning. Available online: http://www.owenscorning.co.kr/reinforcements.asp (accessed on 14 December 2020).
- Aekyung Chemical Co., Ltd. Available online: https://www.akc.co.kr/product/list.do?bcode_id=BCK1&mcode_id=BCK1_1&scode_id=BCK1_1_3 (accessed on 14 December 2020).
- American Society for Testing and Materials. Test Methods for Constituent Content of Composite Materials (ASTM D3171-15); ASTM International: West Conshohocken, PA, USA, 2015. [Google Scholar]
- Mouritz, A.P.; Townsend, C.; Shah Khan, M.Z. Non-destructive detection of fatigue damage in thick composites by pulse-echo ultrasonics. Compos. Sci. Tech. 2000, 60, 23–32. [Google Scholar] [CrossRef]
- Dakota Ultrasonics. Available online: https://dakotaultrasonics.com/product/corrosion/cmx-dl-plus/ (accessed on 14 December 2020).
- Heckadka, S.S.; Nayak, S.Y.; Narang, K.; Pant, K.V. Chopped strand/plain weave E-glass as reinforcement in vacuum bagged epoxy composites. J. Mater. 2015, 2015, 1–7. [Google Scholar] [CrossRef]


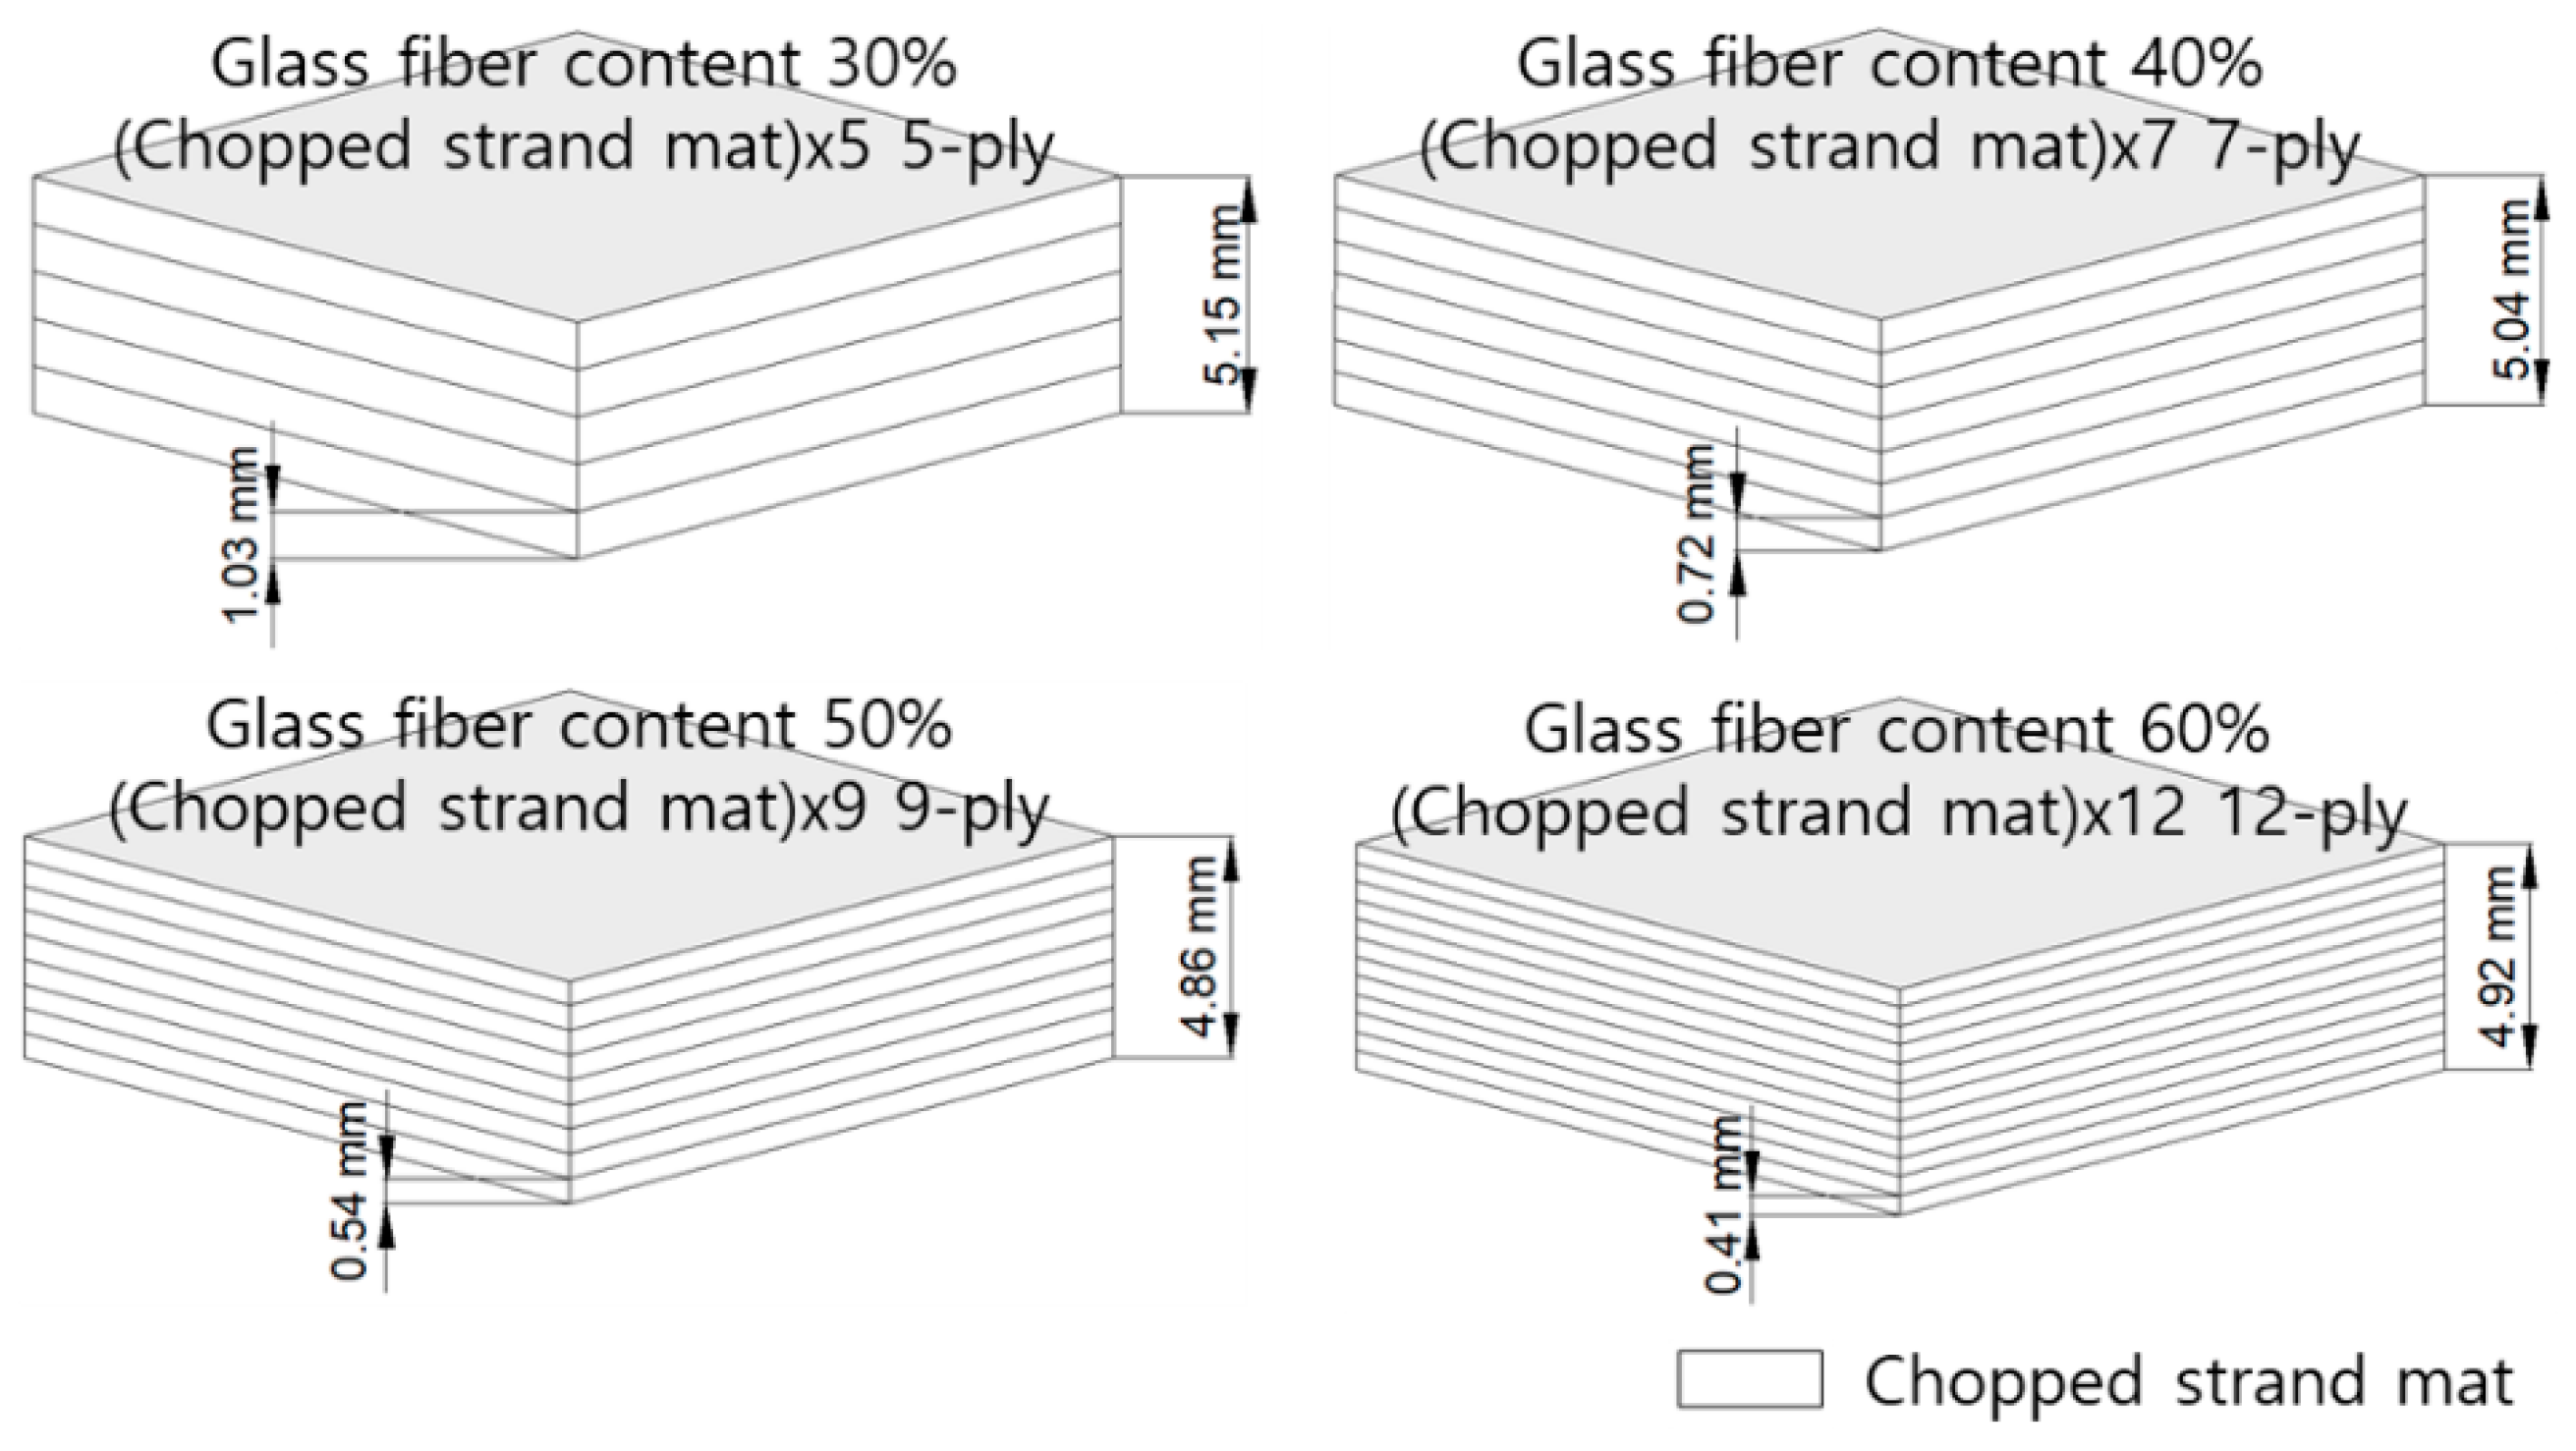
| Design Gc (%) | Laminate Schedule | No. of Plies (ply) | Tsingle (mm) | Tdesign (mm) |
|---|---|---|---|---|
| 30.00 | CSM × 5 | 5 | 1.03 | 5.15 |
| 40.00 | CSM × 7 | 7 | 0.72 | 5.04 |
| 50.00 | CSM × 9 | 9 | 0.54 | 4.86 |
| 60.00 | CSM × 12 | 12 | 0.41 | 4.92 |
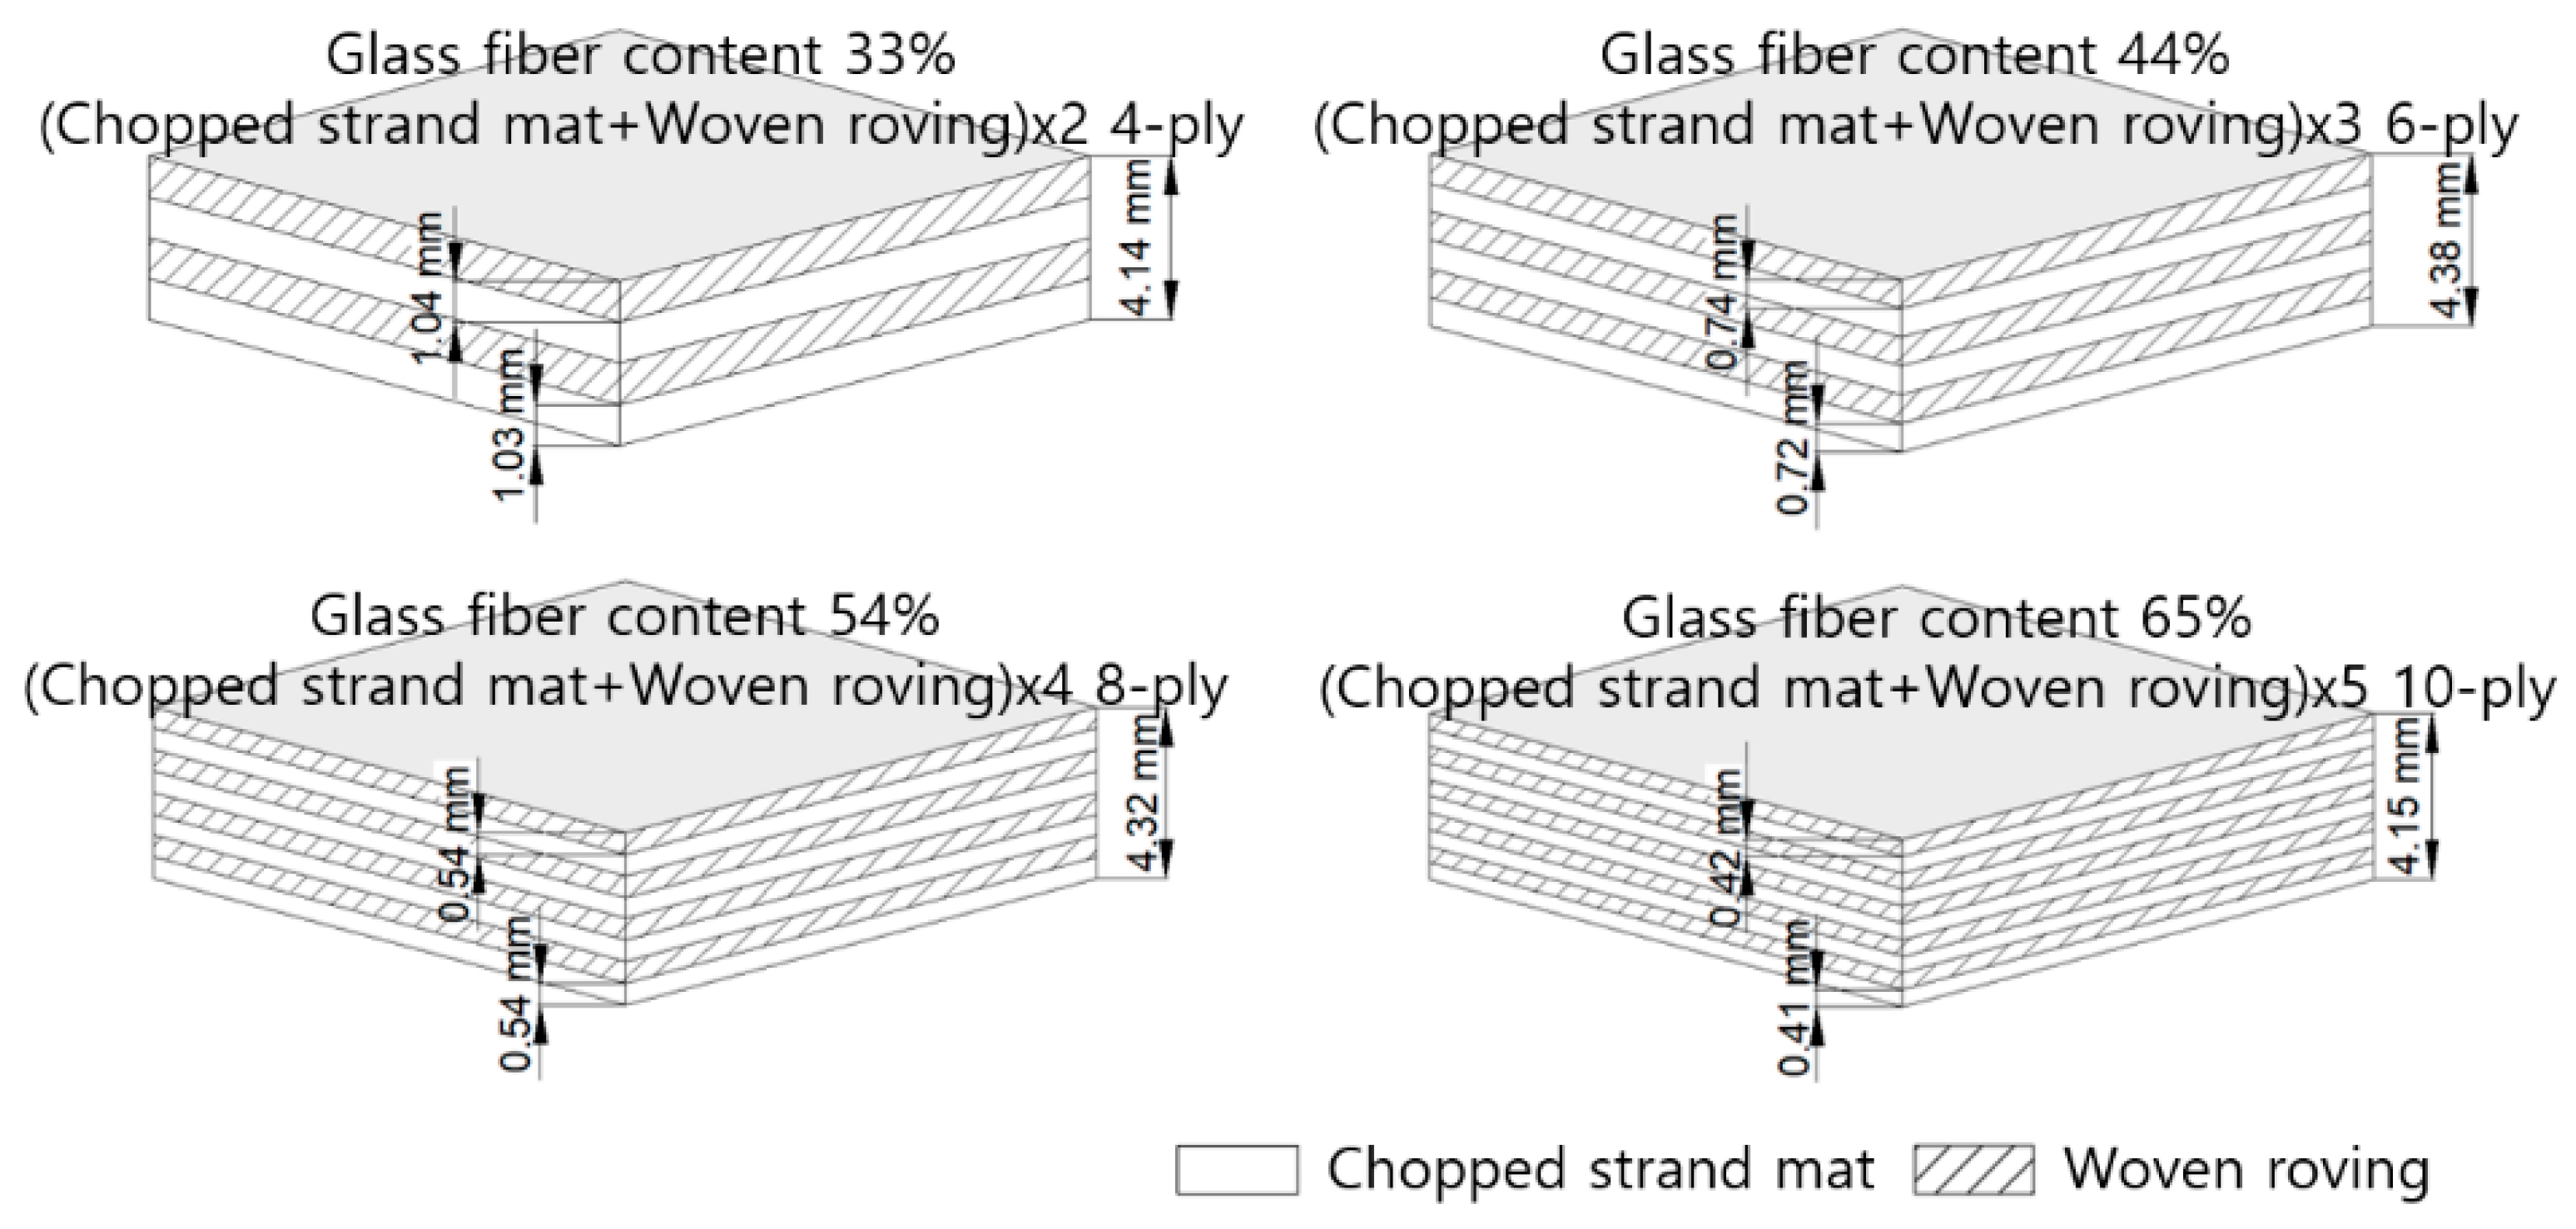
| Design Gc (%) | Laminate Schedule | No. of Plies (ply) | Tsingle (mm) | Tdesign (mm) | |
|---|---|---|---|---|---|
| CSM | WR | ||||
| 33.00 | (CSM + WR) × 2 | 4 | 1.03 | 1.04 | 4.14 |
| 44.00 | (CSM + WR) × 3 | 6 | 0.72 | 0.74 | 4.38 |
| 54.00 | (CSM + WR) × 4 | 8 | 0.54 | 0.54 | 4.32 |
| 65.00 | (CSM + WR) × 5 | 10 | 0.41 | 0.42 | 4.15 |
| Design Gc (%) | Test Value of Gc (%) | Mean (%) | ||||||
|---|---|---|---|---|---|---|---|---|
| 30.00 | 32.09 | 33.14 | 33.58 | 34.42 | 32.39 | 32.93 | ||
| 40.00 | 40.55 | 39.34 | 39.41 | 39.94 | 38.85 | 39.62 | ||
| 50.00 | 46.95 | 46.65 | 46.11 | 45.66 | 45.34 | 46.14 | ||
| 60.00 | 50.80 | 51.16 | 52.12 | 51.72 | 52.50 | 53.36 | 51.82 | 51.93 |
| Design Gc (%) | Test Value of VV (%) | Mean (%) | ||||||
|---|---|---|---|---|---|---|---|---|
| 30.00 | 1.53 | 1.52 | 1.13 | 1.70 | 1.72 | 1.52 | ||
| 40.00 | 1.76 | 1.60 | 1.66 | 2.00 | 1.93 | 1.79 | ||
| 50.00 | 1.76 | 2.16 | 1.78 | 2.09 | 1.87 | 1.93 | ||
| 60.00 | 2.06 | 2.92 | 3.60 | 2.73 | 3.88 | 5.07 | 3.39 | 3.38 |
| Design Gc (%) | Test Value of Gc (%) | Mean (%) | ||||||
|---|---|---|---|---|---|---|---|---|
| 33.00 | 35.31 | 34.82 | 33.05 | 35.98 | 32.59 | 34.35 | ||
| 44.00 | 43.62 | 43.31 | 44.00 | 44.12 | 45.30 | 44.07 | ||
| 54.00 | 53.99 | 55.48 | 53.62 | 52.75 | 54.77 | 54.12 | ||
| 65.00 | 61.24 | 59.69 | 60.25 | 60.12 | 60.53 | 61.71 | 60.36 | 60.56 |
| Design Gc (%) | Test Value of VV (%) | Mean (%) | ||||||
|---|---|---|---|---|---|---|---|---|
| 33.00 | 1.58 | 1.26 | 1.46 | 1.35 | 1.17 | 1.36 | ||
| 44.00 | 1.31 | 1.72 | 1.57 | 1.65 | 1.84 | 1.62 | ||
| 54.00 | 2.02 | 1.96 | 2.34 | 2.29 | 2.02 | 2.13 | ||
| 65.00 | 3.50 | 2.31 | 2.74 | 3.20 | 2.95 | 3.86 | 3.38 | 3.13 |
Publisher’s Note: MDPI stays neutral with regard to jurisdictional claims in published maps and institutional affiliations. |
© 2021 by the authors. Licensee MDPI, Basel, Switzerland. This article is an open access article distributed under the terms and conditions of the Creative Commons Attribution (CC BY) license (https://creativecommons.org/licenses/by/4.0/).
Share and Cite
Lee, S.-G.; Oh, D.; Woo, J.H. The Effect of High Glass Fiber Content and Reinforcement Combination on Pulse-Echo Ultrasonic Measurement of Composite Ship Structures. J. Mar. Sci. Eng. 2021, 9, 379. https://doi.org/10.3390/jmse9040379
Lee S-G, Oh D, Woo JH. The Effect of High Glass Fiber Content and Reinforcement Combination on Pulse-Echo Ultrasonic Measurement of Composite Ship Structures. Journal of Marine Science and Engineering. 2021; 9(4):379. https://doi.org/10.3390/jmse9040379
Chicago/Turabian StyleLee, Sang-Gyu, Daekyun Oh, and Jong Hun Woo. 2021. "The Effect of High Glass Fiber Content and Reinforcement Combination on Pulse-Echo Ultrasonic Measurement of Composite Ship Structures" Journal of Marine Science and Engineering 9, no. 4: 379. https://doi.org/10.3390/jmse9040379
APA StyleLee, S.-G., Oh, D., & Woo, J. H. (2021). The Effect of High Glass Fiber Content and Reinforcement Combination on Pulse-Echo Ultrasonic Measurement of Composite Ship Structures. Journal of Marine Science and Engineering, 9(4), 379. https://doi.org/10.3390/jmse9040379