Article

The Role of Mesoscale Dynamics over Northwestern Cuba in the Loop Current Evolution in 2010, during the Deepwater Horizon Incident

by
Yannis Androulidakis
1,*,
Vassiliki Kourafalou
1,
Matthieu Le Hénaff
2,3,
HeeSook Kang
1 and
Nektaria Ntaganou
1
1
Department of Ocean Sciences, 4600 Rickenbacker Causeway, Rosenstiel School of Marine and Atmospheric Science (RSMAS), University of Miami, Miami, FL 33149, USA
2
Cooperative Institute for Marine and Atmospheric Studies (CIMAS), 4600 Rickenbacker Causeway, University of Miami, Miami, FL 33149, USA
3
NOAA/Atlantic Oceanographic and Meteorological Laboratory (AOML), 4301 Rickenbacker Causeway, Miami, FL 33149, USA
*
Author to whom correspondence should be addressed.
J. Mar. Sci. Eng. 2021, 9(2), 188; https://doi.org/10.3390/jmse9020188
Submission received: 18 January 2021 / Revised: 28 January 2021 / Accepted: 8 February 2021 / Published: 11 February 2021
(This article belongs to the Special Issue Monitoring and Modelling of Coastal Environment)

Abstract

:
The Loop Current (LC) system controls the connectivity between the northern Gulf of Mexico (GoM) region and the Straits of Florida. The evolution of the LC and the shedding sequence of the LC anticyclonic ring (Eddy Franklin) were crucial for the fate of the hydrocarbons released during the Deepwater Horizon (DwH) oil spill in 2010. In a previous study, we identified LC-related anticyclonic eddies in the southern GoM, named “Cuba anticyclones” (“CubANs”). Here, we investigate the relation between these eddies and LC evolution in 2010, focusing on the DwH period. We use high-resolution model results in tandem with observational data to describe the connection between the LC system evolution within the GoM (LC extensions, Eddy Franklin and LC Frontal Eddies—LCFEs) and the mesoscale dynamics within the Straits of Florida where CubANs propagate. Five periods of CubAN eddy activity were identified during the oil spill period, featuring different formation processes under a combination of local and regional conditions. Most of these cases are related to the retracted LC phases, when the major LC anticyclone (Eddy Franklin in 2010) is detached from the main body and CubAN eddy activity is most likely. However, two cases of CubAN eddy presence during elongated LC were detected, which led to the attenuation of the eastward flows of warm waters through the Straits (Florida Current; outflow), allowing the stronger supply of Caribbean waters through the Yucatan Channel into the Gulf (inflow), which contributed to short-term LC northward extensions. Oceanographic (LCFEs) and meteorological (wind-induced upwelling) conditions contributed to the release of CubANs from the main LC body, which, in tandem with other processes, contributed to the LC evolution during the DwH oil spill incident.

1. Introduction

The Deepwater Horizon (DwH) accident on 20 April 2010 was the largest accidental offshore oil spill in history, with about 600,000 tons of crude oil released in the Gulf of Mexico (GoM) [1]. The DwH platform was located at the boundary between the northern GoM shelf and the Gulf interior (Figure 1). Liu et al. [2], based on drifter and satellite data, showed that the elongated Loop Current (LC) retreated from its northernmost position at the end of April 2010 and stayed away from the oil spill area during May 2010. The shedding of the anticyclonic LC ring (also called LC Eddy, LCE) Franklin [3] and the simultaneous evolution of cyclonic LC Frontal Eddies (LCFEs) [4] interrupted the direct connection between the northern Gulf and the Straits of Florida and the Atlantic Ocean, although a few surface oil slicks were entrained in the LC system from mid- to late May [2]; drifters deployed at the eastern edge of the LC at the end of May were advected around Eddy Franklin after its detachment (full circle in 10 days) rather than following the main LC to the southeast. As LCEs frequently do [5,6,7], Eddy Franklin underwent a series of detachments/re-attachments after its formation in late May, until full separation several weeks later in September [8]. The formation of the ring in late May effectively shut down the possibility of vast amounts of oil moving southward during this particular incident. Here, we investigate how processes in the southeastern GoM and the Straits of Florida influenced ring separation and, consequently, LC extension and connectivity between the oil spill area and the southward corridor leading to the Atlantic Ocean.
The conditions that control the LC evolution and, in particular, the LCE shedding processes are a topic of ongoing research. The intrusion of warm Caribbean waters through the Yucatan Channel forms the LC branch of the Gulf Stream, which eventually exits through the Straits of Florida as the Florida Current (FC) and moves toward the Atlantic Ocean as the main Gulf Stream. The Caribbean inflow (Yucatan Current) is, at times, directly northward, leading the LC to be extended over the inner Gulf (elongated LC phases), while at other times, it turns directly northeastward, supplying the FC over the northwestern tip of Cuba (retracted LC phases). Sturges and Leben [9] and Schmitz [6] discussed the changes in LC extension associated with LCE separations. Several previous studies described the main conditions that play a role in the LCE shedding events [10,11,12,13,14,15]. Cyclonic LCFEs propagate along the LC and may contribute to “necking-down” of the LC [6,14,16,17]. Donohue et al. [18], based on field observations, discussed the interaction between deep eddies, LC meandering and LCE detachment events. Moreover, Donohue et al. [19] quantified the meander properties and related them to the LC variability and LCE separation processes. We extend these studies, focusing on additional processes and eddy evolution in the southeastern GoM that influence the GoM mesoscale field.
Specifically, this study focuses on the dynamics over the southeastern GoM and the western Straits of Florida and examines the hypothesis that they also contribute to LC evolution. We chose the period of the DwH oil spill to investigate the relation between the LC and the mesoscale eddies in the Straits of Florida for two main reasons: (1) The LC revealed strong variability during this period, with extended phases, shedding of Eddy Franklin and withdrawal of the LC away from the northern shelves, and (2) the LC variability was crucial for the offshore oil pathways. The interaction between the LC system and the oil spill has been extensively reported in the past [2,4] and it is out of the scope of this study. However, our findings are relevant to the DwH incident, as they are connected to analyses of additional processes that impacted LC evolution.
Kourafalou et al. [20], based on satellite and model data, showed that the “necking-down” (i.e., narrowing of the distance between the LC western and eastern sides) conditions of the LC, followed by LCE (ring) detachments and full separations, and the subsequent dramatic change in LC extension are strongly correlated to the formation and evolution of mesoscale anticyclonic eddies over the northwestern tip of Cuba (named “CubANs” for “Cuba ANticyclones”). These mesoscale anticyclonic eddies were also identified in cruise field observations by Le Hénaff et al. [21]. Periods with the presence of CubANs are usually aligned with periods when the LC starts to get necked-down under the influence of cyclonic LCFEs, which have also been found to play an important role in the processes that lead to ring separations [14,16,17,22] and eventual LC withdrawal to a southern position, near Cuba. As such, the CubANs can be viewed as a manifestation of the meandering of the LC system down to the Straits of Florida.
Two types of CubAN eddies are usually formed over the northwestern Cuban coast [20,23]: the type “A” CubAN, which is a closed anticyclonic cell within the retracted LC (young LC) during and after the necking-down of the LCE, and the type “B” CubAN, which is an individual, distinct anticyclonic eddy that has been released from the main LC core and generally advances eastward along the northern Cuban coast. The size of CubANs may exceed 100 km, so that they can cover most of the width of the Straits, affecting the evolution of the Florida Current (FC) itself [20]. Under specific conditions, both types can be observed simultaneously [23]. This process of generation of anticyclonic vorticity from along the western tip of Cuba and over the very narrow continental shelf along the Cuban coast is comparable to the process described by Gula et al. [24,25], downstream of our study region, along the Gulf Stream in the Atlantic Ocean. However, Androulidakis et al. [23] showed that such a topographic drag does not seem to be the main reason for the generation of these eddies, which rather appear to form from a rearrangement of the negative (anticyclonic) vorticity at the base of the LC. Androulidakis et al. [26], based on oil spill simulations, showed that the CubANs may affect the oil spill pathways and fate of hypothetical future oil spill accidents in the western Straits of Florida.
Herein, we will examine if these anticyclonic eddies played any role on the hydrodynamics of the LC during the DwH period and indirectly affected the respective oil spill pathways. We will show that both type “A” and type “B” CubANs formed and evolved during the summer of 2010. We will pay special attention to type “B” CubANs, which usually evolve during extended LC phases [23] and are expected to have implications on the northward LC extension, as the amount of warm waters feeding into the LC core from influx at Yucatan is modified when these eddies are present in the Straits of Florida. We will also examine if processes of air–sea interaction (specifically wind-induced upwelling) and eddy formation (particularly anticyclonic CubAN eddies) along northwestern Cuba around the base of the LC influenced the LC evolution. Although we focus on 2010, which was characterized by the need to determine hydrocarbon pathways, enhancing the knowledge of processes that influence LC evolution has important implications on understanding basin-wide connectivity and transport.
Three novel questions are examined in the present study: (1) To what extent did the formation of CubANs (specifically type “B” CubANs) influence the FC variability and, thus, the basin-wide LC evolution during the DwH period? (2) What was the specific role of these processes in the evolution of Eddy Franklin? and (3) Which oceanographic and meteorological conditions (e.g., wind-driven upwelling) determined the formation and evolution of CubANs during the summer of 2010? The broader goal of this study is to better understand the linkages between basin-wide GoM physical connectivity and processes in the southeastern GoM, with emphasis on the northwestern Cuba region and the western Straits of Florida. This study also seeks to contribute to the full understanding of basin-wide GoM mesoscale dynamics, which have several biogeochemical implications.

2. Data and Methods

2.1. Model Description

The 2010 simulation is based on a high-resolution (1/50°, ~1.8 km) application of the Hybrid Coordinate Ocean Model (HYCOM) in the GoM (GoM-HYCOM 1/50) [27]. The HYCOM solves the hydrostatic primitive equations and its most unique characteristic is the vertical coordinate system that optimizes the distribution of vertical layers by making them isopycnal in stratified water columns, sigma terrain-following in coastal regions and isobaric in the mixed layer and very shallow areas [28]. More information and details about HYCOM are available in its user manual (https://hycom.org/) and the references therein. There are several previous studies in the GoM based on HYCOM that explore the evolution of the LC system and associated eddies [22,23,29,30]. Ocean currents from HYCOM simulations have also been used to investigate oil spill evolution in the Gulf and especially to trace hydrocarbons and describe their transport during the DwH period [31,32,33]. Its flexible (hybrid) vertical coordinate system is advantageous for the complex topography of the Gulf with major passages such as the Yucatan Channel and the Straits of Florida, in combination with extensive shelf (northern GoM, Campeche Bank and Western Florida Shelf (WFS)) and deep regions (Figure 1).
The GoM-HYCOM 1/50 domain covers the entire Gulf, the adjacent areas in the Caribbean Sea and the Straits of Florida, connecting the Gulf with the Atlantic Ocean (Figure 1). The vertical grid employs 32 hybrid layers. The high resolution of the model is important to effectively resolve mesoscale and coastal processes. The configuration of the model is similar to the GoM-HYCOM 1/50 model used in Le Hénaff and Kourafalou [27]. In particular, it uses daily river discharges for the 15 larger rivers in the U.S. part of the domain, while other rivers are represented with their monthly climatology and implemented based on the parameterization by Schiller and Kourafalou [34]. The boundary conditions come from the operational Global HYCOM (GLB-HYCOM) simulation run at the Naval Research Laboratory at the Stennis Space Center. For 2010, we used the GLB-HYCOM expt_90.8, for which data and dataset information are available at hycom.org. The model is forced by the 3-hourly winds, thermal forcing and precipitation from the European Centre for Medium-Range Weather Forecasts (ECMWF; https://www.ecmwf.int), with a spatial resolution of 0.125°. The GoM-HYCOM 1/50 uses data assimilation in order to obtain realistic ocean fields that are comparable, in space and time, with observations presented in Section 2.2. The data assimilation scheme is a sequential static ensemble optimal interpolation filter; see details in Halliwell et al. [35,36] and Le Hénaff and Kourafalou [27].

2.2. Observational Data

2.2.1. Remote Sensing

Three sources of satellite data were used in the study. The first includes Maps of Absolute Dynamic Topography (MADT), obtained through AVISO. The MADT fields were derived from the respective AVISO Sea Level Anomaly and Mean Dynamic Topography fields in order to be comparable to the model-simulated sea surface height (SSH). We used the MADT data to compute the LC evolution, using the 17-cm SSH anomaly contour [5] during a long period of 24 years (1993–2016), and to evaluate the ability of the GoM-HYCOM 1/50 to simulate the LC evolution during the 2010 study period. The second dataset was from the Group for High Resolution Sea Surface Temperature (GHRSST), which includes gridded sea surface temperature (SST) fields (1.1-km resolution). The SST fields were employed to describe the coastal upwelling processes over the northwestern tip of Cuba, in tandem with model results and ocean color maps derived from the Moderate Resolution Imaging Spectroradiometer (MODIS/Aqua) satellite (constituting the third satellite dataset used in this study). In particular, we used the ocean Color Index (CI) distributed by the University of South Florida; the CI increases with the water productivity and material content [37].
Several satellite data were also assimilated in the model as presented in Section 2.1 (see also Le Hénaff and Kourafalou [27]). The present simulation assimilated along-track altimetry from Jason-1, Jason-2 and Envisat, distributed by AVISO, and SST from the U.S. Navy’s Multichannel SST dataset, which is available on the U.S. Global Ocean Data Assimilation Experiment server (http://usgodae.org).

2.2.2. In Situ Observations

The performance of the model was tested with the near-surface measurements collected from the Shipboard Automated Meteorological and Oceanographic System (SAMOS; http://samos.coaps.fsu.edu) for the broader GoM domain. SAMOS is a data logging system that continuously records navigational near-surface oceanographic parameters (sea temperature and salinity) while the vessel is underway [38] (Briggs et al., 2012). Each SAMOS cruise includes approximately 1400 near-surface observations along a specific ship track. We compiled a dataset from a large number of 2010 cruises (02 November–10 December) from R/V Atlantis that includes extensive sampling of the Louisiana Shelf and a long cross-section from the Straits of Florida to the Texas Shelf (Figure 2a). The performance of the model was also evaluated against observations collected by the R/V Nancy Foster of the National Oceanic and Atmospheric Administration (NOAA) that conducted a two-week survey in the GoM and the Straits of Florida in July 2010, in response to the DwH oil spill. Besides several measurements of biochemical and physical parameters along the eastern and central GoM, the ship collected temperature profiles along two sections across the Straits of Florida in early July. These are the only available cruise data over the Straits during the oil spill period.
The simulation used in the present study also assimilated in situ observations: SST from buoys, cruises and surface drifters, temperature and salinity profiles from Argo floats and temperature profiles from Expendable BathyThermograph (XBT) casts. In addition, it assimilated the airborne profiles of temperature and salinity collected in the response to the DwH oil spill [39]. It is noted that the SAMOS temperature and salinity observations used to validate the model performance were independent data that were not assimilated in the simulations. As for satellite SST, the local observation radius for in situ SST data is 100 km, and SST data were assimilated in areas where the bathymetry is deeper than 10 m. The errors of the vertical profiles of temperature and/or salinity vary on the vertical, with amplitude estimated from climatology data [35]. The local observation radius for profiles is 180 km, and those data were assimilated in areas where the bathymetry is deeper than 10 m.

3. Results

The study results are based on a long-term model simulation (2010–2017), focusing on spring and summer of 2010 (DwH period). The simulated fields were also analyzed by employing satellite and in situ observations, presented in Section 2.2. All observational data were also used to evaluate the model performance in specific oceanographic processes (e.g., LC evolution, LCE shedding events, upwelling processes) and over the CubAN formation region in the southeastern GoM.

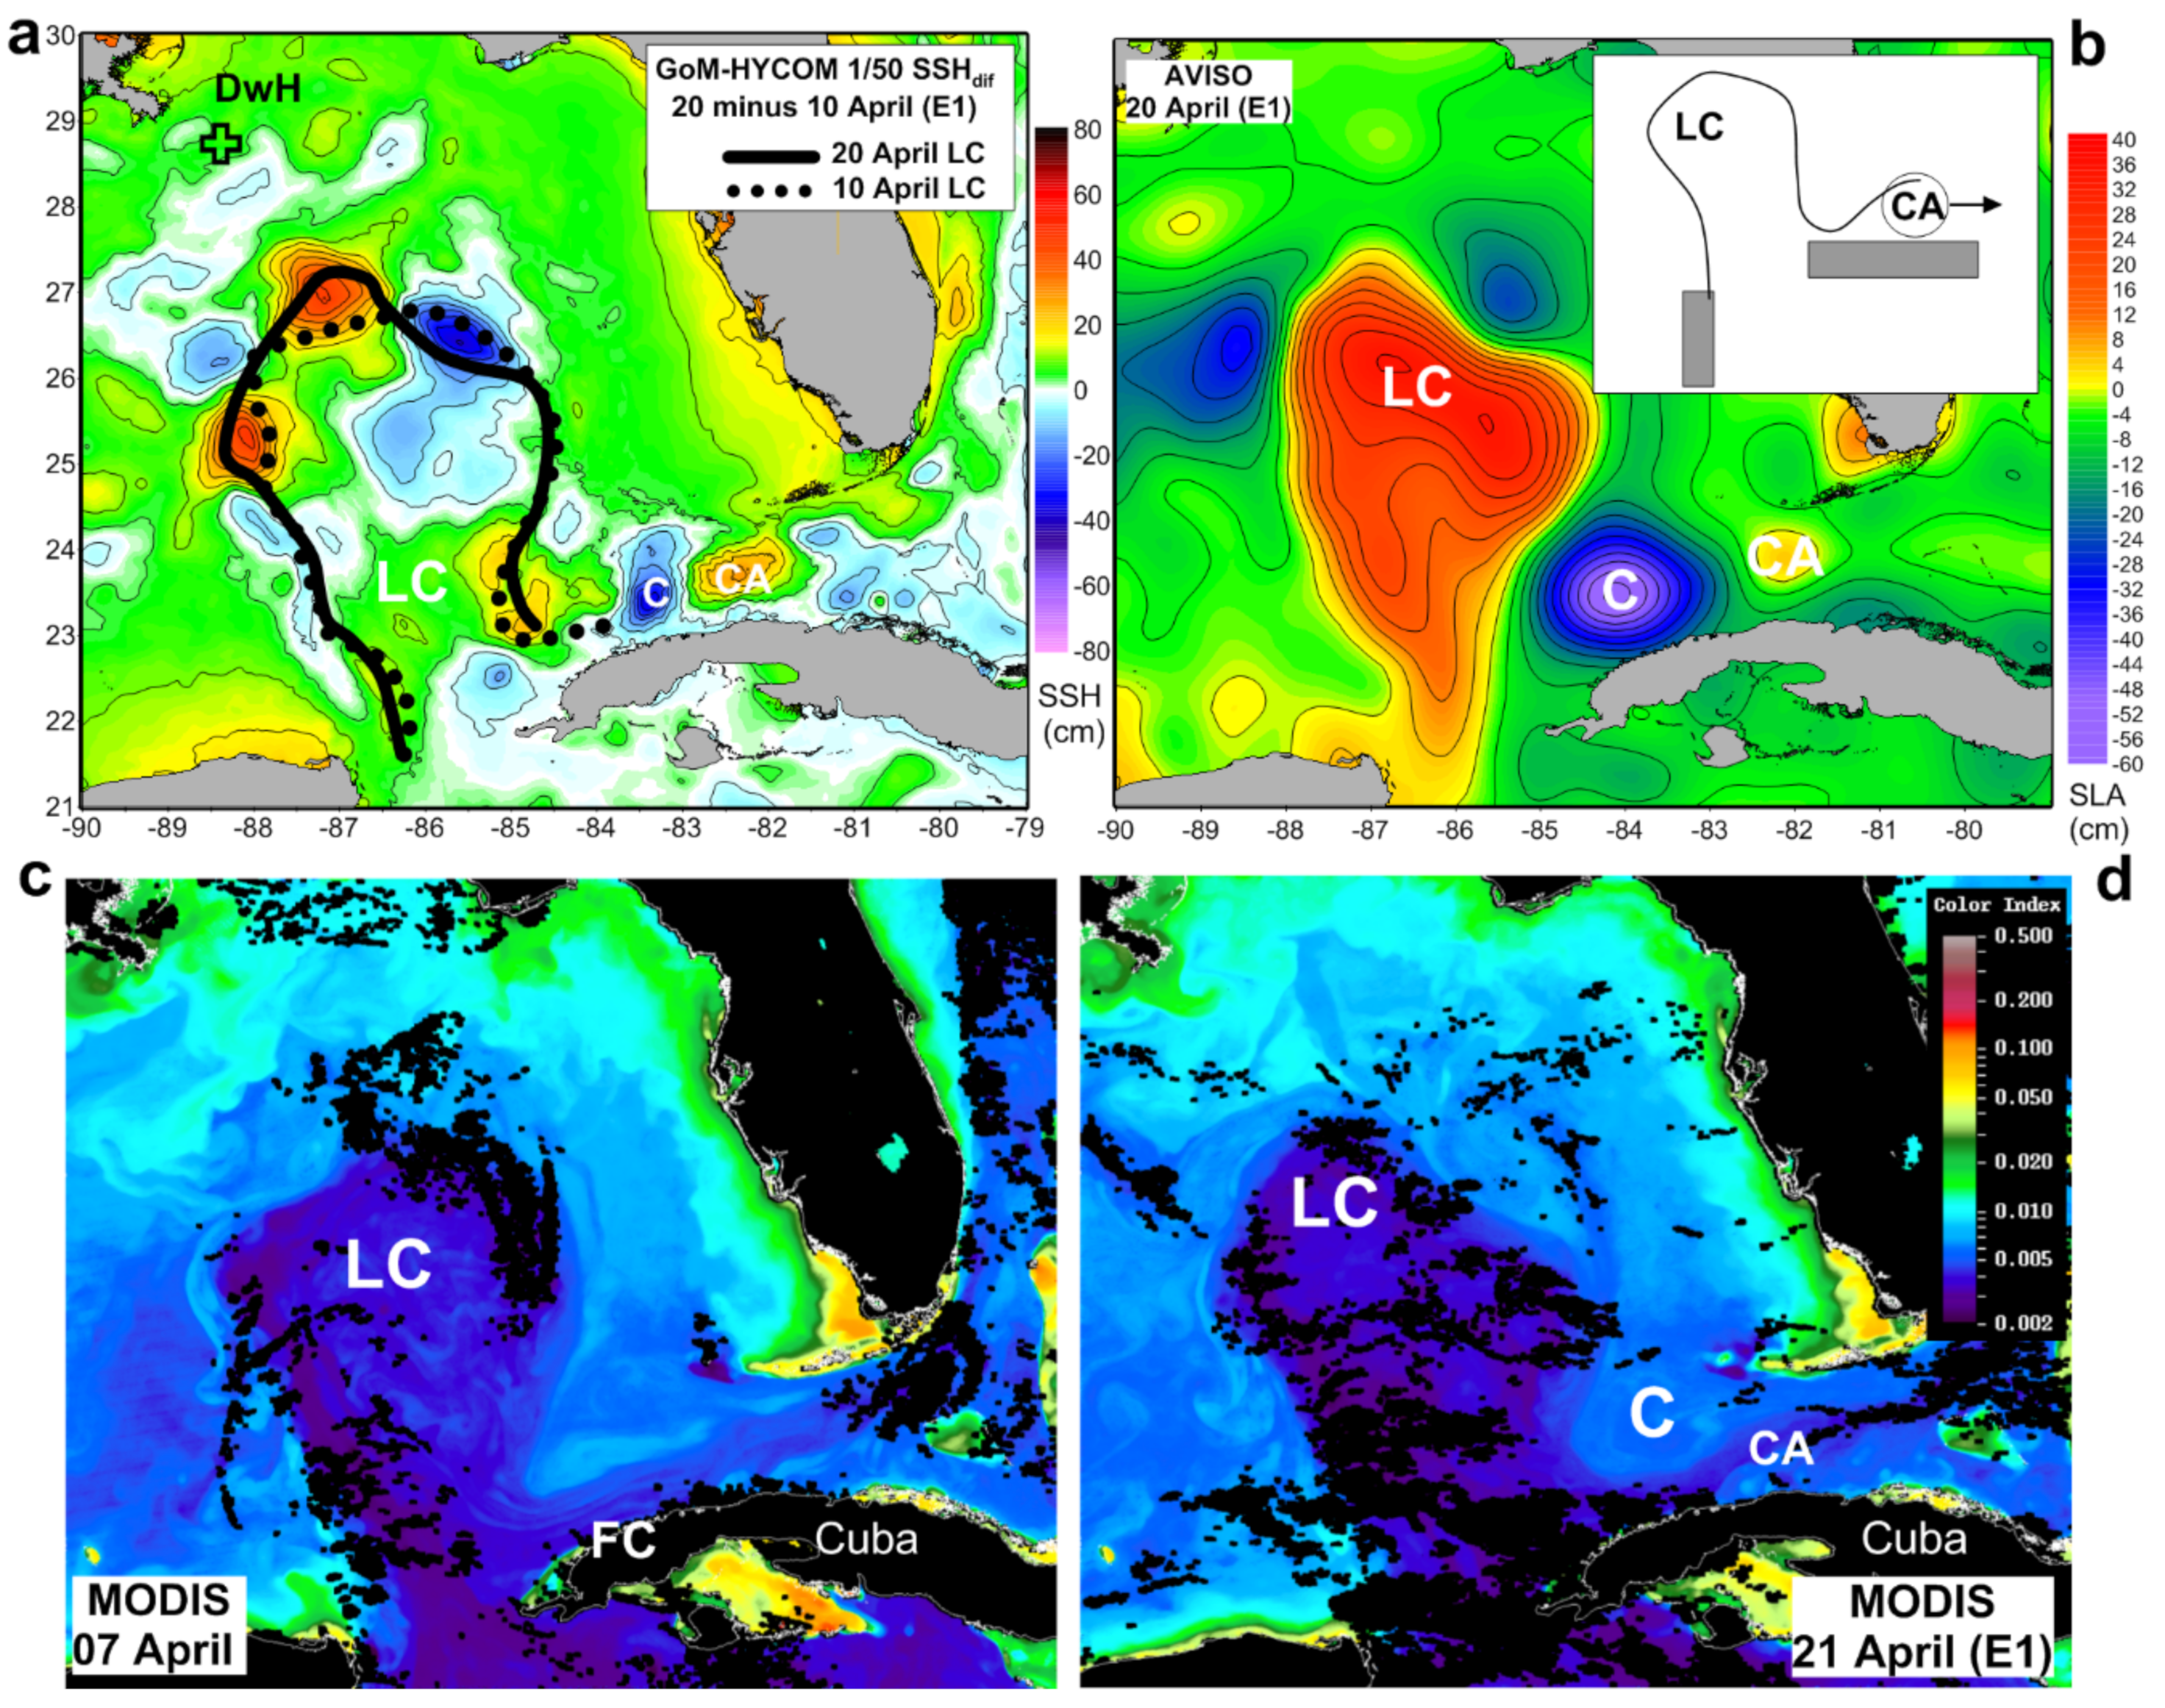
3.1. Model Evaluation

Le Hénaff and Kourafalou [27] confirmed the good performance of GoM-HYCOM 1/50, comparing its results with both observations and two data-assimilative models over the GoM. GoM-HYCOM 1/50 validation was also conducted based on comparisons with non-assimilated data such as satellite salinity fields, satellite ocean color maps, gliders and a DEEPEND (Deep Pelagic Nekton Dynamics of the Gulf of Mexico consortium) cruise (DP02, August 2015; http://www.deependconsortium.org) over the central-northern GoM [40].
The ship-borne in situ salinity and temperature measurements collected from R/V Atlantis (SAMOS database, Section 2.2.2) were compared to the model-simulated values for the same locations and dates. The model evaluation covers a large number of measurements (>45,000 for salinity and >50,000 for temperature) over the Straits of Florida and the central, northern and western Gulf (Figure 2). The surface temperature comparisons (Figure 2a) confirmed the good performance of the model with a statistically significant high Pearson coefficient: rPearson = 0.96 for 7.26 degrees of freedom (d.o.f.), which is larger than the 0.65 reference value for the same number of d.o.f, meaning that it is statistically significant based on Thomson and Emery [41]. The simulated and observed values averaged over the entire field period were around 24 °C, with reasonable root mean square error (RMSE = 0.85 °C). Similarly, the model effectively reproduced the salinity field of the GoM, both close to the Mississippi Delta with low values and over more saline regions (>36; Figure 2b). Although the model slightly overestimates the low salinity values at times, the Pearson coefficient (rPearson~0.70 > 0.30 for 38.79 d.o.f.) and the coefficient of determination (R2 > 0.50) are both high. The mean salinity values differ only by 0.04 units and the general RMSE is low (0.45). The comparisons of salinity values higher than 34 reveal better agreement between simulated and observed data for salinity higher than 34. The largest differences occurred for low salinity values, usually detected over regions with river plumes (e.g., Louisiana Shelf), located away from the area where the LC usually evolves and from the Straits of Florida. The temperature values that are more related to the LC variability and the mesoscale dynamics in the southeastern GoM (e.g., CubANs, FC, cyclones and coastal upwelling) were well reproduced by the model.
The presence of a wide FC covering the width of the Straits is associated, by geostrophy, with a tilt of the isotherms, with colder waters uplifted in the northern part of the Straits. This is seen in the observations (Figure 2c) as well as in the simulation (Figure 2d) at the shelf slope on the northern part of section S1 on 1 July. Very cold waters (<12 °C) were detected at 150 m, while water masses of 20 °C were detected at 100 m, in contrast to the southern part of the section (Cuban coast), where warmer waters (>28 °C) prevailed at the same depth of 100 m. Smith [42] showed that upwelling may occur over the Eastern Florida Shelf when the northward Gulf Stream boundary current comes in contact with the continental shelf. This is to be distinguished from wind-induced coastal upwelling as in Hsuesh and O’Brien [43]. Kourafalou et al. [44] also discussed the LC-induced upwelling over the southwestern WFS. The GoM-HYCOM 1/50 effectively reproduced the vertical structure of both the upper and the deeper ocean with very warm waters (>28 °C) above 100 m and very cold waters (<6 °C) below 900 m, respectively. The stratification in the northern part of section S2 (>24° N) was different on 4 July, with flatter observed (Figure 2e) and simulated (Figure 2f) isotherms in comparison to 1 July (Figure 2c,d), showing a clearly stratified upper ocean. This illustrates the ability of the GoM-HYCOM 1/50 model to effectively simulate both the upper and deeper ocean structure of the southeastern GoM. It is noted that these comparisons are based on a large number of observations that have not been assimilated in the simulation. More comparisons with dependent altimetry data (assimilated) observations are discussed in Section 3.2.

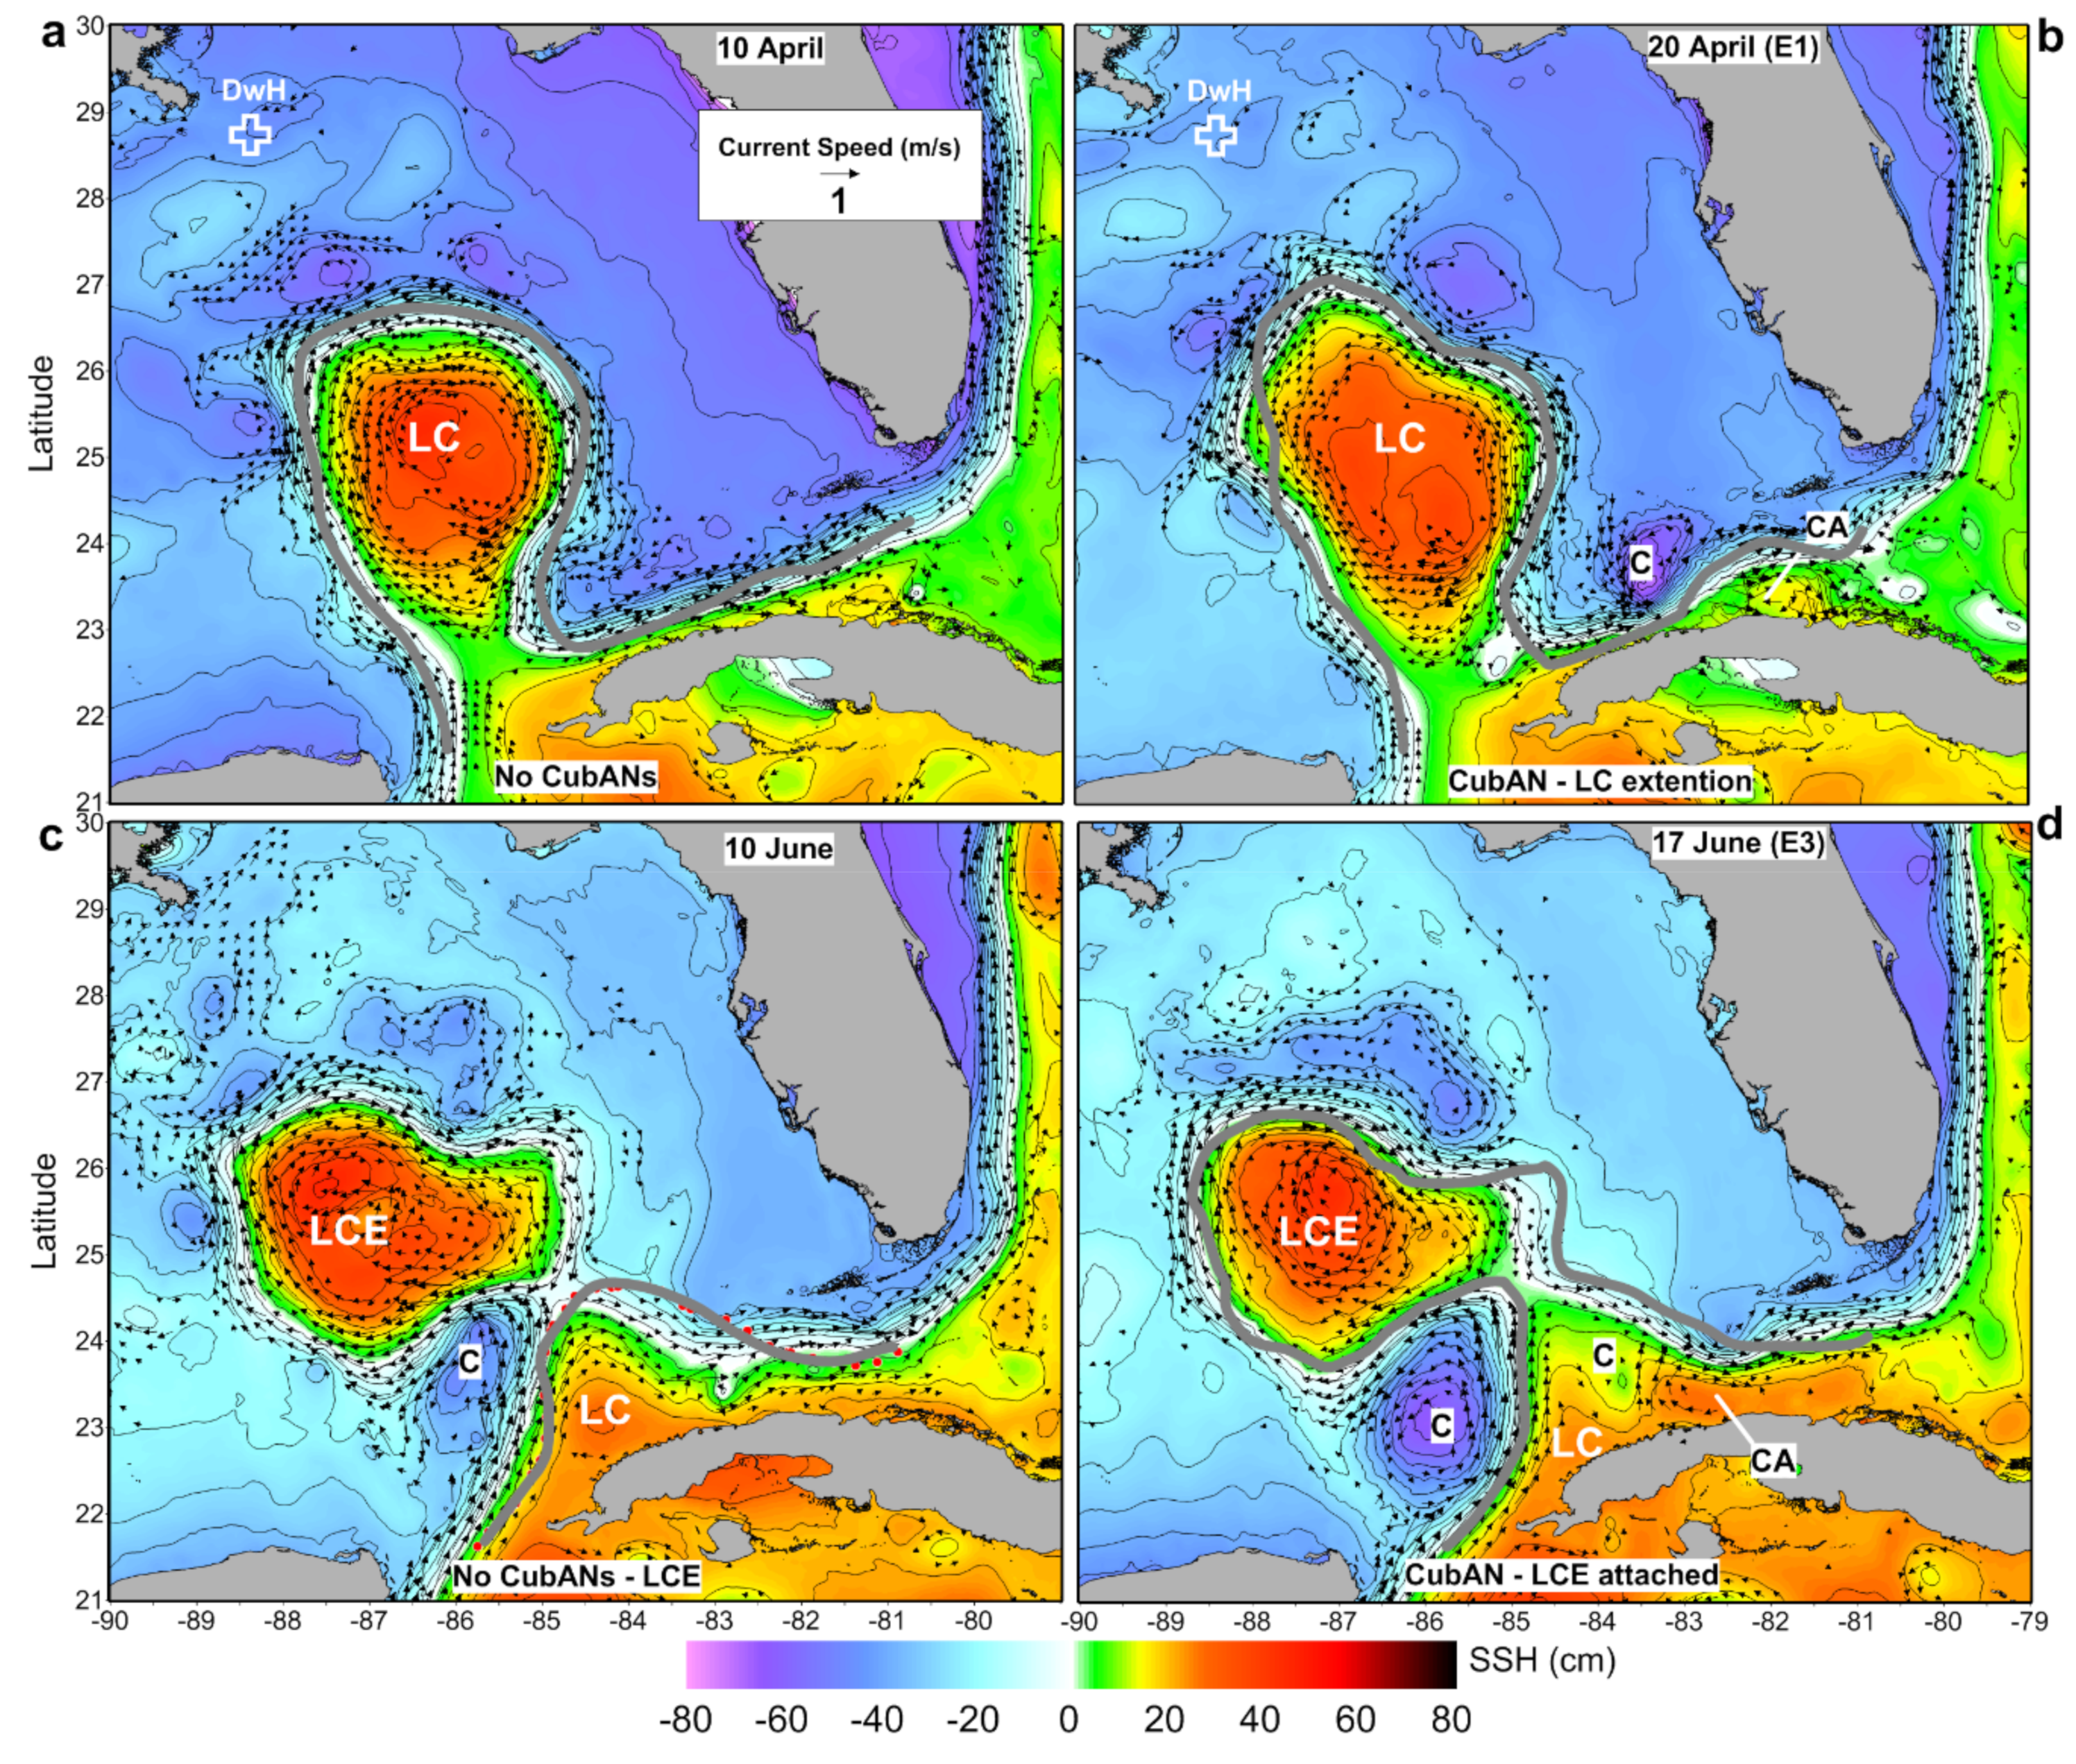
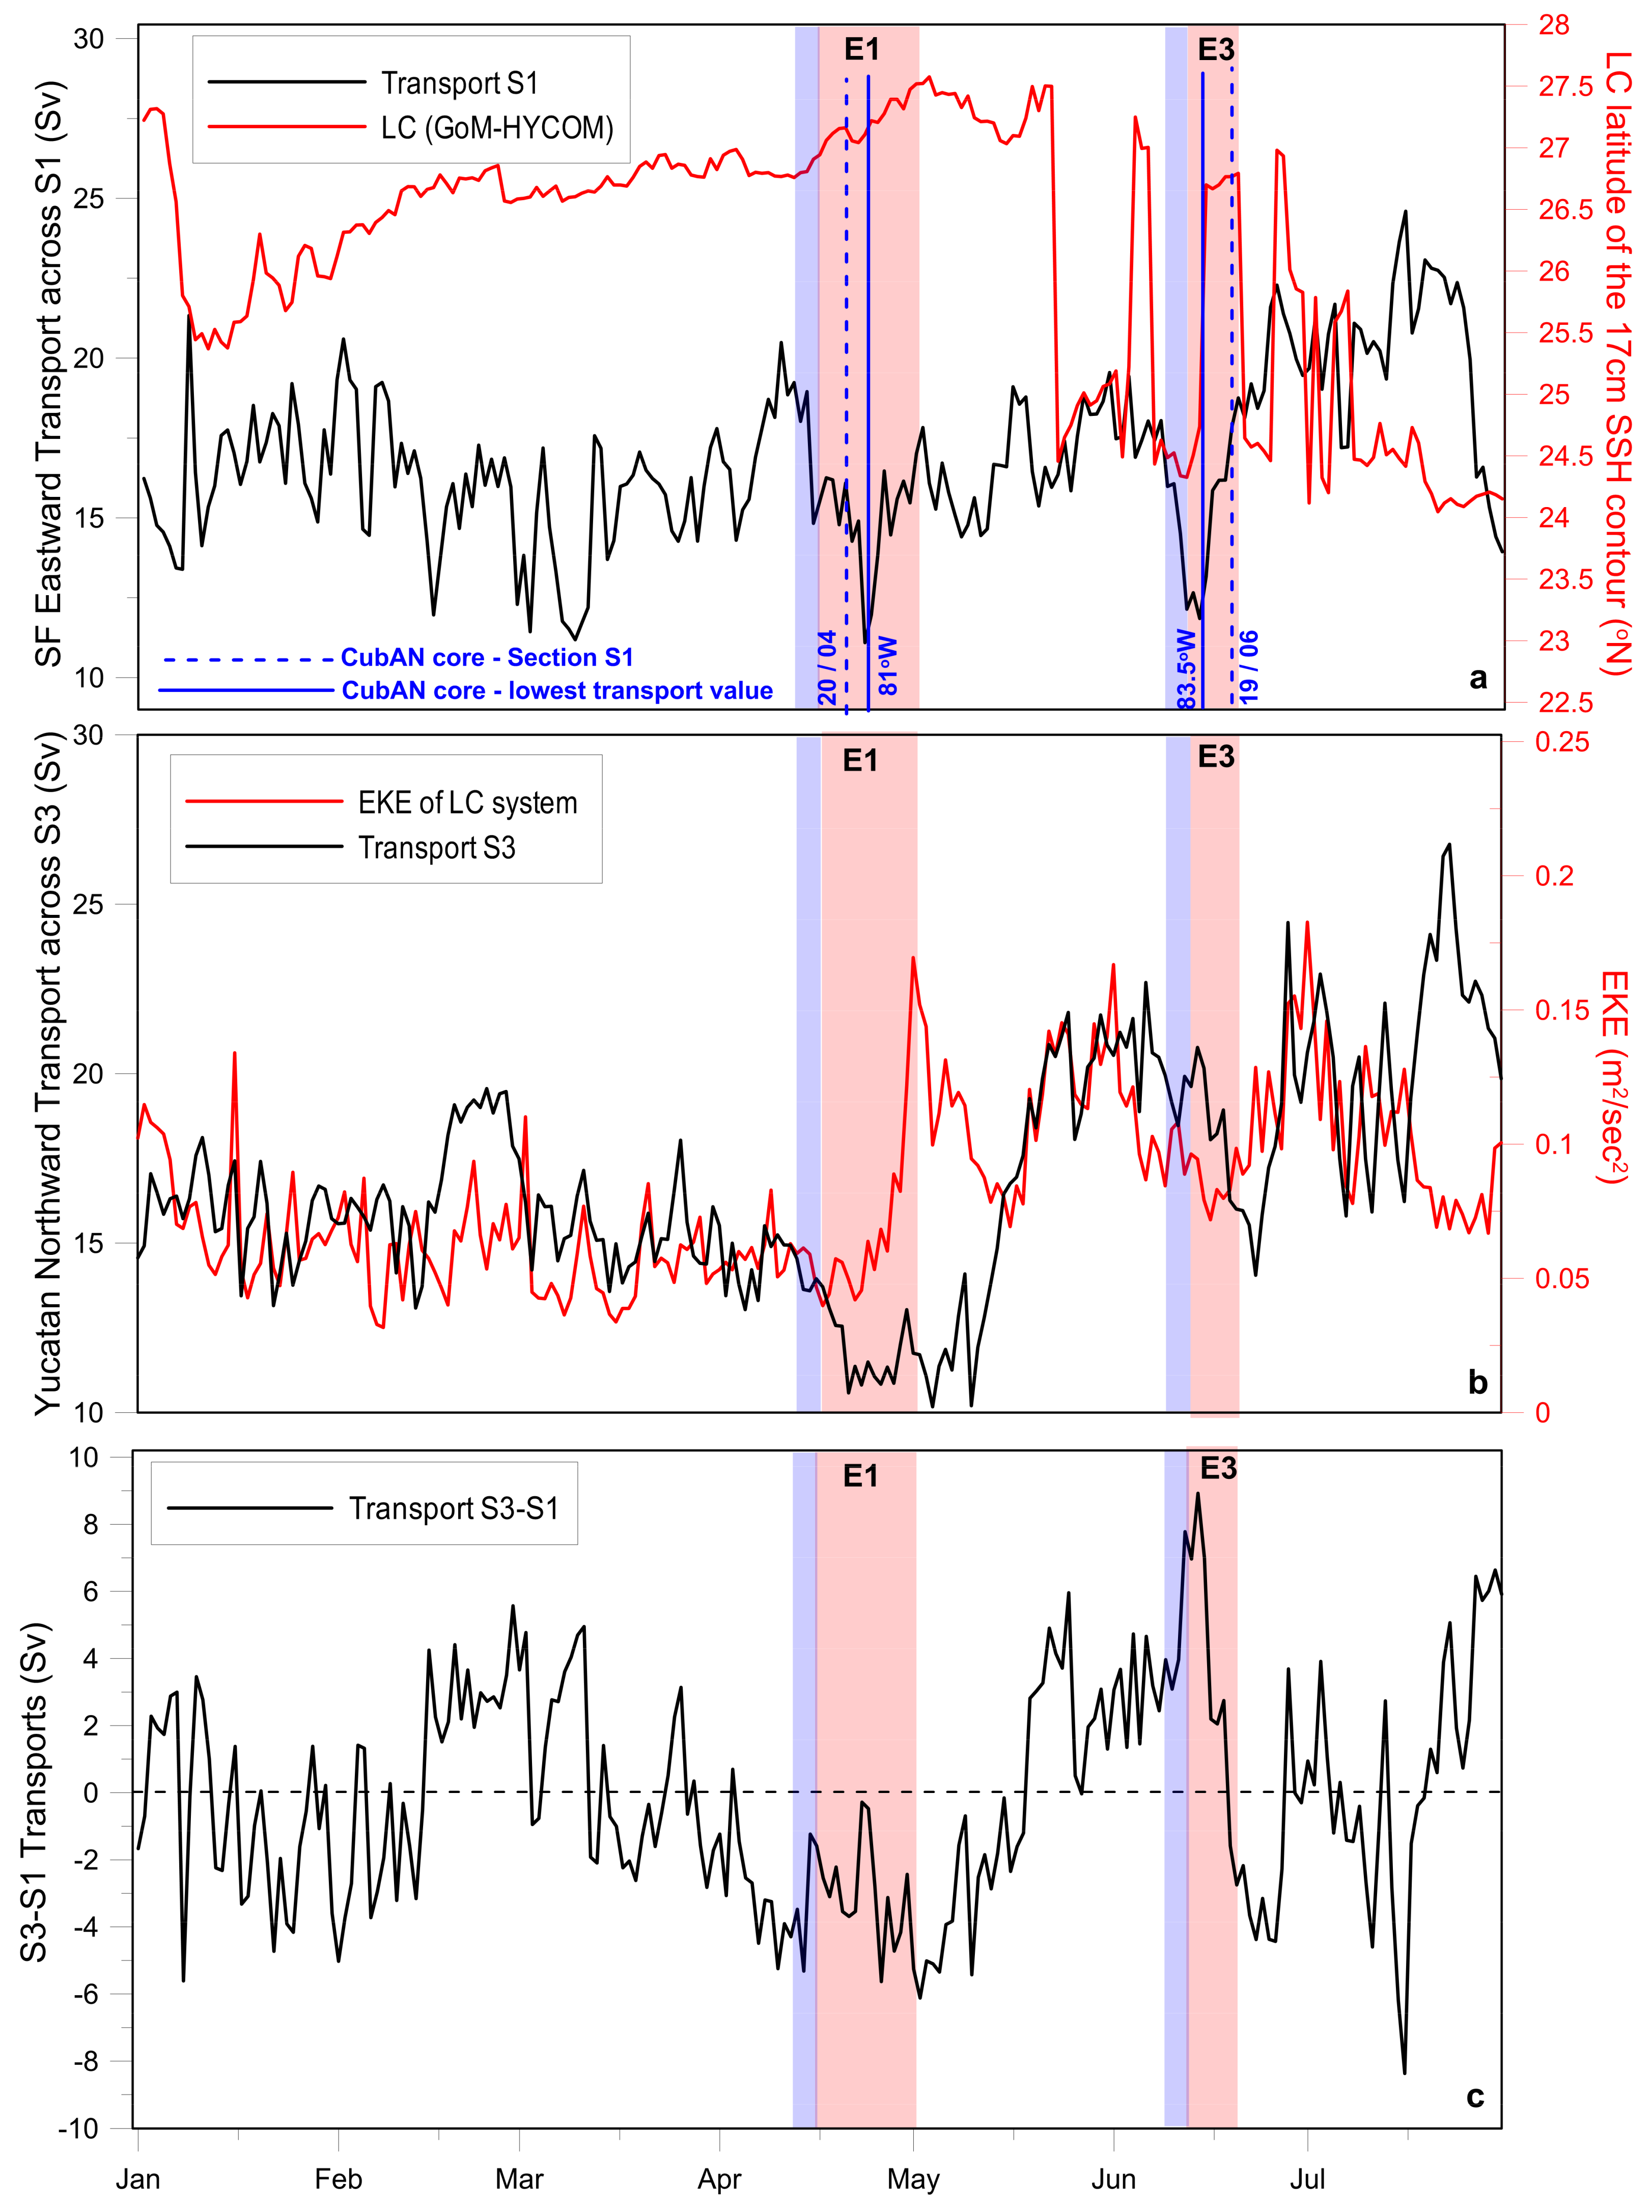
3.2. Loop Current System Evolution

The anticyclonic eddy activity along the northwestern Cuban coast and the formation of CubAN eddies are related to the evolution of the LC/FC system. Kourafalou et al. [20] showed a strong correlation between LC extension and CubAN formation during a protracted period of 13 years (2004–2016). Periods of extended LC over the central and northern Gulf are related to low occurrence frequencies of CubANs, while long periods of CubAN presence were identified during respective periods of retracted (young) LC. However, exceptions with low correlation between these two patterns were also identified due to the effects of local (e.g., coastal upwelling) and regional (e.g., LCFE) processes over northwestern Cuba [20,23].
The northern extension of the LC front during an extended period (1993–2016) was computed based on the 17-cm SSH anomaly contour [5,17,22], derived from the AVISO data (Section 2.2). The temporal evolution of the northern LC front actually represents the changes in the LC extension, including its growth toward the northern GoM, the LCE detachment and shedding periods and the presence of the retracted LC over the western entrance of the Straits of Florida. The observed LC northern position has a standard deviation of approximately one degree and a mean value of 26.4° N, estimated over 24 years (not shown), which can be used as the threshold of the LC northern extension or southern retreat. The year 2010 was one of the cases with extensive southern LC withdrawal (Figure 1), revealing a low annual average (25.8° N from AVISO and 25.9 from GoM-HYCOM 1/50; Figure 3). The daily evolution of the LC during 2010 and the CubAN periods, when one or more CubANs are formed, are presented in Figure 3, employing model fields, satellite and in situ data. The Pearson correlation coefficient between the AVISO- and GoM-HYCOM 1/50-derived time series is significantly high (rmodel-AVISO = 0.8 > 0.65 for 7.32 d.o.f.), and the associated RMSE is lower than 1° (0.6°), showing the good performance of the model. The mean, minimum and maximum values and the respective 1st and 3rd quartiles, derived from the satellite and simulated data, also confirm the ability of the model to effectively simulate the LC evolution (Figure 3). A large difference between the 1st quartile and the 3rd quartile was computed for 2010 (~1.4 degrees; Figure 3), indicating large variation of LC front extension around its mean latitude.
The LC was generally north of its mean position from February to May 2010 and for shorter periods in June, August, September and November, while it significantly retreated during the rest of the year. The LC, derived from both satellite (AVISO) and simulated (GoM-HYCOM 1/50) fields, revealed its highest latitude at the end of April and in early May (~27.5° N on 02 May), a few days after the DwH platform explosion on 20 April. The southward LC retreat is evident beyond mid-May and during June and July, in agreement with findings by Hamilton et al. [8]. The LC presented its most retracted position (marked on Figure 1) on 23 July, a few days after the capping of the DwH bottom leak on 15 July. As the LCE underwent periods of detachment/re-attachment, the retracted LC changed until it reached south of 25° N latitudes in September. These LCE detachments kept the LC body south of 26° N during several periods in summer 2010. Five detachments and re-attachments of Eddy Franklin were also identified by Hamilton et al. [8]. The LCE re-attachments increased the LC extension toward the northern Gulf, especially during June and August. It is notable that 2010 was a year of conditions favorable to CubAN formation, in agreement with Kourafalou et al. [20], who showed that CubANs were present over the Straits of Florida for more than 100 days in 2010 (Figure 4 in [20]).
Several mesoscale anticyclonic eddies were identified in the Straits of Florida and along the northern Cuban coast during and after the DwH oil spill (five periods from April to November 2010; Figure 3) based on the methodology described by Kourafalou et al. [20] and Androulidakis et al. [23]. The marked CubAN periods are associated to the dates when the anticyclonic vortices were completely formed (“closed” eddy), although their formation had begun a few days earlier (see Section 4). Herein, we identified five periods of CubAN formation: two periods of type “B” CubANs during extended LC phases (E1 and E3) and three periods of type “A” CubANs during retracted LC phases (E2, E4 and E5; Figure 3). The first CubAN period (E1, type “B” CubAN) was detected during the second half of April, at the time when the DwH rig exploded (20 April 2010). The LC grew toward the northern GoM during the same period (Figure 3), reaching its northernmost location (27.5° N) in early May (Figure 1 and Figure 3). The presence of a type “A” CubAN in the second half of May coincided with the LCE detachment and young LC formation (E2, Figure 3) and resulted in the northward shift of the FC by 1° at the western Straits entrance (Figure 3). A third period of CubAN formation (E3, Figure 3) was detected in mid-June, when Eddy Franklin re-attached to the LC main body. The LC withdrew south of 24.5° N until the end of July during the presence of a type “A” CubAN (E4, Figure 3). The re-attachment of Eddy Franklin and the northward extension of the LC (26.5° N) in the beginning of August (Figure 3) marked the end of this CubAN period. August was characterized by a northern LC extension and the absence of anticyclonic activity along Cuba. A type “A” CubAN formed inside the young LC that retracted south of 24.8° N on 10 September (E5, Figure 3) after an extended LC period in August.

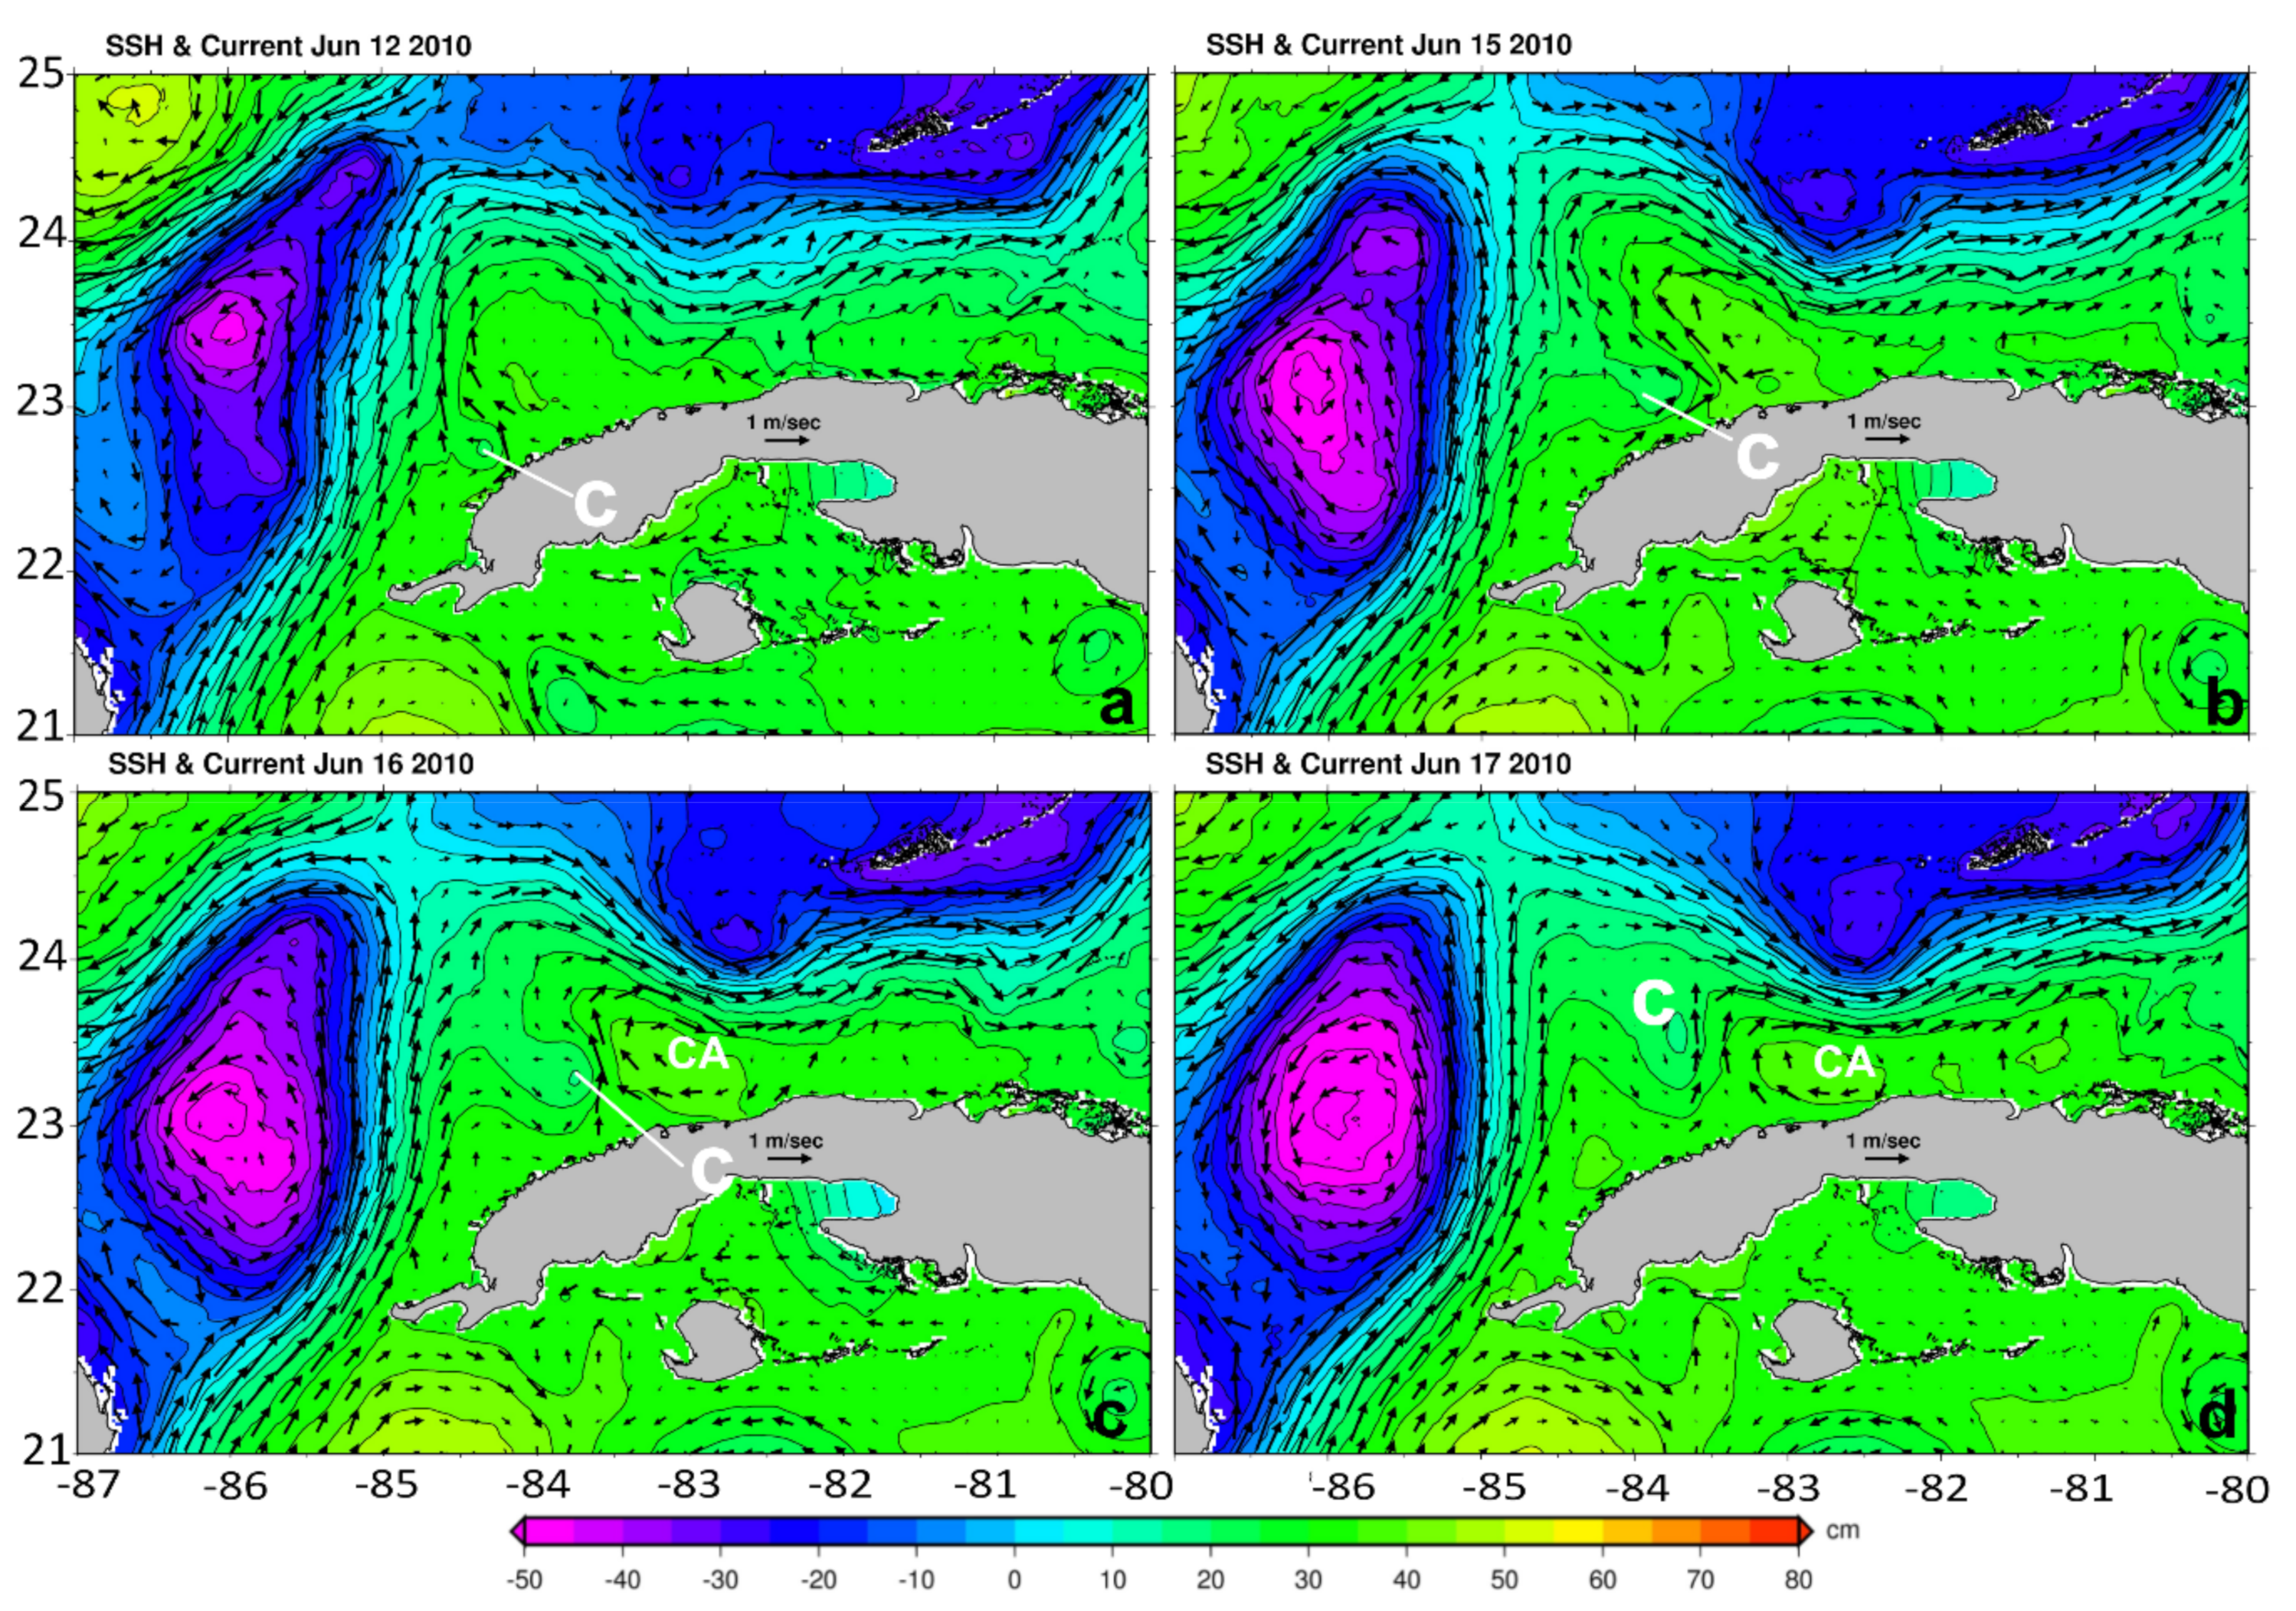
3.3. Evolution of Cuba Anticyclones (CubANs)

Herein, we focus on the two periods, in mid-April (E1) and in mid-June (E3), when the formation of CubANs coincided with elongated LC phases (either via LC extension or LCE re-attachment; type “B” CubANs). We employed near-surface currents and SSH fields from the GoM-HYCOM 1/50 simulation, in tandem with satellite MADT, to explore the two main periods of CubAN presence during the oil spill in relation to the LC system characteristics presented in Section 3.1 (Section 3.3.1). Daily snapshots of CubAN and LC system characteristics of each period/event are presented in Figure 4. In all cases, the extension of the simulated LC derived from both SSH and surface current distributions agrees well with the 17-cm contour derived from the AVISO fields, which is expected since the model assimilates altimetry observations.

3.3.1. CubAN Period Event E1: Extended LC

The first CubAN period (E1, Figure 4b) was detected during the second half of April, at the time when the DwH rig exploded (20 April 2010). The LC grew about 0.75° of latitude degrees toward the northern GoM during the same period (Figure 3), reaching its northernmost location (27.5° N) in early May (Figure 1 and Figure 3). The area of the LC, computed by the simulated 17-cm SSH contour between the 22° N latitude in the south and the 84° W longitude in the east, also supported the LC growth during this period (15 April to 30 April); the area expanded from 130 to 140 km2. Liu et al. [2] showed that a small amount of the surface oil was entrained into the northern part of the LC system in May 2010, before the formation of Eddy Franklin (maps of their analysis can be found at http://ocgweb.marine.usf.edu/~liu/geovel.html). A cyclonic eddy was present at the west entrance of the Straits of Florida (~83.5° W; 23.5° N) on 20 April, characterized by low SSH (−0.5 m) and strong surface anticlockwise currents (~1 m/s) (Figure 4b). This cyclone was absent 10 days earlier, when no CubANs were detected in the Straits and the LC was less extended (Figure 3 and Figure 4a), suggesting that the cyclonic eddy contributed to the formation of the CubAN, as discussed by Kourafalou et al. [20] and Androulidakis et al. [23].
On April 20, the cyclonic eddy was large, covering the entire entrance of the Straits where the eastward FC is usually dominant. This large LCFE was associated with the formation of a type “B” CubAN around 82° W. The presence of the cyclonic eddy was responsible for the southern position of the FC at 83° W during period E1 (Figure 3 and Figure 4b). This case of CubAN formation took place under the direct effect of an LCFE, although the LC remained fully extended over the Gulf. Androulidakis et al. [23] showed that the intrusion of an LCFE from the north towards the western Straits of Florida may “neck down” the eastern “foot” of the extended LC close to the Cuban coast, affect the FC evolution and form a type “B” CubAN. The relation between the formation of this type “B” anticyclonic eddy and the intensification and extension of the LC during the DwH accident is further discussed in Section 4.1.

3.3.2. CubAN Period Event E3: Eddy Franklin Re-Attachment

A second period of type “B” CubAN formation (E3, Figure 3 and Figure 4d) was detected in mid-June, when Eddy Franklin re-attached to the LC main body. The main formation condition for the CubANs in this case was the cyclonic pattern inside the main LC, at 84° W–23.5° N (Figure 4d). This cyclonic eddy, which formed close to the Cuban coast on 12 June (Figure 5a), propagated northward until 17 June, supported by the supply of colder upwelled waters (see Section 4.2). The gradual formation of the CubAN eddy during the cyclone evolution along the anticyclone western periphery is presented in Figure 5b,c. By 17 June (Figure 5d), it separated the core anticyclonic circulation within the LC base, leading to the formation of a well-defined anticyclonic eddy (type “B”) pushing the FC latitude north of 23.5° N (Figure 4d), although a respective cyclonic eddy evolved along the shelf-break of the southern WFS [45,46]. One week earlier, on 10 June, the LCE was clearly detached from the main LC body, and surface currents in the Straits indicated an eastward direction without any anticyclonic eddy formation along Cuba (no CubANs; Figure 4c). The northward propagation of Eddy Franklin was blocked by a large pattern of cyclonic activity (~27° N), which aligned along the LCE’s northern front, contributing to its reattachment to the main LC body (Figure 4d). In Section 4.2, we examine whether the enhancing of the northward extension of the young LC, associated with the re-attachment of Eddy Franklin, was related to the mesoscale dynamics inside the Straits and further connected to coastal upwelling processes along the Cuban coast in agreement with a formation mechanism introduced by Androulidakis et al. [23] (Cases 1 and 2 in Figure 3 in [23]).
These two events during the DwH oil spill period, presented in Figure 4, are characterized by strong interactions between different southeastern GoM circulation patterns: the LC main body, the anticyclonic LCE (Eddy Franklin), the cyclonic LCFEs and the evolution of anticyclonic CubAN eddies along the Straits of Florida. These two events of CubAN formation (E1 and E3), characterized by type “B” eddies, were triggered by cyclonic activity over northwestern Cuba, while the LC extended toward the northern Gulf, and will be further discussed in Section 4.1 and Section 4.2

4. Discussion

Our results support the connection between the LC evolution and the mesoscale processes over the southeastern GoM and the Straits of Florida during the DwH period. We now discuss to what extent these southeastern GoM oceanographic processes were able to influence the basin-wide LC evolution that controls the hydrocarbon pathways from the northern to the southeastern region of the GoM. During the DwH oil spill, although the LC reached its furthest north position, it was mostly away from the northern Gulf. These “retracted LC” phases prevailed during most of the periods of CubAN activity (E2, E4 and E5) as expected from type “A” CubANs [20,23]. However, two cases of type “B” CubAN evolution during the elongated LC periods were identified in April (E1) and June (E3) within the DwH oil spill period. We will discuss the conditions that determined the CubAN evolution and their contribution to the northward extension of the LC during these two periods, which could have increased the probability of oil reaching the Straits of Florida. The first case is related to the extension of the LC until early May (E1; Section 4.1) and the second case is characterized by the re-attachment of the retracted LC to the previously detached Eddy Franklin in June (E3; Section 4.2). We show that specific mesoscale oceanic conditions contributed to the enhancement of the northward extension of the LC and its re-attachment to Eddy Franklin. These are the formation of anticyclonic CubAN eddies and their separation from the LC under cyclonic activity and the reduction in the eastward flows in the Straits of Florida (weakening of the FC).

4.1. Connection between CubANs and Loop Current (E1 Period)

Herein, we investigate if the release of type “B” CubANs during the E1 period (see Section 3.3.1) is related to the further extension of the elongated LC in the early stage of the DwH accident in April 2010 (Figure 3). The SSH differences between 10 and 20 April (E1 period) are presented in Figure 6a. Two large areas with negative (−0.30 m) and positive (0.30 m) changes are revealed at 83.5° W and 82.5° W inside the Straits of Florida (~23.5° N), respectively. These two regions are the only ones with significant high differences inside the Straits during this 10-day period, which was marked by the formation and eastward evolution of a type “B” CubAN, under the influence of an LCFE at the southeastern part of the LC core (Figure 4b). The satellite altimetry data on 20 April support the strong cyclonic activity between the LC and the CubAN in the western part of the Straits (Figure 6b). The ocean color images also show the presence of this eddy dipole (LCFE and anticyclonic CubAN) along the Cuban coast on 21 April (Figure 6d); the spatial distribution of CI clearly shows the cyclonic circulation between the LC (west) and the type “B” CubAN (east). This eddy dipole was absent on 7 April, when the FC was dominant along the Cuban coast (Figure 6c); as shown with the dark blue areas (low CI), the strength of the LC/FC system was reduced inside the Straits on 21 April. Two additional areas with anticyclonic intensification were detected over the northern (27° N) and western (88° W) fronts of the LC, where the SSH increased by 50 cm in only 10 days (Figure 6a). A clear northward extension of the LC took place during this short period, associated with the evolution of mesoscale processes over the western Straits of Florida. The LC revealed a clear withdrawal after the end of the E1 period in early May (Figure 3). The darker blue areas in the ocean color images confirm the change of the LC northern location during this period, showing its extension toward the central northern Gulf on 21 April 2010.
To further examine the role of anticyclonic activity due to CubANs on the LC evolution, we computed the Relative Vorticity (RV) at the model surface layer, normalized with the Coriolis coefficient f of each model cell (RV/f), on 10 April (Figure 7a). The cyclonic belt along the LC periphery is characterized by high positive values (RV/f > 1.5), while the area inside the anticyclonic LC shows negative values (RV/f < −0.5). Negative RV/f values were observed south of 27° N, indicating the LC extension over the central Gulf on 10 April, a few days before the presence of CubANs inside the Straits of Florida. The Straits are characterized by high positive RV/f, related to the presence of the FC (Figure 7a). Ten days later, the cyclonic eddy evolution near the northern coast of Cuba is shown over an area with positive vorticity (RV/f > 2.0) between the LC and the type “B” CubAN (RV/f = −1.0 around 81.5° W; Figure 7b). A change in the cyclonic belt over the northern front of the LC occurred during the E1 period; the cyclonic zone that was continuous around the northern LC front on 10 April was disrupted by 20 April due to the meander activity and the growth of the LC bulge, allowing the extension of the anticyclonic LC waters toward the northern Gulf. Both northward extension and intensification (lower negative vorticity values) of the LC were detected in only 10 days during the E1 period. This offers further evidence of LC northward extension during the CubAN period. The eddy kinetic energy (EKE) was also computed and it confirmed the difference between the periods with and without CubAN eddies. Higher EKE values are shown inside the Straits on 20 April (Figure 7d) due to the formation of the cyclonic–anticyclonic dipole; the distribution of EKE inside the Straits agrees with the respective CI distribution (Figure 6d), showing higher EKE values over areas where mesoscale eddies were observed. The EKE was quite low within the entire Straits on 10 April (Figure 7c), while higher values were computed along the periphery of the LC over the central Gulf.
The presence of cyclonic (LCFE) and anticyclonic (CubAN) eddies at the western entrance of the Straits of Florida (covering almost the entire width of the Straits from 84° W to 82° W) during the E1 period (Figure 6) was associated with a reduction in the FC eastward transport (Figure 8a). The integrated eastward transport across section S1, which covers the entire width of the Straits at 82° W (Figure 1), was higher than 10 Sv during the entirety of 2010 and it was significantly high before the E1 period (20 Sv; Figure 8a). It is noted that the FC fluctuations in the Straits of Florida are related to various metocean conditions and processes; several transport drops were also detected during periods without CubAN eddy presence (Figure 8a). Herein, we examine if such variations, and especially the sharp reductions, are also related to changes in current direction due to the formation of the anticyclonic CubAN eddies. The transport revealed a sudden drop of 4 Sv between 13 and 15 April when the CubAN eddy began to form. A strong reduction of 5 Sv was also revealed in the middle of the E1 period; it increased again in the second half of E1 period when the CubAN moved further eastward, reaching 17 Sv at the end of the E1 period in early May. The core of the CubAN eddy was located at 82° W (section S1) on 20 April and moved east of the section (81° W) on 23 April when the lowest transport value was computed. The release of the type “B” CubAN under the effect of the cyclonic activity led to the weakening of the LC supply to the east (FC), while Caribbean waters continued to supply the Gulf interior through the Yucatan Channel. The weakening of the eastward FC flows during the period of CubAN presence is also discussed in Appendix A with the use of Lagrangian particles. This led to LC intensification and northward extension, reaching closer to the northern Gulf (from 26.8° N to 27.6° N; Figure 8a). The respective northward transport in the Yucatan Channel, as computed across section S3 for the whole water column (Figure 1), revealed a respective but smaller reduction of 1.5 Sv between 13 and 15 April (Figure 8b). The difference between the two transports (inflow to the Gulf minus outflow from the Gulf) increased from −6 to 0 Sv between 14 and 23 April (two successive increases), indicating a larger reduction in the eastward flow in the Straits than the northward flow in the Yucatan Channel (Figure 8c). The LC intensification was also depicted on the evolution of the LC system EKE, which increased significantly during this LC extension, reaching a high peak on 1 May (>0.15 m2/s2; Figure 8b). Liu et al. (2011) showed that this LC phase led to the southward propagation of small patches of hydrocarbons before the Eddy Franklin detachment in late May. Our results connect this important development of the circulation patterns near the DwH accident site to mesoscale processes in the southeastern GoM.
The effect of type “B” CubANs on the flow along Straits of Florida was also tested using an additional simulated year, in 2011. The respective eastward transport across section S1 is presented in Figure 9a. Three strong transport lows were detected in mid-March, at the end of May and in early August of 2011. During all of these periods, clear type “B” CubANs evolved along the northern Cuban coast. A cyclonic eddy was present west of each CubAN, separating the anticyclonic eddy from the main LC body (Figure 9b–d), similarly to the E1 event presented above. The mean annual transport of 2011 was approximately 15 Sv, and for almost half of the year, the transport values were below the mean value (150 days). Androulidakis et al. [23], based on the same GoM-HYCOM 1/50 simulations, detected 71 days of type “B” eddy presence during 2011 (Figure 6a in [23]). These days are mainly related to these three periods when the transport across S1 was <14 Sv lower than the mean level, with values reaching <12 Sv. The LC maximum latitude was high during these events, and especially in March 2011, the LC increase took place at the same time as the transport reduction that began in early March, reaching its minimum value on 17 March (11 Sv; Figure 9a), when the type “B” CubAN eddy center was near 82° W (Figure 9b). These results show that the anticyclonic eddies and the accompanying westward (southern side) and northward (western side) currents that evolve along the Straits of Florida may affect the eastward flow of the FC and, in tandem with other processes in the GoM, may participate in the LC variability.

4.2. Contribution of Coastal Upwelling to CubAN Separation (E3 Period)

A case with an elongated LC and another formation of type “B” eddy was also detected during the E3 period (see Section 3.3.2). The simulated SSH field shows an area of cyclonic activity between the LC and a newly formed anticyclonic eddy at 83° W (Figure 4d). A large, positive SSH difference between 17 and 10 June was located north of Cuba (83° W, 23.5° N), revealing the formation of a type “B” CubAN, while areas with negative values (cyclonic activity) were located west of the anticyclone, around 83.5° W, and north of it (Figure 10a). The retracted LC, detected on 10 June, extended and re-attached to Eddy Franklin, forming an elongated LC by 17 June. Herein, we examine how coastal upwelling over the northwestern tip of Cuba contributed to the enhancement of the cyclonic activity between the two anticyclonic features (LC and CubAN). We seek to explore how this process might be associated with the full release and eastward propagation of the type “B” eddy, the eastward flow reduction in the Straits of Florida and, moreover, the LC extension and re-attachment to Eddy Franklin.
Easterly winds dominated over the region during the entire study period, favoring upwelling along the Cuban coast. However, during the first two weeks of June, the winds (<4 m/s) were not strong enough for coastal upwelling (Figure 10c). The respective SST, derived from GHRSST data, revealed its highest values around 10 June (>29 °C; Figure 10c). SST decreased around mid-June by about 1.5 °C, in tandem with a wind speed increase. The easterly upwelling-favorable winds strengthened between 10 and 24 June (from 4 to 10 m/s). This increase allowed deep and cold waters to reach the surface near the coast, which covered an extensive area between the LC and the type “B” CubAN (83–84° W; Figure 10b). The distribution of the SST differences between 17 and 10 June shows a cold offshore filament with values ranging around −0.5 °C extending along the periphery of the anticyclonic eddy. The upwelling of colder waters is also confirmed by the satellite ocean color image, which shows a thin but elongated “tongue” of productive waters over the same region extending northward (Figure 10d). The offshore spreading of cold upwelled waters amplified the cyclonic activity west of the CubAN eddy, participating in its final shedding as a type “B” eddy. Androulidakis et al. [23], based on simulated data, and Le Hénaff et al. [21], based on observations, also showed the formation of type “B” CubANs due to the effects of coastal upwelling along the northern Cuban coast.
A strong transport reduction of 10 Sv across section S1 began on 10 June, when the anticyclonic CubAN eddy started to form, reaching the lowest value at the beginning of the E3 event between 12 and 14 June (~12.5 Sv; Figure 8a). The LC northward location sharply shifted from 24.5° N to 27° N due to the Eddy Franklin re-attachment. The eddy activity associated with the LC again intensified, with an EKE increase after the ring re-attachment on 15 June (Figure 8b). The overall eastward transport across section S1 was high before the E3 period (~17 Sv on 9 June) and indicates that the FC was dominant along the Straits of Florida. The prevailing eastward flows during May, when CubAN eddies were absent, were also supported by the Lagrangian analysis presented in Appendix A (Figure A1). The FC dominance in the Straits of Florida increased the speed of particles released in the Straits to move directly towards the Atlantic Ocean. The respective Yucatan northward transport was significantly high around 15 June (Figure 8b) and the difference between the inflow (across section S3) and outflow (across section S1) significantly increased by 5 Sv between 10 and 12 June and reached its highest value at the beginning of the E3 period (Figure 8c). The stronger inflow through the Yucatan Channel in comparison to the outflow through the Straits of Florida supplied the LC with more warmer waters that did not exit to the Atlantic but remained inside the Gulf and contributed to the LC extension (Figure 8a).
The attenuation of eastward flows along the Straits of Florida due to the formation of CubANs is described with the aid of Figure 11. The transport reduction during mid-June (Figure 8a) agrees with a respective strong reduction in the area where the surface currents were eastward (Figure 11a). Only 55% of the Straits was covered by eastward velocities on 23 June, significantly lower than in early June, when eastward flows prevailed almost over the entire region (>95% on 10 June). The reduction in eastward flows is also evident in the horizontal distribution of the zonal (Ux) component of the upper-ocean currents presented in Figure 11f,g. This reduction was responsible for the delay with which Lagrangian particles reached the Eastern Florida Shelf after their release at 83.5° W during the E3 period (Appendix A; Figure A1c). Although the entire area was covered by strong eastward currents on 10 June, the area with westward currents was extended on 23 June, especially along the northern Cuban coasts. The domination of strong easterly winds, which caused the coastal upwelling during E3, may also have contributed to this alteration of the general circulation (westward wind-driven flows). Easterly but weaker winds prevailed over the area on 10 June (Figure 11b) in comparison to the strong easterly winds on 23 June (Figure 11c).
We now examine whether the formation of the anticyclonic type “B” CubAN played a more significant role than the westward wind-driven flows in the attenuation of the eastward flows. We estimated the currents corrected from the wind-driven Ekman component in the upper Ekman layer (Figure 11d). The distribution of the east–west currents from the two cases on 10 June (Ux with and without the Ekman component; Figure 11f,h) is similar, due to the low wind magnitude (Figure 11b). The importance of the strong winds on 23 June stands out when the effect of the Ekman currents is removed in Figure 11i (weaker westward flows than in the case with the Ekman component, presented in Figure 11g). However, the attenuation of the eastward flows is also apparent and significant over the Straits (Figure 11i), as weaker eastward currents are shown over the entire area, while strong westward currents up to 1 m/s were still apparent along the Cuban coast. The isolation of the wind-only effect supports our hypothesis that the mesoscale oceanic processes along Cuba may influence the weakening of the generally eastward Straits of Florida transport, as it eventually feeds the Gulf Stream. The CubAN eddy evolution thus has the potential of broader downstream influence on this western boundary current; such implications are beyond the scope of this study. The eastward propagation of the type “B” CubAN under the influence of the cyclonic activity from the wind-induced coastal upwelling altered the LC/FC evolution inside the Straits, reducing the exiting transport of the FC, thus promoting the northward extension of the young LC and facilitating the re-attachment of the Eddy Franklin back to the main body (>26.5° N; Figure 3).
The two cases of type “B” formation (E1 and E3 periods) associated with processes that promote cyclonic vorticity (LCFE and coastal upwelling) were characterized by a northward-extending LC. The LC extension closer to the DwH site would have increased the risk of oil being entrained along the LC front. The connectivity between the northern Gulf and the Straits of Florida was more robust during the E1 period, as the LC reached its highest latitude at the end of April and early May, at the beginning of the DwH oil spill (see Section 4.1). We note that several other conditions prevented the southward advection of oil along the extended LC, namely the strong cyclonic eddy to the north of the LC [4] and the northward winds in late May [22], before the formation of Eddy Franklin.

5. Conclusions

The Deepwater Horizon (DwH) oil spill incident took place in the summer of 2010, when mesoscale variability in the Gulf of Mexico (GoM) was characterized by successive Loop Current (LC) Eddy (LCE, or “ring”) detachments and re-attachments. This anticyclonic eddy activity contributed to the LC evolution and, moreover, the connectivity between the northern and southeastern GoM regions. This study elucidated the associated processes, adding a previously neglected component, namely processes in the southeastern GoM and the Straits of Florida, where the LC feeds into the Florida Current (FC). We showed that the formation of anticyclonic eddies over the northwestern Cuban coast (CubANs, [20,21,23] played a role, among other well-known oceanographic and meteorological factors, in the evolution of the LC/FC system during the DwH oil spill period. Satellite and in situ observations confirmed the ability of the high-resolution GoM-HYCOM 1/50 model to effectively describe both the LC system evolution (LC extensions and LCE events) and the mesoscale activity along the Straits of Florida.
Five distinctive periods of CubAN evolution were identified during the summer 2010 DwH incident period. During most of these events, the connectivity between the northern Gulf, where large quantities of oil were present, and the Straits of Florida was limited, as the LC was in a retracted position. However, two cases of elongated LC were detected that coincided with the formation of CubAN eddies. The first one took place during the early days of the DwH accident in late April, when the LC reached its northernmost location, entrapping a few oil patches along its anticyclonic curvature, as shown by Liu et al. [2]. The impact of a cyclonic LC Frontal Eddy (LCFE) over the southeastern part of the extended LC and the release of anticyclonic CubAN eddies that propagated eastward along the Straits contributed to the intensification and northward extension of the LC. The second case was also related to cyclonic activity, enhanced by wind-induced coastal upwelling along the northern Cuban coast with the release of a CubAN in June 2010 and a respective extension of the young LC that, in tandem with other processes, contributed to the re-attachment of Eddy Franklin and the formation of an elongated LC. The physical mechanism behind this interaction is related to the attenuation of the eastward flows of LC/FC waters due to the release of a CubAN eddy from the LC, thus directing smaller amounts of waters directly towards the Atlantic. The FC transport variability within the confined passage of the Straits of Florida was well established through measurements [47,48] and is generally connected to coastal currents (such as wind-driven southward/southeastward currents along south Florida and the Florida Keys island chain), larger-scale modulations and eddy action within the Straits. The latter has been studied most extensively for the cyclonic eddies north of the Florida Current. Herein, we examined the influence of anticyclonic eddies south of the Florida Current. The drops of eastward transport enhanced the short-term northward extensions of the LC toward the inner Gulf, as its supply of Caribbean waters was higher than the eastward flow in the Straits. This process, in synergy with a strong cyclonic eddy (LCFE) to the north of Eddy Franklin that kept it from moving away from the LC, contributed to this ring’s re-attachment to the main LC after mid-June, restoring the connectivity between the interior Gulf and the Straits of Florida.
Our results provide evidence that the mesoscale processes along the northern Cuban coast may impact the dynamics of the entire Straits of Florida and are related to the regional GoM dynamics. In particular, they are associated with processes influencing the evolution of the LC/FC system (regional branches of the Gulf Stream), which controls the physical connectivity between the northern and southeastern GoM. This physical connectivity has environmental implications within the GoM and it extends to the Atlantic Ocean (Gulf Stream open ocean branch) through the Straits of Florida. We showed how such processes influenced oceanographic conditions during the DwH incident. In the undesirable case of a future oil spill, these processes may potentially influence oil transport and fate, even though the oil spill origin is located at a distanced area (e.g., northern GoM). Knowledge of the physical connectivity and, thus, the transport of pollutants between remote regions is an important aspect of oil spill studies. Alves et al. [49] showed that oil slick expansion and connectivity between remote regions in the Eastern Mediterranean region are strongly controlled by seabed morphology, which determines the ocean circulation. The level of influence of ocean eddies on oil spill trajectories may even justify the use of chemical dispersants in the very few hours after large accidental oil spills [50] such as the DwH incident. Our results showed that the evolution of circulation features at distances from the oil spill origin should be taken into account during large oil slicks that may affect more than one country (e.g., U.S., Mexico, Cuba and Caribbean islands). Pålsson [51] argued that the experience gained from the DwH accident should be used as an example to improve preparedness in the Baltic Sea, which is surrounded by nine countries and is under continuous threat of oil spills, mainly related to the heavy ship traffic. The efficient prediction of ocean dynamics by taking into account local and coastal physical processes (e.g., mesoscale eddies, coastal upwelling, etc.) that may affect large-scale circulation is crucial for improving preparedness and response measures in the case of large oil pollution incidents. In a synthesis study that discusses the scientific experience gained in the aftermath of the DwH oil spill, Barker et al. [52] argued that high-resolution modeling is necessary to resolve coastal and shelf processes. We showed that among other major meteorological and oceanographic conditions that mainly control the LC/FC evolution, specific southeastern GoM mesoscale processes may also participate in the evolution of hydrocarbon pathways. Oil spill modeling in the GoM would benefit from international studies that set standardized approaches for quantifying coastal hazards from an oil spill (such as Sepp-Neves et al. [53], based on three different areas in the Atlantic Ocean) and provide tools in support of related management decisions (such as Zodiatis et al. [54], for the Mediterranean Sea).

Author Contributions

Conceptualization, Y.A., V.K. and M.L.H.; methodology, Y.A., V.K., M.L.H. and H.K.; software, H.K., M.L.H. and N.N.; validation, Y.A.; investigation, Y.A., V.K., M.L.H., N.N. and H.K.; resources, M.L.H. and H.K.; data curation, Y.A., M.L.H. and H.K.; writing—original draft preparation, Y.A.; writing—review and editing, Y.A., V.K., M.L.H., N.N. and H.K.; visualization, Y.A.; supervision, V.K.; project administration, V.K.; funding acquisition, V.K. All authors have read and agreed to the published version of the manuscript.

Funding

This research was made possible in part by a grant from The Gulf of Mexico Research Initiative (award GR-009514 to V. Kourafalou) and in part by the National Academy of Sciences, Engineering and Medicine (Gulf Research Program UGOS #2000011056). Additional funding was provided by NOAA’s QOSAP program through the Cooperative Institute for Marine and Atmospheric Studies (CIMAS) (NA15OAR4320064). M. Le Hénaff received partial support for work on this publication by NOAA/AOML and was supported in part under the auspices of the Cooperative Institute for Marine and Atmospheric Studies (CIMAS), a cooperative institute of the University of Miami and NOAA, cooperative agreement NA20OAR4320472.

Institutional Review Board Statement

Not applicable.

Informed Consent Statement

Not applicable.

Data Availability Statement

The simulated data in this study are openly available at Gulf of Mexico Research Initiative Information and Data Cooperative (GRIIDC) (doi:10.7266/N7NG4NPC).

Acknowledgments

The river discharge data were obtained through the U.S. Geological Survey (https://www.usgs.gov/) and the Army Corps of Engineers. The AVISO Ssalto/Duacs altimeter products were produced and distributed by the Copernicus Marine Environment Monitoring Service (http://marine.copernicus.eu). The Level 4 Multi-scale Ultra-high Resolution (MUR) Global High-Resolution SST (GHRSST) dataset is distributed by Jet Propulsion Laboratory (JPL), NASA (http://podaac.jpl.nasa.gov/dataset/JPL-L4UHfnd-GLOB-MUR). We extend our gratitude to Chuanmin Hu (Optical Oceanography Laboratory, University of South Florida; http://optics.marine.usf.edu), who produced the high-resolution ocean color image from MODIS data, which are openly accessible from NASA: https://oceancolor.gsfc.nasa.gov; https://www.ghrsst.org/.

Conflicts of Interest

The authors declare no conflict of interest.

Appendix A

To further investigate the flows within the Straits of Florida under the influence of the mesoscale anticyclonic activity, surface particles were released at two specific locations along the coasts of Cuba where CubAN eddies (type “B”) mainly evolved during the E1 (15 April–2 May) and E3 (12–29 June) periods (see Figure 3 for LC characteristics during E1 and E3). The computation of the particle trajectories in a Lagrangian framework was based on the methodology by Garraffo et al. [55], using currents derived from the GoM-HYCOM 1/50 simulation. A hundred particles were released on the first day of each period and they were followed until the last period day. The release took place in the model surface layer within a grid with 0.02° resolution (82–82.18° W, 23.25–23.43° N for the E1 period and 83.5–83.68° W, 23–23.18° N for the E3 period). A 20-day No CubAN period was also employed, starting on 1 May, with releases at both the E1 and E3 boxes. The final positions of particles and the time it took to reach their location are shown in Figure A1 for the four examples (E1, E2 and two releases for No CubAN).
All particles followed the northeastward FC from the first day of their release in the two No CubAN release cases in May 2010 (Figure A1b,d). This was expected during periods without CubAN activity, which are usually characterized by strong eastward currents due to the domination of the FC within the Straits of Florida. In both cases, the particles followed a path toward southern Florida and then northward after their entrapment inside the Gulf Stream along the eastern Florida Shelf. For the release at 82° W, it took only 4 days for the particles to reach the upper Florida Keys and only 6 days to reach the Bahamas (Figure A1b). On the contrary, the presence of a CubAN “B” during the E1 event delayed the propagation of the particles, and less than 40% of the particles were able to cross 80.5° W during the first 8 days (Figure A1a). The peak of the particle number in the area east of 80.5° W was significantly higher (85% vs. 50%) and occurred earlier (2 days) in May 2010 (FC dominance) compared to April 2010 (E1 period). Moreover, the general FC-induced connectivity between northern Cuba and the eastern Florida Shelf was significantly weakened due to the presence of CubANs; no particles were detected north of the Bahamas during the E1 period, while it took only 10 days for particles to reach this area during the No CubAN period in May (Figure A1b).
In June 2010 (E3 period), the coastal waters were entrapped inside the anticyclonic eddy at 83.5°, where the CubAN eddy mainly evolved (Figure A1c). On the contrary, the absence of CubANs in May 2010 was associated with the direct northeastward spreading of the coastal waters under strong FC flows, reaching the Atlantic Ocean within the first 5 days after their release (Figure A1d). The particles that first reached the area east of 80.5° W showed a lag of 4 days between the two cases (E1 period and No CubAN period). The presence of the CubAN in June delayed the exit of particles from the Straits of Florida, where the maximum number of particles crossing (80%) was detected approximately 16 days after their release. On the contrary, the absence of CubAN eddies allowed the fast removal of coastal waters from the Straits, with the peak of total number of particles crossing 80.5° W taking place 9 days earlier than in the May case. These four cases support the strong effect of anticyclonic mesoscale eddies on the eastward flows in the Straits of Florida.
Figure A1. Snapshots of the total monthly evolution of 100 particles released in the Straits of Florida (release area marked with a black square) on (a) 15 April 2010 (E1 period, release at 82° W), (b) 1 May 2010 (No CubAN period and release at 82° W), (c) 12 June 2010 (E3 period, release at 83.5° W) and (d) 1 May 2010 (No CubAN period and release at 83.5° W) as derived by the GoM-HYCOM 1/50 simulations. The positions of CubANs are marked in panels (a,c). The number of particles detected daily east of 80.5° W during CubAN (black lines) and No CubAN (red line) periods are presented in the inserts of (a,c). The dashed line in (a) marks the section at 80.5° W that was used to compute the time series of particle numbers.
Jmse 09 00188 g0a1

References

  1. Crone, T.J.; Tolstoy, M. Magnitude of the 2010 Gulf of Mexico oil leak. Science 2010, 330, 634. [Google Scholar] [CrossRef] [Green Version]
  2. Liu, Y.Y.; Weisberg, R.H.; Hu, C.C.; Kovach, C.C.; RiethmüLler, R.R. Evolution of the Loop Current system during the Deepwater Horizon oil spill event as observed with drifters and satellites. Monit. Model. Deep. Horiz. Oil Spill Record-Break. Enterp. 2011, 195, 91–101. [Google Scholar]
  3. Le Hénaff, M.; Kourafalou, V.H.; Paris, C.B.; Helgers, J.; Aman, Z.M.; Hogan, P.J.; Srinivasan, A. Surface evolution of the Deepwater Horizon oil spill patch: Combined effects of circulation and wind-induced drift. Environ. Sci. Technol. 2012, 46, 7267–7273. [Google Scholar] [CrossRef] [PubMed]
  4. Walker, N.D.; Pilley, C.T.; Raghunathan, V.V.; D’Sa, E.J.; Leben, R.R.; Hoffmann, N.G.; Brickley, P.J.; Coholan, P.D.; Sharma, N.N.; Graber, H.C.; et al. Impacts of Loop Current frontal cyclonic eddies and wind forcing on the 2010 Gulf of Mexico oil spill. Monit. Model. Deep. Horiz. Oil Spill Record-Break. Enterp. 2011, 195, 103–116. [Google Scholar]
  5. Leben, R.R. Altimeter-Derived Loop Current Metrics. Circ. Gulf Mex. Obs. Model. 2005, 161, 181–201. [Google Scholar]
  6. Schmitz, W.J. Cyclones and westward propagation in the shedding of anticyclonic rings from the Loop Current. Circ. Gulf Mex. Obs. Model. 2005, 161, 241–261. [Google Scholar]
  7. Lugo-Fernández, A.; Badan, A. On the vorticity cycle of the Loop Current. J. Mar. Res. 2007, 65, 471–489. [Google Scholar] [CrossRef]
  8. Hamilton, P.; Donohue, K.A.; Leben, R.R.; Lugo-Fernández, A.; Green, R.E. Loop Current observations during spring and summer of 2010: Description and historical perspective. Monit. Model. Deep. Horiz. Oil Spill Record-Break. Enterp. Geophys. Monogr. Ser. 2011, 195, 117–130. [Google Scholar]
  9. Sturges, W.; Leben, R. Frequency of ring separations from the Loop Current in the Gulf of Mexico: A revised estimate. J. Phys. Oceanogr. 2000, 30, 1814–1819. [Google Scholar] [CrossRef]
  10. Hurlburt, H.E.; Thompson, J.D. A numerical study of Loop Current intrusions and eddy shedding. J. Phys. Oceanogr. 1980, 10, 1611–1651. [Google Scholar] [CrossRef]
  11. Pichevin, T.; Nof, D. The momentum imbalance paradox. Tellus A 1997, 49, 298–319. [Google Scholar] [CrossRef]
  12. Candela, J.; Sheinbaum, J.; Ochoa, J.; Badan, A.; Leben, R. The potential vorticity flux through the Yucatan Channel and the Loop Current in the Gulf of Mexico. Geophys. Res. Lett. 2002, 29, 16-1–16-4. [Google Scholar] [CrossRef]
  13. Oey, L.Y.; Lee, H.C.; Schmitz, W.J. Effects of winds and Caribbean eddies on the frequency of Loop Current eddy shedding: A numerical model study. J. Geophys. Res. Oceans 2003, 108. [Google Scholar] [CrossRef] [Green Version]
  14. Chérubin, L.M.; Morel, Y.; Chassignet, E.P. Loop Current ring shedding: The formation of cyclones and the effect of topography. J. Phys. Oceanogr. 2006, 36, 569–591. [Google Scholar] [CrossRef]
  15. Weisberg, R.H.; Liu, Y. On the Loop Current penetration into the Gulf of Mexico. J. Geophys. Res. Oceans 2017, 122, 9679–9694. [Google Scholar] [CrossRef] [Green Version]
  16. Le Hénaff, M.; Kourafalou, V.H.; Dussurget, R.; Lumpkin, R. Cyclonic activity in the eastern Gulf of Mexico: Characterization from along-track altimetry and in situ drifter trajectories. Prog. Oceanogr. 2014, 120, 120–138. [Google Scholar] [CrossRef] [Green Version]
  17. Androulidakis, Y.S.; Kourafalou, V.H.; Le Hénaff, M. Influence of frontal cyclones evolution on the 2009 (Ekman) and 2010 (Franklin) Loop Current Eddy detachment events. Ocean Sci. Discuss. 2014, 11, 947–965. [Google Scholar] [CrossRef] [Green Version]
  18. Donohue, K.A.; Watts, D.R.; Hamilton, P.; Leben, R.; Kennelly, M. Loop current eddy formation and baroclinic instability. Dyn. Atmos. Oceans 2016, 76, 195–216. [Google Scholar] [CrossRef] [Green Version]
  19. Donohue, K.A.; Watts, D.R.; Hamilton, P.; Leben, R.; Kennelly, M.; Lugo-Fernández, A. Gulf of Mexico loop current path variability. Dyn. Atmos. Oceans 2016, 76, 174–194. [Google Scholar] [CrossRef]
  20. Kourafalou, V.; Androulidakis, Y.; Le Hénaff, M.; Kang, H. The Dynamics of Cuba Anticyclones (CubANs) and Interaction with the Loop Current/Florida Current System. J. Geophys. Res. Oceans 2017, 122, 7897–7923. [Google Scholar] [CrossRef]
  21. Le Hénaff, M.; Kourafalou, V.H.; Androulidakis, Y.; Smith, R.H.; Kang, H.; Hu, C.; Lamkin, J.T. In situ measurements of circulation features influencing cross-shelf transport around northwest Cuba. J. Geophys. Res. Oceans 2020, 125, e2019JC015780. [Google Scholar] [CrossRef]
  22. Le Hénaff, M.; Kourafalou, V.H.; Morel, Y.; Srinivasan, A. Simulating the dynamics and intensification of cyclonic Loop Current Frontal Eddies in the Gulf of Mexico. J. Geophys. Res. 2012, 117, C02034. [Google Scholar] [CrossRef]
  23. Androulidakis, Y.; Kourafalou, V.; Le Hénaff, M.; Kang, H.; Ntaganou, N.; Hu, C. Gulf Stream evolution through the Straits of Florida: The role of eddies and upwelling near Cuba. Ocean Dyn. 2020, 70, 1005–1032. [Google Scholar] [CrossRef]
  24. Gula, J.; Molemaker, M.J.; McWilliams, J.C. Topographic vorticity generation, submesoscale instability and vortex street formation in the Gulf Stream. Geophys. Res. Lett. 2015, 42, 4054–4062. [Google Scholar] [CrossRef] [Green Version]
  25. Gula, J.; Molemaker, M.J.; McWilliams, J.C. Topographic generation of submesoscale centrifugal instability and energy dissipation. Nat. Commun. 2016, 7, 12811. [Google Scholar] [CrossRef]
  26. Androulidakis, Y.; Kourafalou, V.; Robert Hole, L.; Le Hénaff, M.; Kang, H. Pathways of Oil Spills from Potential Cuban Offshore Exploration: Influence of Ocean Circulation. J. Mar. Sci. Eng. 2020, 8, 535. [Google Scholar] [CrossRef]
  27. Le Hénaff, M.; Kourafalou, V.H. Mississippi waters reaching South Florida reefs under no flood conditions: Synthesis of observing and modeling system findings. Ocean Dyn. 2016, 66, 435–459. [Google Scholar] [CrossRef]
  28. Bleck, R. An oceanic general circulation model framed in hybrid isopycnic-Cartesian coordinates. Ocean Model. 2002, 4, 55–88. [Google Scholar] [CrossRef]
  29. Counillon, F.; Bertino, L. High-resolution ensemble forecasting for the Gulf of Mexico eddies and fronts. Ocean Dyn. 2009, 59, 83–95. [Google Scholar] [CrossRef]
  30. Schiller, R.V.; Kourafalou, V.H. Loop Current impact on the transport of Mississippi River waters. J. Coast. Res. 2014, 30, 1287–1306. [Google Scholar] [CrossRef]
  31. Mezić, I.; Loire, S.; Fonoberov, V.A.; Hogan, P. A new mixing diagnostic and Gulf oil spill movement. Science 2010, 330, 486–489. [Google Scholar] [CrossRef]
  32. Mariano, A.J.; Kourafalou, V.H.; Srinivasan, A.; Kang, H.; Halliwell, G.R.; Ryan, E.H.; Roffer, M. On the modeling of the 2010 Gulf of Mexico oil spill. Dyn. Atmos. Ocean 2011, 52, 322–340. [Google Scholar] [CrossRef]
  33. Kourafalou, V.H.; Androulidakis, Y.S. Influence of Mississippi River induced circulation on the Deepwater Horizon oil spill transport. J. Geophys. Res. Oceans 2013, 118, 3823–3842. [Google Scholar] [CrossRef]
  34. Schiller, R.V.; Kourafalou, V.H. Modeling river plume dynamics with the HYbrid Coordinate Ocean Model. Ocean Model. 2010, 33, 101–117. [Google Scholar] [CrossRef]
  35. Halliwell, G.R., Jr.; Srinivasan, A.; Kourafalou, V.; Yang, H.; Willey, D.; Le Hénaff, M.; Atlas, R. Rigorous evaluation of a fraternal twin ocean OSSE system for the open Gulf of Mexico. J. Atmos. Ocean. Technol. 2014, 31, 105–130. [Google Scholar] [CrossRef]
  36. Halliwell, G.R., Jr.; Kourafalou, V.; Le Hénaff, M.; Shay, L.K.; Atlas, R. OSSE impact analysis of airborne ocean surveys for improving upper-ocean dynamical and thermodynamical forecasts in the Gulf of Mexico. Prog. Oceanogr. 2015, 130, 32–46. [Google Scholar] [CrossRef]
  37. Hu, C. An empirical approach to derive MODIS ocean color patterns under severe sun glint. Geophys. Res. Lett. 2011, 38, L01603. [Google Scholar] [CrossRef]
  38. Briggs, K.; Smith, S.R.; Rolph, J.J. 2011 SAMOS Data Quality Report; COAPS: Tallahassee, FL, USA, 2012; p. 140. [Google Scholar]
  39. Shay, L.K.; Jaimes, B.; Brewster, J.K.; Meyers, P.; McCaskill, E.C.; Uhlhorn, E.; Marks, F.; Halliwell, G.R., Jr.; Smedstad, O.M.; Hogan, P. Airborne ocean surveys of the Loop Current complex from NOAA WP-3D in support of the Deepwater Horizon oil spill. Monit. Model. Deep. Horiz. Oil Spill Record-Break. Enterp. 2011, 195, 131–151. [Google Scholar]
  40. Androulidakis, Y.; Kourafalou, V.; Le Hénaff, M.; Kang, H.; Sutton, T.; Chen, S.; Hu, C.; Ntaganou, N. Offshore spreading of Mississippi waters: Pathways and vertical structure under eddy influence. J. Geophys. Res. Oceans 2019, 124, 5952–5978. [Google Scholar] [CrossRef]
  41. Thomson, R.E.; Emery, W.J. Data Analysis Methods in Physical Oceanography; Newnes: Oxford, UK, 2014. [Google Scholar]
  42. Smith, N.P. Temporal and spatial characteristics of summer upwelling along Florida’s Atlantic shelf. J. Phys. Oceanogr. 1983, 13, 1709–1715. [Google Scholar] [CrossRef] [Green Version]
  43. Hsuesh, Y.; O’Brien, J.J. Steady coastal upwelling induced by an along-shore current. J. Phys. Oceanogr. 1971, 1, 180–186. [Google Scholar]
  44. Kourafalou, V.H.; Androulidakis, Y.S.; Kang, H.; Smith, R.H.; Valle-Levinson, A. Physical connectivity between Pulley Ridge and Dry Tortugas coral reefs under the influence of the Loop Current/Florida Current system. Prog. Oceanogr. 2018, 165, 75–99. [Google Scholar] [CrossRef]
  45. Sponaugle, S.; Lee, T.N.; Kourafalou, V.H.; Pinkard, D. Florida Current frontal eddies and the settlement of coral reef fishes. Limnol. Oceanogr. 2005, 50, 1033–1048. [Google Scholar] [CrossRef] [Green Version]
  46. Kourafalou, V.H.; Kang, H. Florida Current meandering and evolution of cyclonic eddies along the Florida Keys Reef Tract: Are they interconnected? J. Geophys. Res. Oceans 2012, 117. [Google Scholar] [CrossRef]
  47. Baringer, M.O.N.; Larsen, J.C. Sixteen years of Florida Current transport at 27 N. Geophys. Res. Lett. 2001, 28, 3179–3182. [Google Scholar] [CrossRef] [Green Version]
  48. Candela, J.; Ochoa, J.; Sheinbaum, J.; Lopez, M.; Perez-Brunius, P.; Tenreiro, M.; Pallàs-Sanz, E.; Athié, G.; Arriaza-Oliveros, L. The flow through the gulf of Mexico. J. Phys. Oceanogr. 2019, 49, 1381–1401. [Google Scholar] [CrossRef]
  49. Alves, T.M.; Kokinou, E.; Zodiatis, G.; Radhakrishnan, H.; Panagiotakis, C.; Lardner, R. Multidisciplinary oil spill modeling to protect coastal communities and the environment of the Eastern Mediterranean Sea. Sci. Rep. 2016, 6, 1–9. [Google Scholar] [CrossRef] [PubMed]
  50. Alves, T.M.; Kokinou, E.; Zodiatis, G.; Lardner, R.; Panagiotakis, C.; Radhakrishnan, H. Modelling of oil spills in confined maritime basins: The case for early response in the Eastern Mediterranean Sea. Environ. Pollut. 2015, 206, 390–399. [Google Scholar] [CrossRef] [PubMed] [Green Version]
  51. Pålsson, J. Oil Spill Preparedness in the Baltic Sea Countries; Baltic Master II Project; World Maritime University: Malmö, Sweden, 2012; 42p. [Google Scholar]
  52. Barker, C.H.; Kourafalou, V.H.; Beegle-Krause, C.J.; Boufadel, M.; Bourassa, M.A.; Buschang, S.G.; Androulidakis, Y.; Chassignet, E.P.; Dagestad, K.F.; Danmeier, D.G.; et al. Progress in Operational Modeling in Support of Oil Spill Response. J. Mar. Sci. Eng. 2020, 8, 668. [Google Scholar] [CrossRef]
  53. Sepp Neves, A.A.; Pinardi, N.; Navarra, A.; Trotta, F. A general methodology for beached oil spill hazard mapping. Front. Mar. Sci. 2020, 7, 65. [Google Scholar] [CrossRef] [Green Version]
  54. Zodiatis, G.; Radhakrishnan, H.; Georgoudis, E.; Sotillo, M.; Lardner, R.W.; Krokos, G.; Bruciaferri, D. The Mediterranean Decision Support System for Marine Safety dedicated to oil slicks predictions. Deep-Sea Res. II 2016. [Google Scholar] [CrossRef]
  55. Garraffo, Z.D.; Mariano, A.J.; Griffa, A.; Veneziani, C.; Chassignet, E.P. Lagrangian data in a high-resolution numerical simulation of the North Atlantic: I. Comparison with in situ drifter data. J. Mar. Syst. 2001, 29, 157–176. [Google Scholar] [CrossRef]
Figure 1. Topography of the model domain. Geographical locations mentioned in the text: Gulf of Mexico (GoM), Yucatan Channel, Campeche Bank, Cuba, Straits of Florida and West Florida Shelf (WFS). The sea surface height 17-cm contour, derived from the AVISO Maps of Absolute Dynamic Topography (MADT) fields, during the maximum Loop Current (LC) extension of the 1993–2016 period (27 May 2005) and the maximum (2 May) and minimum LC (23 July) extensions of 2010 are marked with solid grey, solid black and dashed black lines, respectively. Sections S1, S2 and S3 and area A1 are indicated with white lines. The location of the Deepwater Horizon (DwH) platform is marked with a cross.
Jmse 09 00188 g001
Figure 2. Scatter comparisons between the in situ (R/V Atlantis) and modeled (Hybrid Coordinate Ocean Model in the GoM (GoM-HYCOM) 1/50) surface (a) temperature and (b) salinity. The number of data points used, the coefficient of determination R2, mean values, the root mean square error (RMSE), the equation of the linear fit, the Pearson correlation coefficient (rPearson), the respective degrees of freedom (d.o.f.) and statistically significant correlation limits are also given. The linear fit for each scatter plot is marked with a red line. Vertical distribution of temperature along (c,d) section S1 on 1 July and (e,f) section S2 on 4 July as collected by R/V Nancy Foster and simulated by GoM-HYCOM 1/50. The insert in panel (a) presents the cruise tracks of R/V Atlantis (black line) and R/V Nancy Foster (red line) used in the comparisons.
Jmse 09 00188 g002
Figure 3. Daily evolution of the latitudes (o N) of the Florida Current (FC) (position of the 20 oC isotherm at 150 m along 83o W longitude; black line) and of the Loop Current (LC; from the 17-cm sea surface height (SSH) anomaly contour) for 2010 as derived from the GoM-HYCOM 1/50 model simulation (red solid line) and AVISO satellite data (red dashed line). Five CubAN periods are marked with shaded boxes: type “B” CubANs with extended LC (red shaded boxes) and type “A” CubANs with retracted LC (cyan shaded boxes). The Deepwater Horizon (DwH) oil spill period (black line at the top) is also marked. The RMSE and the Pearson correlation values with the respective degrees of freedom (d.o.f.) between simulated and satellite-observed LC latitude for 2010 are given (top left). The satellite (left) and simulated (right) annual box plots (minimum, maximum, 1st quartile, 3rd quartile and median) of the LC maximum latitude in 2010 are also shown.
Jmse 09 00188 g003
Figure 4. Maps of simulated (GoM-HYCOM 1/50 model) sea surface height (SSH) and surface current vectors (m/s) for characteristic dates before and during two periods of CubAN activity during the oil spill period: (a) 10 April, (b) 20 April (E1), (c) 10 June and (d) 17 June (E3). The Loop Current (LC), the LC Eddy (LCE), the major cyclones (C) and the CubAN anticyclones (CA) are indicated. The SSH 17-cm contour, derived from the AVISO fields, is marked with a grey solid line. The location of the DwH platform is marked on (a,b) with a cross.
Jmse 09 00188 g004
Figure 5. Maps of simulated (GoM-HYCOM 1/50 model) sea surface height (SSH) and surface current vectors (m/s) over western Straits of Florida on (a) 12, (b) 15, (c) 16 and (d) 17 June 2010 (E3 period). The cyclonic (C) and anticyclonic (CA) eddies are marked.
Jmse 09 00188 g005
Figure 6. Horizontal distribution of (a) model-simulated (GoM-HYCOM 1/50) sea surface height difference (SSHdif) between 20 April (DwH accident, E1) and 10 April (before the DwH accident). (b) Sea level anomaly (SLA) distribution derived from the AVISO fields on 20 April (E1); the insert in (b) shows the respective schematic plot of the type “B” CubAN evolution during the E1 period. Respective Color Index (CI) maps, derived from Moderate Resolution Imaging Spectroradiometer (MODIS), (c) before (7 April) and (d) after (21 April) the DwH accident are also presented. The Loop Current (LC), the major cyclone (C), the CubAN (CA) and the location of the DwH platform are indicated. The model-derived SSH 17-cm contours for 10 and 20 April are marked in (a) with black dashed and solid lines, respectively. The light and dark blue areas in the CI maps are associated to cyclonic (C) and anticyclonic (LC/FC and CA) features, respectively.
Jmse 09 00188 g006
Figure 7. Relative Vorticity (RV), normalized with the Coriolis frequency (f), on (a) 10 April and (b) 20 April (E1) and eddy kinetic energy (EKE) on (c) 10 April and (d) 20 April (E1), computed by the surface current fields (GoM-HYCOM 1/50).
Jmse 09 00188 g007
Figure 8. (a) Evolution of the integrated Straits of Florida (SF) eastward transport across section S1 (Figure 1; black line) and of the Loop Current (LC; 17-cm SSH contour) latitude (red line); (b) Yucatan northward transport across section S3 (Figure 1; black line) and average eddy kinetic energy (EKE; red line) of the LC over area A1 (Figure 1) and (c) difference between the S3 (inflow to the Gulf through the Yucatan Channel) and S1 (outflow from the Gulf through the Straits of Florida) transports as derived from the GoM-HYCOM 1/50 model simulation. The transport computations are based on the northward and eastward components of the simulated velocities integrated at each model layer over the entire water column of sections S3 and S1, respectively. The periods of E1 and E3 CubAN events (red shaded boxes) are marked. The blue shaded boxes mark the periods at which the CubANs began to form prior to their full formation as “closed” eddies. The blue lines mark the date (dashed) when the core of the CubAN eddy was over section S1 and the location of the CubAN core (solid) when the lowest transport occurred.
Jmse 09 00188 g008
Figure 9. (a) Evolution of the integrated Straits of Florida (SF) eastward transport across section S1 (Figure 1; black line) and of the Loop Current (LC; 17 cm SSH contour) latitude (red line) during 2011, as derived from the GoM-HYCOM 1/50 model simulation. Maps of simulated sea surface height (SSH) and surface current vectors (m/s) over western Straits of Florida on (b) 17 March 2011, (c) 30 May 2011 and (d) 01 August 2011. The cyclonic (C) and anticyclonic (CA) eddies are marked. The presence of CubAN events presented in (bd) is marked with grey vertical lines in (a). The horizontal dashed line in (a) indicates the mean annual transport in 2011.
Jmse 09 00188 g009
Figure 10. (a) Sea surface height difference (SSHdif) and (b) sea surface temperature difference (SSTdif) between the 17 June (period E3) and 10 June fields simulated by the GoM-HYCOM 1/50 model. The cyclonic feature (C) and the CubAN (CA) are indicated. The simulated SSH 17-cm contours of 17 and 10 June are marked with black solid and dashed lines, respectively, in (a). The location of the DwH platform is marked in (a) with a cross. (c) Evolution of satellite SST (Group for High Resolution Sea Surface Temperature (GHRSST) data, red line) and 3-hourly European Centre for Medium-Range Weather Forecasts (ECMWF) wind speed (black line) and direction (black vectors) during the entire oil spill period (note that all direction sticks have same length), averaged over the black line box in (b), and (d) satellite ocean Color Index (CI) on 17 June, depicting the upwelling front (white solid line).
Jmse 09 00188 g010
Figure 11. (a) Area (%) of the eastward zonal component of the surface currents before and during the period E3 (June 2010) over the Straits (region shown in panels (bi)), as derived from the GoM-HYCOM 1/50 model simulations. Horizontal distribution of (b,c) wind speed contours with stress direction. (d,e) Depth of the Ekman layer (m), (f,g) zonal east–west velocities (Ux) integrated over the Ekman layer (m/s) and (h,i) zonal east–west velocities integrated over the Ekman layer without the Ekman component of the current (m/s) for 10 June and 23 June during the E3 period. The dashed lines in (a) mark the two dates of 10 June and 23 June. The CubAN eddy evolved around 83° W (Figure 10).
Jmse 09 00188 g011
Publisher’s Note: MDPI stays neutral with regard to jurisdictional claims in published maps and institutional affiliations.

