1. Introduction
Ship collisions are frequent accidents that account for more than 50% of all maritime accidents [
1], causing large scale of casualties and property and environmental damage [
2]. Collision accidents are a concern even in the development of MASS (Maritime Autonomous Surface Ship) [
3]. Therefore, the collision avoidance and path finding system of the MASS is considered one of the core systems of MASS [
4]. Numerous studies were conducted on this collision avoidance system and path finding/control systems [
5,
6,
7]. This system was tested in navigation scenarios to validate safety integrity.
Perera et al. presented an experimental evaluation of autonomous ship collision avoidance. The experiment was conducted with scaled model ships in a lake. Five COLREG-based encounter situations were set up for the experimental evaluation of autonomous navigation and collision avoidance [
8].
Son et al. verified the collision avoidance performance of autonomous ships by applying a COLREG-based scenario to performing a real-ship experiment. For the scenario, three types of navigation situations (head-on, port-crossing, and starboard-crossing) were applied to a 1:1 situation [
9].
Shen et al. presented an autonomous vessel collision avoidance algorithm in restricted water based on deep Q-learning. The scenario was designed based on the navigation situation defined in COLREG by applying the head-on, crossing, and overtaking scenarios in restricted and open areas [
10].
Woo et al. proposed a collision avoidance algorithm for autonomous ships using deep reinforcement learning and tested the algorithm’s performance by applying head-on and overtaking scenarios in a simulation environment [
11].
Pedersen et al. verified the developed autonomous navigation system through simulation-based tests. The automated scenario generator tool was used to test it in the set scenario. Two head-on collisions and one multiple target ship encounter scenarios were used [
12].
Porres et al. presented an AI-based scenario search and production algorithm to validate the autonomous navigation system, but the developed scenario was limited to the 1:1 situation [
13].
Huang et al. presented a new collision risk measure for the collision avoidance algorithm. The authors compare the new model’s performance with the traditional risk measures in the simulated environment. The scenarios used were encounter situations with 1, 2, and 3 target ships. However, the basis for setting up the scenario was not in the article [
14].
Chun et al. proposed a collision avoidance algorithm based on deep reinforcement learning. The developed algorithm was validated in two scenarios, but the design base for one of them was not specified [
15].
Lazarowska used a navigation scenario with a change in the target ship’s course to validate an autonomous ship’s safe trajectory planning algorithm. Head-on, crossing, 1:2 encounter situation, and sudden change of opponent ship were the four scenarios used for validation, and no objective scenario design basis was used [
16].
Gil proposed the concept of a critical safety area for the obstacle-avoidance algorithm. The verification experiments were conducted in a simulation environment. The author designed the scenario considering various obstacles which were different in size and shape. However, the basis for designing the scenario was arbitrary [
17].
Szlapczynski et al. suggested a ship domain-based model of ship collision risk that utilizes a number of parameters. A simulation was conducted to validate the presented method. The scenarios used for the simulation were overtaking, head-on, and crossing, and two phases were included in each scenario. However the rationale of designing scenario was missing [
18].
Table 1 shows a summary of related works. The related works show that various methods are being used to improve the collision avoidance algorithm for autonomous ships. A scenario-based test is generally used for the validation of collision avoidance system development. However, the scenarios used for validation are mainly designed based on the navigation situations in the COLREG or the arbitrary design of the researcher. Thus, there may be a dearth of research into systematic scenario design testing of the MASS collision avoidance system.
For this reason, systematic scenarios must be developed to verify the MASS collision avoidance algorithm. In addition, because human-operated ships dominate the environment in which the MASS will navigate in the future, objectively recognizing the navigation situations where autonomous vessels are likely to encounter human-operated ships is necessary.
Therefore, the purpose of this study is to differentiate the navigation situation of human-operated ships for mass collision avoidance algorithm validation.
2. Methodology
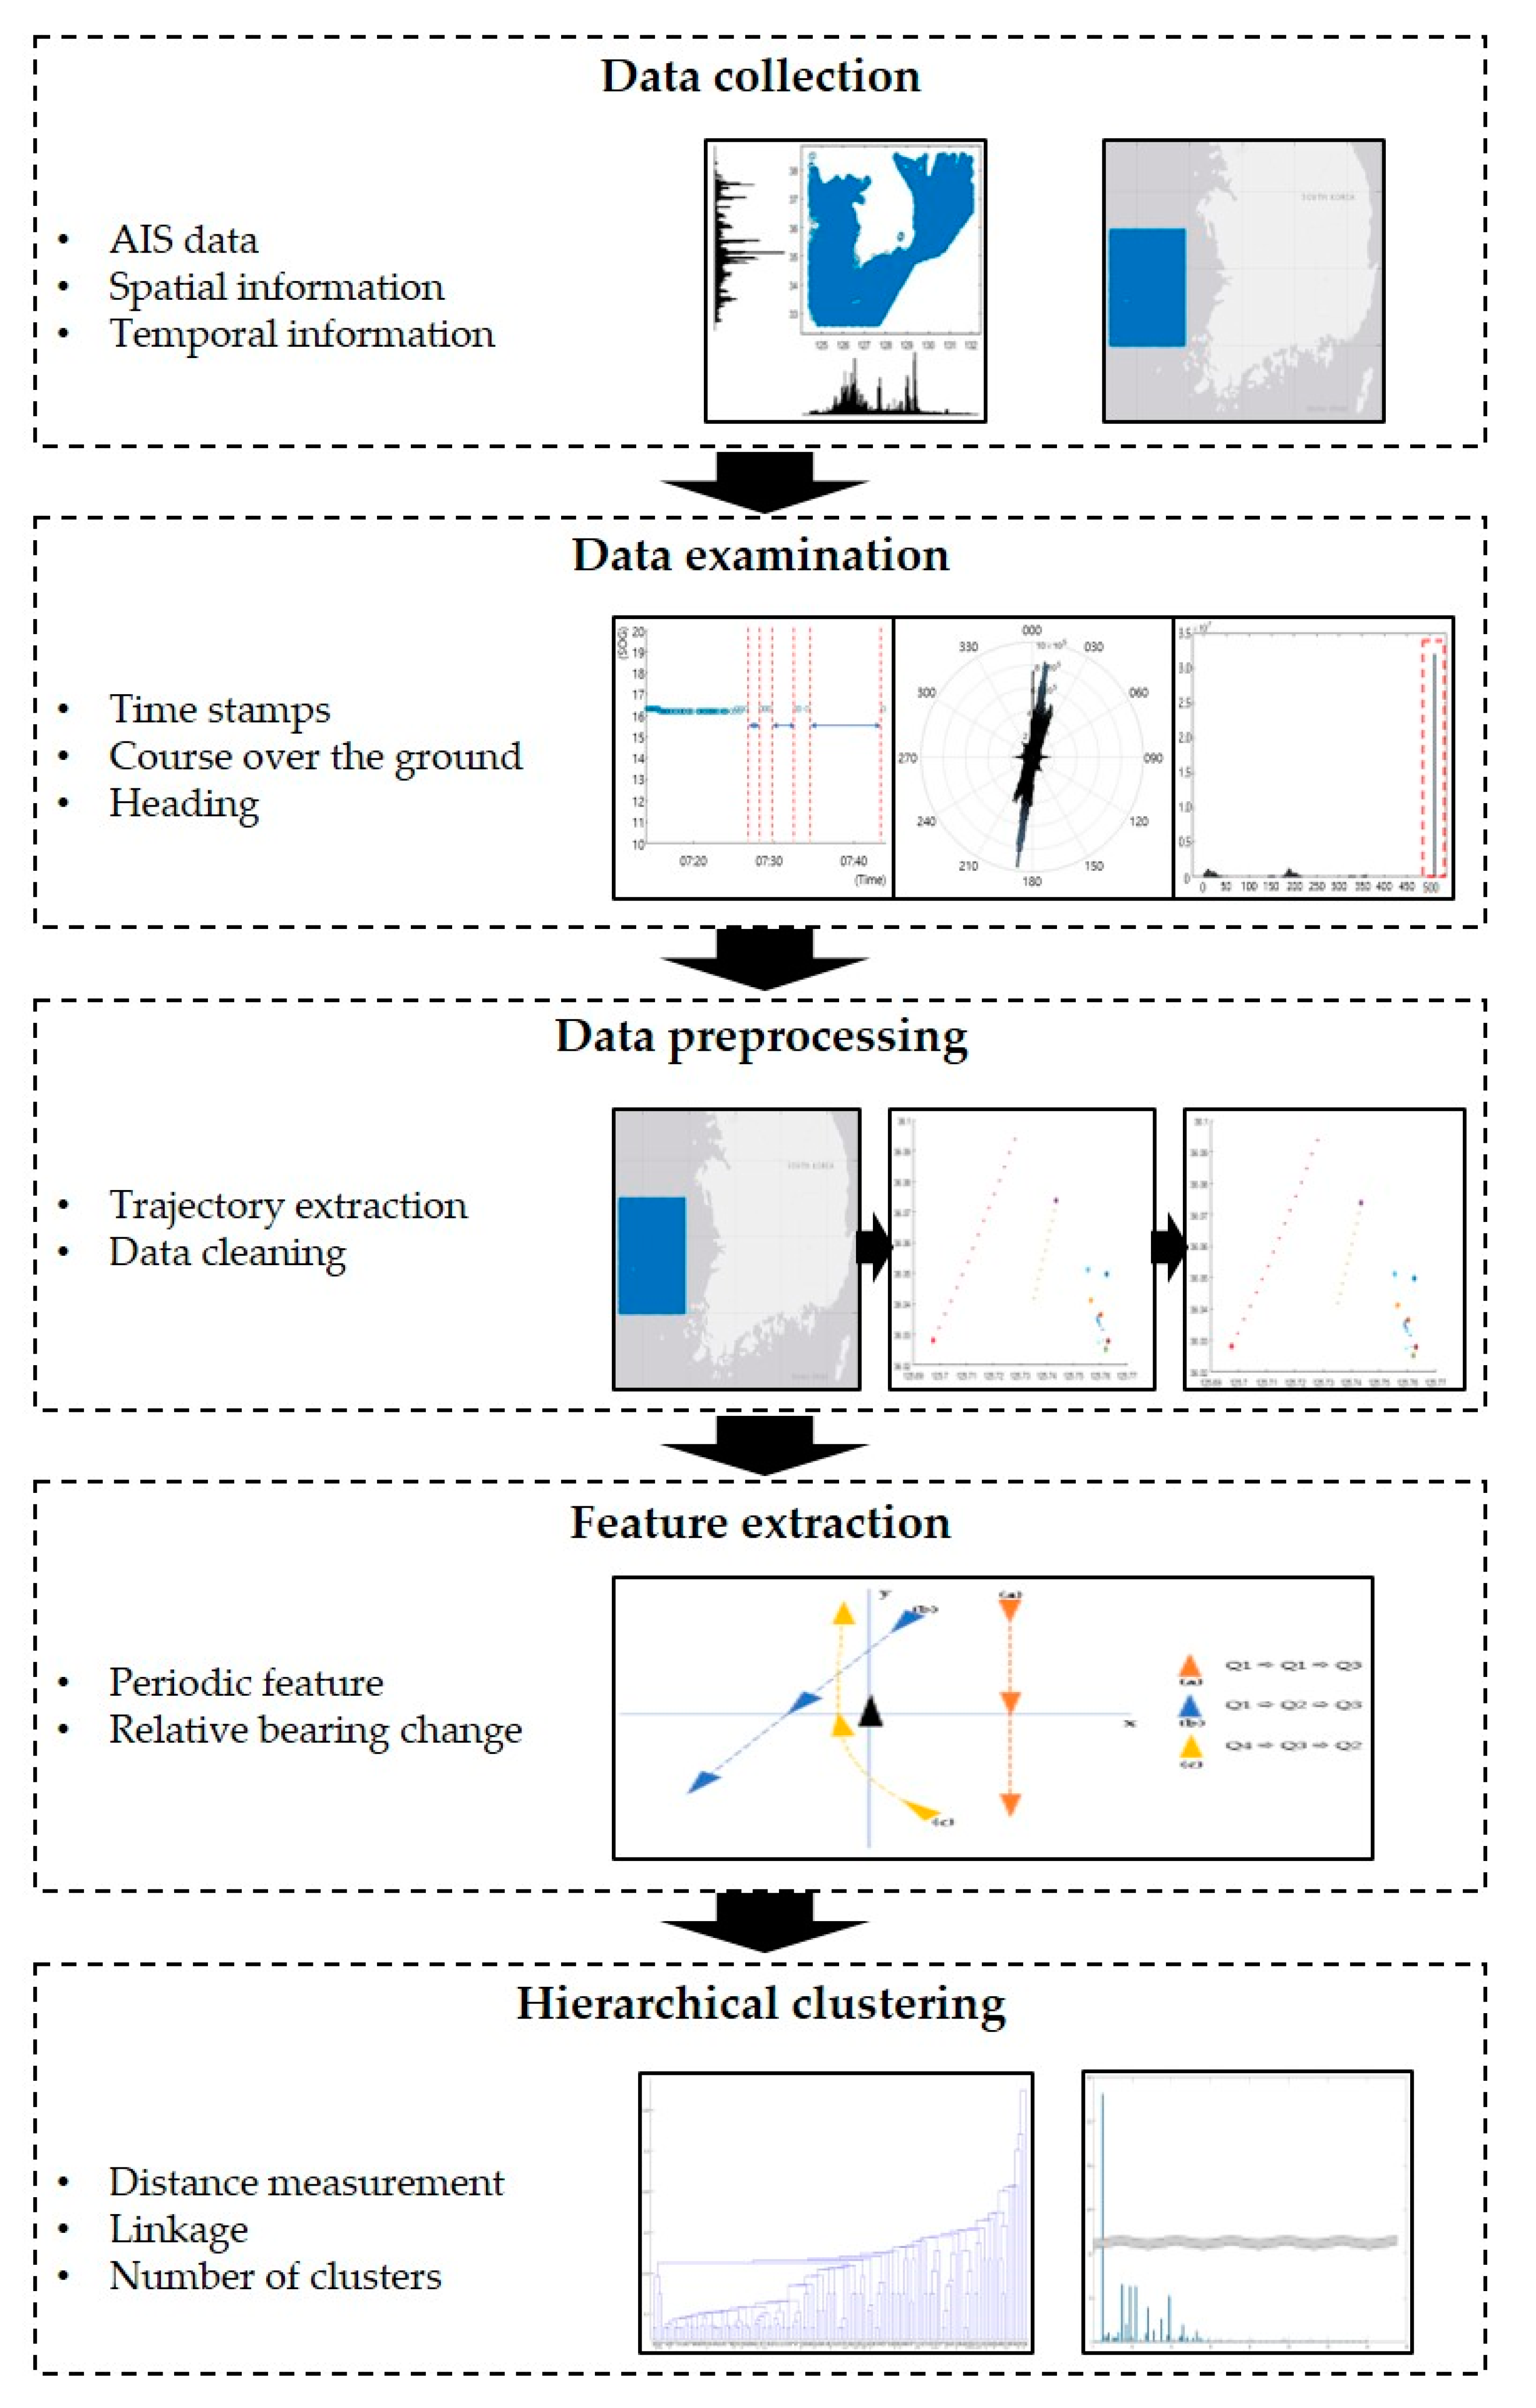
This section aims to describe the methodology that objectively analyzes the navigation situations by clustering the latent ship’s trajectory from the Automatic Identification System (AIS) data collected over a long period in a wide sea area.
The methodology workflow is shown in
Figure 1. The collected data was AIS data, and the data’s characteristics were verified through data analysis. Then, in the preprocessing stage, criteria were applied to the AIS data to extract the trajectory of own ship and target ship, and necessary data cleaning and calculation were performed. Then, feature extraction was used to turn the extracted trajectory data into a variable that represented the navigation situation. Finally, hierarchical clustering was applied to analyze the composition and ratio of the navigation situation.
2.1. Data Collection
2.1.1. AIS Data
The collected data were AIS data. The Republic of Korea’s Ministry of Oceans and Fisheries provided this data, which included both static and dynamic data [
19].
2.1.2. Spatial Information
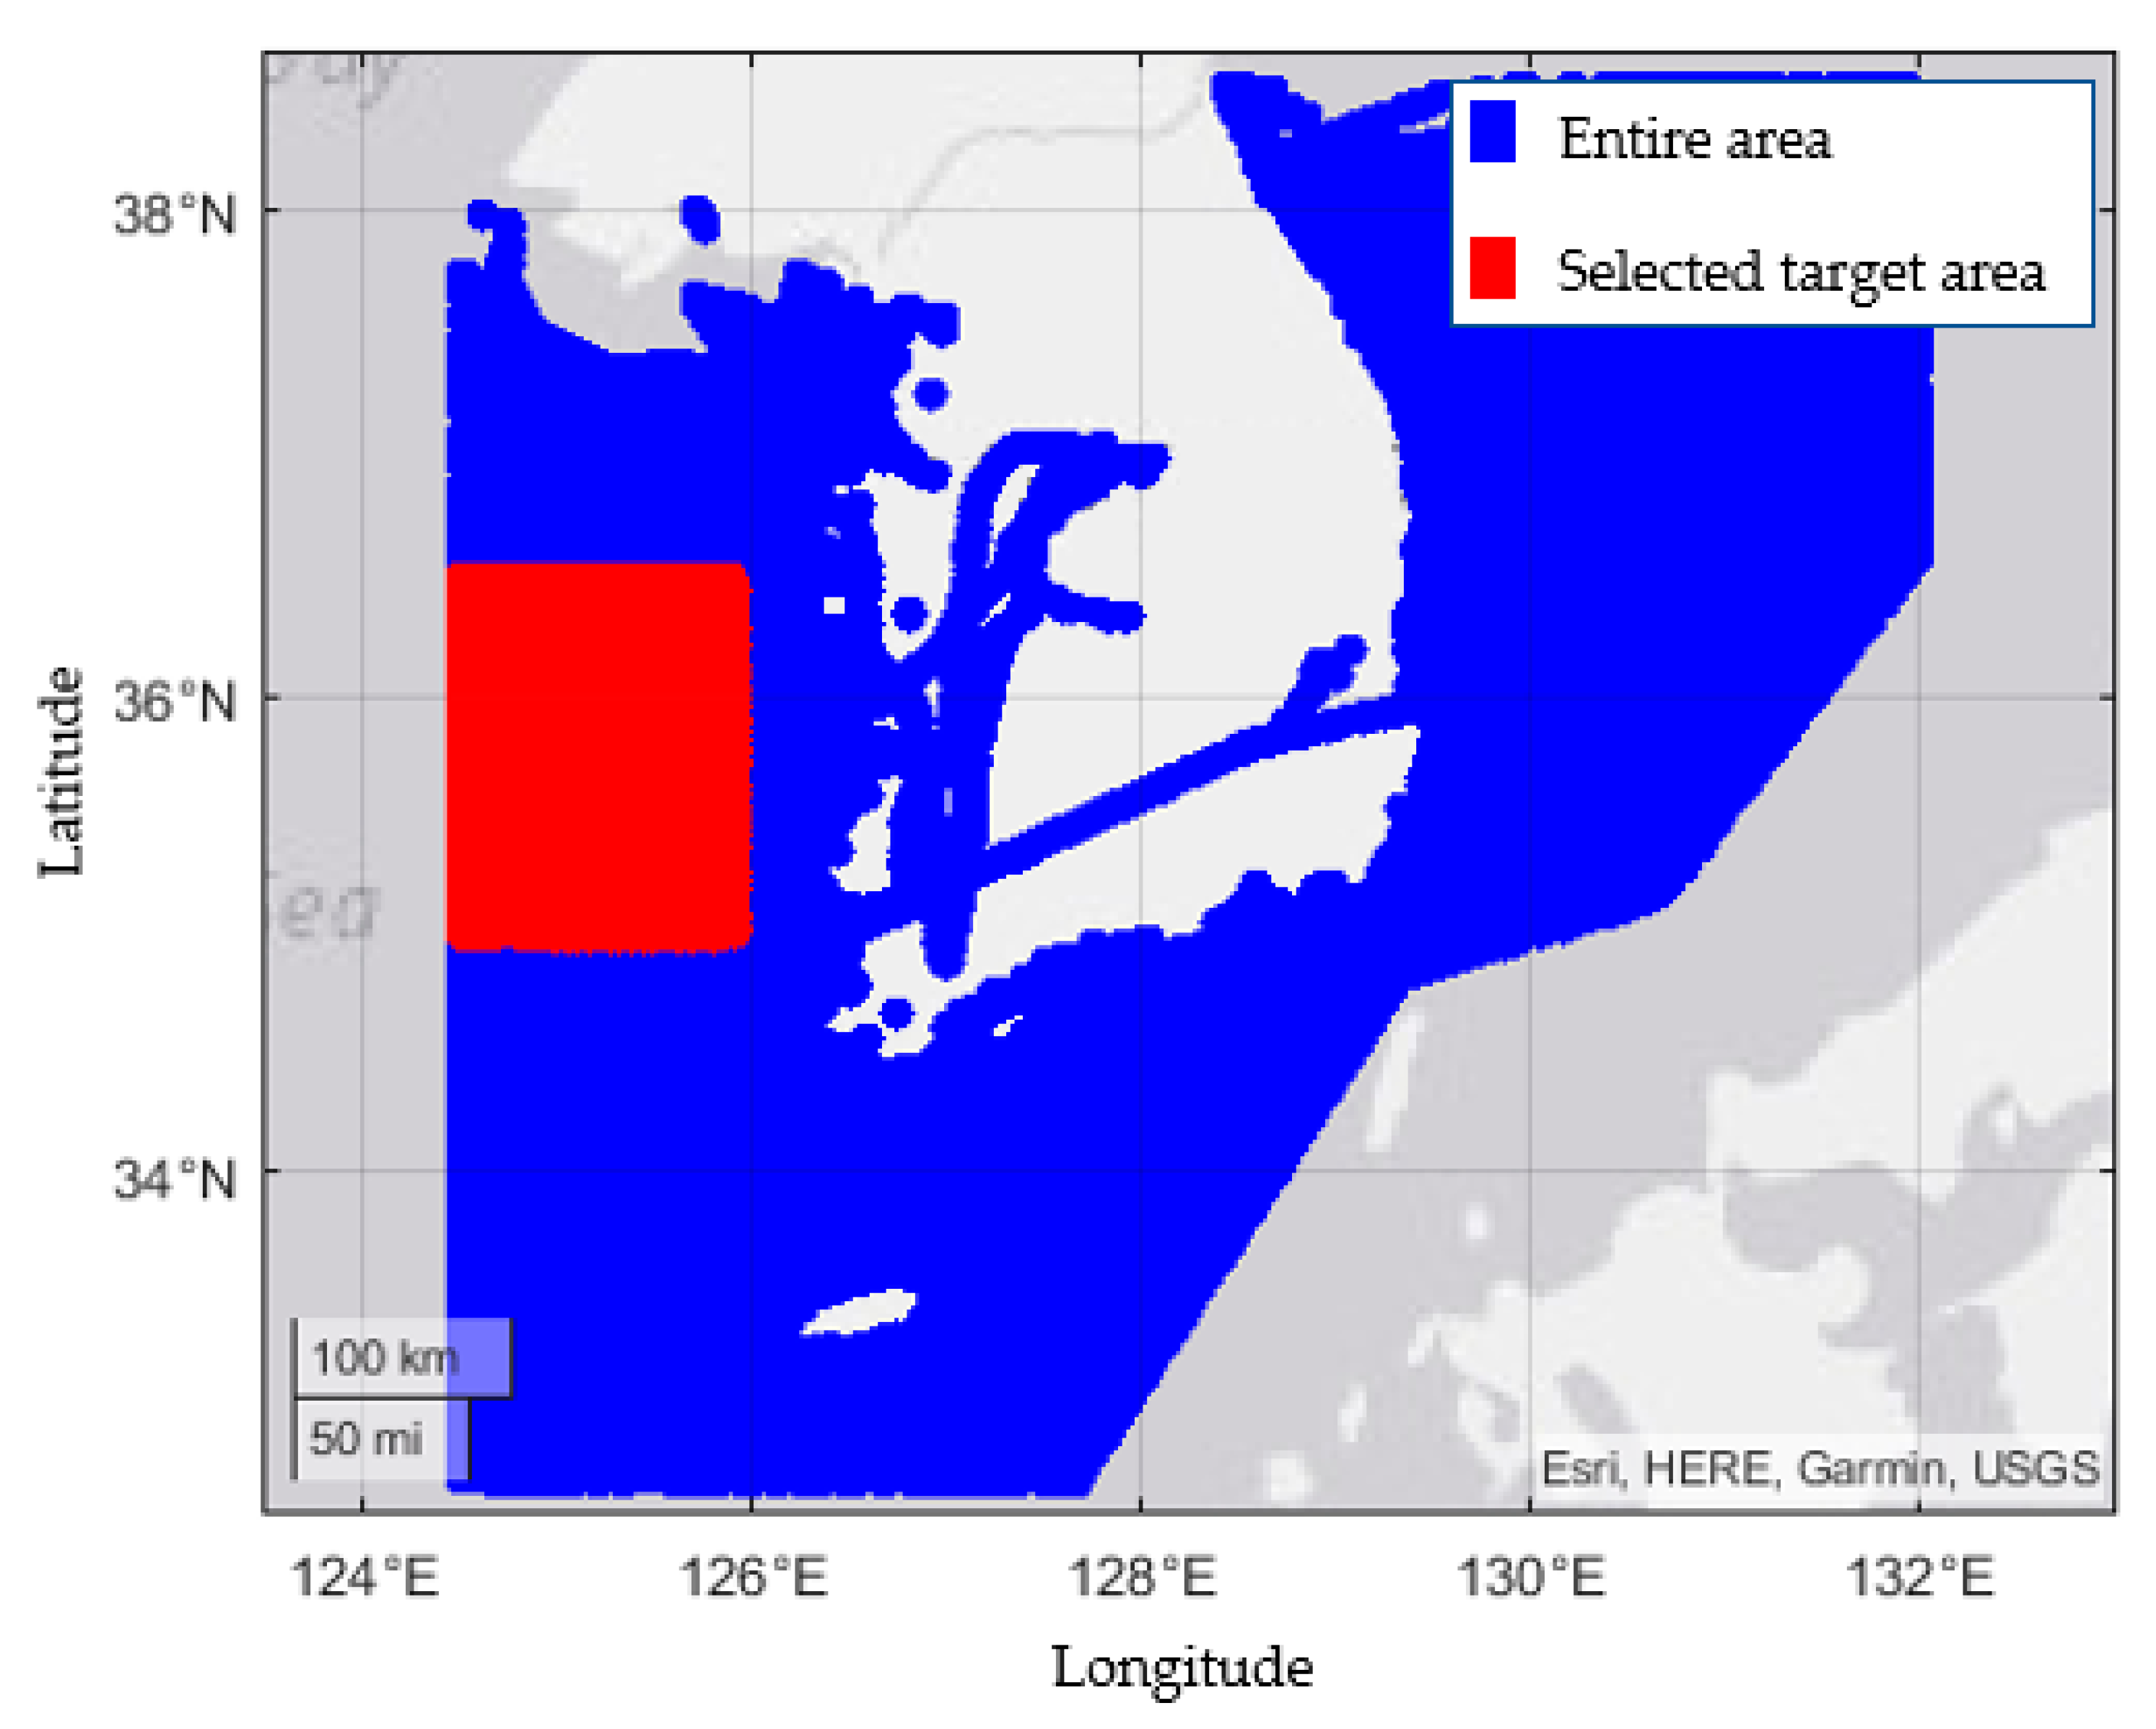
AIS data were collected from all over the Korean sea, as shown in
Figure 2. In this study, the Yellow Sea (west sea) of South Korea, where the no obstacles, such as islands, exist, is presented as the selected target sea area shown in red. Thus, navigation situations between ships that were not affected by the geographic environment could be collected. The distance from east to west and north to south was 90 nautical miles.
2.1.3. Temporal Information
AIS data was data collected for 12 months From 1 September 2019 to 31 August 2020. Therefore, it was possible to analyze the data and to consider monthly or seasonal changes.
2.2. Data Examination
Data examination was performed to understand AIS data characteristics and identify problems such as the missing values, outliers, and errors inherent in the data.
2.2.1. Time Stamp
The transmit rate of AIS data varies depending on the ship’s status and type of AIS transponder [
20]. Therefore, the time interval of the collected data, as shown in
Figure 3a, shows an inconsistent characteristic. Moreover, the time interval beyond the AIS transmission cycle was confirmed.
2.2.2. COG (Course over the Ground)
In
Figure 3b, COG distribution was primarily concentrated at 010 and 190 degrees.
This explains that the ship traffic in this sea area was mainly formed in the north–south direction.
2.2.3. Heading
As shown in
Figure 3c, a large number of 511-degree readings were observed in the heading. Since the heading value 511 indicates that the value is not available, heading errors of 511 degrees appeared to be in need of substitution with appropriate values in a preprocessing stage to confirm the relative bearing between ships [
21].
2.3. Data Preprocessing
The own ship and target ship trajectories were extracted from AIS data by applying criteria in the data preprocessing stage. In addition, the trajectory extraction process necessitated time-series cleaning and distance calculation.
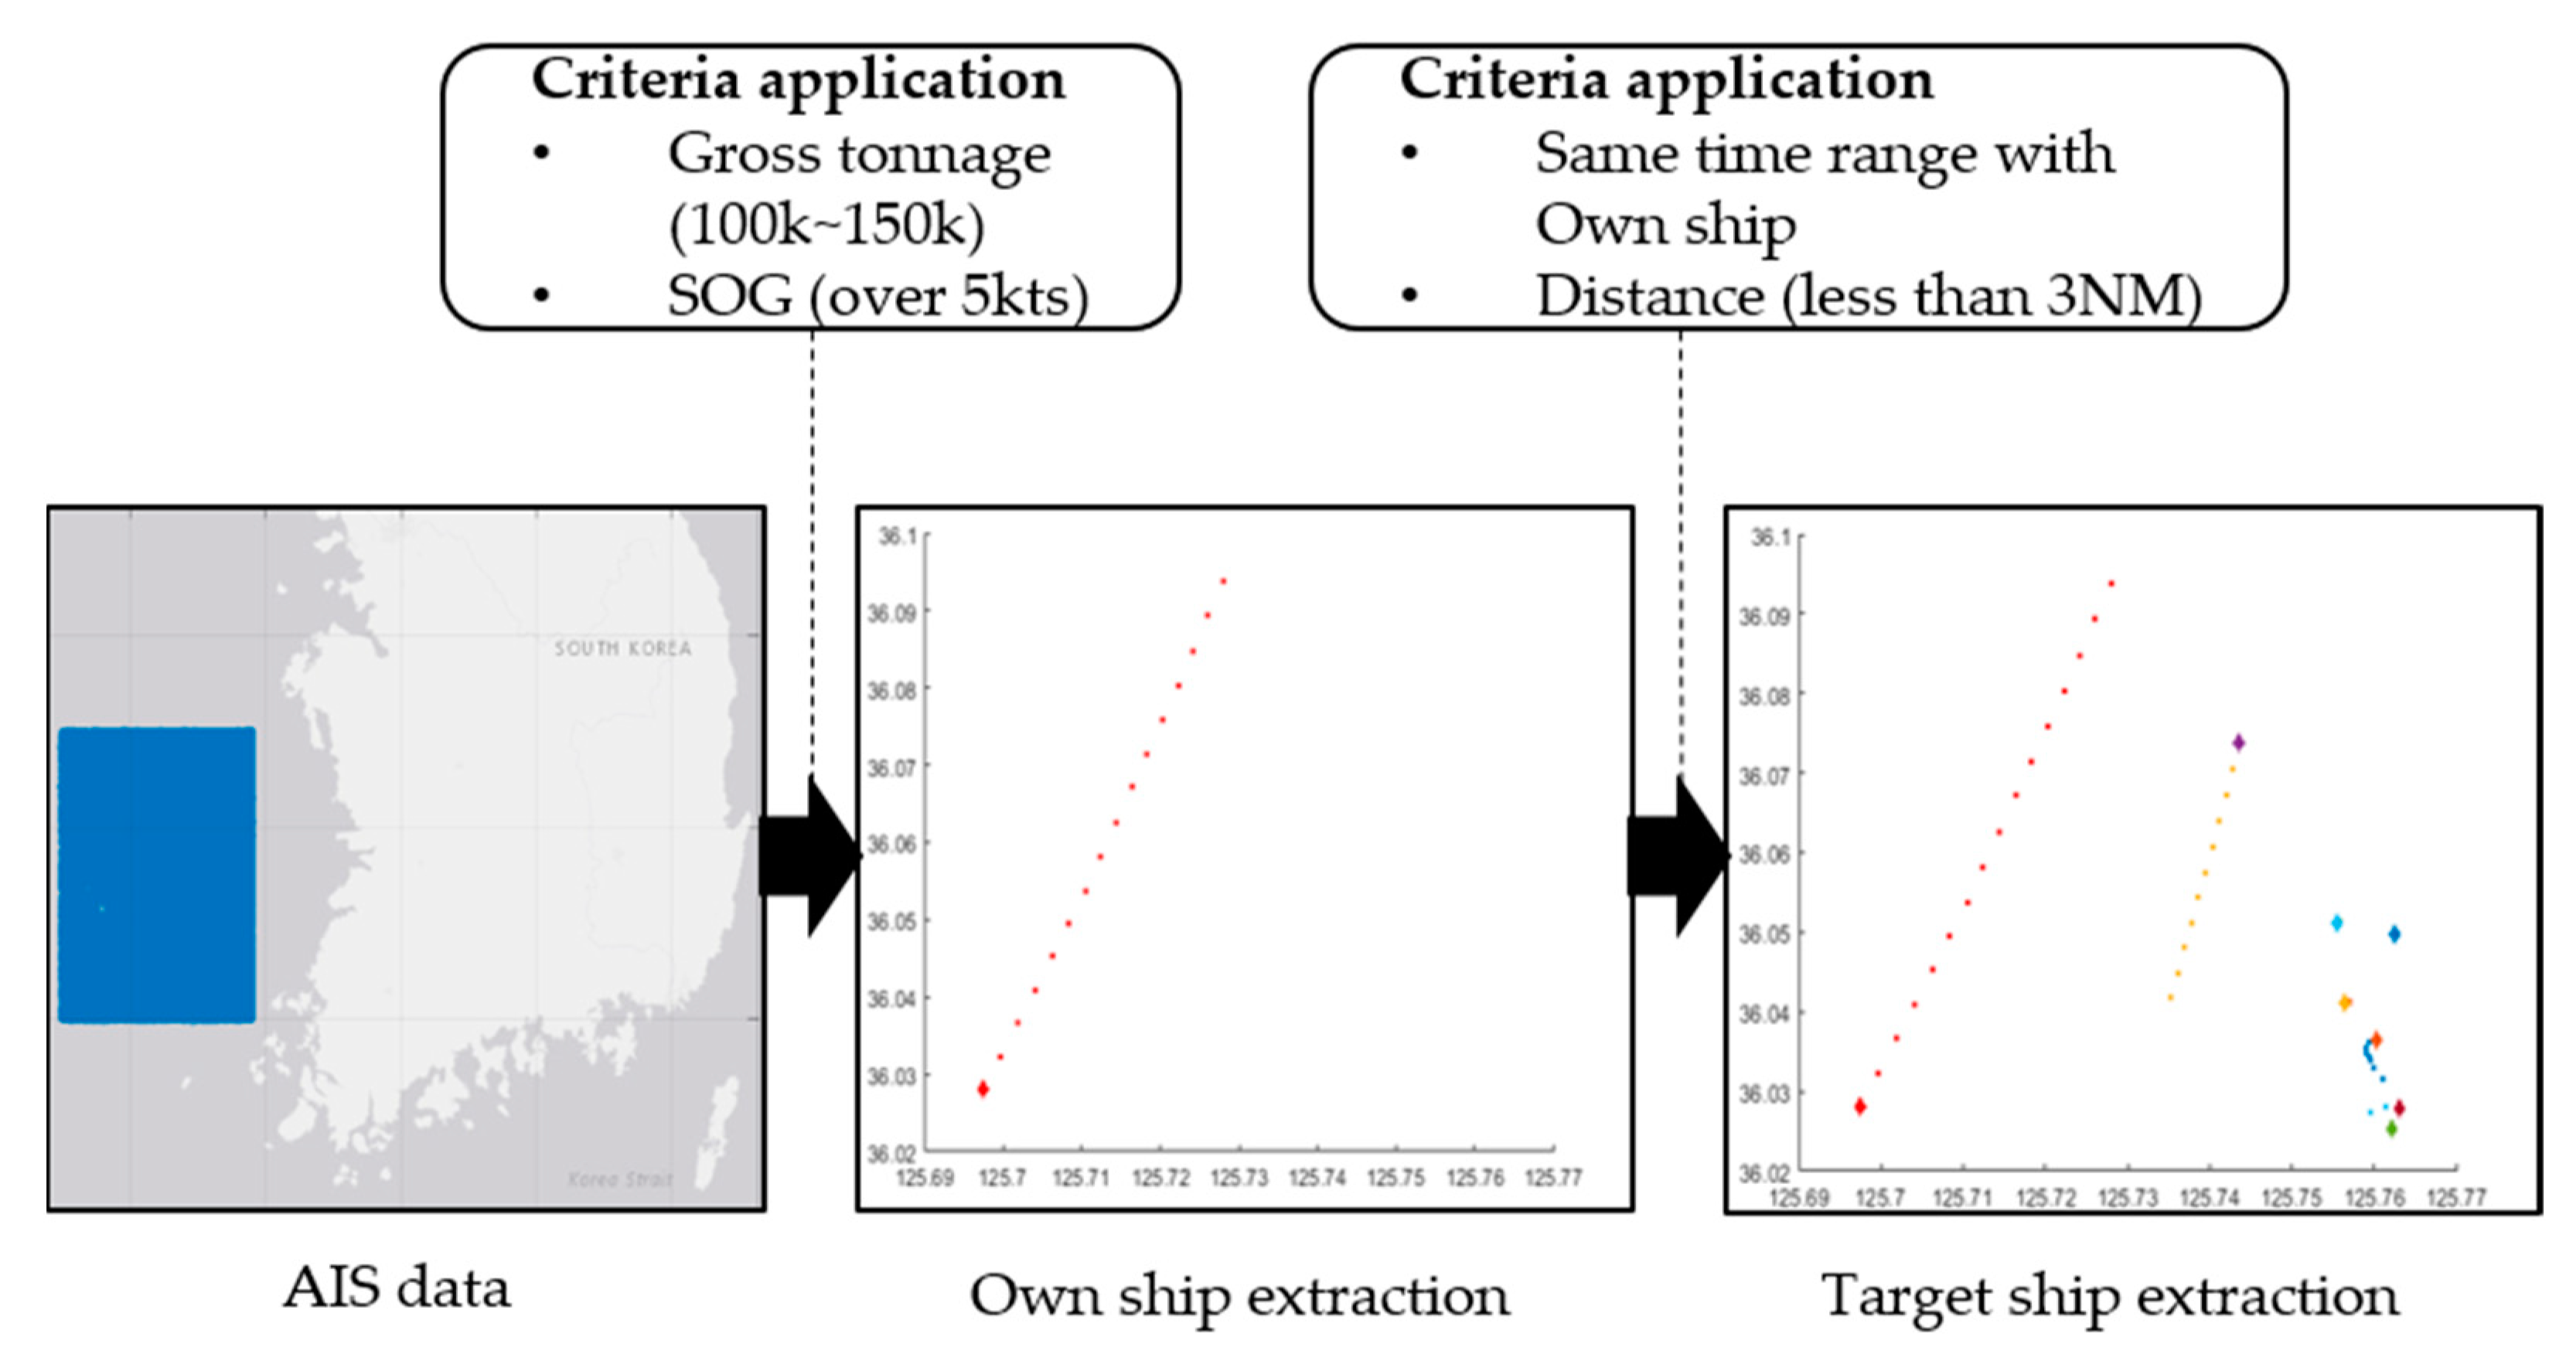
Figure 4 describes the trajectory extraction process.
2.3.1. Trajectory Extraction
The MMSI number of the vessel and the corresponding gross tonnage were extracted from the static data because the subject ship of the research project was a vessel of gross tonnage between 100,000 and 150,000. Then, the data rows in the dynamic data with the same MMSI number were sorted using the extracted MMSI number. The own ship data extracted through the application of gross tonnage included ships that were not sailing. Therefore, only ships with a speed of 5 knots or greater were extracted.
Data of target ships with the same time range as the own ships were extracted. Using the time-series range for each own vessel, data corresponding to the same time range was extracted from dynamic data.
When the distance between the ships was less than 3 miles, a row of dynamic data was extracted by calculating the distance between the own ship and the target ship. The calculated distance was the Euclidean distance using longitude and latitude.
Table 2 summarizes the applied criteria.
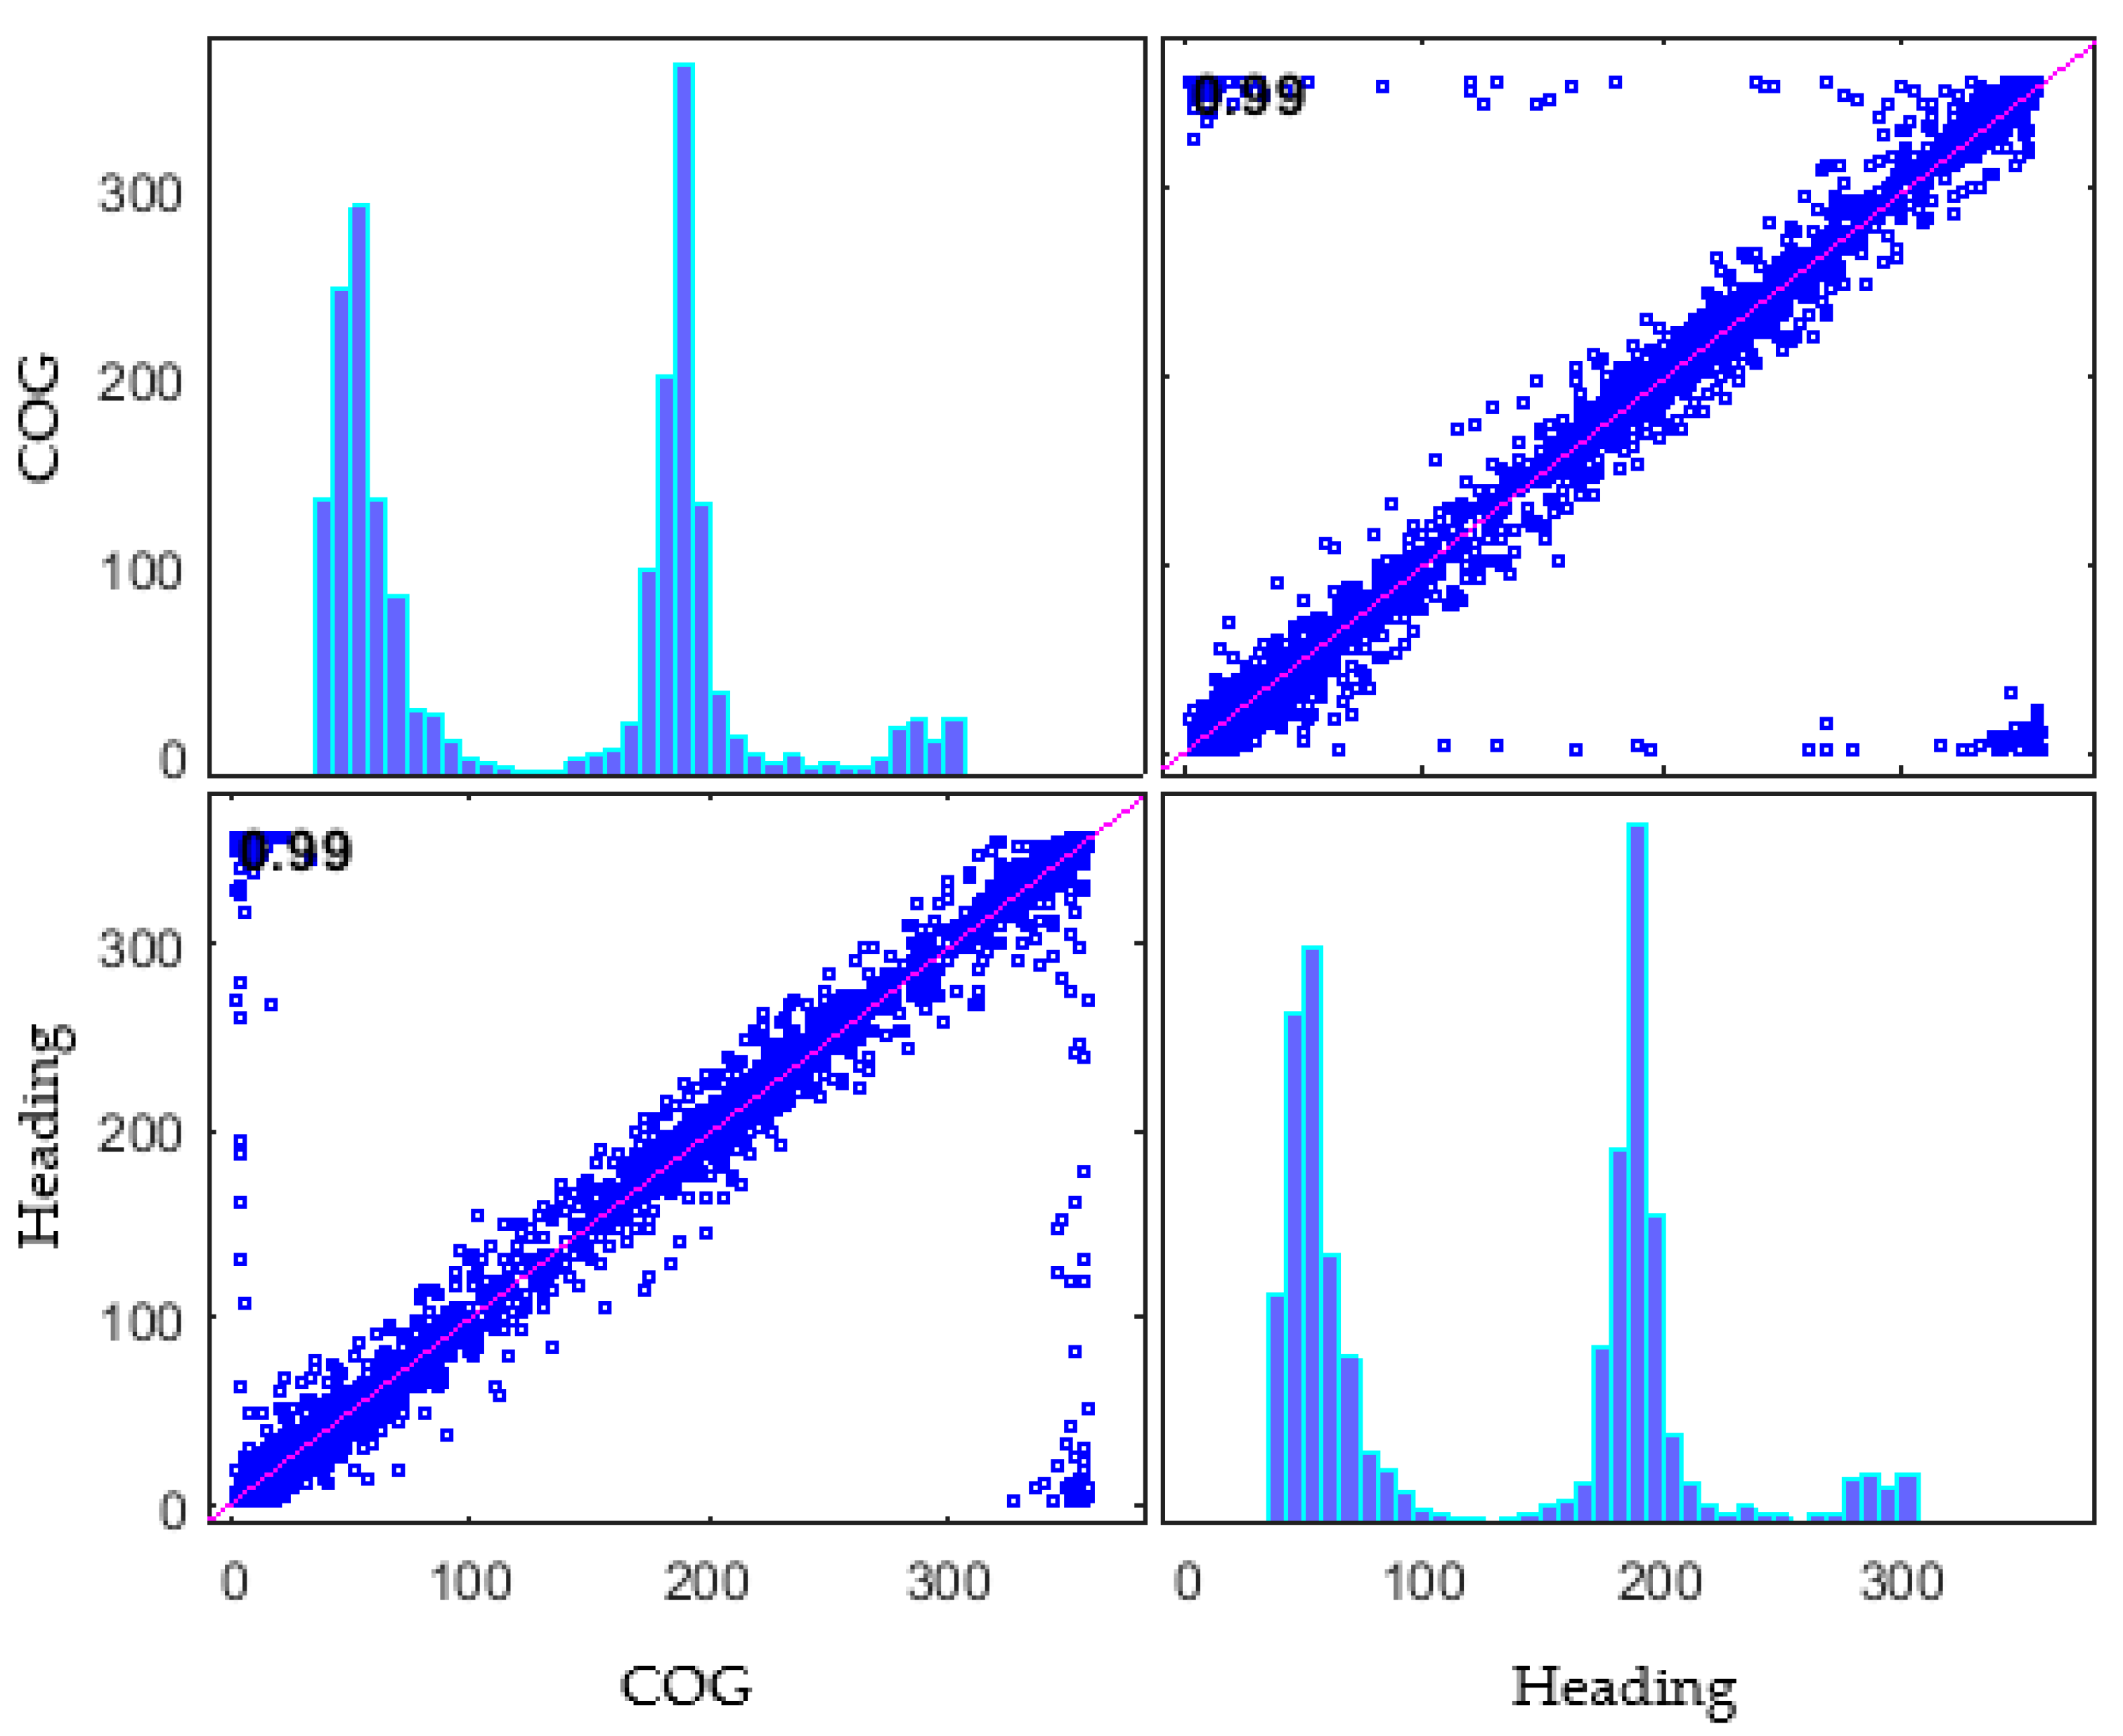
2.3.2. Data Cleaning
During the trajectory extraction stage, time-series synchronization and interpolation for variables were performed. Correlation with COG was confirmed for replacing heading values of 511 (not available) identified during data examination. Since the criteria of own ship is a ship moving at 5 knots or more, the correlation was checked for ships with SOG 5 knots or more. Since COG and heading are continuous values, a Pearson correlation coefficient was used. As a result, a high correlation of 0.9864 was confirmed with a zero
p-value, and the not available heading value was replaced with COG.
Figure 5 describes the correlation between COG and heading.
2.4. Feature Extraction
Because machine learning uses a numerical learning and decision-making basis, converting the AIS data into feature data representing the navigation situation was necessary to apply the navigation situation to the clustering algorithm [
22]. In addition, because the clustering algorithm’s performance varies depending on input features, the following approach was used to extract features that could effectively express the navigation situation.
2.4.1. Periodic Feature
Three experts with more than five years of onboard experience and knowledge of data science determined the domain of the features to be the input data to the clustering algorithm. Consequently, the domain of the features was set to a periodic feature that could comprehensively explain the entire situation from the beginning to the end of the navigation situation.
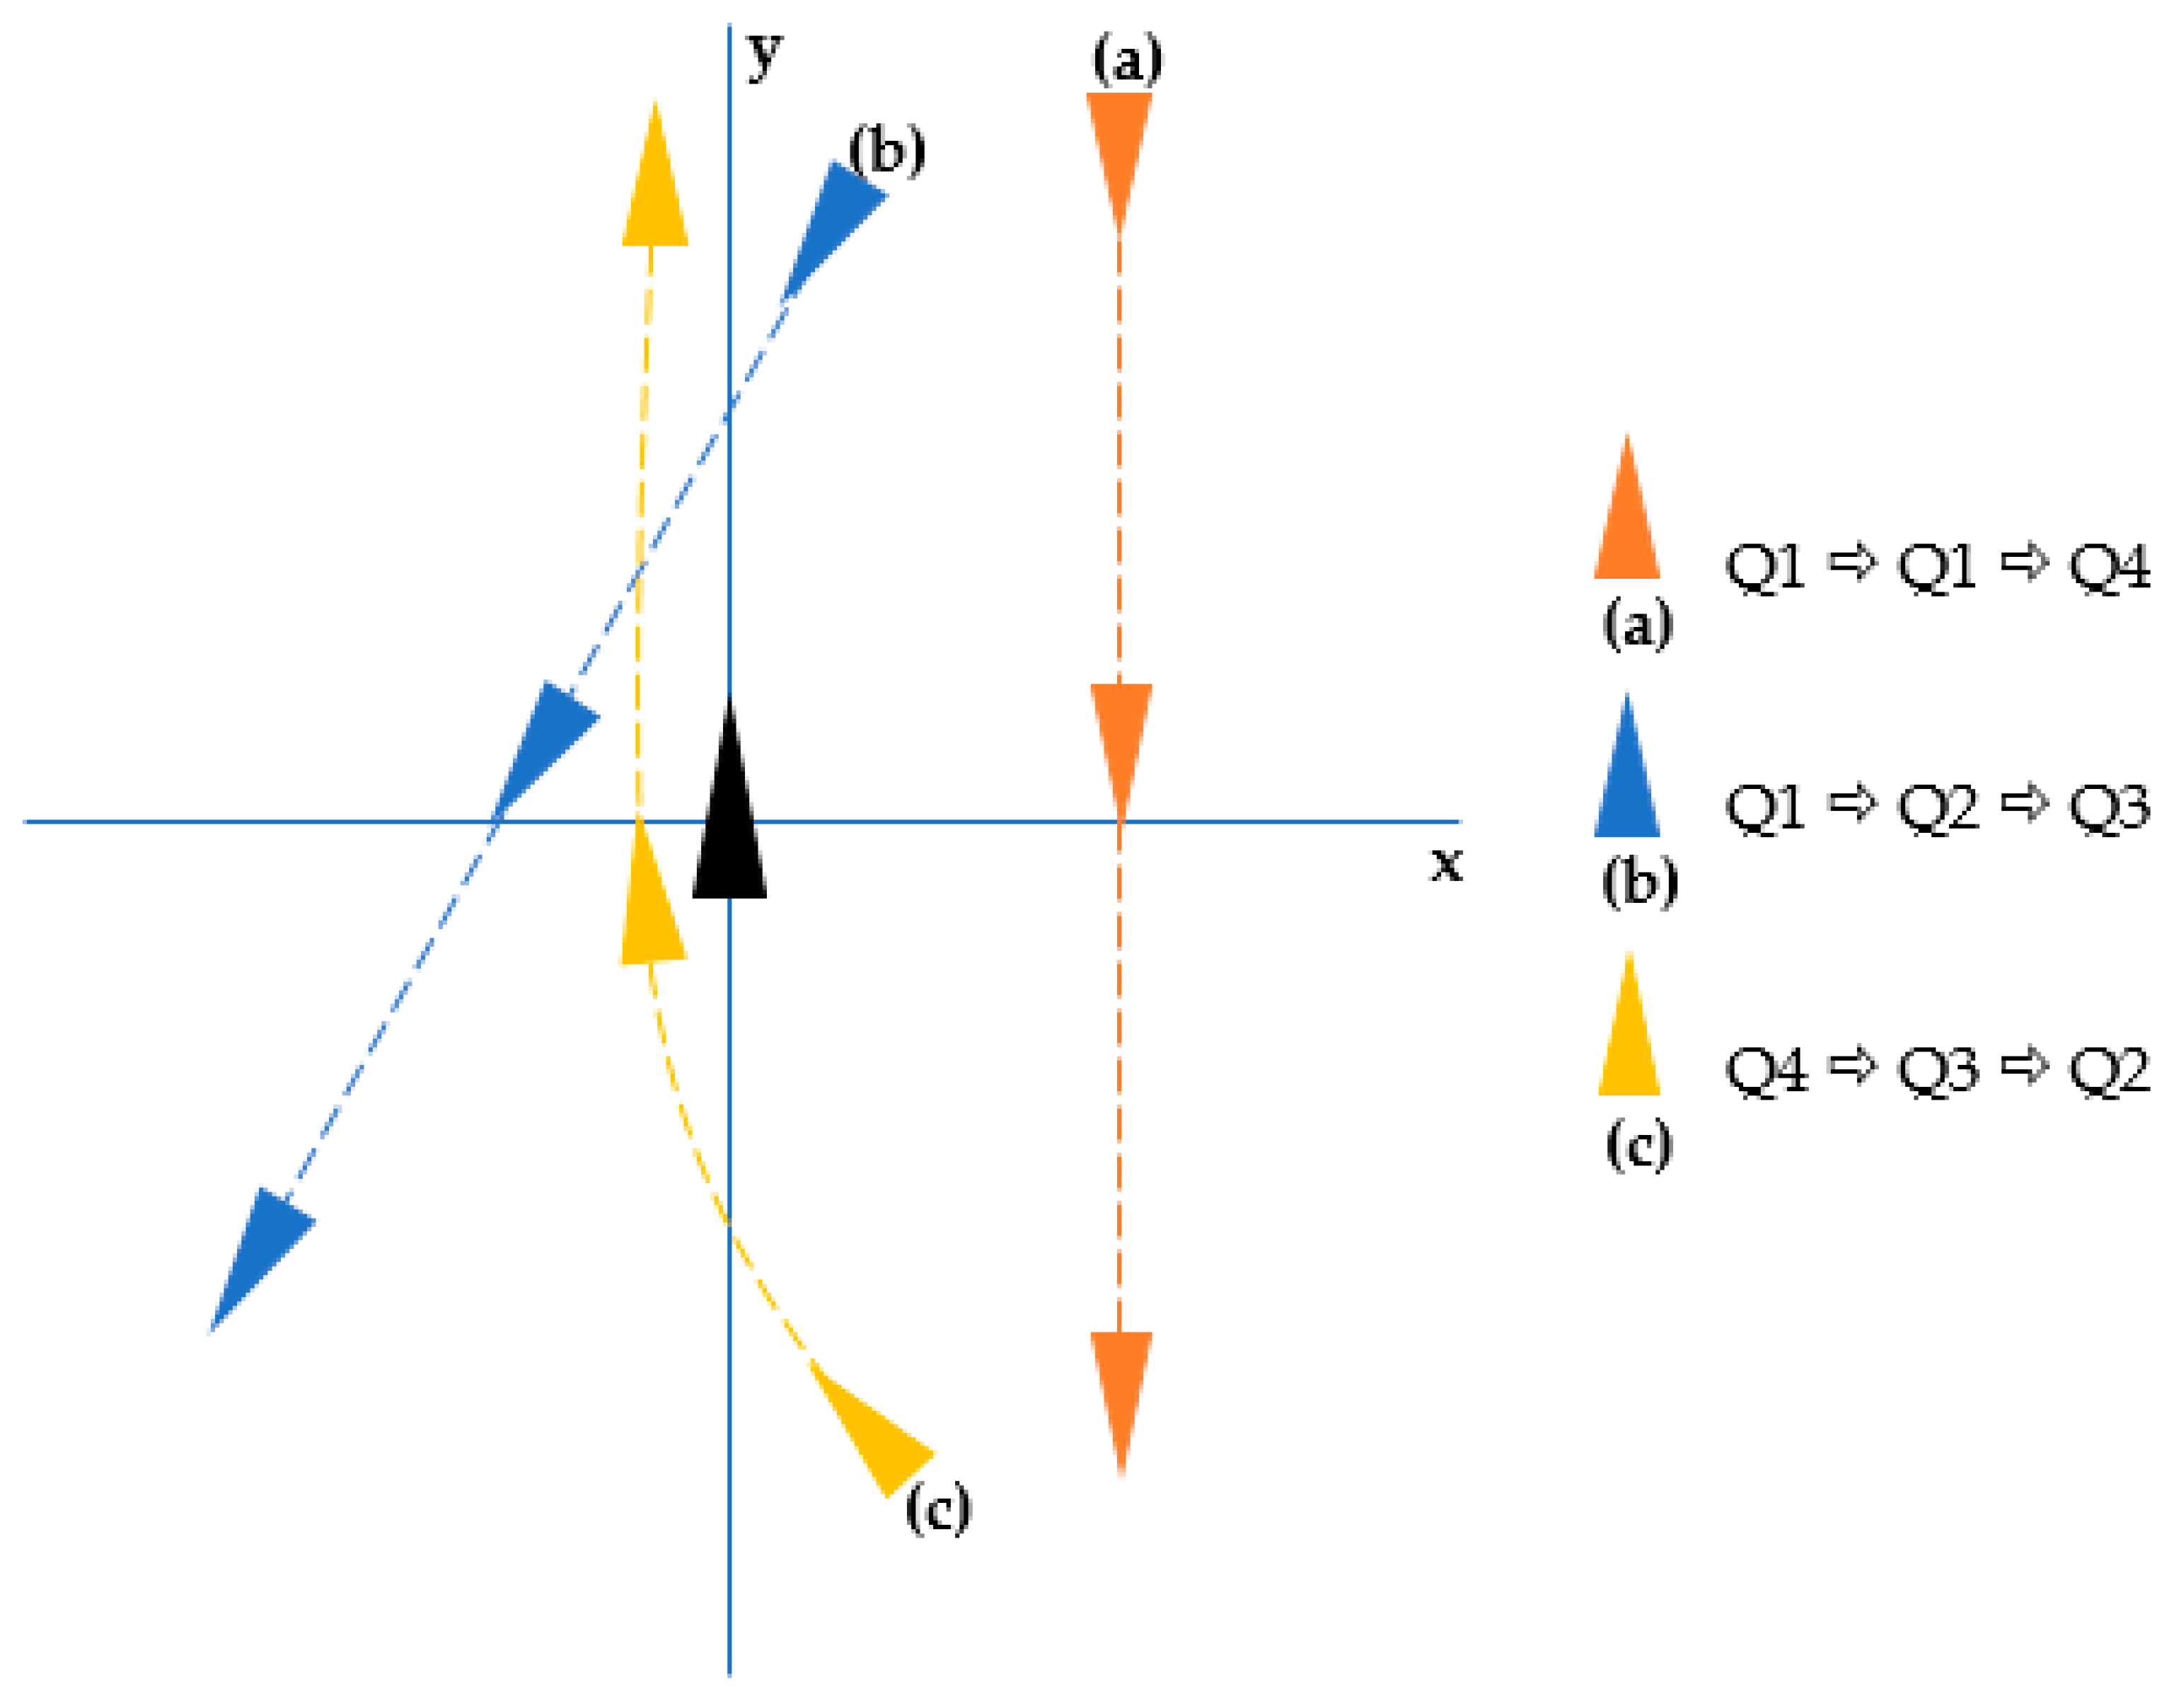
2.4.2. Relative Bearing Change
The relative bearing change was extracted as a feature to explain the general navigation situation [
23]. As shown in
Figure 6, changes to the relative bearing in a vessel were converted into a change in quadrant in a Cartesian coordinate system. By passing an abeam through the starboard of the own ship, the ship (a) was changed from starboard bow to starboard quarter, and when this is expressed as a change in the quadrant, it is expressed as Q1-Q1-Q4.
The feature was extracted by calculating the change of the quadrants of a target ship in the entire trajectory, and the extracted feature list was 24 quadrant changes, as shown in
Table 3.
2.5. Hierarchical Clustering
Agglomerative Clustering Algorithm
An agglomerative hierarchical clustering algorithm was used in this study. This algorithm’s parameter tuning must consider several factors. In this study, the clustering algorithm considered the similarity (distance) measuring method, the proximity (linkage) measuring method, and the optimal number of clusters [
24].
3. Result
3.1. Input Data
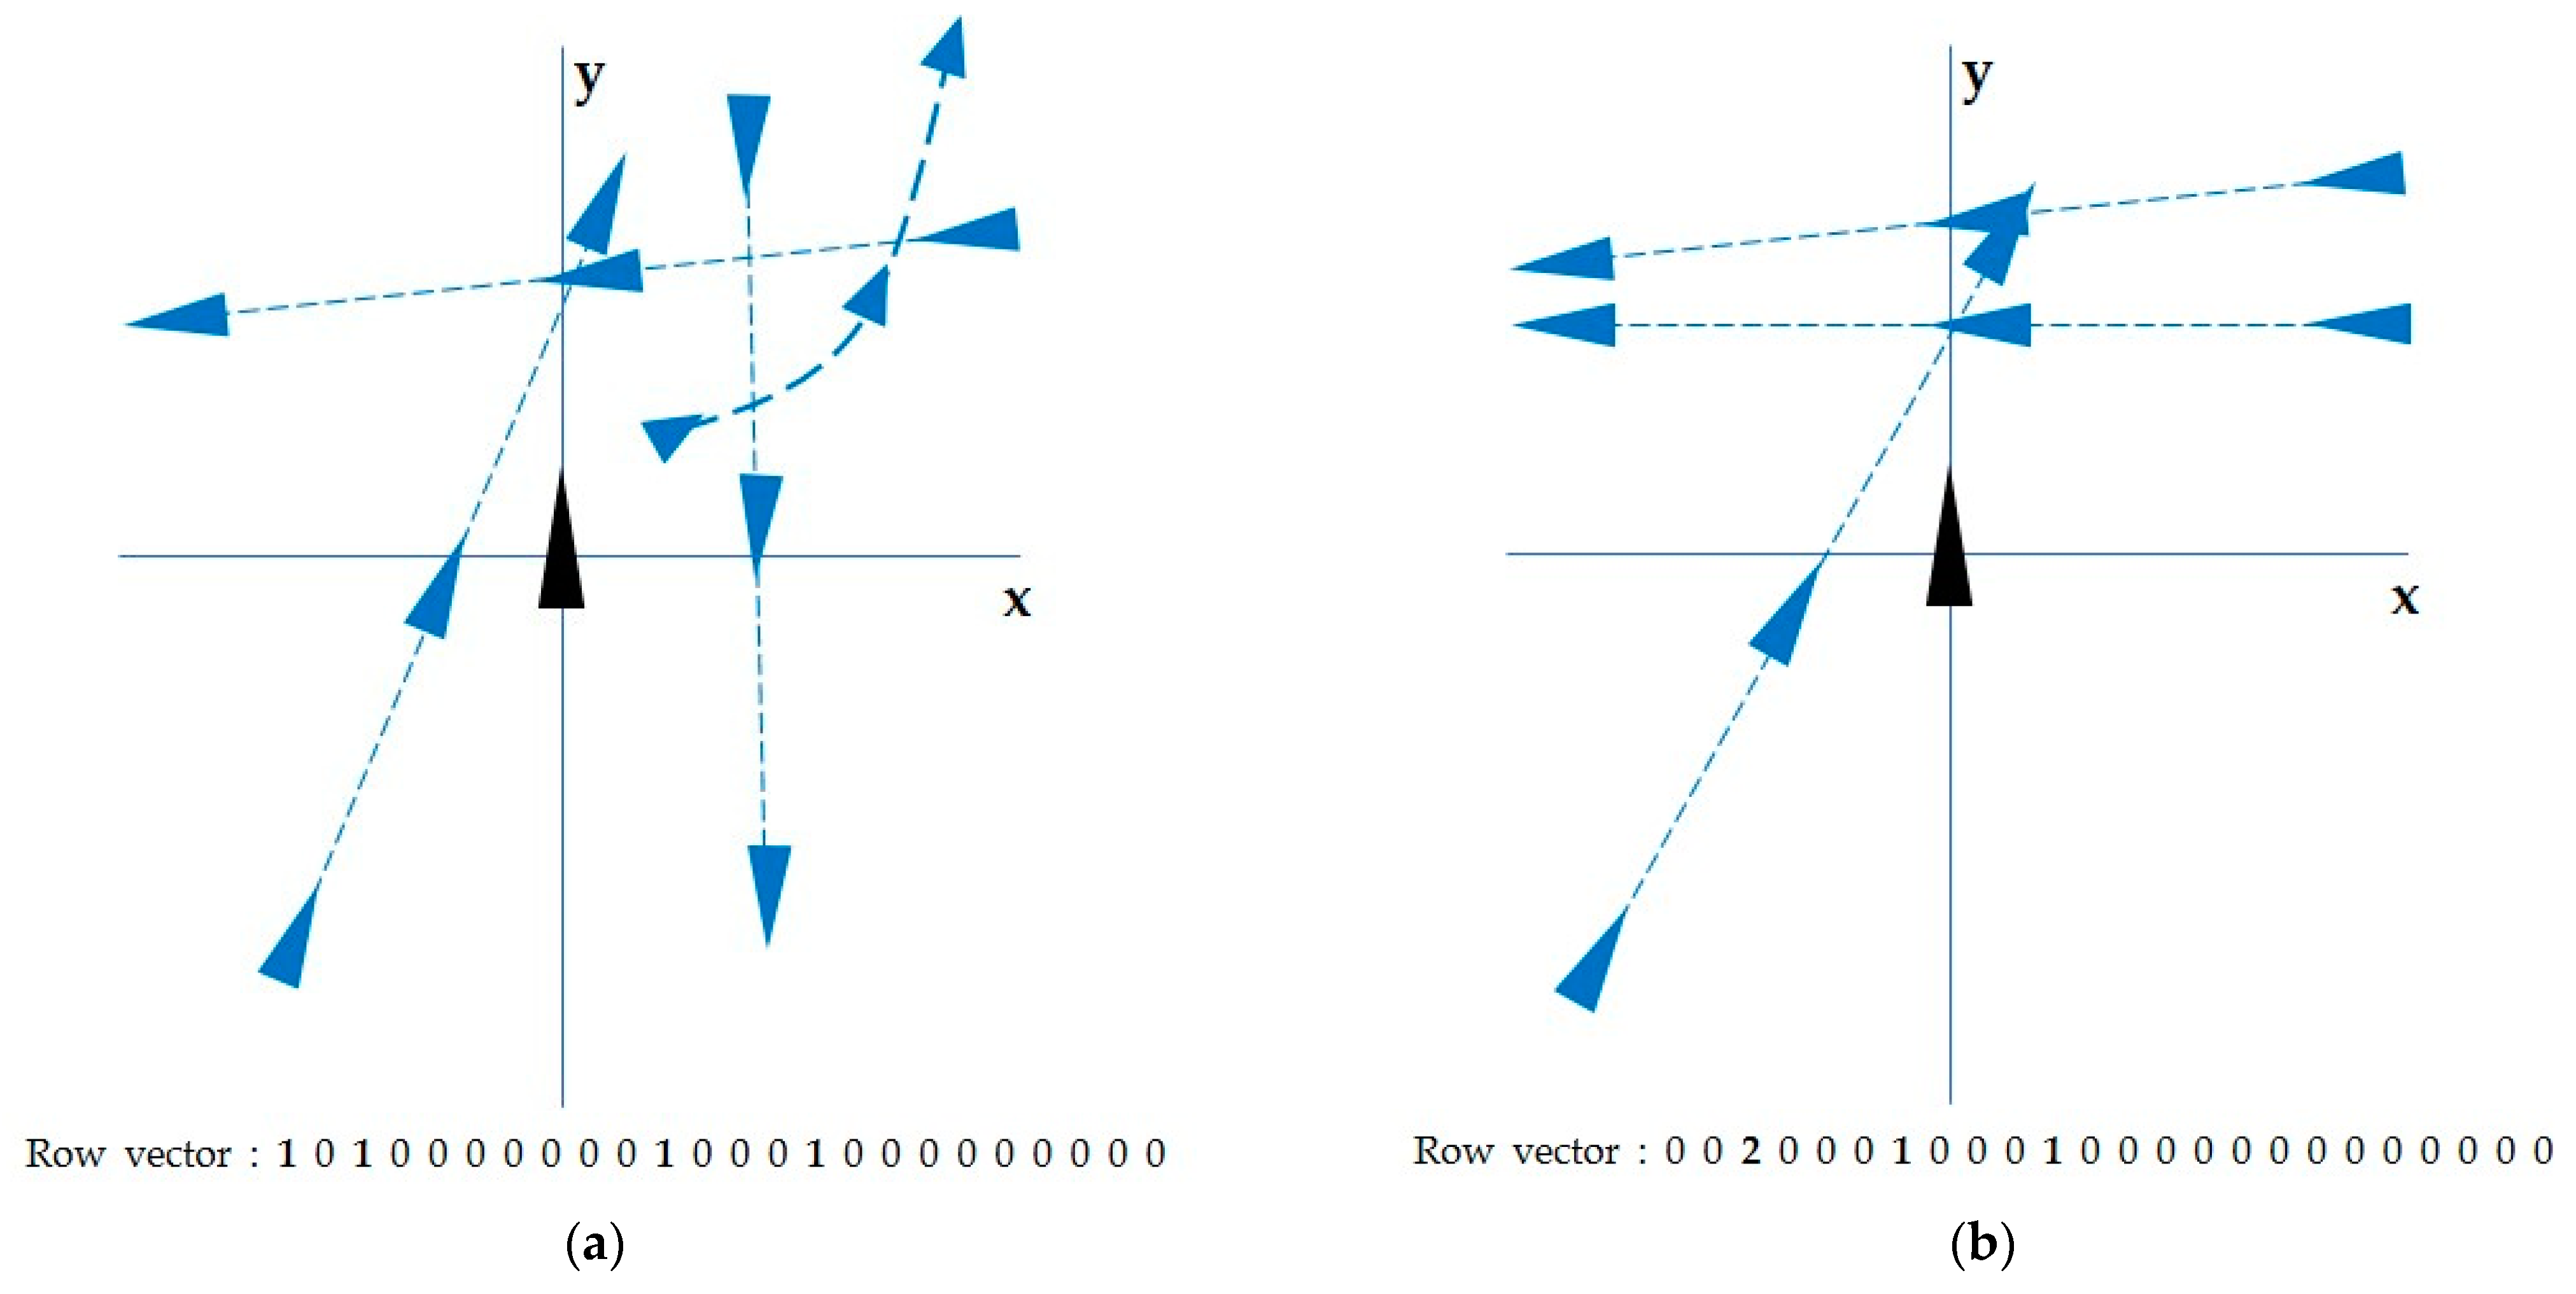
A data set that counts situations corresponding to features in each ship’s trajectory was used as the clustering input data. Each row of input data was a row vector describing one trajectory as a combination of the number of ships corresponding to the features.
The illustrations in
Figure 7 conceptualize the process from the navigation situation to input data. Trajectory (a) is composed of one starboard passing vessel, one crossing vessel, one overtaking vessel, and one moving away from the forward, and the corresponding features are 1, 3, 11, 15. This combination of the navigation situation is described as a row vector (a). A zero in row vector (a) means that there was no vessel corresponding to the feature, and a one means that there was one vessel in the navigation situation corresponding to that feature. Trajectory (b) has two vessels crossing from the starboard side, one vessel crossing from the port side, and one overtaking vessel, and the corresponding features are 3, 7, 11. This combination of the navigation situation is described as a row vector (b).
The input data was an array comprising 1998 row vectors because the feature extraction was applied to 1998 trajectories.
3.2. Clustering Algorithm Parameter Tuning
3.2.1. Distance Measurement
The hamming distance, average linkage distance measurement, and linkage method were used in the clustering algorithm. The hamming distance, which is appropriate for distinguishing the difference among a combination of vectors, was selected because the input data feature was a set of row vectors that count the situations corresponding to the features in the trajectory for each column [
25].
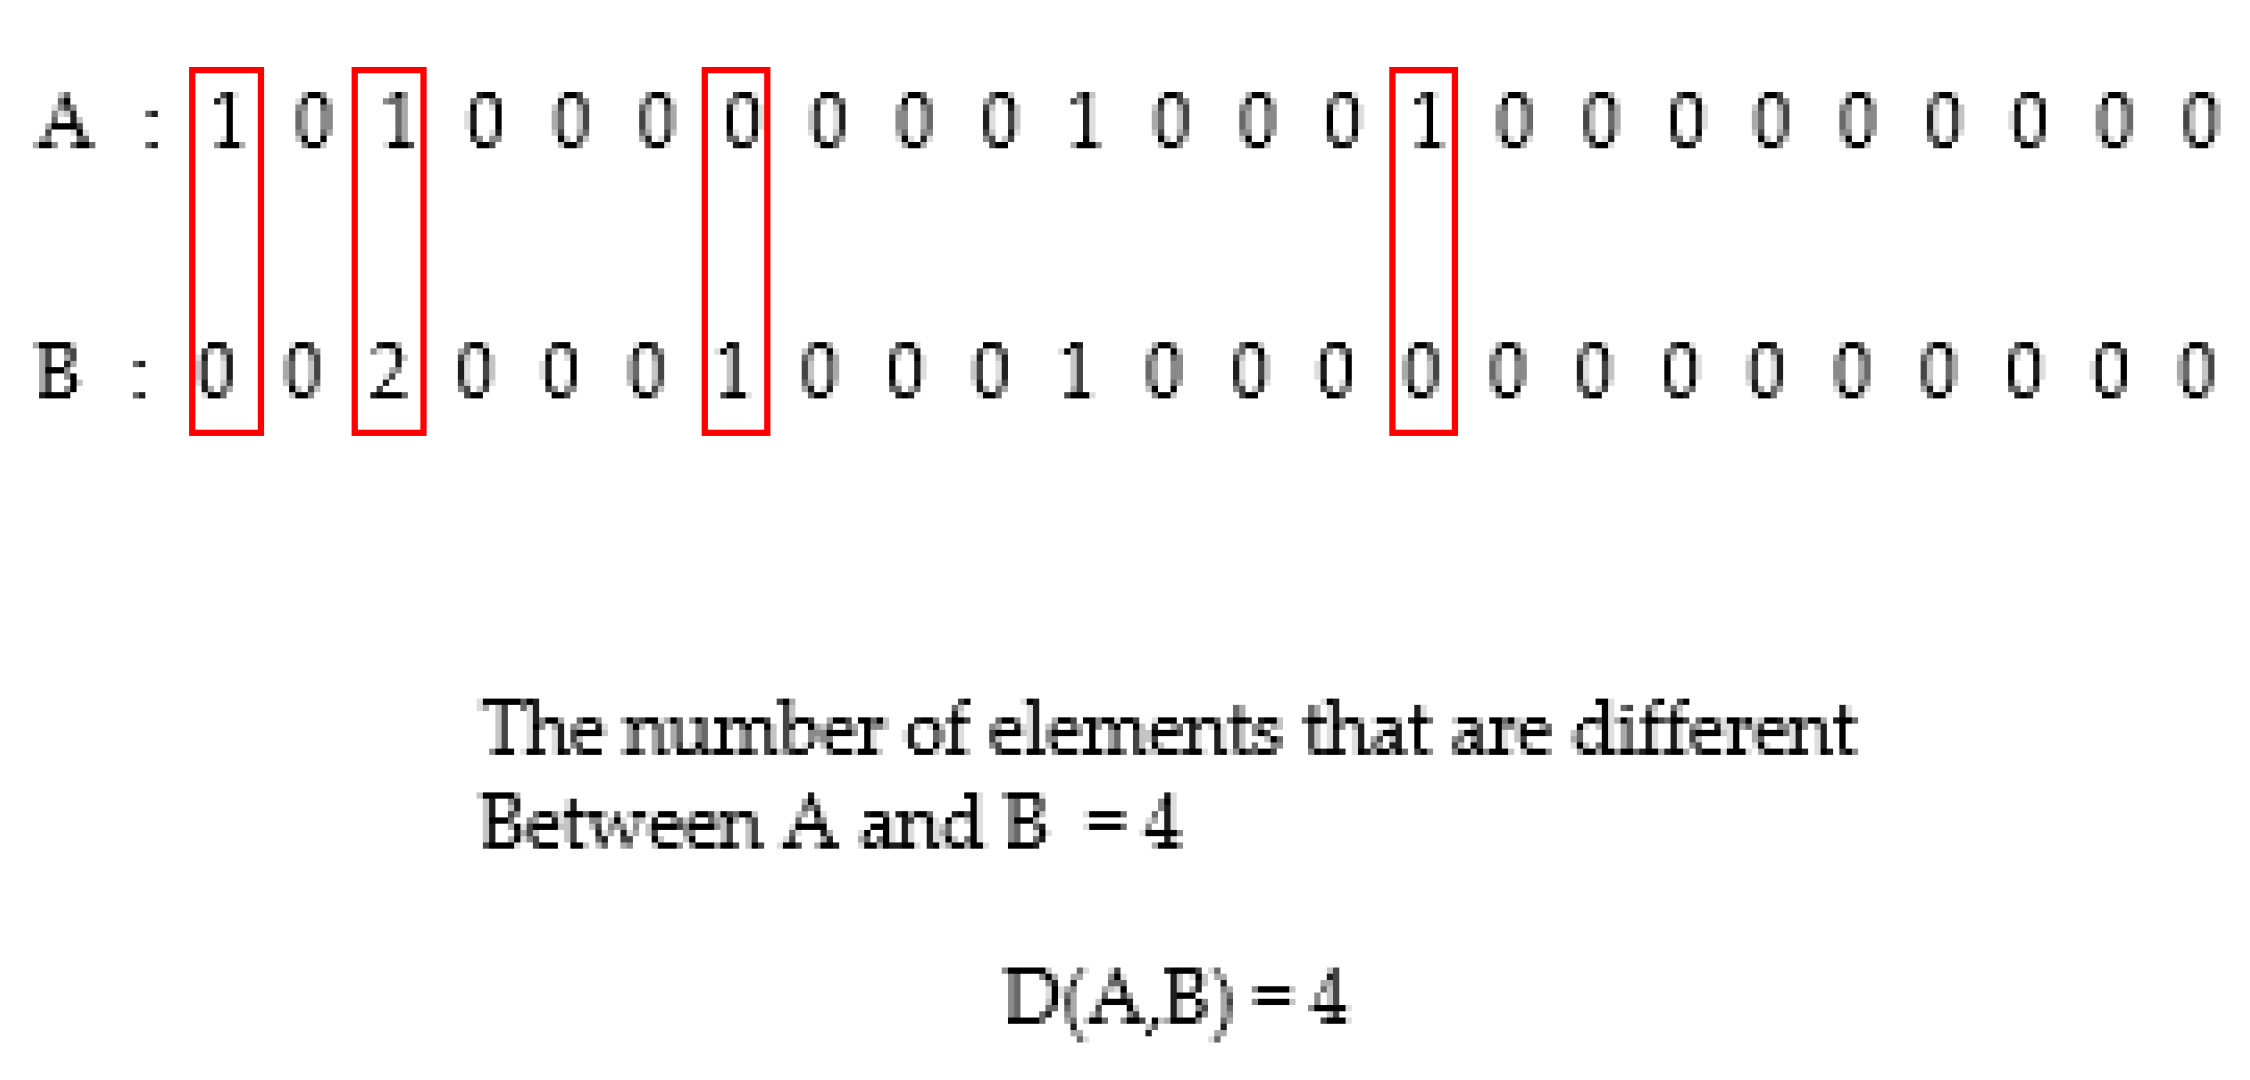
Figure 8 is the row vector of the sailing situation mentioned as an example above. These 2-row vectors use the hamming distance, and the elements corresponding to the four features are different, so the hamming distance is 4.
3.2.2. Linkage Method
For the linkage method, the average linkage with the highest value was selected by comparing the cophenetic correlation coefficient for each method, as shown in
Table 4 [
26].
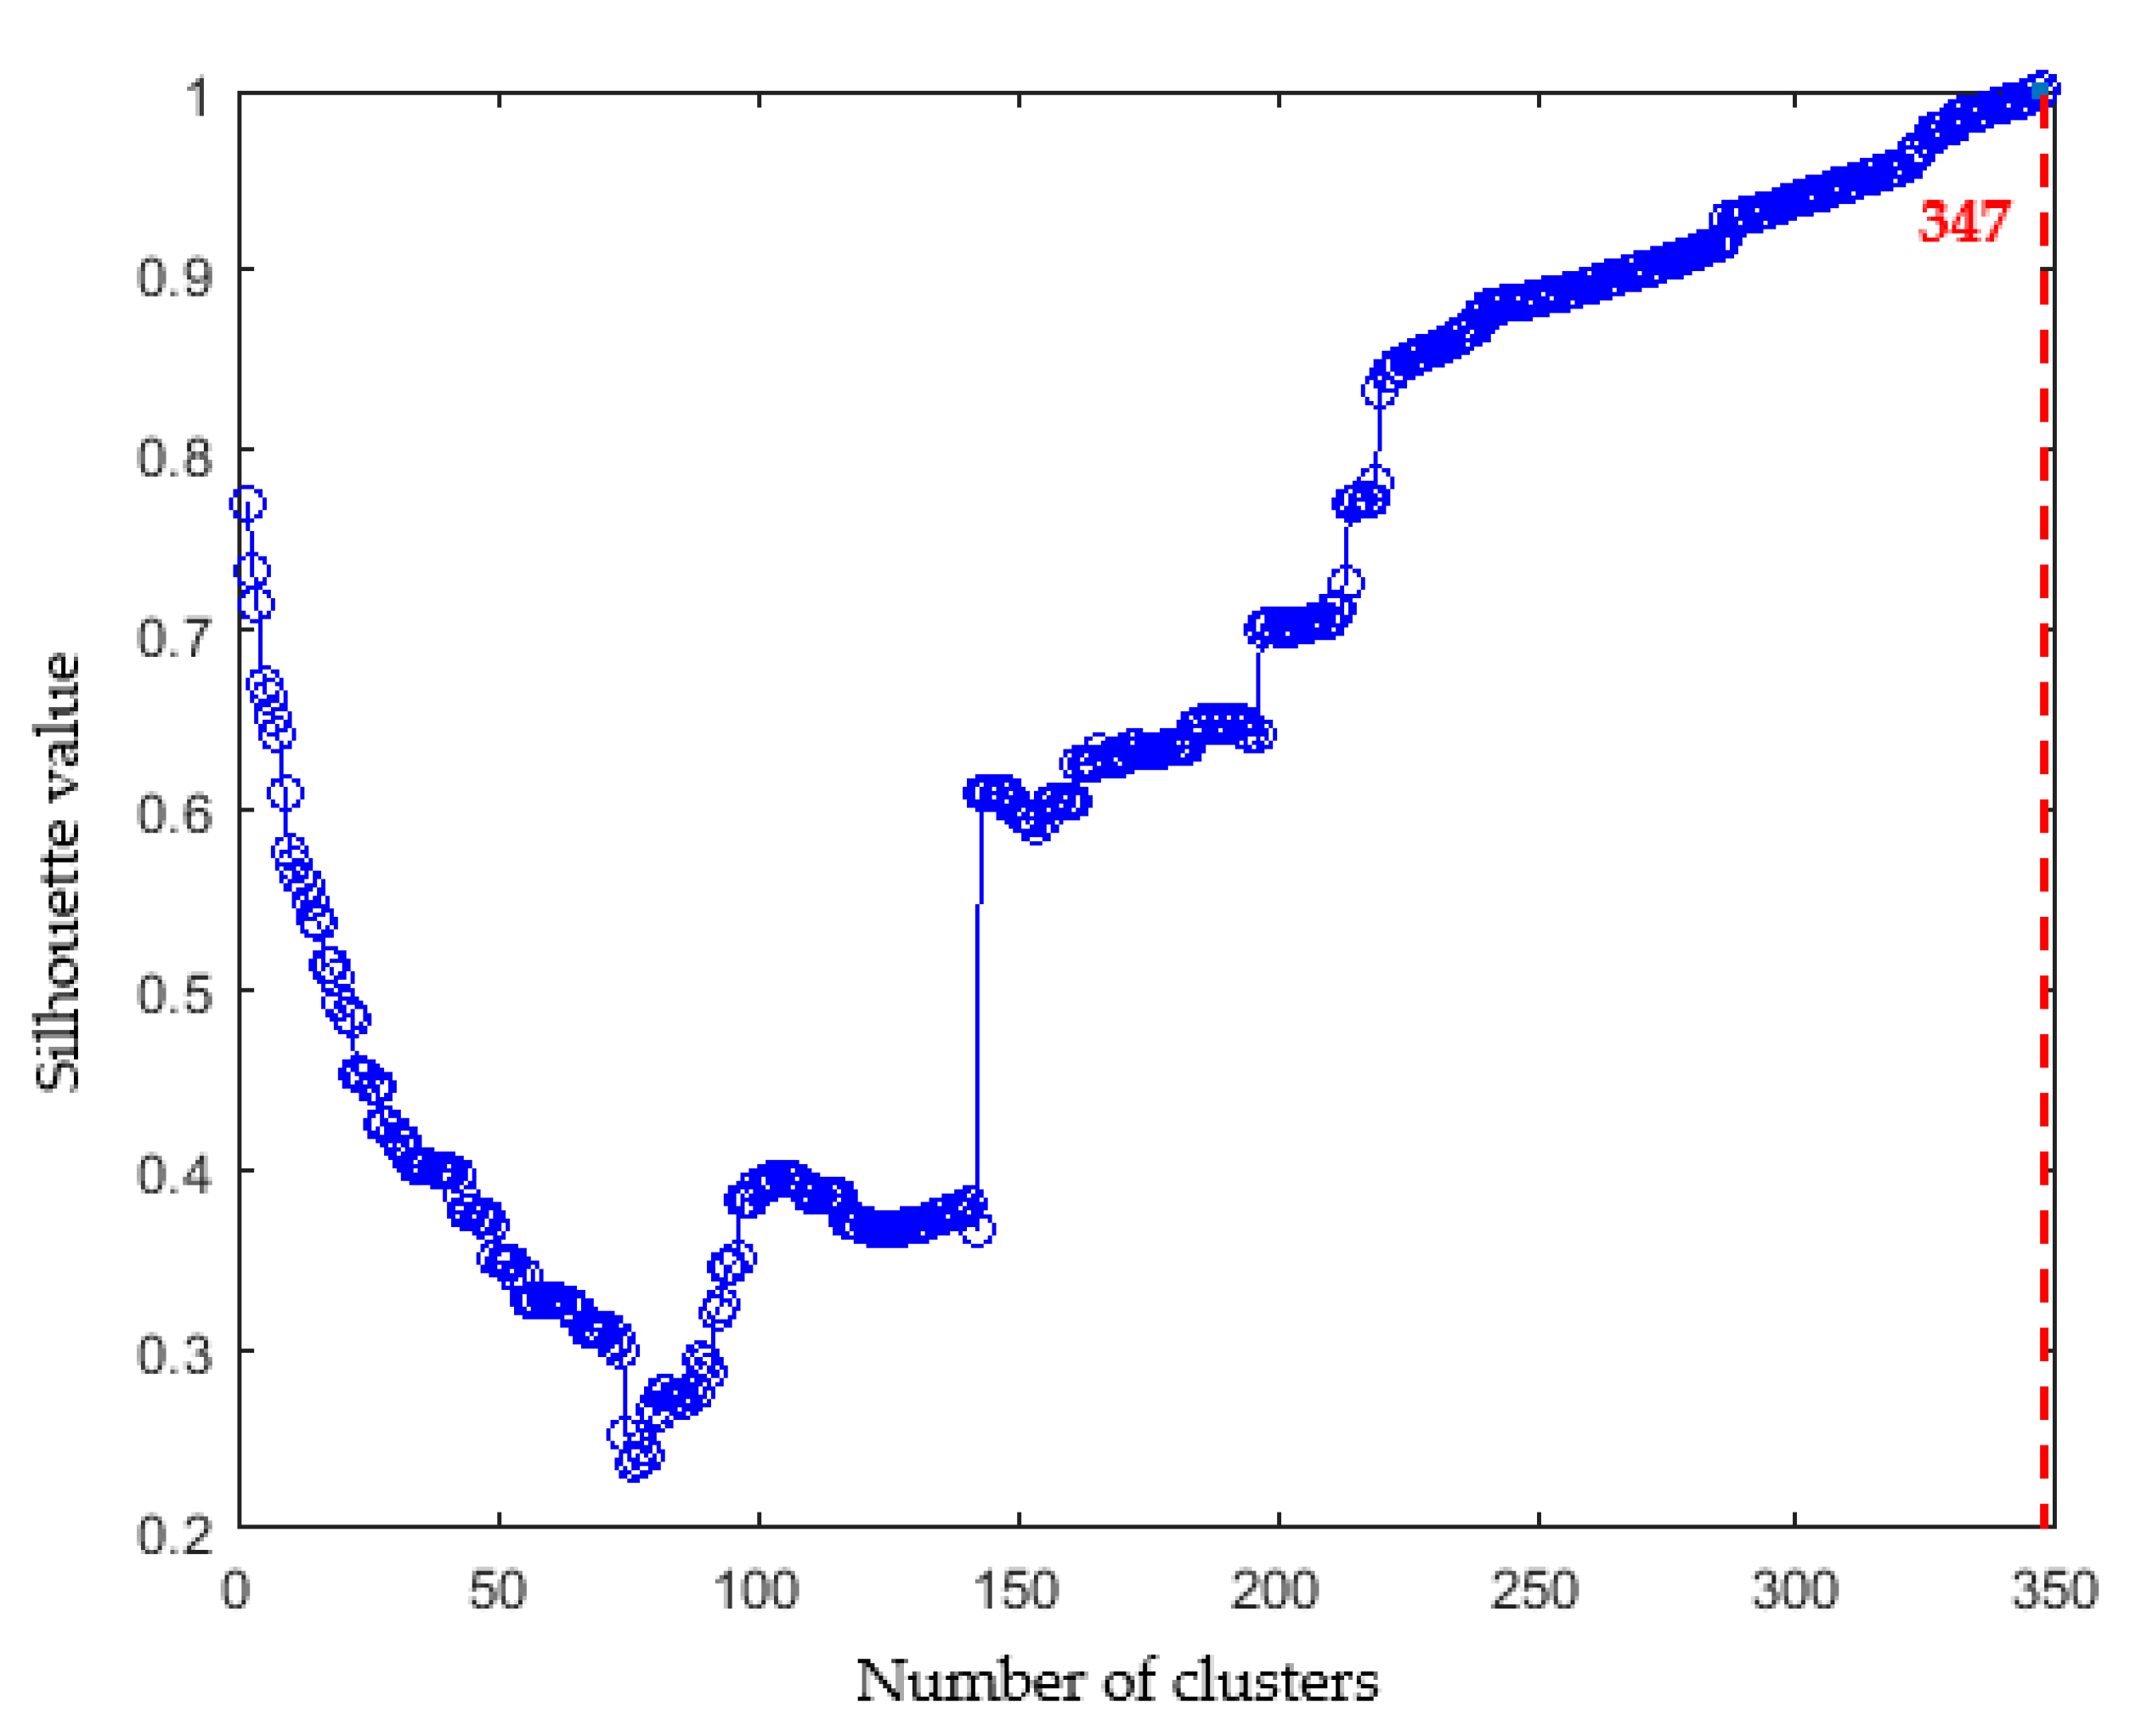
3.2.3. Number of Clusters
Figure 9 shows the silhouette values to find the appropriate number of clusters. The higher the silhouette value, the better the distinction between clusters [
27]. When the number of clusters was 347, the silhouette value was 1.0, so the appropriate number of clusters was 347.
3.3. Clustering Result
3.3.1. Similarity of Clusters
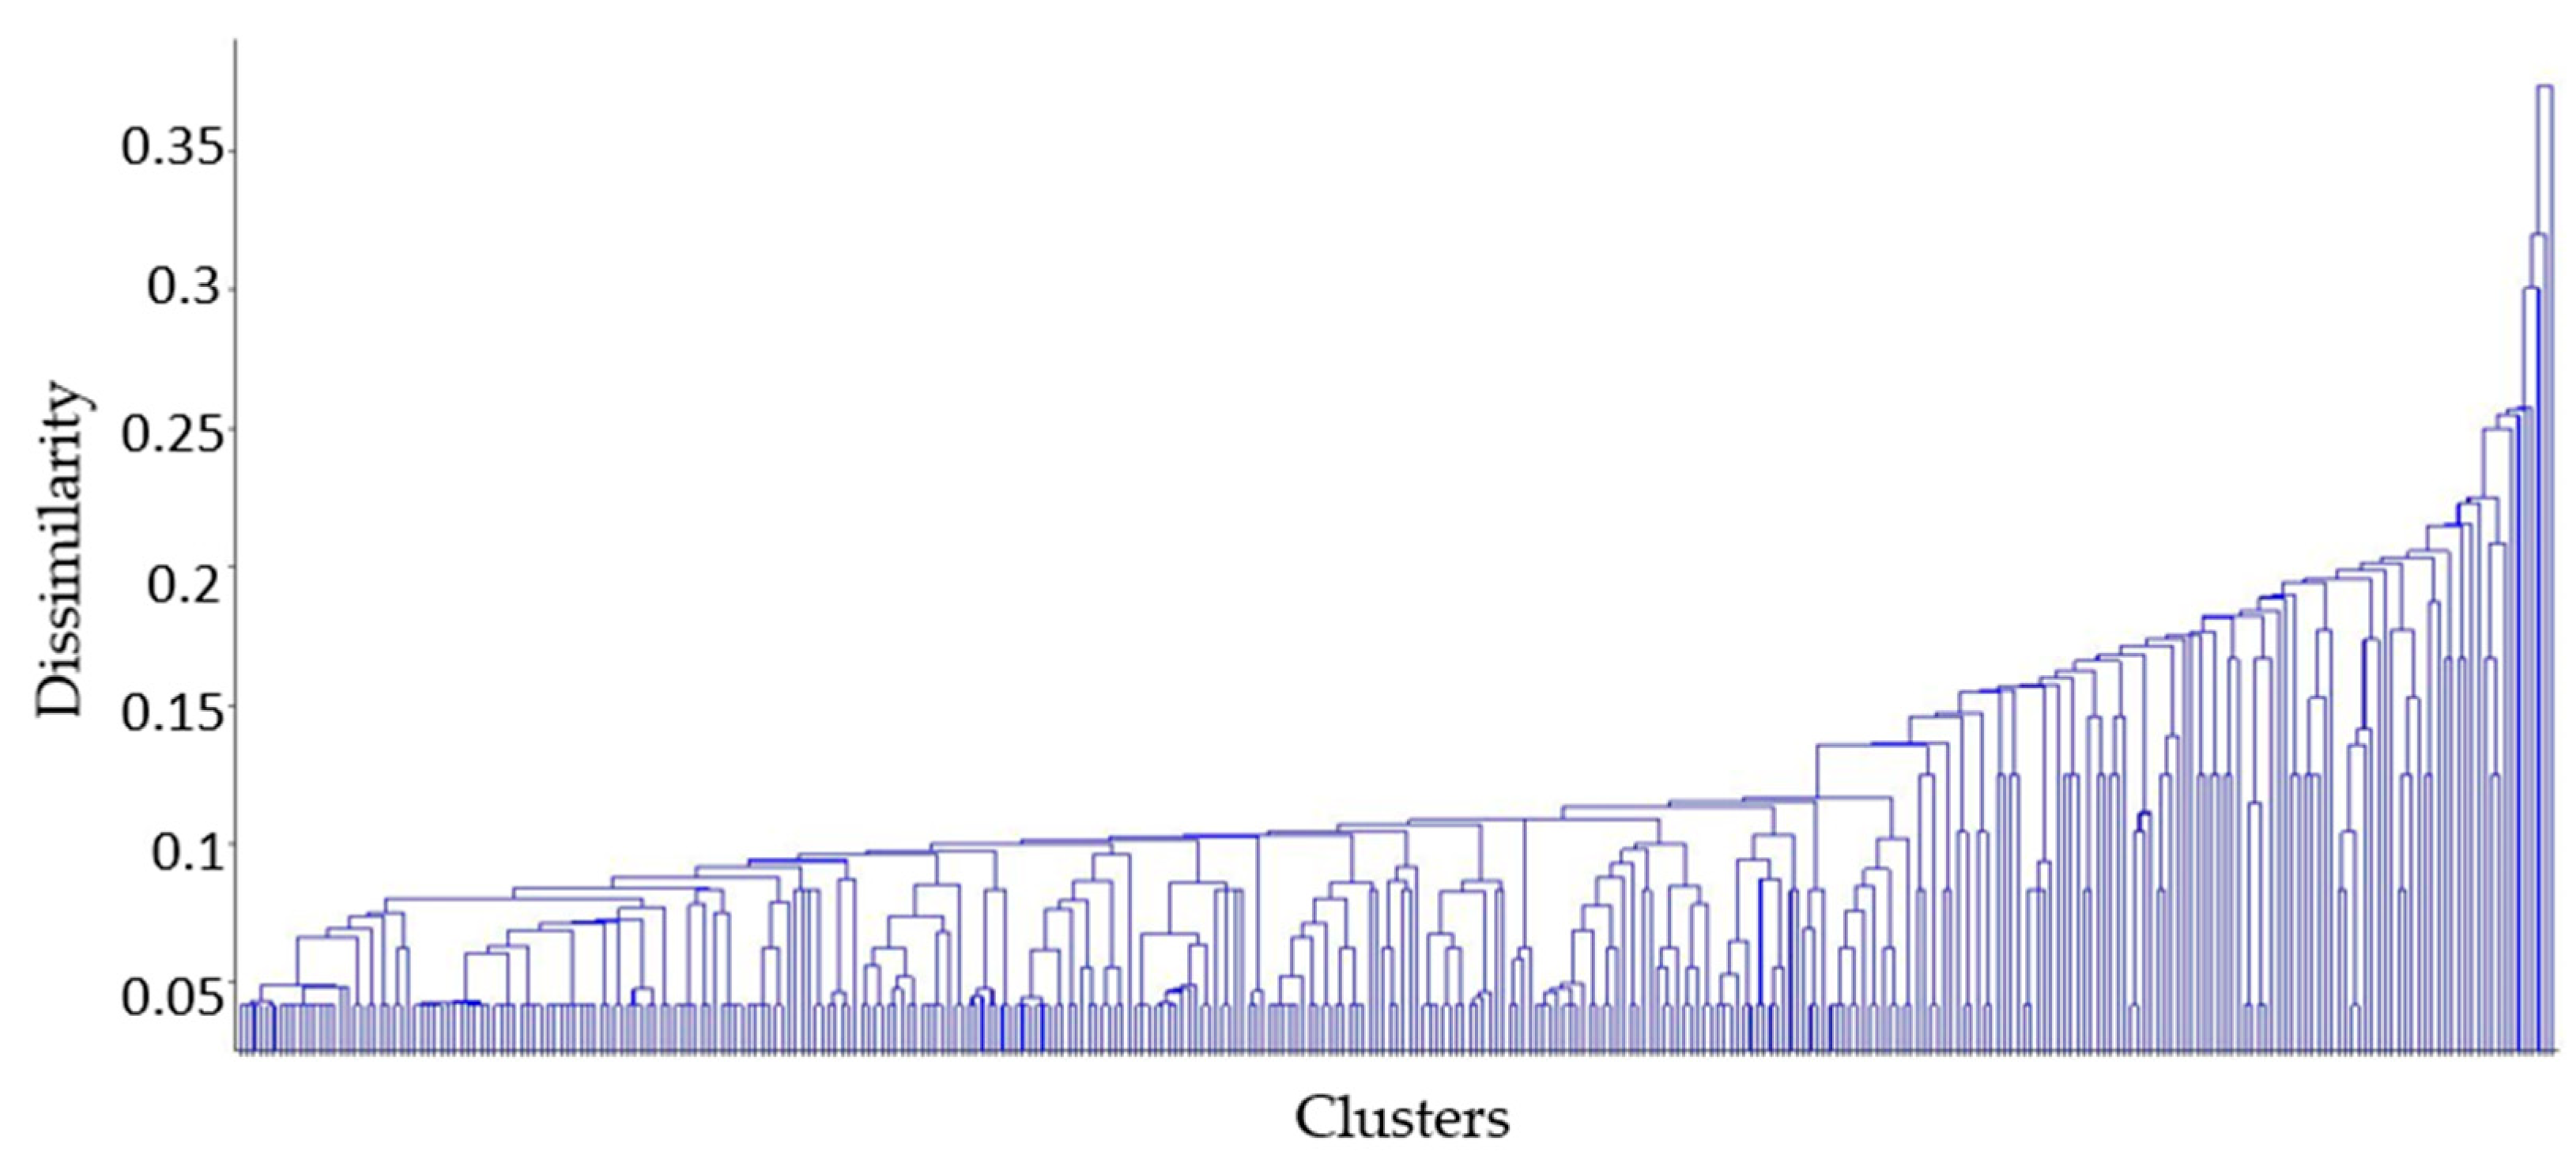
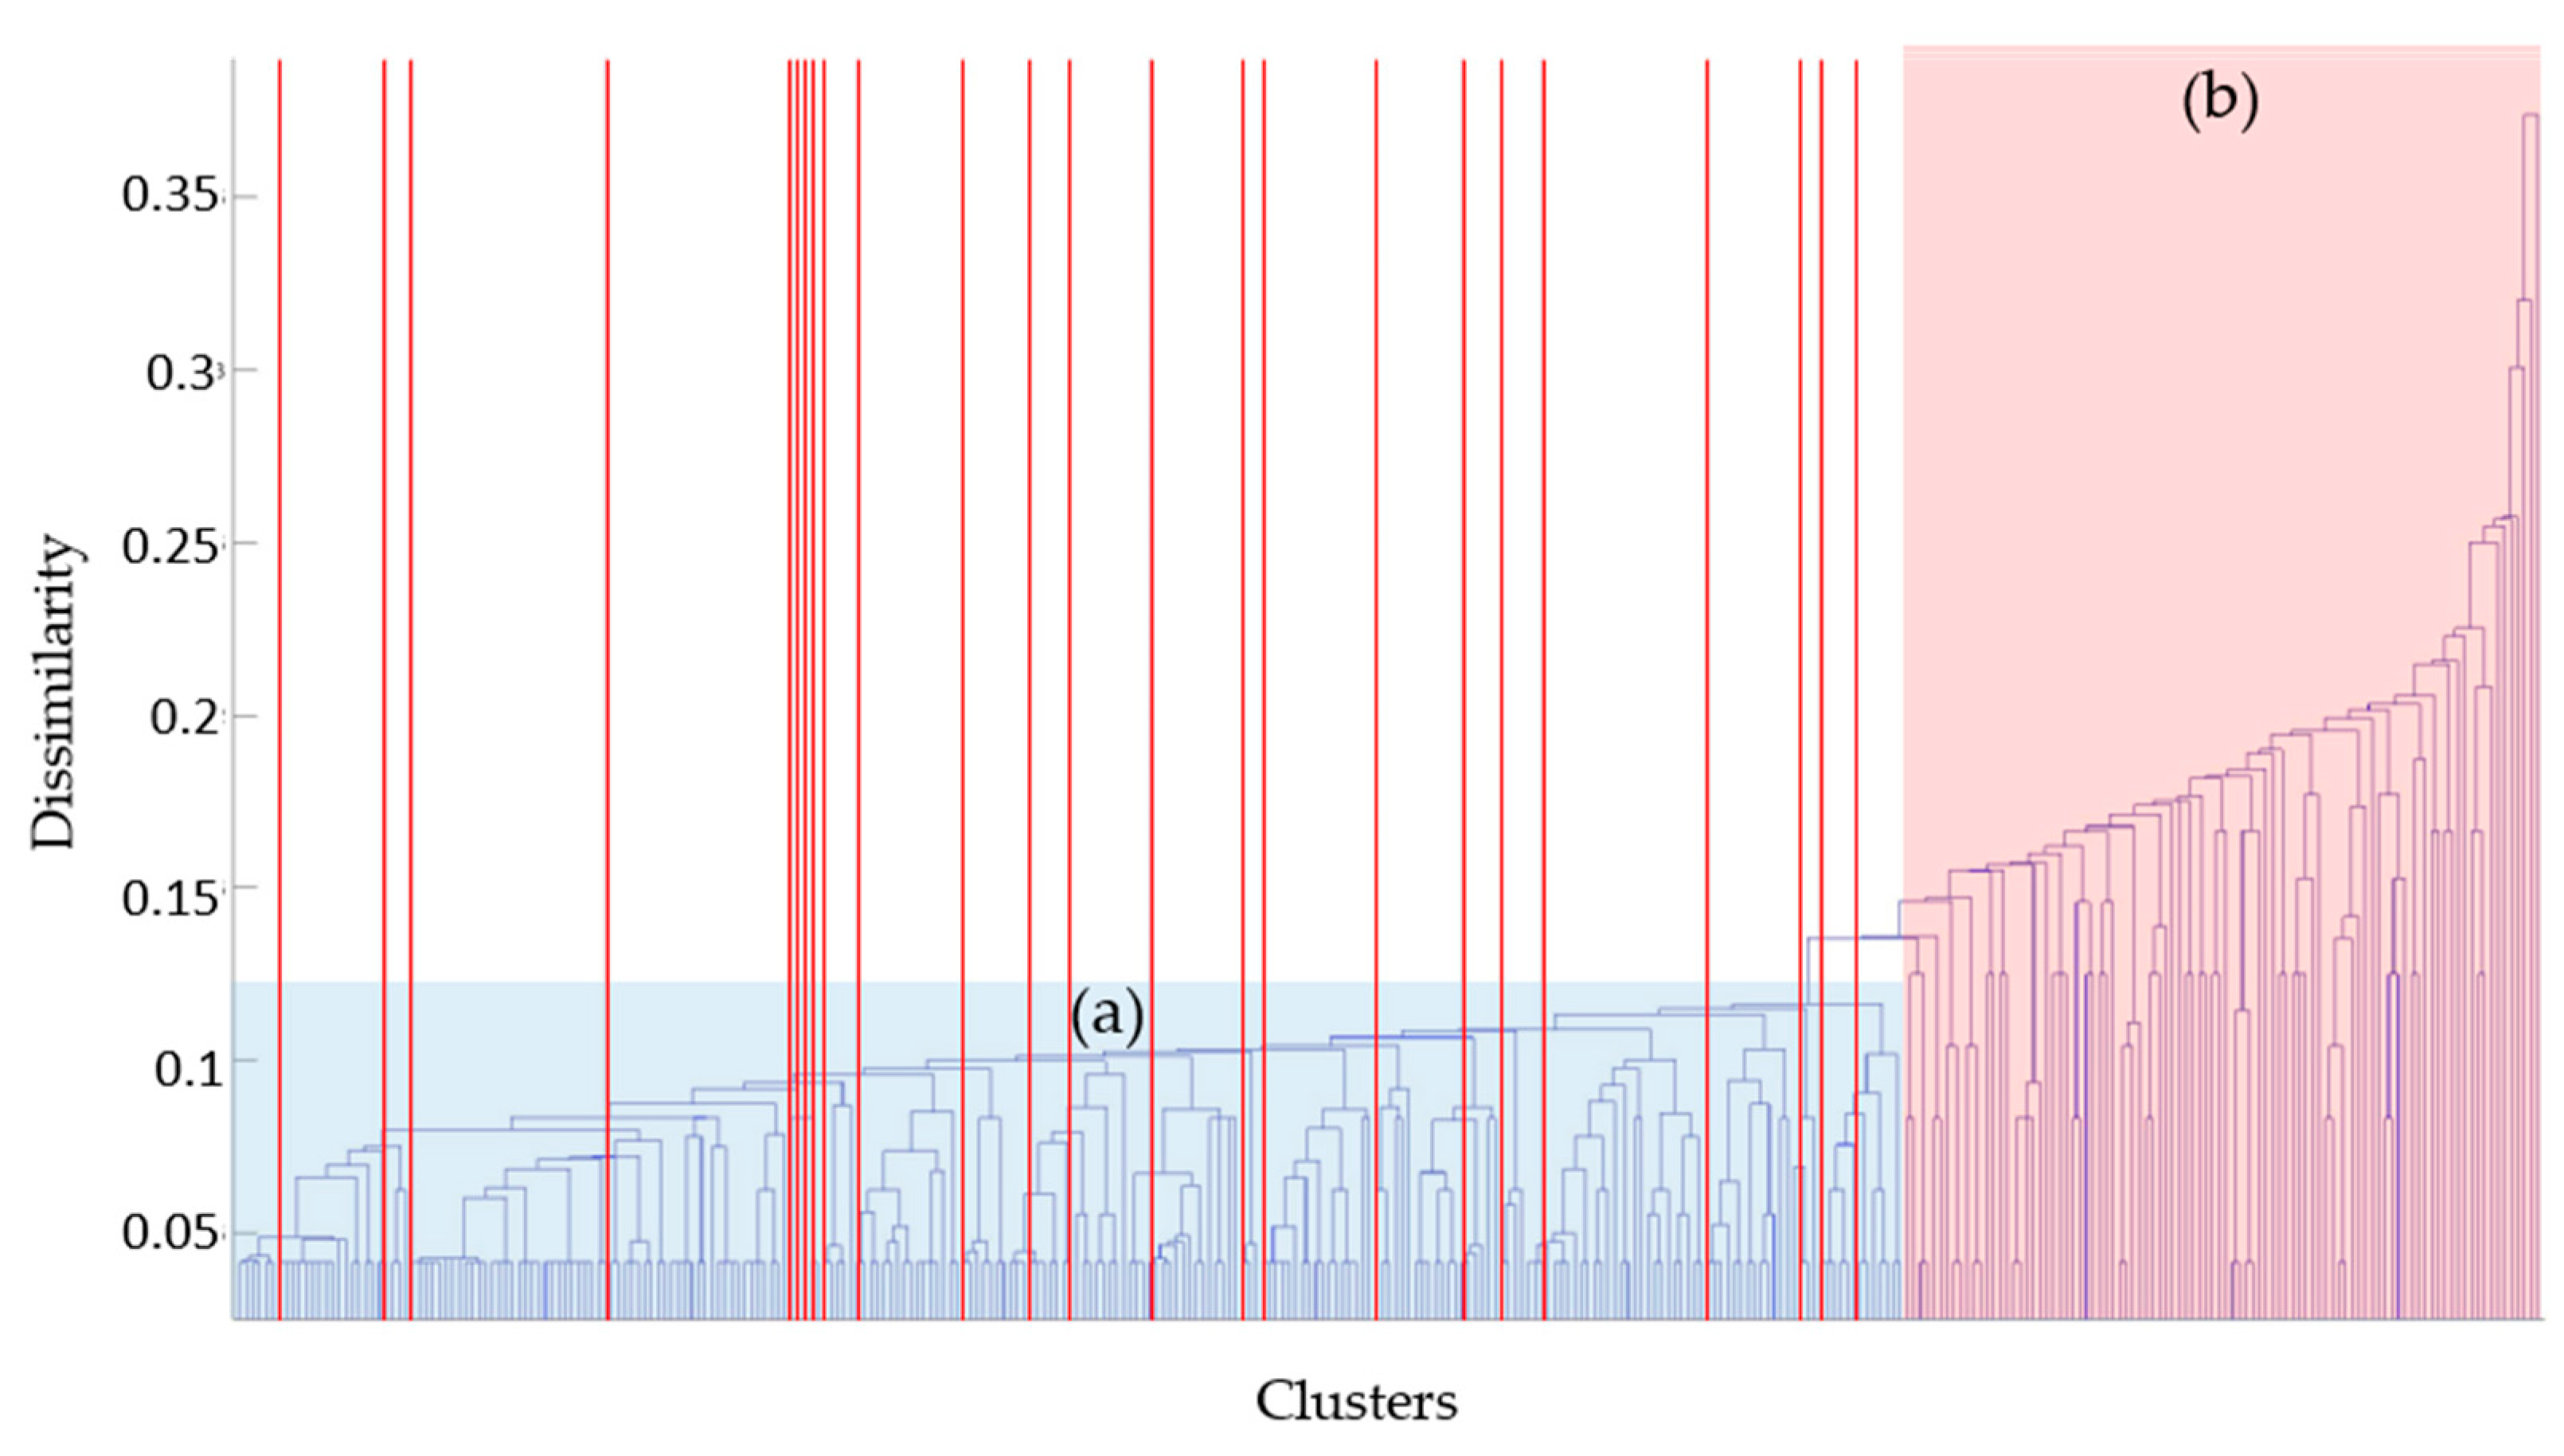
The dendrogram shown in
Figure 10 can be used to determine the similarity of each leaf node that constituted the navigation situation. The lowest level of the dendrogram is called a leaf node or cluster; the cluster’s vertical line is called a node. Each node is connected to one horizontal line, called a clade, and the height of this clade explains the difference between connected clusters [
28]. The difference in the cluster can be explained by the distance measurement used in the clustering algorithm, and a dendrogram in
Figure 10 can be explained by the hamming distance of the input row data used. In this dendrogram, the height of the leaf node increases as it goes to the right, and the height decreases as it goes to the left. Therefore, navigation situations with high similarity were clustered on the left side, and navigation situations with low similarity were clustered on the right.
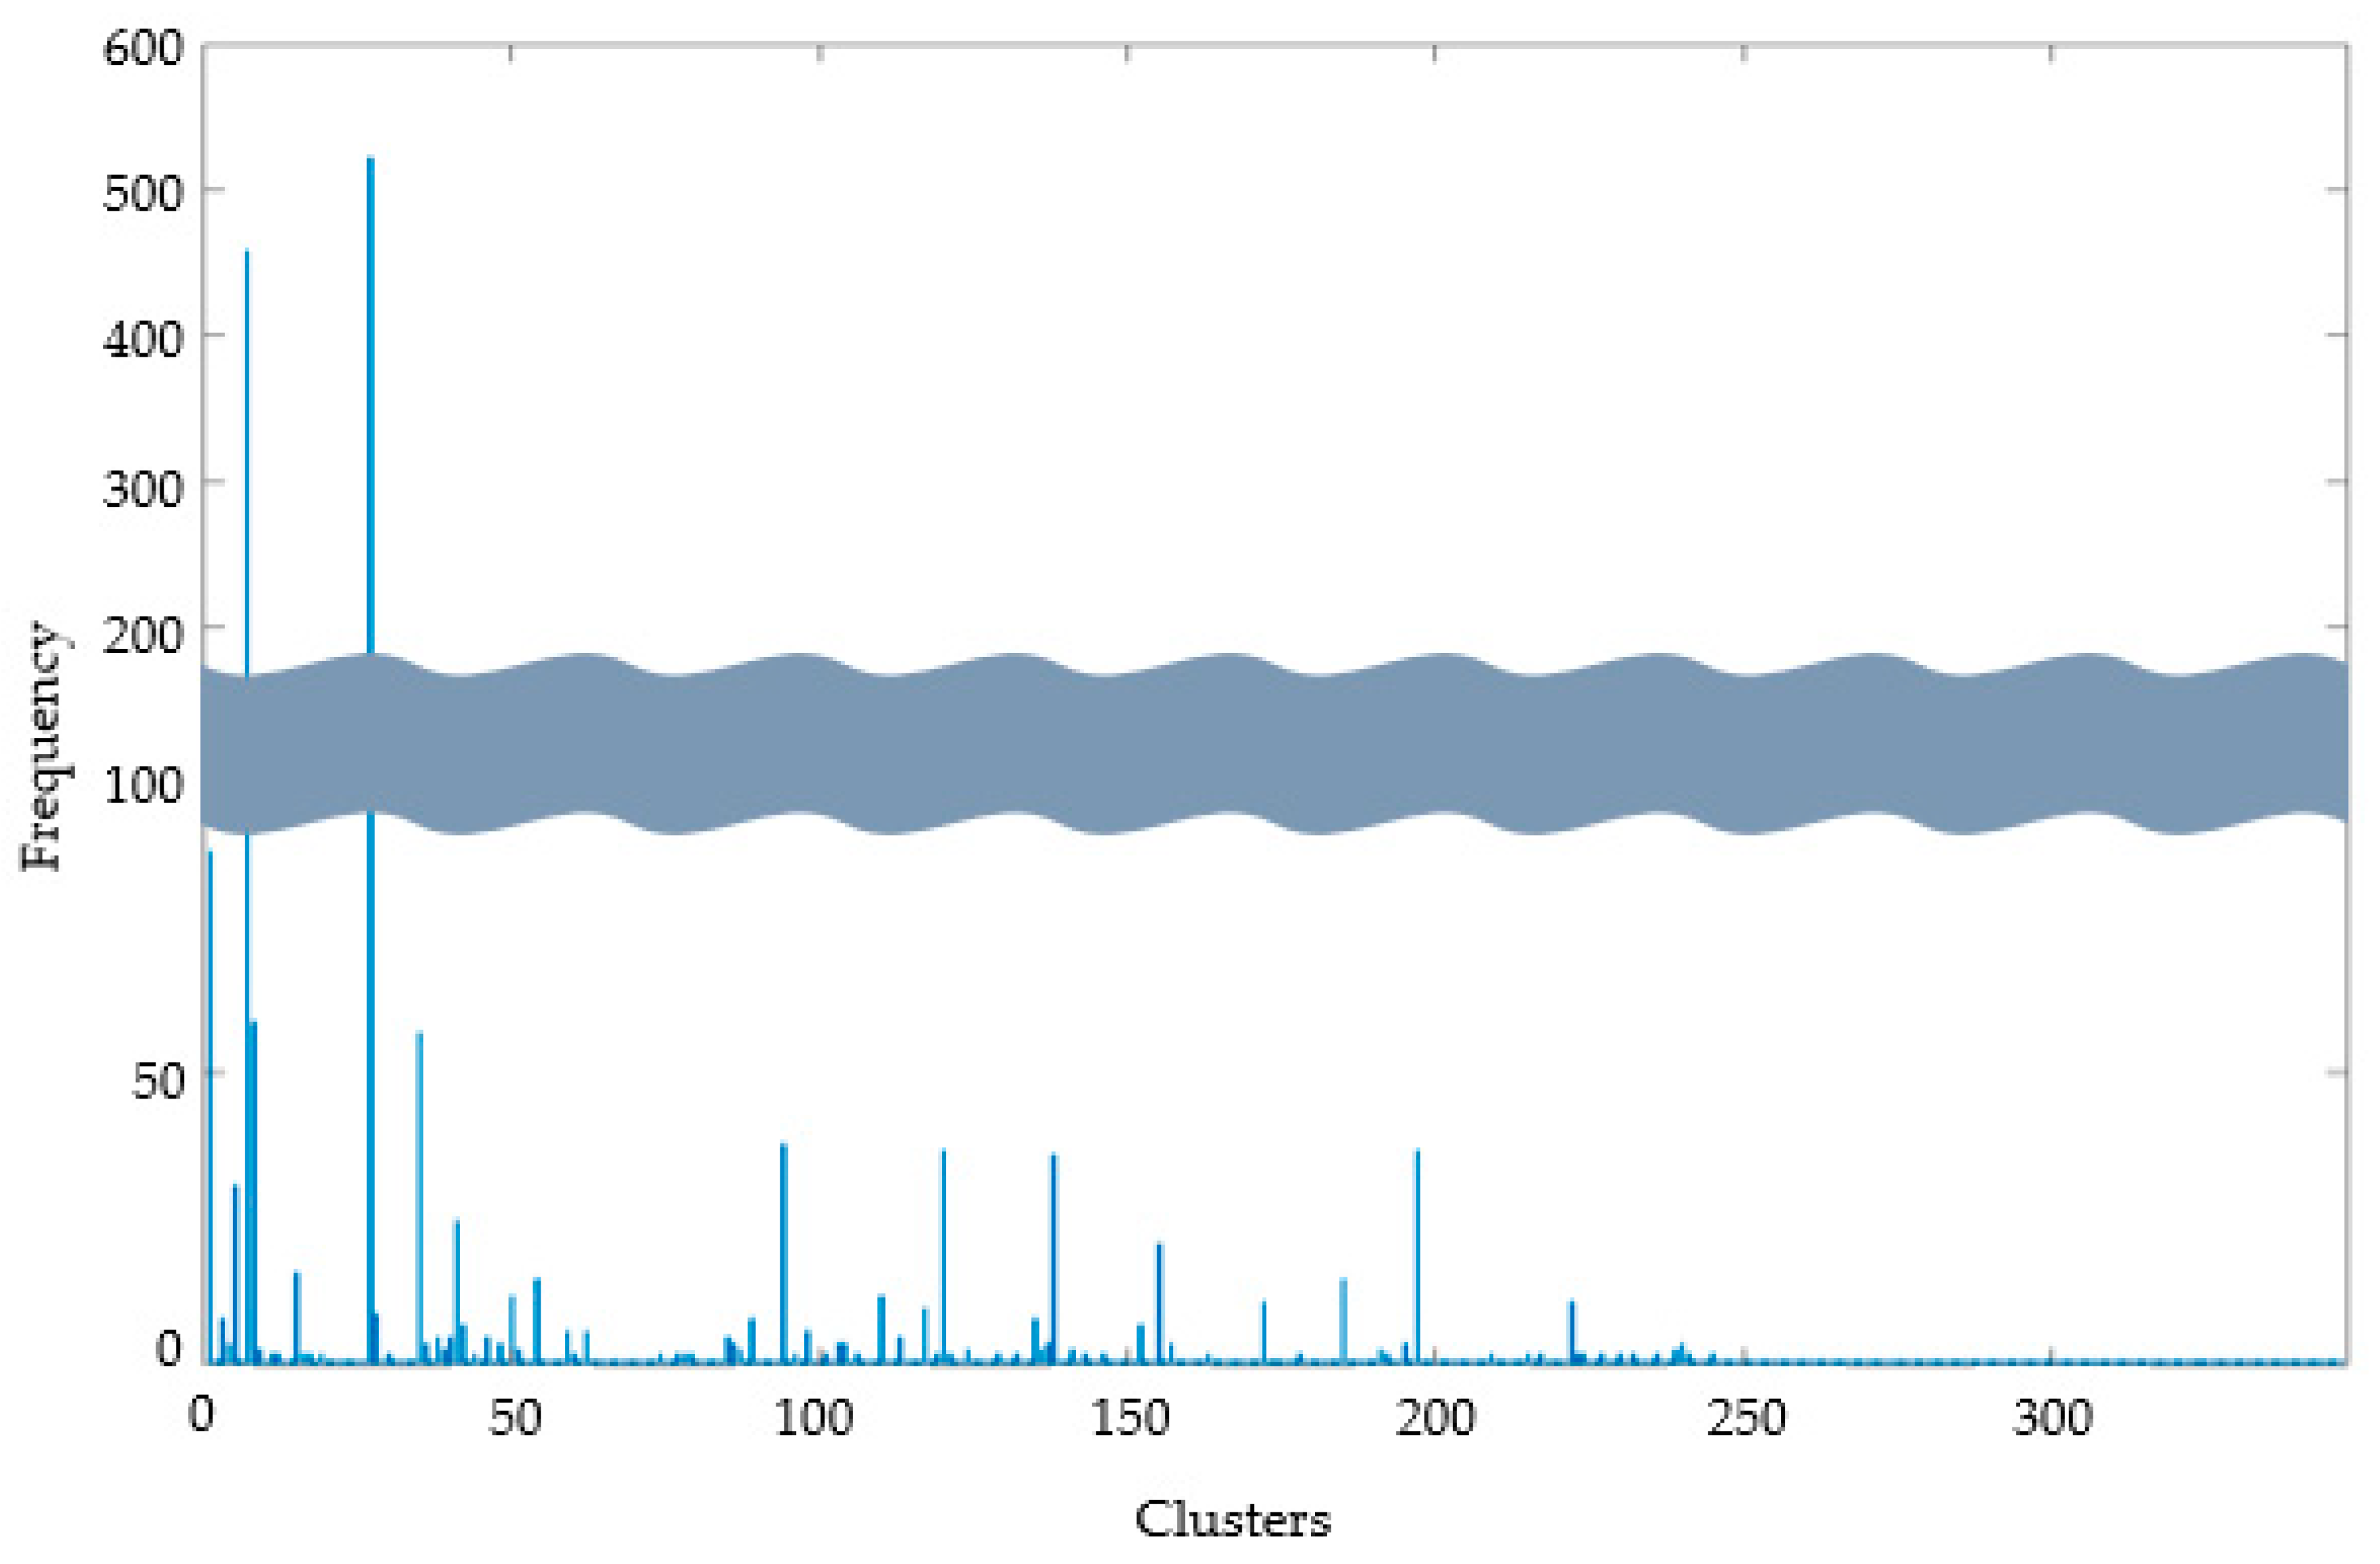
3.3.2. Frequency of Clusters
Figure 10 shows how many navigation situations are clustered at each leaf node. The height represents the frequency and the x-axis corresponds to the order of a dendrogram. The two most frequent clusters show frequencies of 522 and 459, and they accounted for 49.1% of the input data points.
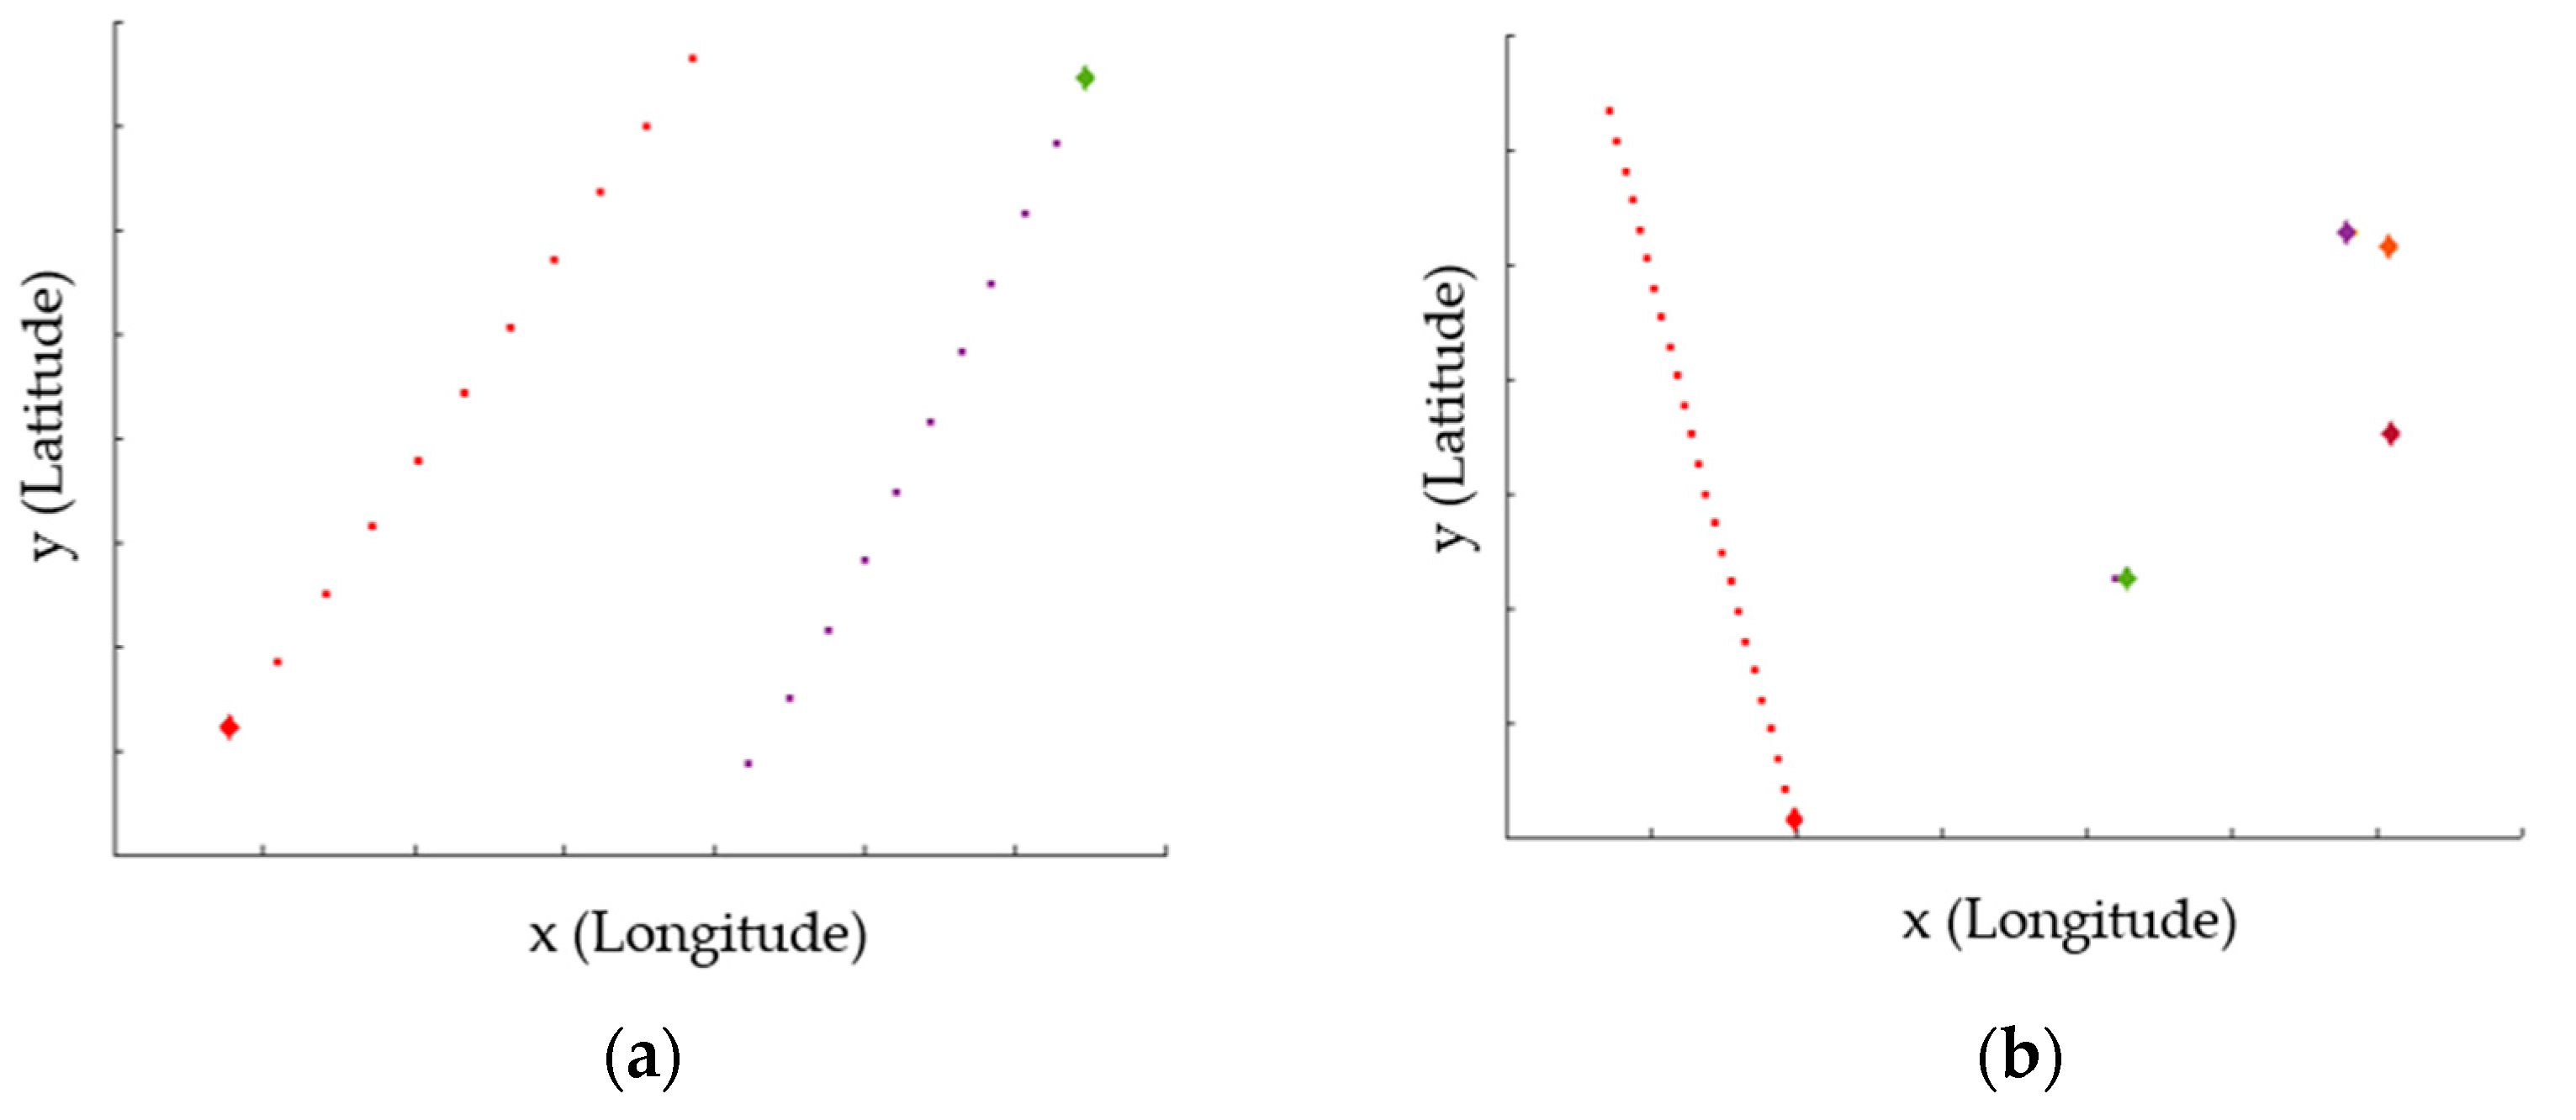
However, it can be confirmed that clusters were connected to the same clade as a cluster with high frequency have a low frequency. For example, in the
Figure 11, the frequency of the 9th cluster(b) connected to the same clade as the 7th cluster(a), which occurred 459 times, is 3. This is because one property of the hamming distance to is to calculate the distance as 1 if the number of vessels is different, even though the combination of a vessel relationship is the same. Although the number of vessels is large in
Figure 12 and they were classified as being in a similar situation because all vessels were passing by the starboard in the same the 7th cluster, the frequency is different because the number of vessels is different.
3.3.3. Ordinary and Extraordinary Situation
The red lines in
Figure 13 are the leaf node locations where 1:1 situations were clustered among leaf nodes of the dendrogram. In general, different clusters can be recognized as connected to the same clade with high similarity, based on the 1:1 navigation situation, and these clusters indicate navigation situations where the hamming distance was less than 2.3 from the corresponding 1:1 navigation situation, as shown in
Figure 13.
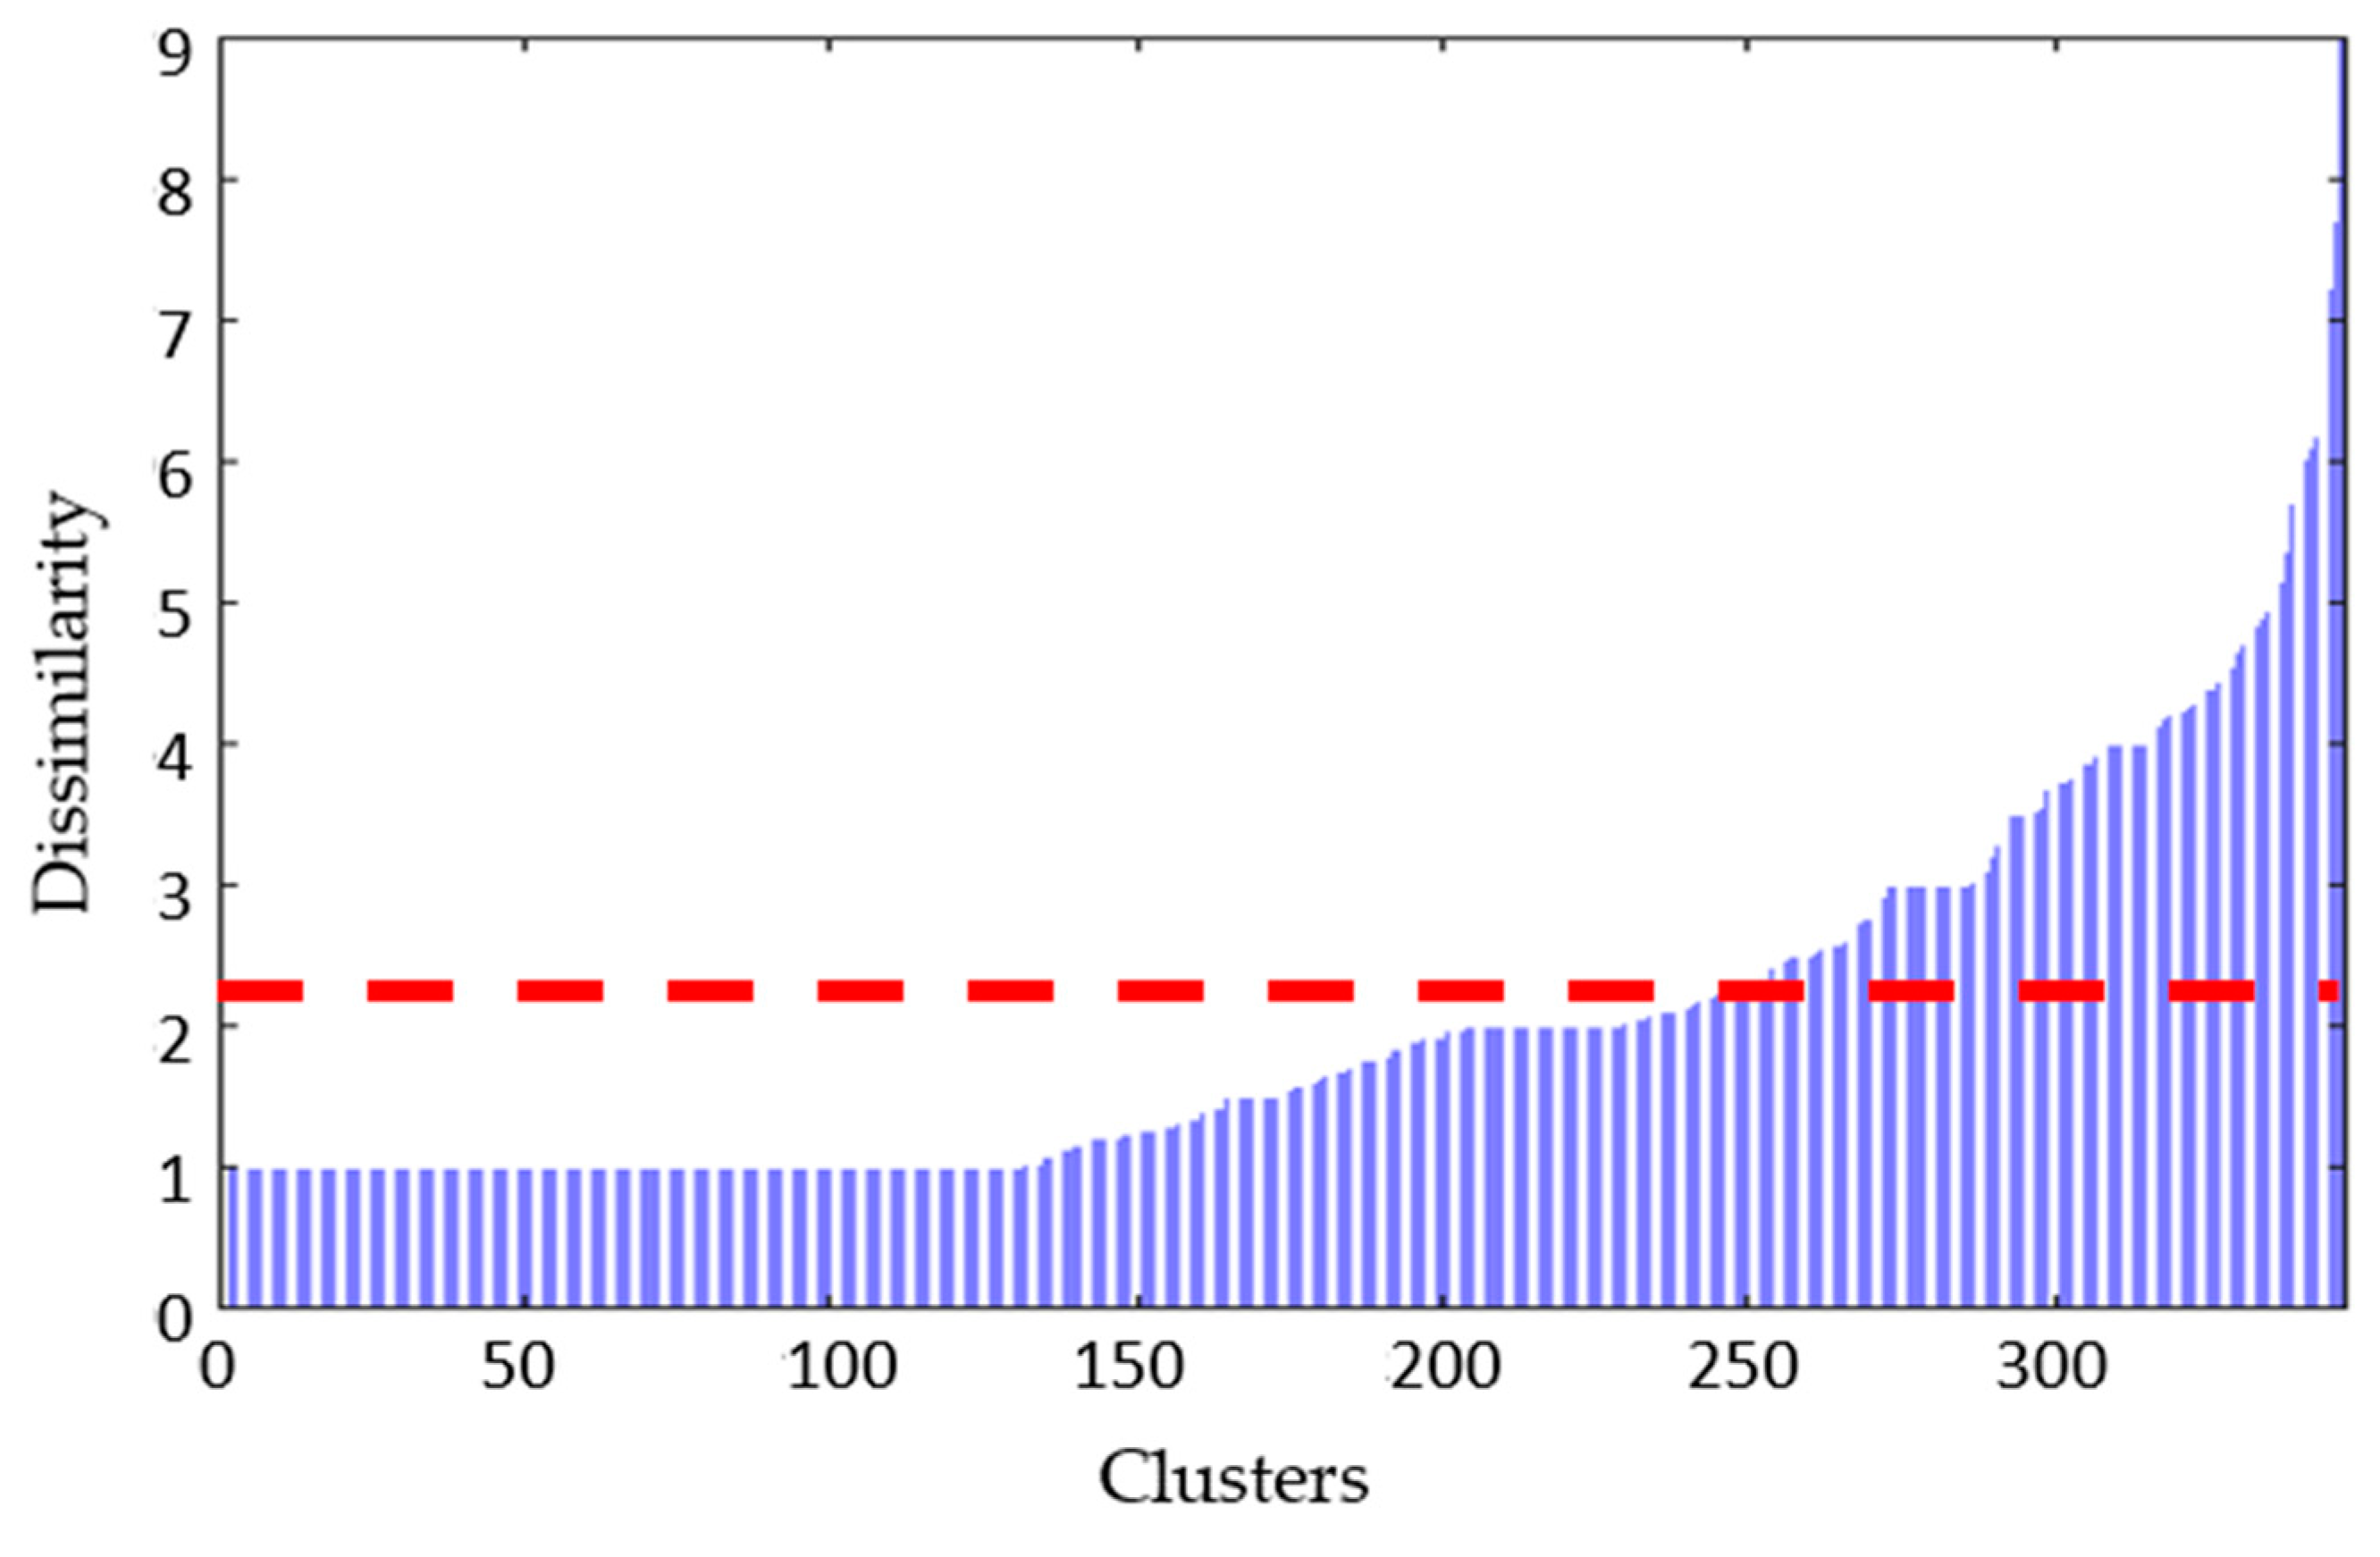
Figure 14 shows the conversion of the hamming distance to the number of different input elements. This figure shows that the clusters can be distinguished into two large two groups based on the dissimilarity value of 2.3. Therefore, these clusters can be distinguished as group (a) and group (b).
Group (a) comprises ordinary navigation situations in which the dissimilarity related to the 1:1 navigation situation was low, and its proportion in the total was 95.2%. Group (b) comprises extraordinary navigation situations that differs from other navigation situations, and its proportion in the total is 4.8%.
3.3.4. Top 20 Frequent Clusters
Table 5 summarizes the 20 most frequent navigation situations. The 27th cluster has 522 distinguished trajectories, accounting for 26.1% of the total, and the second most frequent cluster was the 7th cluster, accounting for 23%. The top 20 clusters in
Table 5 account for 75.7% of the total navigation situation.
4. Discussion
A total of 347 leaf nodes were clustered as a result of hierarchical clustering. Thus, the navigation situation could be distinguished among ordinary navigation situations and extraordinary navigation situations based on the hamming distance (dissimilarity) of the cluster being 2.3.
An ordinary situation is a case in which the hamming distance is less than 2.3 from the 1:1 navigation situation between the own ship and target ship, implying that there are three or fewer ship relationships in the navigation situation. In all navigation situations, ordinary navigation situations occured 95.2% of the time, whereas extraordinary navigation situations occured 4.8% of the time.
Furthermore, the most common navigational situations were confirmed. A navigation situation that passed from the bow directly to the stern direction without crossing the bow or stern direction of the own ship was the most frequently occurring navigation situation, with 11 clusters out of the top 20 navigation situations being related to it. The proportion of these situations in the total was 64.5%. Ships that did not get closer to their ship in the direction of the bow and stern, which occurred 7.5% of the time, were the next most common navigation situation. The third-highest rate of navigation situations was a navigation situation that approached from the port and starboard and passed the bow or stern direction of the own ship, which exhibited a ratio of 3.5%.
However, there are still uncertainties regarding the application of these methods. The encounters with other ships that can occur during a voyage were objectively clustered through this approach, but the passing distance with the encountered ships, elapsed time to termination of the situation, etc. were not considered in the suggested method.
5. Conclusions
The MASS collision avoidance system is one of the core systems of MASS. However, compared to this importance, because the scenario design being used in the test was subjective and did not reflect the characteristics of human-operated ships encountered by the actual MASS, it is necessary to develop an objective scenario. Therefore, the navigation situation of human-operated ships was distinguished for the validation of systematic MASS in this study. The navigation situations of human-operated ships were objectively analyzed using AIS data, and the navigation situations were classified through a data-driven approach of data preprocessing, feature extraction, and hierarchical clustering.
Therefore, by comparing cluster similarity and frequency, the navigation situations that a ship can encounter during navigation were divided into ordinary and extraordinary navigation situations. Ordinary navigation situations account for 95.2% of total navigation situations, and extraordinary navigation situations occur at a rate of 4.8%. The top 20 situations, which account for 75% of the total navigation situations, could be classified along with the occurrence rate.
This research proposed a data-driven clustering model for human-operated ship navigation situations. As a result, the actual navigation conditions of human-operated ships were objectively distinguished. The ratio of ordinary and extraordinary situations, which are two major categories of the proposed navigation situation, and the ratio of the detailed navigation situations constituting it, seems to be a more objective basis for collision avoidance algorithm test scenario design.
However, in general, because the sea area where the data analysis was applied is a region with the traffic is concentrated from north to south and south to north, the navigation situations comprised an overwhelming number of passing situations, the extracted features could only explain ship navigation relationship using relative bearings, excluding other navigational aspects. The movement of the own ship was not considered. Such limitations of this study will be supplemented through future work.
Author Contributions
Conceptualization, T.H. and I.-H.Y.; methodology, T.H.; software, T.H.; formal analysis, T.H.; data curation, I.-H.Y.; writing—original draft preparation, T.H.; writing—review and editing, I.-H.Y.; visualization, T.H.; supervision, I.-H.Y.; project administration, I.-H.Y.; funding acquisition, I.-H.Y. All authors have read and agreed to the published version of the manuscript.
Funding
This research was supported by the ‘Development of Autonomous Ship Technology (20200615)’ funded by the Ministry of Oceans and Fisheries (MOF, Korea).
Institutional Review Board Statement
Not applicable.
Informed Consent Statement
Not applicable.
Data Availability Statement
The data used to support the findings of this study are available from the corresponding author upon request.
Conflicts of Interest
The authors declare no conflict of interest.
References
- Zhang, L.; Wang, H.; Meng, Q.; Xie, H. Ship accident consequences and contributing factors analyses using ship accident investigation reports. Proc. Inst. Mech. Eng. Part O J. Risk Reliab. 2019, 233, 35–47. [Google Scholar] [CrossRef]
- Ceyhun, G.C. The impact of shipping accidents on marine environment: A study of Turkish seas. Eur. Sci. J. 2014, 10, 10–23. [Google Scholar]
- Komianos, A. The autonomous shipping era. operational, regulatory, and quality challenges. TransNav Int. J. Mar. Navig. Saf. Sea Transp. 2018, 12, 335–348. [Google Scholar] [CrossRef] [Green Version]
- Murray, B.; Perera, L.P. A data-driven approach to vessel trajectory prediction for safe autonomous ship operations. In Proceedings of the 2018 Thirteenth International Conference on Digital Information Management (ICDIM), Berlin, Germany, 24–26 September 2018; pp. 240–247. [Google Scholar]
- Xu, H.; Oliveira, P.; Soares, C.G. L1 adaptive backstepping control for path-following of underactuated marine surface ships. Eur. J. Control 2021, 58, 357–372. [Google Scholar] [CrossRef]
- Xu, H.; Fossen, T.I.; Soares, C.G. Uniformly semiglobally exponential stability of vector field guidance law and autopilot for path-following. Eur. J. Control 2020, 53, 88–97. [Google Scholar] [CrossRef]
- Xu, H.; Rong, H.; Soares, C.G. Use of AIS data for guidance and control of path-following autonomous vessels. Ocean Eng. 2019, 194, 106635. [Google Scholar] [CrossRef]
- Perera, L.P.; Ferrari, V.; Santos, F.P.; Hinostroza, M.A.; Soares, C.G. Experimental evaluations on ship autonomous navigation and collision avoidance by intelligent guidance. IEEE J. Ocean Eng. 2014, 40, 374–387. [Google Scholar] [CrossRef]
- Son, N.; Kim, S. On the sea trial test for the validation of an autonomous collision avoidance system of unmanned surface vehicle. In Proceedings of the ARAGON, OCEANS 2018 MTS/IEEE Charleston, Charleston, SC, USA, 22–25 October 2018; pp. 1–5. [Google Scholar]
- Shen, H.; Hashimoto, H.; Matsuda, A.; Taniguchi, Y.; Terada, D.; Guo, C. Automatic collision avoidance of multiple ships based on deep Q-learning. Appl. Ocean Res. 2019, 86, 268–288. [Google Scholar] [CrossRef]
- Woo, J.; Kim, N. Collision avoidance for an unmanned surface vehicle using deep reinforcement learning. Ocean Eng. 2020, 199, 107001. [Google Scholar] [CrossRef]
- Pedersen, T.A.; Glomsrud, J.A.; Ruud, E.; Simonsen, A.; Sandrib, J.; Eriksen, B.H. Towards simulation-based verification of autonomous navigation systems. Saf. Sci. 2020, 129, 104799. [Google Scholar] [CrossRef]
- Porres, I.; Azimi, S.; Lilius, J. Scenario-based testing of a ship collision avoidance system. In Proceedings of the 2020 46th Euromicro Conference on Software Engineering and Advanced Applications (SEAA), Portoroz, Slovenia, 26–28 August 2020; pp. 545–552. [Google Scholar]
- Huang, Y.; van Gelder, P. Collision risk measure for triggering evasive actions of maritime autonomous surface ships. Saf. Sci. 2020, 127, 104708. [Google Scholar] [CrossRef]
- Chun, D.; Roh, M.; Lee, H.; Ha, J.; Yu, D. Deep reinforcement learning-based collision avoidance for an autonomous ship. Ocean Eng. 2021, 234, 109216. [Google Scholar] [CrossRef]
- Lazarowska, A. Verification of a Deterministic Ship’s Safe Trajectory Planning Algorithm from Different Ships’ Perspectives and with Changing Strategies of Target Ships. TransNav Int. J. Mar. Navig. Saf. Sea Transp. 2021, 15, 623–628. [Google Scholar] [CrossRef]
- Gil, M. A concept of critical safety area applicable for an obstacle-avoidance process for manned and autonomous ships. Reliab. Eng. Syst. Saf. 2021, 214, 107806. [Google Scholar] [CrossRef]
- Szlapczynski, R.; Szlapczynska, J. A ship domain-based model of collision risk for near-miss detection and Collision Alert Systems. Reliab. Eng. Syst. Saf. 2021, 214, 107766. [Google Scholar] [CrossRef]
- Xiao, F.; Ligteringen, H.; Van Gulijk, C.; Ale, B. Comparison study on AIS data of ship traffic behavior. Ocean Eng. 2015, 95, 84–93. [Google Scholar] [CrossRef] [Green Version]
- IMO. Available online: https://wwwcdn.imo.org/localresources/en/OurWork/Safety/Documents/AIS/Resolution%20A.1106(29).pdf (accessed on 15 December 2021).
- Guo, S.; Mou, J.; Chen, L.; Chen, P. An Anomaly Detection Method for AIS Trajectory Based on Kinematic Interpolation. J. Mar. Sci. Eng. 2021, 9, 609. [Google Scholar] [CrossRef]
- Khalid, S.; Khalil, T.; Nasreen, S. A survey of feature selection and feature extraction techniques in machine learning. In Proceedings of the 2014 Science and Information Conference, London, UK, 27–29 August 2014; pp. 372–378. [Google Scholar]
- Perera, L.P.; Soares, C.G. Collision risk detection and quantification in ship navigation with integrated bridge systems. Ocean Eng. 2015, 109, 344–354. [Google Scholar] [CrossRef]
- Sui, B.; Lubbe, N.; Bärgman, J. A clustering approach to developing car-to-two-wheeler test scenarios for the assessment of Automated Emergency Braking in China using in-depth Chinese crash data. Accid. Anal. Prev. 2019, 132, 105242. [Google Scholar] [CrossRef]
- Taheri, R.; Ghahramani, M.; Javidan, R.; Shojafar, M.; Pooranian, Z.; Conti, M. Similarity-based Android malware detection using Hamming distance of static binary features. Future Gener. Comput. Syst. 2020, 105, 230–247. [Google Scholar] [CrossRef] [Green Version]
- Saraçli, S.; Doğan, N.; Doğan, İ. Comparison of hierarchical cluster analysis methods by cophenetic correlation. J. Inequalities Appl. 2013, 2013, 203. [Google Scholar] [CrossRef]
- Kaur, P.J. Cluster quality based performance evaluation of hierarchical clustering method. In Proceedings of the 2015 1st International Conference on Next Generation Computing Technologies (NGCT), Dehradun, India, 4–5 September 2015; pp. 649–653. [Google Scholar]
- Sander, J.; Qin, X.; Lu, Z.; Niu, N.; Kovarsky, A. Automatic extraction of clusters from hierarchical clustering representations. In Pacific-Asia Conference on Knowledge Discovery and Data Mining; Springer: Berlin/Heidelberg, Germany, 2003; pp. 75–87. [Google Scholar]
Figure 1.
Workflow of methodology.
Figure 1.
Workflow of methodology.
Figure 2.
Selected target sea area.
Figure 2.
Selected target sea area.
Figure 3.
Observations of the data examination: (a) inconsistent time-series, (b) COG distribution, (c) heading distribution.
Figure 3.
Observations of the data examination: (a) inconsistent time-series, (b) COG distribution, (c) heading distribution.
Figure 4.
Trajectory extraction process.
Figure 4.
Trajectory extraction process.
Figure 5.
Correlation coefficient plot between COG and heading.
Figure 5.
Correlation coefficient plot between COG and heading.
Figure 6.
Concept of feature extraction: (a) relative bearing change (Q1-Q1-Q4), (b) relative bearing change (Q1-Q2-Q3), (c) relative bearing change (Q4-Q3-Q2).
Figure 6.
Concept of feature extraction: (a) relative bearing change (Q1-Q1-Q4), (b) relative bearing change (Q1-Q2-Q3), (c) relative bearing change (Q4-Q3-Q2).
Figure 7.
Example of input data: (a) a combined navigation situation consisting of navigation situations corresponding to features 1, 3, 11, and 15, and an example of conversion to a row vector, (b) a combined navigation situation consisting of navigation situations corresponding to features 3, 7, and 11, and an example of conversion to a row vector.
Figure 8.
Hamming distance for calculation of similarity.
Figure 8.
Hamming distance for calculation of similarity.
Figure 9.
Silhouette value corresponding to the number of clusters.
Figure 9.
Silhouette value corresponding to the number of clusters.
Figure 10.
Dendrogram of hierarchical clustering.
Figure 10.
Dendrogram of hierarchical clustering.
Figure 11.
Example of different frequencies in similar navigation situations: (a) trajectory example of cluster 7, (b) trajectory example of cluster 9.
Figure 11.
Example of different frequencies in similar navigation situations: (a) trajectory example of cluster 7, (b) trajectory example of cluster 9.
Figure 12.
Frequency of clusters.
Figure 12.
Frequency of clusters.
Figure 13.
Clustering of 1:1 vessels and similar navigation situations: (a) a cluster group with a hamming distance of less than 2.3 from a 1:1 situation, (b) a cluster group with a hamming distance of larger than 2.3 from 1:1 situation.
Figure 13.
Clustering of 1:1 vessels and similar navigation situations: (a) a cluster group with a hamming distance of less than 2.3 from a 1:1 situation, (b) a cluster group with a hamming distance of larger than 2.3 from 1:1 situation.
Figure 14.
Hamming distance (nubmer of different in input elements).
Figure 14.
Hamming distance (nubmer of different in input elements).
Table 1.
Summary of related works.
Table 1.
Summary of related works.
| Related Works | Method | Test | Scenario | Design Rationale |
|---|
| Perera, L. P. et al. (2014) | Experimental evaluation of autonomous ship collision avoidance | Scenario base | 5 cases | COLREG |
| Son et al. (2018) | Verification of autonomous collision avoidance in real-ship experiment | Scenario base | 3 cases | COLREG |
| Shen, H et al. (2019) | Collision avoidance model using deep Q-learning | Scenario base | 6 cases | COLREG |
| Woo, J et al. (2020) | Collision avoidance algorithm using deep reinforcement learning | Scenario base | 2 cases | COLREG |
| Pedersen et al. (2020) | Verification of autonomous navigation system in simulation experiment | Scenario base | 3 cases | Automated scenario generator tool |
| Porres et al. (2020) | AI-based scenario production algorithm | Scenario base | 30,000 cases
(1:1 situation) | AI-based scenario search and production algorithm |
| Huang, et al. (2020) | Collision risk measure for collision avoidance algorithm | Scenario base | 3 cases | Arbitary desing |
| Chun et al. (2021) | Collision avoidance algorithm using deep reinforcement learning | Scenario base | 2 cases | Arbitrary design |
| A. Lazarowska (2021) | Autonomous ships safe trajectory planning algorithm | Scenario base | 4 cases | Arbitrary design |
| Gil, M (2021) | Critical safety area for the obstacle-avoidance algorithm | Scenario base | 2 cases | Arbitrary design |
| Szlapczynski, R et al. (2021) | Ship domain-based model of ship collision risk | Scenario base | 3 cases | Arbitary desing |
Table 2.
Criteria list.
| Criteria | Object Ship | Description |
|---|
| Gross tonnage | Own ship | 100,000–150,000 GT |
| SOG of own ship | Own ship | Over 5kts |
| Time range | Target ship | Same time range with own ship |
| Distance | Target ship | Less than 3 miles with own ship |
Table 3.
Feature list.
| Feature Number | Navigation Situaion | Quadrant Change |
|---|
| 1 | Pass-1 | Q1-Q1-Q4 |
| 2 | Pass-2 | Q2-Q2-Q3 |
| 3 | Cross-1 | Q1-Q1-Q2 |
| 4 | Cross-2 | Q1-Q1-Q3 |
| 5 | Cross-3 | Q1-Q2-Q2 |
| 6 | Cross-4 | Q1-Q2-Q3 |
| 7 | Cross-5 | Q2-Q1-Q1 |
| 8 | Cross-6 | Q2-Q1-Q4 |
| 9 | Cross-7 | Q2-Q2-Q1 |
| 10 | Cross-8 | Q2-Q2-Q4 |
| 11 | Overtake-1 | Q3-Q3-Q1 |
| 12 | Overtake-2 | Q3-Q3-Q2 |
| 13 | Overtake-3 | Q4-Q4-Q1 |
| 14 | Overtake-4 | Q4-Q4-Q2 |
| 15 | Away from forward-1 | Q1-Q1-Q1 |
| 16 | Away from forward-2 | Q2-Q2-Q2 |
| 17 | Away from stern-1 | Q3-Q3-Q3 |
| 18 | Away from stern-2 | Q3-Q3-Q4 |
| 19 | Away from stern-3 | Q3-Q4-Q3 |
| 20 | Away from stern-4 | Q3-Q4-Q4 |
| 21 | Away from stern-5 | Q4-Q3-Q3 |
| 22 | Away from stern-6 | Q4-Q3-Q4 |
| 23 | Away from stern-6 | Q4-Q4-Q3 |
| 24 | Away from stern-6 | Q4-Q4-Q4 |
Table 4.
Cophenetic correlation coefficient.
Table 4.
Cophenetic correlation coefficient.
| Linkage | Cophenetic Correlation Coefficient |
|---|
| Average | 0.8949 |
| Single | 0.8060 |
| Complete | 0.7273 |
| Weighted | 0.6703 |
Table 5.
Top 20 frequent clusters.
Table 5.
Top 20 frequent clusters.
| Cluster Number | Navigation Situation Description | Frequency (%) | Accumulated Rate (%) |
|---|
| 27th | Pass port | 1:1 | 522 (26.1) | 26.1 |
| 7th | Pass starboard | 1:1 | 459 (23.0) | 49.1 |
| 1st | Pass port and starboard | 1:2 (1 and 1) | 88 (4.4) | 53.5 |
| 8th | Pass port | 1:2 | 59 (3.0) | 56.5 |
| 35th | Pass starboard | 1:2 | 57 (2.9) | 59.3 |
| 94th | Away from starboard bow | 1:1 | 38 (1.9) | 61.2 |
| 120th | Away from starboard quarter | 1:1 | 37 (1.9) | 63.1 |
| 197th | Away from port bow | 1:1 | 37 (1.9) | 64.9 |
| 138th | Away from port quarter | 1:1 | 36 (1.8) | 66.7 |
| 5th | Pass port and starboard | 1:3 (2 and 1) | 31 (1.6) | 68.3 |
| 41th | Pass port and starboard | 1:3 (1 and 2) | 25 (1.3) | 69.5 |
| 155th | Crossing bow (starboard bow to port quarter) | 1:1 | 21 (1.1) | 70.6 |
| 15th | Pass port | 1:3 | 16 (0.8) | 71.4 |
| 54th | Pass starboard | 1:3 | 15 (0.8) | 72.1 |
| 185th | Crossing bow (port bow to starboard quarter) | 1:1 | 15 (0.8) | 72.9 |
| 50th | Pass port and starboard | 1:4 (3 and 1) | 12 (0.6) | 73.5 |
| 110th | Crossing bow (starboard bow to port bow) | 1:1 | 12 (0.6) | 74.1 |
| 172th | Crossing stern (port bow to starboard quarter) | 1:1 | 11 (0.6) | 74.6 |
| 222th | Crossing stern (starboard bow to port quarter) | 1:1 | 11 (0.6) | 75.2 |
| 117th | Pass port and starboard quarter away | 1:2 (1 and 1) | 10 (0.5) | 75.7 |
| Publisher’s Note: MDPI stays neutral with regard to jurisdictional claims in published maps and institutional affiliations. |
© 2021 by the authors. Licensee MDPI, Basel, Switzerland. This article is an open access article distributed under the terms and conditions of the Creative Commons Attribution (CC BY) license (https://creativecommons.org/licenses/by/4.0/).


