
Scale Model Experiment on Local Scour around Submarine Pipelines under Bidirectional Tidal Currents


Abstract
:1. Introduction
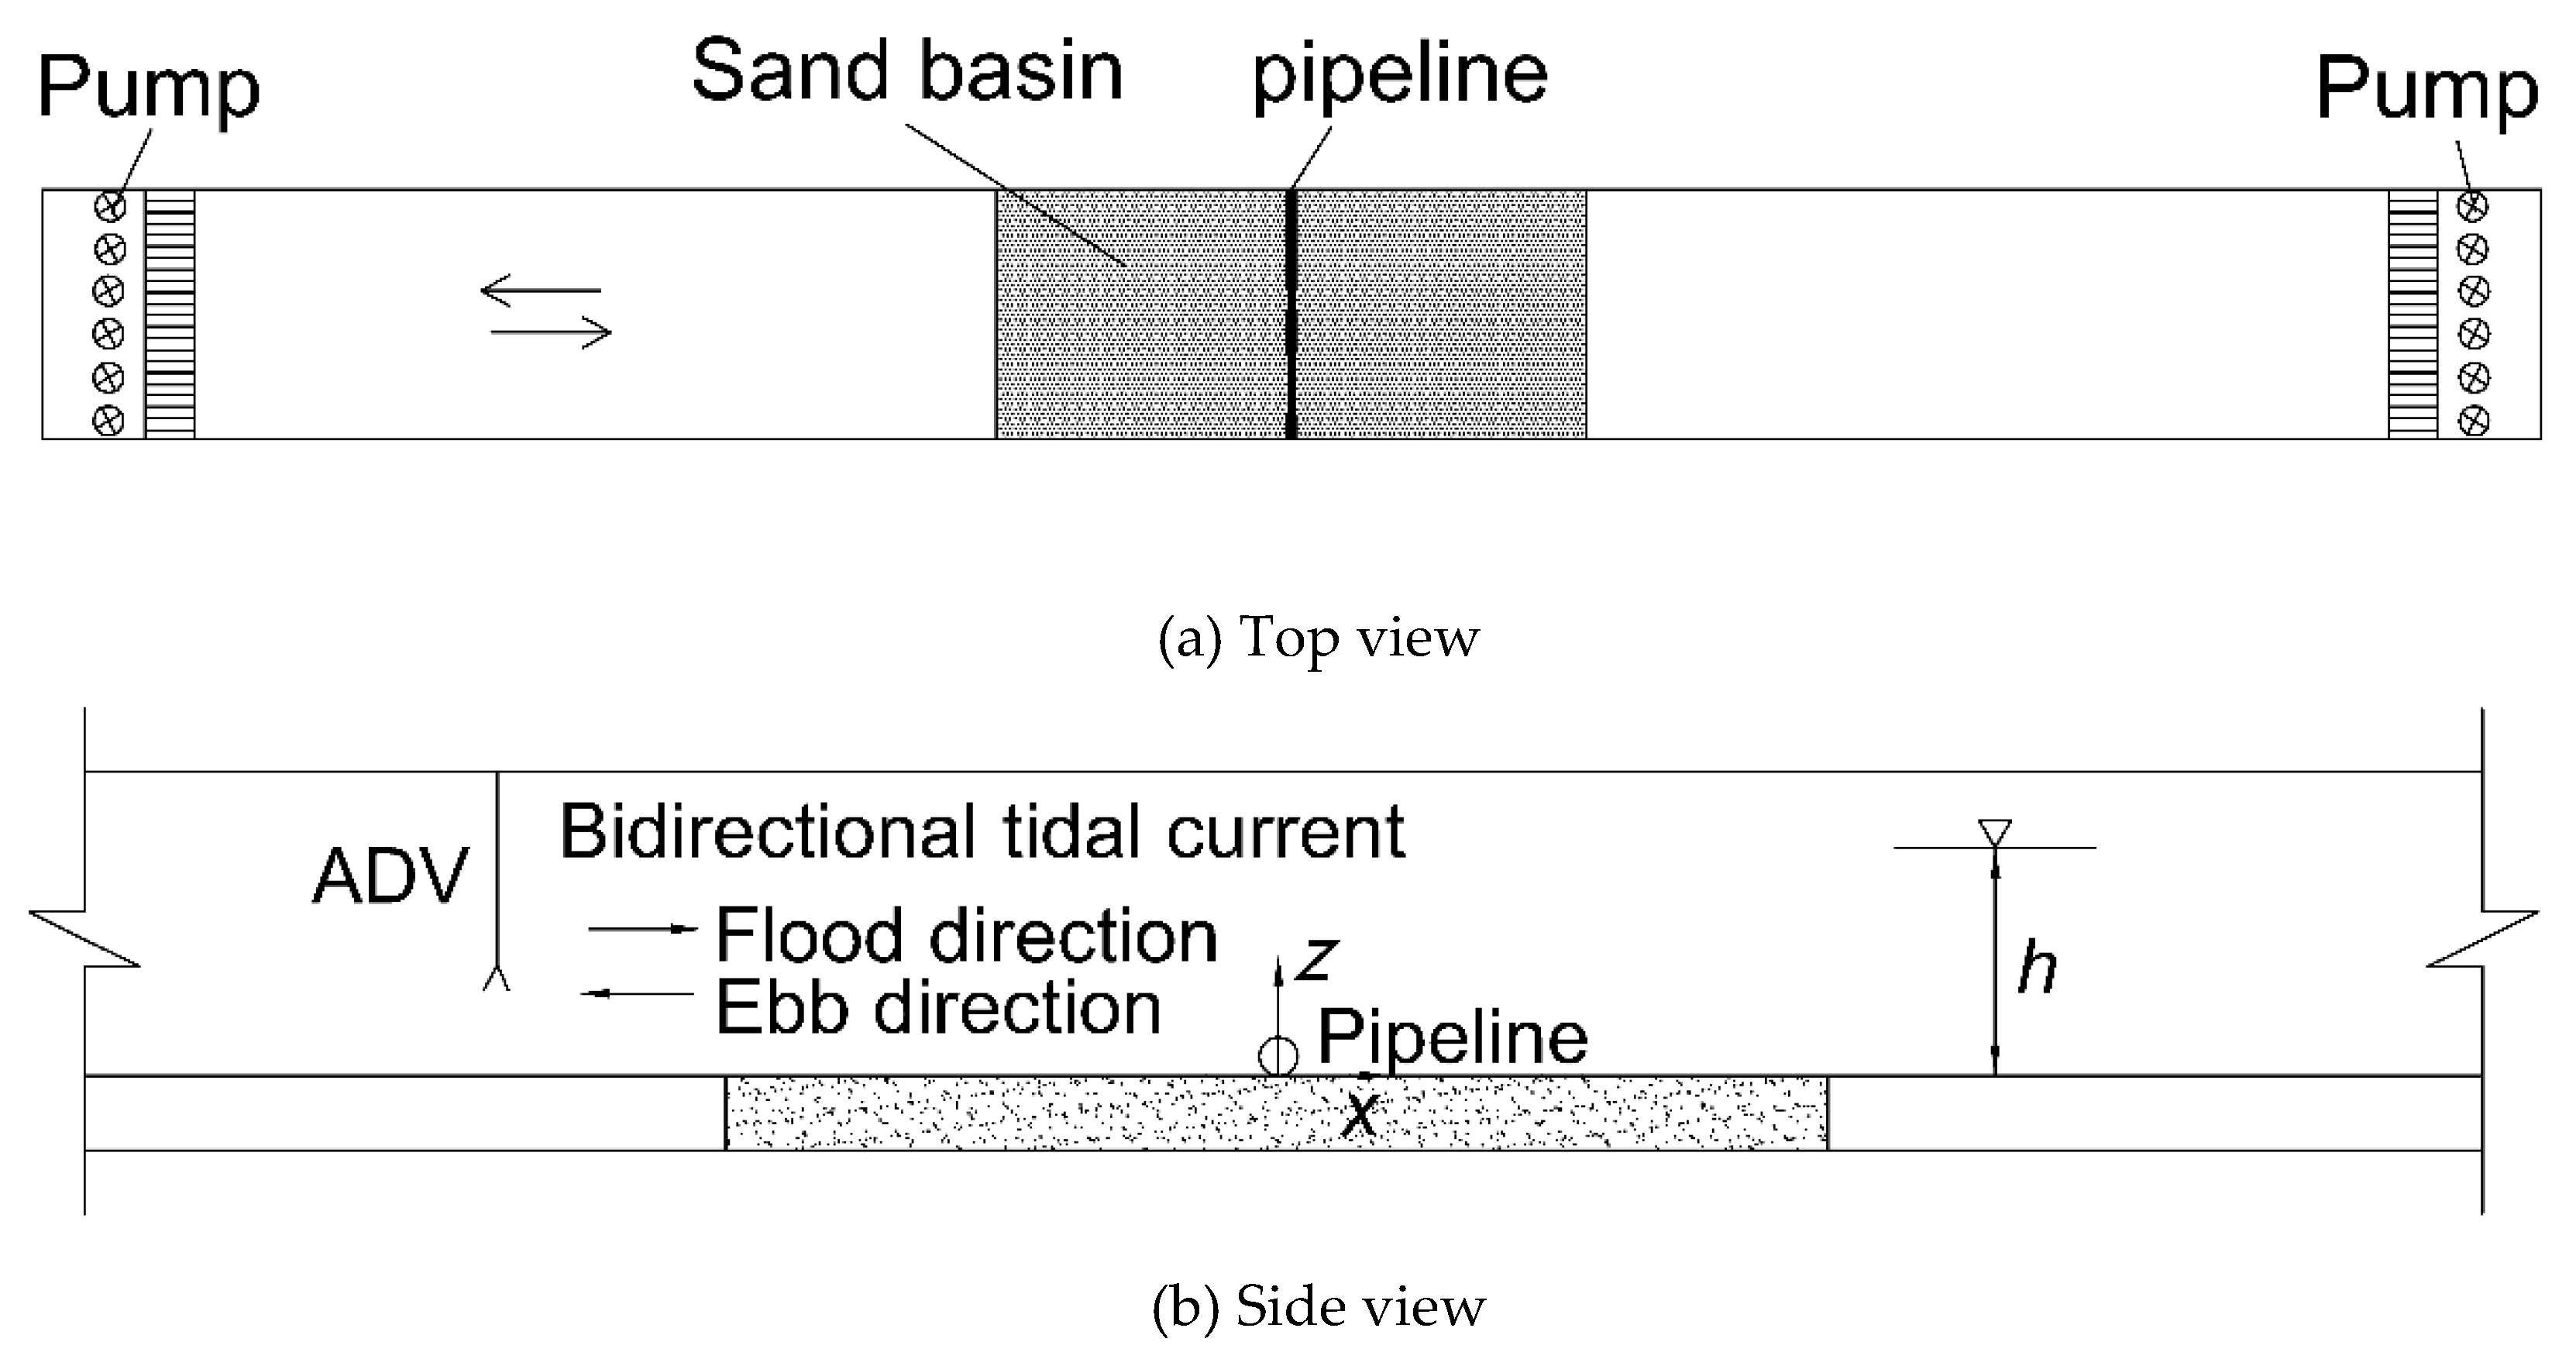
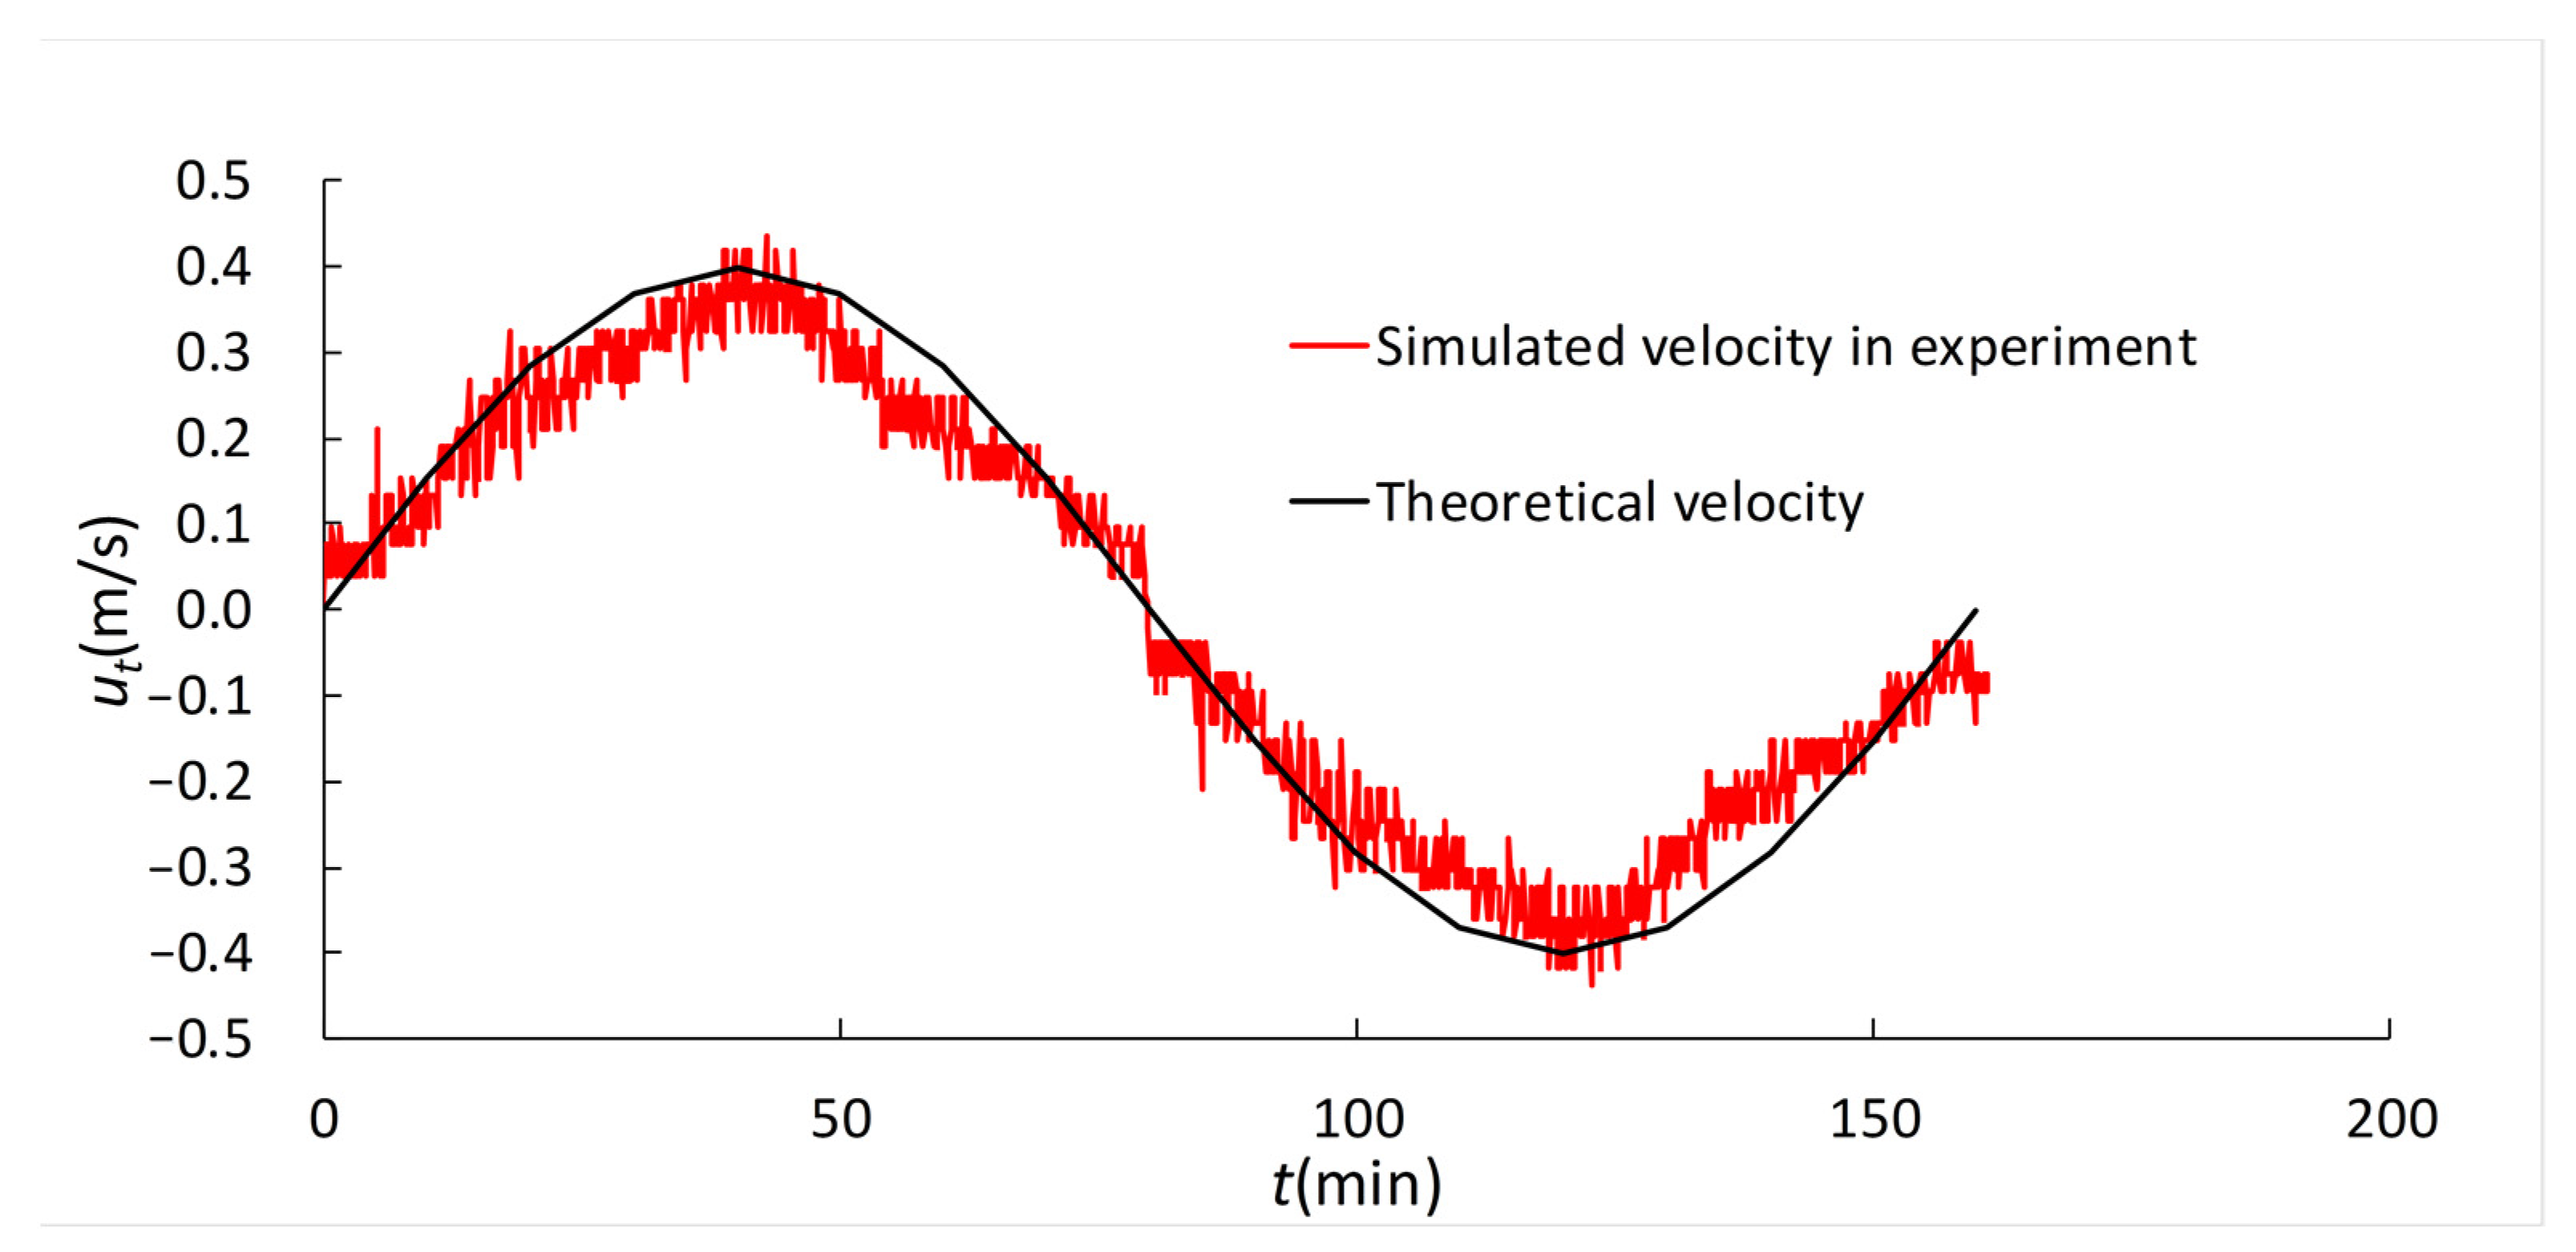
2. Experiment Setup
3. Result and Discussion
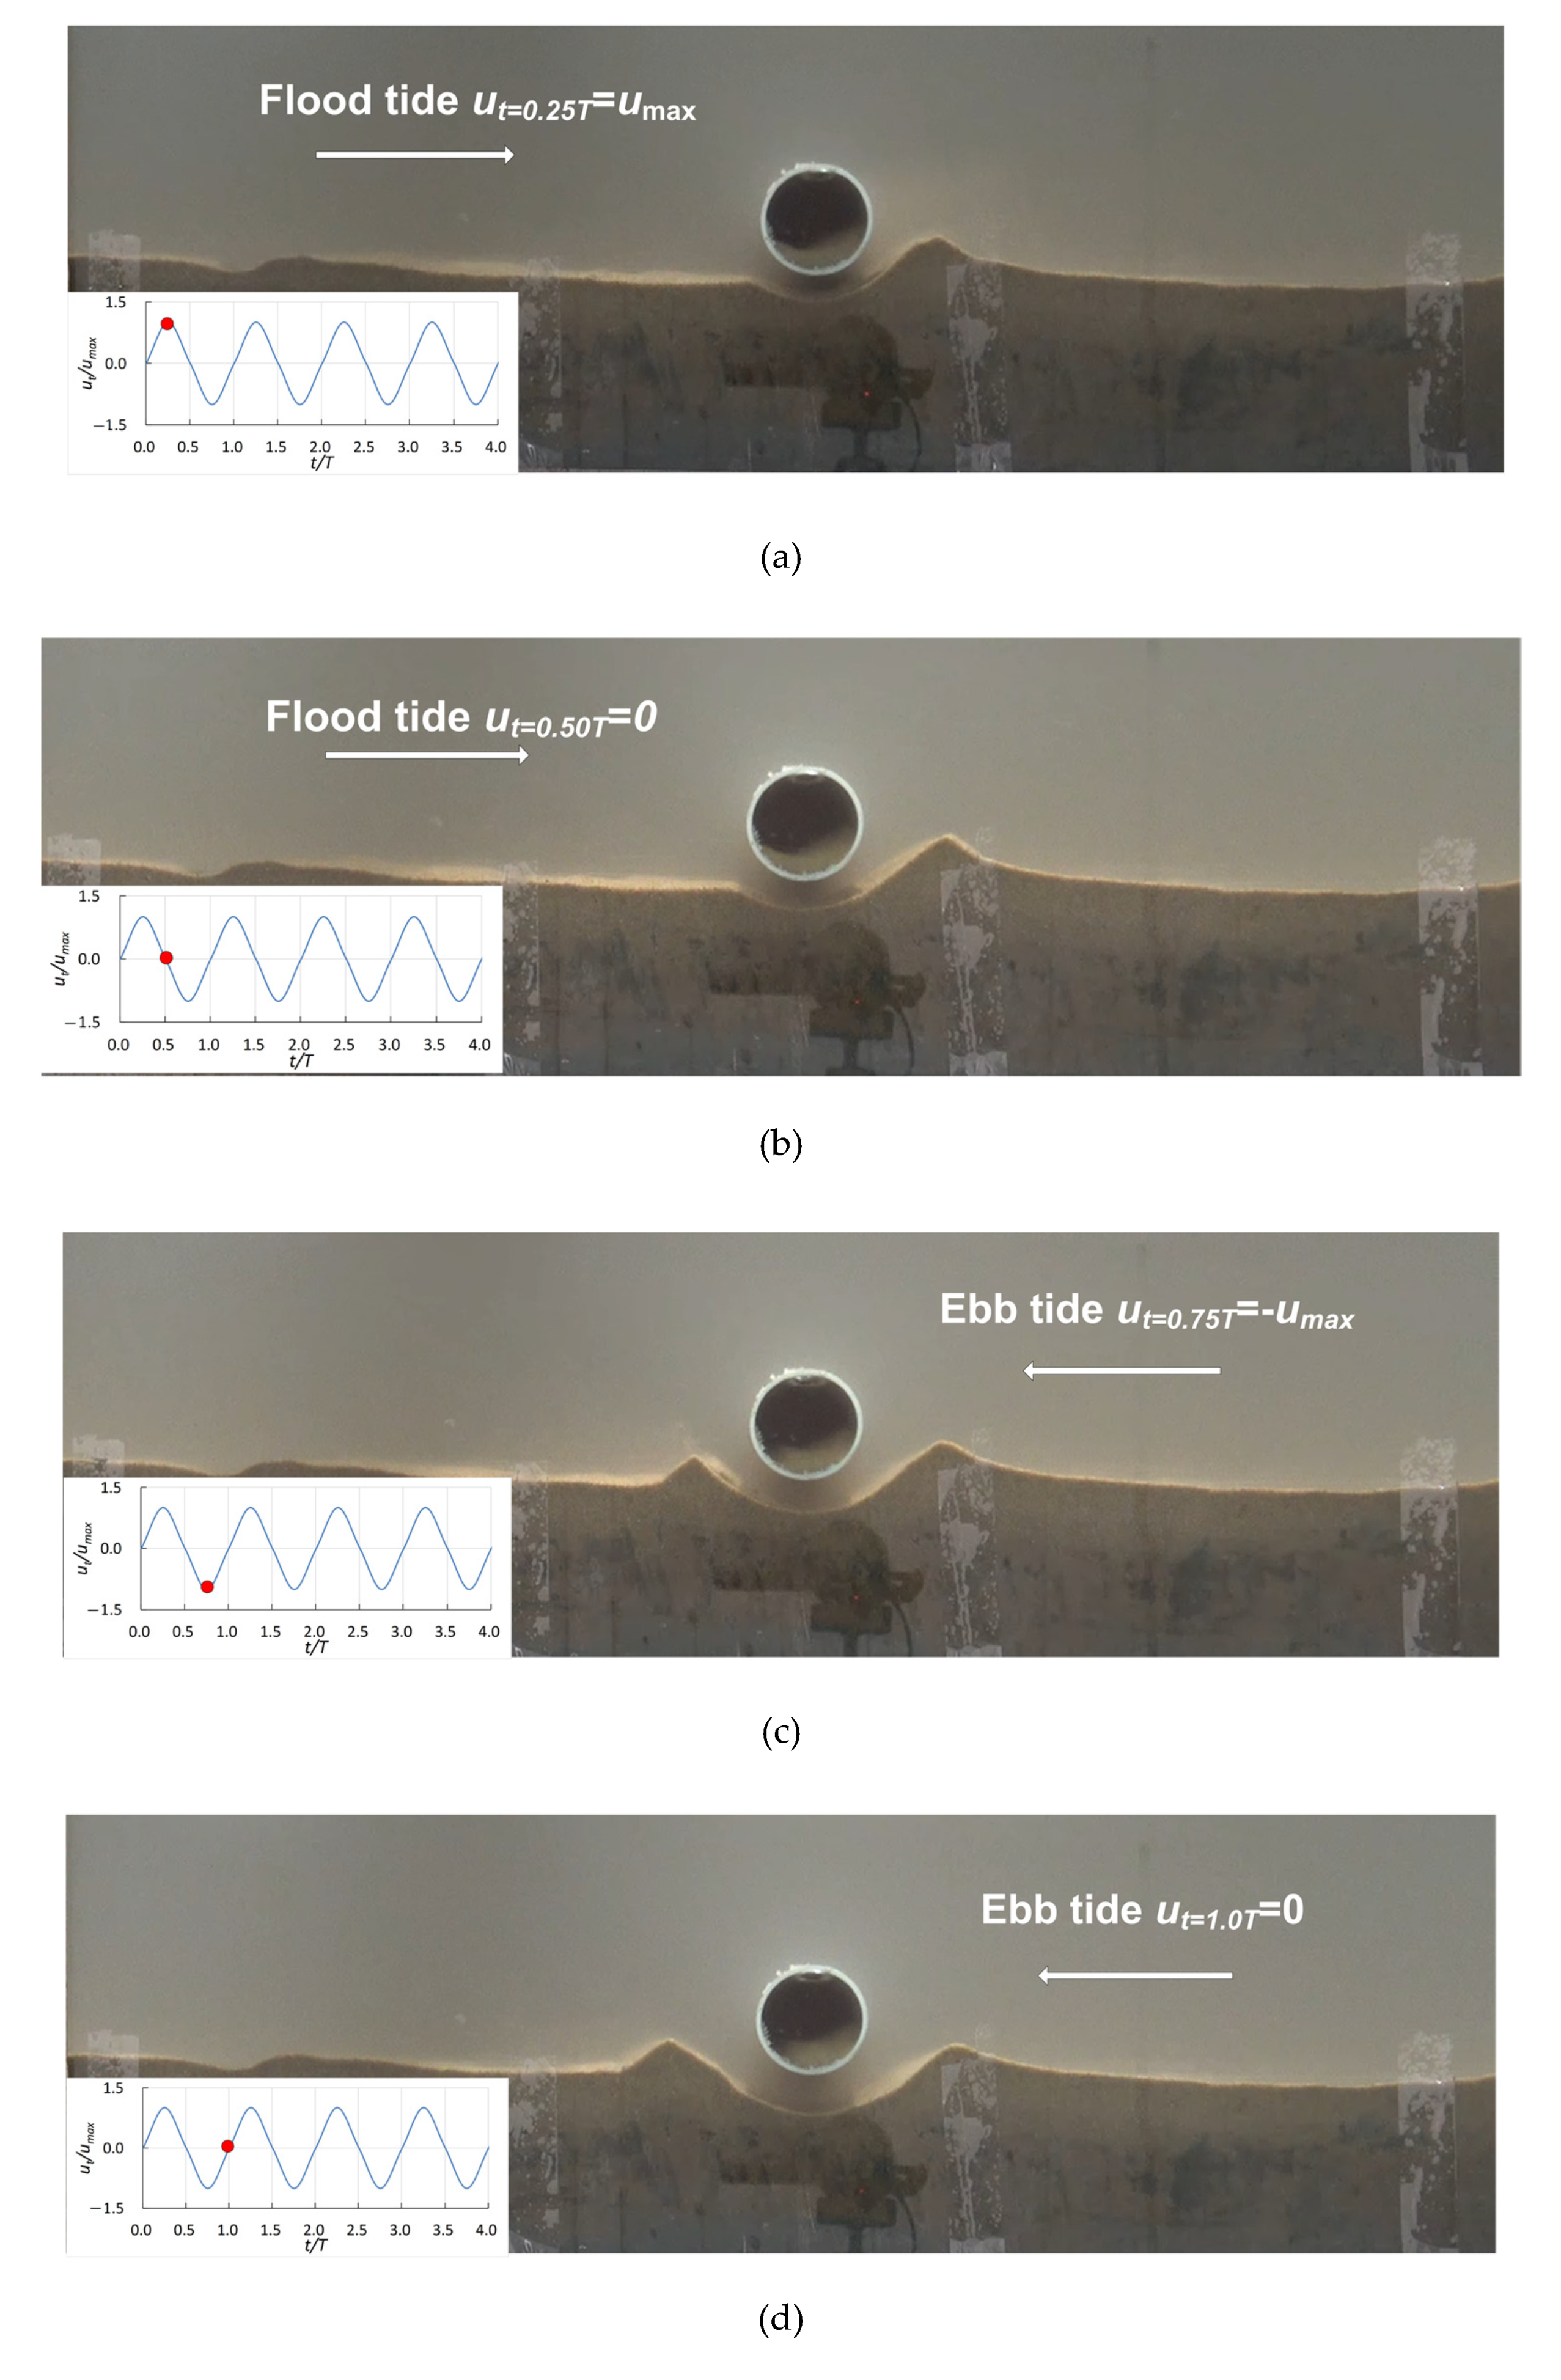
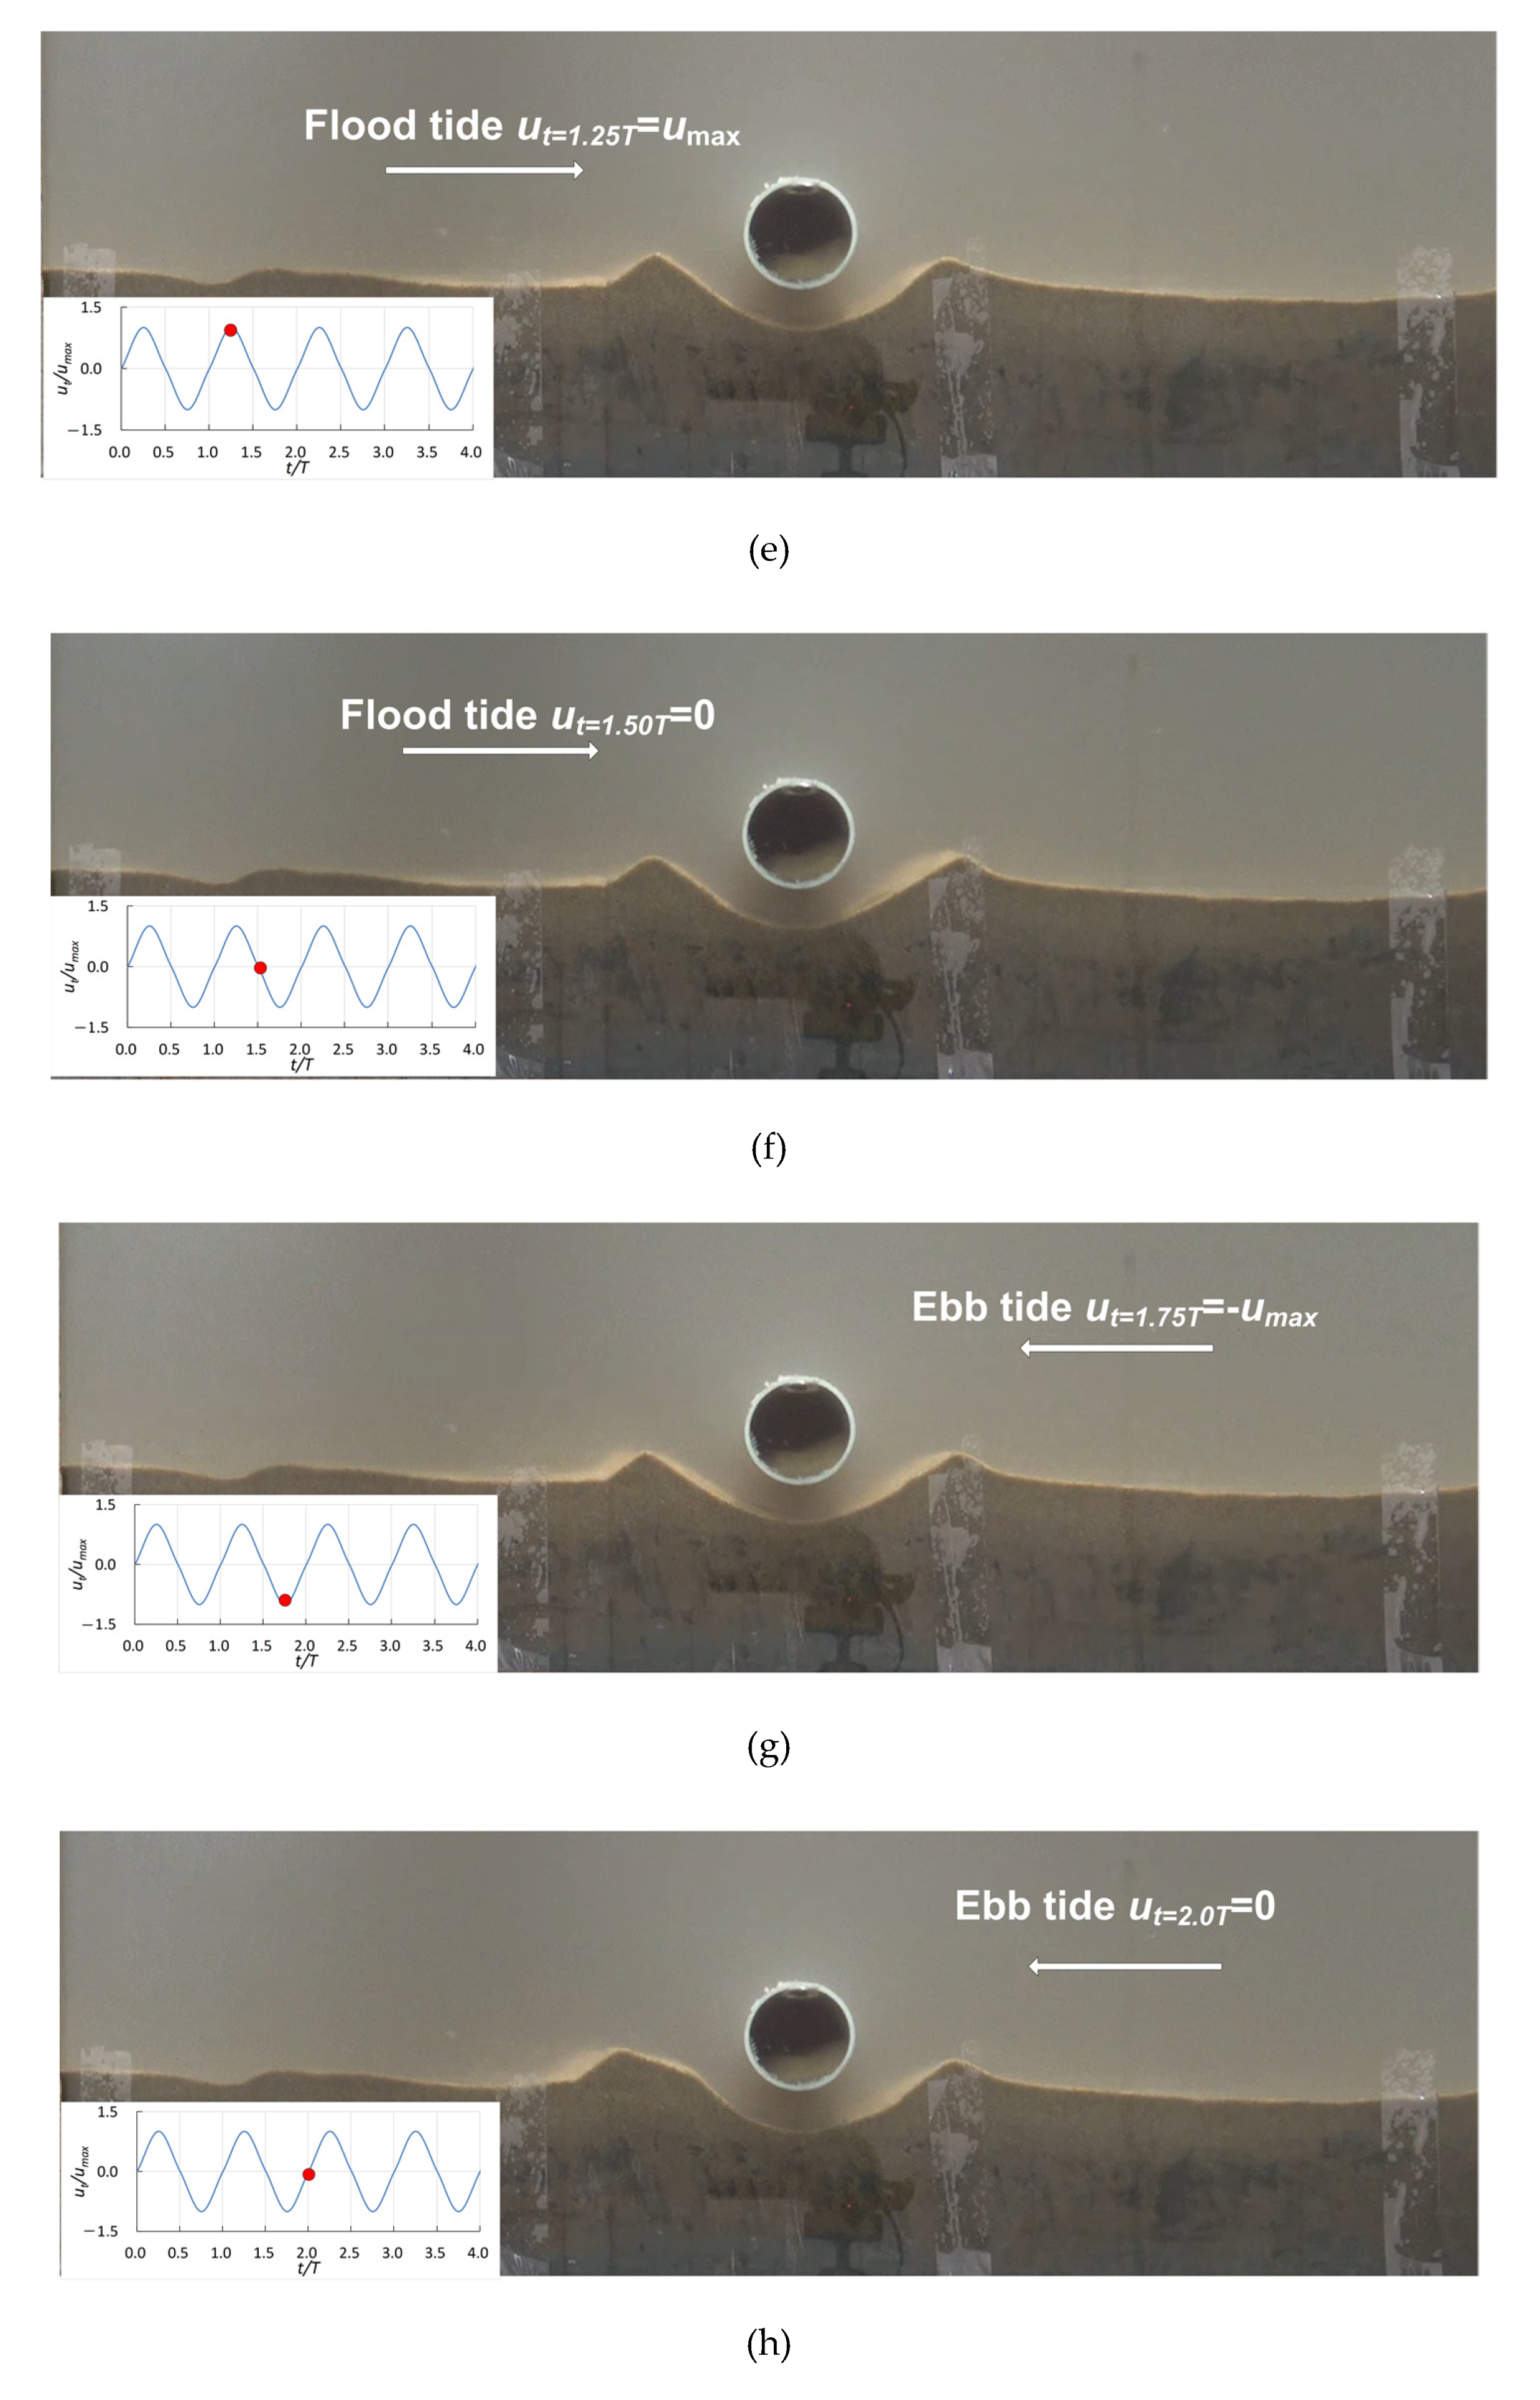
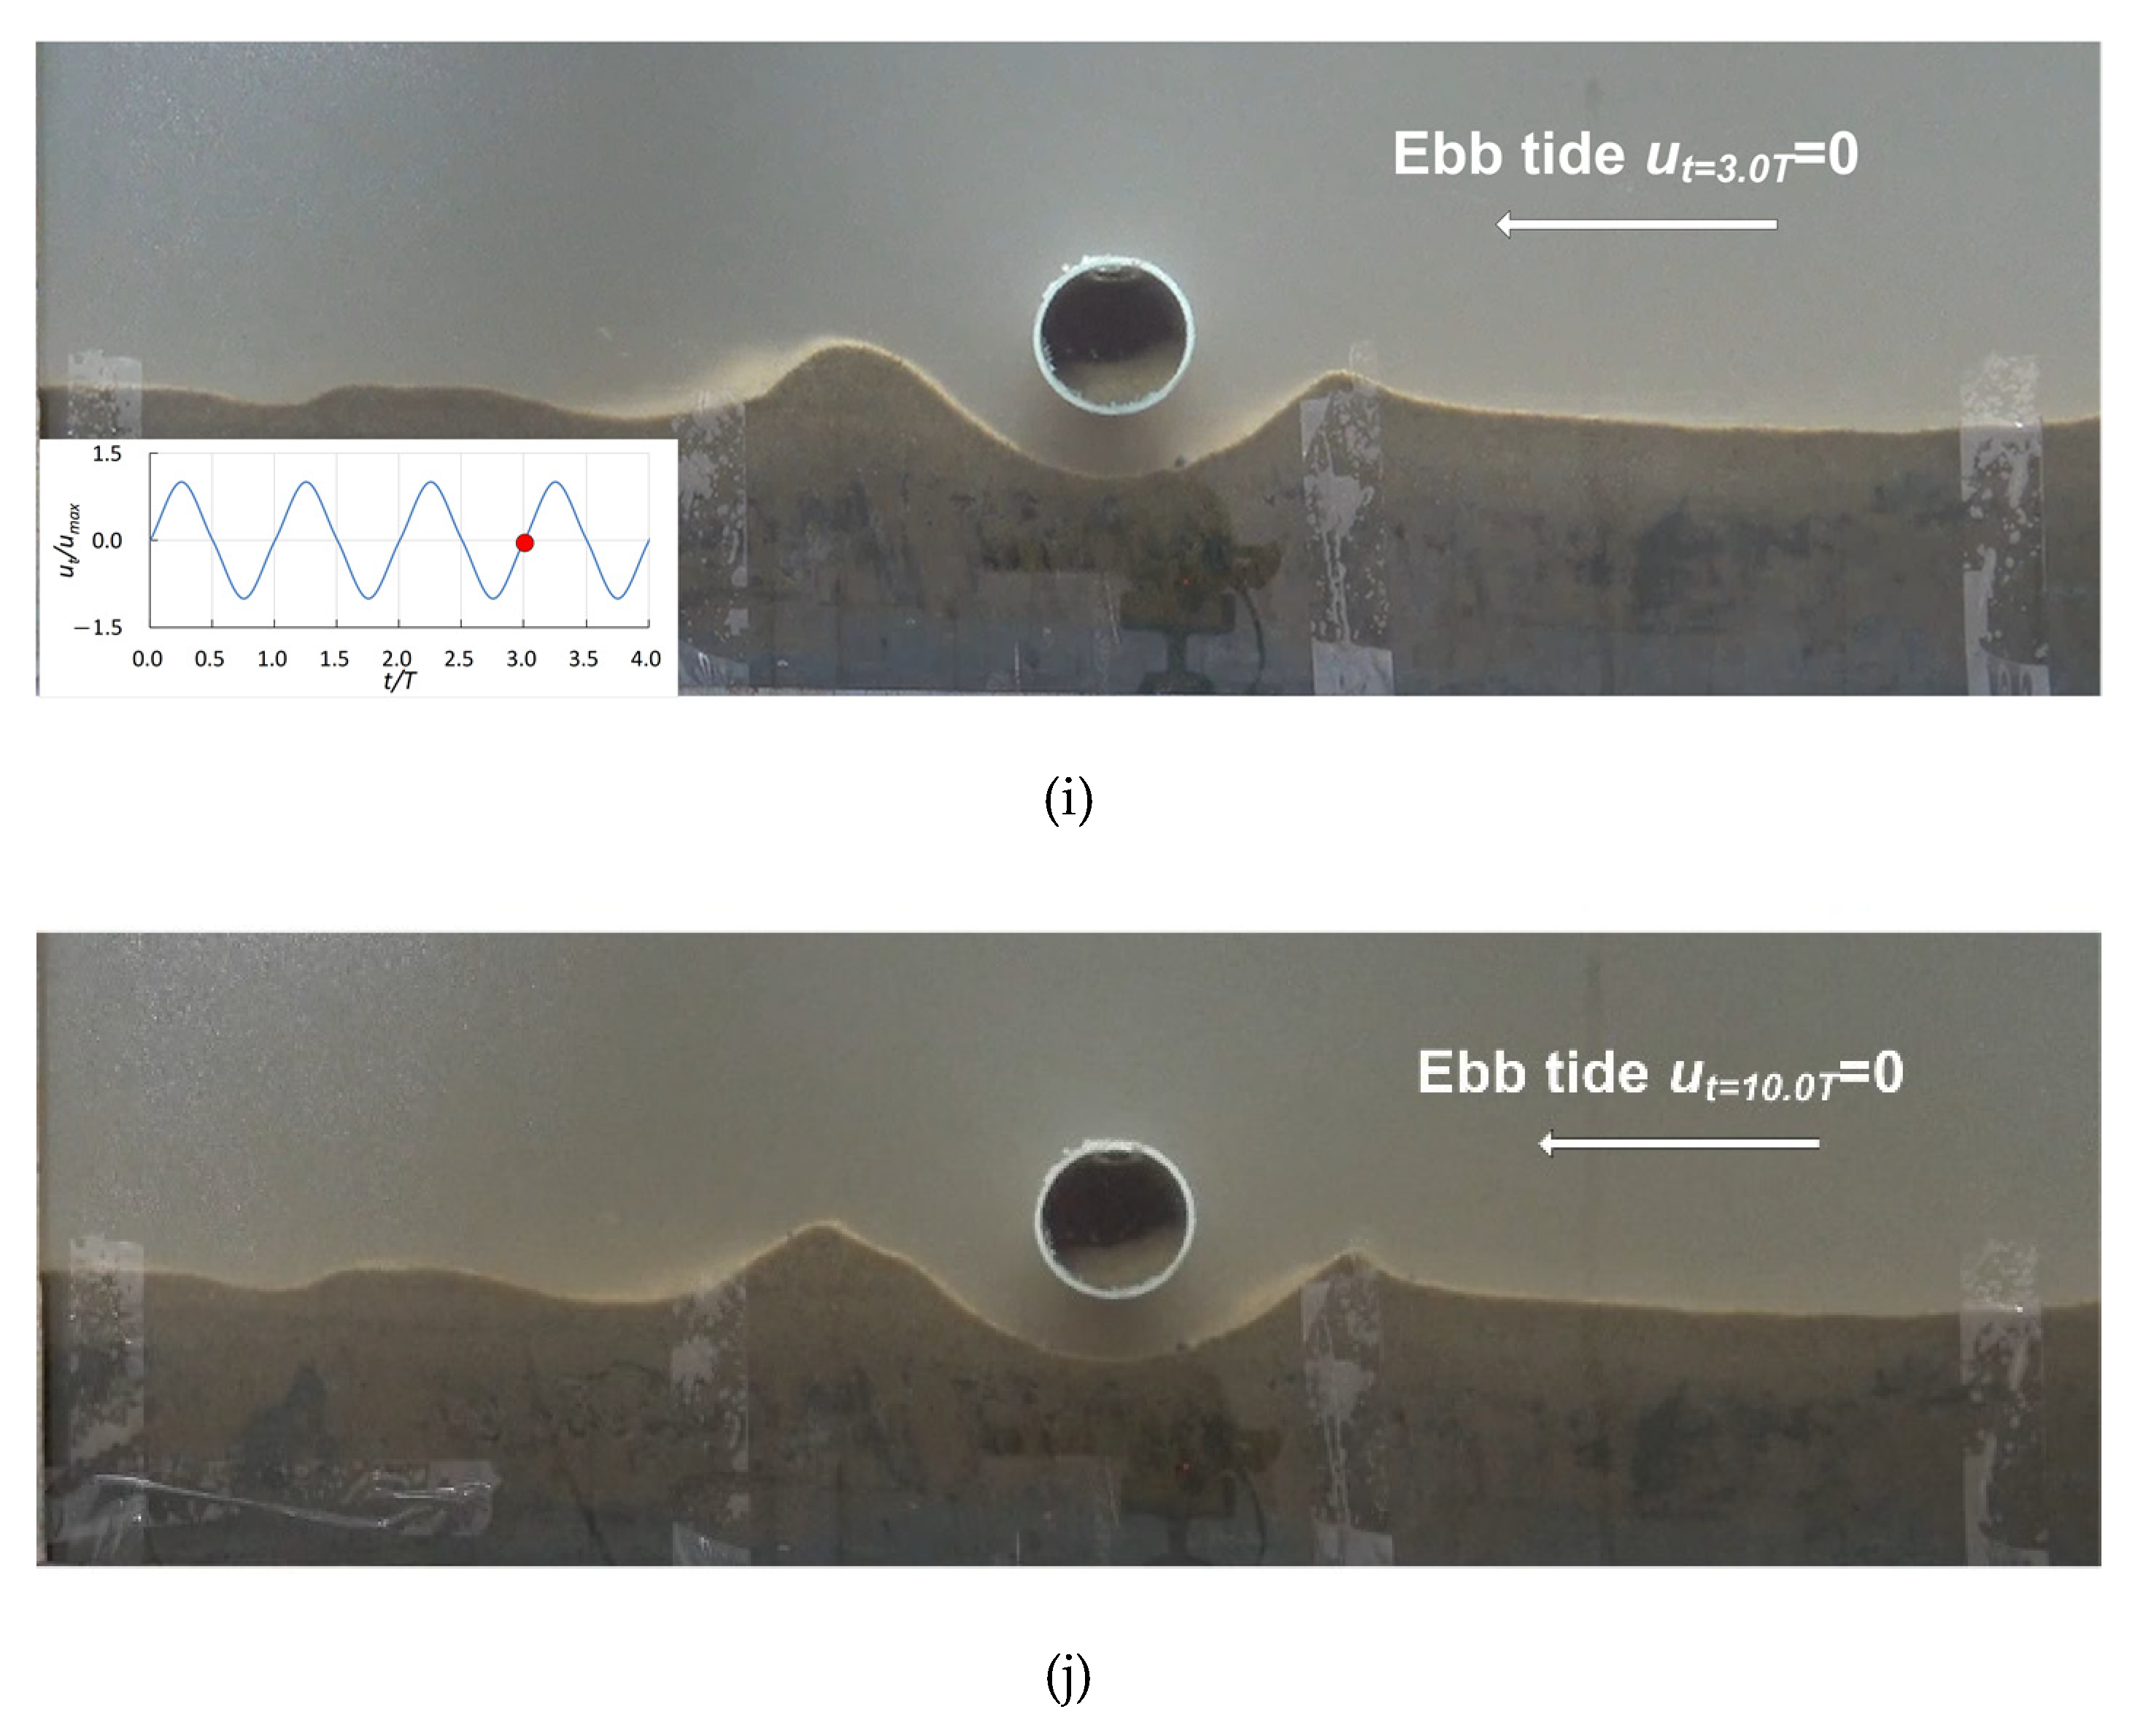
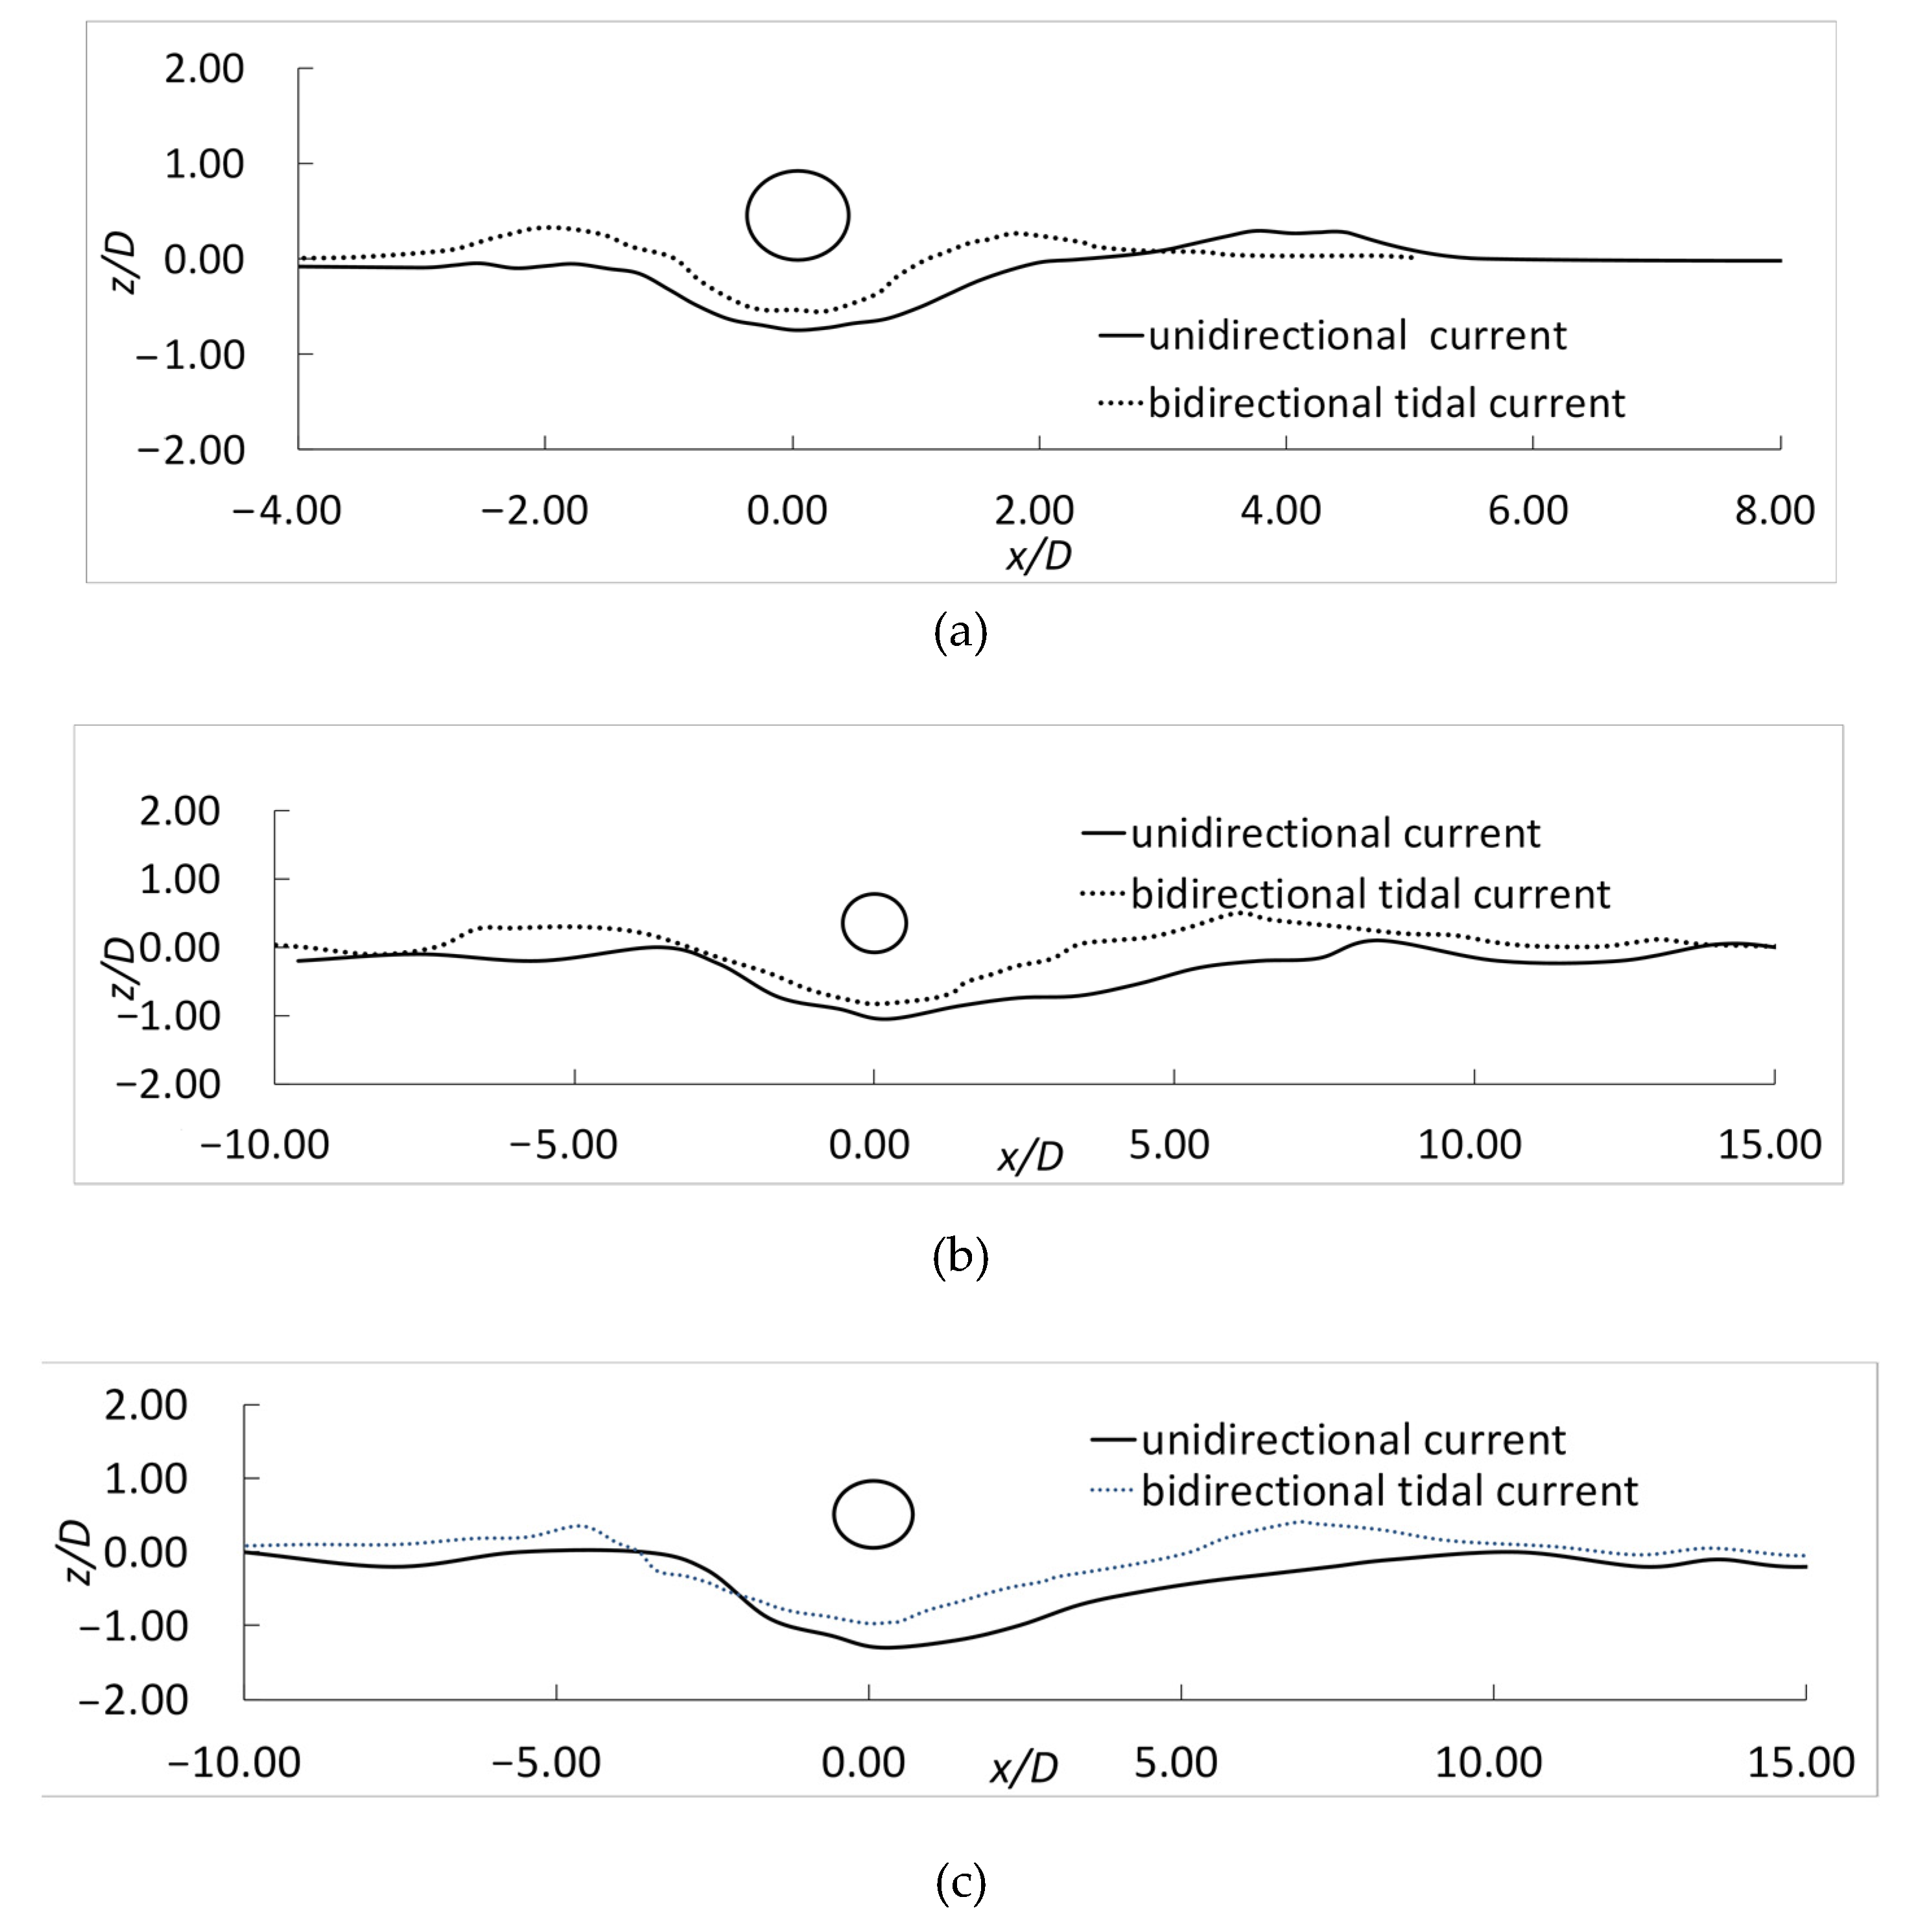
3.1. Scouring Process and Scour Profile
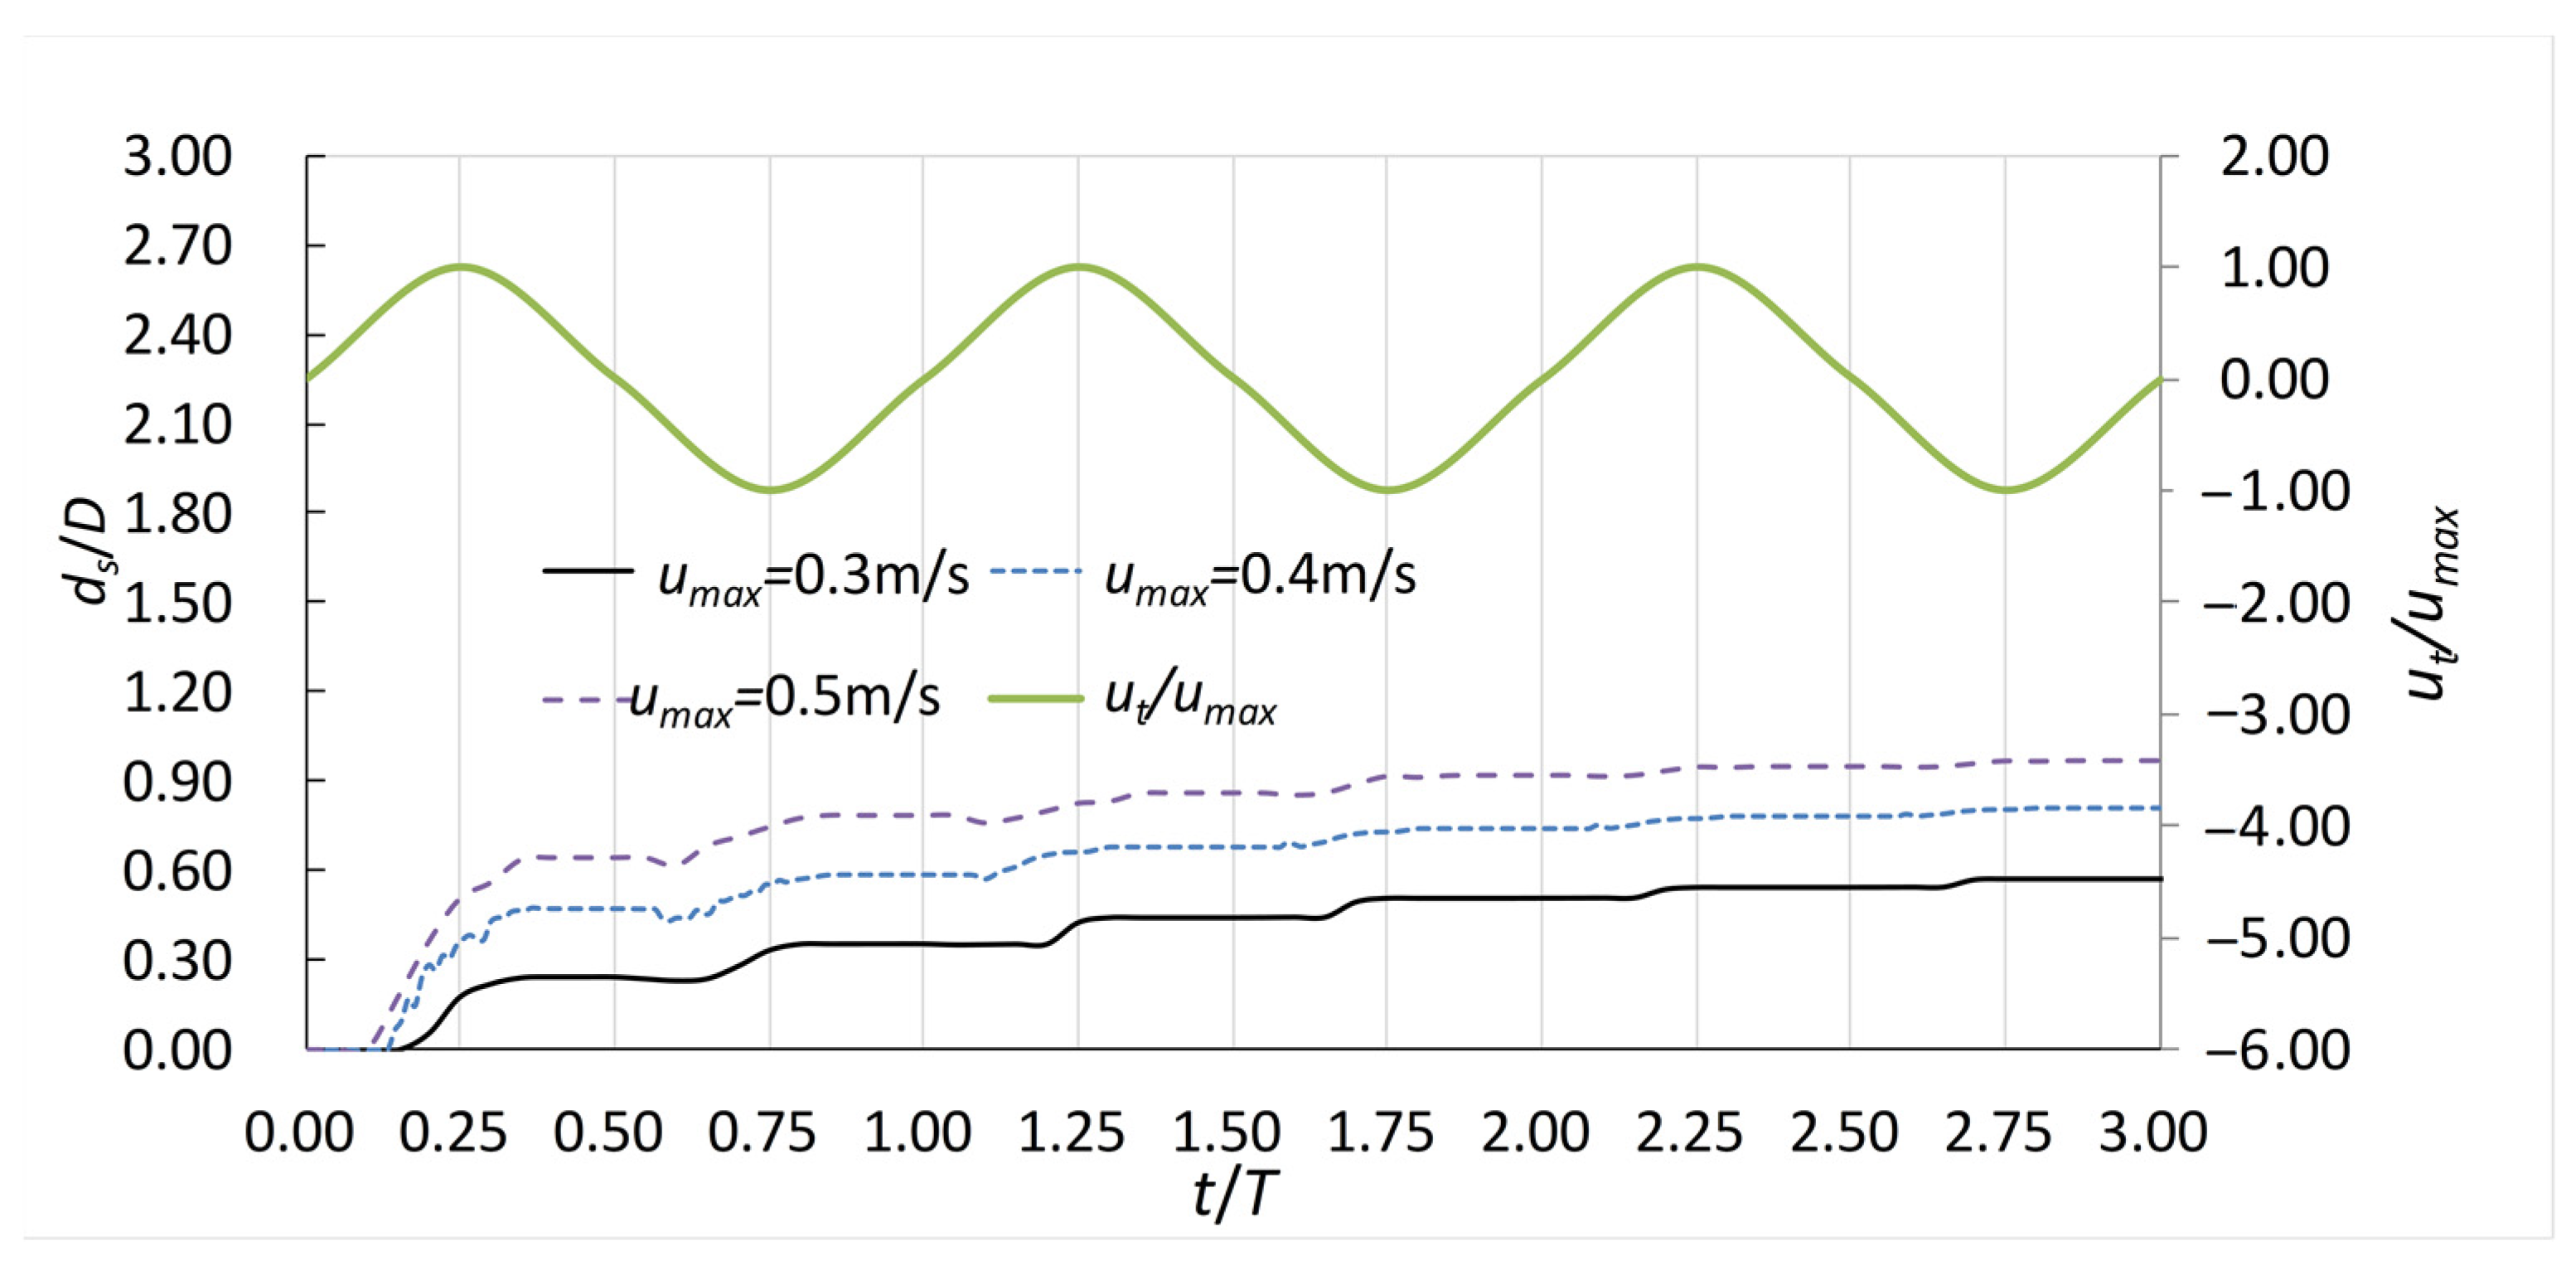
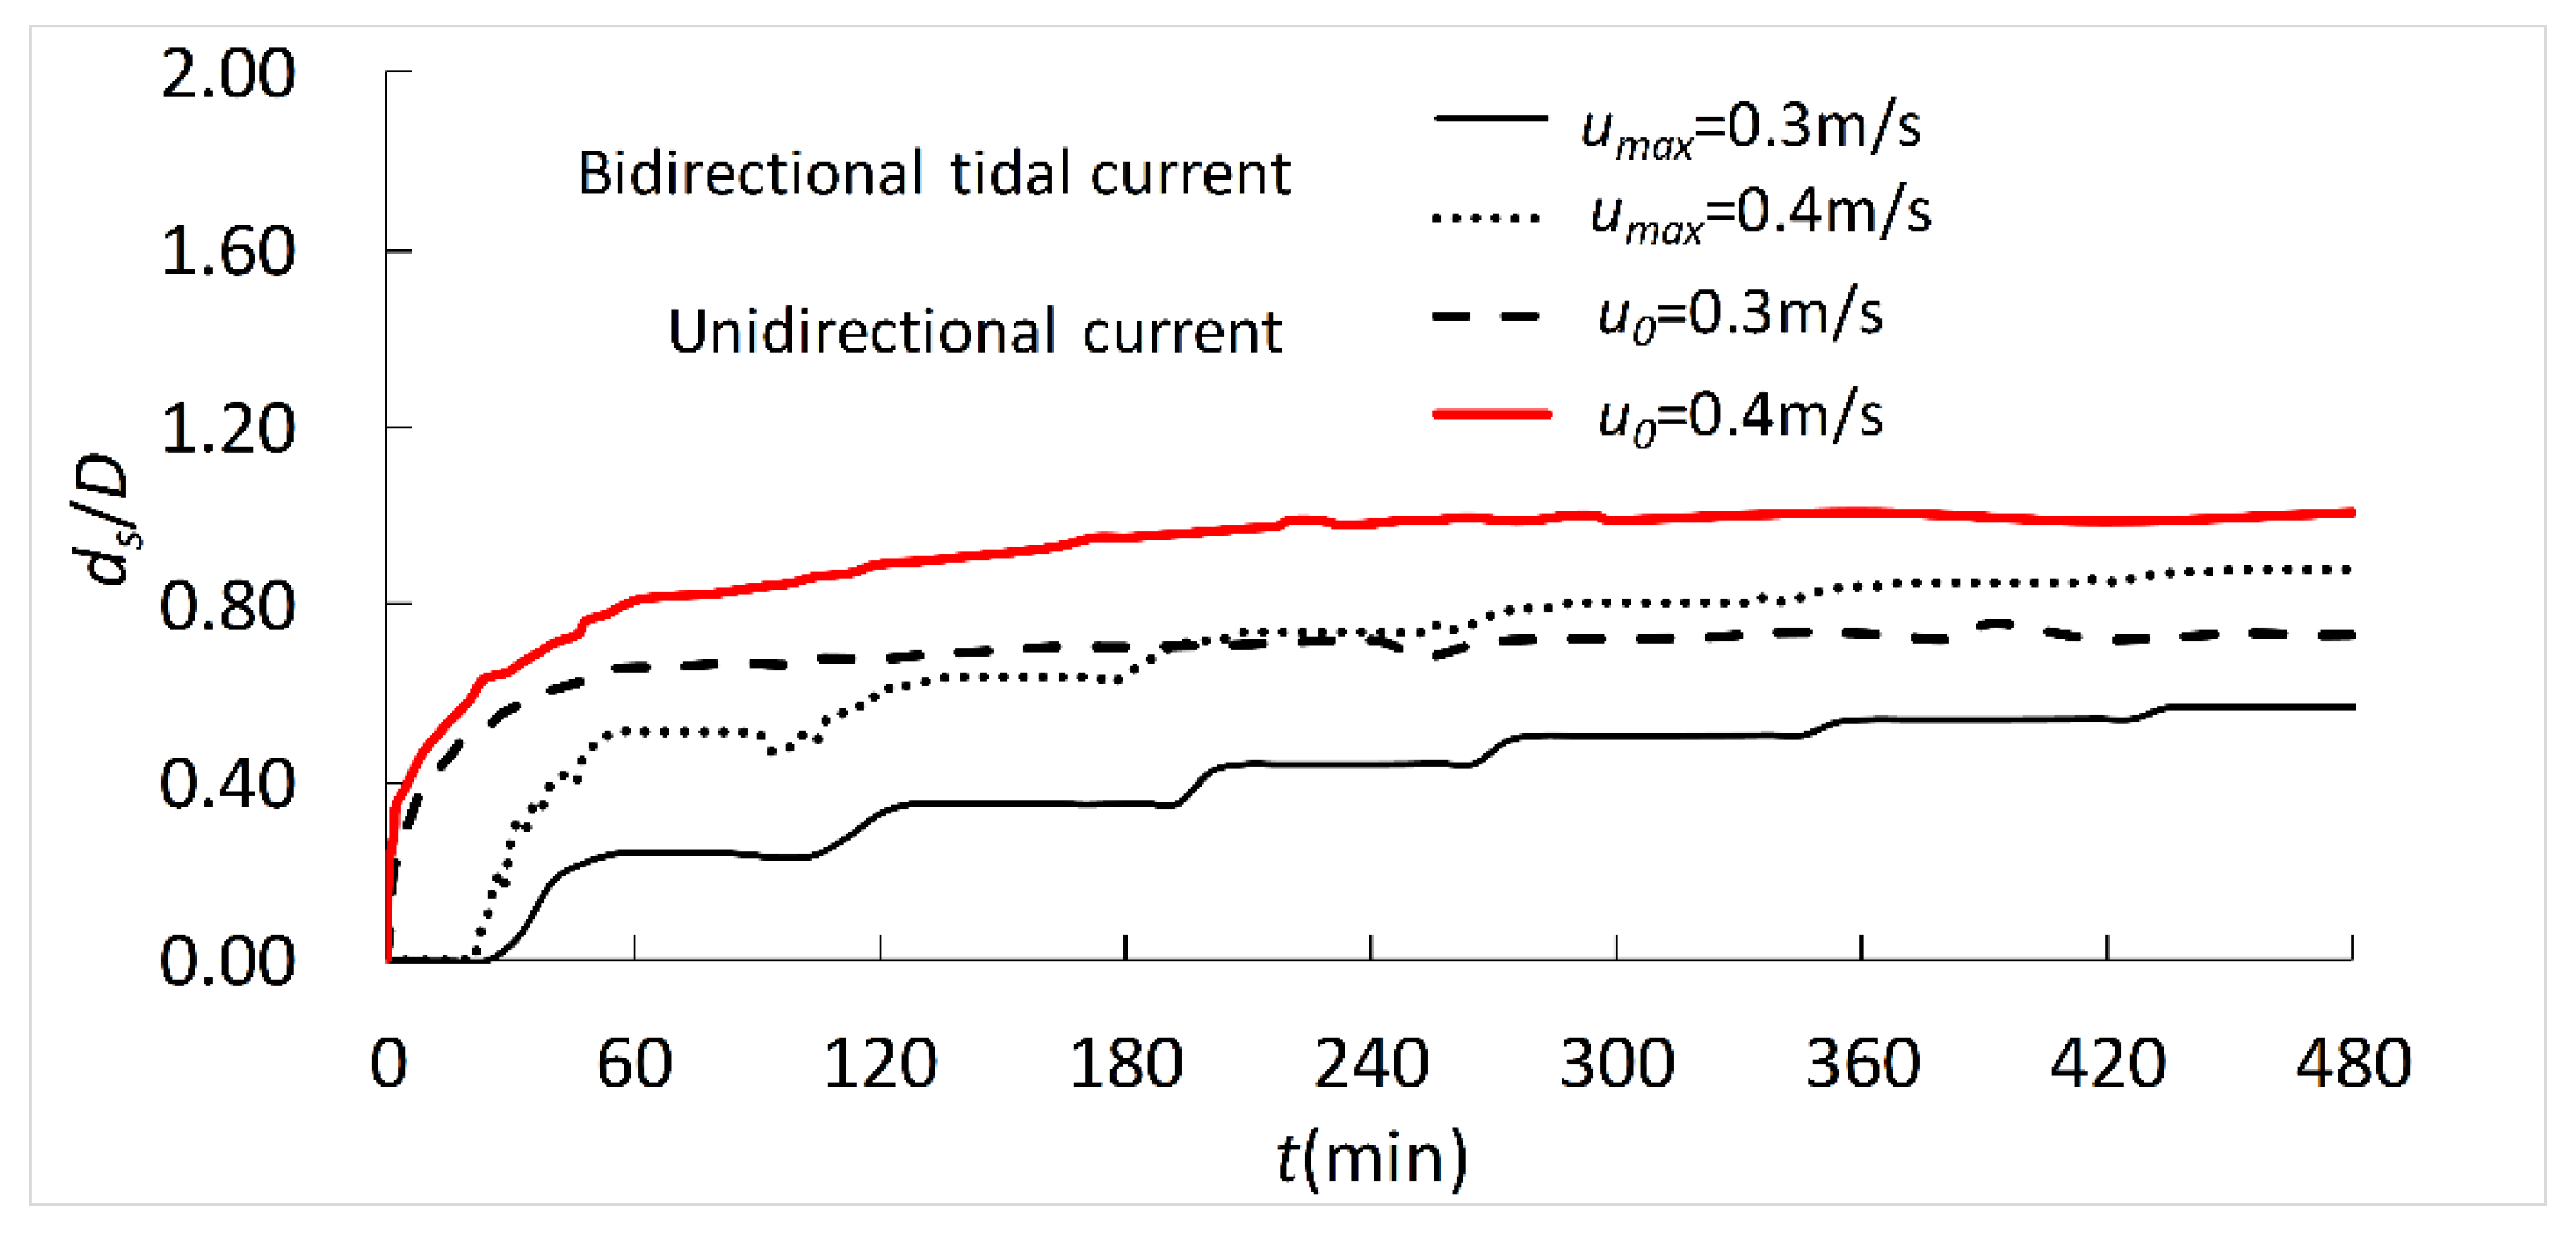
3.2. Temporal Development of Scour Depth
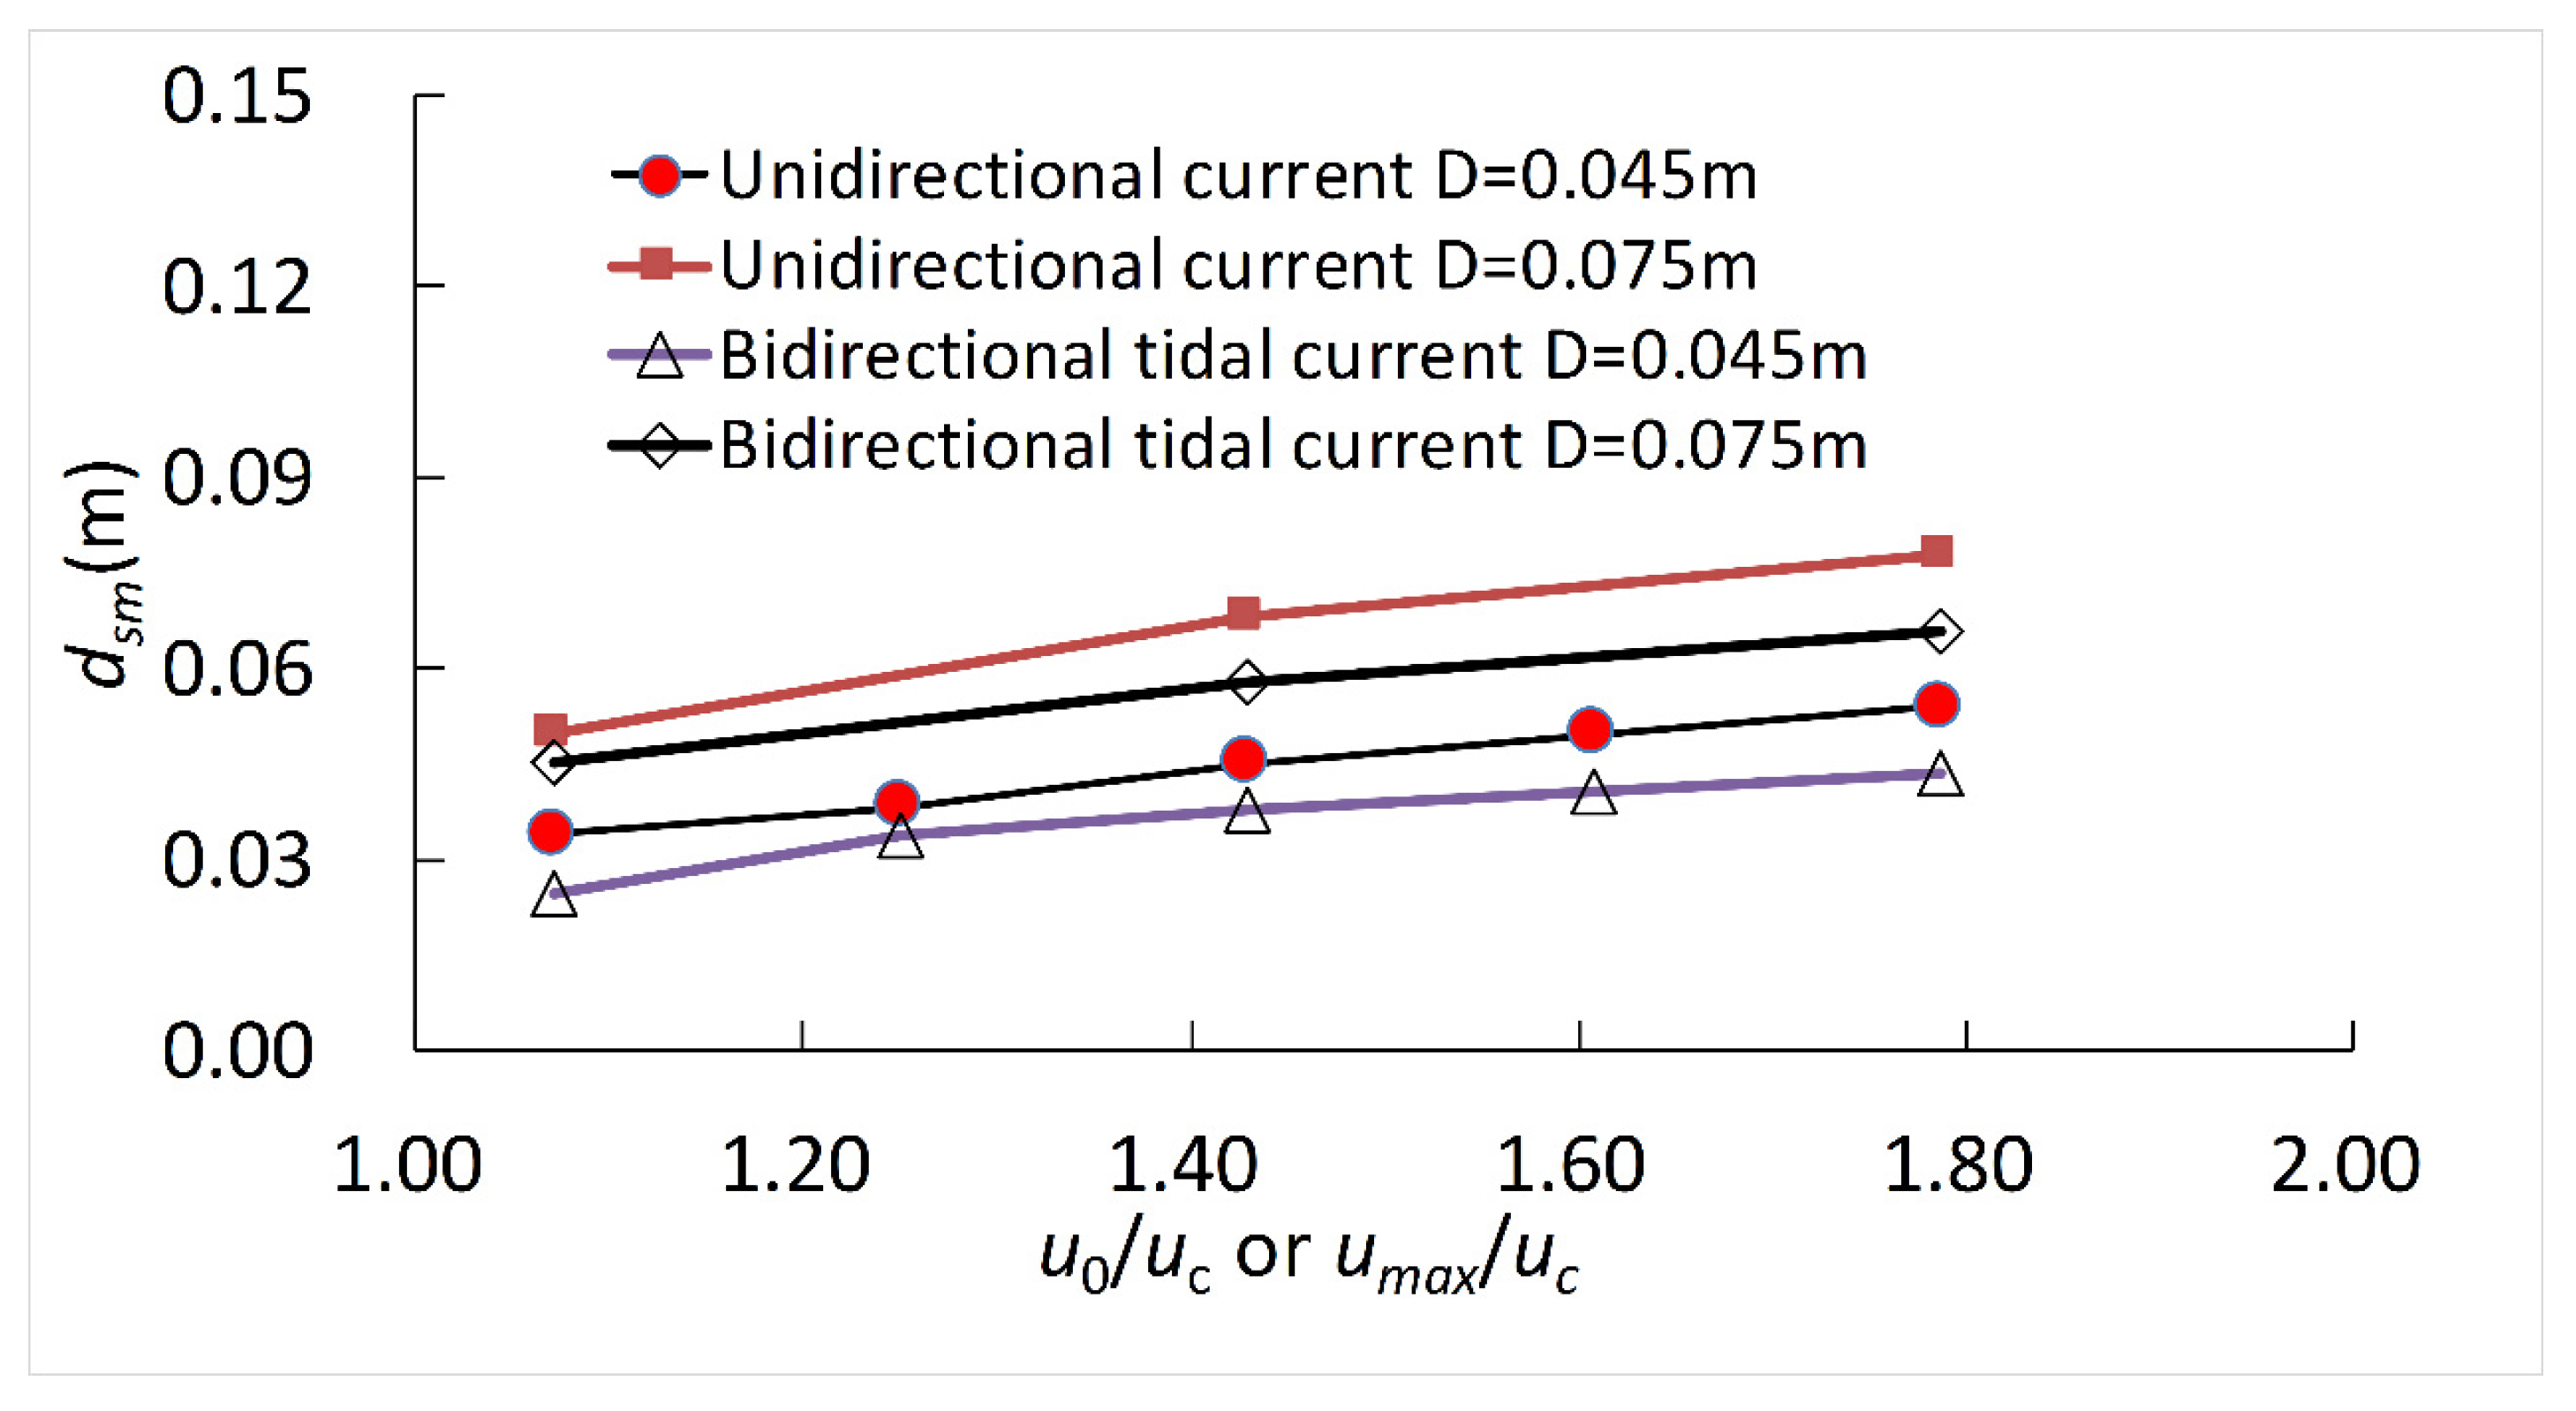
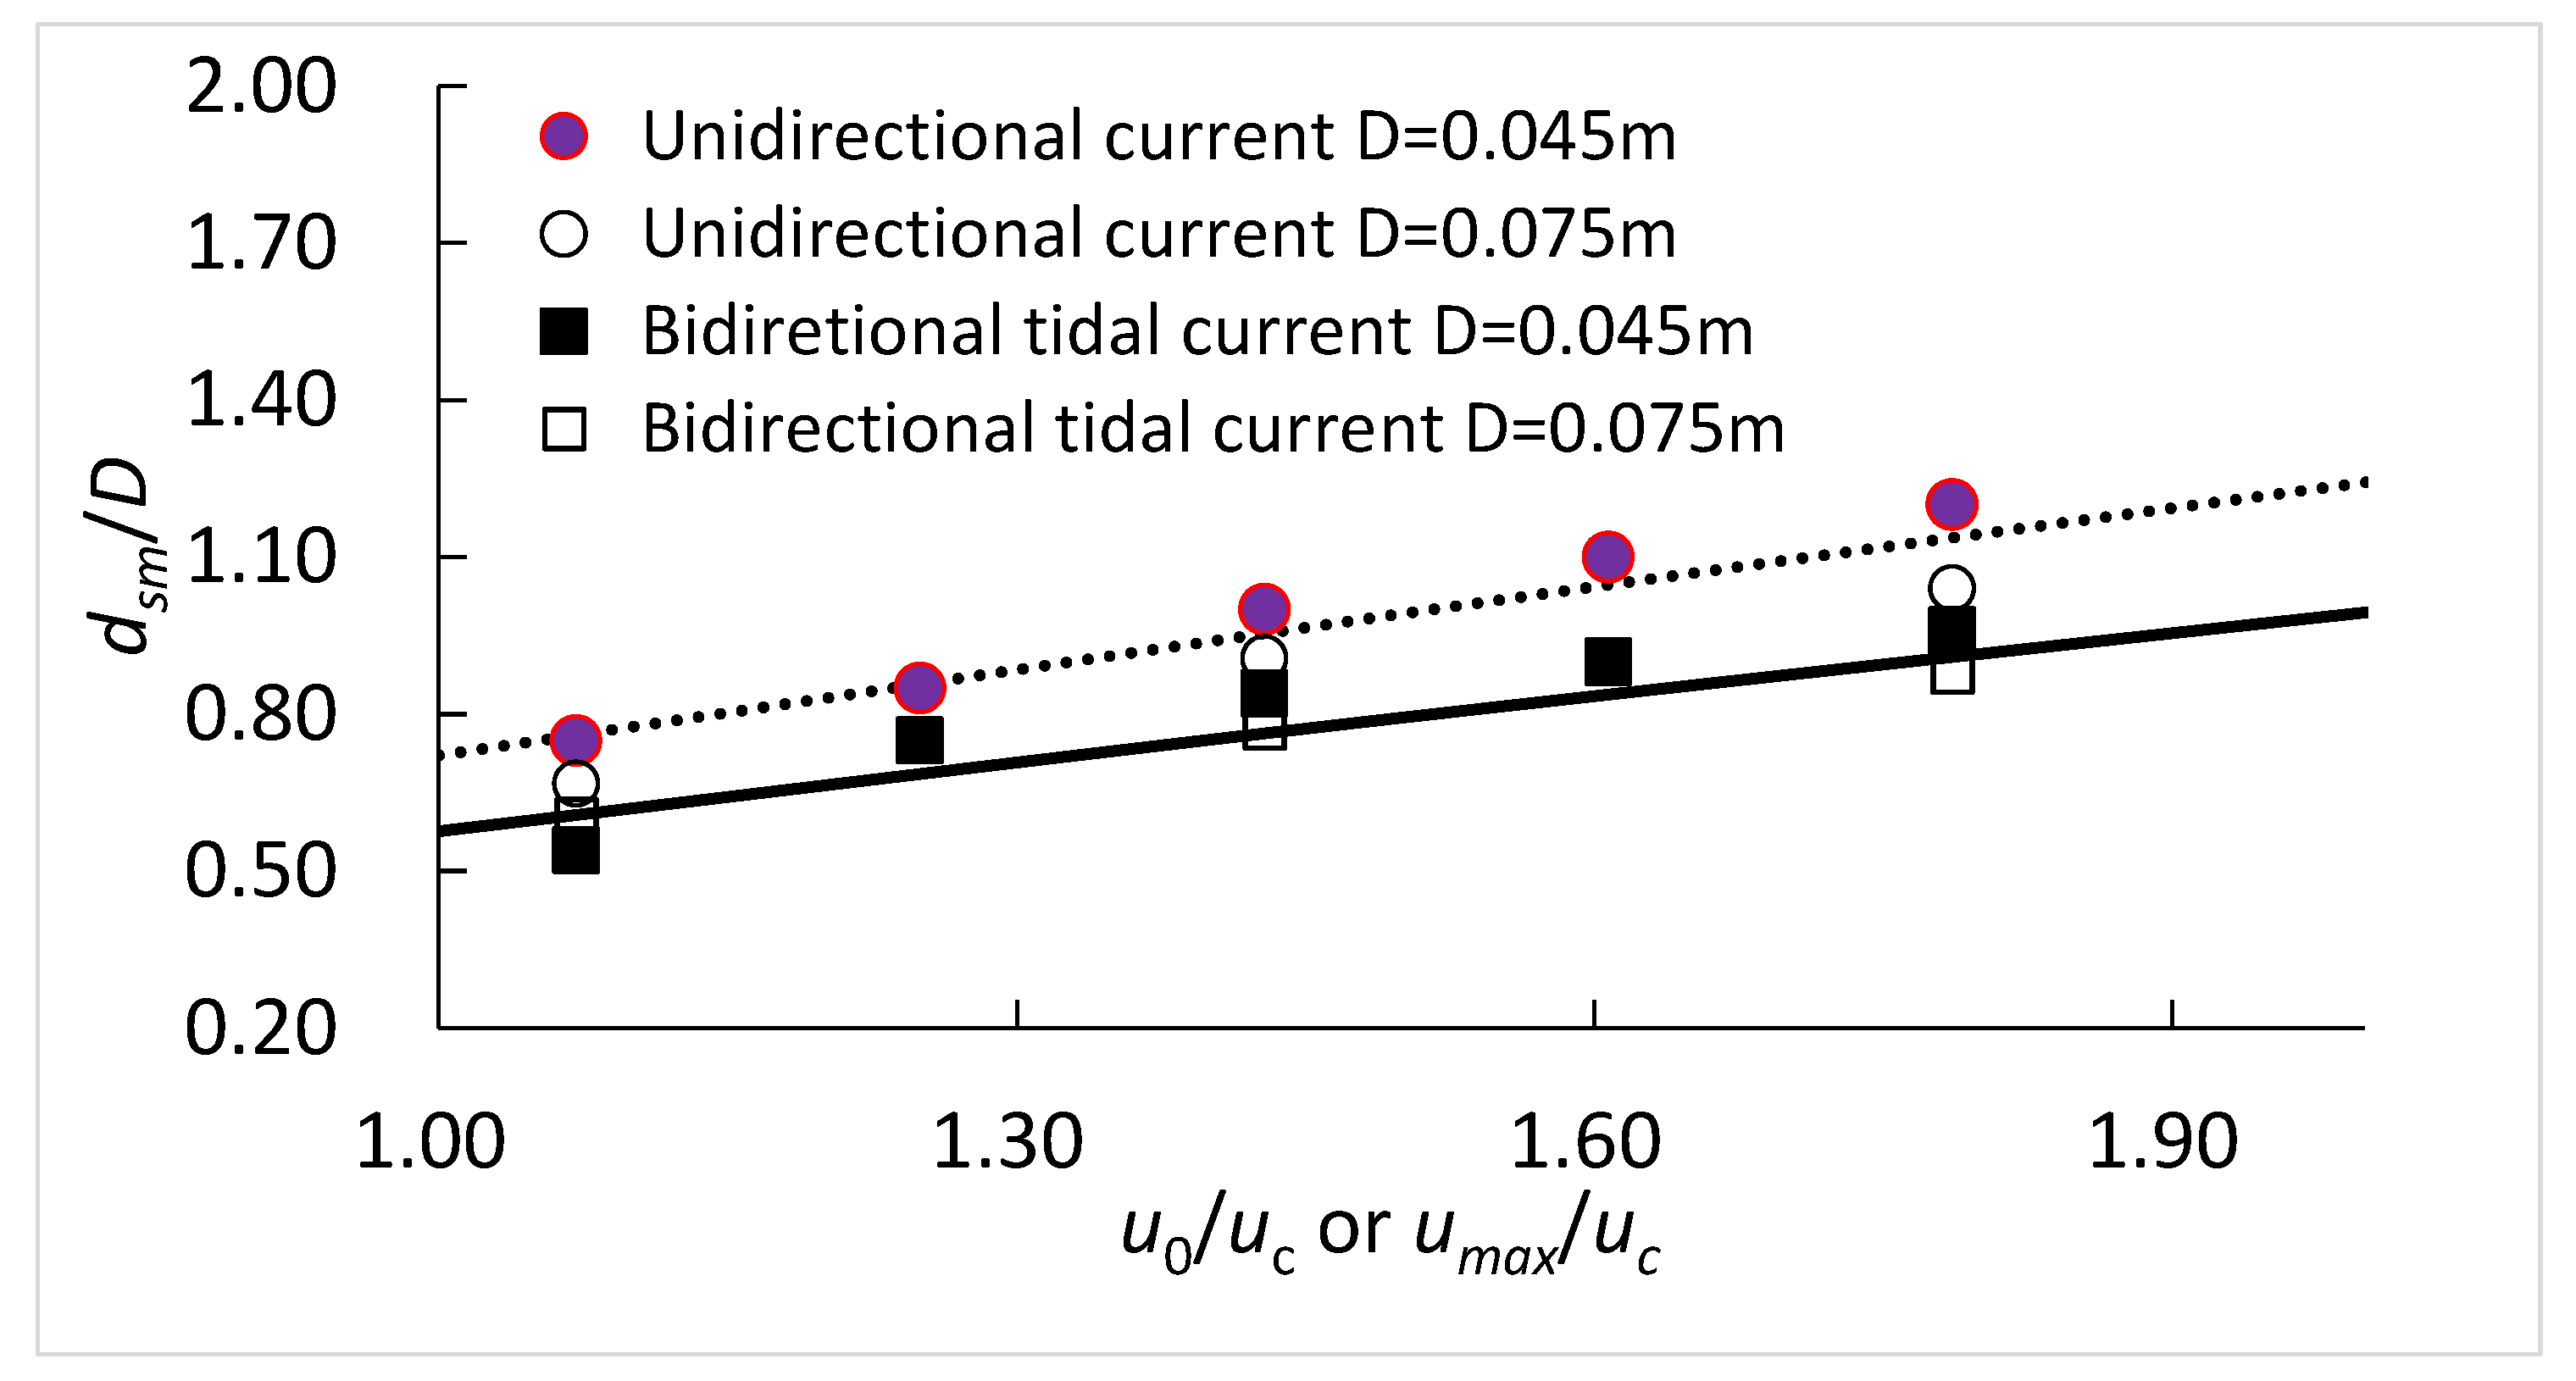
3.3. Maximum Scour Depth under Bidirectional Tidal Currents
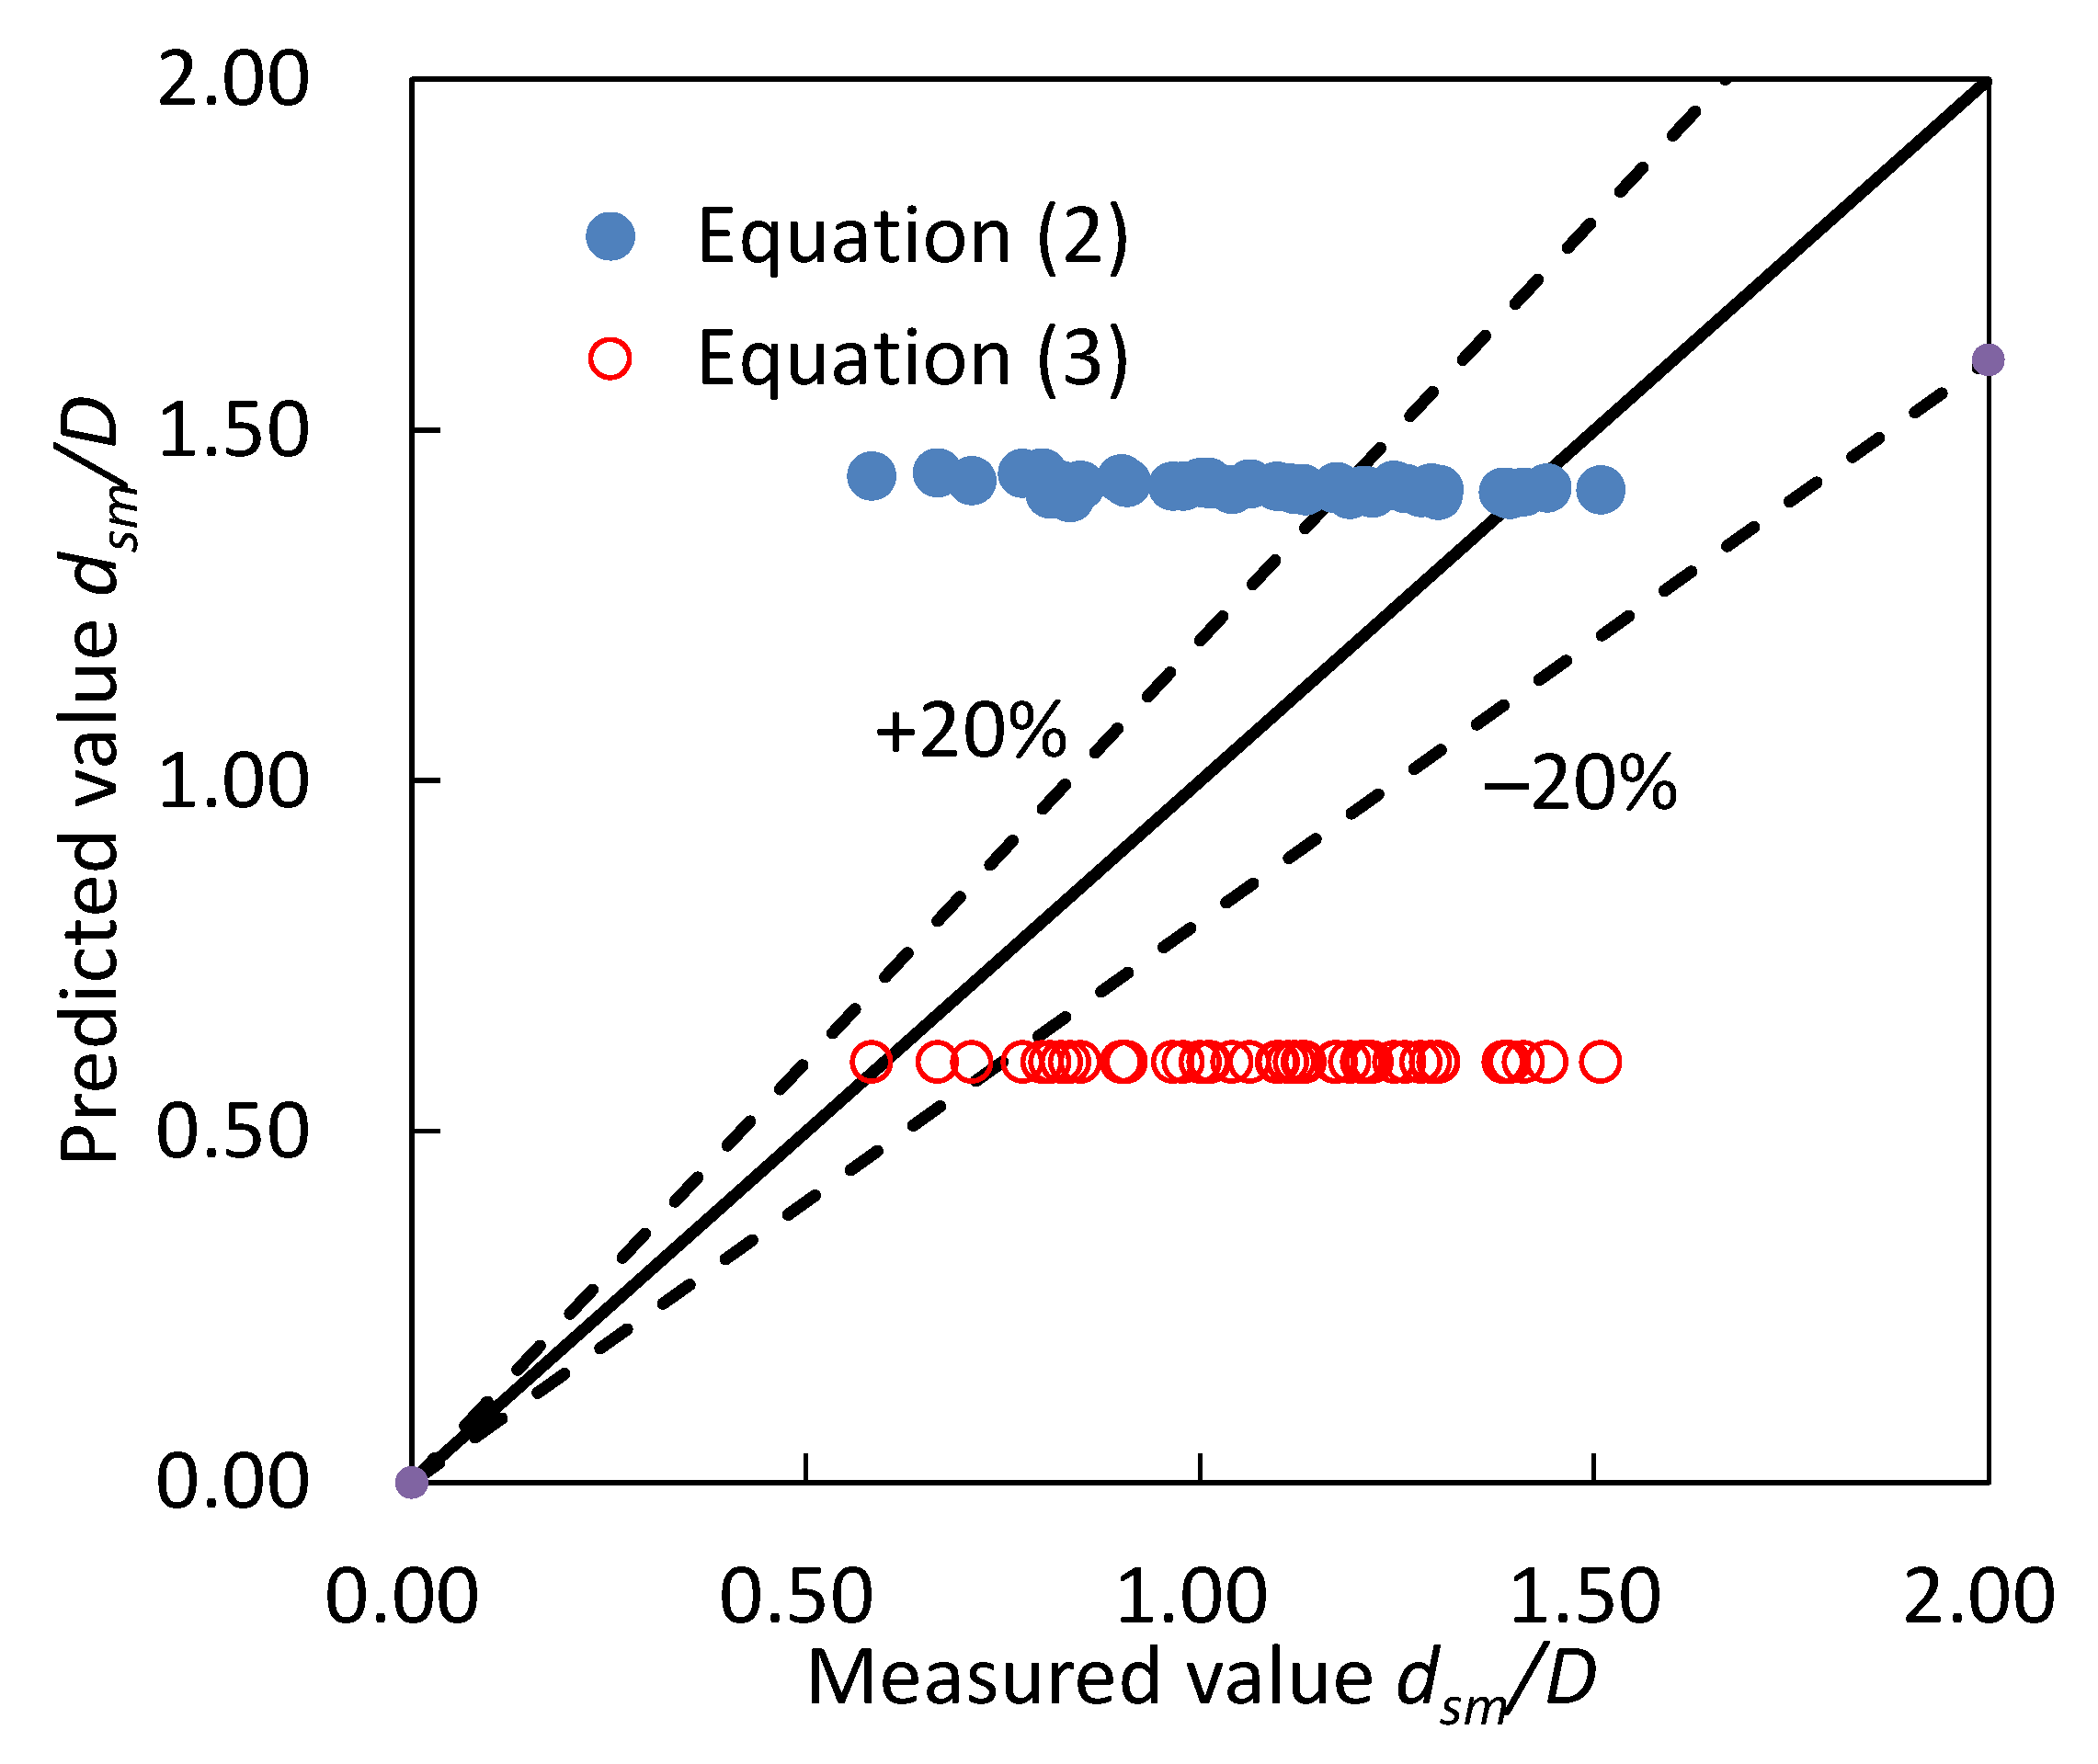
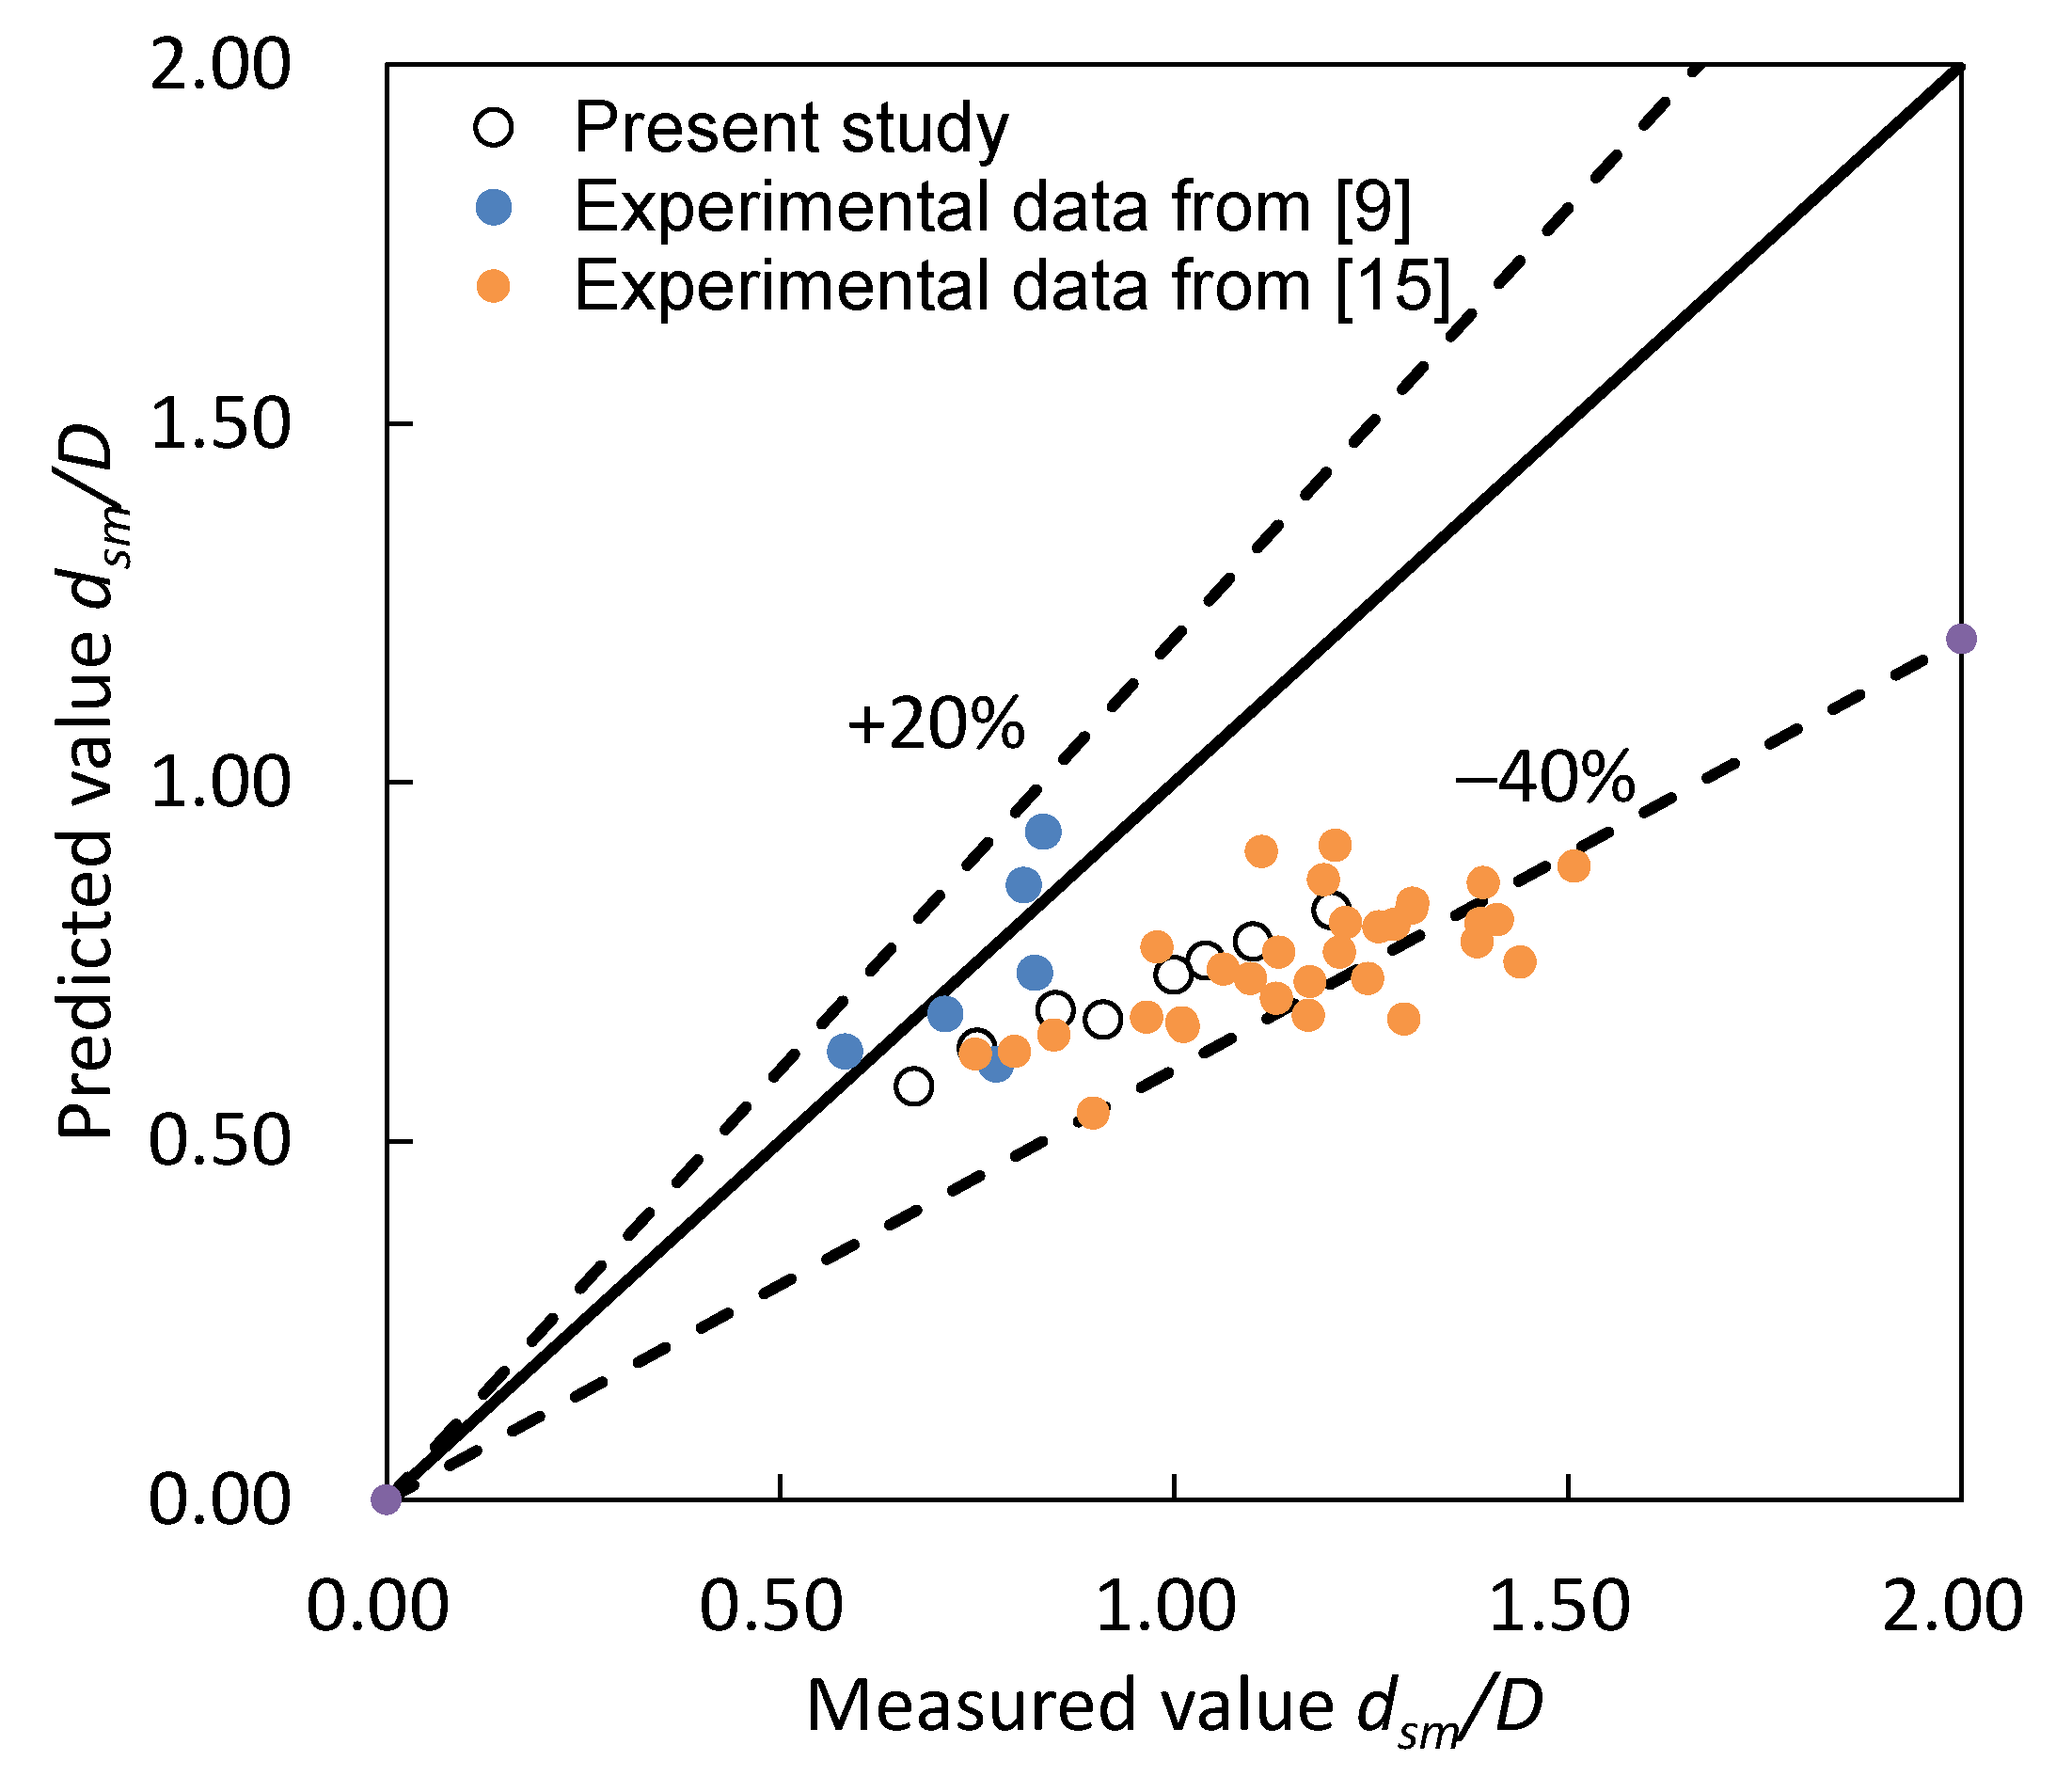
3.4. Prediction of Maximum Scour Depth
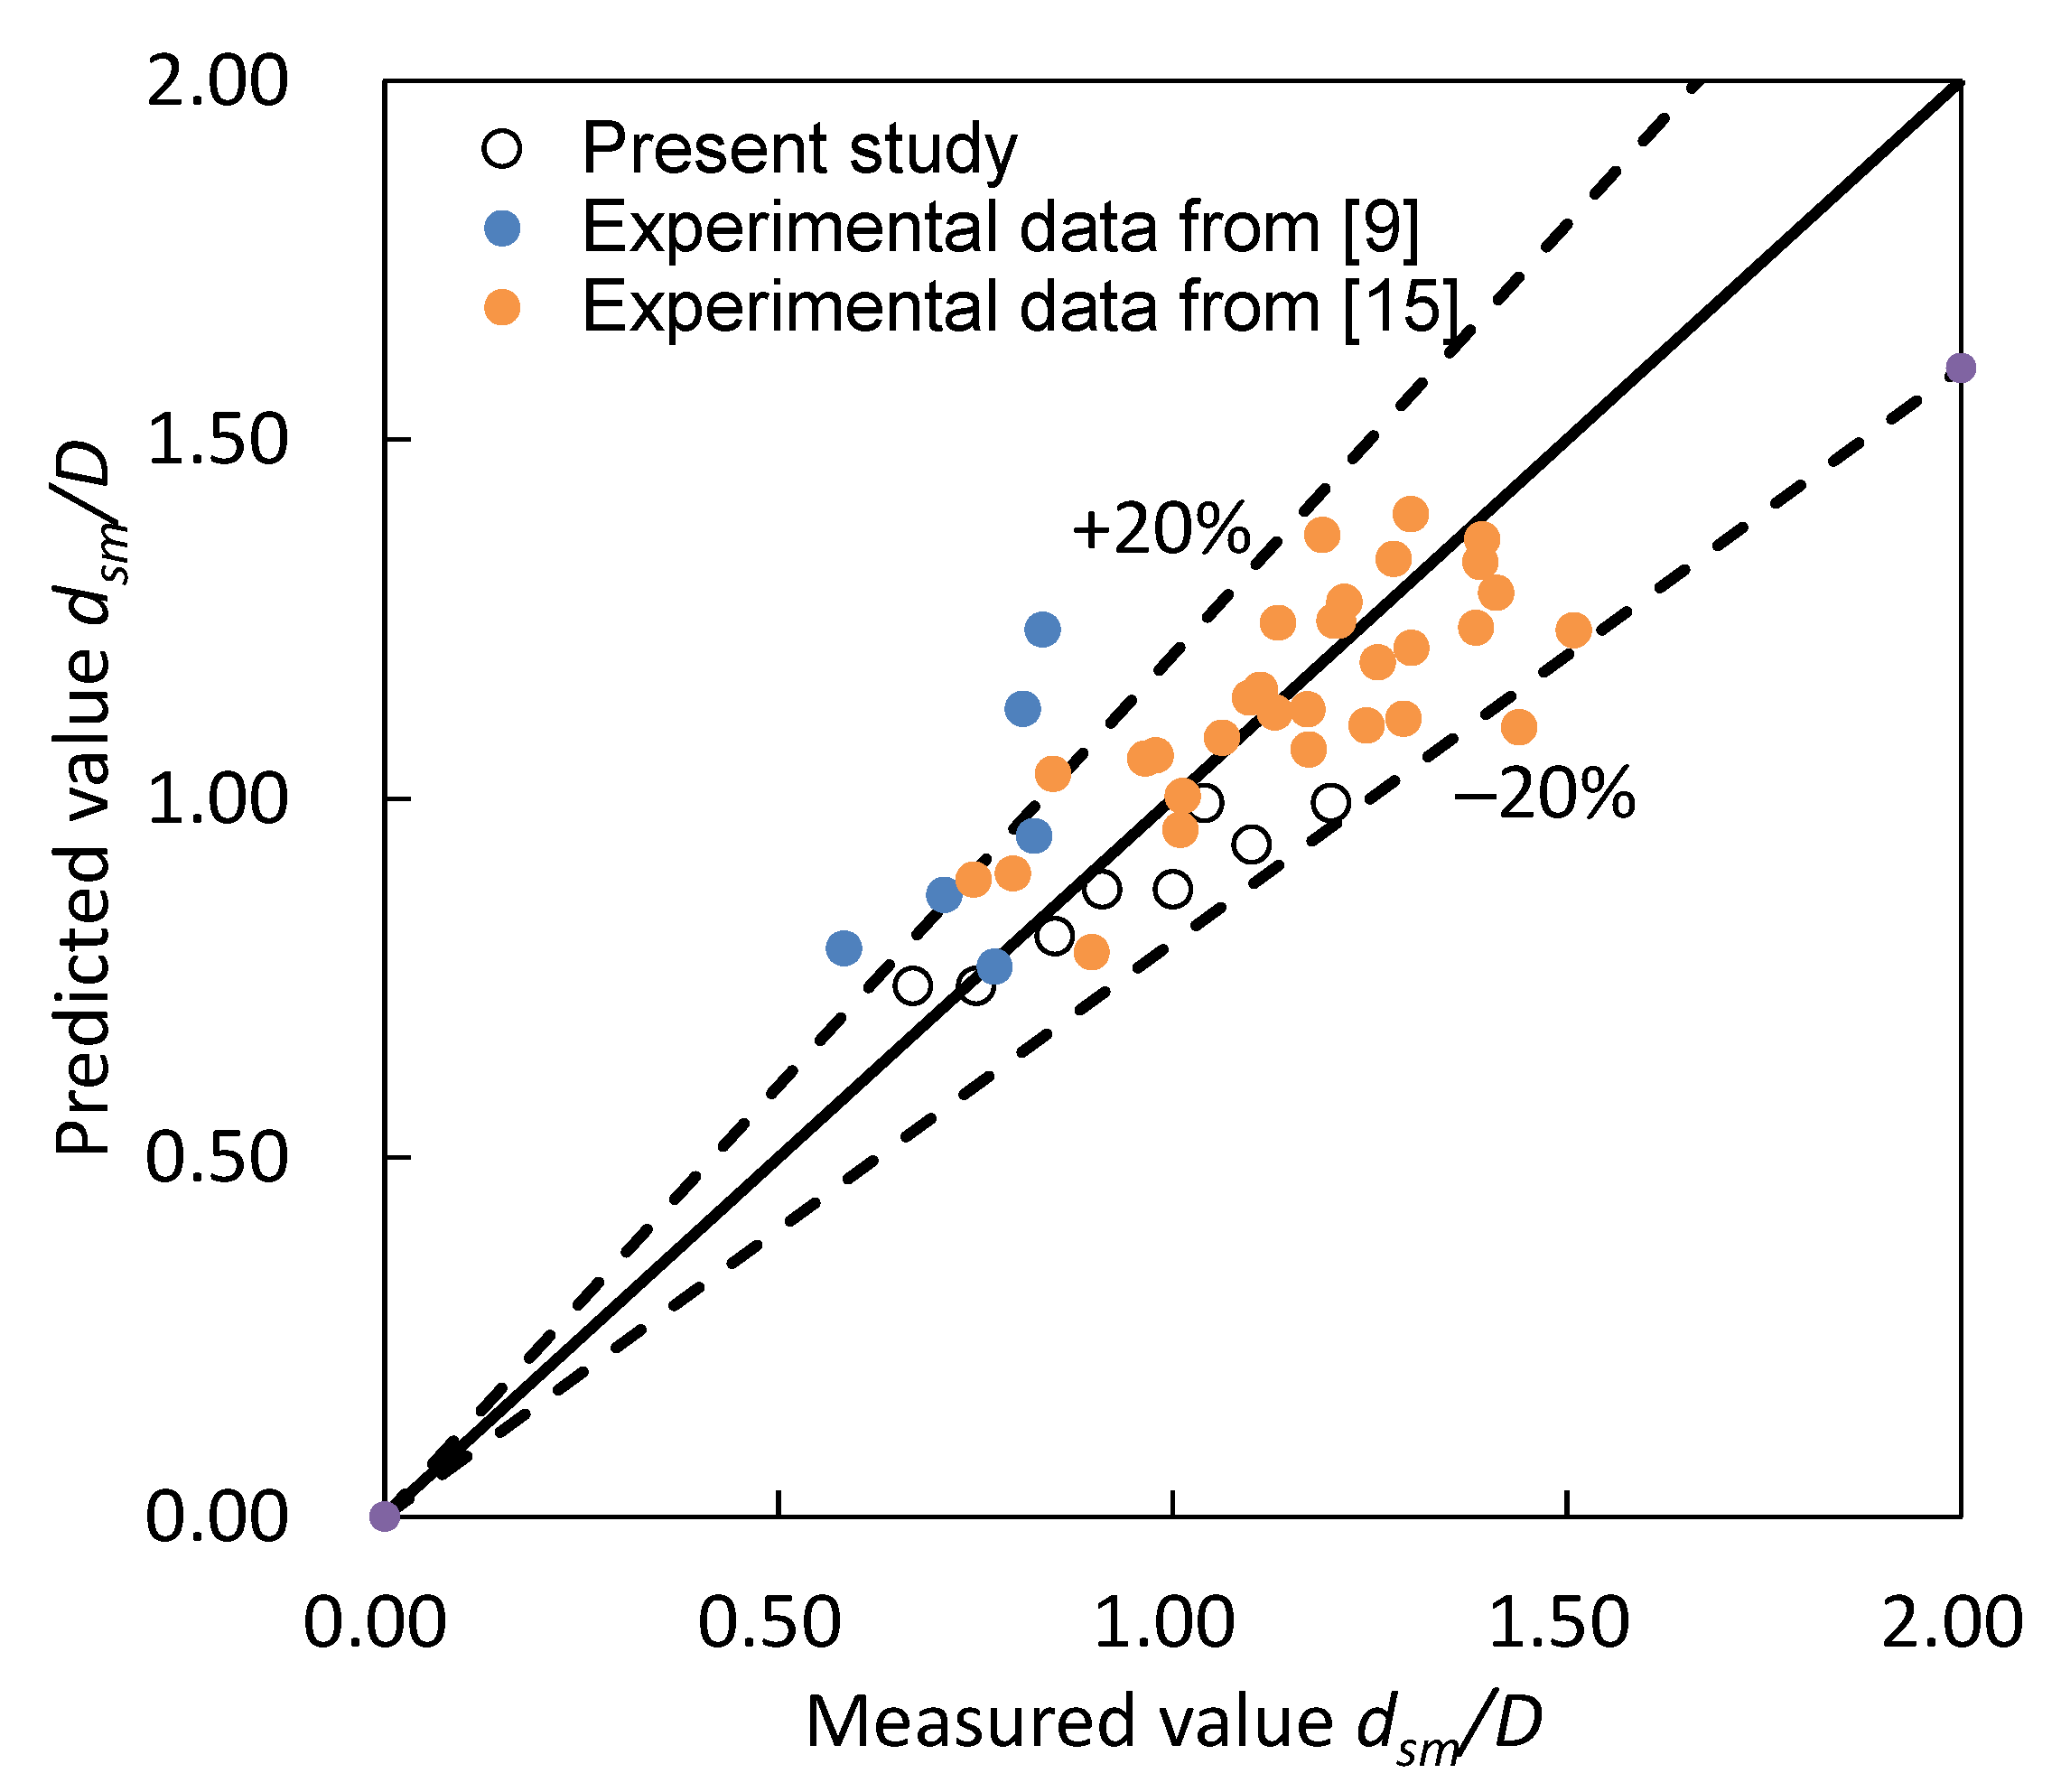
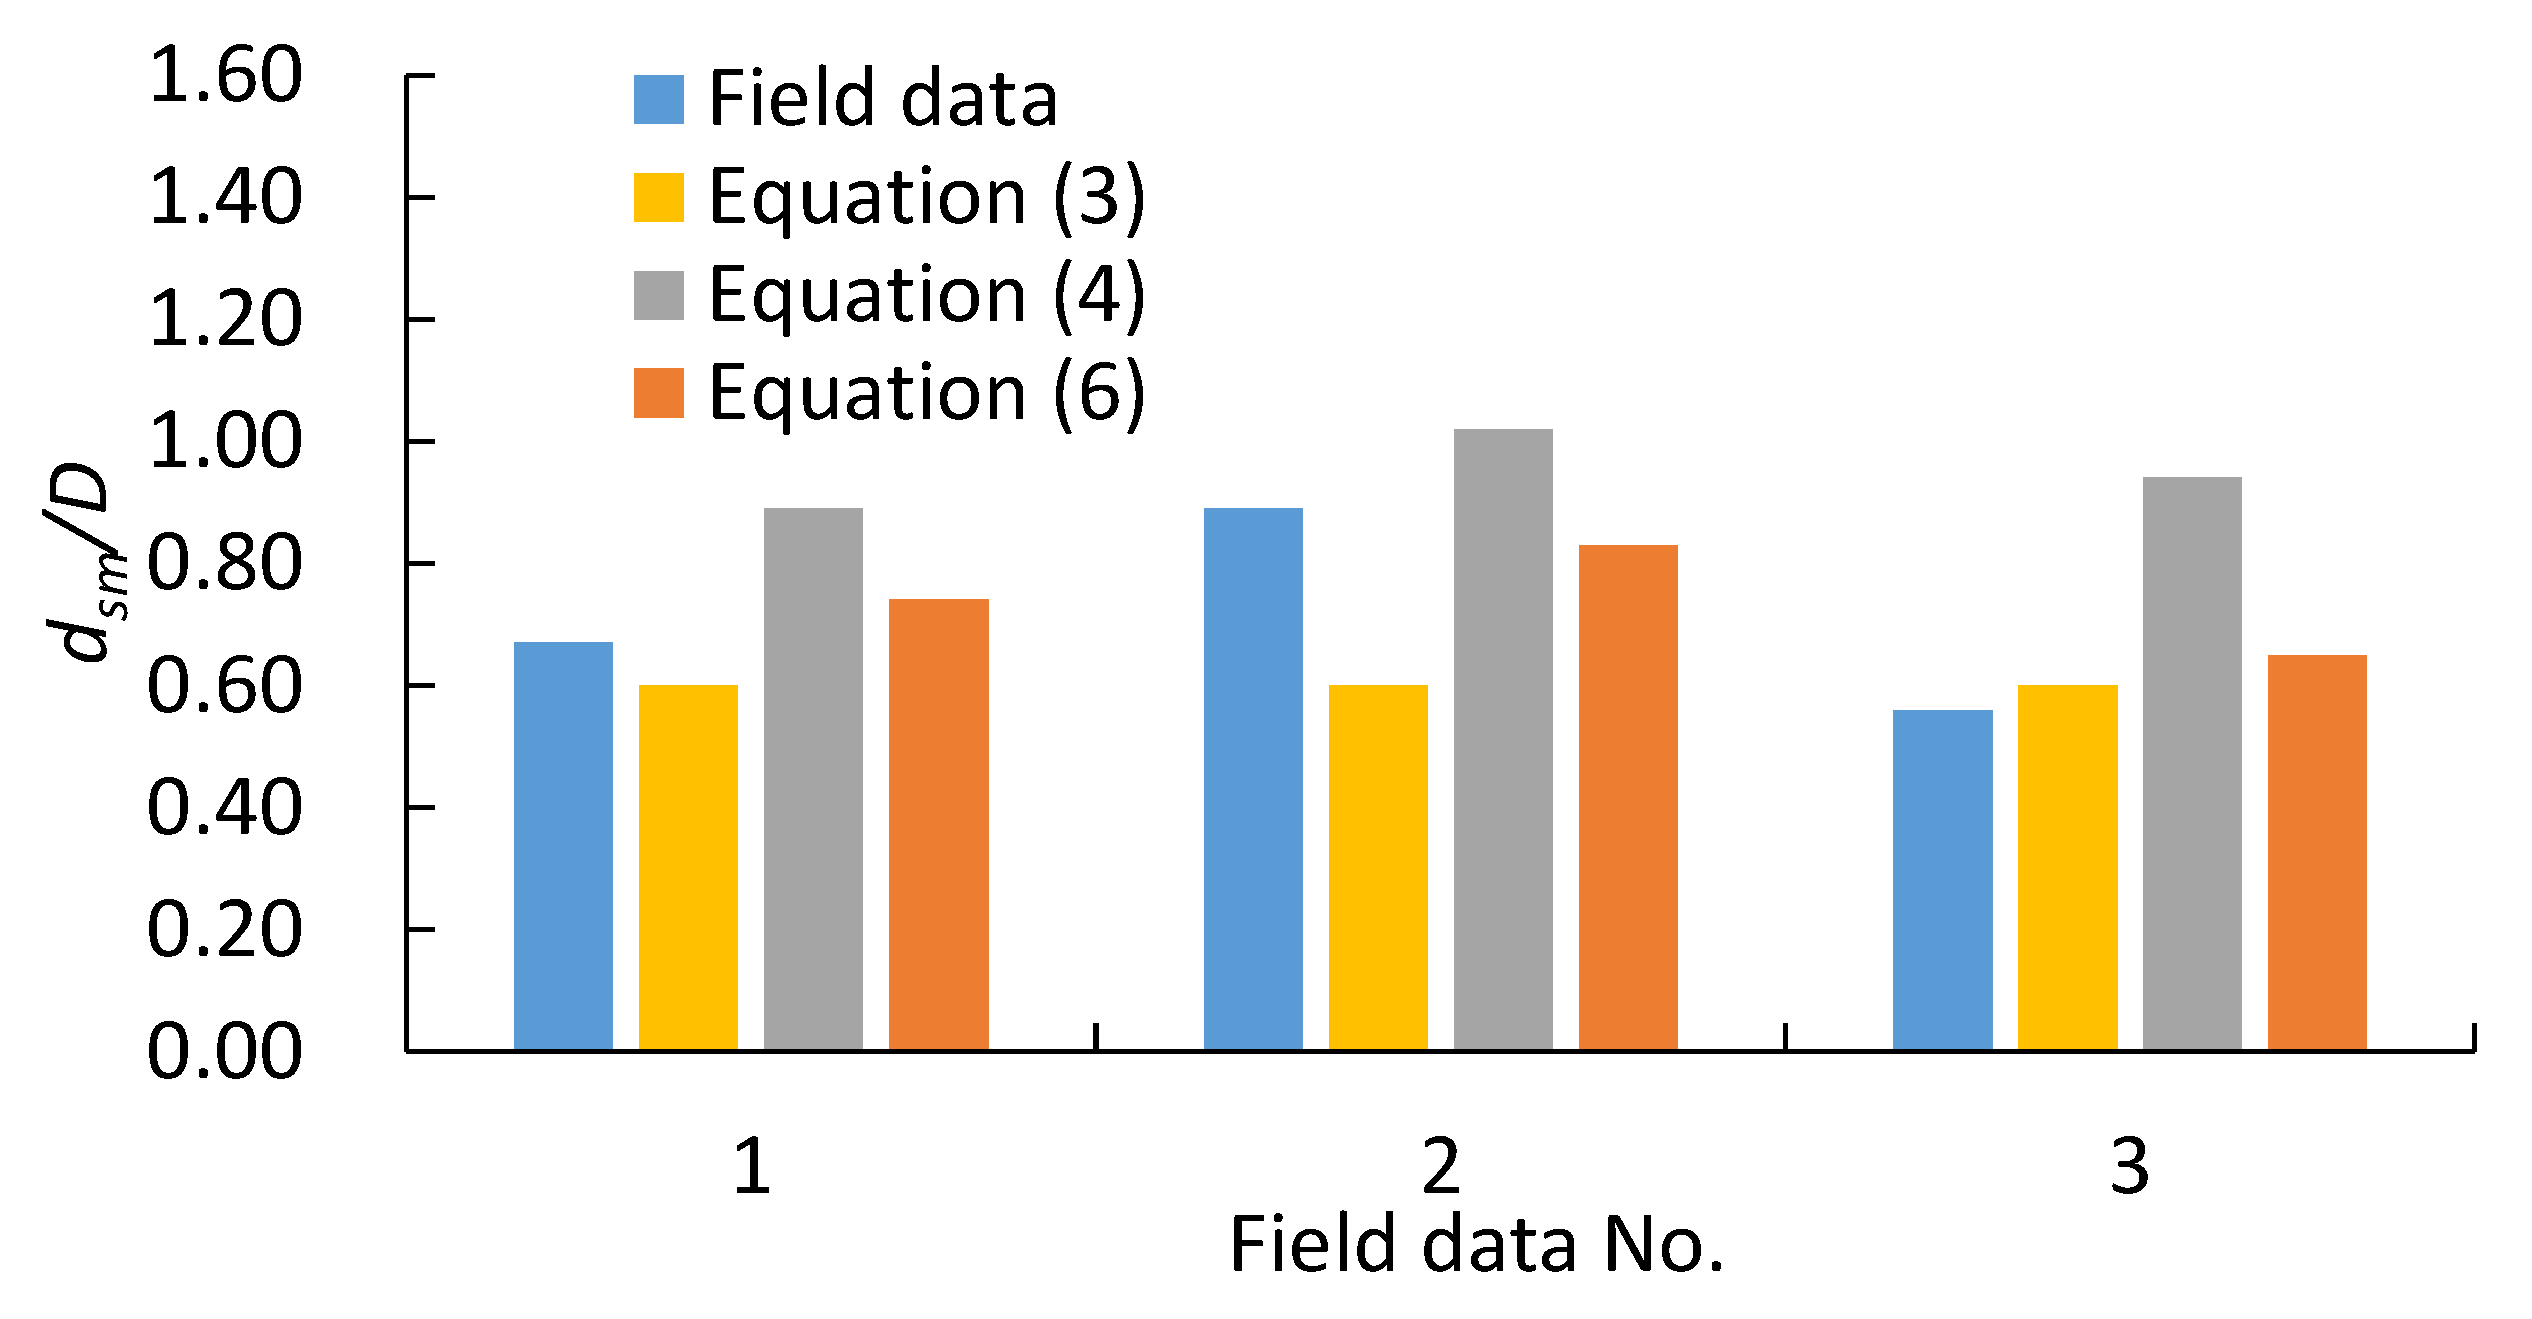
3.5. Comparison with Field Data
- KP3: three span segments and maximum scour depths of 0.3 m, 0.4 m and 0.6 m.
- KP12: four span segments and maximum scour depths of 0.2 m, 0.3 m, 0.4 m and 0.8 m.
- KP16: eight span segments and maximum scour depths of 0.3 m, 0.2 m, 0.1 m, 0.5 m, 0.2 m, 0.1 m, 0.1 m and 0.2 m.
4. Conclusions
- Under a bidirectional tidal current, the scour profile, with two dunes on both sides of submarine pipeline, was more symmetric than that subject to a unidirectional current. In addition, the scour width and depth under a bidirectional tidal current were both smaller than those under a unidirectional tidal current.
- For bidirectional tidal currents, the scour depth increased rapidly during the first half of the tidal cycle. After that, the scour depth only increased slightly when the flow was near maximum flood or ebb tidal velocity, and there was no scour development when flow was close to zero velocity. Additionally, the equilibrium scour depth under a bidirectional current was averagely 0.8 times of that under a unidirectional current whose flow velocity was equal to the maximum tidal velocity.
- An equation to predict live-bed scour depth around submarine pipelines under bidirectional tidal currents was developed. In this equation, the scour depth under a bidirectional current was predicted based on a new fitted equation for live-bed scour depth in unidirectional current coupling with a reduction coefficient of 0.8. This equation was used to predict scour depth in practical engineering and showed good agreement with field data, indicating that the present new equation could accurately predict live-bed scour depth around submarine pipelines under bidirectional currents in the field.
Author Contributions
Funding
Institutional Review Board Statement
Informed Consent Statement
Data Availability Statement
Conflicts of Interest
Notations
| d50 | sediment median diameter |
| D | pipeline diameter |
| Fr | Froude number |
| g | gravitational acceleration |
| h | water depth |
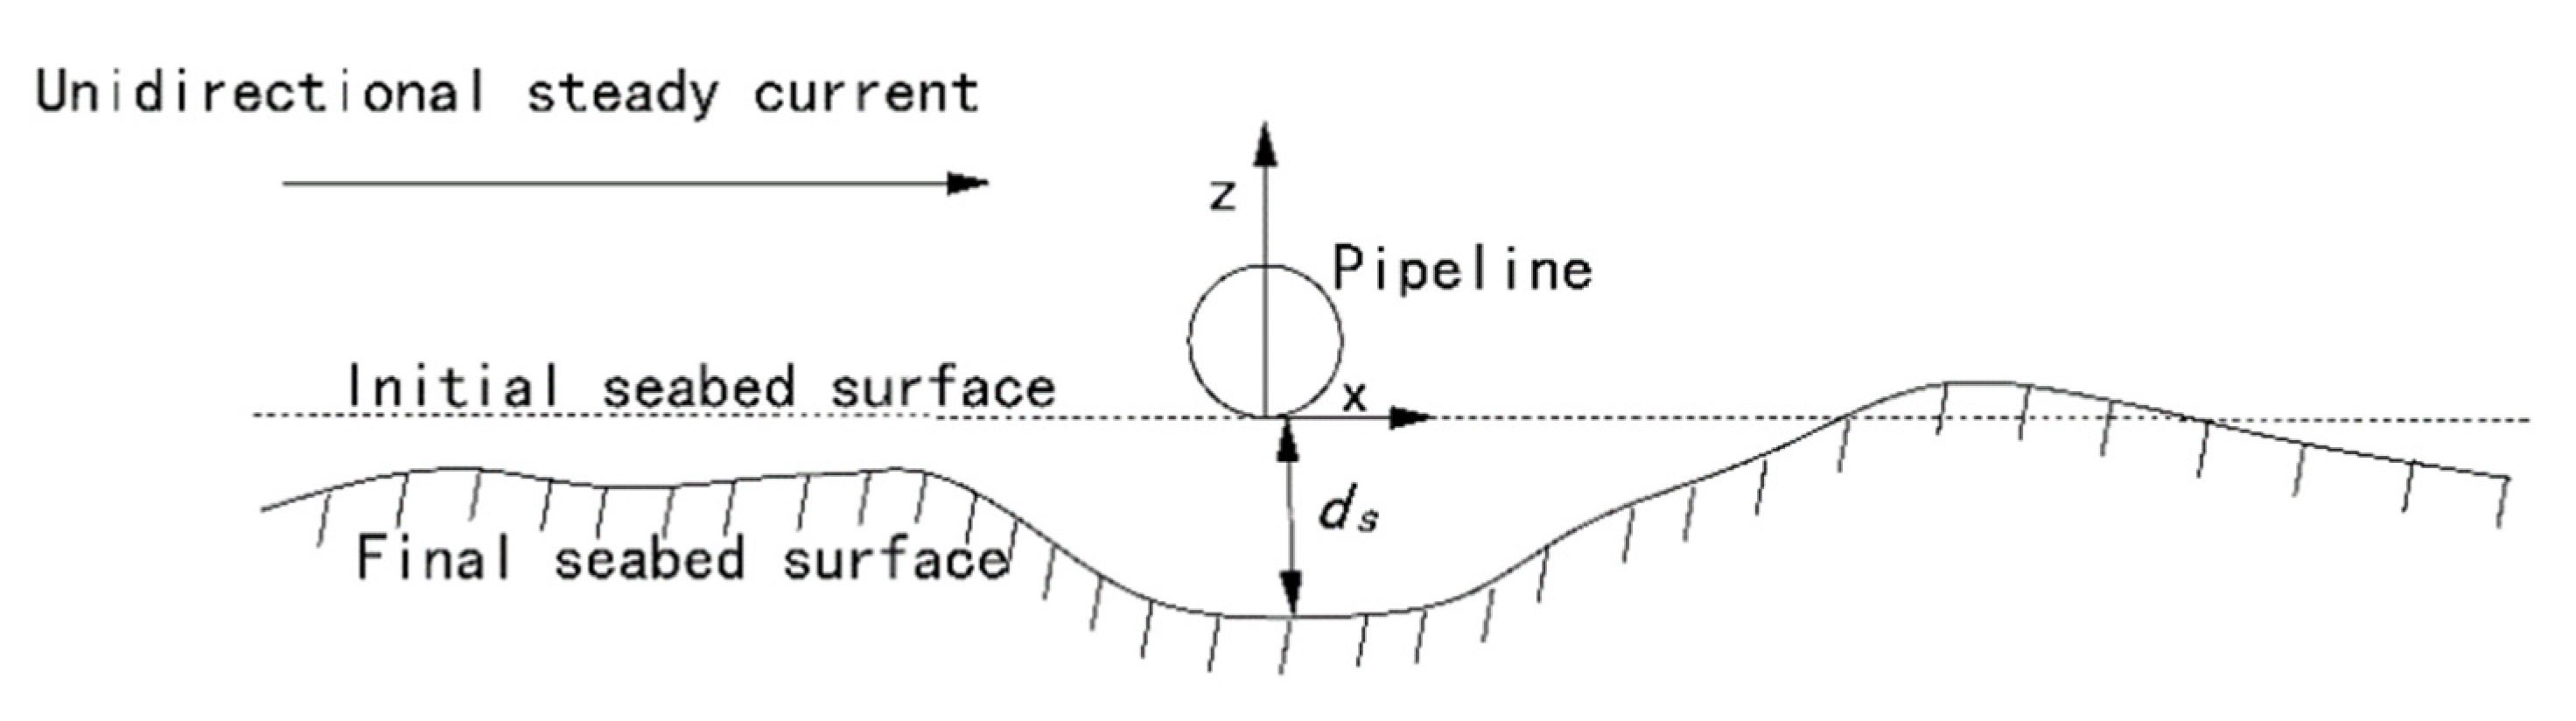
| ds | scour depth at x = 0.0 D |
| dsm | final maximum scour depth |
| KC | Keulegan–Carpenter number |
| t | time |
| T | tidal period |
| Tw | wave period |
| ut | velocity of tidal current at time t |
| umax | maximum peak velocity of tidal current |
| uc | critical velocity for sediment incipient motion |
| u0 | velocity of unidirectional current |
| uwmax | peak velocity of wave |
| x | horizontal direction |
| z | vertical direction |
| ρs | sediment density |
| ρ | water density |
References
- Chiew, Y.M. Prediction of maximum scour depth at submarine pipelines. J. Hydraul. Eng. 1991, 117, 452–466. [Google Scholar] [CrossRef]
- Sumer, B.M.; Fredsøe, J. The Mechanics of Scour in the Marine Environment; World Scientific Publishing Company: Singapore, 2002. [Google Scholar]
- Fredsøe, J. Pipeline–seabed interaction. J. Waterw. Port Coast. Ocean Eng. 2016, 142, 03116002. [Google Scholar] [CrossRef] [Green Version]
- Zhang, Q.; Draper, S.; Cheng, L.; An, H. Scour below a subsea pipeline in time varying flow conditions. Appl. Ocean Res. 2016, 55, 151–162. [Google Scholar] [CrossRef] [Green Version]
- Zhang, Q.; Draper, S.; Cheng, L.; Zhao, M.; An, H. Experimental study of local scour beneath two tandem pipelines in steady current. Coast Eng. J. 2017, 59, 1750002. [Google Scholar] [CrossRef]
- Zhang, Z.Y.; Shi, B.; Guo, Y.K.; Chen, D.Y. Improving the prediction of scour around submarine pipelines. Proc. Inst. Civ. Eng. -Marit. Eng. 2016, 169, 163–173. [Google Scholar] [CrossRef] [Green Version]
- Yang, L.P.; Guo, Y.K.; Shi, B.; Kuang, C.P.; Xu, W.L.; Cao, S.Y. Study of scour around submarine pipeline with a rubber plate or rigid spoiler in wave conditions. ASCE J. Waterw. Port Ocean Coast Eng. 2012, 138, 484–490. [Google Scholar] [CrossRef]
- Yang, L.P.; Shi, B.; Guo, Y.K.; Zhang, L.X.; Zhang, J.S.; Han, Y. Scour protection of submarine pipelines using rubber plates underneath the pipes. Ocean Eng. 2014, 84, 176–182. [Google Scholar] [CrossRef] [Green Version]
- Mao, Y. The Interaction between A Pipeline and An Erodible Bed; The Technology University of Denmark: Kongens Lyngby, Denmark, 1986. [Google Scholar]
- Chiew, Y.M. Mechanics of local scour around submarine pipelines. J. Hydraul. Eng. 1990, 116, 515–529. [Google Scholar] [CrossRef]
- Kjeldsen, S.P.; Gjorsvik, C.; Bringaker, K.G.; Jacobsen, J. Local scour near offshore pipelines. In Proceedings of the 2nd International Port and Ocean Engineering under Arctic Conditions, Reykjavik, Iceland, 27–30 August 1973; pp. 309–331. [Google Scholar]
- Bijker, E.W.; Leeuwestein, W. Interaction between pipelines and the seabed under the influence of waves and currents. In Seabed Mechanics; Denness, B., Ed.; Springer: Dordrecht, The Netherlands, 1984; pp. 235–242. [Google Scholar]
- Yang, L.P.; Shi, B.; Guo, Y.K.; Wen, X.Y. Calculation and experiment on scour depth for submarine pipeline with a spoiler. Ocean Eng. 2012, 55, 191–198. [Google Scholar] [CrossRef]
- Ibrahim, A.; Nalluri, C. Scour prediction around marine pipelines. In Proceedings of the 5th International Offshore Mechanics and Arctic Engineering, Tokyo, Japan, 13–18 April 1986; pp. 679–684. [Google Scholar]
- Moncada-M., A.T.; Aguirre-Pe, J. Scour below Pipeline in River Crossings. J. Hydraul. Eng. 1999, 125, 953–958. [Google Scholar] [CrossRef]
- Cevik, E.; Yuksel, Y. Scour under submarine pipelines in waves in shoaling conditions. J. Waterw. Port Coast. Ocean Eng. 1999, 125, 9–19. [Google Scholar] [CrossRef]
- Lin, Z.B.; Guo, Y.K.; Jeng, D.-S.; Liao, C.C.; Rey, N. An integrated numerical model for wave–soil–pipeline interactions. Coast. Eng. 2016, 108, 25–35. [Google Scholar] [CrossRef] [Green Version]
- Sumer, B.M.; Fredsøe, J. Scour below pipelines in waves. J. Waterw. Port Coast. Ocean Eng. 1990, 116, 307–323. [Google Scholar] [CrossRef]
- Pu, Q.; Li, K.; Gao, F.P. Scour of the seabed under a pipeline in oscillatory flow. China Ocean Eng. 2001, 16, 129–137. [Google Scholar]
- Etemad-Shahidi, A.; Yasa, R.; Kazeminezhad, M.H. Prediction of wave-induced scour depth under submarine pipelines using machine learning approach. Appl. Ocean Res. 2011, 33, 54–59. [Google Scholar] [CrossRef] [Green Version]
- Yasa, R. Prediction of the Scour Depth under Submarine Pipelines—In Wave Condition. J. Coast. Res. 2011, 64, 627–630. [Google Scholar]
- Zhang, J.; Shi, B.; Guo, Y.K.; Xu, W.L.; Yang, K.J.; Zhao, E.J. Scour Development Around Submarine Pipelines due to Current Based on the Maximum Entropy Theory. J. Ocean Univ. China 2016, 15, 841–846. [Google Scholar] [CrossRef]
- Liu, M.M. Numerical investigation of local scour around submerged pipeline in shoaling conditions. Ocean Eng. 2021, 234, 109258. [Google Scholar] [CrossRef]
- Zhang, Q.; Draper, S.; Cheng, L.; An, H. Time Scale of Local Scour around Pipelines in Current, Waves, and Combined Waves and Current. J. Hydraul. Eng. 2017, 143, 04016093. [Google Scholar] [CrossRef]
- Li, Y.; Ong, M.; Fuhrman, D.R.; Larsen, B.E. Numerical investigation of wave plus-current induced scour beneath two submarine pipelines in tandem. Coast. Eng. 2020, 156, 103619. [Google Scholar] [CrossRef]
- Zeng, J.; Chen, G.; Pan, C.; Zhang, Z. Effect of dike line adjustment on the tidal bore in the Qiantang Estuary, China. J. Hydrodyn. 2017, 29, 452–459. [Google Scholar] [CrossRef]
- Ma, L.; Wang, L.; Guo, Z.; Jiang, H.; Gao, Y. Time development of scour around pile groups in tidal currents. Ocean Eng. 2018, 163, 400–418. [Google Scholar] [CrossRef]
- Schendel, A.; Hildebrandt, A.; Goseberg, N.; Schlurmann, T. Processes and evolution of scour around a monopile induced by tidal currents. Coast. Eng. 2018, 139, 65–84. [Google Scholar] [CrossRef]
- McGovern, D.J.; Ilic, S.; Folkard, A.M.; McLelland, S.J.; Murphy, B.J. Time Development of Scour around a Cylinder in Simulated Tidal Currents. J. Hydraul. Eng. 2014, 140, 04014014. [Google Scholar] [CrossRef]
- Zhu, L.; Liu, K.; Fan, H.; Cao, S.; Chen, H.; Wang, J.; Wang, Z. Scour beneath and adjacent to submarine pipelines with spoilers on a cohesive seabed: Case study of Hangzhou Bay, China. J. Waterw. Port Coast Ocean Eng. 2019, 145, 05018009. [Google Scholar] [CrossRef]
- Zhang, R.J.; Xie, J.H.; Wang, M.F. River Sediment Dynamics; China Water and Power Press: Beijing, China, 1998. [Google Scholar]


| Test | Pipe Diameter D (m) | Water Depth h (m) | u0 (m/s) | umax (m/s) | u0/uc or umax/uc | Root Mean Velocity ur (m/s) | Maximum Scour Depth dsm (m) |
|---|---|---|---|---|---|---|---|
| Uni01 | 0.045 | 0.30 | 0.30 | 1.07 | 0.30 | 0.034 | |
| Uni02 | 0.045 | 0.30 | 0.35 | - | 1.25 | 0.35 | 0.038 |
| Uni03 | 0.045 | 0.30 | 0.40 | - | 1.43 | 0.40 | 0.046 |
| Uni04 | 0.045 | 0.30 | 0.45 | 1.61 | 0.45 | 0.050 | |
| Uni05 | 0.045 | 0.30 | 0.50 | - | 1.79 | 0.50 | 0.054 |
| Uni06 | 0.075 | 0.30 | 0.30 | 1.07 | 0.30 | 0.051 | |
| Uni07 | 0.075 | 0.30 | 0.40 | - | 1.43 | 0.40 | 0.068 |
| Uni08 | 0.075 | 0.30 | 0.50 | - | 1.79 | 0.50 | 0.078 |
| Tide01 | 0.045 | 0.30 | - | 0.30 | 1.07 | 0.19 | 0.024 |
| Tide02 | 0.045 | 0.30 | - | 0.35 | 1.25 | 0.22 | 0.034 |
| Tide03 | 0.045 | 0.30 | - | 0.40 | 1.43 | 0.25 | 0.038 |
| Tide04 | 0.045 | 0.30 | - | 0.45 | 1.61 | 0.29 | 0.041 |
| Tide05 | 0.045 | 0.30 | - | 0.50 | 1.79 | 0.32 | 0.043 |
| Tide06 | 0.075 | 0.30 | - | 0.30 | 1.07 | 0.19 | 0.045 |
| Tide07 | 0.075 | 0.30 | - | 0.40 | 1.43 | 0.25 | 0.058 |
| Tide08 | 0.075 | 0.30 | - | 0.50 | 1.79 | 0.32 | 0.066 |
| Hung Segment Location | Pipeline Diameter D (m) | Water Depth H (m) | Maximum Tidal Velocity umax (m/s) | Sediment Incipient Velocity uc (m/s) | umax/uc | Froude Number Fr | Measured Scour Depth dsm/D |
|---|---|---|---|---|---|---|---|
| KP3 | 0.9 | 5.0 | 1.6 | 0.8 | 2.0 | 0.23 | 0.67 |
| KP12 | 0.9 | 8.0 | 2.1 | 1.0 | 2.1 | 0.24 | 0.89 |
| KP16 | 0.9 | 10.0 | 1.8 | 1.1 | 1.6 | 0.18 | 0.56 |
| Field Data dsm/D | Equation (6) | Equation (3) | Equation (4) | |||
|---|---|---|---|---|---|---|
| Predicted Value dsm/D | Absolute Error | Predicted Value dsm/D | Absolute Error | Predicted Value dsm/D | Absolute Error | |
| 0.67 | 0.74 | 0.07 | 0.60 | −0.07 | 0.89 | 0.22 |
| 0.89 | 0.83 | −0.06 | 0.60 | −0.29 | 1.02 | 0.13 |
| 0.56 | 0.65 | 0.09 | 0.60 | 0.04 | 0.94 | 0.38 |
Publisher’s Note: MDPI stays neutral with regard to jurisdictional claims in published maps and institutional affiliations. |
© 2021 by the authors. Licensee MDPI, Basel, Switzerland. This article is an open access article distributed under the terms and conditions of the Creative Commons Attribution (CC BY) license (https://creativecommons.org/licenses/by/4.0/).
Share and Cite
Zhang, Z.; Guo, Y.; Yang, Y.; Shi, B.; Wu, X. Scale Model Experiment on Local Scour around Submarine Pipelines under Bidirectional Tidal Currents. J. Mar. Sci. Eng. 2021, 9, 1421. https://doi.org/10.3390/jmse9121421
Zhang Z, Guo Y, Yang Y, Shi B, Wu X. Scale Model Experiment on Local Scour around Submarine Pipelines under Bidirectional Tidal Currents. Journal of Marine Science and Engineering. 2021; 9(12):1421. https://doi.org/10.3390/jmse9121421
Chicago/Turabian StyleZhang, Zhiyong, Yakun Guo, Yuanping Yang, Bing Shi, and Xiuguang Wu. 2021. "Scale Model Experiment on Local Scour around Submarine Pipelines under Bidirectional Tidal Currents" Journal of Marine Science and Engineering 9, no. 12: 1421. https://doi.org/10.3390/jmse9121421
APA StyleZhang, Z., Guo, Y., Yang, Y., Shi, B., & Wu, X. (2021). Scale Model Experiment on Local Scour around Submarine Pipelines under Bidirectional Tidal Currents. Journal of Marine Science and Engineering, 9(12), 1421. https://doi.org/10.3390/jmse9121421