Abstract
In the oceans and coasts, plastic waste poses a global threat to biodiversity. This study examined the types and distribution of microplastics in beach sediment along the coast of the eastern Gulf of Thailand in March 2018 (northeast monsoon = dry season) and July 2018 (southwest monsoon = rainy season). Microplastic samples were collected from six stations including Koh Khramyai Beach (Chonburi Province), Koh Mannai Beach (Rayong Province), Chao Lao Beach (Chanthaburi Province, 3 stations), and Ploy Dang Beach (Trat Province). The results showed that the highest average abundances of microplastics in March and July were at Koh Mannai Beach (1698 pieces/m2) and Koh Khramyai Beach (799 pieces/m2), respectively. However, no microplastics were found at Ploy Dang Beach in July. According to polymer-type identification using an FTIR spectrometer, 17 polymer types were found in this study. Polyethylene terephthalate (PET = 39.6%) and polyamide (PA = 22.8%) were the polymer types found in the highest proportions in March and July, respectively. In addition, the fiber shape and transparent color of microplastics were found to be the most abundant.
1. Introduction
Plastic waste is a global environmental problem. It was found that more than 8300 million tons of plastics were produced worldwide from 1950 to 2017. It was also estimated that plastic production would likely exceed 33 billion tons by 2050. Furthermore, approximately 8 million tons of plastic waste were released into the ocean in 2015. It is expected that this figure will increase to 12 billion tons by 2050 [1]. Therefore, plastic waste continues to accumulate in the environment and spreads across ecosystems as large plastics, after which they are broken into smaller pieces in the ocean until tiny particles become smaller than 5 mm, called “microplastics”, which originate from the degradation of large plastics or the production of small pellets from plastics used in household and industrial applications. A relationship between the increase in amounts of microplastics with high population density and urban development [2,3,4] in the ecosystem is normally determined. Hence, this is an urgent environmental problem that must be addressed since it is a threat to human health and ecosystems. This is due to the ability of microplastic debris to absorb environmental contaminants on its surface during its sea journey over long periods. Thus, it may contain toxins or contaminants such as polychlorinated biphenyls (PCBs), polycyclic aromatic hydrocarbons (PAHs), heavy metals, and other pollutants [5,6,7,8]. As marine organisms eat microplastics, they can also be passed into the food chain [9,10]. The widespread distribution of microplastics in ocean water, seafloor, and beaches [11,12,13,14] is observable. Furthermore, the presence of microplastic debris in polar regions [15,16] has been reported in bivalves, fish, seabirds, benthic fauna, and plankton [17,18,19,20].
Currently, plastic debris and marine waste are important problems for Thailand, ASEAN, and the world [21]. Thailand has been ranked sixth in terms of contributing plastic waste into the sea, and the Thai Government has already realized this urgent and critical problem needs to be resolved immediately. Marine plastic waste is not a serious problem just for Thai water, it is also an international critical problem that needs to be addressed and solved promptly. For Thailand, very few previous studies on marine waste and microplastics in the environment and living organisms have been published, such as the studies conducted in biota from Songkhla Lagoon [22], in the economic fish in the lower Gulf of Thailand [23], in sessile invertebrates in the eastern coast of Thailand [24], and shrimp sold in local markets [25]. Very few microplastic studies on the coast such as in sediment from sand and mud beaches in Libong Island, a pristine area in Thailand, are available [26]. Microplastics investigations in beach ecosystems have been conducted in limited areas, especially beaches with tourist attractions. At present, microplastic debris in sediment is a crucial problem and a hot issue in the world. Hence, several studies have been conducted, such as the study of Chan and Chen [27], which reported microplastic contamination (25 pieces/m2) from eight beaches in Taiwan. Hamid et al. [28] revealed the occurrence of microplastics (30 item/m2) at 4 beaches in Phang, Malaysia. Ibrahim et al. [29] reported on microplastics occurrence at the Situ wetlands, a pristine area in Malaysia, while Akkajit et al. [30] found microplastics contamination at 6 beaches in Phuket, the most popular tourist attraction site in Thailand. Last, Fok et al. [31] reviewed microplastics abundance in the sediment in China.
There have also been very little data published regarding microplastics abundance in the sediment of the coast of the Eastern Gulf of Thailand. Therefore, the objective of this study was to investigate the existing situation of microplastic contamination in the beach environment, which is likely to be affected by human activities and plastic pollution. The results from this study can provide valuable information for finding suitable ways to manage marine debris that has the high potential to jeopardize coastal tourism activities in the future.
2. Materials and Methods
2.1. Study Area and Sample Collection
Four beaches (six stations) in the eastern part of Thailand were selected for this study (Figure 1 and Table 1). The sampling stations were selected based on human activities and utilization patterns, covering tourist beaches: Chao Lao Beach, Chanthaburi Province (three stations: CL1, CL2, and CL3); Ploy Daeng: PD, Trat Province; Koh Mannai Beach: KM, Rayong Province, and Koh Khramyai: KK, Chonburi Province. The samples were collected in March 2018 (representative of the northeast monsoon: dry season) and in July 2018 (the southwest monsoon: rainy season).
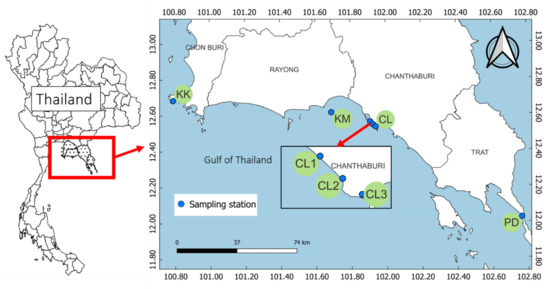
Figure 1.
Map and location coordinates of the sediment sampling stations in the eastern Gulf of Thailand during March and July 2018.

Table 1.
Position of sampling stations at four beaches in the eastern part of Thailand in 2018.
In each sampling station, two lines (100 m length) were selected; at the highest tide line and the middle line between the highest tide and the lowest tide. In each line every 25 m, take 1 replication of the sediment sample with 0–5 cm depth in a square frame of 50 cm × 50 cm and a total of four replicates per line (one station = eight replicates). Scoop all the sand sediment in the square frame (about approximately 2–3 kg). Put it in a container in case the samples were wet and sieve at the laboratory later after drying. If the samples were dry, sifted through 5 mm and 1 mm sieves at the beach, keep the sediment 400 mL (about 640–700 g dry weight in one replicate) and bring it back to the laboratory for further separation of microplastics. To minimize the risk of microplastic contamination, care was taken in every step and all material used in the field was made from glass or stainless steel.
2.2. Experimental Control
To avoid microplastic contamination, all glassware and containers used in this study were rinsed with deionized water. 30% hydrogen peroxide (H2O2) and saturated NaCl (1.2 g/cm3) solutions were filtered through 47 mm Whatman GF/C glass microfiber papers with 1.2 µm pore size. The blank control contained filtered distilled water placed in five areas in the laboratory. To minimize airborne microplastics contamination, all the samples were covered with lids or aluminum foil. The blank control with all the same glassware, container, filter paper, deionized water, and chemical reagents was placed in the laboratory. The result from blank control showed no microplastic contamination.
2.3. Sample Analysis
The sieved samples were passed through a 1 mm sieve and analyzed using the modified method of the NOAA Marine Debris Program [32]. The sieved sediment (size <1 mm) in one line (four replicates) was pooled together (total 1600 mL) for homogenizing the sample. Thereafter, subsampling 400 mL (about 640–700 g) was randomly undertaken, transferred to four containers (one container was about 100 mL), and left in an oven at 50–60 °C for 24 h for drying. The dry sediment of each container was weighed and recorded. Dry sediment was transferred to a 500 mL beaker (total four beakers) and then saturated saline NaCl (1.2 g/cm3) was added. The slurry mix was allowed to settle for 24 h to separate microplastics debris from the sediment. The solution was poured through a 300 µm filter cloth, and the second solution was filtered through GF/C filter paper. The sample left on a 300 µm filter cloth was taken to a 500 mL beaker. Subsequently, 20 mL of ferrous sulfate and 20 mL of 30% hydrogen peroxide (H2O2) were added to remove organic matter. The supernatant was filtered through GF/C filter paper using a vacuum system. After filtration, the filter paper was dried in an oven at about 60 °C. The particles on the filter were identified and counted under a stereomicroscope, Olympus model SZ61 with magnification of 10–40 times coupled with an additional camera, Dyno-eyes (brand Dino lite), since it can detect very small particles; the smallest size of our microplastic was 20 µm. We counted the MPs on the filter paper and then recorded the microplastics found on the filter paper. To distinguish between organic and non-organic materials (plastic), we followed the rules of Hidalgo-Ruz [33] as Rule 1: no cellular or organic structures visible, Rule 2: fibers should be equally thick throughout their entire length, and Rule 3: particles should exhibit homogenous color throughout the item. We also applied the hot needle test (de Witte et al., 2014) for suspected cases, which was useful in cases when we were unable to distinguish between plastic and organic matter. In the presence of a hot needle, plastic pieces will melt or curl. The sediment between 5–1 mm was sieved, weighed, and sorted visually under a stereomicroscope. All the microplastics found were recorded for size based on three class sizes (1–5 mm; 300 µm–<1 mm; 20 µm–<300 µm), color (green, yellow, blue, black, red, transparent, and white) and shape (fibers, sheets, and rods).
2.4. Microplastic Identification
Approximately 20% of sorted microplastics from all stations was selected from size classes and analyzed to identify the polymer types using a micro Fourier transform infrared (µFTIR) spectrometer (IRT-5200 FTIR Microscope from JASCO). The particle was transferred to Potassium bromide (KBr) glass slide size 3 mm with forceps and covered with another KBr plate to make the sample ready for µFTIR analysis. To minimize the error from the background during the identification process, we measured the background value at the empty space and then we moved to measure the target item. The wavelength used was 4000–600 cm−1 with transmission mode and scanned eight times per one target plastic. The obtained polymer type was compared with the library called Bio-Rad Laboratories, and 70% matching was accepted.
2.5. Data Analysis
Data analysis of microplastics abundance, size, color, and shape was performed using MS Excel 2007 (Office Professional Plus 2019) software. Paired sample t-test was used to test for the differences of microplastic abundance in sediment in March 2018 under the influence of the northeast monsoon (dry) season and July 2018 under the influence of the southwest monsoon (rainy) season. To reduce non-normality, raw data were transformed to Log (X + 1) before testing by using the R program (R Core Team 2019).
3. Results and Discussion
3.1. Microplastic Occurrence
In microplastics debris in the sediment samples obtained from the beaches of the eastern Gulf Coast of the six stations, the amounts of microplastics ranged from 0–1698 pieces per square meter and 0–33 pieces/kg (dry weight) as shown in Table 2. However, microplastic particles were found at all the stations in both seasons except the PD station during the rainy season. Though both KM and KK were undeveloped beaches (sea turtle nesting conservation areas = intact beaches), KM unexpectedly had the highest amount of microplastics found in the sediment during the dry season and KK possessed the highest microplastic occurrence in the sediment during the rainy season. The possible explanation was that microplastics from tourist and fishing activities were probably transported by the clockwise flow of the Thai gulf current from nearby at Pattaya Beach, Chonburi Province to KK, during the rainy season whereas they were possibly carried by the anticlockwise flow of the Thai gulf current from CL to KM during the dry season (Figure 2). This probably indicates that the higher amount of microplastic particles present in the sediment is not suitable for being an indicator of the degree of higher contamination level of the study beach. This is because they are easily transported as suspended load by current, wave, tides, and coastal erosion processes from other places to the deposit site. Thus, there exists a dynamic quantity of microplastics present in the sediment according to their short residence time in the coastal sediment. Moreover, the highest proportion of the microplastic size of 20–<300 μm were found at all the stations except CL2 station in the dry season and CL1 in the rainy season (Figure 3). The diffusion of microplastics is related to the ebb and flow factor of the tide, which is caused by the accumulation of microplastics along tidal lines, especially during the high tides, and tends to accumulate along the area with an abundance of algae or other flora on the beach. This is mainly influenced by human activities such as tourism, aquaculture, and port construction, including river flow rates [34,35]. Surprisingly, the abundant occurrence in our study at CL1–CL3 = 4–17 pieces/kg is considerably lower than that of the previous study by DMCR, 2014 (103–153 pieces/kg) by 13–20 times, even though there has been a continuous tendency increase in tourist activities around the study site during the past 5 years [36]. The possible explanations for this unexpected result are as follows: (1) the most microplastics present in the sediment were not in situ, carried from other places, and arrived at the deposit site from the tide, wave, and current. Hence, their abundance in the sediment is not directly related to the activities at the deposit site; (2) the microplastics are small in size, mostly low density, and therefore are very easily transported by waves, currents, tides, and coastal erosion processes as suspended loads. They also have a short residence time at the deposit site. This is a very dangerous characteristic since they have a high potential to contaminate the seawater and threaten the marine ecological system, and thus are very difficult to be cleaned up from the delicate marine environment. Other evidence that supports this explanation is the absence of the microplastics present in the station PD during the rainy season in our study (Table 2).
Table 2.
Mean and standard deviation (SD) of microplastic particles per 1 square meter of the sampling area and 1 kg dry weight of sediment sample.
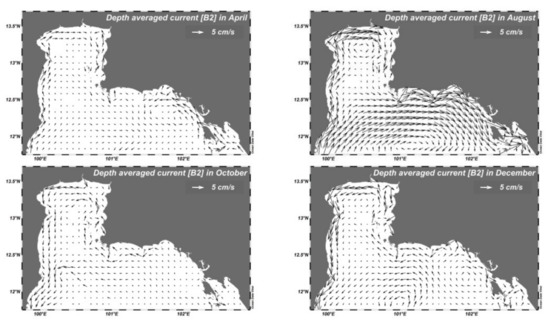
Figure 2.
Average current flow by monthly representing the different seasons in the northern Gulf of Thailand (arrows denote the direction and speed of the currents) (Tong-u-dom, et al. 2017) [37].
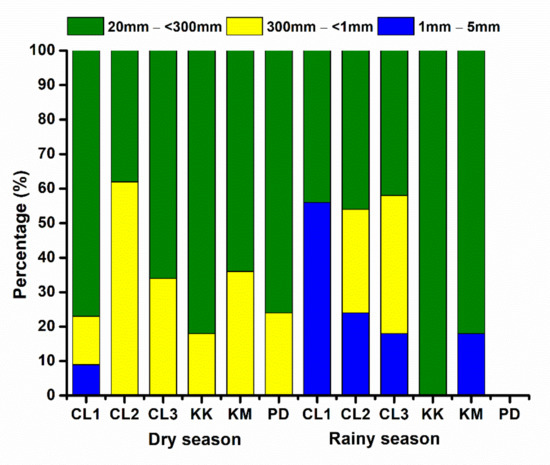
Figure 3.
The percentage of three class sizes of microplastics found in beach sediment.
The t-test analysis of microplastics present in sediment in March 2018 (dry season) had more abundance than that in July 2018 (rainy season) with significance level of (p < 0.01). As expected, the results of our study showed more sediment deposits in the beach sediment in the dry season than in the rainy season, probably owing to the lower wave energy in the dry season than that of the rainy season. This appearance is concordant with the t-test analysis of microplastics presence in sediment in March 2018 (dry season) possessing more abundance than in July 2018 (rainy season) significantly (p < 0.01).
3.2. Physical Characteristics of Microplastics: Shape and Color
The results of the shape and color classification of microplastics are shown in Figure 4a,b. The acquired microplastics were classified in two ways: shape (fibers, sheets, and rods) and color (white, clear, red, black, blue, yellow, and green). An example of microplastic shapes collected from the beach sediment on the eastern Gulf Coast is shown in Figure 5. The shape analysis revealed that the fibers were the most abundant in sediment samples ranging from 46.87 to 100.00%, which is congruent with the microplastics studies in China and Canada that showed the highest-fiber types of microplastics found in beaches [38,39]. Furthermore, the most identified color was transparent for all samples, followed by black and red. It was also found that most microplastic (20–300 μm) samples had clear and black colors. It is assumed that these microplastic sources are related to human activities on the coast. The majority of sheet plastic fragments possibly came from the breakdown of plastic bags, which are commonly used for packing food or products, whereas fiber debris probably derived from the decomposition of fishing gear, clothes, and garments.
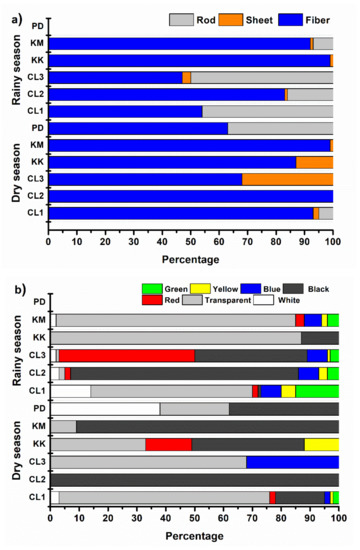
Figure 4.
Percent of microplastic occurrence based on (a) shape, (b) color.
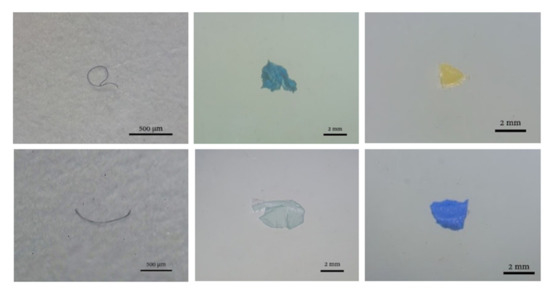
Figure 5.
Examples of microplastic shapes collected from the beach sediment on the eastern Gulf Coast.
3.3. Type of Polymers of Microplastics
The results of the analysis of the polymer types of microplastic particles were divided into 17 types: polyethylene terephthalate (PET), polyethylene (PE), polypropylene (PP), polyester (PES), polystyrene (PS), styrene-butadiene rubber (SBR), polychloroprene (CR), polyvinylchloride (PVC), polytetrafluoroethylene (PTFE), resin, polyethylene chlorinated (CPE), polyamide (PA), high-density polyethylene (HDPE), nitrile butadiene rubber (NBR), ethylene-propylene diene (EPDM), rubber, unidentified plastic polymers, etc. (Figure 6). Compared between the seasons, the most common polymer types were present during the dry season (March 2020) at CL1, CL2, KK, and KM stations = PET and CL3 station = PTFE and PD station = PES and PS. In the rainy season (July 2020), the most common types of polymer were found at CL1 and KK stations = PA, CL2, and KM stations = PET and CL3 station = EDPM. An example of the spectra of polymers found on the study beaches is shown in Figure 7. The highest amount (percentage) found was PET plastic since this type of plastic tends to be cheap and widely used in the food and consumer industries. For the microplastic debris with fiber appearance, the highest proportion found was PA, and it might have sources from fishing equipment such as nets, trawl, and ropes that could accumulate more in sediment than other plastic polymers.
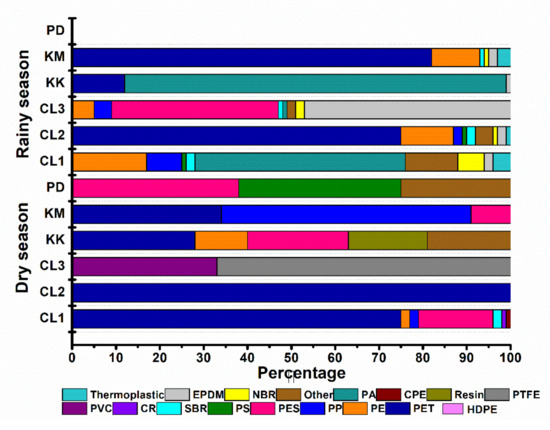
Figure 6.
Polymer types found on the beaches in the eastern part of Thailand.
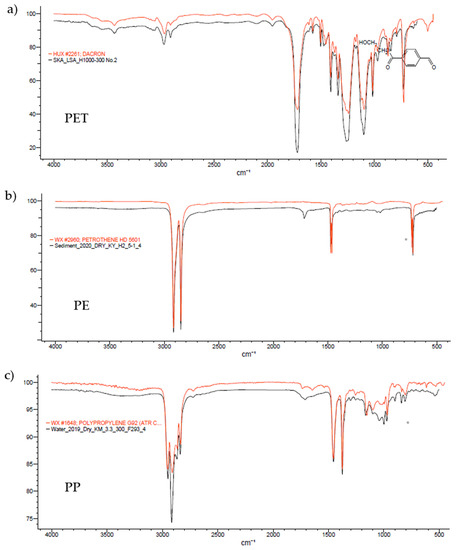
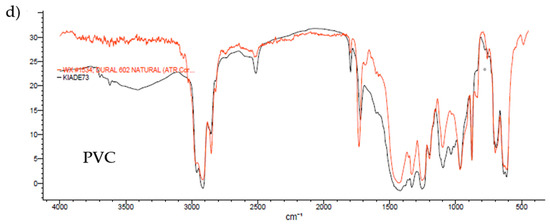
Figure 7.
Example of Fourier transform infrared (FTIR) spectroscopy Analysis of abundant polymers found in this study: (a) Polyethylene Terephthalate (PET), (b) Polyethylene (PE), (c) Polypropylene (PP) and (d) Polyvinyl Chloride (PVC).
4. Conclusions
From the study results of the six stations of sediment samples on the eastern Gulf of Thailand, microplastics were found to have the highest occurrence in March (northeast monsoon: dry season) at the KM and in July (southwest monsoon: rainy season) at KK, even though both beaches were undeveloped (intact beaches). The microplastics from tourist and fishing activities were probably transported by the clockwise flow of Thai gulf current from nearby Pattaya Beach, Chonburi Province to KK during the rainy season, whereas they were possibly carried by the anticlockwise flow of the Thai Gulf current from CL and KM during the dry season. This probably indicates that the abundant occurrence of microplastics particles present in the sediment is unsuitable as an indicator of the degree of contamination level of the study beach. This is because they are easily transported by currents, waves, and tides from other places to the deposit site as suspended loads. Thus, there is a dynamic quantity of microplastics occurrence in sediment according to their short residence time in the sediment of the coastal area. Further studies during the same period of our study are needed to confirm the aforementioned observation since our study was carried out only in March and July 2018. Moreover, the highest proportion of microplastics sizes of 20–300 μm was found in every station, except CL2 during the dry season and CL1 during the rainy season. The physical characteristics of microplastics were found in three shapes and seven colors. According to the analysis of polymer types using an FTIR spectrometer, 17 polymer types were found with the highest occurrence of PET and PA content during the dry and rainy seasons, respectively. The highest amount (percentage) of PET plastic was found since this type of plastic was cheap and widely used in the food packaging and consumer industries. For the microplastic debris with fiber appearance, the highest proportion found was PA, which might derive from the breakdown of fishing equipment such as nets, trawl, and ropes.
Author Contributions
Conceptualization, S.J., S.P. and P.T.; Investigation, S.J. and M.P.; Methodology, S.J. and M.P.; Supervision, S.P. and P.T.; Writing—original draft, S.J.; Writing—review and editing, S.P. and P.T. All authors have read and agreed to the published version of the manuscript.
Funding
This research received no external funding.
Institutional Review Board Statement
Not applicable.
Informed Consent Statement
Not applicable.
Data Availability Statement
Not applicable.
Conflicts of Interest
The authors declare no conflict of interest.
References
- Geyer, R.; Jambeck, J.R.; Law, K.L. Production, use, and fate of all plastics ever made. Sci. Adv. 2017, 3, e1700782. [Google Scholar] [CrossRef] [PubMed] [Green Version]
- Eriksen, M.; Maximenko, N.; Thiel, M.; Cummins, A.; Lattin, G.; Wilson, S.; Hafner, J.; Zellers, A.; Rifman, S. Plastic pollution in the South Pacific subtropical gyre. Mar. Pollut. Bull. 2013, 68, 71–76. [Google Scholar] [CrossRef]
- Yonkos, L.T.; Friedel, E.A.; Perez-Reyes, A.C.; Ghosal, S.; Arthur, C.D. Microplastics in four estuarine rivers in the Chesapeake Bay, U.S.A. Environ. Sci. Technol. 2014, 48, 14195–14202. [Google Scholar] [CrossRef] [PubMed]
- Zhao, S.; Zhu, L.; Li, D. Characterization of small plastic debris on tourism beaches around the South China Sea. Reg. Stud. Mar. Sci. 2015, 1, 55–62. [Google Scholar] [CrossRef]
- Derraik, J.G.B. The pollution of the marine environment by plastic debris: A review. Mar. Pollut. Bull. 2002, 44, 842–852. [Google Scholar] [CrossRef]
- Lee, H.; Shim, W.J.; Kwon, J.H.H. Sorption capacity of plastic debris for hydrophobic organic chemicals. Sci. Total Environ. 2014, 470–471, 1545–1552. [Google Scholar] [CrossRef] [PubMed]
- Endo, S.; Takizawa, R.; Okuda, K.; Takada, H.; Chiba, K.; Kanehiro, H.; Ogi, H.; Yamashita, R.; Date, T. Concentration of polychlorinated biphenyls (PCBs) in beached resin pellets: Variability among individual particles and regional differences. Mar. Pollut. Bull. 2005, 50, 1103–1114. [Google Scholar] [CrossRef]
- Tang, G.; Liu, M.; Zhou, Q.; He, H.; Chen, K.; Zhang, H.; Hu, J.; Huang, Q.; Luo, Y.; Ke, H.; et al. Microplastics and polycyclic aromatic hydrocarbons (PAHs) in Xiamen coastal areas: Implications for anthropogenic impacts. Sci. Total Environ. 2018, 634, 811–820. [Google Scholar] [CrossRef] [PubMed]
- Eriksen, M.; Mason, S.; Wilson, S.; Box, C.; Zellers, A.; Edwards, W.; Farley, H.; Amato, S. Microplastic pollution in the surface waters of the Laurentian Great Lakes. Mar. Pollut. Bull. 2013, 77, 177–182. [Google Scholar] [CrossRef]
- Free, C.M.; Jensen, O.P.; Mason, S.A.; Eriksen, M.; Williamson, N.J.; Boldgiv, B. High-levels of microplastic pollution in a large, remote, mountain lake. Mar. Pollut. Bull. 2014, 85, 156–163. [Google Scholar] [CrossRef]
- Cózar, A.; Echevarría, F.; González-Gordillo, J.I.; Irigoien, X.; Úbeda, B.; Hernández-León, S.; Palma, Á.T.; Navarro, S.; García-de-Lomas, J.; Ruiz, A.; et al. Plastic debris in the open ocean. Proc. Natl. Acad. Sci. USA 2014, 111, 10239–10244. [Google Scholar] [CrossRef] [PubMed] [Green Version]
- Woodall, L.C.; Sanchez-Vidal, A.; Canals, M.; Paterson, G.L.J.; Coppock, R.; Sleight, V.; Calafat, A.; Rogers, A.D.; Narayanaswamy, B.E.; Thompson, R.C. The deep sea is a major sink for microplastic debris. R. Soc. Open Sci. 2014, 1, 140317. [Google Scholar] [CrossRef] [PubMed] [Green Version]
- Sagawa, N.; Kawaai, K.; Hinata, H. Abundance and size of microplastics in a coastal sea: Comparison among bottom sediment, beach sediment, and surface water. Mar. Pollut. Bull. 2018, 133, 532–542. [Google Scholar] [CrossRef] [PubMed]
- Wang, J.; Wang, M.; Ru, S.; Liu, X. High levels of microplastic pollution in the sediments and benthic organisms of the South Yellow Sea, China. Sci. Total Environ. 2019, 651, 1661–1669. [Google Scholar] [CrossRef]
- Bergmann, M.; Wirzberger, V.; Krumpen, T.; Lorenz, C.; Primpke, S.; Tekman, M.B.; Gerdts, G. High quantities of microplastic in arctic deep-sea sediments from the Hausgarten observatory. Environ. Sci. Technol. 2017, 51, 11000–11010. [Google Scholar] [CrossRef] [Green Version]
- Morgana, S.; Ghigliotti, L.; Estévez-Calvar, N.; Stifanese, R.; Wieckzorek, A.; Doyle, T.; Christiansen, J.S.; Faimali, M.; Garavent, F. Microplastics in the Arctic: A case study with sub-surface water and fish samples off Northeast Greenland. Environ. Pollut. 2018, 242, 1078–1086. [Google Scholar] [CrossRef]
- Lusher, A.L.; McHugh, M.; Thompson, R.C. Occurrence of microplastics in the gastrointestinal tract of pelagic and demersal fish from the english channel. Mar. Pollut. Bull. 2013, 67, 94–99. [Google Scholar] [CrossRef]
- Fang, C.; Zheng, R.; Zhang, Y.; Hong, F.; Mu, J.; Chen, M.; Song, P.; Lin, L.; Lin, H.; Le, F.; et al. Microplastic contamination in benthic organisms from the Arctic and sub-Arctic regions. Chemosphere 2018, 209, 298–306. [Google Scholar] [CrossRef]
- Amelineau, F.; Bonnet, D.; Heitz, O.; Mortreux, V.; Harding, A.M.A.; Karnovsky, N.; Walkusz, W.; Fort, J.; Gremillet, D. Microplastic pollution in the greenland sea: Background levels and selective contamination of planktivorous diving seabirds. Environ. Pollut. 2016, 219, 1131–1139. [Google Scholar] [CrossRef] [PubMed]
- Jamieson, A.J.; Brooks, L.S.R.; Reid, W.D.K.; Piertney, S.B.; Narayanaswamy, B.E.; Linley, T.D. Microplastics and synthetic particles ingested by deep-sea amphipods in six of the deepest marine ecosystems on Earth. R. Soc. Open Sci. 2019, 6, 180667. [Google Scholar] [CrossRef] [Green Version]
- Pradit, S.; Towatana, P.; Nitiratsuwan, T.; Jualaong, T.; Jirajarus, M.; Sornplang, K.; Noppradit, P.; Darakai, Y.; Weerawong, C. Occurrence of microplastics on beach sediment at Libong, a pristine island in Andaman Sea, Thailand. Sci. Asia 2020, 46, 336–343. [Google Scholar] [CrossRef]
- Pradit, S.; Noppradit, P.; Goh, B.P.; Sornplang, K.; Ong, M.C.; Towatana, P. Occurrence of microplastics and trace metals in fish and shrimp from Songkhla lake, Thailand duing the covid-19 pandemic. Appl. Ecol. Environ. Res. 2021, 19, 1085–1106. [Google Scholar] [CrossRef]
- Azad, S.M.O.; Towatana, P.; Pradit, S.; Goh, P.B.; Hue, H.T.T.; Jualaong, S. First evidence of existence of microplastics in stomach of some commercial fishes in the lower Gulf of Thailand. Appl. Ecol. Environ. Res. 2018, 16, 7345–7360. [Google Scholar] [CrossRef]
- Thushari, G.G.N.; Chavanich, S.; Yakupitiyage, A. Coastal debris analysis in beaches of Chonburi Province, eastern of Thailand as implications for coastal conservation. Mar. Pollut. Bull. 2017, 116, 121–129. [Google Scholar] [CrossRef] [PubMed]
- Goh, G.; Cammarata, N.; Voss, C.; Carter, S.; Petrov, M.; Schubert, L.; Radford, A.; Olah, C. Multimodal neurons in artificial neural networks. Distill 2021, 6, e30. Available online: https://distill.pub/2021/multimodal-neurons (accessed on 4 March 2021). [CrossRef]
- Pradit, S.; Nitiratsuwan, T.; Towatana, P.; Jualaong, S.; Sornplang, K.; Noppradit, P.; Jirajarus, M.; Darakai, Y.; Weeerawong, C. Marine debris accumulation on the beach in Libong, a small island in Andaman sea, Thailand. Appl. Ecol. Environ. Res. 2020, 18, 5461–5474. [Google Scholar] [CrossRef]
- Chen, M.C.; Chen, T.H. Spatial and seasonal distribution of microplastics on sandy beaches along the coast of the Hengchun Peninsula, Taiwan. Mar. Pollut. Bull. 2020, 151, 110861. [Google Scholar] [CrossRef] [PubMed]
- Hamid, F.S.; Harith, S.S.; Lalung, J.; Hassan, A.; Periathamby, A.; Repin, I.M. Technical Report: Status Abundance and Distribution of Marine Debris on Selected Beaches of Marine Park Islands; Division of Marine Park and Marine Resources Management: Putra Jaya, Malaysia, 2019; pp. 1–48. Available online: https://www.researchgate.net/publication/337149784_Technical_Report_ABUNDANCE_AND_DISTRIBUTION_OF_MARINE_DEBRIS_ON_SELECTED_BEACHES_OF_MARINE_PARK_ISLANDS_DEPARTMENT_OF_FISHERIES_MALAYSIA_Ministry_of_Agriculture_and_Industry_Based (accessed on 2 June 2021).
- Ibrahim, Y.S.; Hamzah, S.R.; Khalik, W.M.A.W.M.; Yusof, K.M.K.K.; Anuar, S.T. Spatiotemporal microplastic occurrence study of Setiu Wetland, South China Sea. Sci. Total Environ. 2021, 788, 147809. [Google Scholar] [CrossRef]
- Akkajit, P.; Tipmanee, D.; Cherdsukjai, P.; Suteerasak, T.; Thongnonghin, S. Occurrence and distribution of microplastics in beach sediments along Phuket coastline. Mar. Pollut. Bull. 2021, 169, 112496. [Google Scholar] [CrossRef]
- Fok, L.; Cheung, P.K. Hong Kong at the Pearl River Estuary: A hotspot of microplastic pollution. Mar. Pollut. Bull. 2015, 1–2, 112–118. [Google Scholar] [CrossRef]
- NOAA. Laboratory Methods for the Analysis of Microplastics in the Marine Environment: Recommendations for Quantifying Synthetic Particles in Waters and Sediments. 2015. Available online: https://marinedebris.noaa.gov/sites/default/files/publications-files/noaa_microplastics_methods_manual.pdf (accessed on 29 August 2021).
- Hidalgo-Ruz, V.; Gutow, L.; Thompson, R.C.; Thiel, M. Microplastics in the Marine Environment: A Review of the Methods Used for Identification and Quantification. Environ. Sci. Technol. 2012, 46, 3060–3075. [Google Scholar] [CrossRef] [PubMed]
- Turner, A.; Holmes, L.A. Adsorption of trace metals by microplastic pellets in fresh water. Environ. Chem. 2015, 12, 600–610. [Google Scholar] [CrossRef]
- Howell, E.A.; Bograd, S.J.; Morishige, C.; Seki, M.P.; Polovina, J.J. On North Pacific circulation and associated marine debris concentration. Mar. Pollut. Bull. 2012, 65, 16–22. [Google Scholar] [CrossRef]
- Department of Marine and Coastal Resources. Available online: https://www.dmcr.go.th/document (accessed on 25 August 2017).
- Tong-u-dom, S.; Na-u-dom, T.; Buranapratheprat, A. The responses of a hydrodynamic model to different open boundary condition in the Northern Gulf of Thailand. Burapha Sci. J. 2017, 22, 259–272. [Google Scholar]
- Qiu, Q.; Peng, J.; Yu, X.; Chen, F.; Wang, J.; Dong, F. Occurrence of microplastics in the coastal marine environment: First observation on sediment of China. Mar. Pollut. Bull. 2015, 98, 274–280. [Google Scholar] [CrossRef] [PubMed]
- Mathalon, A.; Hill, P. Microplastic fibers in the intertidal ecosystem surrounding Halifax Harbor, Nova Scotia. Mar. Pollut. Bull. 2014, 81, 69–79. [Google Scholar] [CrossRef] [PubMed]
Publisher’s Note: MDPI stays neutral with regard to jurisdictional claims in published maps and institutional affiliations. |
© 2021 by the authors. Licensee MDPI, Basel, Switzerland. This article is an open access article distributed under the terms and conditions of the Creative Commons Attribution (CC BY) license (https://creativecommons.org/licenses/by/4.0/).