Article

Fish Teeth Sr Isotope Stratigraphy and Nd Isotope Variations: New Insights on REY Enrichments in Deep-Sea Sediments in the Pacific

1
Southern Marine Science and Engineering Guangdong Laboratory (Guangzhou), Guangzhou 511458, China
2
Key Laboratory of Marine Mineral Resources, Ministry of Natural Resources, Guangzhou Marine Geological Survey, China Geological Survey, Guangzhou 510075, China
*
Author to whom correspondence should be addressed.
J. Mar. Sci. Eng. 2021, 9(12), 1379; https://doi.org/10.3390/jmse9121379
Submission received: 1 November 2021 / Revised: 20 November 2021 / Accepted: 21 November 2021 / Published: 4 December 2021
(This article belongs to the Special Issue Recent Advances in Geological Oceanography)

Abstract

:
Rare earth elements and yttrium (REY) are widely recognized as strategic materials for advanced technological applications. Deep-sea sediments from the eastern South Pacific and central North Pacific were first reported as potential resources containing significant amounts of REY that are comparable to, or greater than, those of land-based deposits. Despite nearly a decade of research, quantitative abundances and spatial distributions of these deposits remain insufficient. Age controls are generally absent due to the lack of biostratigraphic constraints. Thus, the factors controlling the formation of REY-rich sediments are still controversial. In this study, the REY contents of surface sediments (<2 m depth) in 14 piston cores from the Central and Western Pacific were investigated. The results show that deep-sea sediments with high REY contents (>1000 μg/g) were mainly concentrated around seamounts (e.g., the Marshall Islands). The REY contents of surface sediments generally decreased with distance from the seamounts. Biostratigraphic and fish teeth debris (apatite) Sr isotopic stratigraphy of one piston core (P10) from the Central Pacific indicates that deep-sea sediments with high REY contents were aged from early Oligocene to early Miocene. Since the opening of the Drake Passage during the early Oligocene, the northward-flowing Antarctic Bottom Water (AABW) would have led to an upwelling of nutrients around seamounts with topographic barriers, and at the same time, AABW would delay the rate of sediment burial to try for enough time for REY entering and enriching in the apatite (fish teeth debris). Understanding the spatial distribution of fertile regions for REY-rich sediments provides guidance for searching for other REY resources in the Pacific and in other oceans.

1. Introduction

Rare earth elements and yttrium (REY) are widely recognized as strategic materials for advanced technological applications [1,2]. Global demands for REY are increasing rapidly [3]. At present, deposits associated with intrusive carbonate complexes and ion-adsorbed deposits are the world’s most important source of REY [4,5]. Considering the supply risk, many countries have begun to explore REY resources beyond traditional terrestrial mines. Deep-sea sediments from the eastern South Pacific and central North Pacific were first reported as potential resources containing significant amounts of REY, comparable to, or greater than, those of land-based deposits [6]. Subsequently, REY-rich deep-sea sediments have also been found in the Indian Ocean [7]. The mineralogical, as well as major and trace elemental compositions, of deep-sea sediments have been investigated in the Pacific and India Ocean, with the goal of analyzing the host phase of REY elements and their provenance. It has been suggested that hydrothermal activity at mid-ocean ridges (MORs) plays a role in the formation of REY-rich muds; in addition, phillipsite content and sedimentation rate may also affect the enrichment of REY in sediments [6].
REY-rich deep-sea sediments in the Pacific Ocean are mainly distributed in the eastern South Pacific and central North Pacific [6]. However, despite nearly a decade of research (since 2011), quantitative data on the abundances and spatial distributions of these deposits remain insufficient. In effect, the specific spatial distributions of REY-rich sediments in these two regions are enigmatic. Furthermore, precise age controls are generally absent due to the lack of biostratigraphic constraints. These factors restrict the study of REY enrichment mechanisms in deep-sea sediments.
Carbonate fossils are mostly absent in REY-rich pelagic clays because of their location below the carbonate compensation depth (CCD; ~4500 m). Moreover, the resolution of the magnetostratigraphic record is insufficient to accurately define the reversals [8]. Therefore, current high-resolution dating of pelagic clays is difficult when using conventional methods [9]. The 87Sr/86Sr record can be used to date and correlate marine sediments [10,11,12,13,14,15]. Furthermore, fish teeth debris, characterized by extremely high concentrations of REEs, occur in nearly all sediment types, including red clays [16,17]. The use of fish teeth Sr isotope stratigraphy for dating pelagic clays has been investigated [9,18]. The comparison of 87Sr/86Sr isotopic ratios to the marine Sr isotope curve [19] should, theoretically, constrain ages at a resolution of ±0.5 myr for the time period of ~16–38 Ma, and ±1.0 myr from ~16 Ma to the present [9].
The fractionation of Sm/Nd in continental crust relative to the mantle allows the 143Nd/144Nd ratio to be used to constrain Nd sources and trace the pathways of rare earth elements (REEs) in the ocean [20]. The residence time of Nd is shorter than the oceanic mixing cycle [21]; consequently, the oceans are poorly mixed with respect to Nd. Different oceans exhibit different Nd isotopic signatures [22], which allows isotopically distinct water masses to be traced [23,24]. Fish teeth debris can provide a record of the Nd isotopic signature of seawater, even in sediments that lack calcareous fossils [22].
In this study, the REY contents of surface sediments (<2 m depth) in 14 piston cores from the Central and Western Pacific were analyzed with the goal of identifying the spatial distribution of REY-rich sediments. In addition, in situ Sr and Nd isotopes of apatite (fish teeth detritus) at different depths in core P10—which contains both high REY content and low REY content sediments for comparison from the Central Pacific areas—were analyzed to try to constrain the age of the REY-rich sediments and to obtain the record of Nd isotopic signatures of seawater, which may have implications for constraining the source and pathways of the REY. These results may help in understanding the factors controlling REY enrichment in deep-sea sediments, which may provide guidance for searching for REY resources elsewhere in the Pacific or in other oceans.

2. Study Area and Methods

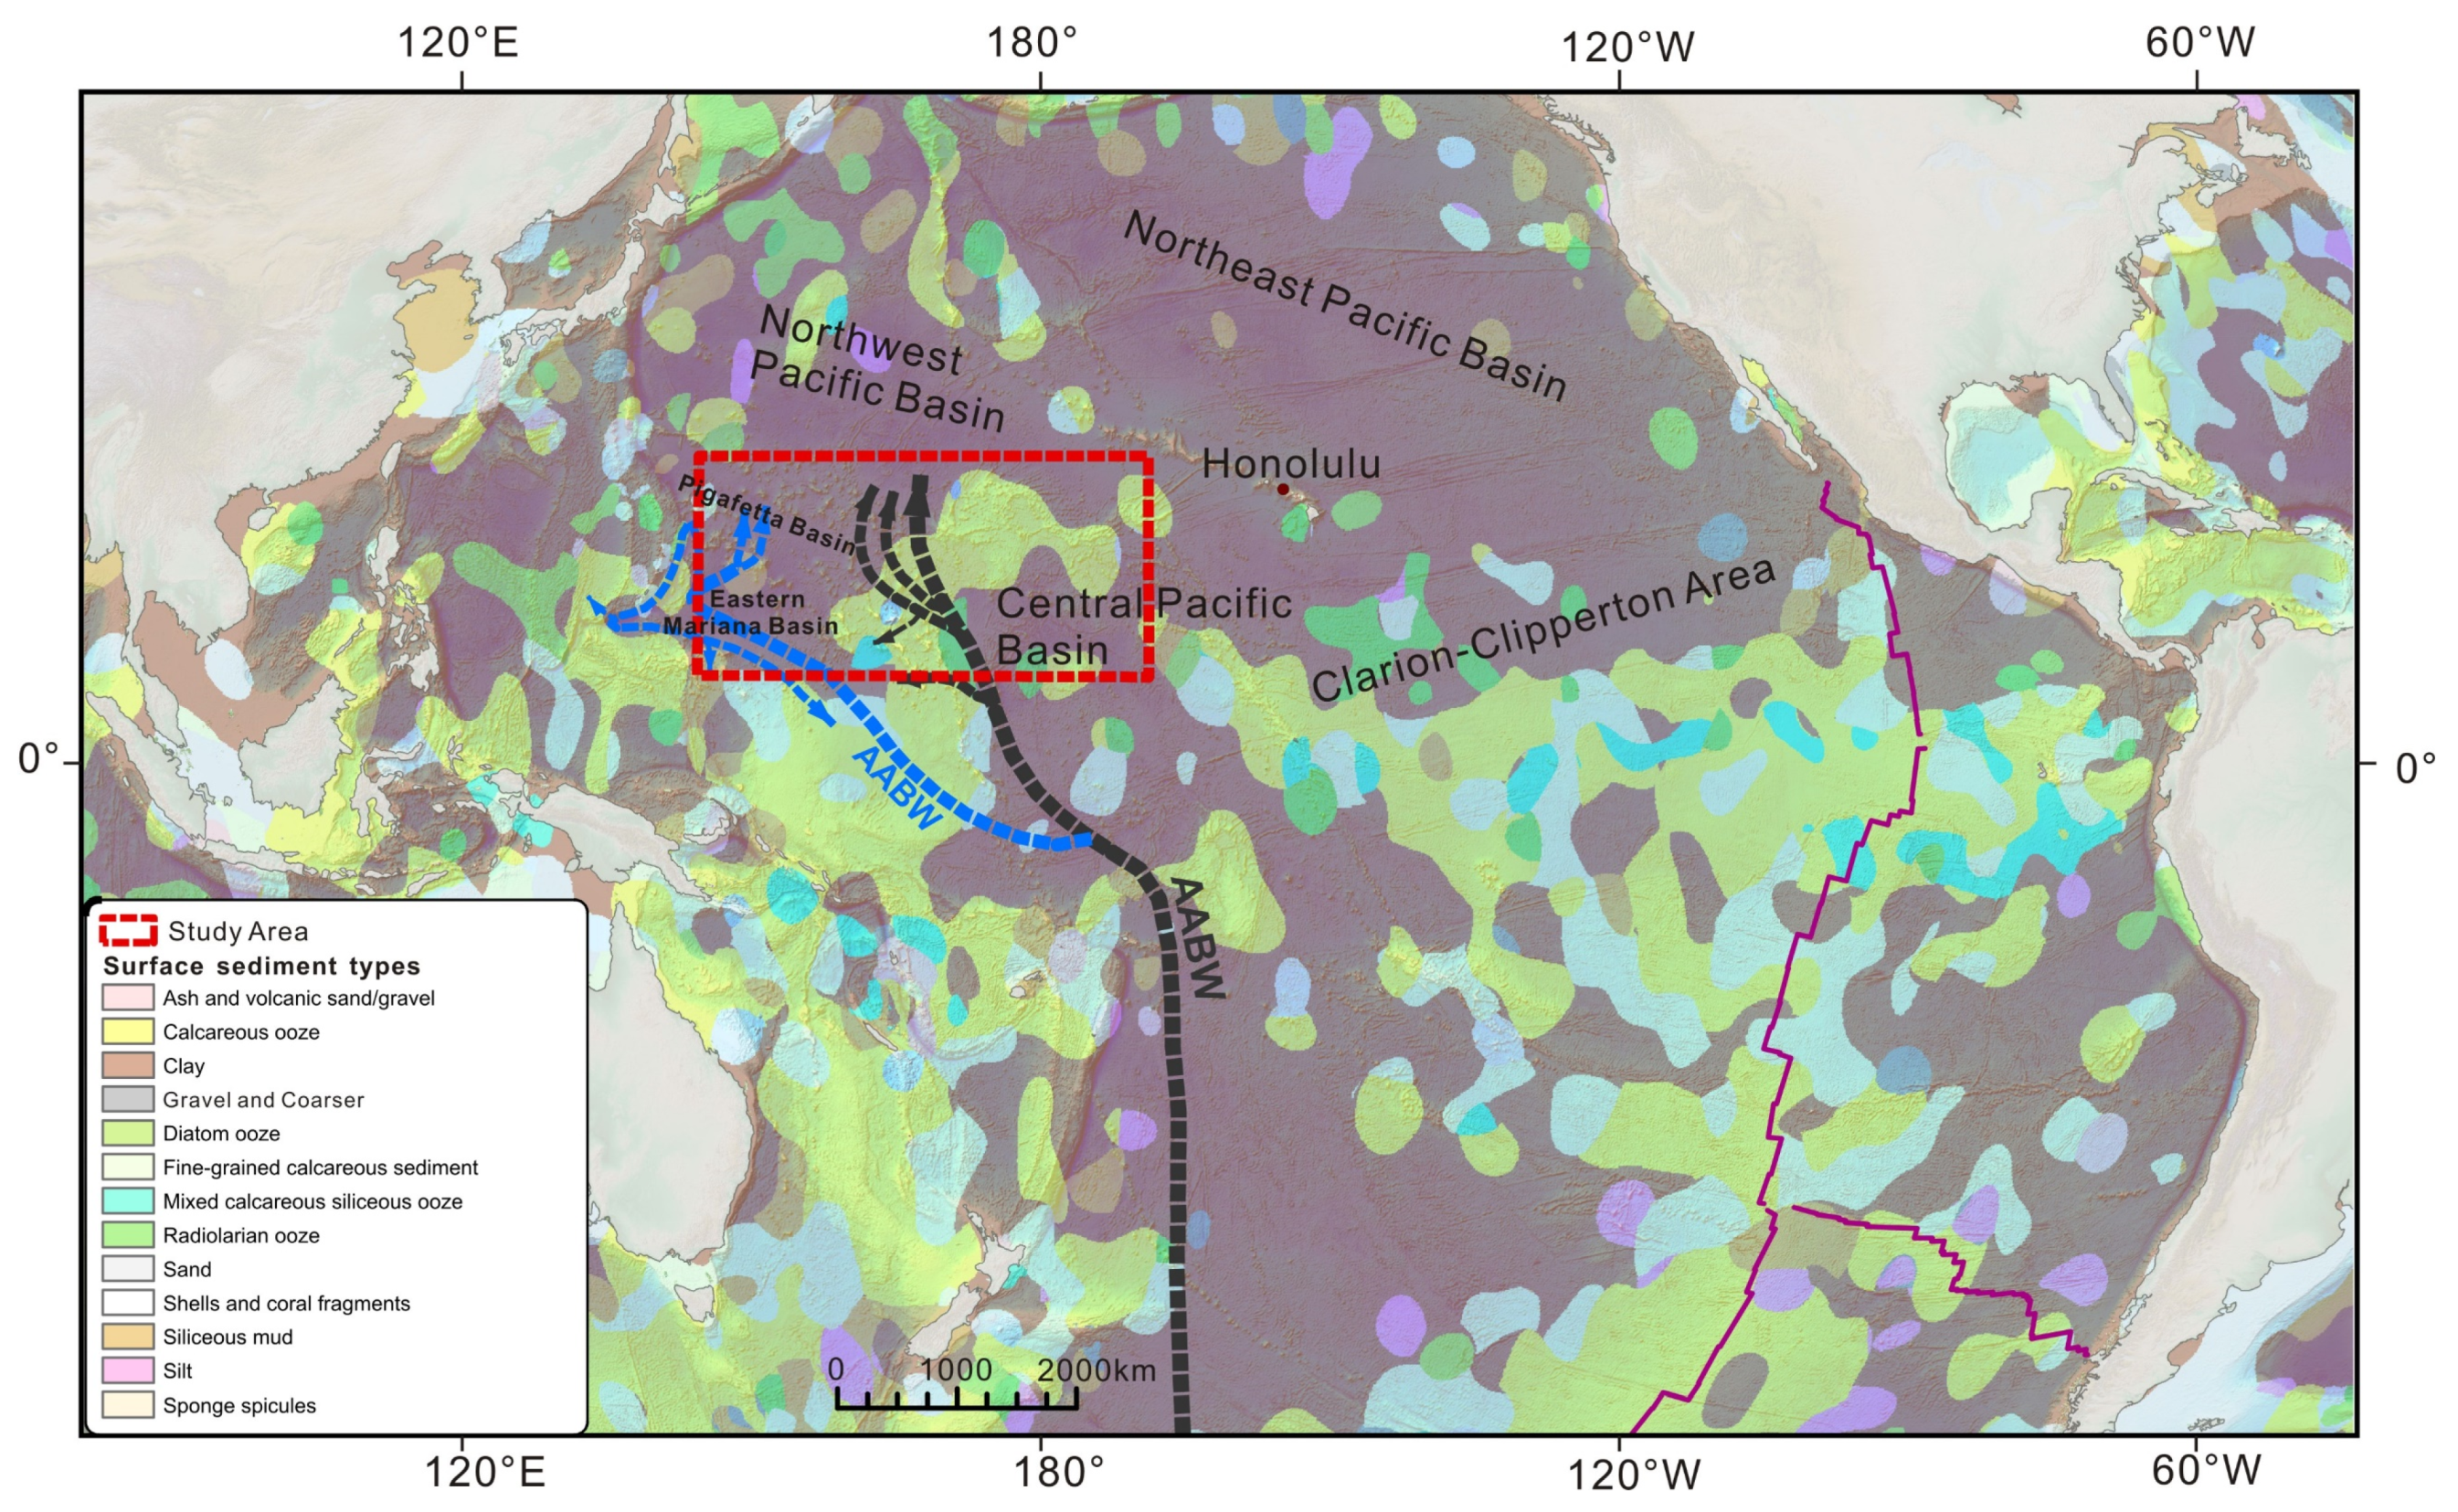
2.1. Study Area and Samples
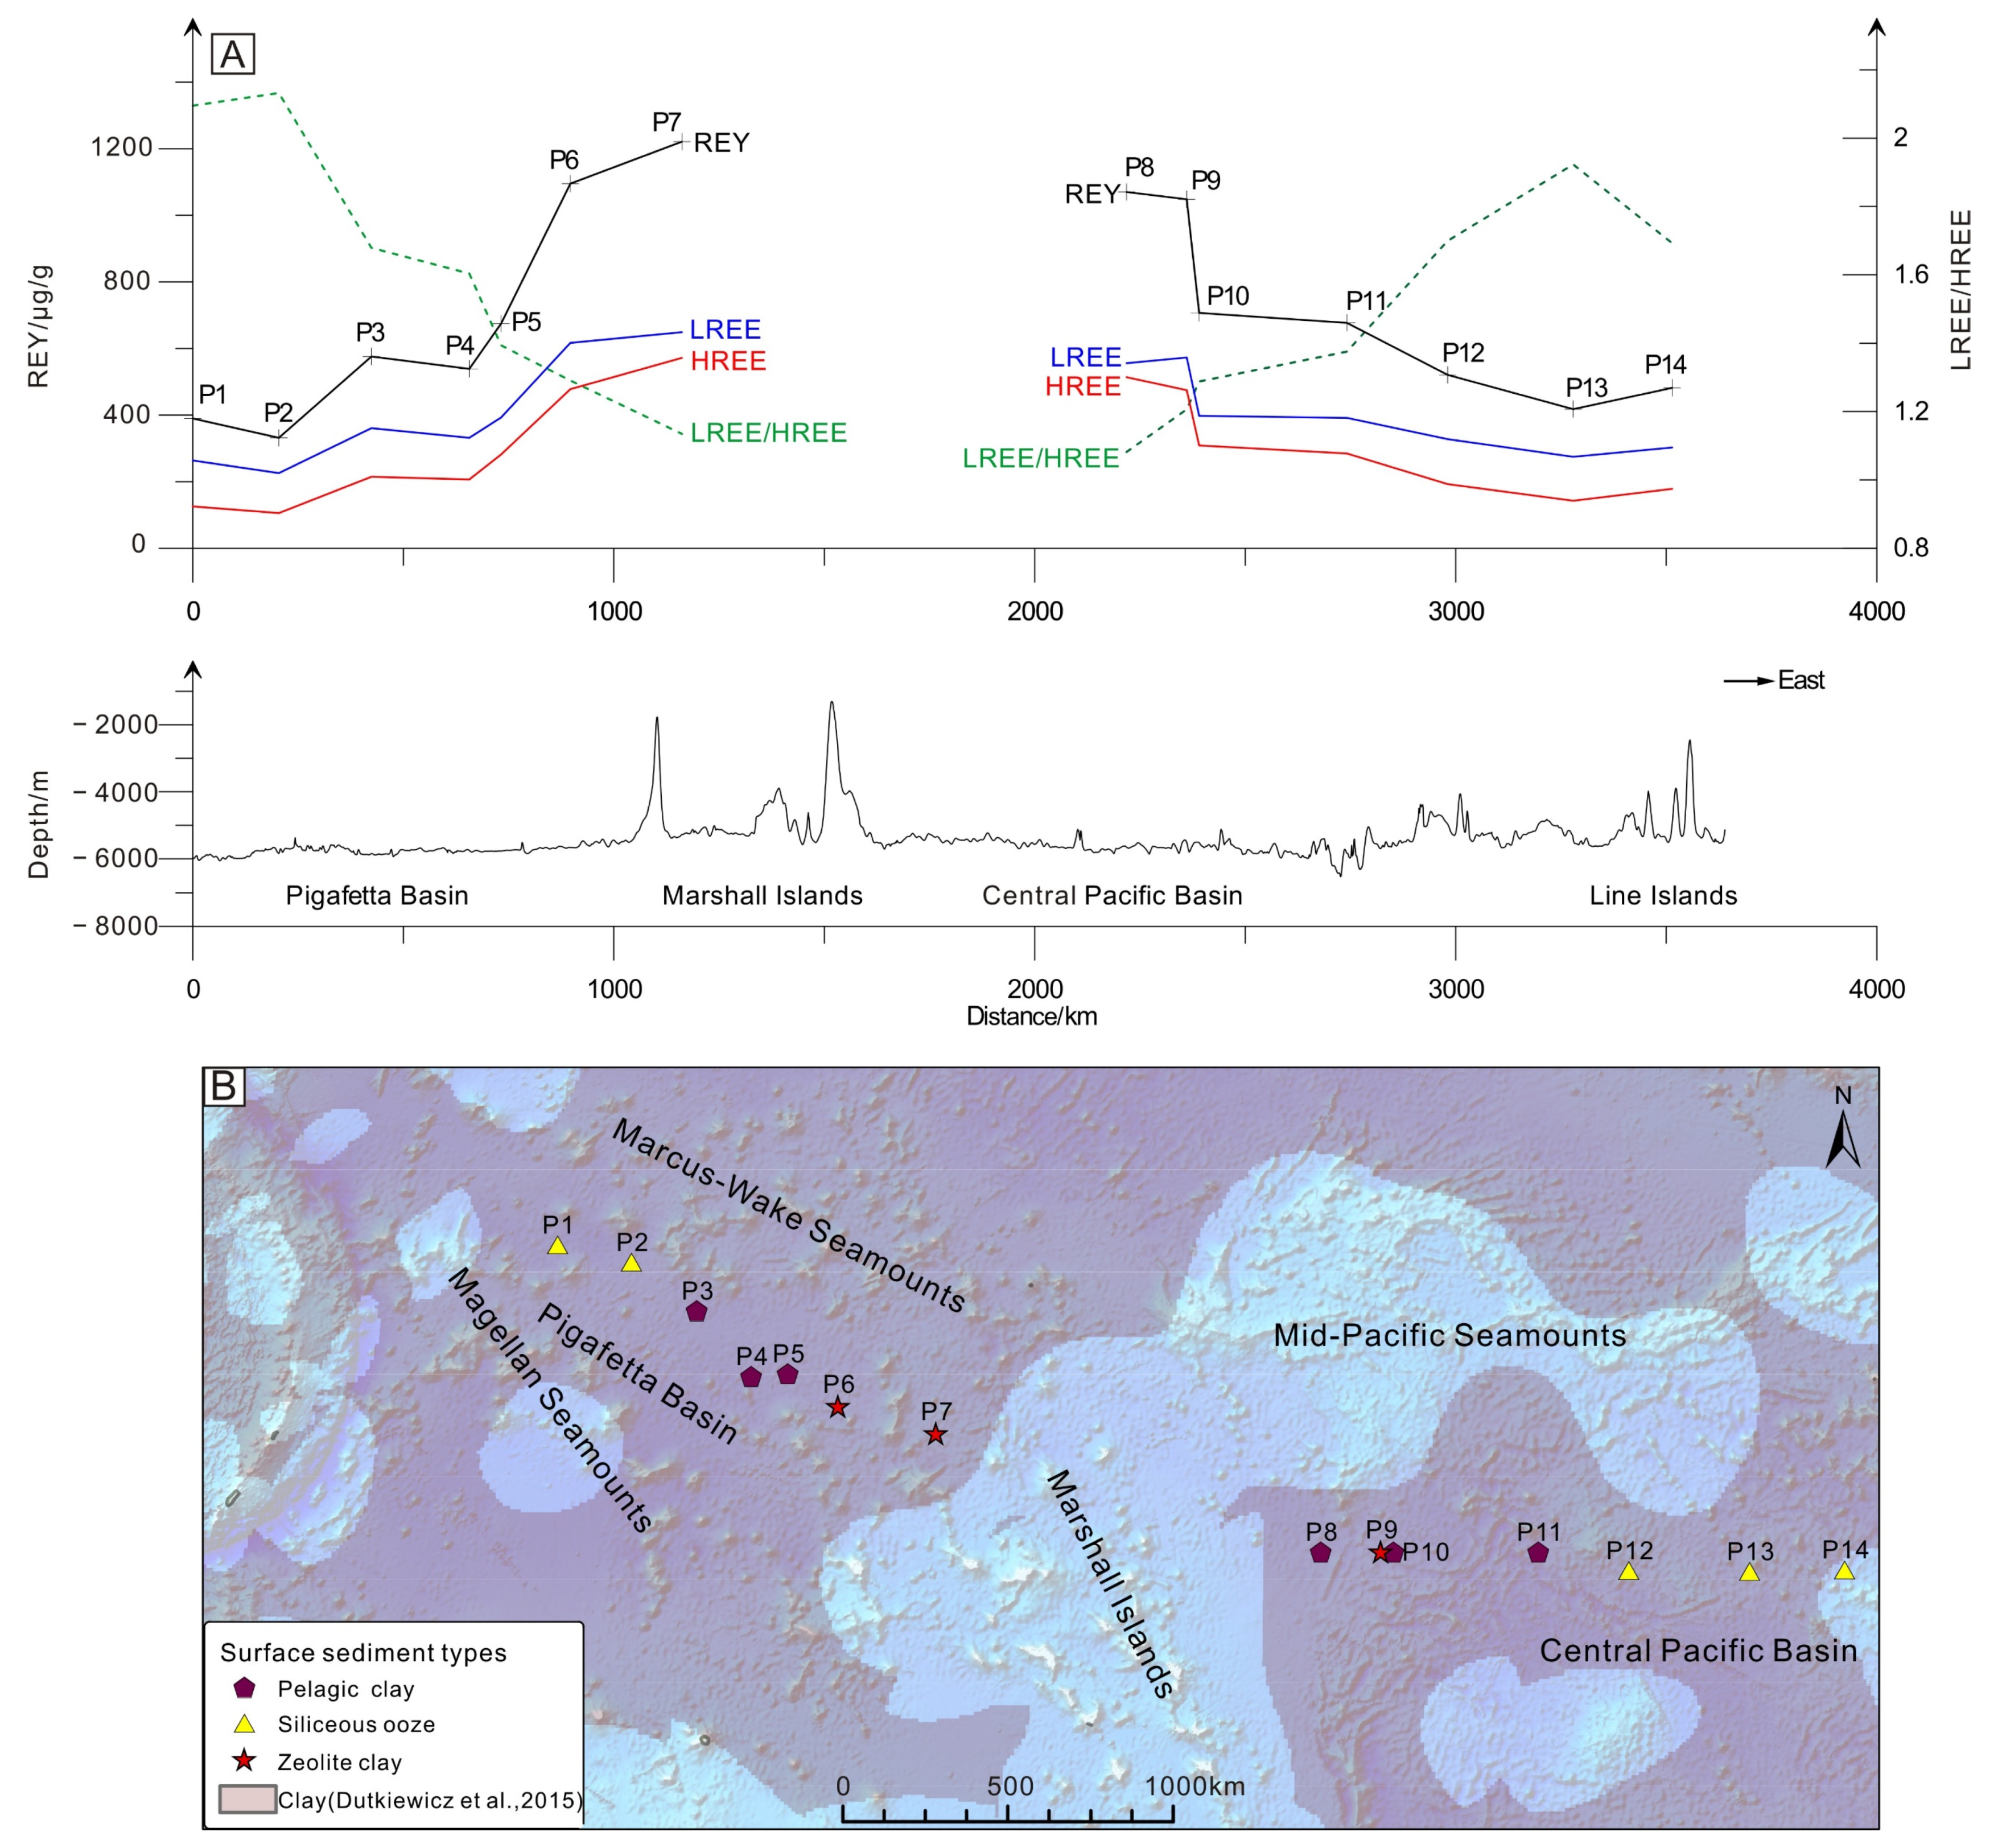
The study area is located in the Central and Western Pacific (Figure 1), which are potential areas for REY-rich sediments [6]. The study area included the Pigafetta Basin, Eastern Mariana Basin, and parts of the Central Pacific Basin. The sediments were mainly pelagic clays, with minor radiolarian and calcareous oozes [25] at water depths of 4824–6251 m (Figure 2).
Sample information is provided in Table 1. Samples were taken for REY analysis at a sampling interval of 15 cm continuously from the top to the bottom of the cores. The average REY contents of the surface sediments (<2 m depth) of 14 piston cores were calculated (Figure 2). In addition, a 7.2 m core (P10) from the Central Pacific was selected for further in situ Sr and Nd isotopic analyses of apatite (fish teeth detritus) to constrain the age and the source of the high REY content sediment. The upper (0–210 cm) and lower (600–720 cm) sections of P10 mainly contained pelagic clay, whereas the middle layer (210–600 cm) was composed of zeolite clay with a higher REY content (REY > 1000 μg) than the other layers.
Figure 1. Surface sediment types and Antarctic Bottom Water (AABW) flow path. (Sediment types after [25], AABW path after [26]).
Jmse 09 01379 g001
Figure 2. Characteristics of REY and sediment types in surface sediments (<2 m) in the Central and Western Pacific. (A) Characteristics of REY; (B) dominant surface sediment types (<2 m). P1–P14 correspond to piston cores.
Jmse 09 01379 g002
Table 1. Water depth and length of the 14 piston cores, with type and REY content of their surface sediments (<2 m) in the study area.
CoreSediment TypeREY (μg/g)LREE (μg/g)HREE (μg/g)Depth (m)Length (cm)
P1Siliceous ooze390264126−5877834
P2Siliceous ooze332226106−5677720
P3Pelagic red clay576361215−5747605
P4Pelagic red clay539332207−57731445
P5Pelagic red clay675393282−5696732
P6Zeolite clay1095617478−5368715
P7Zeolite clay1221649572−5163802
P8Pelagic red clay707398309−5495765
P9Pelagic red clay1070556514−5667880
P10Zeolite clay1048573475−5613720
P11Pelagic red clay677392285−5635860
P12Siliceous ooze521328193−5293830
P13Siliceous ooze418275143−5177634
P14Siliceous ooze482303179−5620826

2.2. Major and Trace Elements

Analyses of major and trace elements were performed at the MNR Key Laboratory of Marine Mineral Resources, Guangzhou Marine Geological Survey. Major elements were analyzed using X-ray fluorescence (XRF; Axios), with a detection limit of 0.01–0.1% and a relative standard deviation (RSD) of <2%.
Trace elements were analyzed using inductively coupled plasma mass spectrometry (ICP-MS). Each sediment sample (0.1 g) was first placed in a beaker, to which 4 mL of 1:1 HCl, 10 mL of HF, and 1.5 mL of HClO3 were added. The mixture was heated until it formed a dry paste. Then, 4 mL of 1:1 HCl was added to make a 25 mL solution; 1 mL of which was pipetted and diluted with 2% HNO3 to a certain volume for analysis. Marine standard sediments GBW07313, GBW07315, and GBW07316 were used for quality control. The instrumental detection limit was 0.01–0.1 μg/mL and the RSD was <2%.

2.3. In Situ Sr and Nd Isotopes

The fish teeth debris were selected after sieving the wet sediment samples through a 63 μm mesh and then cleaned in an ultrasonic bath to remove any adhering clay particles and organic materials. After drying, the clean fish teeth were selected using a microscope and pasted on the annular target for in situ Sr and Nd isotopic analyses. In order to eliminate the influences of clay or other substances adhering to or infilling the fish teeth as much as possible, only triangular fish teeth or clear fish debris were selected for analysis (Figure 3). In addition, only fish teeth with high Sr and Nd contents (Sr > 400 μg/g; Nd >1 000 μg/g) were analyzed. Multiple fish teeth were analyzed in order to characterize the reproducibility in the same interval.
In situ Sr isotopic analyses were performed using an NWR 193 laser ablation system attached to a Thermo Fisher Scientific Neptune Plus multi-collector (MC) ICP-MS at the Beijing Createch Testing Technology Co., Ltd. A spot size of 38 μm was used, with a 6–8 Hz repetition rate and an energy density of 10 J/cm2, depending on the Sr concentration of the sample. Sr isotopic data were acquired using static multi-collection in low-resolution mode with nine Faraday collectors. Prior to laser analysis, the Neptune MC-ICP-MS was tuned using a standard to obtain the maximum sensitivity. A typical data acquisition cycle consisted of a 40 s measurement of the Ar gas blank with the laser switched off, followed by 60 s of measurement with laser ablation. The Durango1 apatite reference material was analyzed every 10 samples for external calibration.
Data reduction was conducted offline, and potential isobaric interferences were accounted for in the following order: Kr, Yb2+, Er2+, and Rb. Initially, the interferences of 84Kr and 86Kr on 84Sr and 86Sr, respectively, were removed using the 40 s Kr gas baseline measurement. The presence of 167Er2+, 171Yb2+, and 173Yb2+ at masses of 83.5, 85.5, and 86.5, respectively, were then monitored. Subsequently, the natural ratio of 85Rb/87Rb (2.5926) was used to correct for the isobaric interference of 87Rb on 87Sr using the exponential law, assuming that Rb has the same mass discrimination behavior as Sr. In addition, interferences from Ca argides or dimers and Ca–P–O were not considered for high Sr contents (>400 µg/g). The 87Sr/86Sr ratios were then calculated and normalized from the interference-corrected 86Sr/88Sr ratios using the exponential law. The data reduction procedure was performed using an Excel Visual Basic for Applications macro program [27,28].
All of the in situ Nd isotopic analyses were performed using a Neptune Plus MC-ICP-MS (Thermo Scientific, Waltham, MA, USA), coupled with a RESOlution M-50 193 nm laser ablation system (Resonetics, Nashua, NH, USA), hosted at the State Key Laboratory of Isotope Geochemistry, Guangzhou Institute of Geochemistry, Chinese Academy of Sciences. A detailed description of these instruments can be found in [29]. A small N2 (2 mL L−1) flow and X skimmer cone at the interface were used to improve the instrumental sensitivity. All isotope signals were detected using Faraday cups under static mode. Laser parameters were set as follows: a beam diameter of 82–112 μm; a repetition rate of 6 Hz; and an energy density of ~4 J cm−2. Helium was chosen as the carrier gas (800 mL min−1). Each analysis consisted of 250 cycles, with an integration time of 0.262 s per cycle. The first 29 s were used to detect the gas blank with the laser beam off, followed by 30 s of laser ablation for sample signal collection with the laser beam. During the measurements, gas blanks of 143Nd were less than 0.2 mv. The interferences of 144Sm on 144Nd were derived from the 147Sm intensities, with a natural 143Sm/147Sm ratio of 0.20504 [30]. The mass bias factor of Sm was calculated from the measured isotopic ratio of 147Sm/149Sm and its accepted value (1.08507; [30]). The mass bias of 143Nd/144Nd was normalized to 146Nd/144Nd = 0.7129 using an exponential law. A detailed description of the data reduction procedure can be found in [29]. In total, 40 analyses of McClure apatite and 25 analyses of Durango apatite yielded weighted means of 143Nd/144Nd = 0.512280 ± 0.000055 (2 SD) and 143Nd/144Nd = 0.512470 ± 0.000060 (2 SD), respectively, which are consistent (within error) with the values reported by [31].

3. Results

3.1. REY Characteristics of Surface Sediments

The REY contents of the surface sediments from the Central and Western Pacific are listed in Table 1. The data indicate that the average REY contents of the surface sediments at different sites in the Pigafetta Basin (northwest of the Marshall Islands) varied from 332 to 1221 μg/g (Figure 2). Heavy REEs (HREEs), including Y, varied from 106 to 572 μg/g, while light REEs (LREEs) varied from 226 to 649 μg/g.
The average REY contents of the surface sediments at different sites in the Central Pacific basin (east of the Marshall Islands) varied from 418 to 1070 µg/g (Figure 2). HREE (including Y) contents varied from 143 to 514 μg/g, while LREE contents varied from 275 to 573 μg/g.

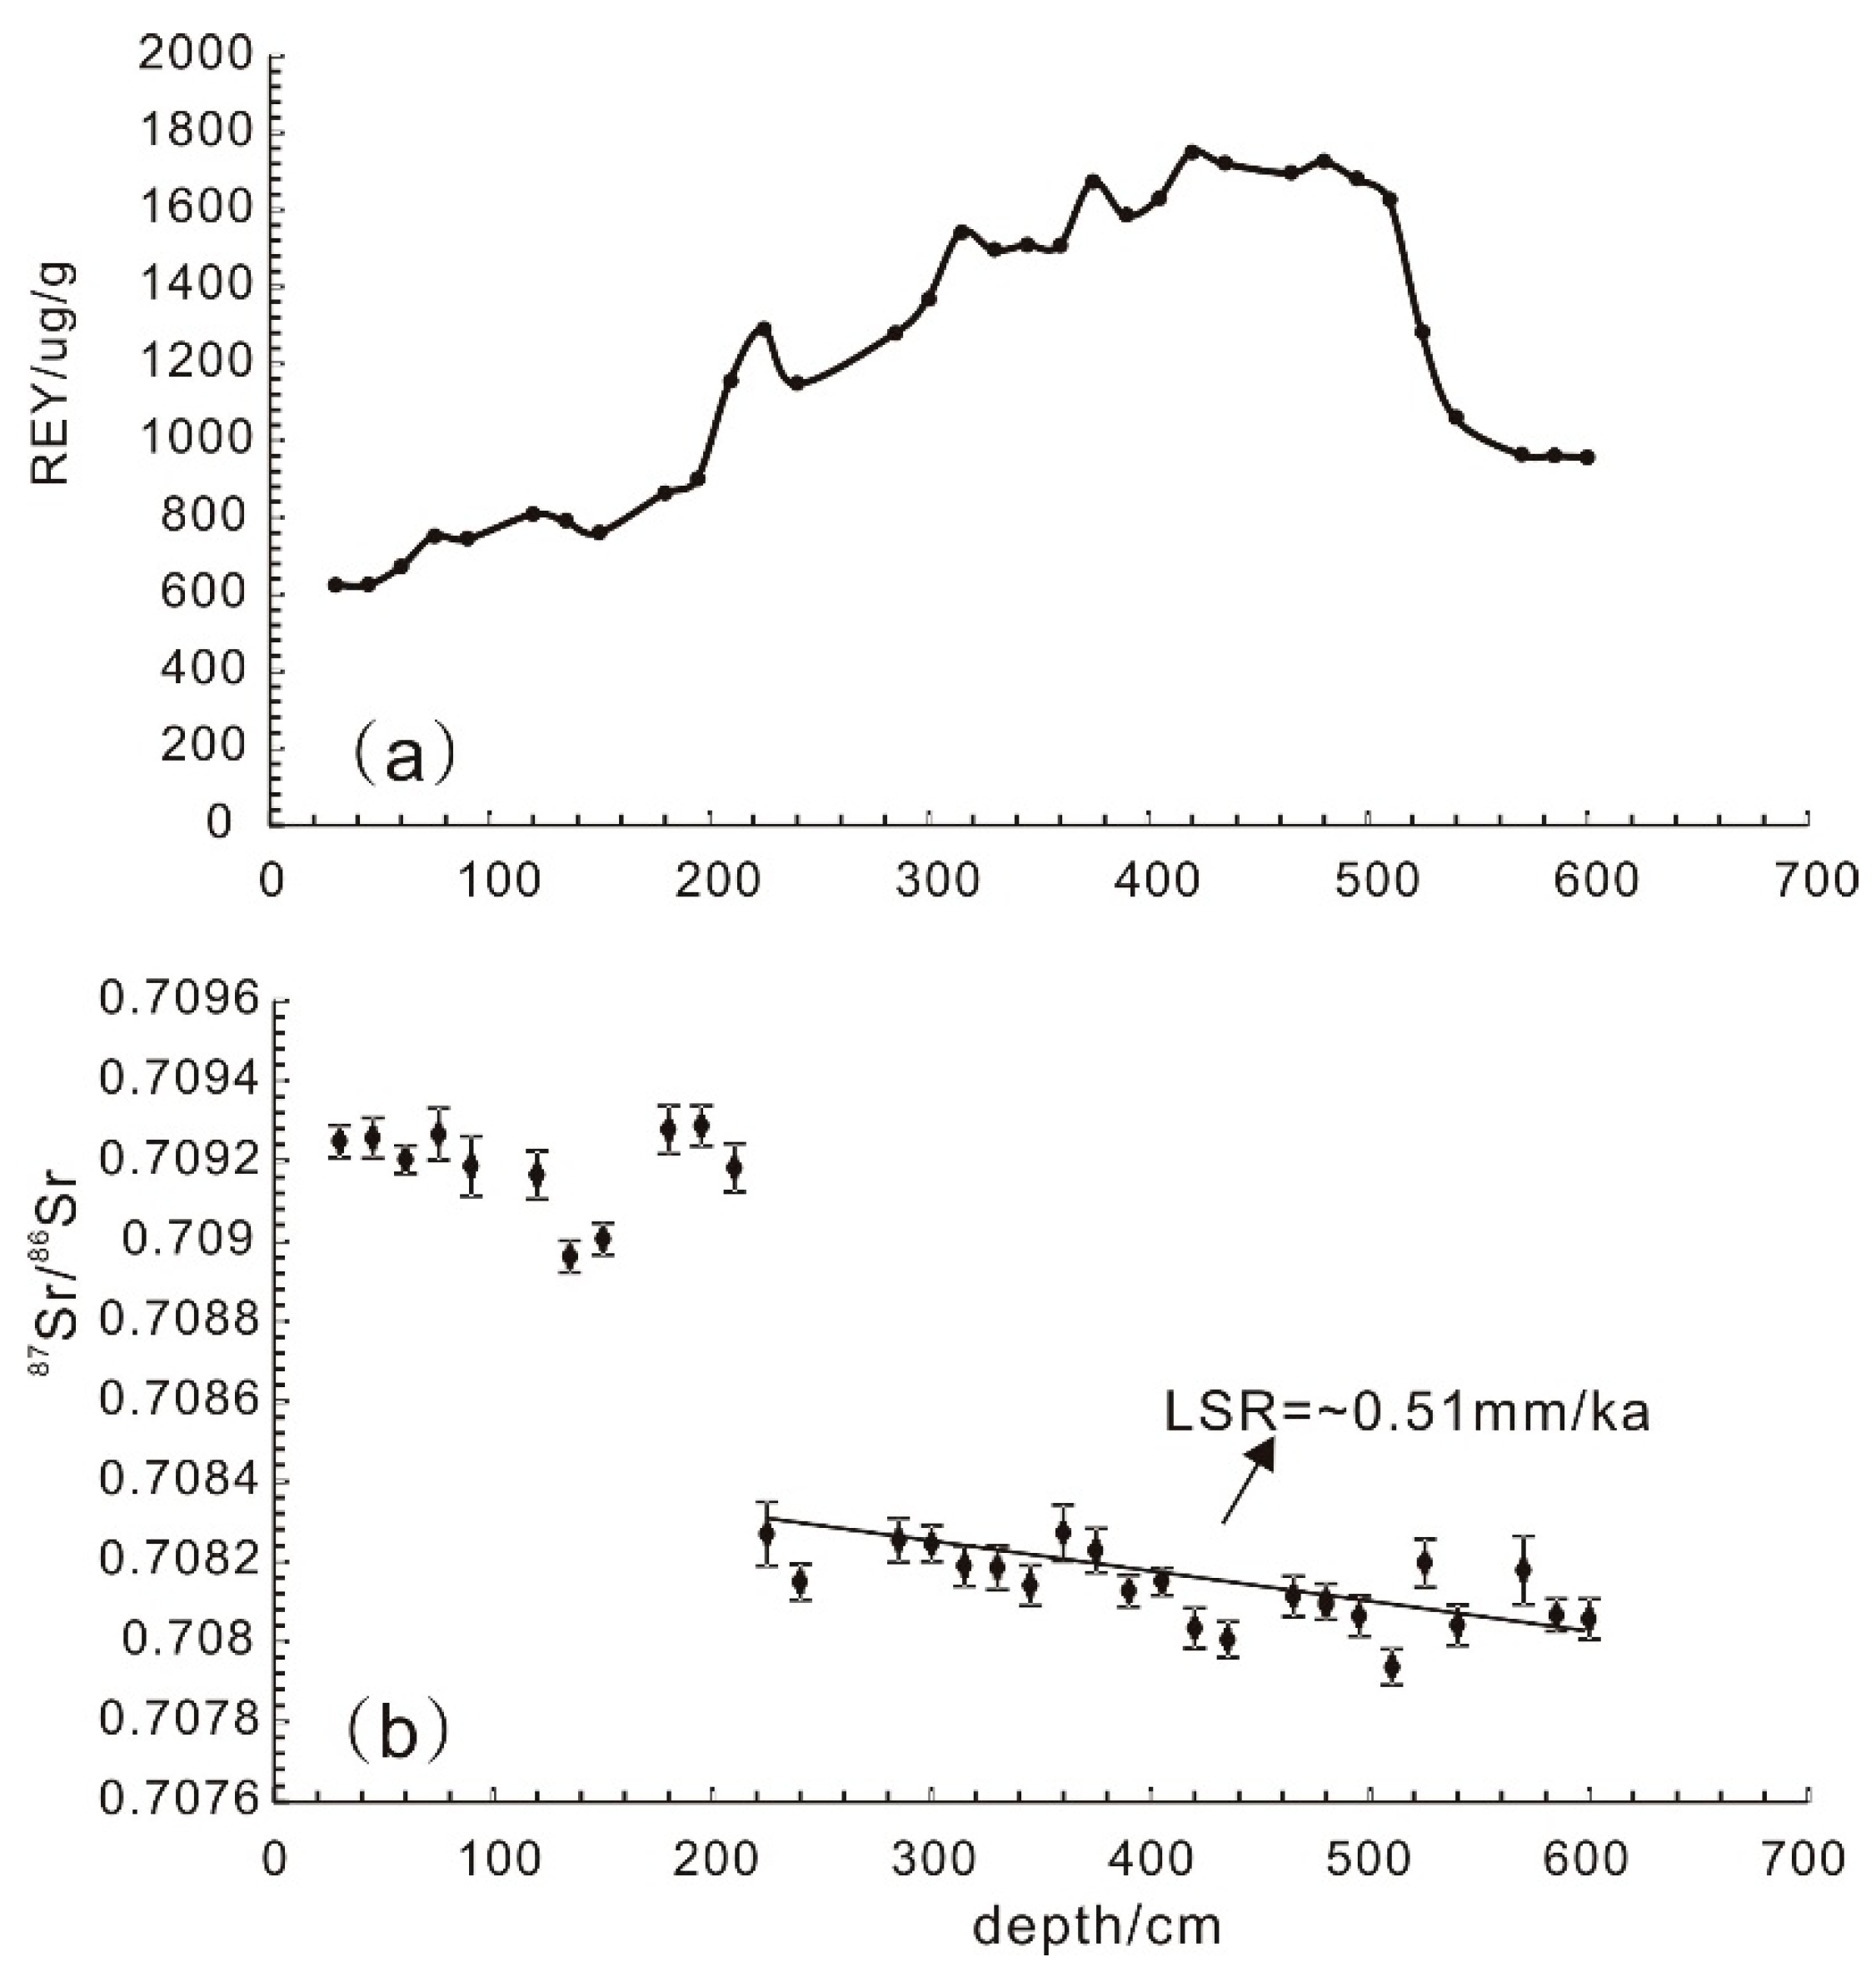
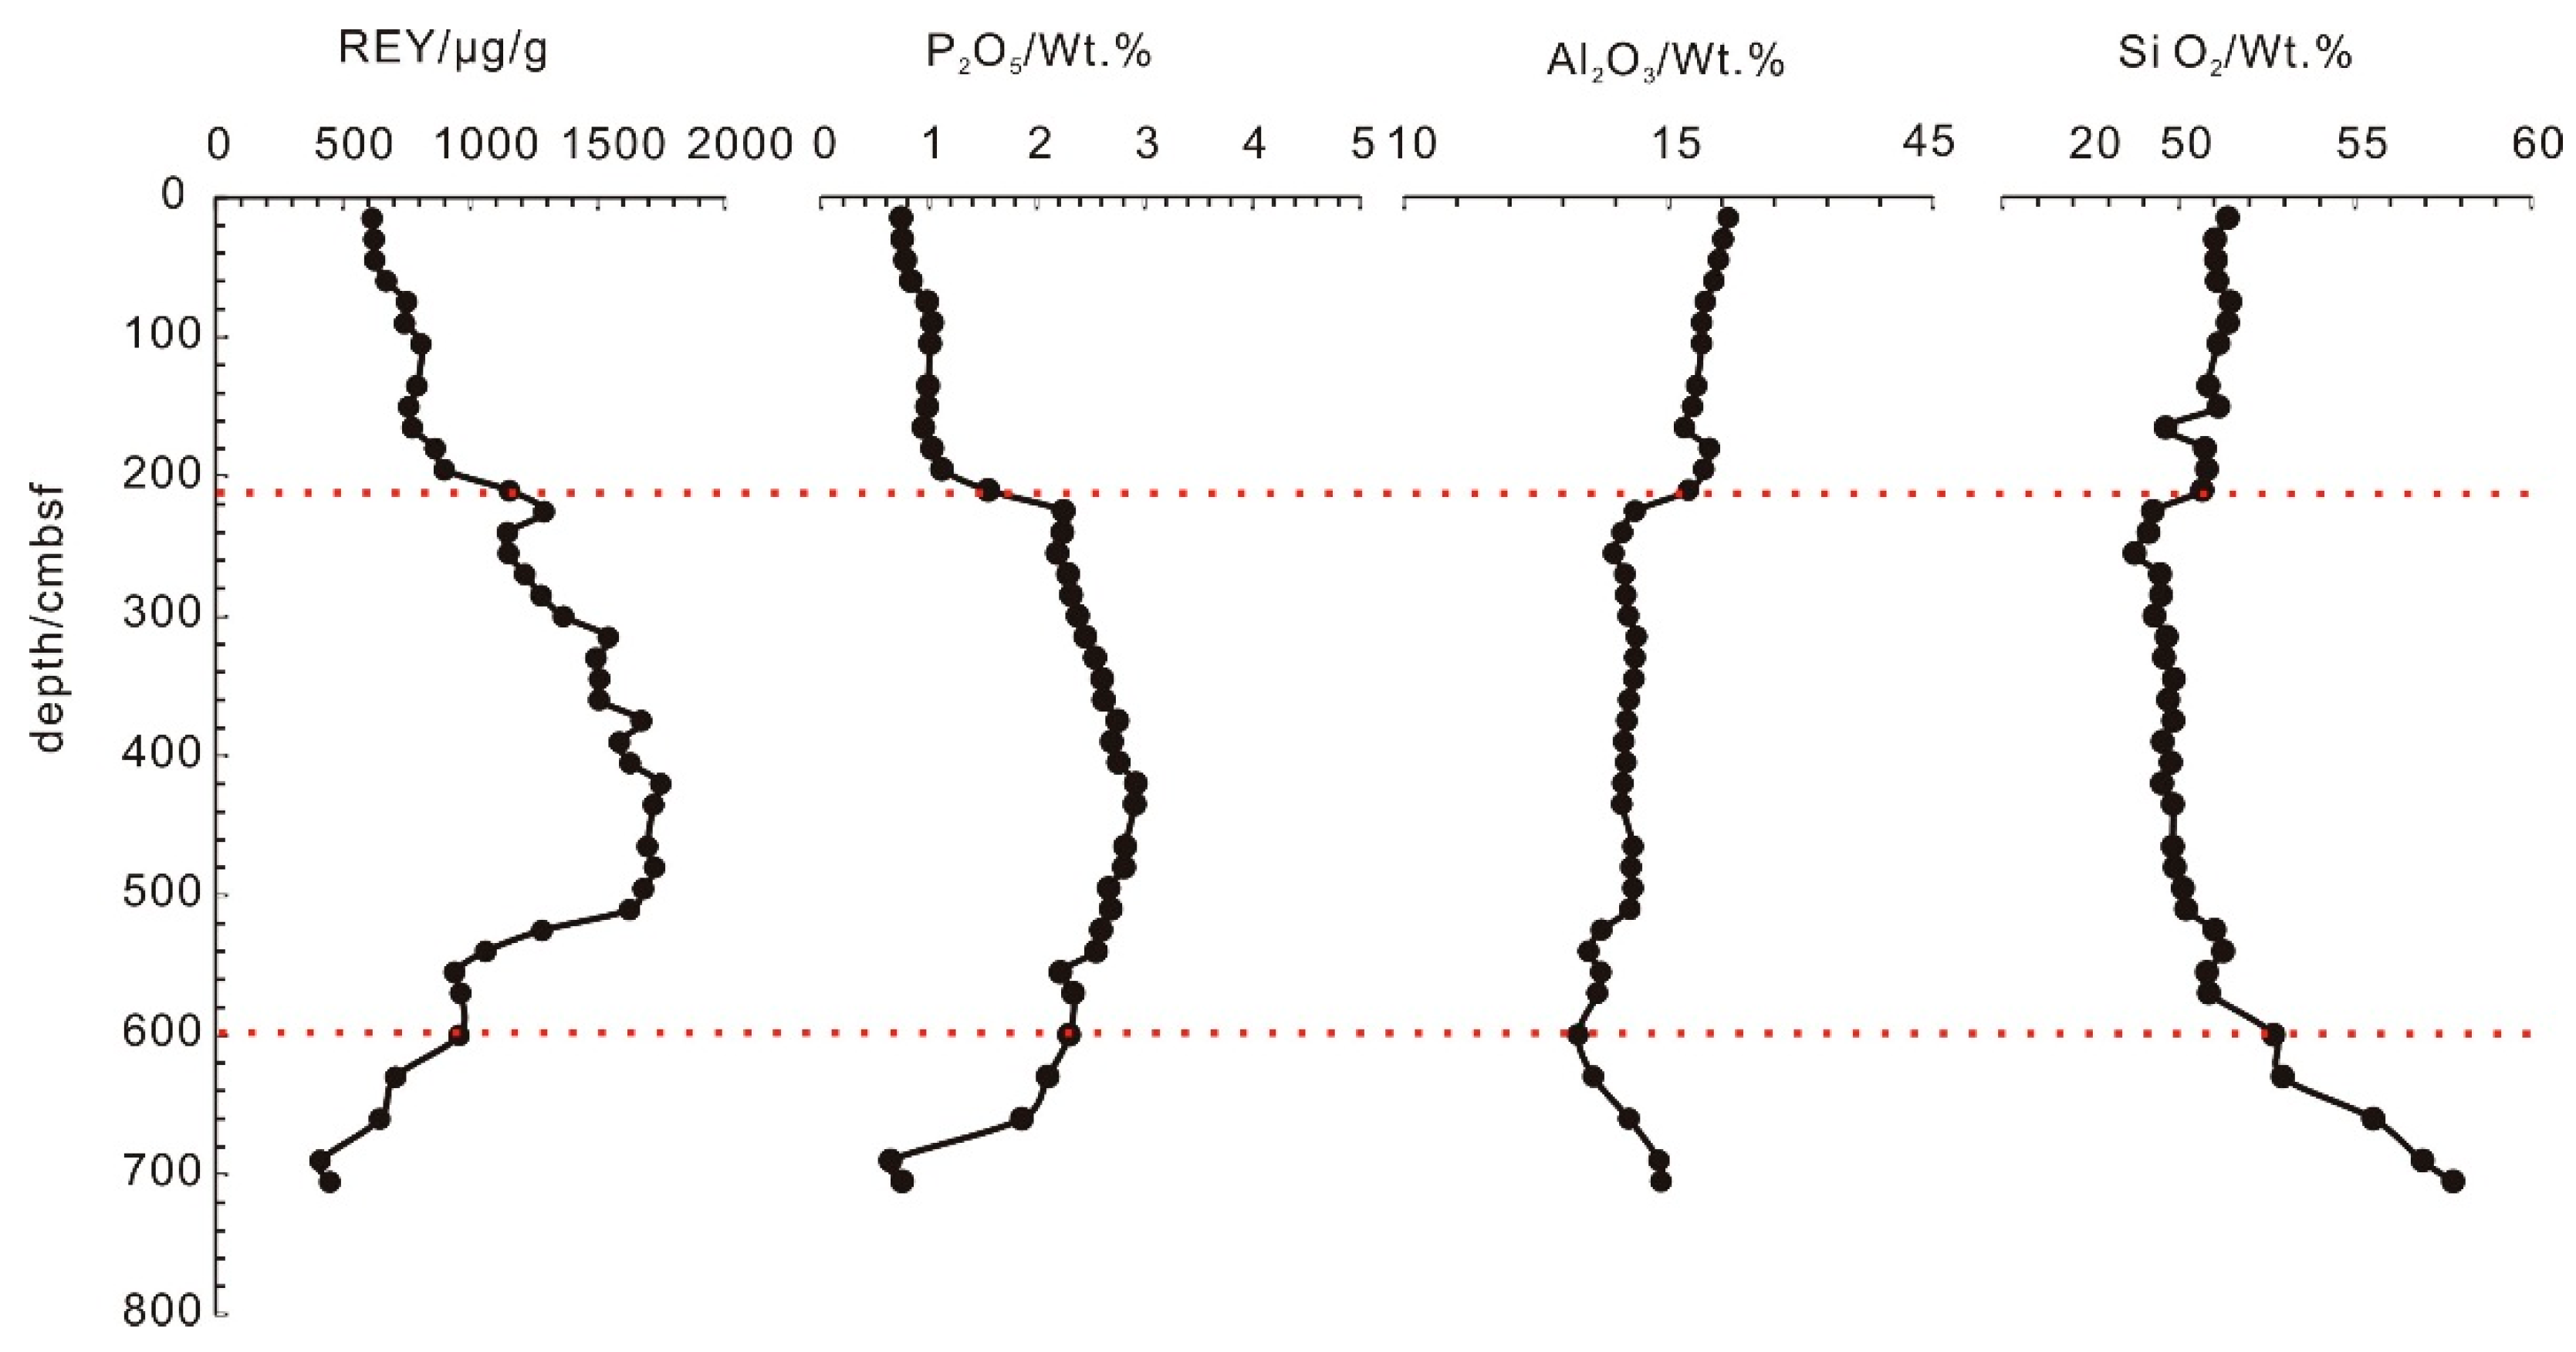
3.2. Vertical Distributions of REY

Vertical REY contents of sediments from the Central and Western Pacific varied from core to core. All of the analyzed piston cores contained multiple REY-rich sediment layers at different depths and with different thicknesses (Figure 4). For example, Core P7 contained three layers with REY contents of >1000 µg/g and two layers with REY contents ranging from 700 to 1000 µg/g. However, core P10 contained one layer with REY content of >1000 µg/g, two layers with REY contents ranging from 700 to 1000 µg/g, and two layers with REY contents ranging from 400 to 700 µg/g.
In North American shale composite (NASC)-normalized REE patterns (Figure 5), all of the sediments of P10 exhibited significant negative Ce anomalies and positive Y anomalies.

3.3. Fish Teeth Sr Isotopic Compositions

In situ fish teeth Sr values, at different depths in core P10, are listed in Table 2 and Figure 6. The initial 87Sr/86Sr ratios varied, ranging from 0.707960 to 0.709288, and multiple fish teeth from the same interval exhibited different isotopic characteristics.
The initial 87Sr/86Sr ratios ranged from 0.708961 to 0.709288 in the upper 210 cm of the core. Some fish teeth exhibited lower 87Sr/86Sr values (such as 0.708961) than the 87Sr/86Sr value of modern seawater (0.70924, [19]), indicating that they were old fish teeth that had been re-deposited [36]. The apatite 87Sr/86Sr values of the upper 210 cm in core P10 were generally similar to the modern seawater value, except for the unreasonable data described above.
Fish teeth 87Sr/86Sr ratios in the 210–600 cm layer and the lower 600–720 cm layer exhibited similar characteristics, ranging from 0.708005 to 0.708426 and from 0.707960 to 0.708481, respectively, indicating that these two layers were continuously deposited.
Theoretically, the fish teeth 87Sr/86Sr values should exhibit a decreasing trend in the vertical direction. However, the values fluctuated throughout the core length (Figure 6b). For example, some fish teeth 87Sr/86Sr values of lower layers (600–720 cm) were greater than those of the 210–600 cm layer (Table 2); moreover, different fish teeth particles at the same interval showed different 87Sr/86Sr values. These fluctuating 87Sr/86Sr values may have been raised by the clay materials adhering to the fish teeth [37] or reflect the overturning of the old and new sediments. Nevertheless, the fish teeth 87Sr/86Sr values in the upper sediment with lower REY contents, and in the middle layer sediment with higher REY contents (Figure 6a), showed significant difference, indicating that fish teeth 87Sr/86Sr values were of significance for the determination of sediment chronology.

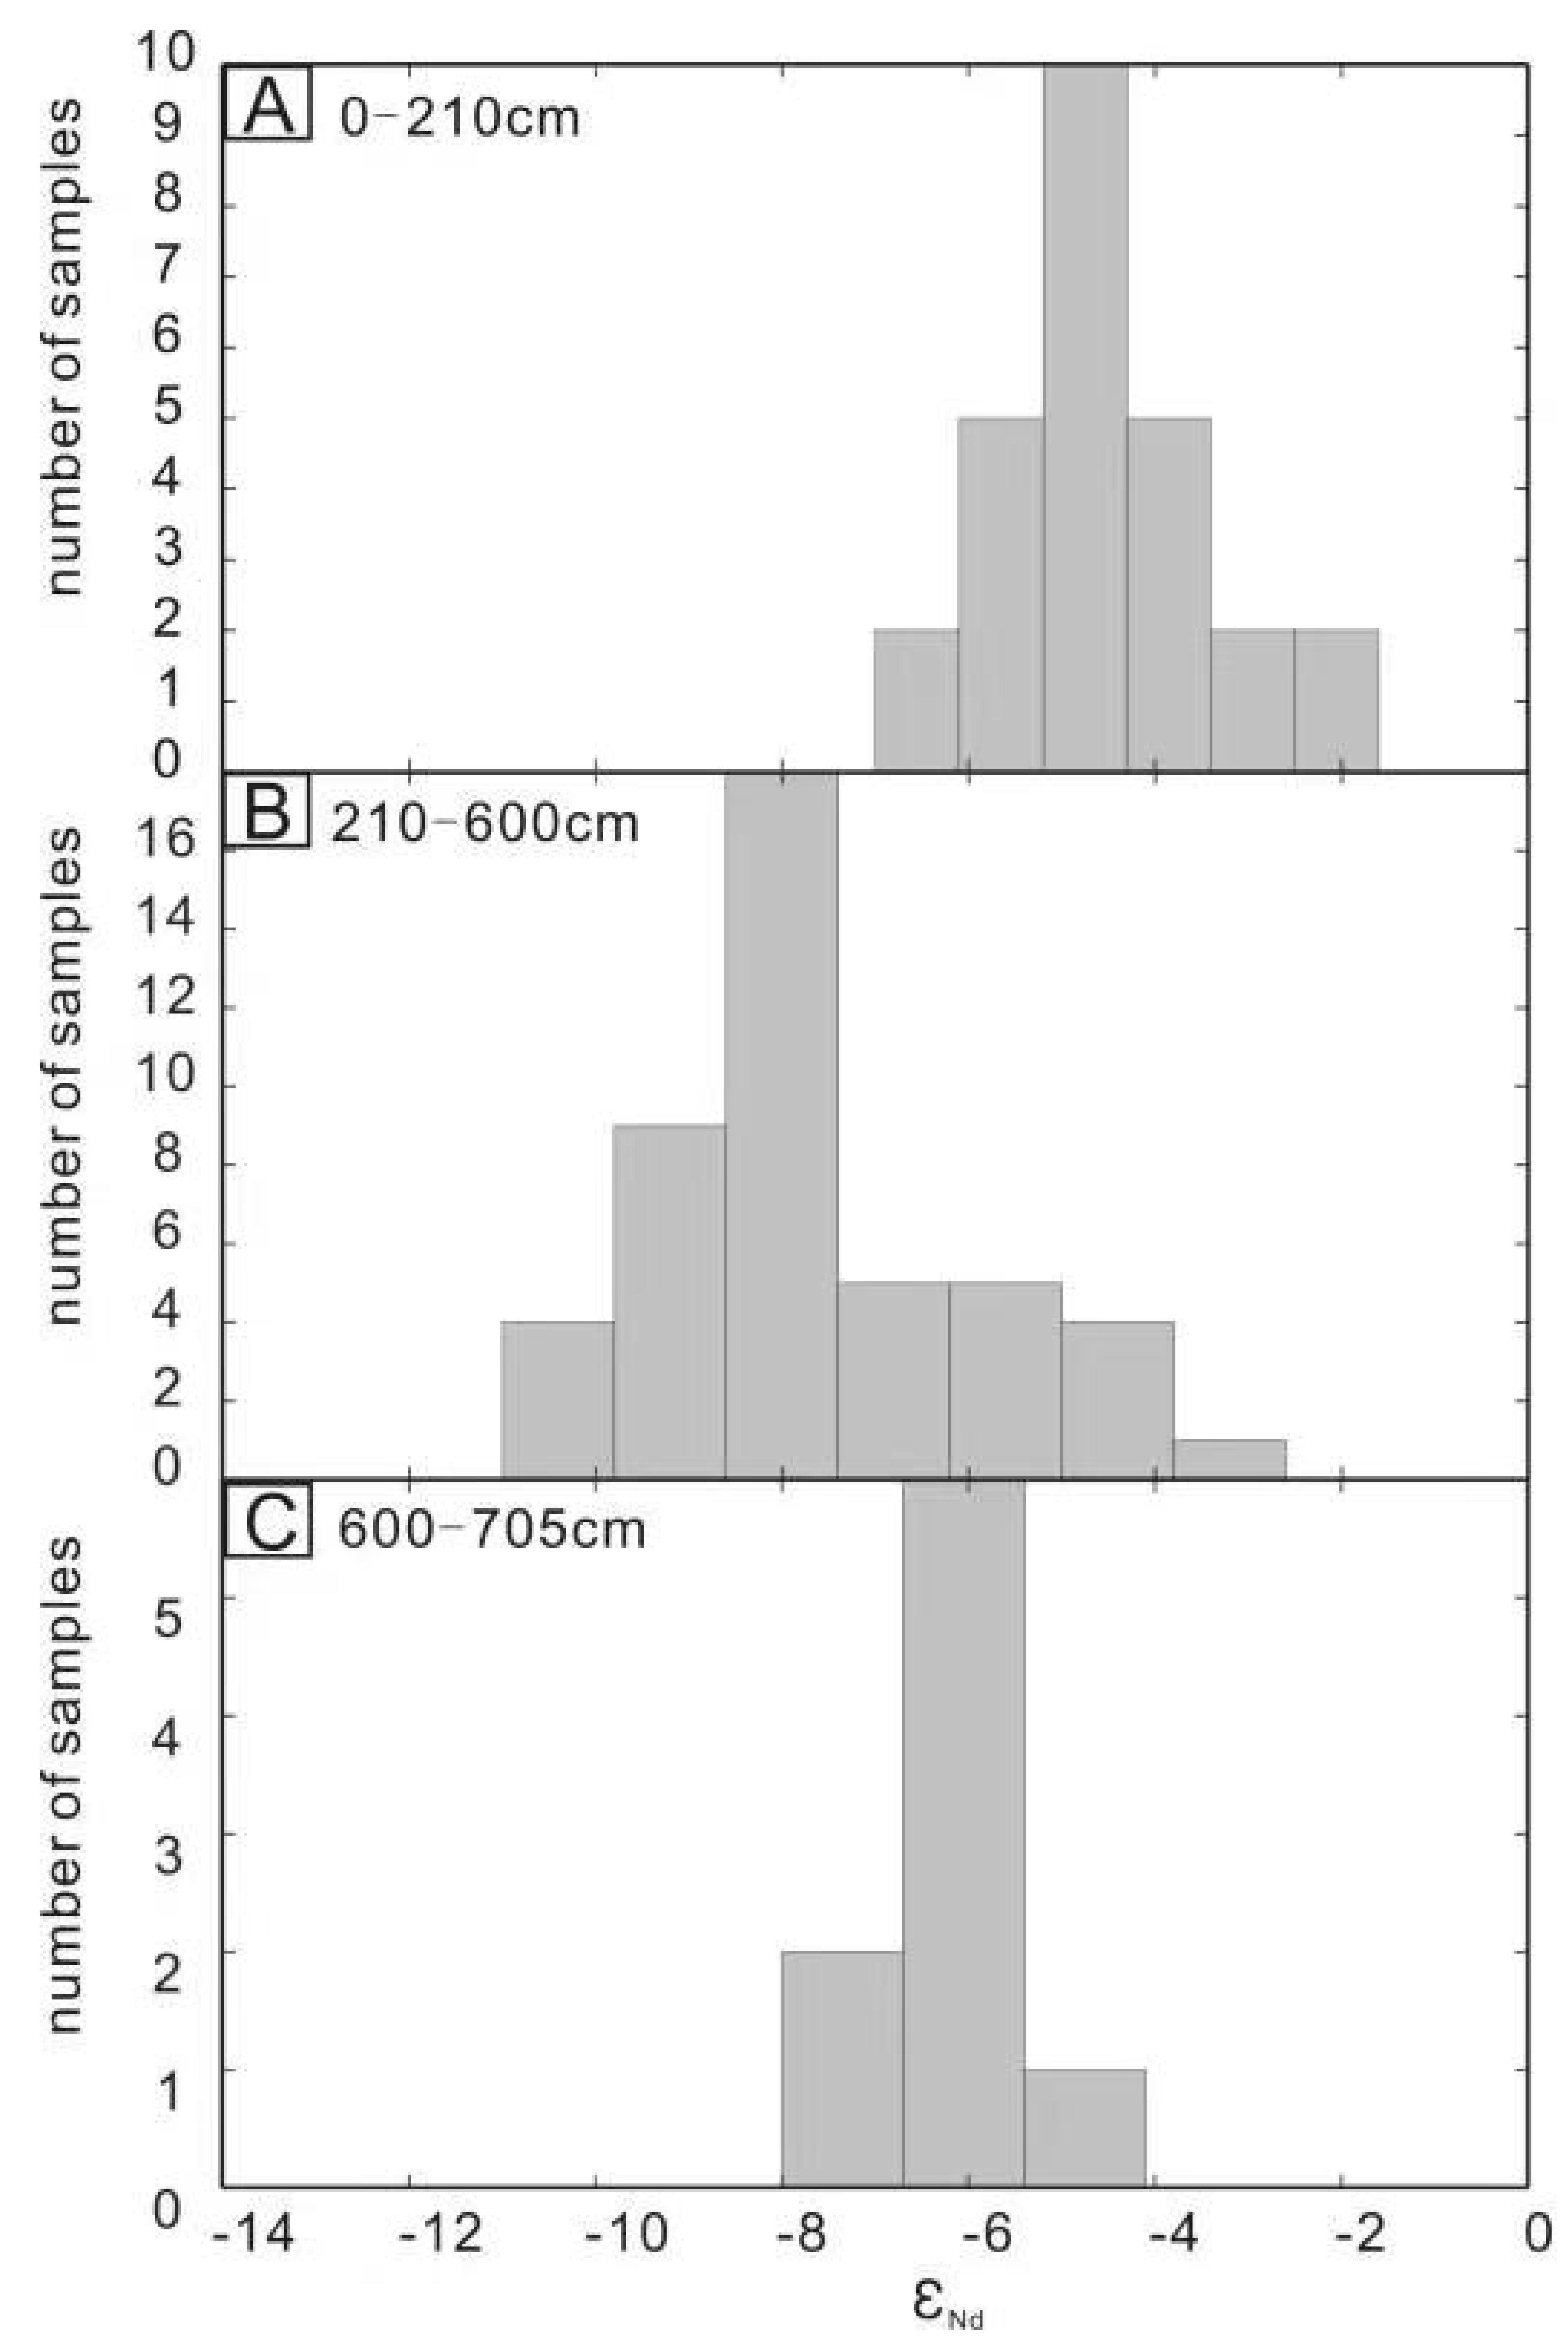
3.4. Fish Teeth Nd Isotopic Compositions

In situ fish teeth Nd data from core P10 are listed in Table 3. The 143Nd/144Nd varied from 0.512110 to 0.512533, corresponding to an εNd range from −10.29 to −2.04 for the whole core. However, there were clear vertical variations in the Nd isotopes of apatite (Figure 7). Apatite εNd values varied from −6.42 to −2.04, concentrated between −5 and −3, with an average value of −4.48 in the upper 210 cm. In the 210–600 cm layer, apatite εNd values varied widely from −10.29 to −2.87 (i.e., significantly lower than in the upper layer). Apatite εNd values in the middle layer were divided into two ranges: from −10.29 to −7 and −6 to −2. At 600–705 cm, the values ranged from −7.69 to −4.27, with an average of −5.97. Apatite εNd is related to the REY content of the sediment. The REY contents of the 0–210 cm and 600–705 cm layers were lower than that of the 210–600 cm layer.

4. Discussion

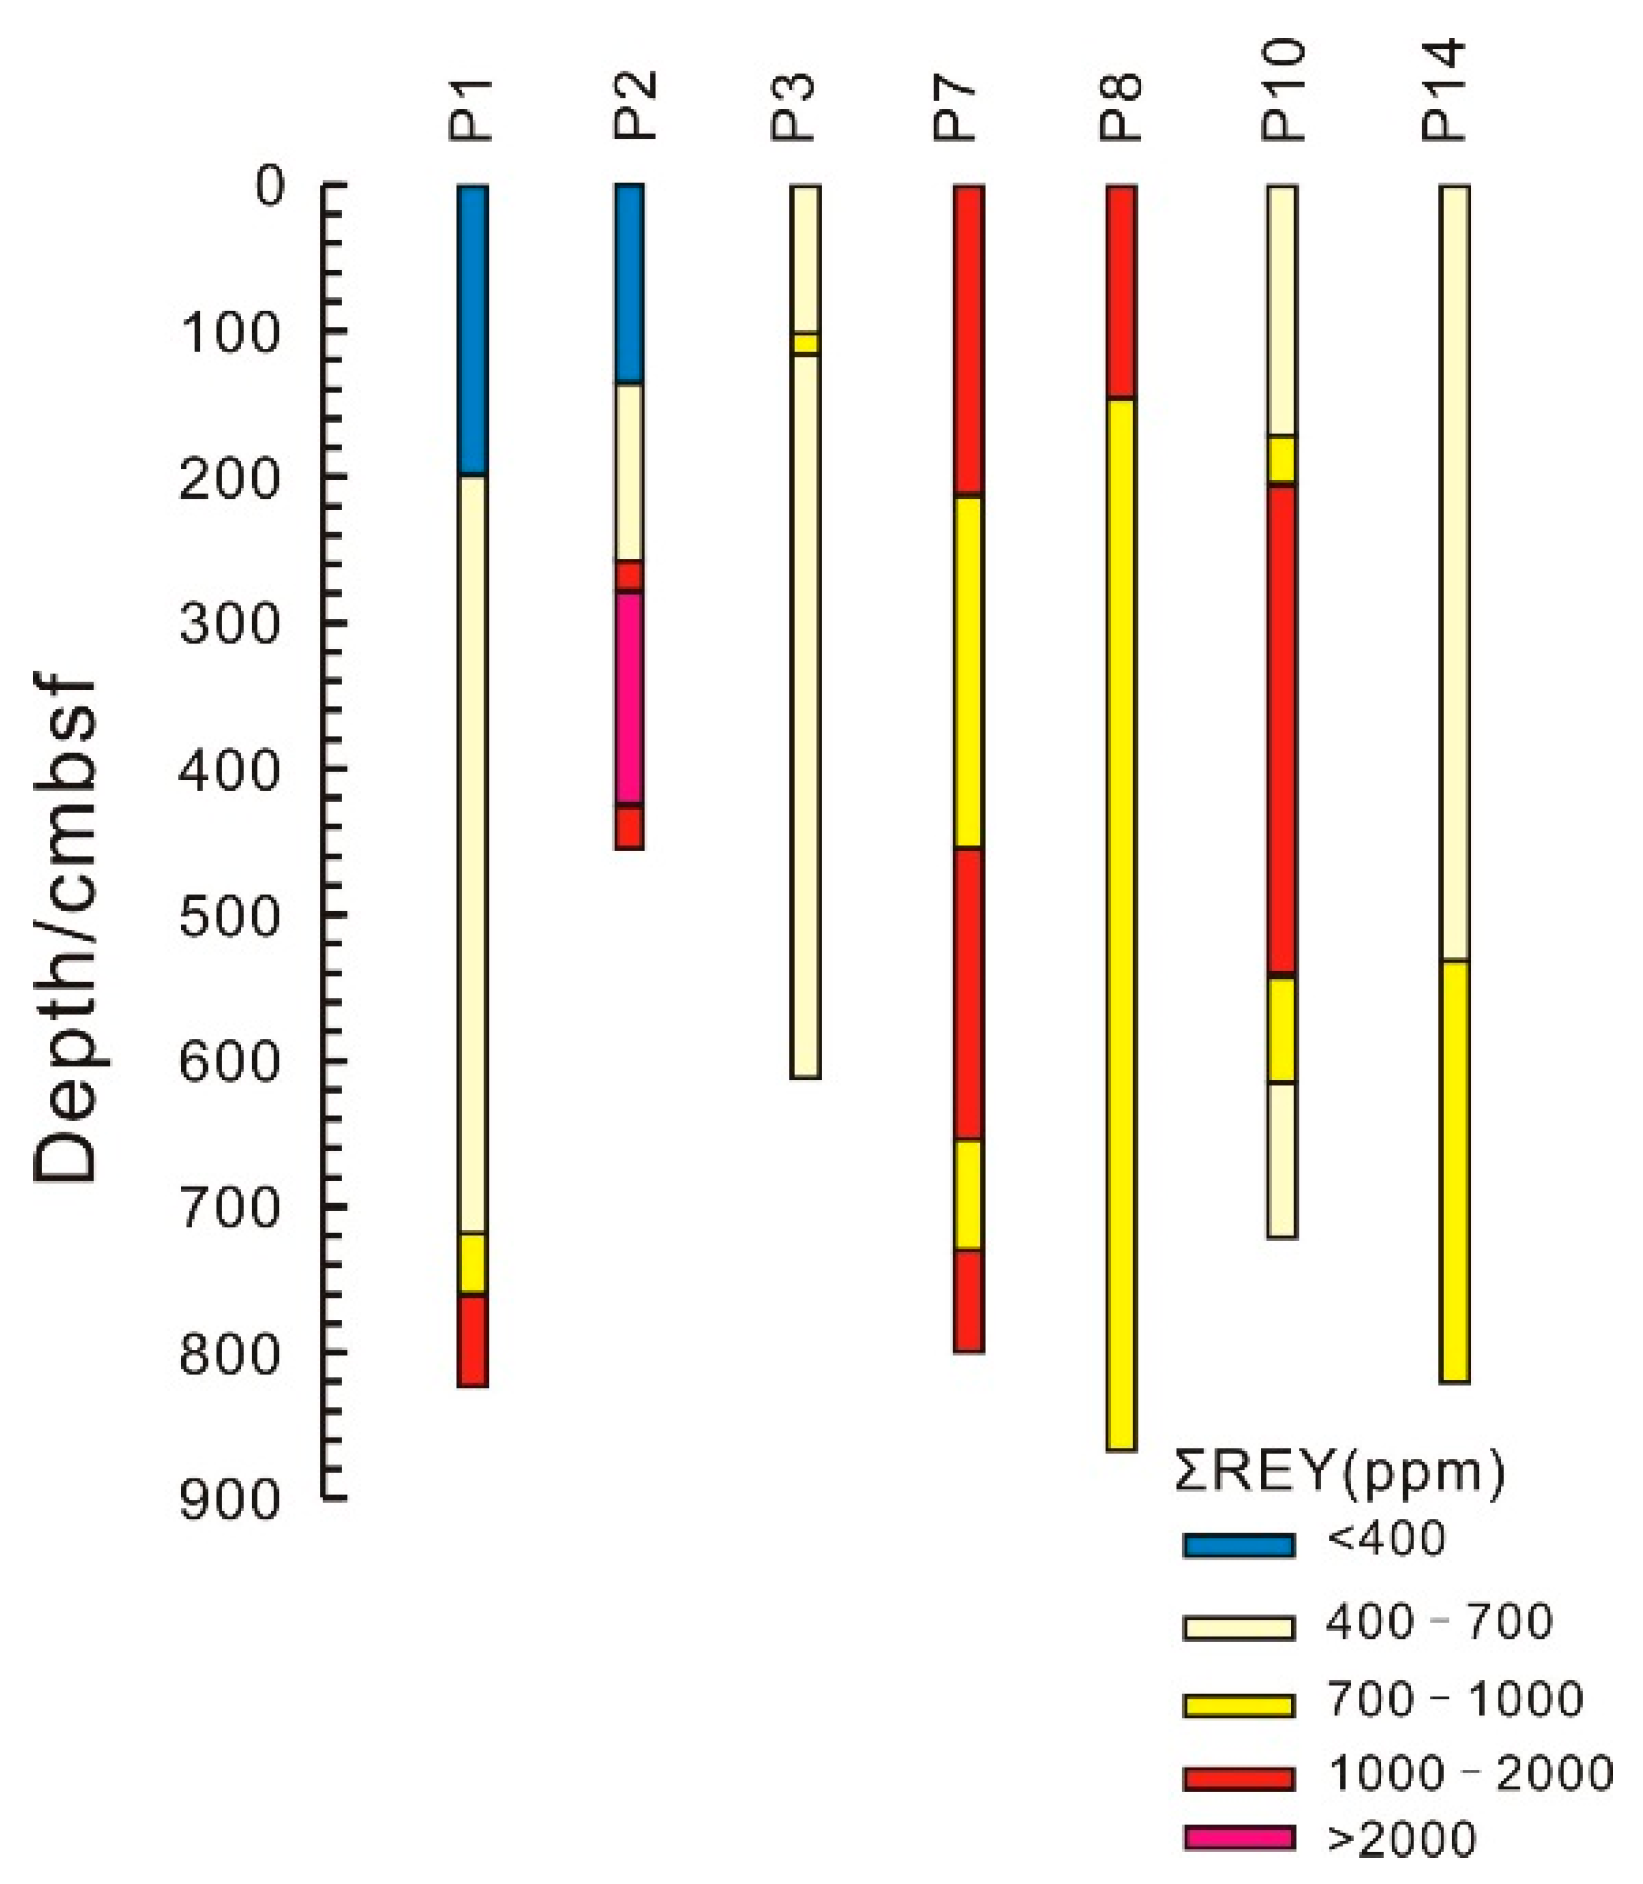
4.1. Distribution of REY-Rich Sediments in the Central and Western Pacific

As mentioned above, deep-sea sediments contain high concentrations of REY at numerous sites throughout the eastern South and central North Pacific [6]. However, the specific distributions of REY-rich sediments in the study area are still unknown.
In this study, REY-rich sediments in the surface layer (<2 m) of the Central and Western Pacific Ocean exhibited a regular distribution (Figure 2). Sediments with high REY contents (>1000 μg/g) were mainly concentrated around seamounts (e.g., the Marshall Seamounts and Mid-Pacific Seamounts). The REY contents of the surface sediments decreased with increasing distance from the seamounts. In the northwestern Pacific (northwestern Marshall Islands), the REY contents of the surface sediments gradually decreased from southeast to northwest. Surface sediments in the southeast had the highest REY contents (1000–1500 μg/g); whereas, those of the northwestern surface sediments were generally low (<400 μg/g). In the Central Pacific, the REY contents of the surface sediments also exhibited regular patterns, decreasing gradually with increasing distance from seamounts.
The REY content in the deeper core sediments were showed in Figure 4. Similar to those of the surface sediments, core sediments with high REY contents (e.g., >700 μg/g) also usually occurred around the Marshall Islands within a ~10 m depth range (i.e., cores P7, P8, and P10).

4.2. Dating REY-Rich Sediments

Core P10 was collected adjacent to Deep Sea Drilling Project (DSDP, the first of three international scientific ocean drilling programs that have operated over more than 40 years) site 170 in the Central Pacific. The DSDP initial reports (Volume 17, Site 170) indicate that the uppermost 16 m of zeolitic brown clay were late Oligocene–Quaternary in age; whereas, the 16–36 m layer was mainly Eocene–Oligocene cherts. Therefore, the deep-sea sediment in this area is not older than the Oligocene.
In this study, for each 87Sr/86Sr value, an age was assigned. Therefore, we were able to produce an age–depth curve for the clay (Table 2, Figure 8). Fish teeth Sr isotopic analyses from the upper 210 cm of the P10 yielded 87Sr/86Sr ratios of 0.7109143–0.709288 (with outliers of 0.709005 and 0.708961), which were identical (within error) to that of modern seawater (0.7092, [19]), except for the unreasonable data (mentioned in Section 3.3). In addition, common radiolarian fossils from the Quaternary period (e.g., Druppatractus testudo, Euchitonia trianglulum, and Stylodictya validispina) were observed in the upper 30 cm (internal report, unpublished data). According to the biostratigraphic and fish teeth Sr isotopic analyses, the age of the upper 210 cm of the core is Quaternary. We calculated a linear sedimentation rate (LSR) of ~1.0 mm/ky.
Fish teeth 87Sr/86Sr values in the middle (225–600 cm) layer, which had high REY contents (>1000 μg/g), ranged from 0.708005 to 0.708426, indicate a clear hiatus in deposition between the upper (210 cm) and middle layers. The fish teeth 87Sr/86Sr values of the lower (600–720 cm) layer were continuous with those of the middle layer (0.707960–0.708481), indicating that these two layers were continuously deposited. Fish teeth Sr ages indicate that the REY-rich sediments were Oligocene–early Miocene (30.13–20.08 Ma) in age. Stichocorys delmontensis radiolarian, which occurred in the early to late Miocene (internal report, unpublished data), were observed at 600 cm depth. Therefore, the radiolarian biostratigraphy is in agreement with the ages obtained from the fish teeth. We calculated an LSR of ~0.51 mm/ky, which was much slower than the upper layer.
From 84 Ma, the Drake Passage began to open [38]. Until the Oligocene and early Miocene (~29 Ma) [39,40], the opening of the Drake Channel led to the formation of deep circumpolar currents [41]. The evolution of the Miocene paleo-ocean was characterized by the opening and closing of channels, changes in ocean circulation, and the development of glaciers. Affected by underflows, extensive sedimentary discontinuities exist in Miocene sediments throughout the ocean basins [36,42]. In core P10, the Miocene deep-sea hiatuses are coincident with the global hiatuses. Therefore, the ages of the fish teeth obtained using in situ Sr isotopes are reliable and reasonable.

4.3. Antarctic Bottom Water (AABW) and REY Enrichment

Clear vertical variations were observed in the Nd isotopes of fish teeth in core P10 (Figure 7), indicating that the sediments were affected by different water masses at different depths. The seawater εNd value in the Northern and Central Pacific ranges from −5 to −3 at depths of 1000–5000 m [43]. In the upper 210 cm and lower 120 cm of core P10, the fish teeth εNd values were consistent with the Pacific deep water εNd, indicating that the REEs in these sediments were mainly derived from seawater.
However, the Nd isotopes of fish teeth in the middle layer (210–600 cm) were less radiogenic, exhibiting significantly reduced εNd values with amplitudes exceeding 2 units, which is much lower than that of the seawater εNd. This indicates that the REY in these sediments was affected by other factors. In general, εNd values are mainly affected by continental and mantle materials. Overall, volcanic material from the seabed is more radiogenic and characterized by positive values; whereas, terrestrial materials are less radiogenic and characterized by negative values. For example, mid-ocean ridge basalts in the Pacific have an average εNd value of +10; whereas, terrestrial silicates from the northern Central Pacific have an average εNd value of −10.2 [44]. Therefore, significant inputs of terrestrial material will lower the εNd value. However, Figure 9 shows that the Al2O3 and SiO2 contents of the sediments in the 210–600 cm layer were slightly lower than those in the upper- and lowermost layers, indicating that the low apatite εNd was not caused by an input of terrestrial materials. The changes in Nd isotopic compositions were therefore mainly caused by the mixing of ocean water masses with different Nd isotopic compositions under the condition that external inputs remained stable [45].
As aforementioned, during the early Oligocene, the opening of Drake Passage resulted in an established deep circumpolar current and an increase in AABW activity. The AABW forms two branches after inflowing into the Central Pacific Basin through the Samoa channel, of which, one branch flows to the Northwestern Pacific Basin through the Marshall Islands (Figure 1, [26,46]). The sediments in the study area are located in the area where the AABW flows. The AABW is a low-temperature, high salinity, high density, and oxygen-rich water mass. It controls deep ocean circulation and provides a strong oxidizing environment for crust formation at seamounts [47]. The environmental redox indicators of the Ce anomaly have been verified [48,49]. The NASC-normalized REE pattern (Figure 5) exhibited a significant negative Ce anomaly in the sediments of core P10, indicating that they were formed under strongly oxidizing conditions. In contrast, the fish teeth εNd values of the 210–600 cm layer of core P10 ranged from −10.29 to −2.87, with some values similar to the εNd value of the AABW (≈−9, [24]), implying that the REY-rich sediments were affected by the AABW. However, where the AABW is strong, sediment is eroded or transported, which is not conducive for deposition. The fish teeth εNd values of REY-rich sediment had a relatively broad range, indicating that they were partly affected by the AABW. As the thermal gradient between the polar region and the equator increased, the activity of the AABW strengthened during the Miocene. Correspondingly, sediments were eroded and transported away by the strong AABW, explaining the depositional hiatus observed in core P10 during this period.
In the modern ocean, enhanced primary productivity around seamounts is a result of upwelling generated by seamount–current interactions [50,51]. The intensified northward AABW would have led to the upwelling of nutrients in regions with topographic barriers that were steep and large enough to allow upwelling [52,53]. This supply of nutrients in oligotrophic pelagic regions may have been sufficient to increase local fish proliferation [53]. The phenomenon, whereby REY-rich sediments with high contents of fish teeth were observed mainly around the seamounts in this study, also supports the influence of the AABW on the enrichment of REY in the sediment.

5. Conclusions

This study indicates that the REY-rich sediments (>1000 μg/g) in the Central and Western Pacific have a clear spatial distribution and are mainly concentrated around seamounts. The chronological data from a typical piston core indicate that REY-rich sediments were mainly deposited during the early Oligocene to early Miocene. Therefore, since the opening of the Drake Passage in the early Oligocene, the AABW began to affect the Pacific Ocean. The upwelling of AABW induced fish proliferation around seamounts, simultaneously slowing sediment deposition and trying for enough time for REY entering and enriching in the apatite (fish teeth debris). During the early Oligocene to Miocene, when the AABW intensity was moderate, REY was enriched in the apatite (fish detritus) in the pelagic and zeolite clays. The specific spatial distribution of REY-rich sediments, described in this study, can provide guidance for future searches for REY-rich sediments in the Pacific, as well as in other oceans.

Author Contributions

Conceptualization and methodology, F.W. and G.H.; sample collection, F.W., X.D., Y.Y. and J.R.; formal analysis, F.W., X.D. and J.R.; figures, F.W. and Y.Y.; writing—original draft preparation, F.W. and G.H. All authors have read and agreed to the published version of the manuscript.

Funding

This research was funded by the National Natural Science Foundation of China (Grant No. 41702096), the Key Special Project for Introduced Talents Team of Southern Marine Science and Engineering Guangdong Laboratory (Guangzhou), grant number GML2019ZD0106, the National Natural Science Foundation of China (Grant No. 41803026,42002085), the PI Project of Southern Marine Science and Engineering Guangdong Laboratory (Guangzhou) (Project No: GML2020GD0802), and the China Geological Survey (DD20190629, DD20191009).

Institutional Review Board Statement

Not applicable.

Informed Consent Statement

Not applicable.

Data Availability Statement

The data presented in this study are available on request from the corresponding author. The data are not publicly available due to privacy.

Acknowledgments

All of the drill core samples in this study were collected by the “Hai Yang Di Zhi Liu Hao”.

Conflicts of Interest

The authors declare no conflict of interest.

References

  1. Chakhmouradian, A.R.; Wall, F. Rare Earth Elements: Minerals, Mines, Magnets (and More). Elements 2012, 8, 333–340. [Google Scholar] [CrossRef]
  2. Hatch, G.P. Dynamics in the Global Market for Rare Earths. Elements 2012, 8, 341–346. [Google Scholar] [CrossRef]
  3. Humphries, M. Rare Earth Elements: The Global Supply Chain; Congressional Research Service: Washington, DC, USA, 2010.
  4. Liu, Y.; Chen, Z.; Yang, Z.; Sun, X.; Zhu, Z.; Zhang, Q. Mineralogical and geochemical studies of brecciated ores in the Dalucao REE deposit, Sichuan Province, southwestern China. Ore Geol. Rev. 2015, 70, 613–636. [Google Scholar] [CrossRef]
  5. Liu, Y.; Chakhmouradian, A.R.; Hou, Z.; Song, W.; Kynicky, J. Development of REE mineralization in the giant Maoniuping deposit (Sichuan, China): Insights from mineralogy, fluid inclusions, and trace-element geochemistry. Miner. Depos. 2019, 54, 701–718. [Google Scholar] [CrossRef]
  6. Kato, Y.; Fujinaga, K.; Nakamura, K.; Takaya, Y.; Kitamura, K.; Ohta, J.; Toda, R.; Nakashima, T.; Iwamori, H. Deep-sea mud in the Pacific Ocean as a potential resource for rare-earth elements. Nat. Geosci. 2011, 4, 535–539. [Google Scholar] [CrossRef]
  7. Yasukawa, K.; Liu, H.J.; Fujinaga, K.; Machida, S.; Haraguchi, S.; Ishii, T.; Nakamura, K.; Kato, Y. Geochemistry and mineralogy of REY-rich mud in the eastern Indian Ocean. J. Asian Earth Sci. 2014, 93, 25–36. [Google Scholar] [CrossRef]
  8. Gleason, J.D.; Moore, T.C., Jr.; Johnson, T.M.; Rea, D.K.; Owen, R.M.; Blum, J.D.; Pares, J.; Hovan, S.A. Age calibration of piston core EW9709-07 (equatorial central Pacific) using fish teeth Sr isotope stratigraphy. Palaeogeogr. Palaeoclimatol. Palaeoecol. 2004, 212, 355–366. [Google Scholar] [CrossRef]
  9. Gleason, J.D.; Moore, T.C., Jr.; Rea, D.K.; Johnson, T.M.; Owen, R.M.; Blum, J.D.; Hovan, S.A.; Jones, C.E. Ichthyolith strontium isotope stratigraphy of a Neogene red clay sequence:calibrating eolian dust accumulation rates in the central North Pacific. Earth Planet. Sci. Lett. 2002, 202, 625–636. [Google Scholar] [CrossRef]
  10. Hess, J.; Stott, L.D.; Bender, M.L.; Kennett, J.P.; Schilling, J.G. The Oligocene marine microfossil record: Age assessments using strontium isotopes. Paleoceanography 1989, 4, 655–680. [Google Scholar] [CrossRef]
  11. McArthur, J.M.; Burnett, J.; Hancock, J.M. Strontium isotopes at K/T boundary. Nature 1992, 355, 28. [Google Scholar] [CrossRef]
  12. McArthur, I.M.; Chen, M.; Gale, A.S.; Kenedy, W.J. Strontium isotope stratigraphy in the Late Cretaceous: Numerical calibration of the Sr isotope curve and intercontinental correlations for the Campanian. Paleoceanogr. Paleoclimatol. 1993, 8, 859–873. [Google Scholar] [CrossRef] [Green Version]
  13. Dingle, R.V.; McArthur, J.M.; Vroon, P. Oligocene and Pliocene interglacial events in the Antarctic Peninsula dated using strontium isotope stratigraphy. J. Geol. Soc. Lond. 1997, 154, 257–264. [Google Scholar] [CrossRef]
  14. Dingle, R.V.; Lavelle, M. Late Cretaceous–Cenozoic climatic variations of the northern Antarctic Peninsula: New geochemical evidence and review. Palaeogeogr. Palaeoclimatol. Palaeoecol. 1998, 141, 215–232. [Google Scholar] [CrossRef]
  15. Crame, A.J.; McArthur, J.M.; Pirrie, D.; Riding, J.B. Strontium isotope correlation of the basal Maastrichtian stage in Antarctica to the European and U.S. standard biostratigraphic schemes. J. Geol. Soc. Lond. 1999, 156, 957–964. [Google Scholar] [CrossRef]
  16. Arrhenius, G.; Bramlette, M.N.; Piciotto, E. Localization of radioactive and stable heavy nuclides in ocean sediments. Nature 1957, 180, 85–86. [Google Scholar] [CrossRef]
  17. Wright, J.; Schrader, H.; Holser, W.T. Paleoredox variations in ancient oceans recorded by rare earth elements in fossil apatite. Geochim. Cosmochim. Acta 1987, 51, 631–644. [Google Scholar] [CrossRef]
  18. Snoeckx, H.; Rea, D.K.; Jones, C.E.; Ingram, B.L. Eolian and Silica Deposition in the Central North Pacific: Results from Leg 145 sites 885/886. In Proceedings of the Ocean Drilling Program. Scientific Results; Rea, D.K., Basov, I.A., Scholl, D.W., Allan, J.F., Eds.; Ocean Drilling Progarm, Texam A&M University: College Station, TX, USA, 1995; Volume 145, pp. 219–230. Available online: http://www-odp.tamu.edu/publications/145_SR/VOLUME/CHAPTERS/sr145_14.pdf (accessed on 19 November 2021).
  19. McArthur, J.M.; Howarth, R.J.; Bailey, T.R. Strontium isotope stratigraphy: LOWESS Version 3: Best fit to the marine Sr-isotope curve for 0–509 Ma and accompanying look-up table for deriving numerical ages. J. Geol. 2001, 109, 155–170. [Google Scholar] [CrossRef] [Green Version]
  20. Palmer, M.R.; Elderfield, H. Variations in the Nd isotopic composition of foraminifera from Atlantic Ocean sediments. Earth Planet. Sci. Lett. 1985, 73, 299–305. [Google Scholar] [CrossRef]
  21. Goldberg, E.D.; Koide, M.; Schmitt, R.A.; Smith, J. Rare earth distributions in the marine environment. J. Geophys. Res. 1963, 68, 4209–4217. [Google Scholar] [CrossRef]
  22. Staudigel, H.; Doyle, P.; Zindler, A. Sr and Nd isotope systematics in fish teeth. Earth Planet. Sci. Lett. 1985, 76, 45–56. [Google Scholar] [CrossRef]
  23. Piepgras, D.J.; Wasserburg, G.J. Nd isotopic variations in seawater. Earth Planet. Sci. Lett. 1980, 50, 128–138. [Google Scholar] [CrossRef]
  24. Piepgras, D.J.; Wasserburg, G.J. Isotopic composition of neodymium in waters from the Drake Passage. Science 1982, 217, 207–214. [Google Scholar] [CrossRef] [PubMed]
  25. Dutkiewicz, A.; Müller, R.D.; O’Callaghan, S.; Jónasson, H. Census of seafloor sediments in the world’s ocean. Geology 2015, 43, 795–798. [Google Scholar] [CrossRef]
  26. Kawabe, M.; Fujio, S.; Yanagimoto, D. Deep-water circulation at low latitudes in the western North Pacific. Deep Sea Res. Part I Oceanogr. Res. Pap. 2003, 50, 631–656. [Google Scholar] [CrossRef]
  27. Yang, Y.H.; Wu, F.Y.; Xie, L.W.; Yang, J.H.; Zhang, Y.B. In-situ Sr isotopic measurement of natural geological samples by LA-MC-ICP-MS. Acta Petrol. Sin. 2009, 25, 3431–3441. (In Chinese) [Google Scholar]
  28. Hou, K.J.; Qin, Y.; Li, Y.H.; Fan, C.F. In situ Sr-Nd Isotopic Measurement of Apatite Using Laser Ablation Multi-collector Inductively Coupled Plasma-Mass Spectrometry. Rock Miner. Anal. 2013, 32, 547–554. (In Chinese) [Google Scholar]
  29. Zhang, L.; Ren, Z.Y.; Xia, X.P.; Li, J.; Zhang, Z.F. IsotopeMaker: A Matlab program for isotopic data reduction. Int. J. Mass Spectrom. 2015, 392, 118–124. (In Chinese) [Google Scholar] [CrossRef] [Green Version]
  30. Wasserburg, G.J.; Jacobsen, S.B.; DePaolo, D.J.; McCulloch, M.T.; Wen, T. Precise determination of SmNd ratios, Sm and Nd isotopic abundances in standard solutions. Geochim. Cosmochim. Acta 1981, 45, 2311–2323. [Google Scholar] [CrossRef]
  31. Yang, Y.H.; Wu, F.Y.; Yang, J.H.; Chew, D.M.; Xie, L.W.; Chu, Z.Y.; Zhang, Y.B.; Huang, C. Sr and Nd isotopic compositions of apatite reference materials used in U–Th–Pb geochronology. Chem. Geol. 2014, 385, 35–55. (In Chinese) [Google Scholar] [CrossRef]
  32. Haskin, M.A.; Haskin, L.A. Rare earths in European shales: A redetermination. Science 1966, 154, 507–509. [Google Scholar] [CrossRef]
  33. Mead, G.A.; Hodell, D.A. Controls on the 87Sr/86Sr composition of seawater from the middle Eocene to Oligocene: Hole 689B, Maud rise, Antarctica. Paleoceanography 1995, 10, 327–346. [Google Scholar] [CrossRef]
  34. Hodell, D.A. Variations in the strontium isotopic ratio of seawater during the Miocene: Stratigraphic and geochemical implications. Paleoceonography 1994, 9, 405–426. [Google Scholar] [CrossRef]
  35. Hodell, D.A.; Mueller, P.A.; Garrido, J.R. Variations in the strontium isotopic composition of seawater during the Neogene. Geology 1991, 19, 24–27. [Google Scholar] [CrossRef]
  36. Dubois, N.; Mitchell, N.C. Large-scale sediment redistribution on the equatorial Pacific seafloor. Deep Sea Res. Part I Oceanogr. Res. Pap. 2012, 69, 51–61. [Google Scholar] [CrossRef]
  37. Veizer, J.; Compston, W. 87Sr/86Sr composition of seawater during the Phanerozoic. Geochim. Cosmochim. Acta 1947, 38, 1461–1484. [Google Scholar] [CrossRef]
  38. Vérard, C.; Flores, K.; Stampfli, G. Geodynamic reconstructions of the South America–Antarctica plate system. J. Geodyn. 2012, 53, 43–60. [Google Scholar] [CrossRef]
  39. Barker, P.F.; Burrell, J. The opening of Drake Passage. Mar. Geol. 1977, 25, 15–34. [Google Scholar] [CrossRef]
  40. Zachos, J.; Pagani, M.; Sloan, L.; Thomas, E.; Billups, K. Trends, Rhythms, and Aberrations in Global Climate 65 Ma to Present. Science 2001, 292, 686–693. [Google Scholar] [CrossRef] [PubMed]
  41. Keller, G.; Barron, J. Paleoceaanographic implications of Miocene deep-sea hiatuses. Geol. Soc. Am. Bull. 1983, 94, 590–613. [Google Scholar] [CrossRef]
  42. Barron, J.; Keller, G. Widespread Miocene deep-sea hiatuses: Coincidence with periods of global cooling. Geology 1982, 10, 577–581. [Google Scholar] [CrossRef]
  43. Albarède, F.; Goldstein, S.L. World map of Nd isotopes in sea-floor ferromanganese deposits. Geology 1992, 20, 761–763. [Google Scholar] [CrossRef]
  44. Jones, C.E.; Halliday, A.N.; Rea, D.K.; Owen, R.M. Neodymium isotopic variations in North Pacific modern silicate sediment and the insignificance of detrital REE contributions to seawater. Earth Planet. Sci. Lett. 1994, 127, 55–66. [Google Scholar] [CrossRef] [Green Version]
  45. Zhao, K.D.; Jiang, S.Y.; Zheng, X.Y.; Chen, T.Y.; Ling, F.F. Nd isotope evolution of ocean waters and implications for paleo-ocean circulation. Earth Sci. Front. 2009, 16, 160–171. (In Chinese) [Google Scholar]
  46. Kawabe, M.; Yanagimoto, D.; Kitagawa, S. Variations of deep western boundary currents in the Melanesian Basin in the western North Pacific. Deep Sea Res. Part I Oceanogr. Res. Pap. 2006, 53, 942–959. [Google Scholar] [CrossRef]
  47. Han, J.; Wu, G.H.; Ye, Y.; Wu, D.D. Geochemical record of bottom water in ferromanganese crusts. Miner. Depos. 2006, 25, 620–628. (In Chinese) [Google Scholar]
  48. De Carlo, E.H. Paleoceanographic implication of rare earth element variability in a marine Fe-Mn crust from the Hawaiian Archipelago. Mar. Geol. 1991, 98, 449–467. [Google Scholar] [CrossRef]
  49. Banakar, V.K.; Pattan, J.N.; Mudholkar, A.V. Palaeoceano graphic conditions during the formation of a ferromanganese curst from the Afanasiy-Nikitin seamount, North Central Indian Ocean: Geochemical evidence. Mar. Geol. 1997, 136, 299–315. [Google Scholar] [CrossRef]
  50. Rogers, A.D. The biology of seamounts. Adv. Mar. Biol. 1994, 30, 305–350. [Google Scholar]
  51. Rogers, A.D. The biology of seamounts: 25 Years on. Adv. Mar. Biol. 2018, 79, 137–224. [Google Scholar]
  52. Hein, J.R.; Yeh, H.W.; Gunn, S.H.; Sliter, W.V.; Benninger, L.M.; Wang, C.H. Two major Cenozoic episodes of phosphatization recorded in equatorial Pacific seamount deposits. Paleoceanography 2003, 8, 293–311. [Google Scholar] [CrossRef]
  53. Ohta, J.; Yasukawa, K.; Nozaki, T.; Takaya, Y.; Mimura, K.; Fujinaga, K.; Nakamura, K.; Usui, Y.; Kimura, J.I.; Chang, Q.; et al. Fish proliferation and rare-earth deposition by topographically induced upwelling at the late Eocene cooling event. Sci. Rep. 2020, 10, 1–11. [Google Scholar] [CrossRef]
Figure 3. Representative BSE images of fish teeth debris grains from the core P10. Red circles show the location of LA-ICP-MS Sr analyses. (AD) samples from different depths of the P10.
Jmse 09 01379 g003
Figure 4. REY contents of typical piston cores in the study area.
Jmse 09 01379 g004
Figure 5. North American shale composite (NASC)-normalized REE patterns of deep-sea sediments in core P10. NASC after [32].
Jmse 09 01379 g005
Figure 6. The REY content of sediment (a) and in situ fish teeth 87Sr/86Sr values (b) in core P10.
Jmse 09 01379 g006
Figure 7. In situ fish teeth εNd values in core P10. (AC), the 0–210 cm layer, the 210–600 cm layer and 600–705 cm layer of P10.
Jmse 09 01379 g007
Figure 8. Fish teeth ages obtained from core P10.
Jmse 09 01379 g008
Figure 9. Variations in REY, P2O5, SiO2, and Al2O3 contents in core P10.
Jmse 09 01379 g009
Table 2. Strontium isotopic data for P10 fish teeth debris.
Depth (cm)87Sr/86Sr (corr)Age (Ma)
300.7092490.000080 [19]
300.7091430.000090.5 [19]
450.7092570.000100 [19]
600.7091580.000110 [19]
600.7092040.000070 [19]
750.7092670.000130 [19]
900.7091870.000150 [19]
1200.7091650.000120 [19]
1350.7089610.000085.2 [19]
1500.7090050.000084.5 [19]
1800.7092780.000120 [19]
1950.7092880.000100 [19]
2100.7091830.000121.8 [19]
2250.7081240.0000726.77 [33]
2250.7082690.0001623.71 [33]
2400.7081490.0000925.31 [33]
2850.7084260.0001120.08 [33]
2850.7082530.0001123.36 [34]
3000.7082440.0000923.48 [34]
3000.7082750.0001121.9 [34]
3150.7080880.0001126.29 [33]
3150.7081890.0001023.96 [34]
3300.7082350.0001523.23 [34]
3300.7081840.0001123.96 [34]
3450.7081400.0001025.31 [33]
3600.7082710.0001423.71 [35]
3600.7083300.0001022.61 [35]
3750.7082270.0001124.11 [35]
3900.7081260.0000825.7 [33]
3900.7080620.0001227.67 [33]
4050.7082180.0001024.33 [35]
4050.7081500.0000725.31 [33]
4200.7080160.0000728.68 [33]
4200.7080330.0001028.18 [33]
4350.7080050.0000929.22 [33]
4500.7083310.0001322.61 [35]
4650.7081130.0001026.67 [33]
4650.7083700.0001121.06 [35]
4800.7080920.0001427.46 [33]
4800.7080990.0000926.97 [33]
4950.7081870.0000924.87 [33]
4950.7080640.0001027.67 [33]
5100.7082750.0001023.71 [35]
5250.7081960.0001224.87 [33]
5250.7083850.0001121.27 [35]
5400.7080410.0001027.98 [33]
5700.7081780.0001725.02 [33]
5700.7082390.0001424.22 [35]
5850.7081060.0000826.14 [33]
5850.7080660.0000827.67 [33]
6000.7080960.0000727.07 [33]
6000.7080560.0001027.58 [33]
6300.7082540.0000923.95 [35]
6450.7080080.0000929.22 [33]
6600.7081840.0001426.29 [33]
6750.7079600.0000730.13 [33]
6950.7083090.0001223.03 [35]
7050.7083500.0000821.98 [35]
7050.7084770.0001220.42 [35]
7200.7084810.0001020.82 [35]
Table 3. Nd isotopic data for P10 fish teeth debris.
Depth (cm)143Nd/144NdεNd
150.5124130.000039−4.40
300.5123740.000049−5.14
450.5124150.000032−4.35
450.5123710.000054−5.21
450.5124180.000076−4.29
600.5123090.000028−6.42
750.5125310.000037−2.09
750.5124970.000045−2.75
900.5125330.000035−2.04
900.5123200.000041−6.20
1050.5124110.000037−4.43
1050.5123720.000044−5.19
1350.5123430.000077−5.76
1350.5123870.000032−4.90
1500.5123350.000051−5.91
1500.5124160.000027−4.34
1650.5124490.000038−3.69
1800.5124360.000038−3.95
1800.5123750.000029−5.13
1950.5123970.000022−4.71
1950.5124080.000024−4.49
2100.5121830.000066−8.88
2100.5124210.000031−4.22
2250.5121240.000034−10.03
2250.5121660.000032−9.21
2250.5121870.000049−8.79
2400.5121360.000032−9.80
2400.5121270.000169−9.97
2550.5124070.000024−4.52
2550.5121550.000031−9.43
2700.5122560.000039−7.45
2850.5121100.000038−10.29
2850.5122500.000042−7.58
3000.5122120.000029−8.31
3000.5122500.000042−7.56
3150.5122560.000043−7.46
3150.5122350.000034−7.86
3300.5122410.000035−7.75
3300.5121800.000039−8.93
3450.5124060.000047−4.53
3600.5122490.000028−7.59
3600.5122690.000042−7.19
3750.5122840.000042−6.90
3750.5122000.000060−8.55
3900.5123690.000039−5.24
4050.5122380.000038−7.80
4050.5121120.000054−10.26
4200.5122640.000060−7.29
4350.5122080.000048−8.39
4350.5123490.000034−5.64
4650.5122360.000036−7.84
4800.5121370.000045−9.78
4950.5124270.000060−4.11
5100.5124910.000045−2.87
5250.5123690.000020−5.25
5400.5122500.000053−7.56
5550.5121870.000030−8.79
5700.5122470.000065−7.64
5700.5122930.000028−6.74
5850.5123730.000028−5.18
6000.5124190.000036−4.27
6000.5123580.000019−5.47
6300.5123480.000023−5.65
6300.5123150.000023−6.30
6600.5123520.000023−5.59
6900.5123520.000023−5.59
6900.5122440.000049−7.69
7050.5123290.000027−6.03
Publisher’s Note: MDPI stays neutral with regard to jurisdictional claims in published maps and institutional affiliations.

