Article

Depositional Sedimentary Facies, Stratigraphic Control, Paleoecological Constraints, and Paleogeographic Reconstruction of Late Permian Chhidru Formation (Western Salt Range, Pakistan)

by
Syed Kamran Ali
1,
Hammad Tariq Janjuhah
2,*,
Syed Muzyan Shahzad
3,
George Kontakiotis
4,*,
Muhammad Hussain Saleem
1,
Usman Khan
5,
Stergios D. Zarkogiannis
6,
Panayota Makri
4 and
Assimina Antonarakou
4
1
Institute of Geology, University of Azad Jammu and Kashmir, Muzaffarabad 13100, Azad Kashmir, Pakistan
2
Department of Geology, Shaheed Benazir Bhutto University, Dir (U), Sheringal 18050, Khyber Pakhtunkhwa, Pakistan
3
School of Geoscience and Info-Physics, Central South University, Changsha 410083, China
4
Department of Historical Geology-Paleontology, Faculty of Geology and Geoenvironment, School of Earth Sciences, National and Kapodistrian University of Athens, Panepistimiopolis, Zografou, 15784 Athens, Greece
5
Department of Earth Sciences, Université Lille 1, Cité Scientifique, CEDEX, 59655 Villeneuve d’Ascq, France
6
Department of Earth Sciences, University of Oxford, Oxford OX1 3AN, UK
*
Authors to whom correspondence should be addressed.
J. Mar. Sci. Eng. 2021, 9(12), 1372; https://doi.org/10.3390/jmse9121372
Submission received: 20 November 2021 / Revised: 29 November 2021 / Accepted: 30 November 2021 / Published: 3 December 2021
(This article belongs to the Special Issue Recent Advances in Geological Oceanography)

Abstract

:
The Upper Indus Basin, in Pakistan’s western Salt Range, is home to the Zaluch Gorge. The sedimentary rocks found in this Gorge, belonging to the Chhidru Formation, were studied in terms of sedimentology and stratigraphy, and provide new insights into the basin paleogeographic evolution from the Precambrian to the Jurassic period. Facies analysis in the Chhidru Formation deposits allowed the recognition of three lithofacies (the limestone facies—CF1, the limestone with clay interbeds facies—CF2, and the sandy limestone facies—CF3) with five microfacies types (mudstone biomicrite—MF-1, wackestone-biomicrite—MF-2, wackestone-biosparite—MF-3, pack-stone-biomicrite—MF-4, and packstone-biosparite—MF-5), as well as their depositional characteristics. The identified carbonate and siliciclastic formations display various facies in a shallow marine environment, with different lithologies, sedimentary features, and energy conditions. It is thought that the depositional characteristics of these microfacies are closer to those of the middle to outer shelf. Because of the progressively coarsening outcrop sequence, this formation seems to be at the very top of the high stand system tract (HST). A modified dynamic depositional model of the Chhidru Formation is further built using outcrop data, facies information, and stratigraphy. According to this concept, the formation was deposited in the middle to inner shelf area of the shallow marine environment, during the Late-Permian period. The Permo-Triassic Boundary (PTB), which is the end of the type-1 series, is marked by this formation’s top.

1. Introduction

The Salt Range region of Pakistan has been the focus of geological study because of its complicated geology, which ranges in age from Precambrian to Recent [1], although the precise sedimentological sequence and its paleoenvironmental significance remain largely unclear. The Salt Range of Pakistan, situated in the southern Potwar Basin, is the southernmost portion of the Sub-Himalayan Mountains, which stretch east-west for more than 180 km between the Jhelum and Indus rivers (Figure 1). An unconformably thick sedimentary layer covers low-grade metamorphic and igneous rocks in the Salt Range from the Precambrian to modern eras (Figure 1). A long phase of nondeposition has persisted over the majority of the Indian subcontinent since the Late Proterozoic, when Pakistan and India’s Permian sedimentation began [2].
The upper part of the Chhidru Group was given a Permian age [3,4,5]. The Permo-Triassic layers in the western Chhidru Nala were also measured by Wignall and Hallam [6]. The evidence supporting a significant split between the Permian and Triassic sequences, on the other hand, eluded him. As a result of their research, Kummel [7] identified the Permian-Triassic boundary as a “paraconformity of undetermined magnitude” and characterized the distribution of lithology and fauna of layers above and below it. For further information on the stratigraphic succession of this formation, we refer to the works of Theobald [8], Ghazi et al. [9], Schneebeli-Hermann et al. [10], and Waterhouse [11]. They classified it as the Permian period of the Upper Chhidru Group. No clear boundary existed between the Permian and Triassic period following these Salt Range studies.
Shen et al. [13] projected a proper age for the Chhidru’s Formation, although the age is still debated. The most recent palynological and stratigraphic investigations detail the microfossil composition of the Middle Permian Sardhai Formation and the Permian to Middle Triassic assemblages [3,14,15]. Hermann et al. [3] used microfloral records from the Nammal and Chhidru (Salt Range), and Chitta-Landu and Narmia, to identify three palynological associations and five different palynostratigraphic zones from the top Permian to the middle Triassic (Surghar Range). To study palynological assemblages, scientists had to look at sedimentary gaps at the Permian-Triassic border and carbonate-dolomite lithology in the Lower Triassic. Mertmann [16] investigated the evolution of the Salt Range’s marine Permian carbonate platform and described the various system tracts. Although general information about the stratigraphic and sedimentological aspects of the various formations in the Salt Range exists, the specific critical approach in terms of sedimentology and stratigraphy for the Chhidru Formation is lacking, which is crucial in understanding the Permo-Triassic (P-T) boundary in the Western Salt Range.
The present study has conducted a critical examination of facies analysis, microfacies types, and other aspects of the depositional environment, as well as the distribution of fauna in the Chhidru Formation; this is necessary to understand and identify the cyclical order in Pakistan’s Western Salt Range stratigraphic framework, based on sedimentological and stratigraphic research on the Salt Range. The dynamic depositional model that was proposed will provide additional insights into the paleogeographic evolution of the basin and better correlation with coeval analogous tectono-stratigraphic successions along the south-eastern margin of the Paleo-Tethys Ocean.

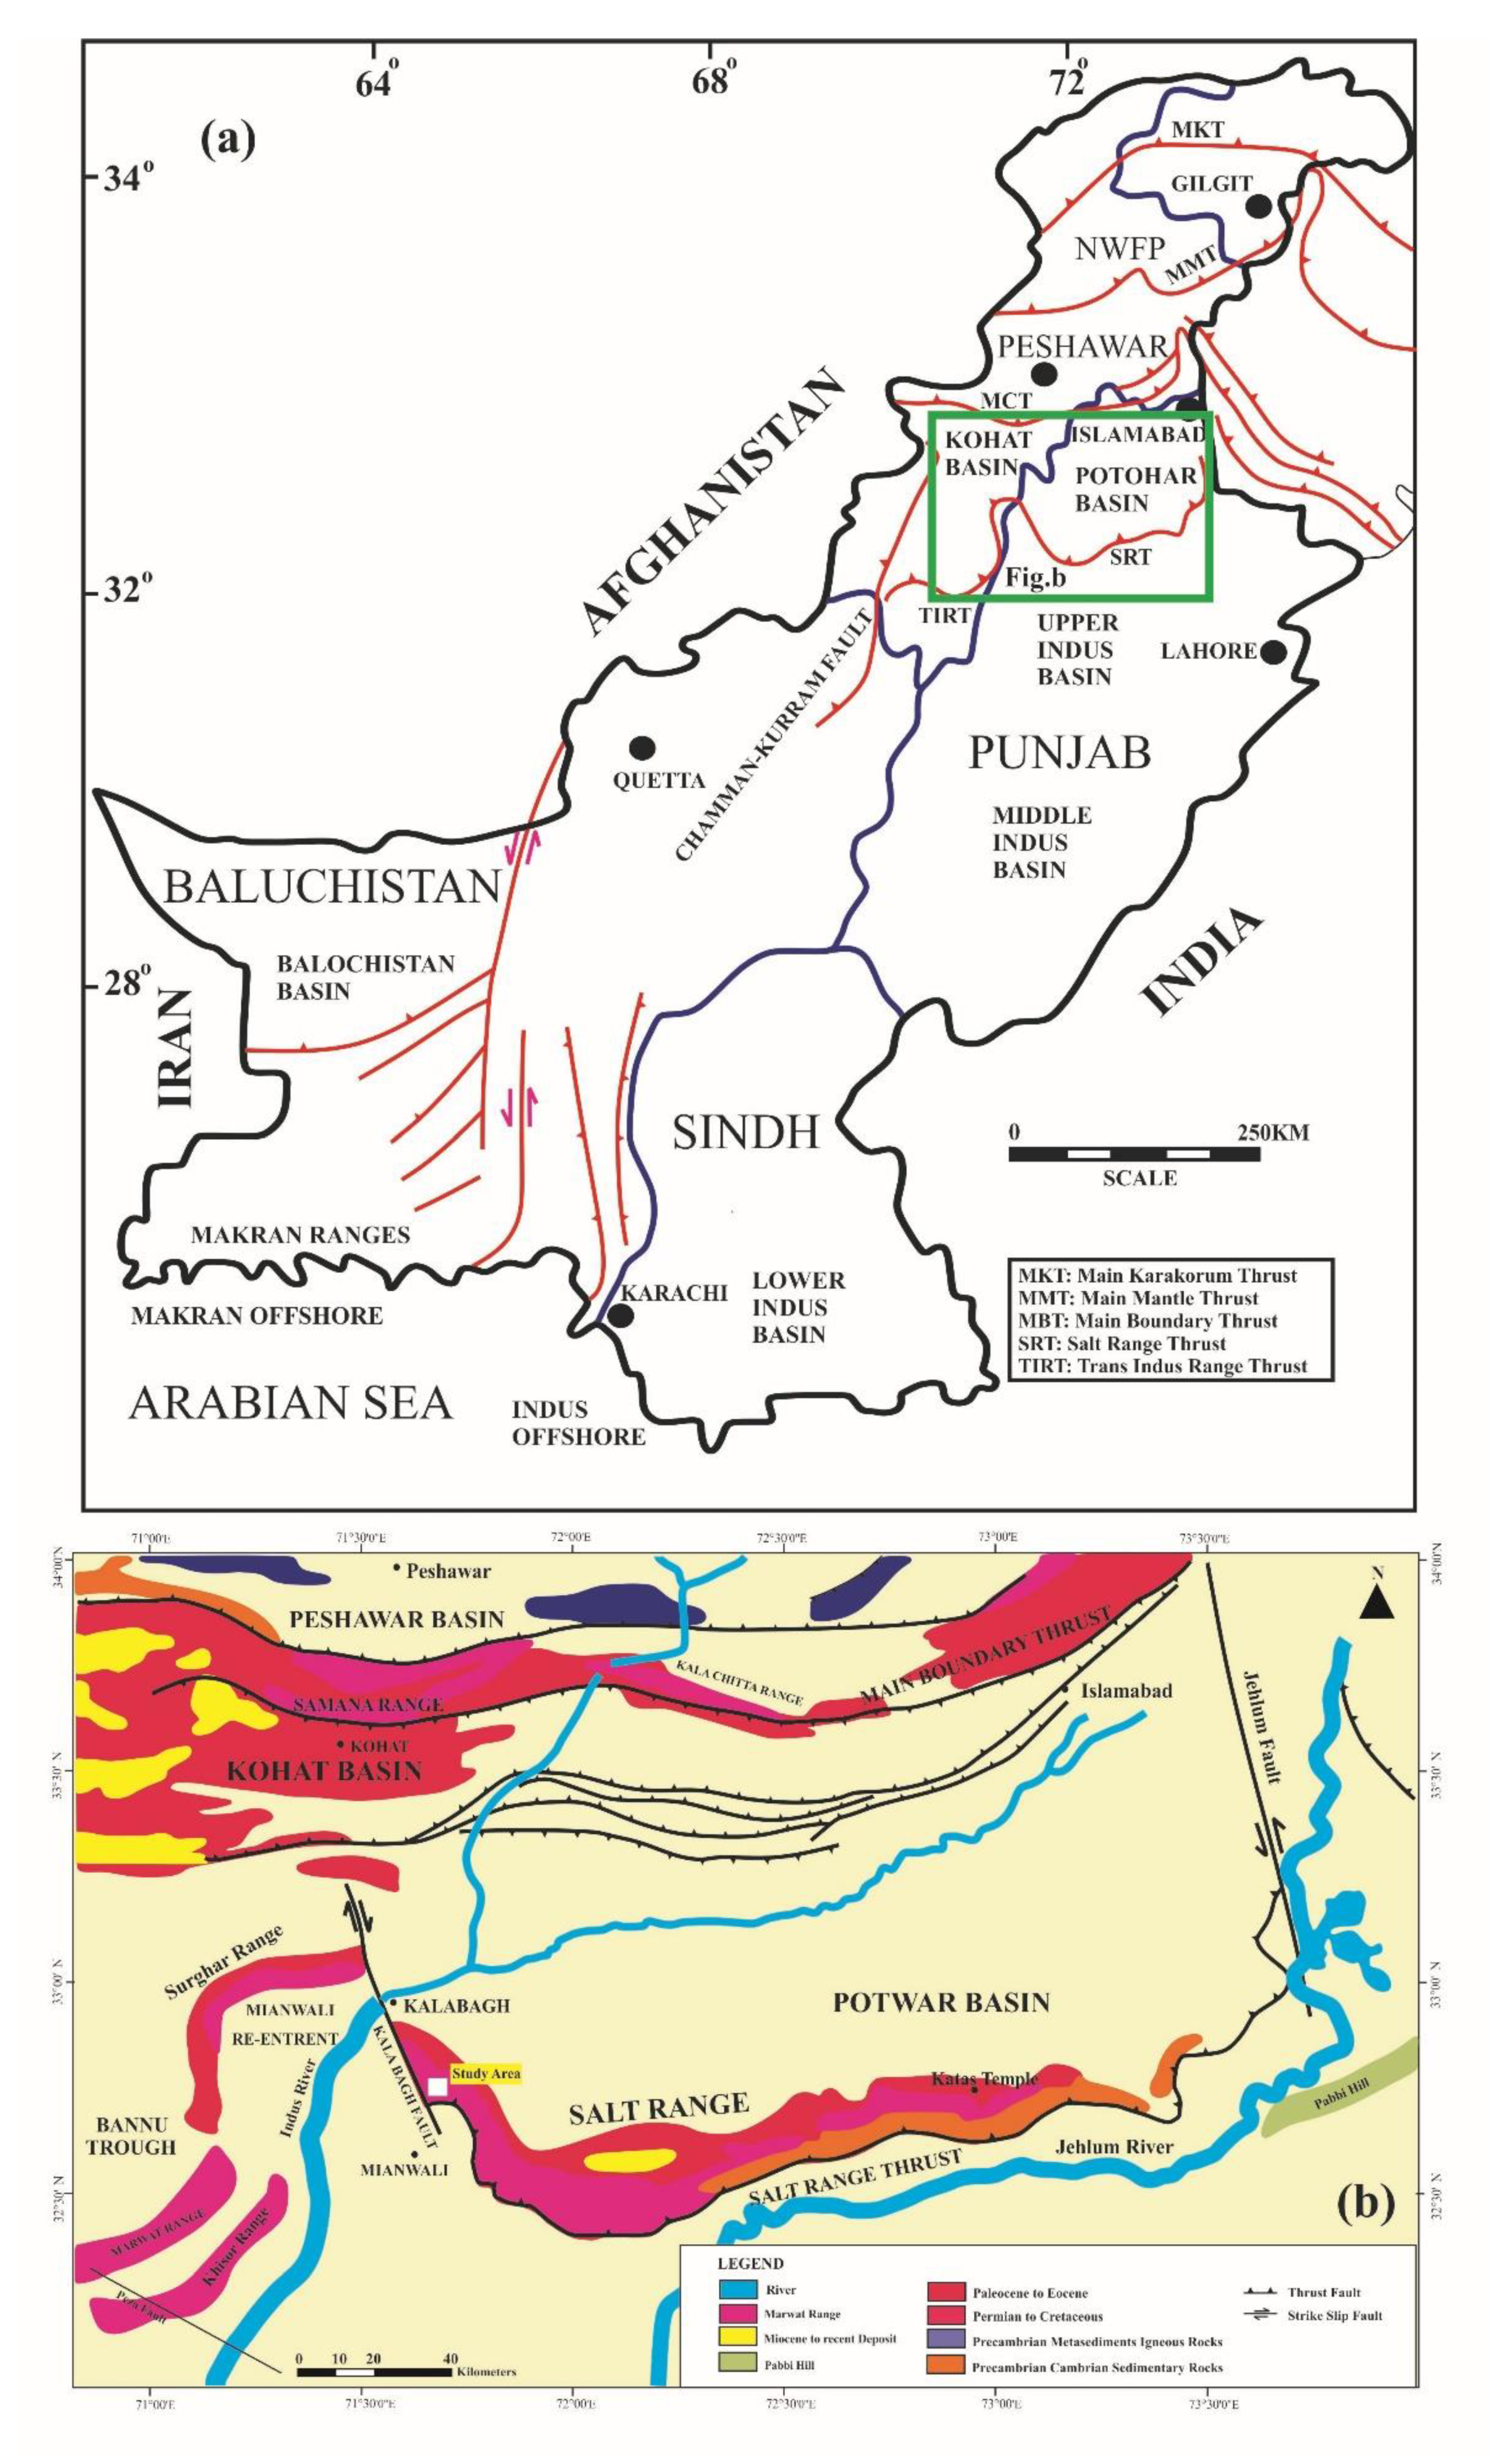
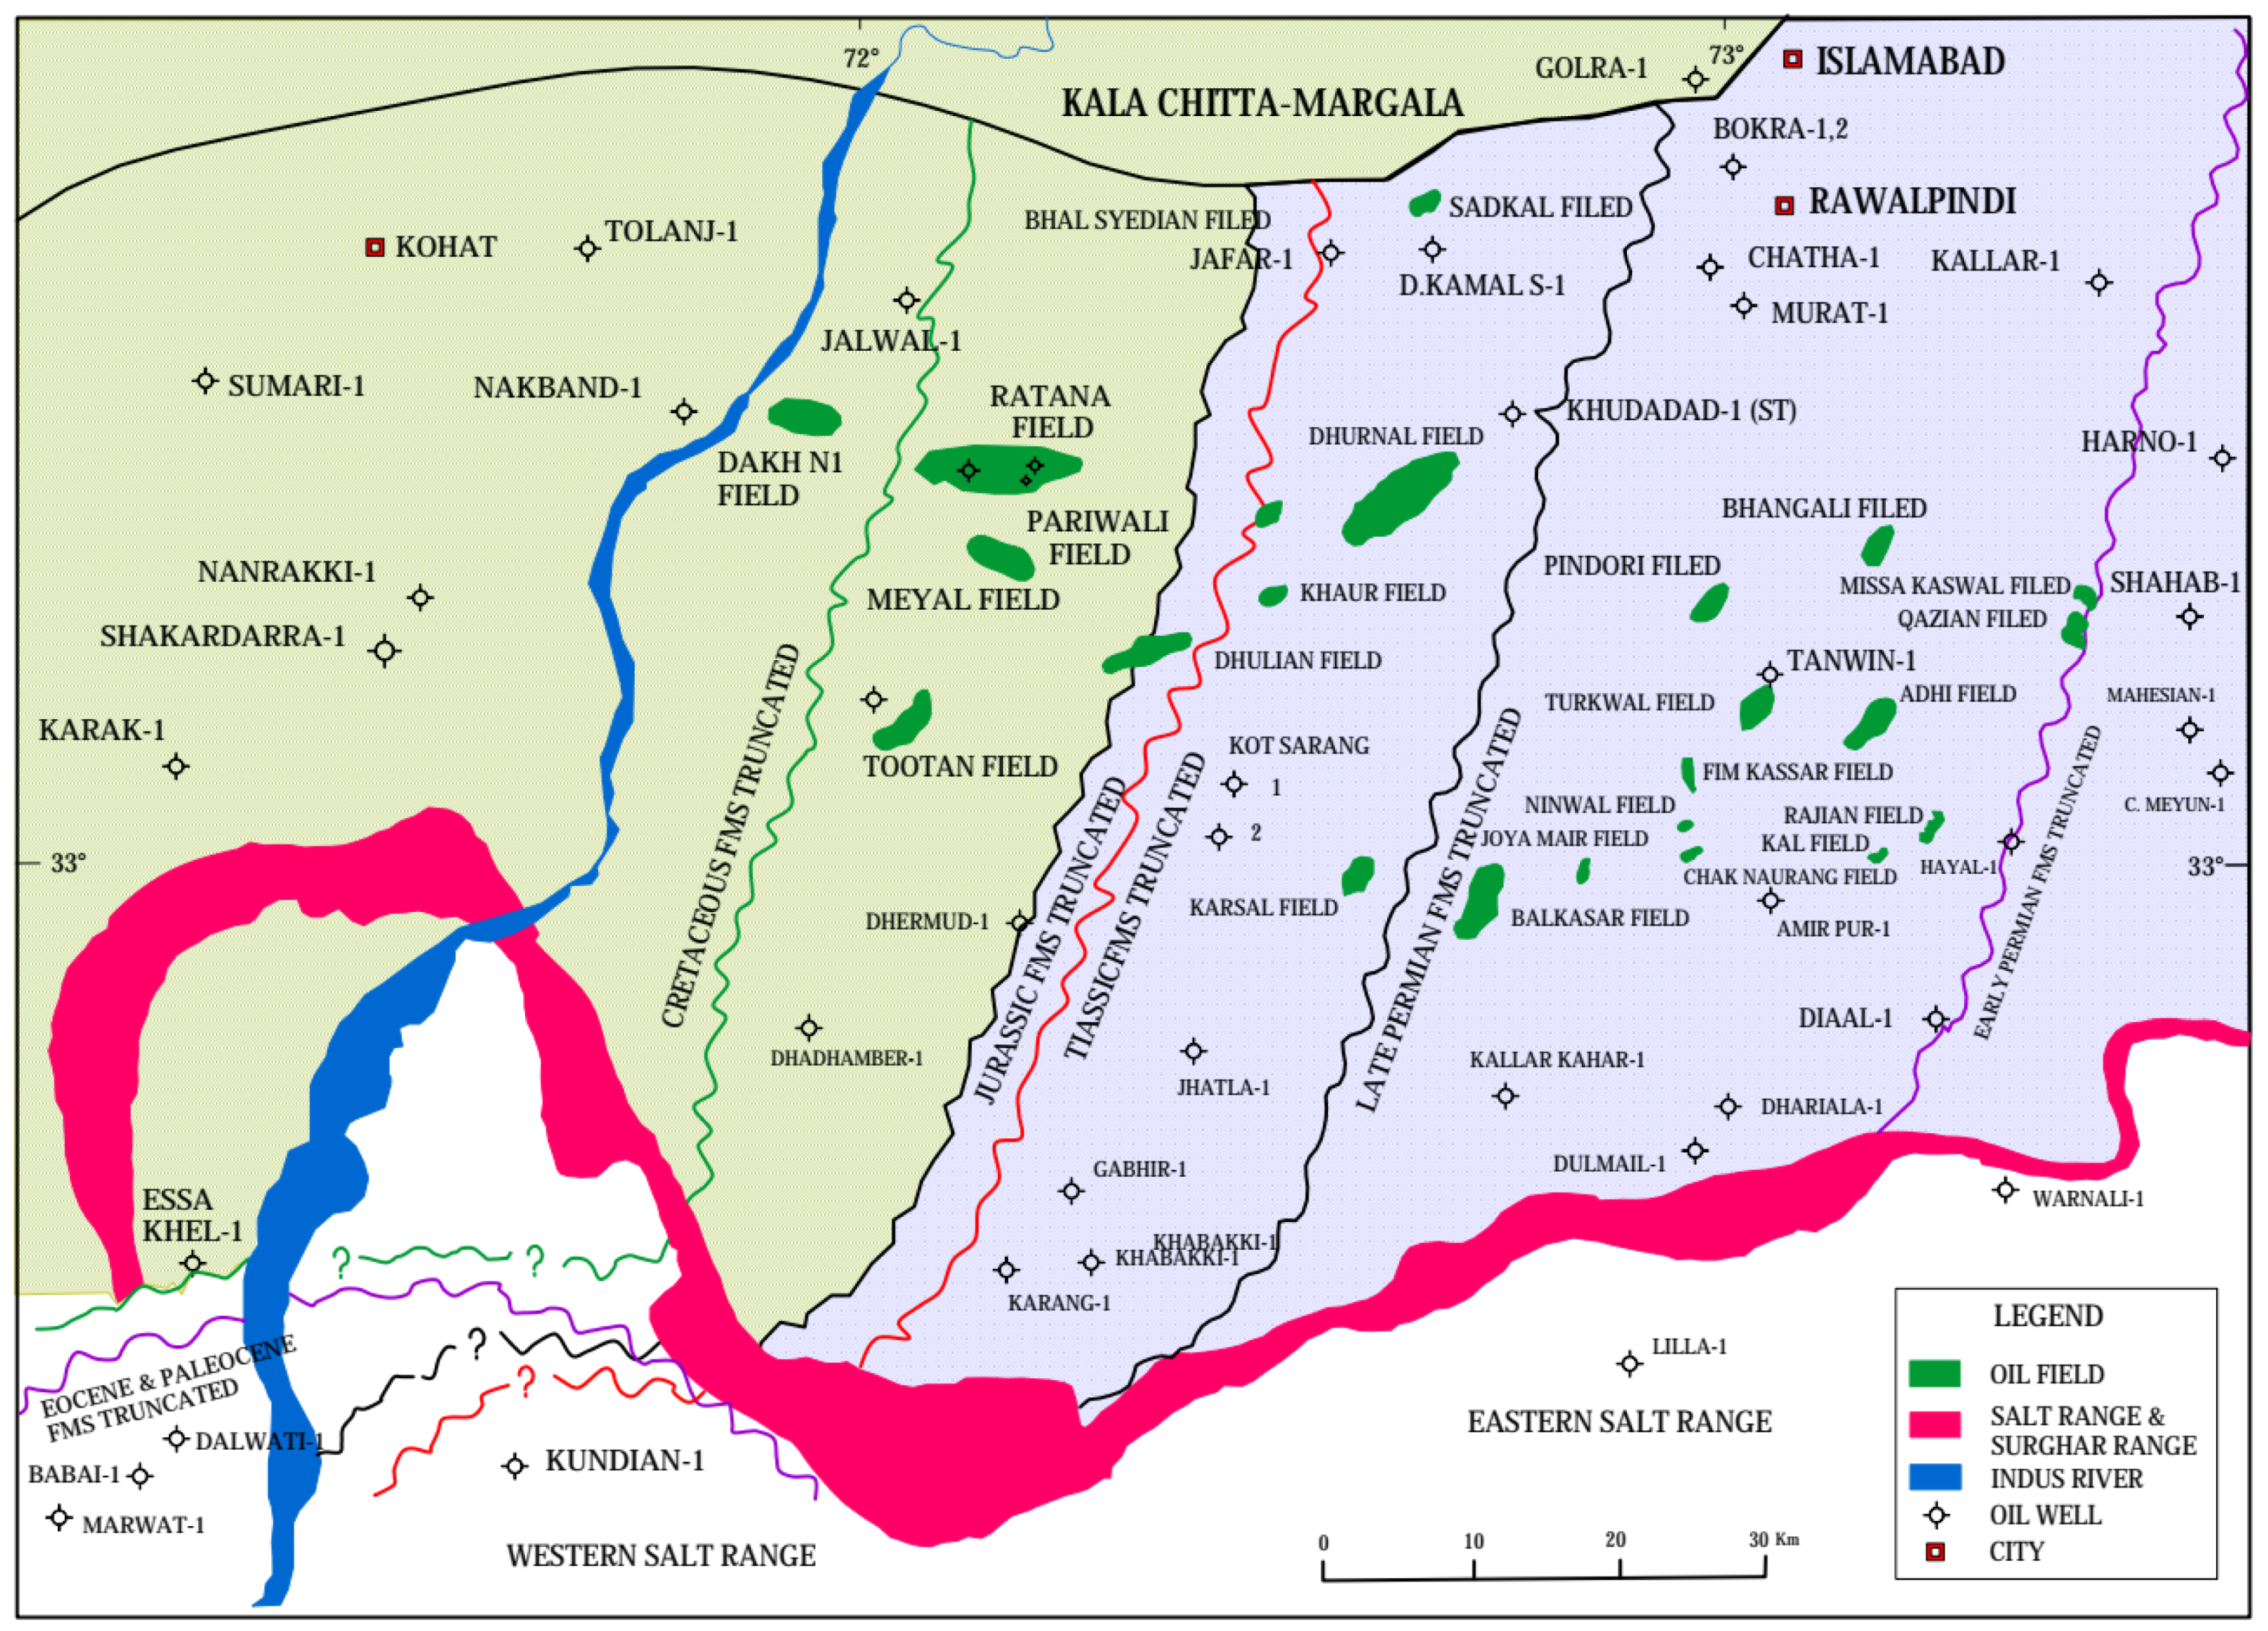
2. Geological Setting

Pakistan is located on the Eurasian, Indian and Arabian Plates (Figure 1). A tertiary period convergence of the Eurasian and Indian plates is represented by this structure. Punjab is Pakistan’s most populous province, followed by Sindh and Khyber Pakhtunkhwa (KPK) in terms of population [17]. Punjab’s terrain is divided between the Plateau (Potwar), a mountain range straddling the Jhelum and Indus rivers, and the Punjab Plains, a lowland area. The hill system is also known as the Salt Range [18]. The stratigraphy of the Salt Range area has been identified in the Kohat-Potwar Plateau, as well as in the wells drilled in Punjab Plains. To create the Potwar sub-basin, geological force, such as the thrust belt, which runs north-south for around 150 km, is responsible for the development of the basin. Tectonically, the Potwar sub-basin is bounded by the Jhelum fault in the east and the Kalabagh fault in west [19,20]. The Potwar sub-basin is separated from the Main Boundary Thrust (MBT) on the north and the MBT on the south by the Salt Range thrust. (Figure 1). The Indian and Eurasian plates collision caused a 55-km shortening of the horizontal crust between Soan Syncline and NPDZ, and a 20-km shortening along the Salt Range [21,22,23,24]. From Precambrian to more recent geological strata, the Upper Indus Basin geology and sedimentary environment are diverse [25,26,27]. Eastward from the Salt Range, the thickness of pre-Cambrian and Cambrian rock formations rises, whereas westward from the Salt Range, it decreases [9,28,29]. A salt, marl, and gypsum-rich lithology first appeared in the Precambrian Salt Range Formation. East of the Salt Range is where it is at its peak. The Cambrian rocks include the Khewra Sandstone, the Kussak Formation, the Jutana Formation, and the Baghanwala Formation [30,31]. The eastern Salt Range has a well-developed Cambrian stratigraphic sequence. Large plate tectonic changes marked the Late Paleozoic–Early Mesozoic era. The Paleo-Tethys Ocean closed along the southern boundary of Eurasia in the Late Triassic, completing the Variscan assemblage into a single supercontinent, Pangea, in the Middle Cambrian period. During Gondwana’s last stages, the Cimmerian Orogen, a prominent mountain range, was formed when the eastern boundary of Gondwana was broken by a strip of Gondwanan terranes called the Cimmerian terranes, which encompasses Iran, Afghanistan, the Karakoram, and Qiangtang [32]. According to the Late Permian–Early Triassic paleogeographic reconstruction, the Salt Range was located around 30–40° S along the Tethyan border and indicates an overall warm-temperate paleoclimate [33,34]. Limestones, dolostones, sandstones, and shales make up the Salt Range’s Triassic strata. To study sediments below and across the Permian–Triassic Boundary (PTB), the Salt Range’s exposures have made it possible.
The Permian deposit began several hundred years after the Cambrian deposit had finished. The Permian succession is divided into two stratigraphic successions, the Nammal Gorge and the Chhidru Nalah near Chhidru town, each of which has a different depositional environment (Figure 1) [35,36,37]. The Nilawahan Group is mainly a Gondwanan terrestrial succession, whereas the Zaluch Group is a shallow marine Tethyan succession [14,31,38,39]. The Tobra Formation’s base has a disconformity, which scientists discovered. Several rock types lie above the Tobra Formation, including the Dandot Formation, Warchha Sandstone, and the Nilawahan Group’s Sardhai Formation [40,41].
A well-exposed region of shallow to intertidal marine deposits may be found in the Zaluch Group of the Salt Range, which includes the Amb, Wargal, and Chhidru formations [7,16,42,43,44,45,46]. A discontinuity exists between the Amb and Sardhai formations at their base, while the upper Chhidru-overlying Triassic Mianwali Formation’s contact has yet to be determined [7,9,36,47,48]. Permian rock formations may be found in the western Salt Range [49] (Figure 2).
The rocks of the Mesozoic period can be characterized due to paraconformity. At the end of the Permian period, Hermann et al. [50] referred to the body as a para-unconformity showing subaerial exposure. The Permian rocks found in the Salt Range are rich in fauna and are related to Triassic rocks. There is a substantial faunal break at the boundary between the Permian and Triassic periods. Each of the Mesozoic formations may be found in the Upper Indus Basin and are part of the Triassic era [35]. The Mesozoic rock series may be found in abundance in the western Salt Range [51,52]. Samanasuk Limestone and the Shinawri Formation are part of the Jurassic period’s Datta and Shinawri formations. The Cretaceous period is represented by the Chichali and Lumshiwal formations in Rajasthan (Figure 2). Unconformities in rock units may be seen across Africa in the Hangu Formation, which includes laterite and bauxite. The Cenozoic geologic sequence includes the Hangu Formation, Lockhart Formation, Patala Formation, Nammal Formation, Sakesar Limestone, and Chorgali Formation, respectively.
Surface and subsurface maps of the Potwar region and the area to the west of it are shown in Figure 2. The bright blue color of the Potwar region’s subsoil indicates the lack of Jurassic and Cretaceous layers. The bright green color indicates the existence of Jurassic and Cretaceous formations under the surface of the western Potwar-Kohat region and the southern Hazara highlands. According to Alhubail and Ghahfarokhi [53] Pakistan’s Upper Indus Basin Upper Jurassic to Early Cretaceous rocks are rich in geological and economic resources.
Typical Jurassic and Early Cretaceous formations, such as the Datta, Samana Suk, Chichali, and Lumshiwal formations, may be found as far east as the Abbottabad area’s Thandiani Formation [54,55]. In the southern Hazara highlands, as well as across the Indus River, these rock units may be found in abundance. Since no Jurassic or Cretaceous ages were found in the Potwar region, a particular condition existed across the Main Boundary Thrust in the neighboring Potwar area (Figure 2).

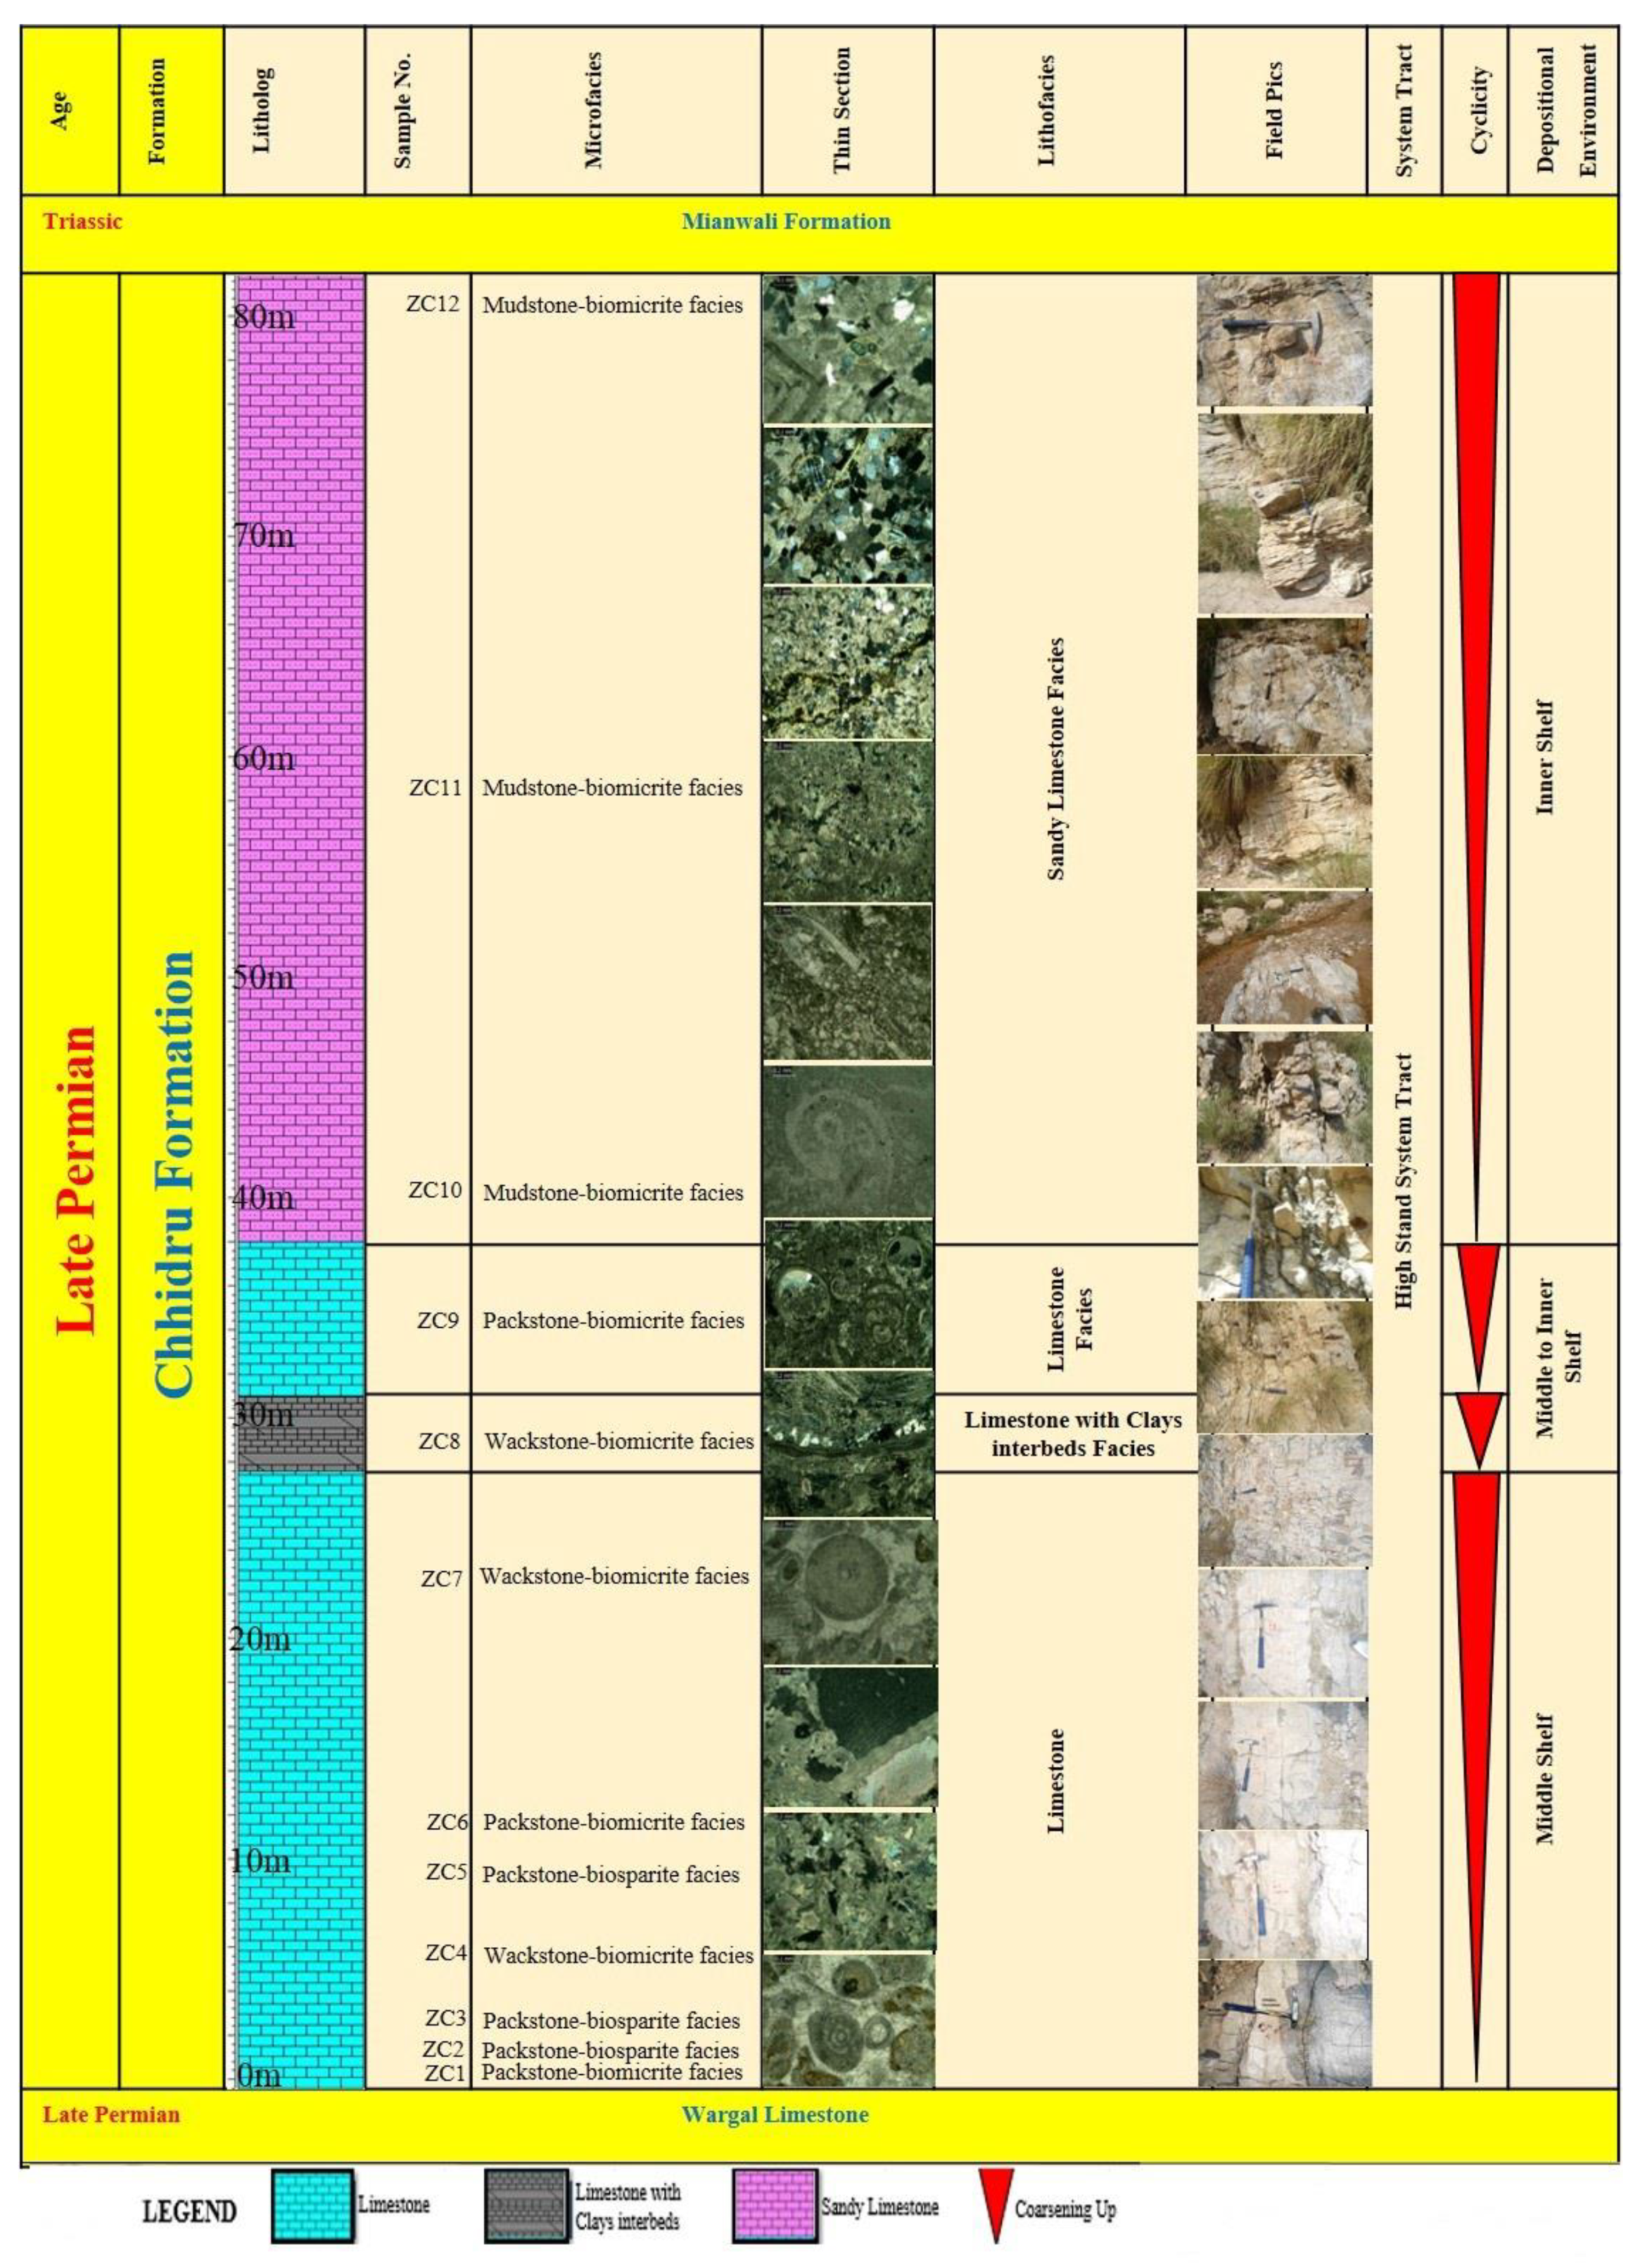
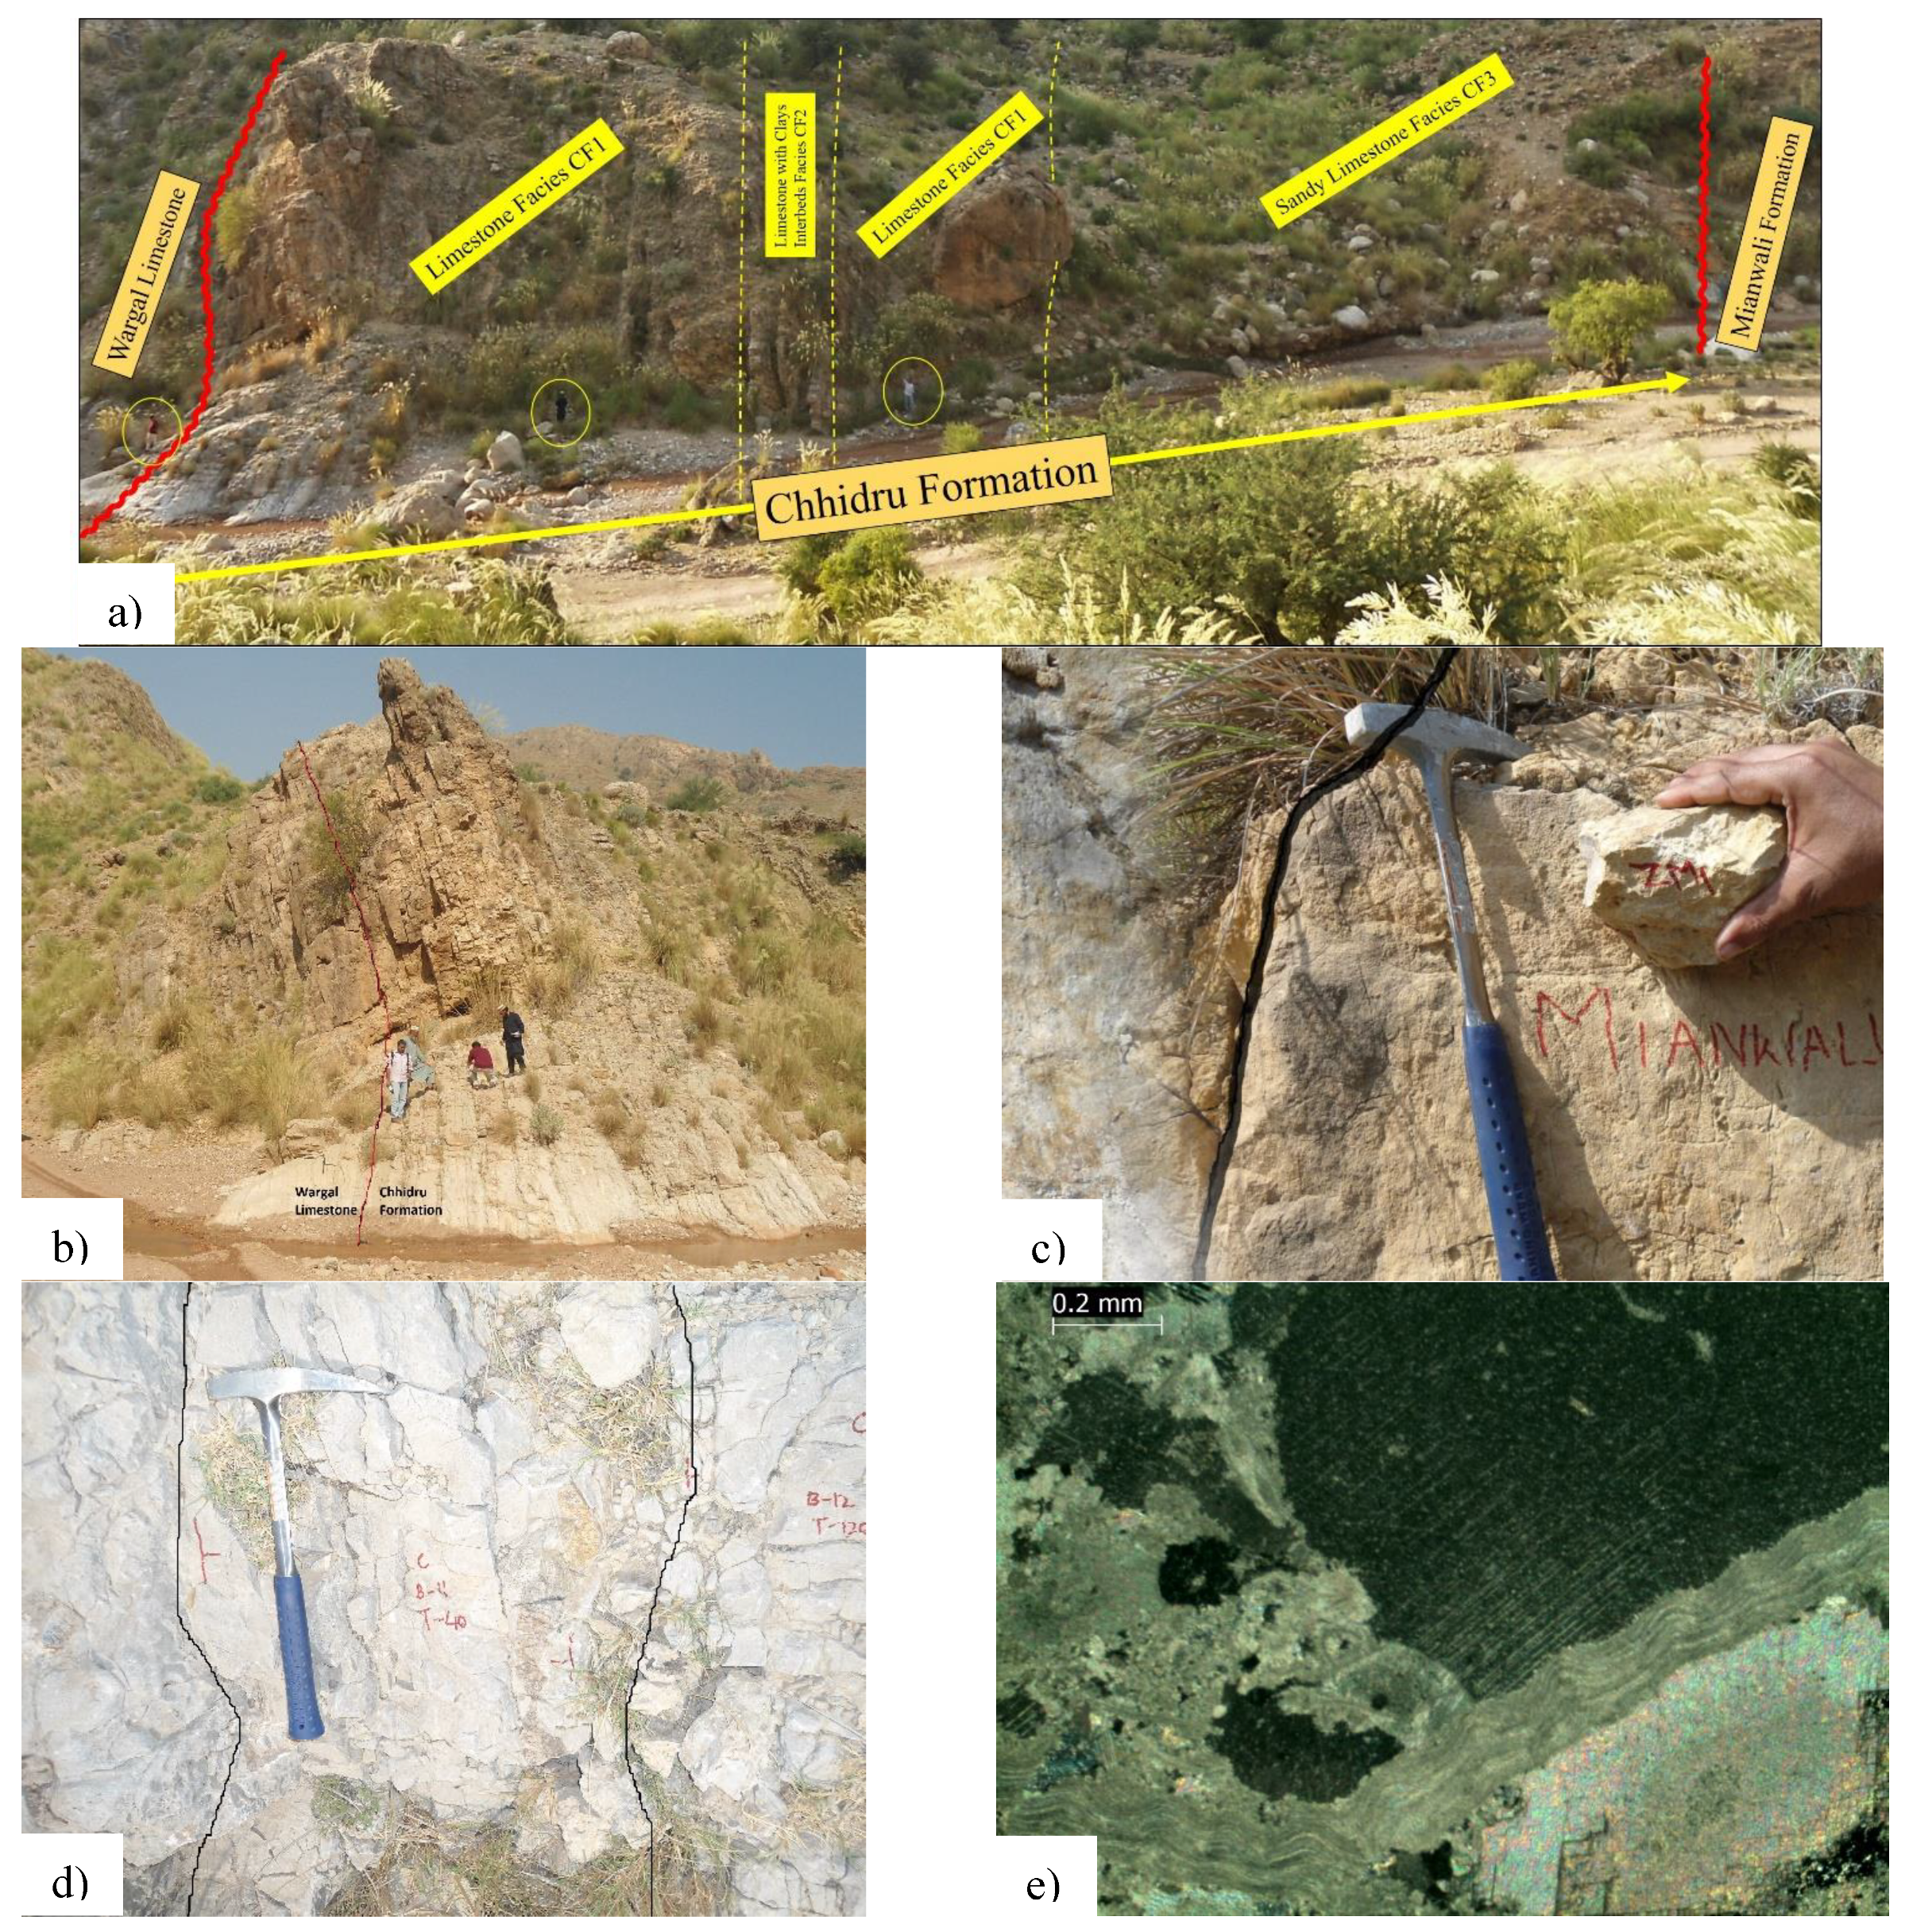
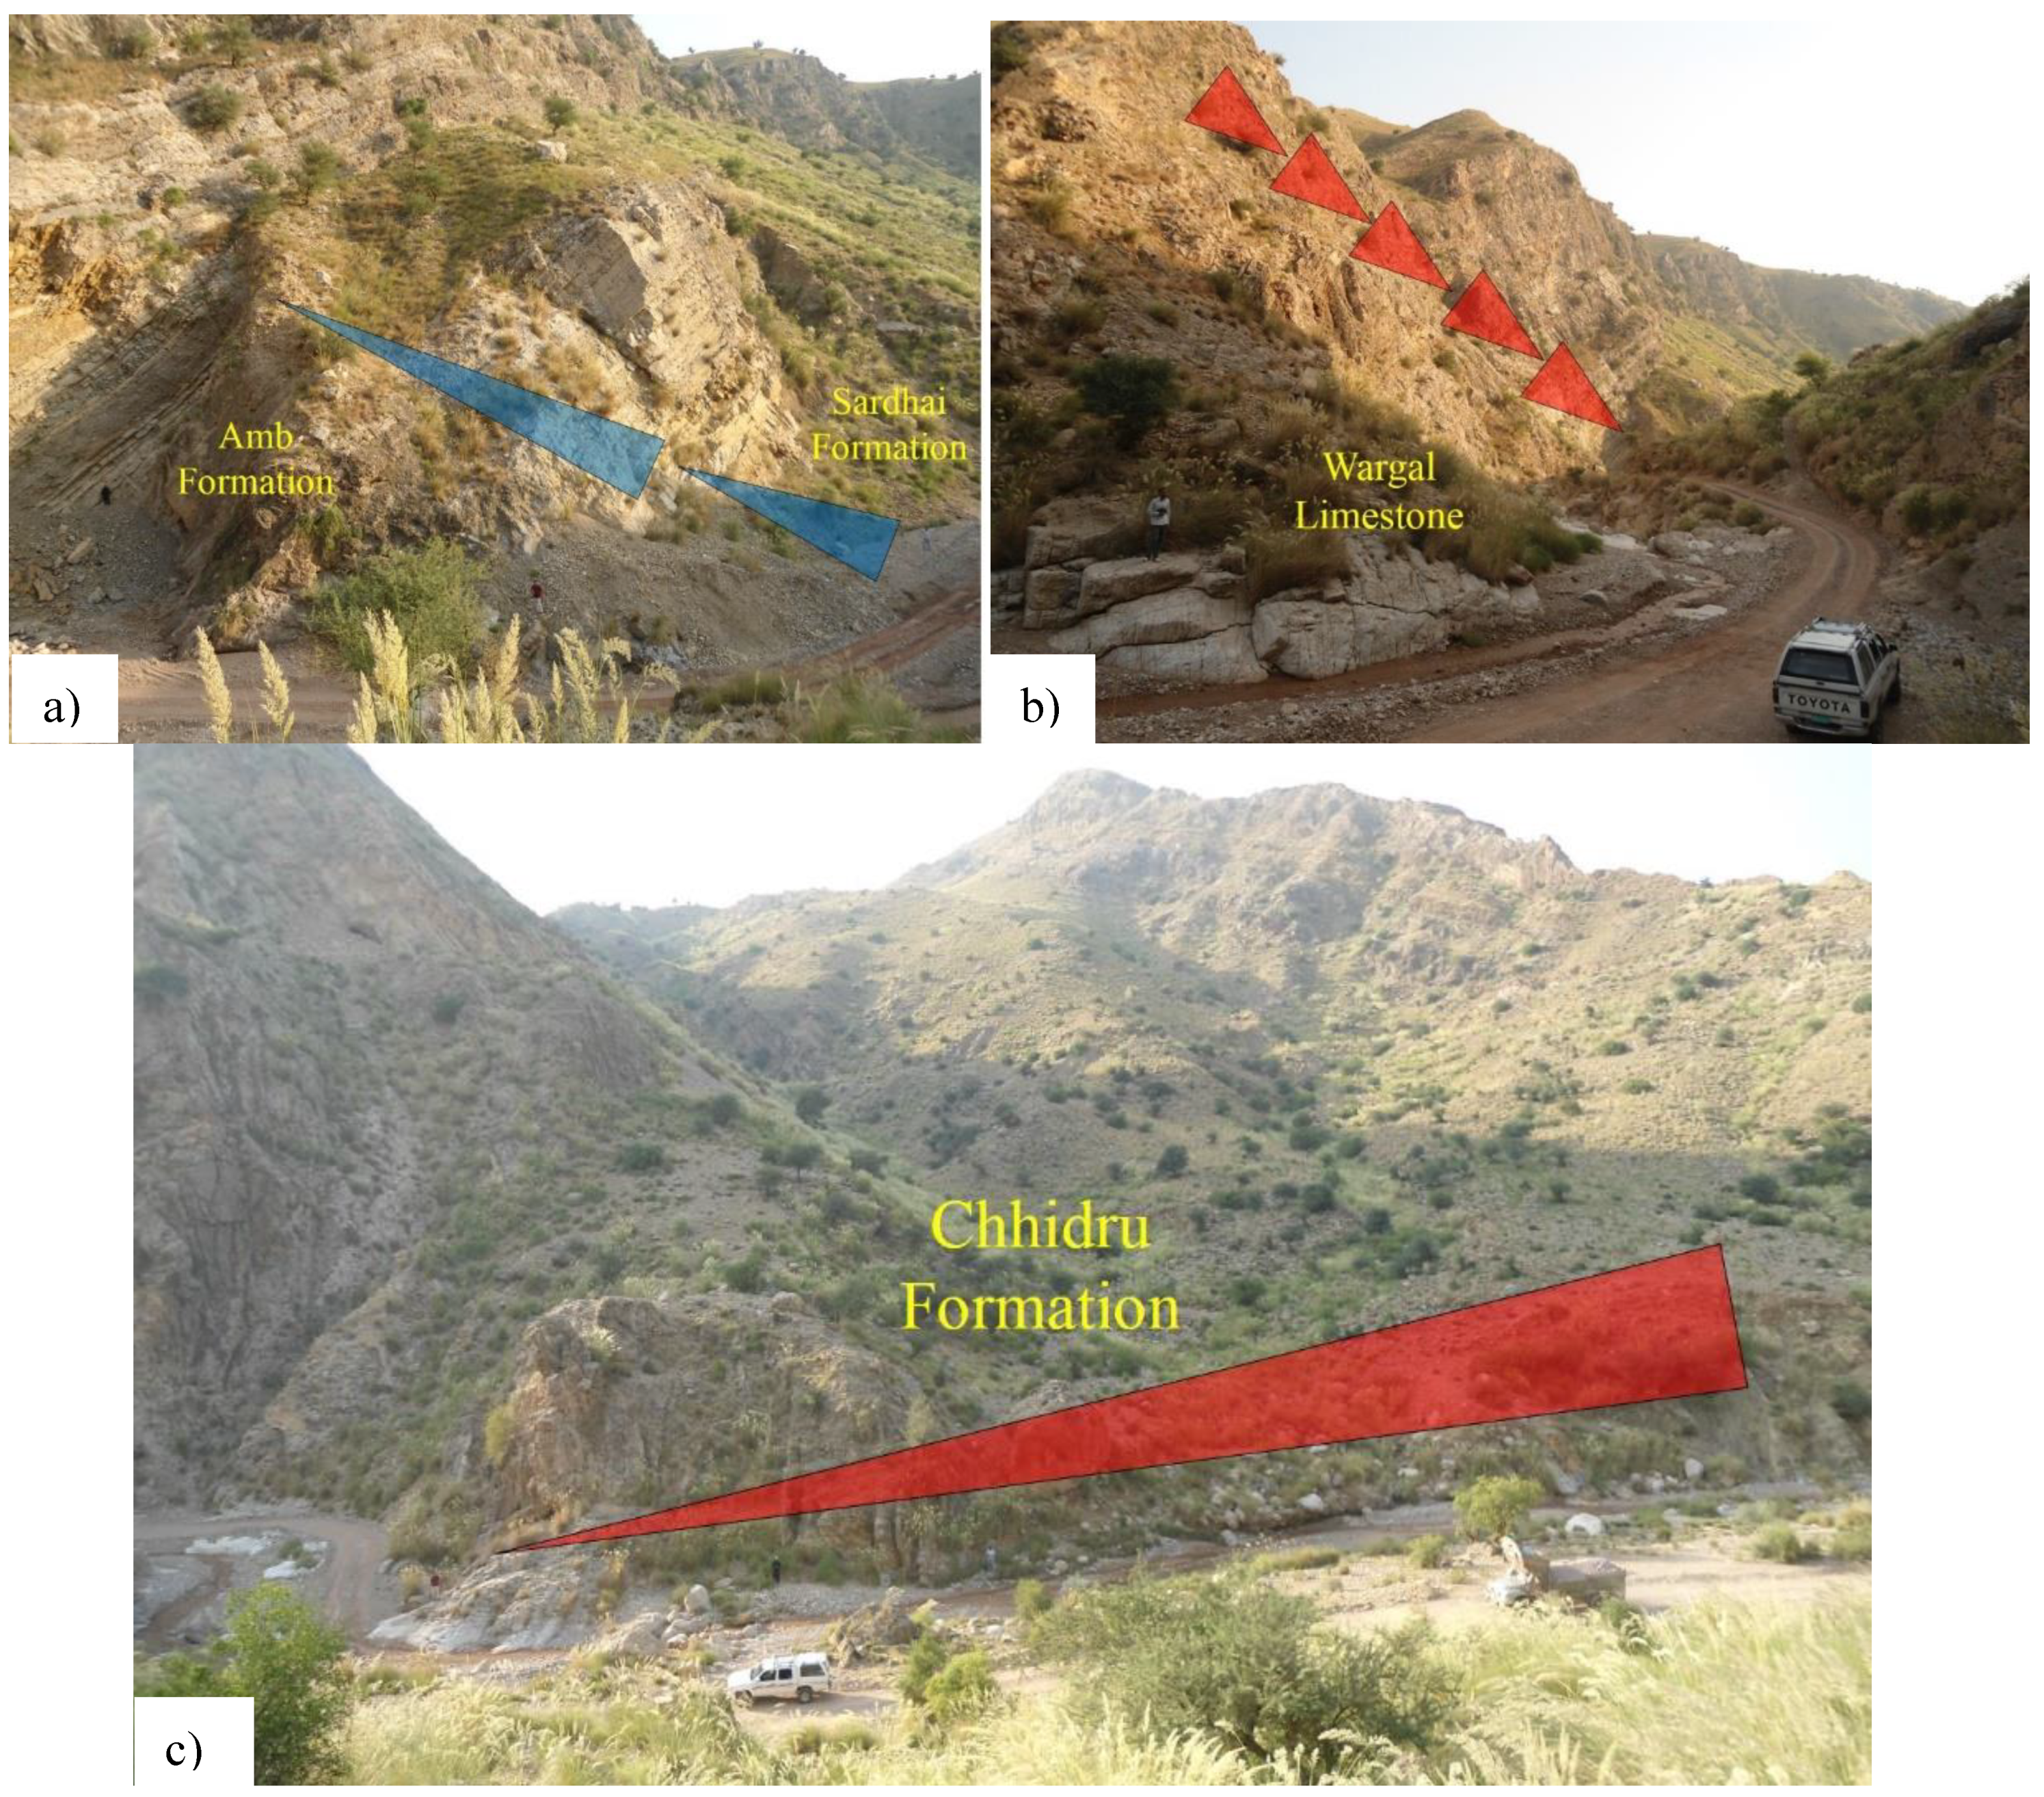
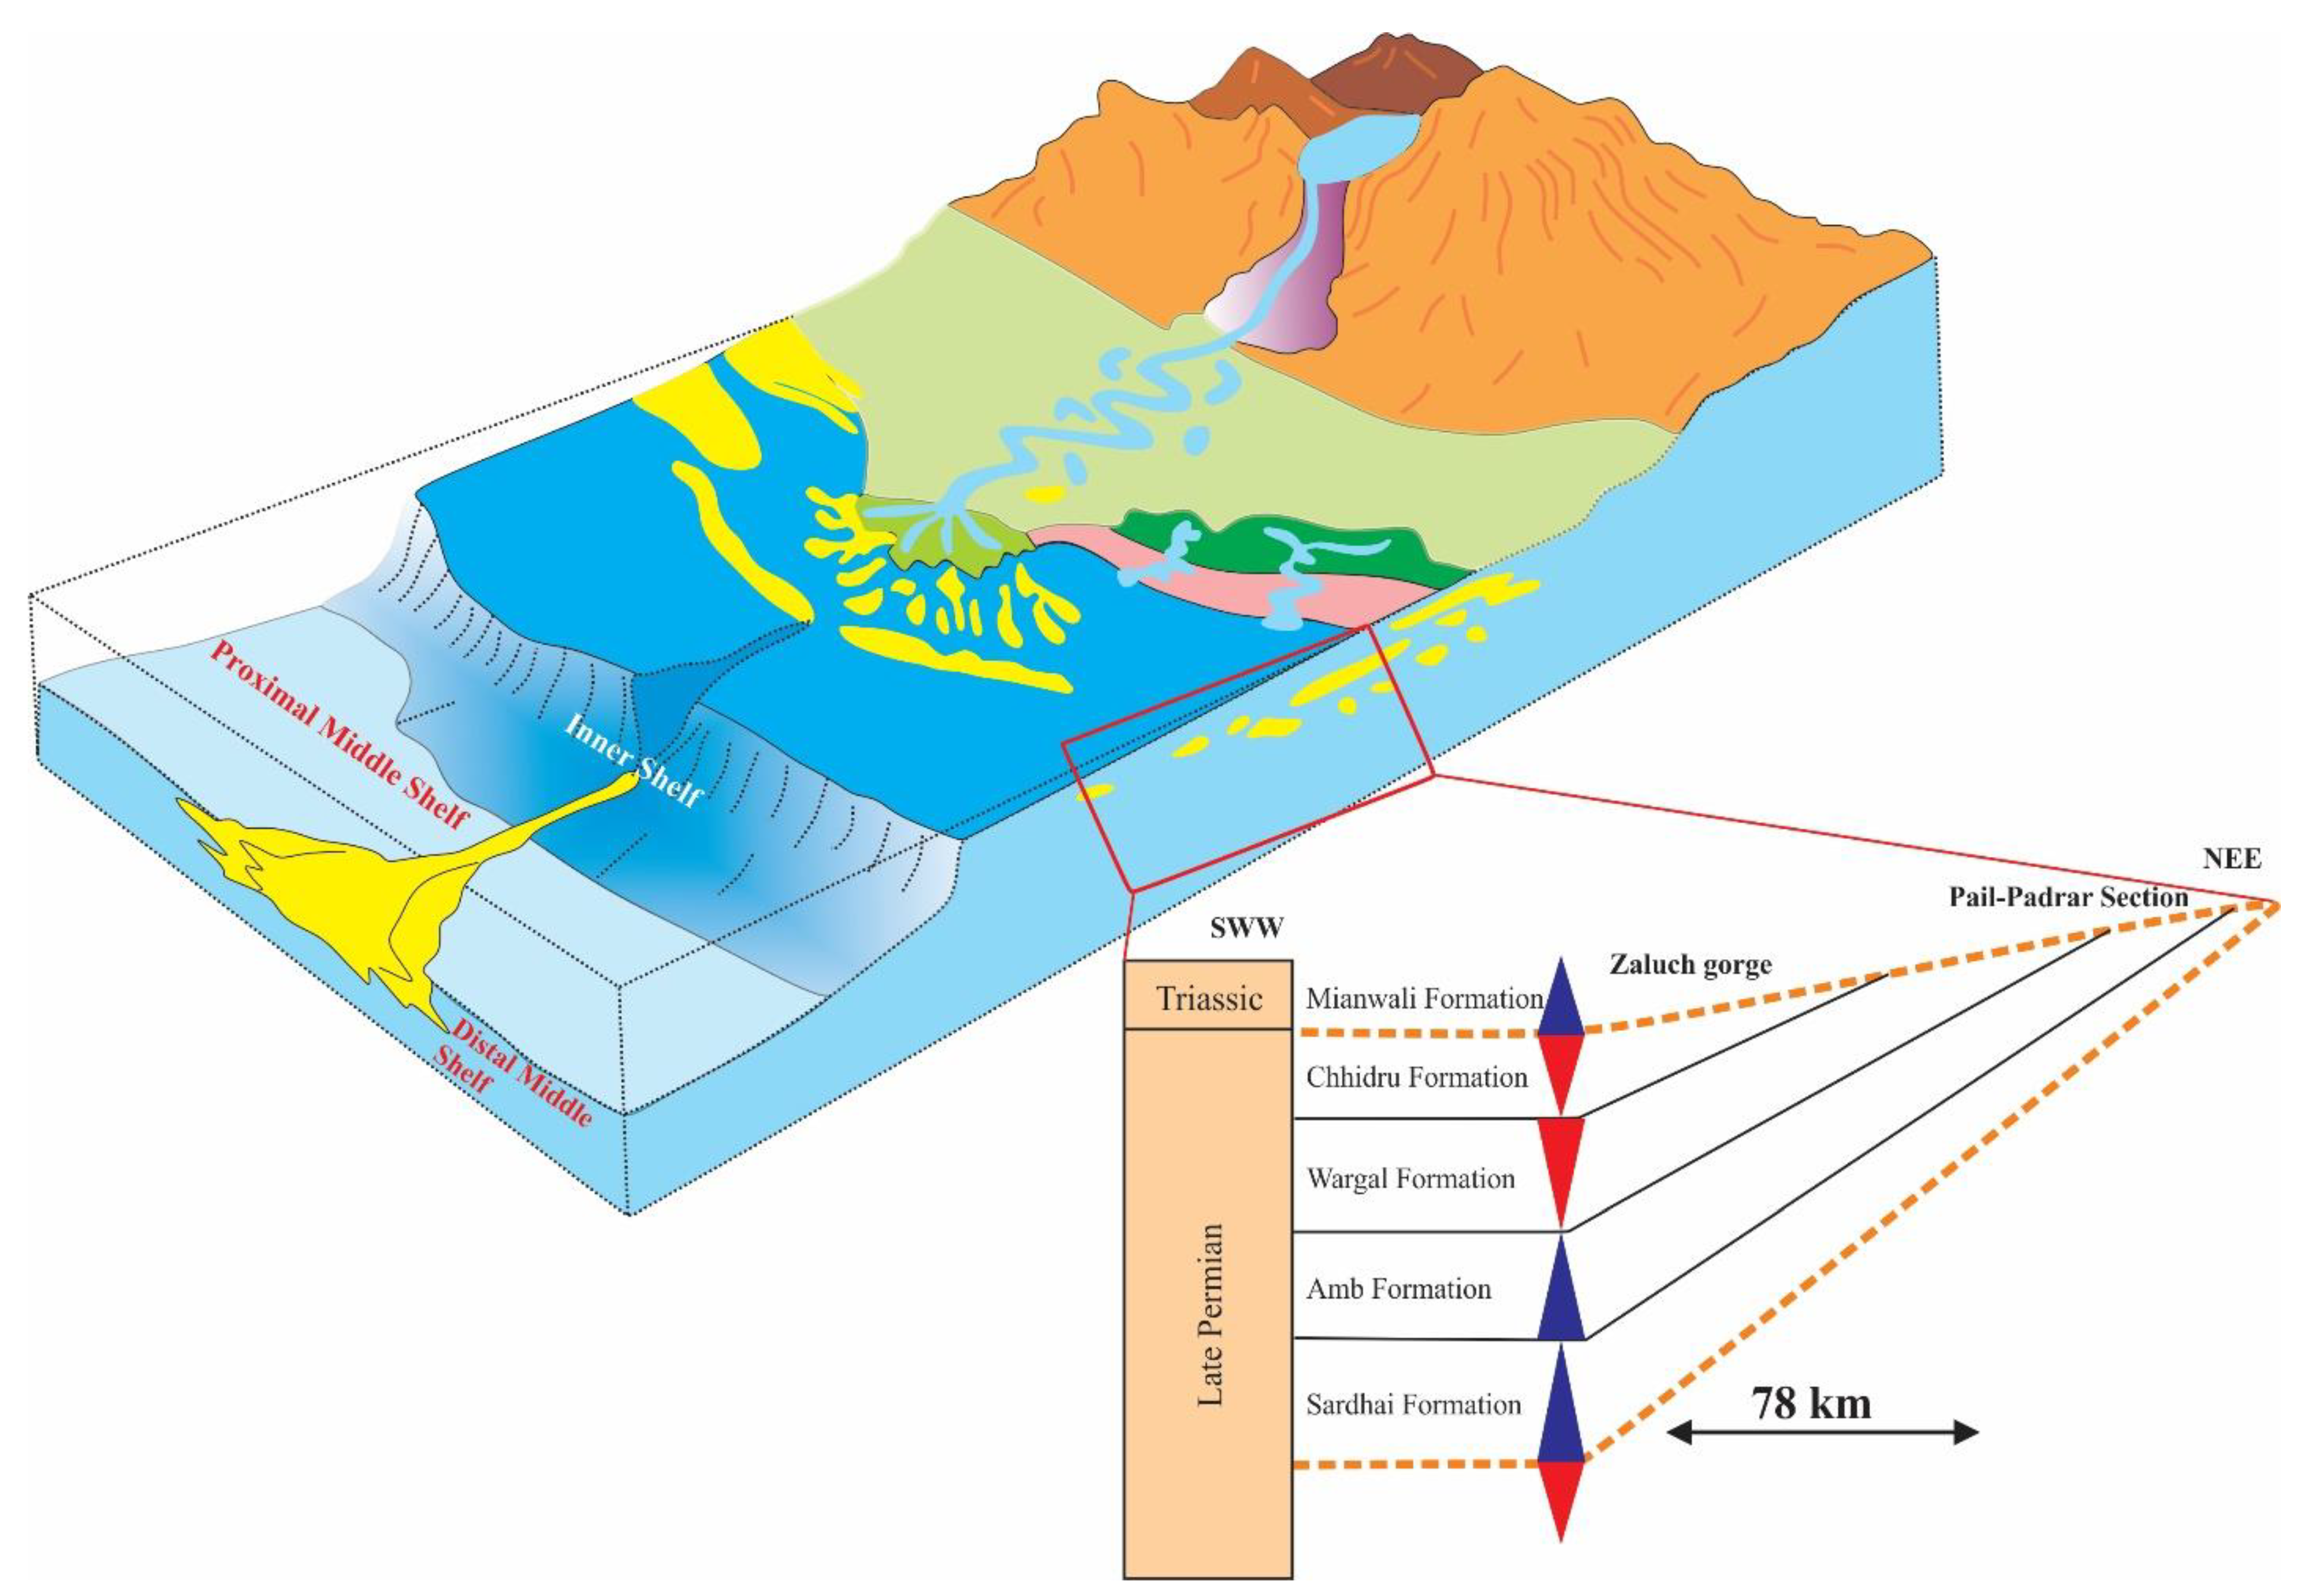
2.1. Stratigraphy of Zaluch Gorge-Chhidru Formation

The study area is located in the Zaluch Gorge, in the westernmost section of the Salt Range. Sedimentary rocks from the Precambrian Salt Range Formation to the Jurassic Datta Formation make up the Zaluch Area (Table 1). The Nilawahan Group’s Tobra Formation represents the beginning of the Permian period. Above the Tobra Formation is the Warchha Sandstone. Zaluch Gorge is devoid of the Dandot Formation [4,11]. The Warchha Sandstone gradually gives way to the Sardhai Formation, as it rises to the north [56]. Ascending toward the top from the Nilawahan Group is the Zaluch Group, which contains the Amb Formation, Wargal Limestone, and the Chhidru Formation. Fossil-rich Permian strata in the Salt Range are connected to rocks from the Triassic period; marine layers along the Permo-Triassic boundary are consistent, the fauna did not change much after contact with the marine layers along the Permo-Triassic boundary [43,57]. The Mianwali Formation is the first in the Triassic series, followed by the Tredian and Kingriali formations. The Kingriali Formation, which is younger than the Jurassic Datta Formation, rests erratically just above it.

Chhidru Formation

Originally, the Chhidru Formation was referred to as the Chhidru beds after early investigations by Waagen [58]. According to Dunbar [59], in the early nineteenth century, Chhidru Formation was characterized as a mix of siliciclastic and carbonate phases. There has been much debate about the age of the Chhidru Formation, and its relationship to Triassic rocks, since Teichert [60] first discovered it. Mei and Henderson [61] suggested the Wuchiapingian/Changhsingian boundary as the dividing line between the Wargal and Chhidru formations. Since the Chhidru Formation was deposited in a shallow subtidal to the intertidal environment, its thickness varies across the Salt Range, according to Mertmann [16]. The stratigraphic thickness, as determined by earlier researchers, varies widely. According to Mertmann [16], Jan and Stephenson [62], Sajjad Ahmed et al. [63] and Hussain et al. [64], Zaluch Nala, Zaluch Gorge and Chhidru Nala all recorded 58.4 m, 63.63 m, and 81.81 m of the Chhidru Formation, respectively. According to Zahid et al. [25], Hermann et al. [50] and Saboor et al. [65], the Chhidru Formation is a siliciclastic mixed carbonate series that is readily accessible in the research region under consideration.
Shallow sandstone and sandy limestone comprise most of the Chhidru Formation. The base of the Chhidru Formation is exposed, displaying shale units. Above the shale unit, a calcareous sandstone unit is evident. An oscillation ripple mark may be seen on the topmost layer of this formation, which might be a white sandstone bed [66,67]. This limestone-clay-sand interbeds formation may be found in Zaluch Gorge (Figure 3). The Chhidru Formation’s lower contact with Wargal Limestone is conformable, while the upper contact is not visible, because of a paraconformity at the Permian-Triassic (P-T) boundary with upper contact of the Mianwali Formation (Figure 3). The Late Permian period is responsible for the development of Chhidru. [3,11,31].
There is a rich fossil fauna in Pakistan’s Salt Range and Surghar Range, which date back to the Permian-Triassic period, when carbonate-siliciclastic successions were combined with sandstones and clays. These sedimentary archives allow researchers to combine palynology with ammonoids, conodont, and chemostratigraphic age controls to better understand the origins of life on Earth [68,69]. Cyclosorus, a Permian ammonoid, was discovered in the Salt Range by Furnish and Glenister [70]. Wignall and Hallam [6] investigated the Salt Range and Trans Indus Range’s topmost Permian and lower Triassic conodonts. The acritarchs and tasmanitids of the Chhidru Formation were explained by Ahmad et al. [67]. According to Qureshi et al. [57], the Salt Range and the Surghar Range are rich in palynology, which he investigated. Between 1981 and 1985, Pakistani and Japanese scientists studied the Permo-Triassic succession in the Salt Range. As opposed to the Chhidru Formation in Khan and Afzal’s [71] research, the Zaluch Nalah and Nammal portions had a higher density of brachiopods. The Zaluch Gorge section of Pakistan’s P-T boundary has received the most attention. Mertmann [16] studied the development of the Permian marine carbonate platform’s salt range after discovering several system tracts in the Chhidru Formation.

3. Material and Methods

Fieldwork was carried out in the Salt Range area’s Zaluch Gorge Chhidru Formation, which has a mix of siliciclastic and carbonates throughout its geological history. The existing outcrop was recorded, measured, and sampled using standard procedures [72]. An 82.15-m-thick sequence was researched and documented in the western Salt Range’s Zaluch Gorge on a standard log sheet. Detailed analyses were performed to identify distinct lithofacies intervals based on sedimentological properties such as lithology, depositional texture as defined by Dunham [73], and carbonate components.
The section was then classified into three facies (Figure 3). The lithofacies in the region were identified and described using an outcrop study, important stratigraphic features, and microscopic hemicycles observed in the field. Thirty-four rock samples, each 2.8 cm long and 3.2 cm in diameter, were gathered from the same intervals investigated. These samples were selected to illustrate carbonate microfacies, and their textures ranged from mudstone to packstone. At the AJ&K University Laboratory, 12 thin sections were produced for chosen materials and then analyzed using reflected and transmitted light microscopy. The thin sections were described using an Olympus BX 51 camera with a DP-27 connected. Half of the thin sections were treated with an acid solution containing red alizarin S and potassium ferricyanide stains on a section of the slide. The microfacies definition and textural character analysis of the carbonate rocks, which included both biogenic and inorganic dominant components, were performed using Dunham [73] and Embry and Klovan [74] carbonate classification schemes, which were modified to include the Standard Microfacies Types (SMF) in the facies zones (FZ) of the rimmed carbonate platform model. Depositional environments were reconstructed based on the derived sedimentological features and through comparison with additional standard facies reconstructions [75,76,77].
To evaluate the depositional environment, both macroscopically and through lithofacies analyses, several petrographic observations and parameters were recorded and measured. Finally, a dynamic depositional model was developed, based on the dynamics of the paleo-deposition environment, emphasizing the paleogeographic relevance of the studied deposits. Figure 3 depicts a synthesis of the acquired findings.

4. Results

4.1. Lithofacies of Chhidru Formation

The investigated part is located entirely inside District Mianwali’s Zaluch Gorge (Late Permian). Wargal Limestone has a conformable lower contact, whereas the Triassic Mianwali Formation, which lies above it, is paraconformable (Figure 4a–c). In the field, the following three lithofacies were found:
  • Limestone facie (CF1)
  • Limestone with clays interbeds facies (CF2)
  • Sandy limestone facie (CF3)

4.1.1. Limestone Facies CF1

This facie (CF1) comprises ceramist grey to light brownish, thin-grained limestone (Figure 4a,d). The thickness of this facie is approximately 35.49 m in the studied region. This facies comprises more than 90% of limestone. The main grain size is medium grained. These facies are enriched in fossiliferous strata. Eight rock samples (ZC1, ZC2, ZC3, ZC4, ZC5, ZC6, ZC7, and ZC9) were obtained for the petrographic investigation (Figure 3). The petrographic study shows substantial grainstone depositional texture with moderate to poor preservation of allochems.

4.1.2. Limestone Interbedded with Clays Facie CF2

According to quantitative analysis, this facies (CF2) is composed of 80% limestone and 20% mudstone and has a greyish to light brownish color (Figure 4a). It also contains fossiliferous limestone and finely interbedded lamina. The grain is between fine and medium in texture. The petrographic analysis of CF2 (sample ZC8) reveals a mudstone depositional texture with limited preservation of the allomicritic matrix (Figure 4e). The diagenetic fabric of the mudstone fabric shows iron leaching at particular points of petrographic investigation. Fractures filled with stylolite and calcite have also been observed.

4.1.3. Sandy Limestone Facies CF3

The sandy limestone facies (CF3) are distinguished by their light grey to creamy white color (Figure 3 and Figure 4a). In the studied region, the total thickness of this facie is about 44.36 m. The sandy limestone layers found are less fossiliferous than CF1 and CF2. The most often used grain size is medium grain. According to petrographic studies, this facie has a packstone depositional texture. Three rock samples (ZC10, ZC11, and ZC12) were collected for petrographic examination. The petrographic investigation also showed a random distribution of quartz, feldspar, and muscovite (Figure 5a). Calcite, stylolites, bioclasts (micritized), and recrystallized fossil pieces define the diagenetic fabric of this facies.

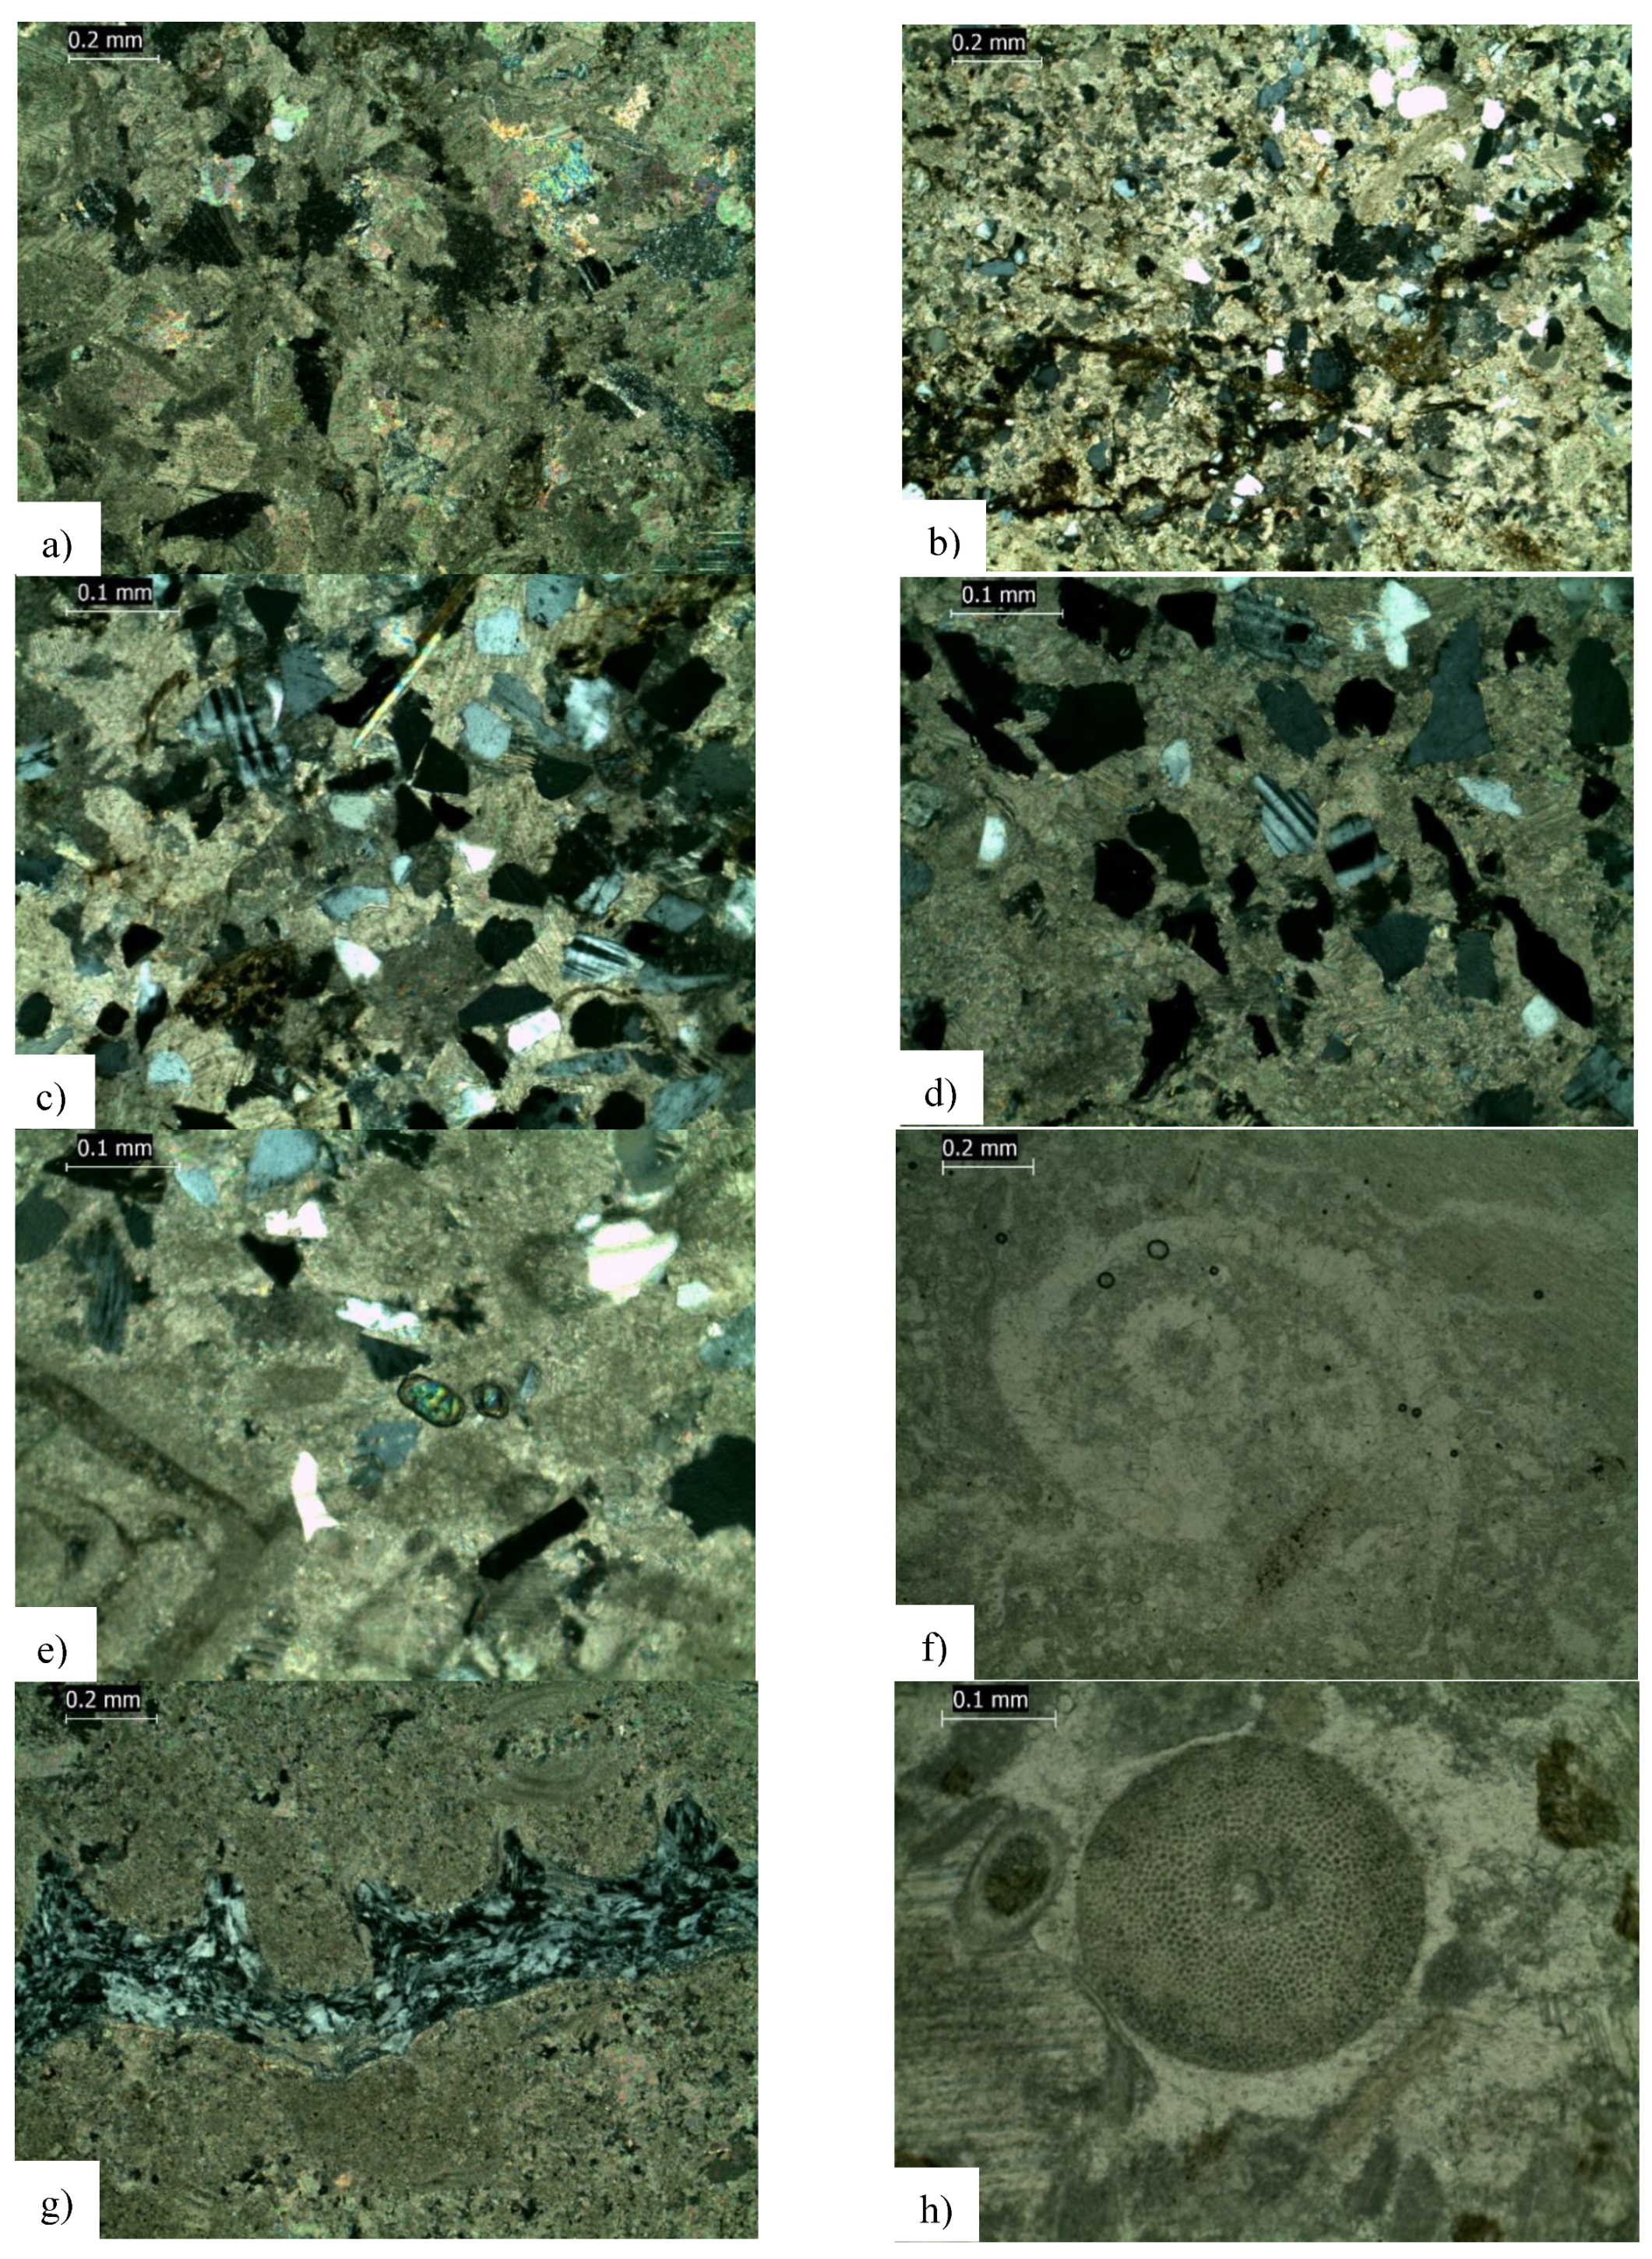
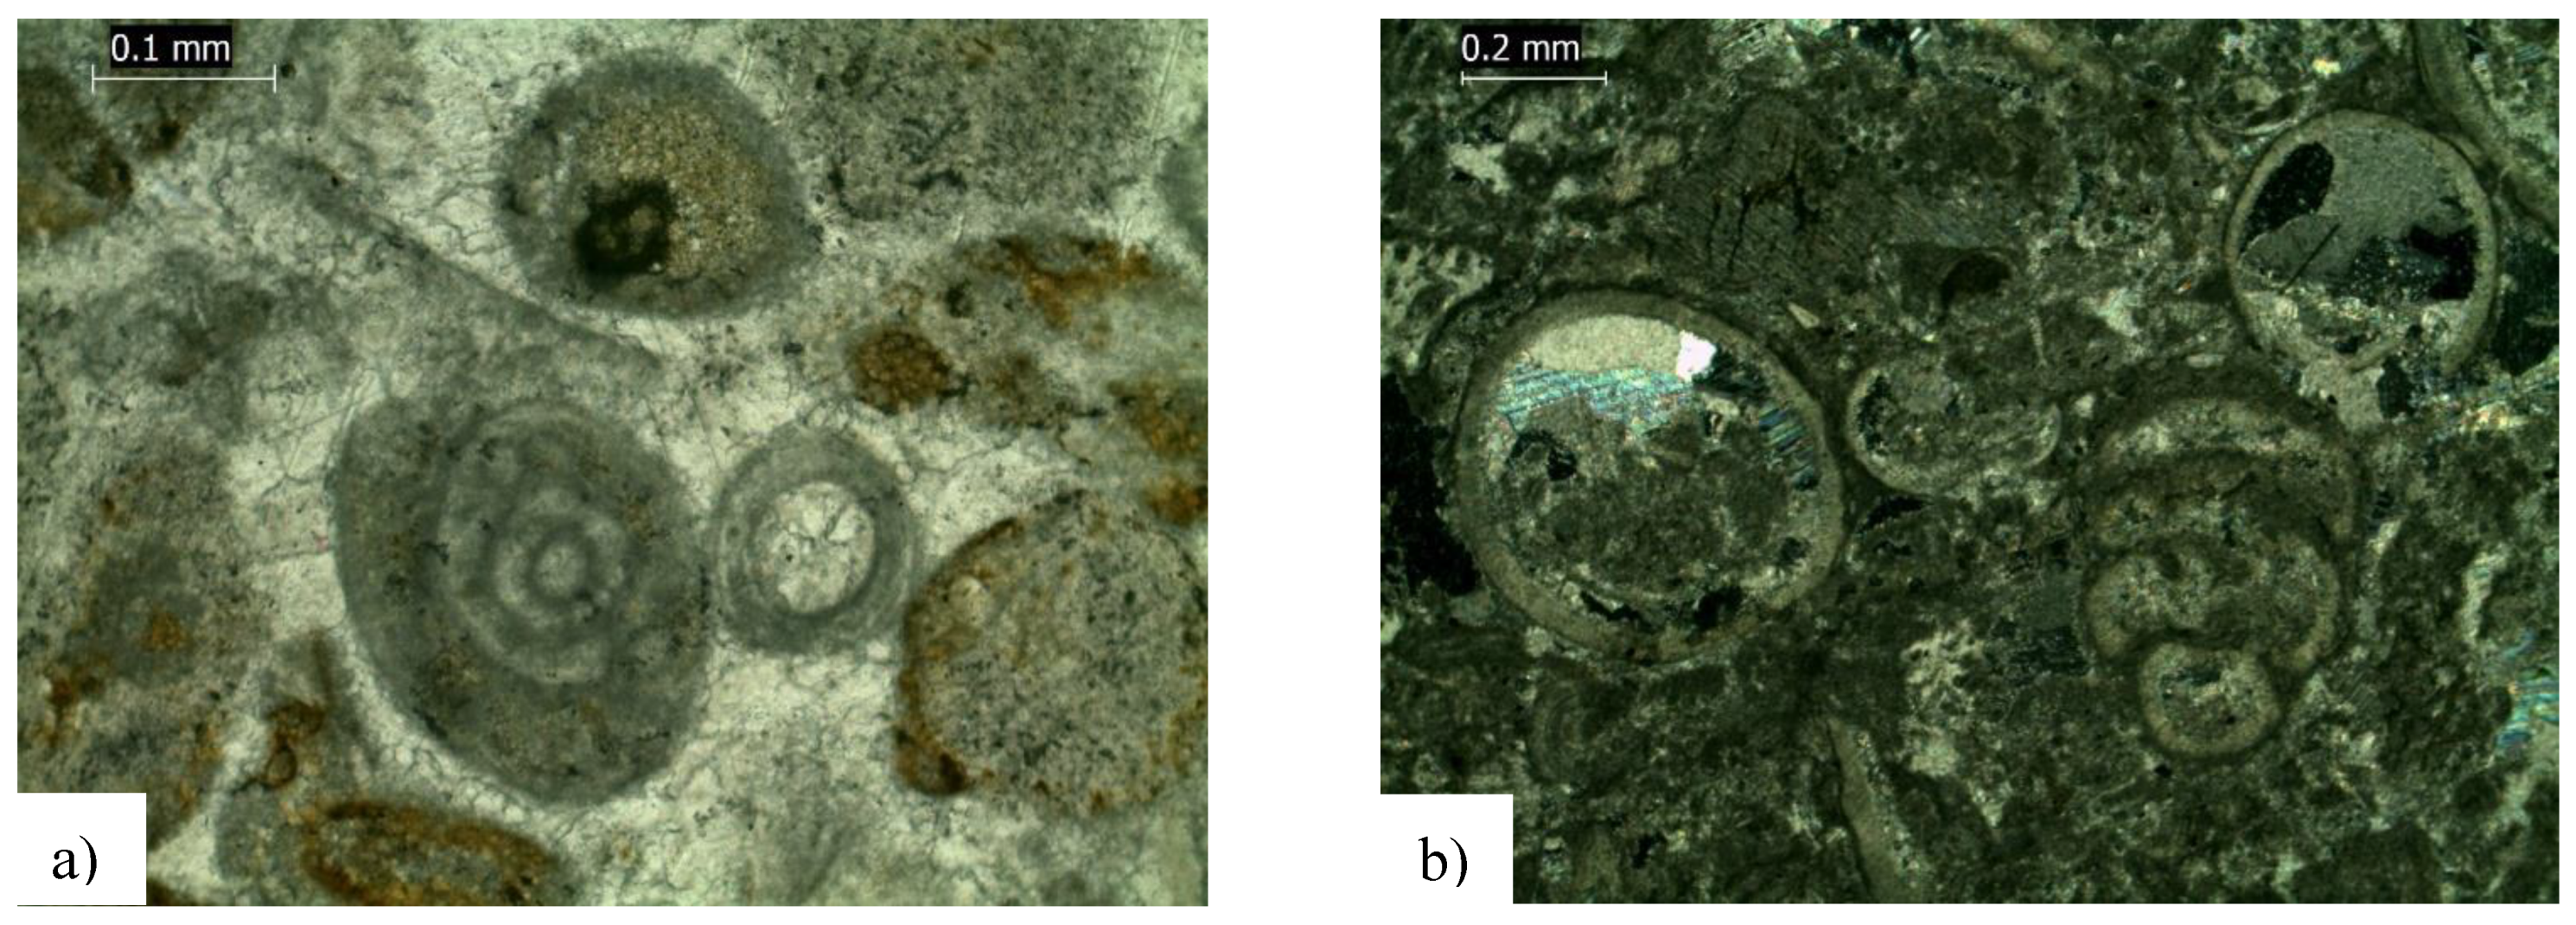
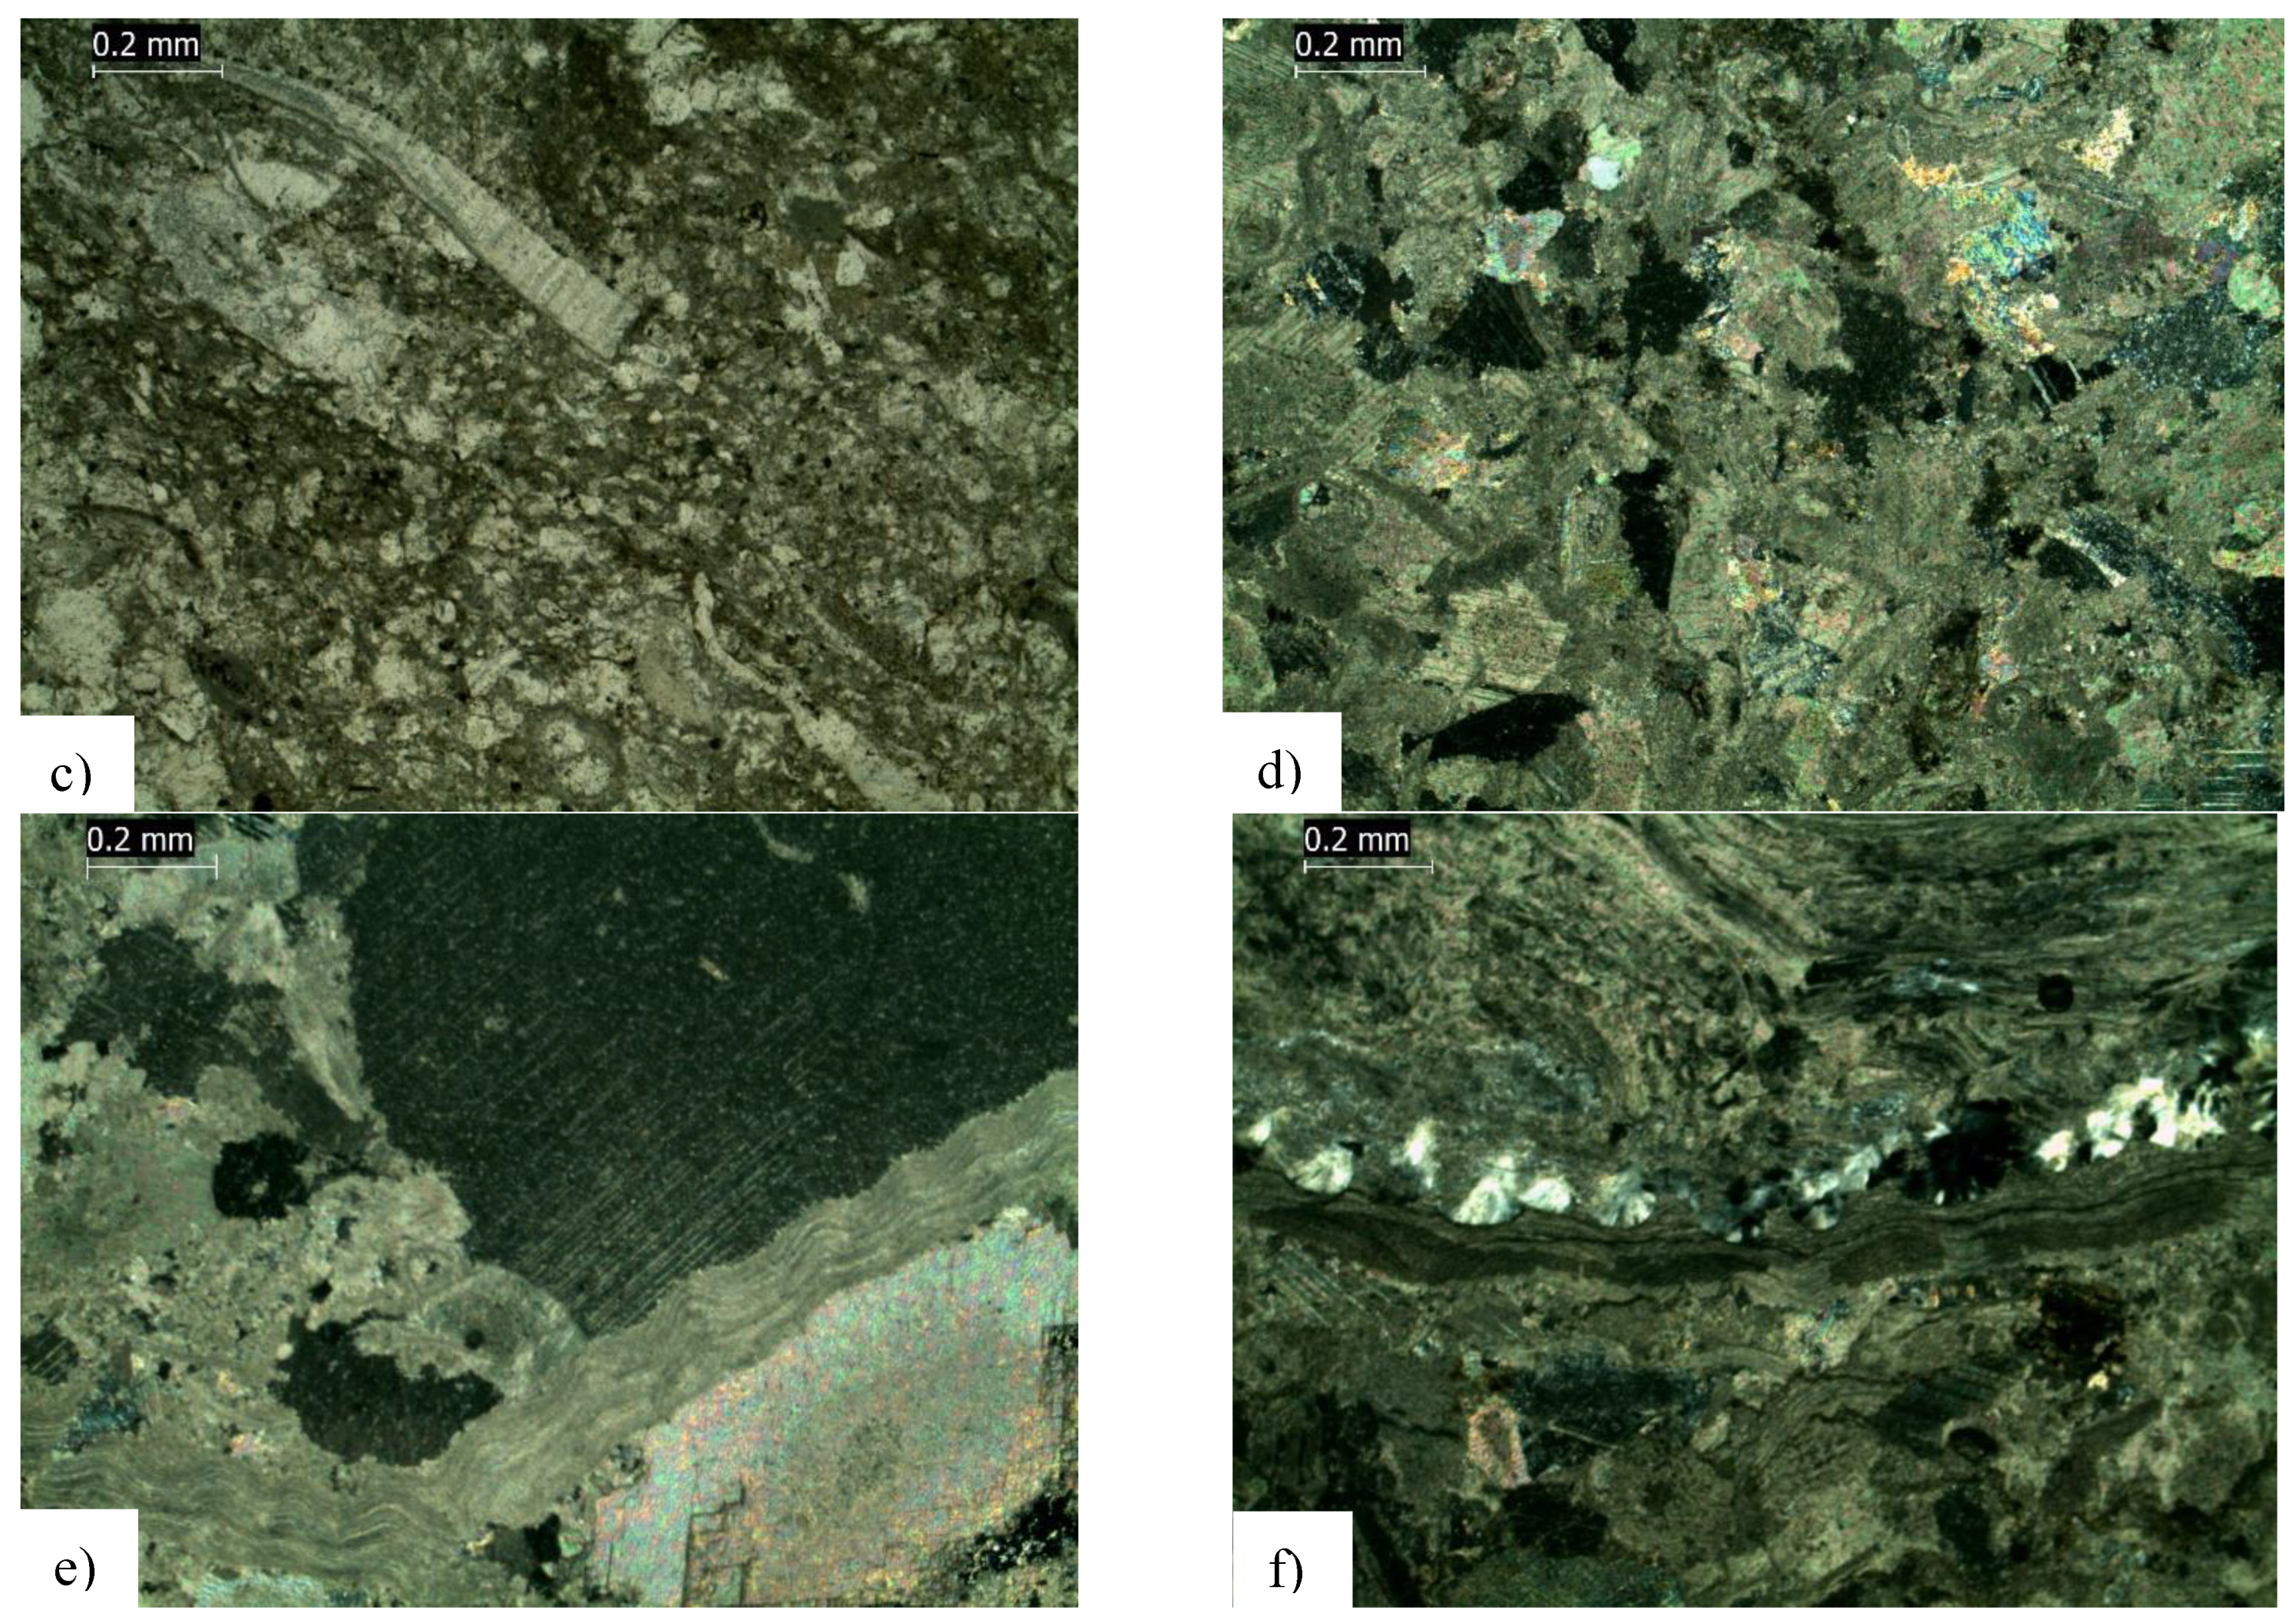
4.2. Microfacies of Chhidru Formation

The microfacies found in the Chhidru Formation were identified and classified based on the classification scheme of Wilson (2008). Dominant microfacies are those made of multiple types of bioclasts, quartz, and feldspar components, showing textures from mudstone to packstone. A total of five microfacies have been identified; they are listed below.
  • Mudstone-biomicrite facies
  • Wackstone-biomicrite facies
  • Wackstone-biosparite facies
  • Packstone-biomicrite facies
  • Packstone-biosparite facies

4.2.1. Mudstone-Biomicrite Facies

The mudstone-biomicrite facies includes samples ZC10, ZC11, and ZC12 (Table 2). The petrographic examination reveals that these samples are composed of micrite, quartz, feldspar, and fairly preserved brachiopod and bryozoan bioclasts, among other minerals (Figure 5b,c).
A little quantity of hematite, around 1–2%, may be found in stylolite. Mineral zircon is present in very small amounts in ZC12 (Figure 5d). The most frequent kind of cement discovered in these microfacies is sparry calcite cement (Figure 5c,d). Dunham classifies samples ZC10, ZC11, and ZC12 as mudstone due to the presence of muddier carbonate (Figure 5b–e). The grains are subangular to subrounded and weakly to moderately sorted, and this microfacies represent marine fossil fragments containing these grains.
This microfacies is characterized by marine fossils fragments, subangular to sub rounded grains, moderate to poor sorting, and abundant clastic and ferruginous matrix. This is a low-energy deposition environment underneath the fair-weather wave base because of the presence of matrix. A close proximity to the inner shelf is suggested by the occurrence of tiny marine fossils and the predominant sandstone texture (such as quartz, feldspar, etc.) [78,79]. The same kind of microfacies was also regarded as inner shelf deposits by Zlobin et al. [80], Özgen-Erdem and Koç-Tasgin [81], and Moissette et al. [82].

4.2.2. Wackstone-Biomicrite Facies (MF-2)

The Wackstone-biomicrite facies includes samples ZC7 and ZC8 (Table 2). These samples include 30% bioclasts, 50% micrite, and 20% spar, as determined by petrographic examination (Figure 5f,g). Bioclasts in fine-grained cement is classified by Folk as such (micrite). ZC7 and ZC8 are classified by Dunham as Wackstone deposits with poor fusulinids and gastropod preservation (Figure 5f,g).
According to Sims and Belanger [83], Arefifard and Payne [84] and Huang et al. [85], Fusulinids (foraminifera) is most often seen in open sea. Bryozoans, on the other hand, can only exist in naturally salted water [86,87,88,89]. Marine subtidal habitat is indicated by the presence of a micrite matrix and a wide range of fauna. Because agitated water prevents lime mud from settling, a low energy depositional condition results in a large inflow or presence of mud. Low energy deposition, the presence of shallow marine creatures, poor preservation of fusulinids, and a large inflow of lime are believed to have contributed to the deposition of this microfacies below the middle shelf setting’s fair-weather wave base condition.

4.2.3. Wackstone-Biosparite Facies (MF-3)

Sample ZC4 is classified as a Wackstone-biomicrite microfacies (Table 2). The petrographic analysis of ZC4 reveals that this rock sample includes 49% bioclasts, 16% micrite, and 35% spar. It depicts fragments of brachiopod shells (Figure 5h). The cement spar contains bioclasts that are coarsely crystalline. More than 10% of ZC4’s carbonate grains are supported by mud, according to Dunham [73] categorization (Figure 5h).
The limestone of a shallow marine origin is especially rich in brachiopod fragments. Most of the organisms were benthonic and sessile [90,91,92]. However, even though brachiopods are all marine organisms, they have a wide salinity range, ranging from brackish to slightly hypersaline [93,94,95]. The presence of sparry cement indicates a high level of energy. These microfacies point to a deposition in the proximal middle shelf area below the storm wave base.

4.2.4. Packstone-Biomicrite Facies (MF-4)

The Packstone-biomicrite facies is shown by samples ZC1, ZC6, and ZC9 (Figure 6a–c; Table 2). Petrographic analysis of the C1, ZC6, and ZC9 samples shows that bioclasts make up more than half of the material, with micrite and spar coming in second and third in order. ZC1 has calcite veins as well (Figure 6a–c). Brachiopods, gastropods, and bryozoans are all found here. Since bioclasts are found in fine-grained cement (micrite), this is referred to as bio-micrite according to Folk’s categorization. Because of mud-supported grains, ZC1, ZC6, and ZC9 are classified as Packstone by Dunham [73] (Figure 6a–c).
As stated by Tucker [97] and Cumming et al. [98], marine bryozoans are important carbonate sediment providers. They have helped create reefs and other limestones in the past. Even though brachiopods dwell in fresh water far from the offshore, Scholle and Ulmer-Scholle [94] and Karlsson et al. [99] describe them as marine invertebrates. A large inflow of continental sediments during deposition is thought to be the origin of the formation of this microfacies on a distal middle shelf.

4.2.5. Packstone-Biosparite Facies (MF-5)

Samples no. ZC2, ZC3, and ZC5 are categorized as Packstone-biosparite facies (Figure 6d–f; Table 2). The petrographic analysis of ZC2, ZC3, and ZC5 reveals that bioclasts are the most abundant, followed by micrite and spar. Bryozoans and brachiopods are the most commonly observed marine organisms. This microfacies indicates a proximal middle shelf deposition because of the poor preservation of marine fragments and the presence of a continental inflow during the deposition.

5. Discussion

5.1. Dynamic Depositional Model

For the dynamic depositional modeling, the sequence stratigraphy is a critical input tool for characterizing the sediments that fill the region’s time and space. Rock relationships in a chronostratigraphic framework of repeated layers are studied using sequence stratigraphy. Unconformities or their corresponding conformities define the boundaries of these repeating layers [72,100,101]. Different system tracts (transgressive and regressive) represent a depositional sequence, which leads to the interpretation of understanding the deposition between changes in the sea level, according to Janjuhah et al. [102], Lin et al. [103], and Janjuhah and Alansari [104]. This is the sole method, according to Embry [100], to subdivide rock recordings into system tracts, which may be the only option in this specific instance.
The transgressive–regressive (T–R) sequence was established by Embry and Klovan [74] and is still in use. The unconformable boundary on the basin border is the subaerial unconformity, and the corresponding conformity farther out to sea is the maximum regressive surface (MRS). Through the use of this approach, we may avoid the problems associated with both the depositional and genetic stratigraphic sequences. The T–R sequence is divided into transgressive and regressive system tracts using maximum flooding surfaces. Regressive systems tracts, a basic method of separating the rock record into systems tracts, may be the only alternative in a given scenario when other methods are ineffective [100]. The T–R sequence model of Embry [105] was used in this investigation (Figure 7).
For this reason, the sequence boundary (SB) is located in Zaluch Gorge, near the base of the Sardhai Formation, where Warchha Sandstone and Sardhai Shale meet [16,47]. Sardhai formation has a fine ascending succession, as shown by the grain size. As a result, the water level rises, causing the Sardhai formation clays to be deposited [38]. The transgressive surface may be found at the very top of the Sardhai formation (TS) (Figure 7a). Underneath the Sardhai formation, the lower system tract (LST) is present. There is also a marine origin to the Amb Formation that covers the Sardhai formation (Figure 7a). It is clear from the lithology and grain size that sea level increased and ultimately reached at its highest point. Once the regression has begun, the sea level has dropped. The maximum flooding surface (MSF) is present at this point. It is located between the transgression surface (TS) and the MSF of the Amb Formation (Figure 7a). Following deposition (Amb Formation), regression takes place, and the facie begins to recede toward the basin’s edge. Rocks, such as the Wargal Limestone and Chhidru formations, are deposited first (Figure 7b). When looking at the Chhidru Formation, the regressive system tract is composed of marine and non-marine fabric ranging from limestone to sandy limestones (Figure 3 and Figure 7c) [66,67]. This group of facies was thought to have been deposited in an environment between the inner and the middle shelf.
The unconformity at the summit of the Chhidru Formation indicates a type-1 sequence boundary. The high stand system tract (HST) contains several geological formations. Figure 8 depicts the depositional hierarchy, stratigraphic cycles, and system tracts in this setting. Previous research has placed the age of the Chhidru Formation at various times. According to the biostratigraphy of brachiopods, Khan and Afzal [71] dated the Chhidru Formation as Guadeloupian. His objective was to use the brachiopod biostratigraphy as a means of correlating the fossil records of different species. His research also found that the Salt Range lacked Upper Permian strata. Using data from Furnish and Glenister [70], Nakazawa and Dickins [106], Balic and Malvic [107], Nugroho and Putra [108], and Moro et al. [109] utilized biostratigraphic dating of foraminifera fusulinids and ammonites to interpret the Chhidru Formation as having been deposited between 254 and 252.5 Ma. They proposed using the Upper Permian age as a baseline for cyclicity in their correlation studies. The relative sea-level curve was compared using the chronology of the eustatic sea-level curve developed by Chen et al. [110], Haq and Schutter [111], Ross and Ross [112]. The relative sea-level curve for Chhidru’s Formation was derived using observations of various facies and microfacies, as well as their hypothesized depositional settings. It has been suggested that the Chhidru Formation was deposited 1.5 Ma ago, during two distinct periods. Six fourth-order cycles with a 0.1–0.4 Ma time duration are found inside these third-order cycles [113]. The Chhidru Formation’s depositional environment was determined by combining data from lithofacies, microfacies, sequence stratigraphy, and preserved fauna. There is evidence from lithofacies (such as those found in the Chhidru Formation, which includes clastic as well as carbonate fragments) as well as microfacies (such as those found in the middle and inner shelf) that the Chhidru Formation was deposited in the middle to the inner shelf during periods of tectonic stability, with the distal source of the fine clastic sediments still providing the sediments for the shelf-diverse agents, representing two (3rd Order) cycles and six parasequence cycles (fourth order) of the T–R cycle. Samples ZC1, ZC3, ZC6, ZC7, and ZC9 are thought to have lived in clear water in a shallow marine environment, and fossils such as brachiopods and ammonites support this theory [114,115]. It is safe to assume that samples ZC2, ZC10, and ZC11, which all include varied fauna, were collected in a subtidal environment. However, while being mostly marine, brachiopods have a wide salinity range, being found in both brackish and somewhat hypersaline habitats. There is a middle-inner shelf depositional environment indicated by the fossils’ poor preservation, which is due to a significant continental inflow during the deposit of the Chhidru Formation. Glacio-eustacy and tectonic subsidence influence the deposition in third-order cycles [116]. Global third order cycle deposits may have been formed by an increase in glacial ice volume in the late Paleozoic [117]. After sea inundation, local subsidence may have caused the Chhidru Formation’s parasequences to appear cyclically.
This system tract emerges during the part of the global sea-level rise, when rising rates outpace sedimentation rates. Comparison of the Chhidru Formation’s sea level to global sea level in the Upper Permian time, these two medium-sized (25–75 m) decreases in the Upper Permian are associated with the sea level decline at the base and top of the Chhidru Formation, according to Haq and Schutter [111] (Figure 3 and Figure 8). This means that the other two small cycles of falls are not present worldwide but are due to local tectonic activity (Figure 3). The Chen et al. [110] curve shows a fall of 253.8 Ma on the world chart, and this research is highly correlated, while a 252.5 Ma fall cannot be correlated as the Chen et al. [110] curve has a maximum flooding surface at that time. When compared to the sea-level curve of Ross and Ross [112], it seems that the worldwide impacts on the Neo-Tethys depositional facies on the Chhidru Formation, as well as local tectonic activity, played a role (Figure 8) [118]. We infer that the depositional environment of the Chhidru Formation is influenced by both global and local tectonics.

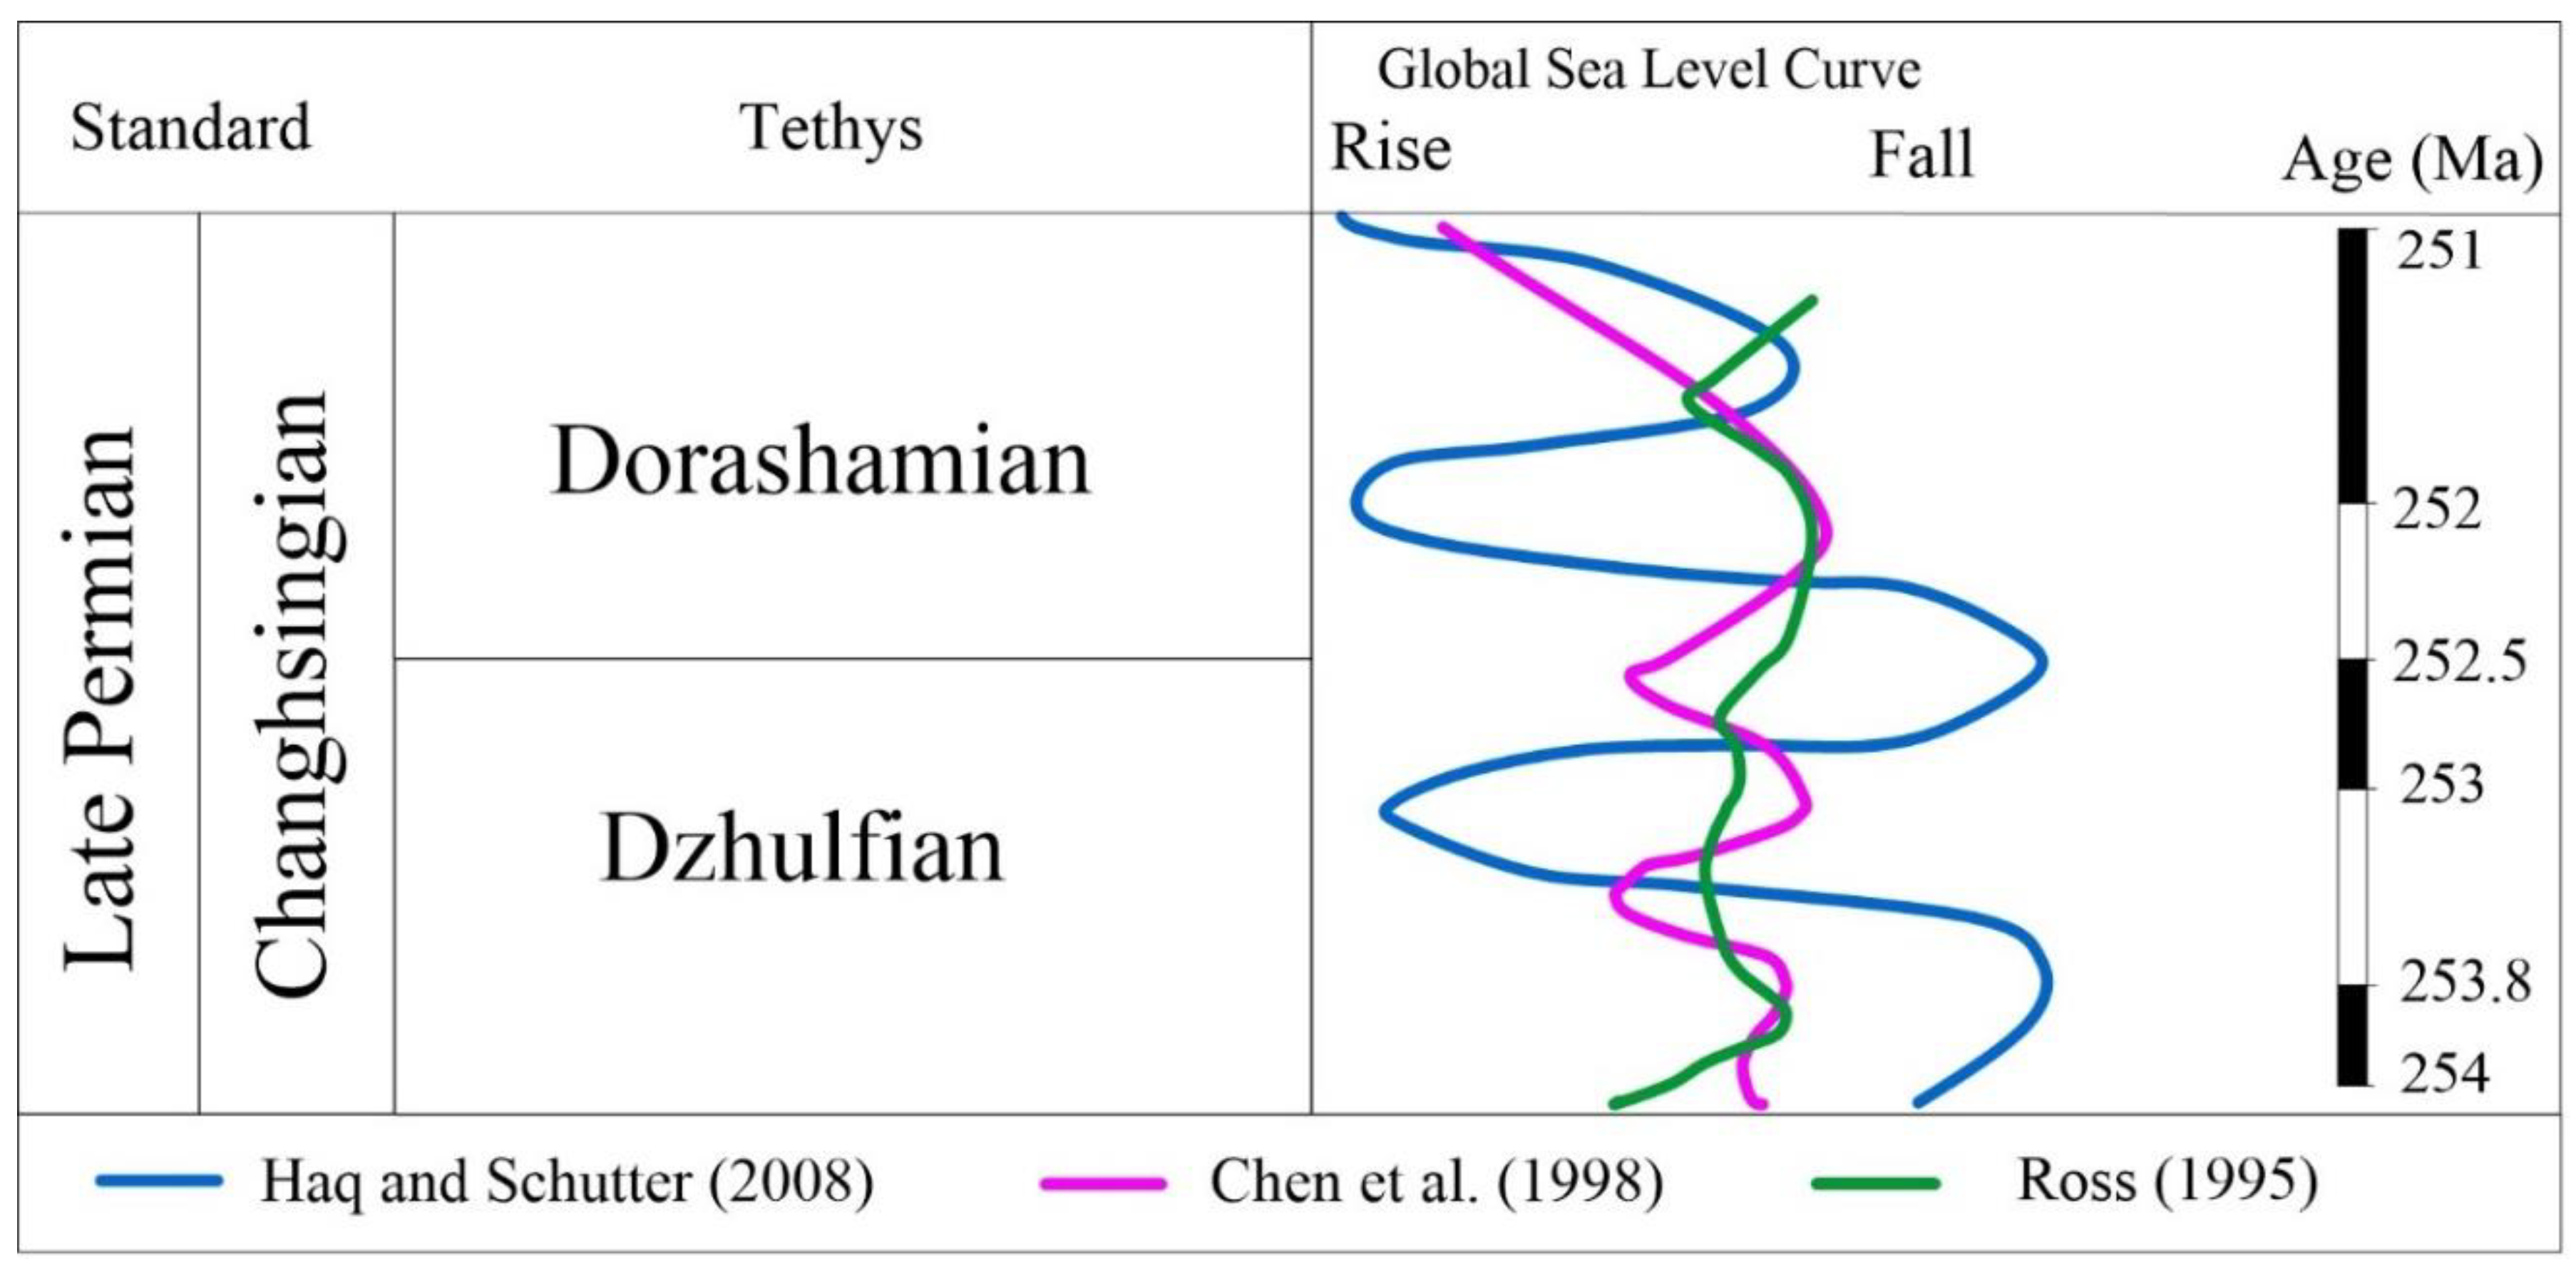
5.2. Permo-Triassic Boundary

The mixed siliciclastic and carbonate succession of the Permo-Triassic era may be found in Pakistan’s salt. The sandstone bed known as the white sandstone bed is the uppermost lithological unit of the Chhidru Formation. The sandstone is fine to medium grained, thinly bedded with shale interbeds, and the upper contact with the Mianwali Formation’s Kathwai member is dolomite. The P-T Boundary is marked by Ceratite beds from the Mianwali Formation (Table 1). The grain size rises from bottom to top (Chhidru Formation–Mianwali Formation), indicating a coarsening of material in increasing order (Figure 9). The limestone in the Chhidru Formation’s lower section has been replaced by sandy limestone, which was deposited far from the coast on the middle to inner shelf during the Late Permian period. Grain size rises from bottom to top, indicating an increasingly coarsened layer. Later, the lithology changed dramatically, and the dolomitic unit of the Mianwali Formation started to rise sharply. During the Siberian Traps eruptions, seawater sulphate levels in the ocean dropped dramatically, which may have caused the early Triassic dolomite to accumulate [119]. Invertebrates, particularly brachiopods and ammonoids, were able to recover during the Spathian period due to continued cooling, which decreased marine anoxia and raised sulphate levels. During the P-T mass extinction event, there were fewer floral eaters and more piscivores in the environment [120]. It is argued that a sharp decline in the quantity of sediment-binding vegetation in the Early Triassic of South Africa, Australia, India, and Spain was responsible for the basinal shift from low-energy meandering rivers to high-energy braided rivers [121]. A variety of Permian flora was reintroduced in the Spathian Stage, resulting in the presence of algal bindstones in the South China sea. This demonstrates that the eastern Tethys Ocean’s dominantly mixed siliciclastic-carbonate margins were dominated by sediment-binding organisms that played a key role in the formation of carbonates. Reduviasporonites, including the species Reduviasporonites chalastus and Reduviasporonites catenulatus, are common in Permian-Triassic palynological assemblages [122,123,124]. Reduviasporonites have been found in ‘relatively high frequency’ at the PTB, as reported by Yin et al. [125]. Reduviasporonites have been found in Pakistan’s Lower Triassic by Schneebeli-Hermann and Bucher [4].
On the basis of the abrupt facies changes that occur between the Chhidru and Mianwali formations, as well as the record of the biostratigraphy, it seems that a P-T border exists between these two formations.

6. Conclusions

The Nilawahan and Zaluch formations date from the Permian, and they were formed in the Salt Range. During that period, the tendency of sediment deposition was east to west. As a result, the Permian succession’s thickness rises from east to west over the Salt Range. These two formations exhibit progradation, while the Sardhai Formation and the Amb Formation in the Zaluch Gorge show retrogradation and may be found inside the low stand system tract or the transgressive system tract. The maximum flooding surface is located near the summit of the Amb Formation. Once the water level starts dropping, the regressive process may begin. There are two major deposits in the high stand system tract during this time period, which are the Wargal Limestone and Chhidru formations (HST); the border between Permian-Triassic and Triassic is seen at the apex of the Chhidru Formation. According to the outcrop data from the Chhidru Formation, three lithofacies have been observed, namely, the limestone facies (CF1), the limestone with clay interbeds facies (CF2), and the sandy limestone facies (CF3), while the petrographic study has classified the Chhidru Formation into five distinct microfacies, namely the mudstone biomicrite facies, the wackestone-biomicrite facies, and the wackestone-biosparite. Based on lithofacies, microfacies, stratigraphic control, and surviving fauna including brachiopods, ammonites, and gastropods, the Chhidru Formation was formed in a middle to inner shelf environment. The high stand system tract’s sequence stratigraphic cycles indicate that this succession is situated in its uppermost portion. According to the sequence stratigraphic study, the Chhidru Formation exhibits a worldwide coursing-upward cycle. Using a laser level, we were able to map out where the transgressive surface and maximum flooding surface are in relation to each other.

Author Contributions

Conceptualization, S.K.A., H.T.J. and M.H.S.; methodology, M.H.S., S.K.A. and H.T.J.; software, M.H.S. and S.K.A.; validation, M.H.S., S.K.A. and H.T.J.; formal analysis, M.H.S. and S.K.A.; investigation, M.H.S., S.K.A., H.T.J., G.K., S.D.Z., P.M. and A.A.; resources, M.H.S.; data curation, M.H.S., S.K.A., H.T.J. and S.M.S.; writing—original draft preparation, M.H.S.; writing—review and editing, M.H.S., S.K.A., H.T.J., G.K., S.D.Z., P.M., U.K. and A.A.; visualization, S.K.A., H.T.J. and G.K.; supervision, S.K.A. and H.T.J.; project administration, S.K.A., H.T.J., G.K. and A.A.; funding acquisition, G.K. and A.A. All authors have read and agreed to the published version of the manuscript.

Funding

This research received no external funding.

Institutional Review Board Statement

Not applicable.

Informed Consent Statement

Not applicable.

Acknowledgments

We thank the director of the Institute of Geology, University of Azad Jammu and Kashmir, Muzaffarabad for his help and friendly attitude during our research work, which is always a source of inspiration for us.

Conflicts of Interest

The authors declare no conflict of interest.

References

  1. Awan, R.S.; Khan, A.; Liu, C.; Yang, S.; Zang, Q.; Wu, Y.; Li, G.; Iltaf, K.H.; Tahir, M.; Ali, S. Subsurface geological model of sedimentary and metasedimentary wedge from Mansehra to Battal based on gravity data, Hazara area, Pakistan. Energy Geosci. 2021, 2, 229–237. [Google Scholar] [CrossRef]
  2. Krishna, J. High-Resolution Intrabasinal to Inter-regional Geodynamic Chronicle During the Span of the Intra-Permian–Intra-Paleogene Mega-Sequence in and Around India on the GTM. In The Indian Mesozoic Chronicle; Springer: Berlin/Heidelberg, Germany, 2017; pp. 505–694. [Google Scholar]
  3. Hermann, E.; Hochuli, P.A.; Bucher, H.; Roohi, G. Uppermost Permian to Middle Triassic palynology of the Salt Range and Surghar Range, Pakistan. Rev. Palaeobot. Palynol. 2012, 169, 61–95. [Google Scholar] [CrossRef]
  4. Schneebeli-Hermann, E.; Bucher, H. Palynostratigraphy at the Permian-Triassic boundary of the Amb section, Salt Range, Pakistan. Palynology 2015, 39, 1–18. [Google Scholar] [CrossRef]
  5. Khan, M.A.; Hussain, S.R.J.; Ali, B.; Ali, S.; Khan, M.J.; Mehmood, S. Microfacies analysis and depositional setting of the late Permian Wargal limestone exposed at Nammal Gorge, Western Salt Range, Pakistan. Bahria Univ. Res. J. Earth Sci. 2017, 2, 46–51. [Google Scholar]
  6. Wignall, P.; Hallam, A. Griesbachian (Earliest Triassic) palaeoenvironmental changes in the Salt Range, Pakistan and southeast China and their bearing on the Permo-Triassic mass extinction. Palaeogeogr. Palaeoclimatol. Palaeoecol. 1993, 102, 215–237. [Google Scholar] [CrossRef]
  7. Kummel, B. Stratigraphy and paleontology of the Permian-Triassic boundary beds, Salt Range and trans-Indus ranges, West Pakistan. In Stratigraphic Boundary Problems: Permian and Triassic of West Pakistan; Casa Camino Real: Las Cruces, NM, USA, 1970; Volume 4, pp. 1–110. [Google Scholar]
  8. Theobald, W. Notes on geology of Salt Range. Jl. ASB 1854, 23, 651. [Google Scholar]
  9. Ghazi, S.; Mountney, N.P.; Butt, A.A.; Sharif, S. Stratigraphic and palaeoenvironmental framework of the Early Permian sequence in the Salt Range, Pakistan. J. Earth Syst. Sci. 2012, 121, 1239–1255. [Google Scholar] [CrossRef] [Green Version]
  10. Schneebeli-Hermann, E.; Kürschner, W.M.; Hochuli, P.A.; Bucher, H.; Ware, D.; Goudemand, N.; Roohi, G. Palynofacies analysis of the Permian–Triassic transition in the Amb section (Salt Range, Pakistan): Implications for the anoxia on the South Tethyan Margin. J. Asian Earth Sci. 2012, 60, 225–234. [Google Scholar] [CrossRef]
  11. Waterhouse, J. Lopingian (Late Permian) stratigraphy of the salt range, Pakistan and Himalayan region. Geol. J. 2010, 45, 264–284. [Google Scholar] [CrossRef]
  12. Wadood, B.; Aziz, M.; Ali, J.; Khan, N.; Wadood, J.; Khan, A.; Shafiq, M.; Ullah, M. Depositional, diagenetic, and sequence stratigraphic constrains on reservoir characterization: A case study of middle Jurassic Samana Suk Formation, western Salt Range, Pakistan. J. Sediment. Environ. 2021, 6, 131–147. [Google Scholar] [CrossRef]
  13. Shen, S.Z.; Cao, C.-Q.; Henderson, C.M.; Wang, X.-D.; Shi, G.R.; Wang, Y.; Wang, W. End-Permian mass extinction pattern in the northern peri-Gondwanan region. Palaeoworld 2006, 15, 3–30. [Google Scholar] [CrossRef]
  14. Jan, I.U. Progress in the Gondwanan Carboniferous–Permian palynology and correlation of the Nilawahan Group of the Salt Range, Pakistan: A brief review. J. Earth Syst. Sci. 2014, 123, 21–32. [Google Scholar] [CrossRef]
  15. Mishra, S.; Aggarwal, N.; Jha, N. Palaeoenvironmental change across the Permian-Triassic boundary inferred from palynomorph assemblages (Godavari Graben, south India). Palaeobiodivers. Palaeoenviron. 2018, 98, 177–204. [Google Scholar] [CrossRef]
  16. Mertmann, D. Evolution of the marine Permian carbonate platform in the Salt Range (Pakistan). Palaeogeogr. Palaeoclimatol. Palaeoecol. 2003, 191, 373–384. [Google Scholar] [CrossRef]
  17. Anser, M.K.; Yousaf, Z.; Khan, M.A.; Nassani, A.A.; Abro, M.M.Q.; Vo, X.H.; Zaman, K. Social and administrative issues related to the COVID-19 pandemic in Pakistan: Better late than never. Environ. Sci. Pollut. Res. 2020, 27, 34567–34573. [Google Scholar] [CrossRef]
  18. Jalil, A.; Khan, K. Preliminary appraisal of physio-chemical and bacteriological water contaminations in Rawalpindi/Islamabad catchment of Soan river, Potwar plateau (Punjab), Pakistan. Punjab Univ. J. Zool 2012, 27, 39–44. [Google Scholar]
  19. Miraj, M.A.F.; Idrees, M.Z. Subsurface Structural Interpretation of Missa Keswal Area, Eastern Potwar, Pakistan. Iraqi Geol. J. 2021, 54, 146–156. [Google Scholar] [CrossRef]
  20. Mehmood, W.; Aadil, N.; Jadoon, Y. 3-D Structural Modeling of Meyal Field, Potwar Sub-basin, Pakistan using Seismic and Well Data. Nucleus 2016, 53, 26–32. [Google Scholar]
  21. Ghani, H.; Sobel, E.R.; Zeilinger, G.; Glodny, J.; Zapata, S.; Irum, I. Palaeozoic and Pliocene tectonic evolution of the Salt Range constrained by low-temperature thermochronology. Terra Nova 2021, 33, 293–305. [Google Scholar] [CrossRef]
  22. Farooqui, M.A.; Umar, M.; Sabir, M.A.; Pervez, R.; Jalees, T. Geochemical attributes of late Neoproterozoic Salt Range Formation, Pakistan: Constraints on provenance, paleoclimate, depositional and tectonic settings. Geosci. J. 2019, 23, 201–218. [Google Scholar] [CrossRef]
  23. Cotton, J.T.; Koyi, H.A. Modeling of thrust fronts above ductile and frictional detachments: Application to structures in the Salt Range and Potwar Plateau, Pakistan. Geol. Soc. Am. Bull. 2000, 112, 351–363. [Google Scholar] [CrossRef]
  24. Yuan, D.Y.; Ge, W.P.; Chen, Z.W.; Li, C.Y.; Wang, Z.C.; Zhang, H.P.; Zhang, P.Z.; Zheng, D.W.; Zheng, W.J.; Craddock, W.H. The growth of northeastern Tibet and its relevance to large-scale continental geodynamics: A review of recent studies. Tectonics 2013, 32, 1358–1370. [Google Scholar] [CrossRef]
  25. Zahid, M.; Khan, A.; ur Rashid, M.; Saboor, A.; Ahmad, S. Structural interpretation of Joya Mair oil field, south Potwar, Upper Indus Basin, Pakistan, using 2D seismic data and petrophysical analysis. J. Himal. Earth Sci. 2014, 47, 73. [Google Scholar]
  26. Henderson, A.L.; Najman, Y.; Parrish, R.; Mark, D.F.; Foster, G.L. Constraints to the timing of India–Eurasia collision; a re-evaluation of evidence from the Indus Basin sedimentary rocks of the Indus–Tsangpo Suture Zone, Ladakh, India. Earth Sci. Rev. 2011, 106, 265–292. [Google Scholar] [CrossRef]
  27. Khan, U.; Janjuhah, H.T.; Kontakiotis, G.; Rehman, A.; Zarkogiannis, S.D. Natural Processes and Anthropogenic Activity in the Indus River Sedimentary Environment in Pakistan: A Critical Review. J. Mar. Sci. Eng. 2021, 9, 1109. [Google Scholar] [CrossRef]
  28. Abir, I.A.; Khan, S.D.; Ghulam, A.; Tariq, S.; Shah, M.T. Active tectonics of western Potwar Plateau–Salt Range, northern Pakistan from InSAR observations and seismic imaging. Remote Sens. Environ. 2015, 168, 265–275. [Google Scholar] [CrossRef] [Green Version]
  29. Ullah, M.F.; Mahmood, K.; Akram, M.S. Coal mining trends and future prospects: A case study of Eastern Salt Range, Punjab, Pakistan. J. Himal. Earth Sci. 2018, 51, 87–93. [Google Scholar]
  30. Sameeni, S.J. The Salt Range: Pakistan’s unique field museum of geology and paleontology=[Le Salt Range: Un musée de géologie et de paléontologie à ciel ouvert au Pakistan]. In PaleoParks: The Protection and Conservation of Fossil Sites Worldwide; Carnets de Géologie/Notebooks on Geology, Brest, Book Chapter 6 (CG2009_BOOK_03/06); Université de Bretagne Occidentale Département des Sciences de la Terre: Brest, France, 2009; pp. 65–73. [Google Scholar]
  31. Malkani, M.S.; Mahmood, Z. Revised stratigraphy of Pakistan. Geol. Surv. Pak. Rec. 2016, 127, 1–87. [Google Scholar]
  32. Siehl, A. Structural setting and evolution of the Afghan orogenic segment—A review. Geol. Soc. Lond. Spec. Publ. 2017, 427, 57–88. [Google Scholar] [CrossRef]
  33. Ueno, K. The Permian antitropical fusulinoidean genus Monodiexodina: Distribution, taxonomy, paleobiogeography and paleoecology. J. Asian Earth Sci. 2006, 26, 380–404. [Google Scholar] [CrossRef]
  34. Shi, G.; Archbold, N. A quantitative analysis on the distribution of Baigendzhinian-Early Kungurian (Early Permian) brachiopod faunas in the western Pacific region. J. Southeast Asian Earth Sci. 1995, 11, 189–205. [Google Scholar] [CrossRef]
  35. Khan, I.; Zhong, N.; Luo, Q.; Ai, J.; Yao, L.; Luo, P. Maceral composition and origin of organic matter input in Neoproterozoic–Lower Cambrian organic-rich shales of Salt Range Formation, upper Indus Basin, Pakistan. Int. J. Coal Geol. 2020, 217, 103319. [Google Scholar] [CrossRef]
  36. Jan, I.U.; Iqbal, S.; Davies, S.J.; Zalasiewicz, J.A.; Stephenson, M.H.; Wagreich, M.; Haneef, M.; Hanif, M.; Ahmad, S. A periglacial palaeoenvionment in the upper carboniferous–lower permian tobra formation of the salt range, Pakistan. Acta Geol. Sin. Engl. Ed. 2017, 91, 1063–1078. [Google Scholar] [CrossRef]
  37. Roohi, G.; Raza, S.M.; Schneebeli-Hermann, E.; Bucher, H.; Yaseen, A.; Imran, M. Permo-Triassic climate change and faunal turnover in the Salt and Surgharranges, Northern Pakistan. J. Himal. Earth Sci. 2017, 50, 1–12. [Google Scholar]
  38. Shah, A.; Haneef, M.; Hanif, M.; Jan, I.U. Lithofacies and palaeoenvironments of the Carboniferous-Permian Nilawahan Group, Salt Range Pakistan. J. Himal. Earth Sci. 2012, 45, 136. [Google Scholar]
  39. Mazumder, S.; Tep, B.; Pangtey, K.; Das, K.; Mitra, D. Probable existence of a Gondwana transcontinental rift system in western India: Implications in hydrocarbon exploration in Kutch and Saurashtra offshore: A GIS-based approach. J. Earth Syst. Sci. 2017, 126, 81. [Google Scholar] [CrossRef] [Green Version]
  40. Shehzad, S.; Alam, I.; Mehmood, S.; Masood, F. Diagenetic History and Microfacies Analysis of Upper Permian Wargal Limestone in the Central Salt Range, Pakistan. Pak. J. Sci. Ind. Res. Ser. A Phys. Sci. 2018, 61, 163–172. [Google Scholar] [CrossRef]
  41. Abbasi, I.A.; Haneef, M.; Khan, M.A. Early Permian Siliciclastic System of the North-Gondwanaland: A Comparison between Nilawahan Group of North Pakistan and Haushi Group of Oman. Pak. J. Hydrocarb. Res. 2011, 21, 19–33. [Google Scholar]
  42. Shah, I. Stratigraphy of Pakistan: Memoirs of the Geological Survey of Pakistan. Sci. Res. 1977, 12, 138–140. [Google Scholar]
  43. Ahmad, I.; Ahmad, S.; Ali, F. Structural analysis of the Kharthop and Kalabagh Hills area, Mianwali District, Punjab, Pakistan. J. Himal. Earth Sci. 2016, 49, 63–74. [Google Scholar]
  44. Gee, E.; Gee, D. Overview of the geology and structure of the Salt Range, with observations on related areas of northern Pakistan. Geol. Soc. Am. Spec. Pap. 1989, 232, 95–112. [Google Scholar]
  45. Jan, I.U.; Stephenson, M.H.; Khan, F.R. Palynostratigraphic correlation of the Sardhai Formation (Permian) of Pakistan. Rev. Palaeobot. Palynol. 2009, 158, 72–82. [Google Scholar] [CrossRef] [Green Version]
  46. Abdulghani, A.; Ghazi, S.; Riaz, M.; Zafar, T. Sedimentary fabrics and diagenetic features of the Late Triassic Kingriali Formation, Khisor-Marwat ranges, Pakistan. Indian J. Geo Mar. Sci. 2020, 49, 954–964. [Google Scholar]
  47. Khan, S.; Ahmad, S.; Hanif, M.; Jan, I.U.; Swati, M.A.F.; Khan, S.; Saboor, A. Lithofacies, paleoenvironments and sequence stratigraphic modelling of the Wargal Limestone: Implication for reservoir characterization in the Salt Range, northwest, Pakistan. J. Himal. Earth Sci. 2014, 47, 41. [Google Scholar]
  48. Craig, J.; Hakhoo, N.; Bhat, G.; Hafiz, M.; Khan, M.; Misra, R.; Pandita, S.; Raina, B.; Thurow, J.; Thusu, B. Petroleum systems and hydrocarbon potential of the North-West Himalaya of India and Pakistan. Earth Sci. Rev. 2018, 187, 109–185. [Google Scholar] [CrossRef]
  49. Malkani, M.S.; Mahmood, Z. Stratigraphy of Pakistan. Geol. Surv. Pak. Mem. 2017, 24, 1–134. [Google Scholar]
  50. Hermann, E.; Hochuli, P.A.; Méhay, S.; Bucher, H.; Brühwiler, T.; Ware, D.; Hautmann, M.; Roohi, G.; Yaseen, A. Organic matter and palaeoenvironmental signals during the Early Triassic biotic recovery: The Salt Range and Surghar Range records. Sediment. Geol. 2011, 234, 19–41. [Google Scholar] [CrossRef] [Green Version]
  51. Hussain, W.; Abbas, S.Q.; Hussain, S. 95 Structure Investigation, Economics and Stratigraphy of the Paleozoic, Mesozoic and Cenozoic Sequence in the Vicinity Eastern and Western side of the Salt Range, Punjab Pakistan. J. Inf. Commun. Technol. Robot. Appl. 2018, 6, 95–116. [Google Scholar]
  52. Fahad, M.; Khan, M.A.; Hussain, J.; Ahmed, A.; Yar, M. Microfacies analysis, depositional settings and reservoir investigation of Early Eocene Chorgali Formation exposed at Eastern Salt Range, Upper Indus Basin, Pakistan. Carbonates Evaporites 2021, 36, 41. [Google Scholar] [CrossRef]
  53. Alhubail, M.M.; Ghahfarokhi, R.B. Introduction to Unconventional Hydrocarbon Resources. Unconv. Hydrocarb. Resour. Tech. Reserv. Eng. Anal. 2020, 1, 1. [Google Scholar]
  54. Hylland, M.D.; Yeats, R.S. Stratigraphic and structural framework of Himalayan foothills. In Himalaya and Tibet: Mountain Roots to Mountain Tops; Geological Society of America: Boulder, CO, USA, 1999; Volume 328, p. 257. [Google Scholar]
  55. Kazmi, A.H.; Abbasi, I.A. Stratigraphy & Historical Geology of Pakistan; Department & National Centre of Excellence in Geology: Peshawar, Pakistan, 2008. [Google Scholar]
  56. Ghazi, S.; Mountney, N.P. Petrography and provenance of the Early Permian Fluvial Warchha Sandstone, Salt Range, Pakistan. Sediment. Geol. 2011, 233, 88–110. [Google Scholar] [CrossRef]
  57. Qureshi, M.N.; Talha, N.; Ahmad, M.; Zafar, M.; Ashfaq, S. Morpho-palynological investigations of natural resources: A case study of Surghar mountain district Mianwali Punjab, Pakistan. Microsc. Res. Tech. 2019, 82, 1047–1056. [Google Scholar] [CrossRef]
  58. Waagen, W. Salt-range fossils; fossils from the Ceratite formation; Pisces–Ammonoidea: Ibid. Mem. Palaeont. Indica Ser. 1895, 13, 2. [Google Scholar]
  59. Dunbar, C.O. Stratigraphic Significance of the Fusulinids of the Lower Products [sic] Limestone of the Salt Range; Geological Society of America: Boulder, CO, USA, 1933. [Google Scholar]
  60. Teichert, C. Stratigraphic nomenclature and correlation of the Permian “Productus limestone”. Salt Range West Pak. Ibid. Recs 1966, 15, 19. [Google Scholar]
  61. Mei, S.; Henderson, C.M. Comments on some Permian conodont faunas reported from Southeast Asia and adjacent areas and their global correlation. J. Asian Earth Sci. 2002, 20, 599–608. [Google Scholar] [CrossRef]
  62. Jan, I.U.; Stephenson, M.H. Palynology and correlation of the Upper Pennsylvanian Tobra Formation from Zaluch Nala, Salt Range, Pakistan. Palynology 2011, 35, 212–225. [Google Scholar] [CrossRef]
  63. Ahmed, S.; Ahmad, I.; Khan, M.I. Structure and stratigraphy of the Paleozoic and Mesozoic sequence in the vicinity of Zaluch Nala, Western Salt Range, Punjab Pakistan. Pak. J. Hydrocarb. Res. 2005, 15, 1–8. [Google Scholar]
  64. Hussain, H.S.; Jan, I.U.; Hanif, M.; Sadiq, I. Microfacies, palynofacies and depositional environment of the Upper Permian Wargal limestone, western Salt Range, Pakistan. J. Himal. Earth Sci. 2015, 48, 41–60. [Google Scholar]
  65. Saboor, A.; Ul Haq, M.; Nawaz, A.; Swati, M.A.F.; Gohar, J.; Khan, S.; Ghaffari, A. Insight to the geological character of the Early Triassic strata in the Western Salt Range, Pakistan: A comparative study. Geol. J. 2021, 56, 4667–4684. [Google Scholar] [CrossRef]
  66. Zia-ul-Rehman, M.; Masood, K.R.; Arshad, F.; Rehman, S.U.; Ullah, M.F. Biostratigraphy and Its Suggested Correlation with Lithostratigraphy, in Chhidru Formation, Salt Range, Pakistan. Int. J. Agric. Appl. Sci. 2015, 7, 12–19. [Google Scholar]
  67. Ahmad, S.; Waqas, M.; Khan, S.S.; Swati, F.; Azhar, M.; Jan, I.U.; Ali, F.; Yaqoob, M.; Sadiq, A.; Khan, S. Facies analysis and dynamic depositional modelling of the Upper Permian Chhidru Formation, Salt Range, Upper Indus Basin, Pakistan. J. Himal. Earth Sci. 2015, 48, 54–70. [Google Scholar]
  68. Schneebeli-Hermann, E. Regime shifts in an Early Triassic subtropical ecosystem. Front. Earth Sci. 2020, 8, 608. [Google Scholar] [CrossRef]
  69. Chen, J.; Xu, Y.-G. Establishing the link between Permian volcanism and biodiversity changes: Insights from geochemical proxies. Gondwana Res. 2019, 75, 68–96. [Google Scholar] [CrossRef]
  70. Furnish, W.; Glenister, B.F. Permian ammonoid Cyclolobus from the Salt Range, West Pakistan. In Stratigraphic Boundary Problems: Permian and Triassic of West Pakistan; Special Publication; Paleontological Institute, University of Kansas: Lawrence, KS, USA, 1970; Volume 4, pp. 153–175. [Google Scholar]
  71. Khan, F.R.; Afzal, J. Comparative study of Brachiopods of Chhidru Formation from Zaluch and Nammal sections, Western Salt Range, Pakistan. Pak. J. Hydrocarb. Res. 2005, 15, 53–63. [Google Scholar]
  72. Janjuhah, H.T.; Alansari, A.; Santha, P.R. Interrelationship Between Facies Association, Diagenetic Alteration and Reservoir Properties Evolution in the Middle Miocene Carbonate Build Up, Central Luconia, Offshore Sarawak, Malaysia. Arab. J. Sci. Eng. 2018, 44, 1–16. [Google Scholar] [CrossRef]
  73. Dunham, R.J. Classification of carbonate rocks according to depositional textures. Am. Assoc. Pet. Geol. 1962, 108–121. [Google Scholar]
  74. Embry, A.F.; Klovan, J.E. A late Devonian reef tract on northeastern Banks Island, NWT. Bull. Can. Pet. Geol. 1971, 19, 730–781. [Google Scholar]
  75. Flugel, E. Microfacies of Carbonate Rocks: Analysis, Interpretation and Application; Springer: Berlin/Heidelberg, Germany; New York, NY, USA, 2004; p. 979. [Google Scholar]
  76. Flügel, E. Practical use of microfacies: Reservoir rocks and host rocks. In Microfacies of Carbonate Rocks; Springer: Berlin/Heidelberg, Germany, 2010; pp. 877–894. [Google Scholar]
  77. Kontakiotis, G.; Moforis, L.; Karakitsios, V.; Antonarakou, A. Sedimentary Facies Analysis, Reservoir Characteristics and Paleogeography Significance of the Early Jurassic to Eocene Carbonates in Epirus (Ionian Zone, Western Greece). J. Mar. Sci. Eng. 2020, 8, 706. [Google Scholar] [CrossRef]
  78. Hjálmarsdóttir, H.R.; Hammer, Ø.; Nagy, J.; Grundvåg, S.-A. Foraminiferal stratigraphy and palaeoenvironment of a storm-influenced marine shelf: Upper Aptian–lower Albian, Svalbard, Arctic Norway. Cretac. Res. 2021, 130, 105033. [Google Scholar] [CrossRef]
  79. Wallet, E.; Slater, B.J.; Willman, S.; Peel, J.S. Small carbonaceous fossils (SCF s) from North Greenland: New light on metazoan diversity in early Cambrian shelf environments. Pap. Palaeontol. 2021, 7, 1403–1433. [Google Scholar] [CrossRef]
  80. Zlobin, V.; Rosen, O.; Abbyasov, A. Two metasedimentary basins in the Early Precambrian granulites of the Anabar Shield (polar Siberia): Normative mineral compositions calculated by the MINLITH program and basin facies interpretations. In Precambrian Sedimentary Environments: A Modern Approach to Ancient Depositional Systems; Blackwell Publishing Ltd.: Algiers, Algeria, 2002. [Google Scholar]
  81. Özgen-Erdem, N.; Koç-Tasgin, C. Microfacies and Depositional Environment of the Ilerdian Carbonates in the North-Western Tosya (SE Kastamonu) Region, Northern Turkey. J. Geol. Soc. India 2019, 93, 704–712. [Google Scholar] [CrossRef]
  82. Moissette, P.; Cornée, J.-J.; Antonarakou, A.; Kontakiotis, G.; Drinia, H.; Koskeridou, E.; Tsourou, T.; Agiadi, K.; Karakitsios, V. Palaeoenvironmental changes at the Tortonian/Messinian boundary: A deep-sea sedimentary record of the eastern Mediterranean Sea. Palaeogeogr. Palaeoclimatol. Palaeoecol. 2018, 505, 217–233. [Google Scholar] [CrossRef]
  83. Sims, E.R.; Belanger, C.L. Quantifying Late Pennsylvanian Multivariate Morphological Change in the Fusulinid Genus Triticites from the Central and Southwestern United States. J. Foraminifer. Res. 2021, 51, 165–181. [Google Scholar] [CrossRef]
  84. Arefifard, S.; Payne, J.L. End-Guadalupian extinction of larger fusulinids in central Iran and implications for the global biotic crisis. Palaeogeogr. Palaeoclimatol. Palaeoecol. 2020, 550, 109743. [Google Scholar] [CrossRef]
  85. Huang, X.; Aretz, M.; Zhang, X.; Du, Y.; Qie, W.; Wen, Q.; Wang, C.; Luan, T. Pennsylvanian—Early Permian palaeokarst development on the Yangtze Platform, South China, and implications for the regional sea-level history. Geol. J. 2018, 53, 1241–1262. [Google Scholar] [CrossRef]
  86. Schwaha, T.; Bernhard, J.M.; Edgcomb, V.P.; Todaro, M.A. Aethozooides uraniae, a new deep-sea genus and species of solitary bryozoan from the Mediterranean Sea, with a revision of the Aethozoidae. Mar. Biodivers. 2019, 49, 1843–1856. [Google Scholar] [CrossRef] [Green Version]
  87. Janjuhah, H.T.; Gamez Vintaned, J.A.; Salim, A.M.A.; Faye, I.; Shah, M.M.; Ghosh, D.P. Microfacies and depositional environments of miocene isolated carbonate platforms from Central Luconia, Offshore Sarawak, Malaysia. Acta Geol. Sin. Engl. Ed. 2017, 91, 1778–1796. [Google Scholar] [CrossRef]
  88. Miranda, A.A.; Almeida, A.C.; Vieira, L.M. Non-native marine bryozoans (Bryozoa: Gymnolaemata) in Brazilian waters: Assessment, dispersal and impacts. Mar. Pollut. Bull. 2018, 130, 184–191. [Google Scholar] [CrossRef]
  89. Moissette, P. Changes in bryozoan assemblages and bathymetric variations. Examples from the Messinian of northwest Algeria. Palaeogeogr. Palaeoclimatol. Palaeoecol. 2000, 155, 305–326. [Google Scholar] [CrossRef]
  90. Tucker, M.E.; Wright, V.P. Carbonate Sedimentology; John Wiley & Sons: Hoboken, NJ, USA, 2009. [Google Scholar]
  91. Bujtor, L.; Nagy, J. Fauna, palaeoecology and ecotypes of the Early Cretaceous sediment hosted hydrothermal vent environment of Zengővárkony (Mecsek Mountains, Hungary). Palaeogeogr. Palaeoclimatol. Palaeoecol. 2021, 564, 110179. [Google Scholar] [CrossRef]
  92. Bergamin, L.; Ruggiero, E.T.; Pierfranceschi, G.; Andres, B.; Constantino, R.; Crovato, C.; D’Ambrosi, A.; Marassich, A.; Romano, E. Benthic foraminifera and brachiopods from a marine cave in Spain: Environmental significance. Mediterr. Mar. Sci. 2020, 21, 506–518. [Google Scholar] [CrossRef]
  93. Fürsich, F.T.; Schneider, S.; Werner, W.; Lopez-Mir, B.; Pierce, C.S. Life at the continental–marine interface: Palaeoenvironments and biota of the Alcobaça Formation (Late Jurassic, Central Portugal), with a formal definition of the unit appended. Palaeobiodivers. Palaeoenviron. 2021, 1–65. [Google Scholar] [CrossRef]
  94. Scholle, P.A.; Ulmer-Scholle, D.S. A Color Guide to the Petrography of Carbonate Rocks: Grains, Textures, Porosity, Diagenesis, AAPG Memoir 77; AAPG: Tulsa, OK, USA, 2003; Volume 77. [Google Scholar]
  95. Stock, C.W.; Sandberg, C.A. Latest Devonian (Famennian, expansa Zone) conodonts and sponge-microbe symbionts in Pinyon Peak Limestone, Star Range, southwestern Utah, lead to reevaluation of global Dasberg Event. Palaeogeogr. Palaeoclimatol. Palaeoecol. 2019, 534, 109271. [Google Scholar] [CrossRef]
  96. Folk, R.L. Practical petrographic classification of limestones. AAPG Bull. 1959, 43, 1–38. [Google Scholar]
  97. Tucker, M.E. Sedimentary Petrology: An Introduction to the Origin of Sedimentary Rocks; John Wiley & Sons: Hoboken, NJ, USA, 2009. [Google Scholar]
  98. Cumming, R.L.; Gordon, D.P.; Gowlett-Holmes, K. Bryozoans in the marine benthos. In Australian Bryozoa Volume 1: Biology, Ecology and Natural History; Clayton, Missouri, USA, 2018; p. 145. [Google Scholar]
  99. Karlsson, T.M.; Vethaak, A.D.; Almroth, B.C.; Ariese, F.; van Velzen, M.; Hassellöv, M.; Leslie, H.A. Screening for microplastics in sediment, water, marine invertebrates and fish: Method development and microplastic accumulation. Mar. Pollut. Bull. 2017, 122, 403–408. [Google Scholar] [CrossRef]
  100. Embry, A. Practical sequence stratigraphy. Can. Soc. Pet. Geol. 2009, 81, 79. [Google Scholar]
  101. Catuneanu, O.; Galloway, W.E.; Kendall, C.G.S.C.; Miall, A.D.; Posamentier, H.W.; Strasser, A.; Tucker, M.E. Sequence stratigraphy: Methodology and nomenclature. Newsl. Stratigr. 2011, 44, 173–245. [Google Scholar] [CrossRef] [Green Version]
  102. Janjuhah, H.T.; Salim, A.; Mohammad, A.; Ali, M.Y.; Ghosh, D.P.; Hassan, A.; Hakif, M. Development of Carbonate Buildups and Reservoir Architecture of Miocene Carbonate Platforms, Central Luconia, Offshore Sarawak, Malaysia. In Proceedings of the SPE/IATMI Asia Pacific Oil & Gas Conference and Exhibition, Jakarta, Indonesia, 17–19 October 2017. [Google Scholar]
  103. Lin, W.; Bhattacharya, J.P.; Stockford, A. High-resolution sequence stratigraphy and implications for cretaceous glacioeustasy of the Late Cretaceous Gallup System, New Mexico, USA. J. Sediment. Res. 2019, 89, 552–575. [Google Scholar] [CrossRef]
  104. Janjuhah, H.T.; Alansari, A. Offshore Carbonate Facies Characterization and Reservoir Quality of Miocene Rocks in the Southern Margin of South China Sea. Acta Geol. Sin. Engl. Ed. 2020, 94, 1547–1561. [Google Scholar] [CrossRef]
  105. Embry, A.F. Transgressive-regressive (TR) sequence stratigraphy. In Proceedings of the Gulf Coast SEPM Conference Proceedings, Houston, TX, USA, 8–11 December 2002; pp. 151–172. [Google Scholar]
  106. Nakazawa, K.; Dickins, J.M. The Tethys: Her Paleogeography and Paleobiogeography from Paleozoic to Mesozoic; Tokai University Press: Tokyo, Japan, 1985. [Google Scholar]
  107. Balic, D.; Malvic, T. Pliocene-Quaternary stratigraphy and sedimentation at the Neretva River Mouth, on Croatian Adriatic Coast. Geol. Q. 2013, 57, 233–241. [Google Scholar] [CrossRef]
  108. Nugroho, S.H.; Putra, P.S. Determining textural and geochemical element characteristics of seafloor sediment using multivariate analysis along the Simeulue sub-basin, Indonesia. Rud.-Geol.-Naft. Zb. 2020, 35, 79–92. [Google Scholar] [CrossRef]
  109. Moro, A.; Velić, I.; Mikuž, V.; Horvat, A. Microfacies characteristics of carbonate cobble from Campanian of Slovenj Gradec (Slovenia): Implications for determining the Fleuryana adriatica De Castro, Drobne and Gušić paleoniche and extending the biostratigraphic range in the Tethyan realm. Rud.-Geol.-Naft. Zb. 2018, 33, 1–13. [Google Scholar] [CrossRef]
  110. Chen, Z.; Jin, Y.; Shi, G. Permian transgression-regression sequences and sea-level changes of South China. Proc. R. Soc. Vic. 1998, 110, 345–367. [Google Scholar]
  111. Haq, B.U.; Schutter, S.R. A chronology of Paleozoic sea-level changes. Science 2008, 322, 64–68. [Google Scholar] [CrossRef]
  112. Ross, C.A.; Ross, J.R. Permian sequence stratigraphy. In The Permian of Northern Pangea; Springer: Berlin/Heidelberg, Germany, 1995; pp. 98–123. [Google Scholar]
  113. Strohmenger, C.; Voigt, E.; Zimdars, J. Sequence stratigraphy and cyclic development of Basal Zechstein carbonate-evaporite deposits with emphasis on Zechstein 2 off-platform carbonates (Upper Permian, Northeast Germany). Sediment. Geol. 1996, 102, 33–54. [Google Scholar] [CrossRef]
  114. Bujtor, L. A Valanginian crustacean microcoprolite ichnofauna from the shallow-marine hydrothermal vent site of Zengővárkony (Mecsek Mts., Hungary). Facies 2012, 58, 249–260. [Google Scholar] [CrossRef]
  115. Chen, Z.-Q.; Benton, M.J. The timing and pattern of biotic recovery following the end-Permian mass extinction. Nat. Geosci. 2012, 5, 375–383. [Google Scholar] [CrossRef]
  116. Wynn, T.C.; Read, J.F. Sequence response of a distal-to-proximal foreland ramp to glacio-eustacy and tectonics: Mississippian, Appalachian Basin, West Virginia-Virginia, USA. Am. Assoc. Pet. Geol. 2003, 83, 11–34. [Google Scholar]
  117. Fischer, A.G. The two Phanerozoic supercycles. In Catastrophes and Earth History; Princeton University Press: Princeton, NJ, USA, 2014; pp. 129–150. [Google Scholar]
  118. Ahmad, S., Jr.; Ali, A.; Haneef, M.; Waqas, M.; Ali, J.; Khan, S.S.; Sadiq, A.; Yaqoob, M. Facies analysis, depositional model and sequence stratigraphy of the Upper Permian Chiddru Formation, Salt Ranges, Upper Indus Basin, Pakistan. J. Himal. Earth Sci. 2012, 45, 6. [Google Scholar]
  119. Song, H.; Tong, J.; Algeo, T.J.; Song, H.; Qiu, H.; Zhu, Y.; Tian, L.; Bates, S.; Lyons, T.W.; Luo, G. Early Triassic seawater sulfate drawdown. Geochim. Et Cosmochim. Acta 2014, 128, 95–113. [Google Scholar] [CrossRef]
  120. Sahney, S.; Benton, M.J. Recovery from the most profound mass extinction of all time. Proc. R. Soc. B Biol. Sci. 2008, 275, 759–765. [Google Scholar] [CrossRef] [PubMed] [Green Version]
  121. Ward, P.D.; Montgomery, D.R.; Smith, R. Altered river morphology in South Africa related to the Permian-Triassic extinction. Science 2000, 289, 1740–1743. [Google Scholar] [CrossRef] [PubMed] [Green Version]
  122. Foster, C.; Stephenson, M.; Marshall, C.; Logan, G.; Greenwood, P. A revision of Reduviasporonites Wilson 1962: Description, illustration, comparison and biological affinities. Palynology 2002, 26, 35–58. [Google Scholar] [CrossRef]
  123. Liu, F.; Peng, H.; Bomfleur, B.; Kerp, H.; Zhu, H.; Shen, S. Palynology and vegetation dynamics across the Permian–Triassic boundary in southern Tibet. Earth Sci. Rev. 2020, 209, 103278. [Google Scholar] [CrossRef]
  124. Kar, R.; Ghosh, A.K. First record of Reduviasporonites from the Permian–Triassic transition (Gondwana Supergroup) of India. Alcheringa Australas. J. Palaeontol. 2018, 42, 373–382. [Google Scholar] [CrossRef]
  125. Yin, H.; Feng, Q.; Lai, X.; Baud, A.; Tong, J. The protracted Permo-Triassic crisis and multi-episode extinction around the Permian–Triassic boundary. Glob. Planet. Chang. 2007, 55, 1–20. [Google Scholar] [CrossRef]
Figure 1. Pakistan’s tectonic map. (a) showing Pakistan’s overall geology and surrounding area; (b) the geological map of the Salt Range is shown as a green box in Figure 1a (Modified after Wadood et al. [12]).
Jmse 09 01372 g001
Figure 2. Lithology distribution map of the Salt Range area (Modified after Malkani and Mahmood [49]).
Jmse 09 01372 g002
Figure 3. The Chhidru Formation’s sedimentological log shows the outcrop description, facies distribution, sample site, cyclicity, and deposition interpretation.
Jmse 09 01372 g003
Figure 4. Images of outcrops depicting significant characteristics seen in the Zaluch Gorge, Western Salt Range. (a) lithology distribution and three distinct facies identified; (b) highlighting the lower contact of the Chhidru Formation with the Wargal Limestone; (c) highlighting the upper contact of the Chhidru Formation with the Mianwali Formation; (d) Facies-1 (CF1 limestone facies); (e) photomicrograph of Facies-2 (CF2 limestone with clay interbeds).
Jmse 09 01372 g004
Figure 5. Photomicrographs representing different characteristics (a) Facies-3 (CF3 Sandy Limestone); (b) Sample-Zc10—Mudstone-biomicrite unit from the Chhidru Formation representing brachiopods and stylolites veins highlighted by hematite (cross Nicol 4×); (c) Sample-ZC11—Mudstone-biomicrite unit representing albite, microcline, muscovite, and nodosaria (cross Nicol 4×); (d) Sample-ZC-12—Mudstone-biomicrite unit showing albite; (e) Sample-ZC-12—Mudstone-biomicrite unit representing zircon which is colorless in plain polarized light (PPL 10×); (f) Sample-ZC-7—Wackstone-biomicrite unit representing ammonites (PPL 4×); (g) Sample-ZC-8—Wackstone-biomicrite unit showing bioclasts replaced by silica (Cross Nicol 4×); (h) Sample-ZC-4—Wackstone-biosparite unit representing radiolaria (PPL 10×).
Jmse 09 01372 g005
Figure 6. Photomicrographs representing different features (a) Sample-ZC-1—Wackstone-biomicrite unit representing ammonite (PPL 10×); (b) Sample ZC-6—Packstone-biomicrite unit representing ostracod and gastropod (Cross Nicol 4×); (c) Sample-ZC-9—Packstone-biomicrite unit representing brachiopod (PPL 4×); (d) Sample-ZC-2—Packstone-biosparite unit representing micrite and spar (PPL 4×); (e) Sample-ZC-3—Packstone-biosparite unit indicating brachiopod packed between spar (Cross Nicol 4×); (f) Sample-ZC-5—Packstone-biosparite representing bioclasts replaced by silica.
Jmse 09 01372 g006aJmse 09 01372 g006b
Figure 7. Field outcrop picture of a Zaluch Gorge outcrop displaying the following various cycles: (a) the stratigraphic cycle of the Sadri and Amb formations; (b) the stratigraphic cycles of Wargal Limestone; and (c) the stratigraphic cycle of the Chhidru Formation.
Jmse 09 01372 g007
Figure 8. Global sea-level curves comparison of various researchers Chen et al. [110], Haq and Schutter [111], and Ross and Ross [112].
Jmse 09 01372 g008
Figure 9. Zaluch Gorge’s depositional model in addition to sequence stratigraphic cycles, surface, and system track data.
Jmse 09 01372 g009
Table 1. Stratigraphic successions of the Zaluch Gorge.
FormationLithologyAge
Datta FormationSandstone, Siltstone, Glass sand, Fire clayJurassic
Kingriali FormationDolomite, Limestone, Marl, ShaleTriassic
Tredian FormationSandstone, ShaleMiddle Triassic
Mianwali FormationSandstone, Shale, Dolomite (Heterogeneous lithology)Lower Triassic
Unconformity (P-T Boundary)
Chhidru FormationLimestone, SandstoneLate Permian
Wargal LimestoneLimestone, DolomiteLate Permian
Amb FormationShale, LimestoneMiddle to Late Permian
Unconformity
Sardhai FormationShaleEarly Permian
Warchha SandstoneSandstoneEarly Permian
Tobra FormationConglomerates having tillitic, fresh water and complex faciesEarly Permian
Unconformity
Salt Range FormationSalt, Marl, GypsumPrecambrian
Table 2. Modal percentage composition of lithofacies of Chhidru Formation, Zaluch Gorge (Macro-scale Estimation).
Sample No.Quartz
%
Feldspar
%
Calcite
%
Bioclasts
%
Others
%
Classification
Dunham [73]Folk [96]
ZC12295632Muscovite 1%,
Zircon (Trace)
MudstoneBiomicrite
ZC11634281Hematite 1%,
Muscovite 3%
MudstoneBiomicrite
ZC10414512Hematite 2%,
Muscovite (Trace)
MudstoneBiomicrite
BioclastsMicriteSpar
ZC9314326------PackstoneBiomicrite
ZC8197710------WackstoneBiomicrite
ZC7196120------WackstoneBiomicrite
ZC673189------PackstoneBiomicrite
ZC5143650------PackstoneBiosparite
ZC4491635Hematite (Trace)WackstoneBiosparite
ZC355936------PackstoneBiosparite
ZC2431437Hematite 1%PackstoneBiosparite
ZC1511911Hematite 5%PackstoneBiomicrite
Publisher’s Note: MDPI stays neutral with regard to jurisdictional claims in published maps and institutional affiliations.

