Article

A Systematic Study on Berthing Capacity Assessment of Sanya Yazhou Fishing Port by Typhoon Prediction Model

1
College of Engineering, Ocean University of China, Qingdao 266100, China
2
Shandong Provincial Key Laboratory of Ocean Engineering, Ocean University of China, Qingdao 266100, China
*
Author to whom correspondence should be addressed.
J. Mar. Sci. Eng. 2021, 9(12), 1380; https://doi.org/10.3390/jmse9121380
Submission received: 2 November 2021 / Revised: 26 November 2021 / Accepted: 1 December 2021 / Published: 4 December 2021
(This article belongs to the Section Ocean Engineering)

Abstract

:
This paper sheds light on the effect of combination modes on the evaluation of berthing capacity for Sanya Yazhou Fishing Port (SYFP) under hypothetical typhoon conditions. By statistically analysing the maximum probability of moving speeds and directions of historical typhoons passing through the fishing port, the representative typhoon path was determined with the nonparametric regression method. The designed typhoon wind fields of levels 12–17 were generated based on Holland’s parametric wind model. Then, the MIKE 21 BW model was used to obtain the high-precision wave distribution in the fishing port. The boundary conditions (significant wave height and peak period) of the MIKE 21 BW model were calculated by combining the MIKE 21 SW model with the designed typhoon wind fields. In SYFP, ships usually adopt the modes of multi-ship side-by-side and single anchor mooring during typhoons. In fair weather, approximately 158 vessels can be berthed if they are all large ones, while approximately 735 vessels can be moored if they are all small ones. However, with an increase in typhoon levels, the anchoring area for small vessels decreases. From the perspective of wave distribution in the fishing port, the number of large vessels moored was hardly affected by typhoons. This can be attributed to the breakwater, which significantly decreases the large wave height in the fishing port. Finally, a study on the framework of a method for hazard assessment of berthing capacity in the coming typhoon-driven storm waves was set up.

1. Introduction

Typhoons are very severe natural disasters that can pose a serious threat to harbours [1,2]. A steady sea condition is a decisive factor for the management of berthed vessels in fishing ports [3,4,5]. Therefore, to ensure the safety of fishing ports and reduce the risk of typhoon disasters to the greatest extent, it is necessary to evaluate the berthing capacity of fishing ports [6,7,8]. There are several methods for studying the berthing capacity in fishing ports under typhoon fields [1,9,10,11]. This study focuses on Sanya Yazhou Fishing Port (SYFP) as an example to establish a comprehensive evaluation system for the berthing capacity of fishing ports. Two primary components are used for this evaluation: the typhoon wind model and the wave model.
Typhoon wind fields, in particular, are important input parameters of the wave model, which can be simulated with different typhoon models [12]. Aside from this, the quality of the wind fields and historical climate are two important factors that affect the accuracy of the wave model [3,13]. In the past several decades, numerous wind models have been developed to hindcast and forecast typhoon surface wind fields [14]. Numerical simulations of hydrodynamics caused by typhoons and storms have been applied to the study of extreme hydrometeorology [6]. Holland developed a popular scheme, which has been used extensively for reconstructing typhoon wind fields in a wide range of applications [15]. Furthermore, an updated version of this approach was presented, which has less sensitivity to data errors and reproduces typhoon wind profiles with high temporal and spatial resolution [16].
In addition, a suitable wave model is a vital part of the evaluation of berthing capacity, which can in turn shape government policies, corporate budgets, and spending decisions [17]. Both the MIKE 21 SW model and tide-surge-wave coupled model have been applied to simulate the wave fields in many areas [18,19]. Hsiao demonstrated that the simulations of the maximum significant wave height have almost no discrepancies in the spatial distribution or the magnitude between the fully coupled and decoupled models [20]. The MIKE 21 SW model based on wave action balance equations is popular for simulating the wave distribution in large areas. In contrast, when considering a harbour shielded by a breakwater or artificial islands, the BW model of the enhanced Boussinesq-type equations is more suitable, as it can simulate the propagation of directional wave trains travelling from deep to shallow water [21,22]. Wang et al. used the MIKE 21 BW model to calculate the wave height distribution behind the breakwater in the Xiaoguoju fishing port project [23]. Further, Gou et al. studied the wave height distribution and berthing stability of different breakwater panning schemes to optimise the layout of the breakwater with the BW model [24].
By using the statistical results of the historical typhoon paths and the nearest record points from the historical typhoon paths to SYFP, this study used Holland’s model to generate hypothetical designed typhoon wind fields of different levels. In light of this, the wave distribution of the model can be affected by the model itself. To study the evolution process of a given wave under hypothetical typhoons in SYFP, a high-precision BW model was established. This was used to calculate the generation, evolution, reflection, refraction, and diffraction of waves in SYFP combined with the MIKE 21 SW mode. This research is a systematic study on typhoon prevention assessment of SYFP and can be of great significance for formulating reasonable wind shelter measures.

2. Materials and Methods

To study the effect of typhoons on wave distribution in the fishing port, numerical models of different scales were built. In the large-scale model, the wind field generated by the Holland model drives the MIKE 21 SW model (a spectrum wave model) to calculate the wind waves. As boundary conditions for the MIKE 21 BW model (a Boussinesq wave model) are small scale, the calculated wave characteristics were used to obtain the wave distribution in the fishing port. A flowchart of the proposed method is shown in Figure 1.

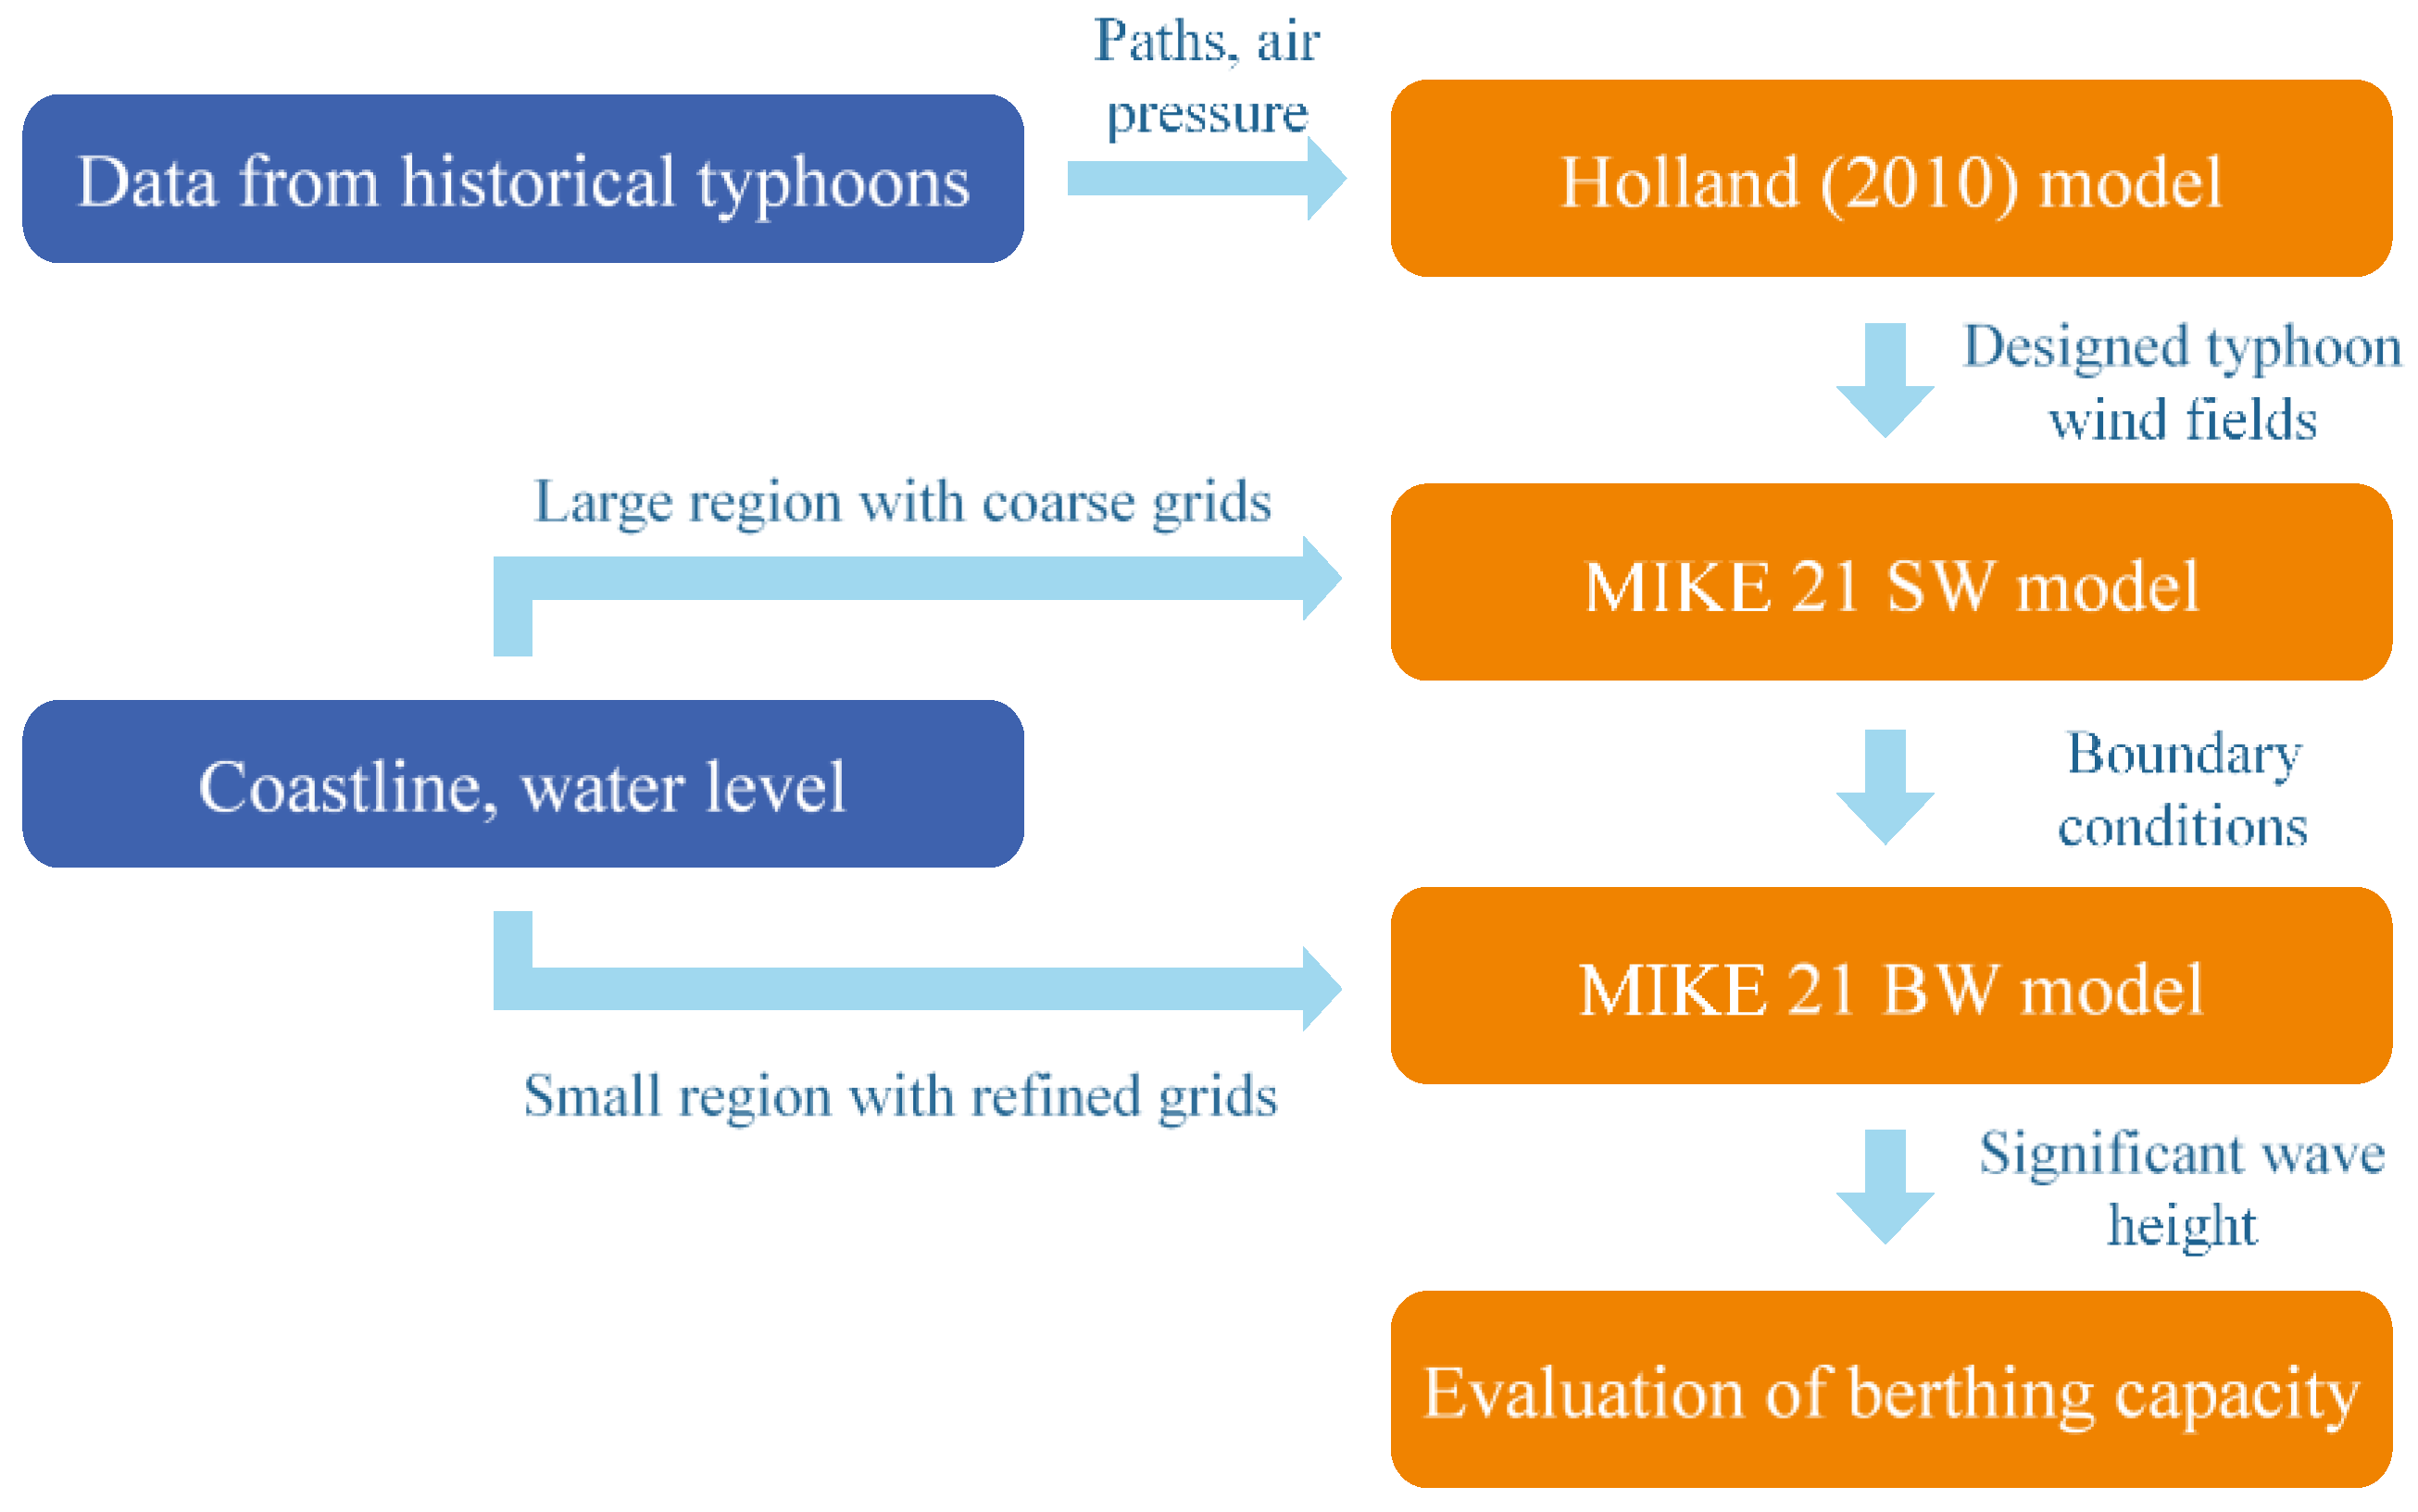
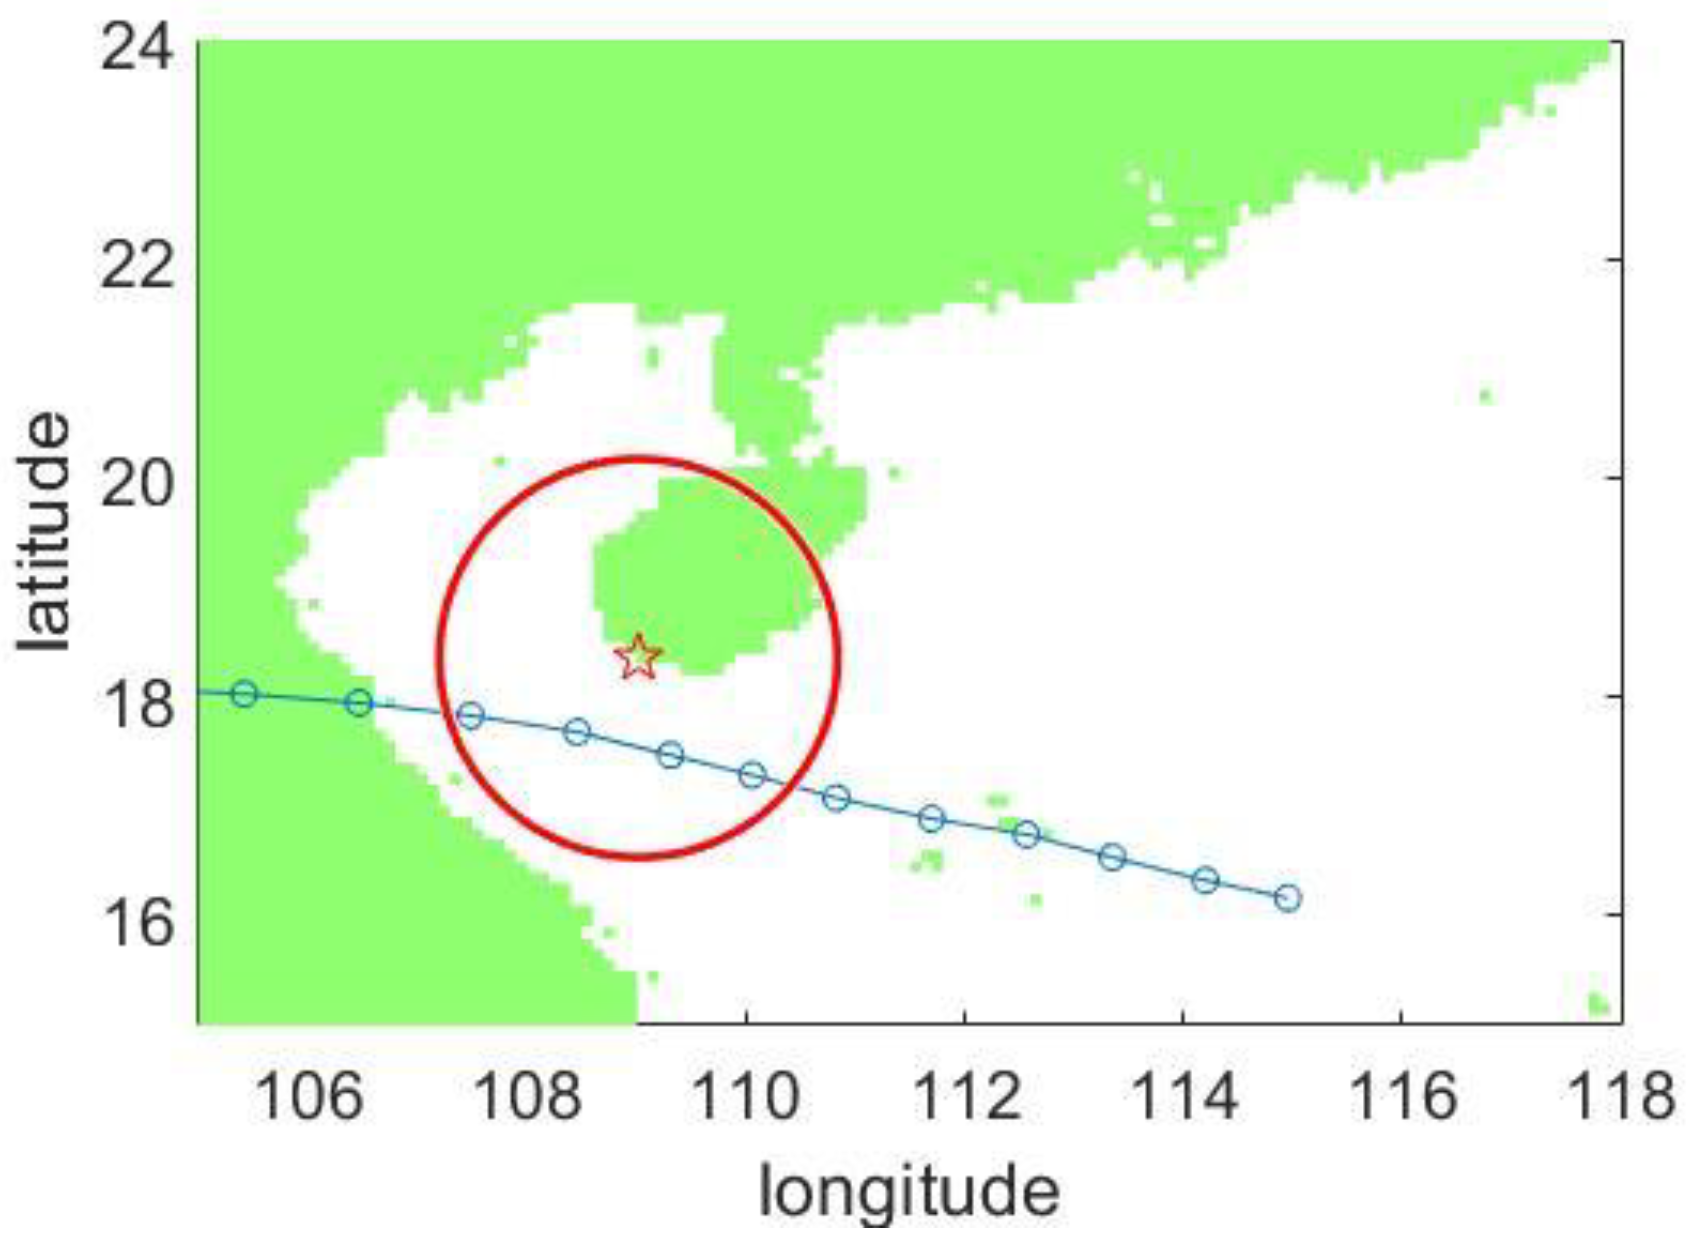
2.1. Wind Field Model

According to Holland’s parametric approach, the surface wind speed with a height of 10 m can be calculated using the following formula [16]:
V H = v m s { ( R m r ) b s exp [ 1 ( R m r ) b s ] } x
where v m s is the maximum wind, R m is the radius of the maximum winds, and r is the distance between the cyclone centre and the calculating point (km). b s is a scaling parameter related to the proportion of the pressure gradient near the maximum wind radius. Alternatively, the maximum wind speed for a given pressure drop can be estimated as follows:
b s = 4.4 × 10 5 Δ p s 2 + 0.01 Δ p s + 0.03 p c s t 0.014 φ + 0.15 v f x + 1.0
x = 0.6 ( 1 Δ p s 215 ) ,
v m s = ( 100 b s ρ m s e Δ p s ) 0.5 ,
where Δ p s is the pressure drop from a defined external pressure to the cyclone centre, and p c s / t is the intensity change per hour. v f is the moving speed of the cyclone, ρ m s is the density of air, and φ is the absolute value of latitude in degrees. Typhoon parameters Δ p s and v f can be obtained from the China Meteorological Administration tropical cyclone database (CMA dataset) [25]. R m can be calculated using the following formula [26]:
R m = 28.52 tanh [ 0.0873 ( φ 28 ) ] + 12.22 exp ( Δ p s 33.86 ) + 0.2 v f + 37.22
The asymmetric parametric wind model is calculated using the following formula [27]:
V ( r , θ ) = V g ( r ) + ε V g ( r ) sin ( θ + α )
where V ( r , θ ) denotes the asymmetric tangential wind field. ε represents the degree of asymmetry and α represents the azimuth that controls the location of the maximum wind speed. In this study, ε = V f / v g m , where v g m is the maximum wind speed of the gradient wind.

2.2. Wave Models

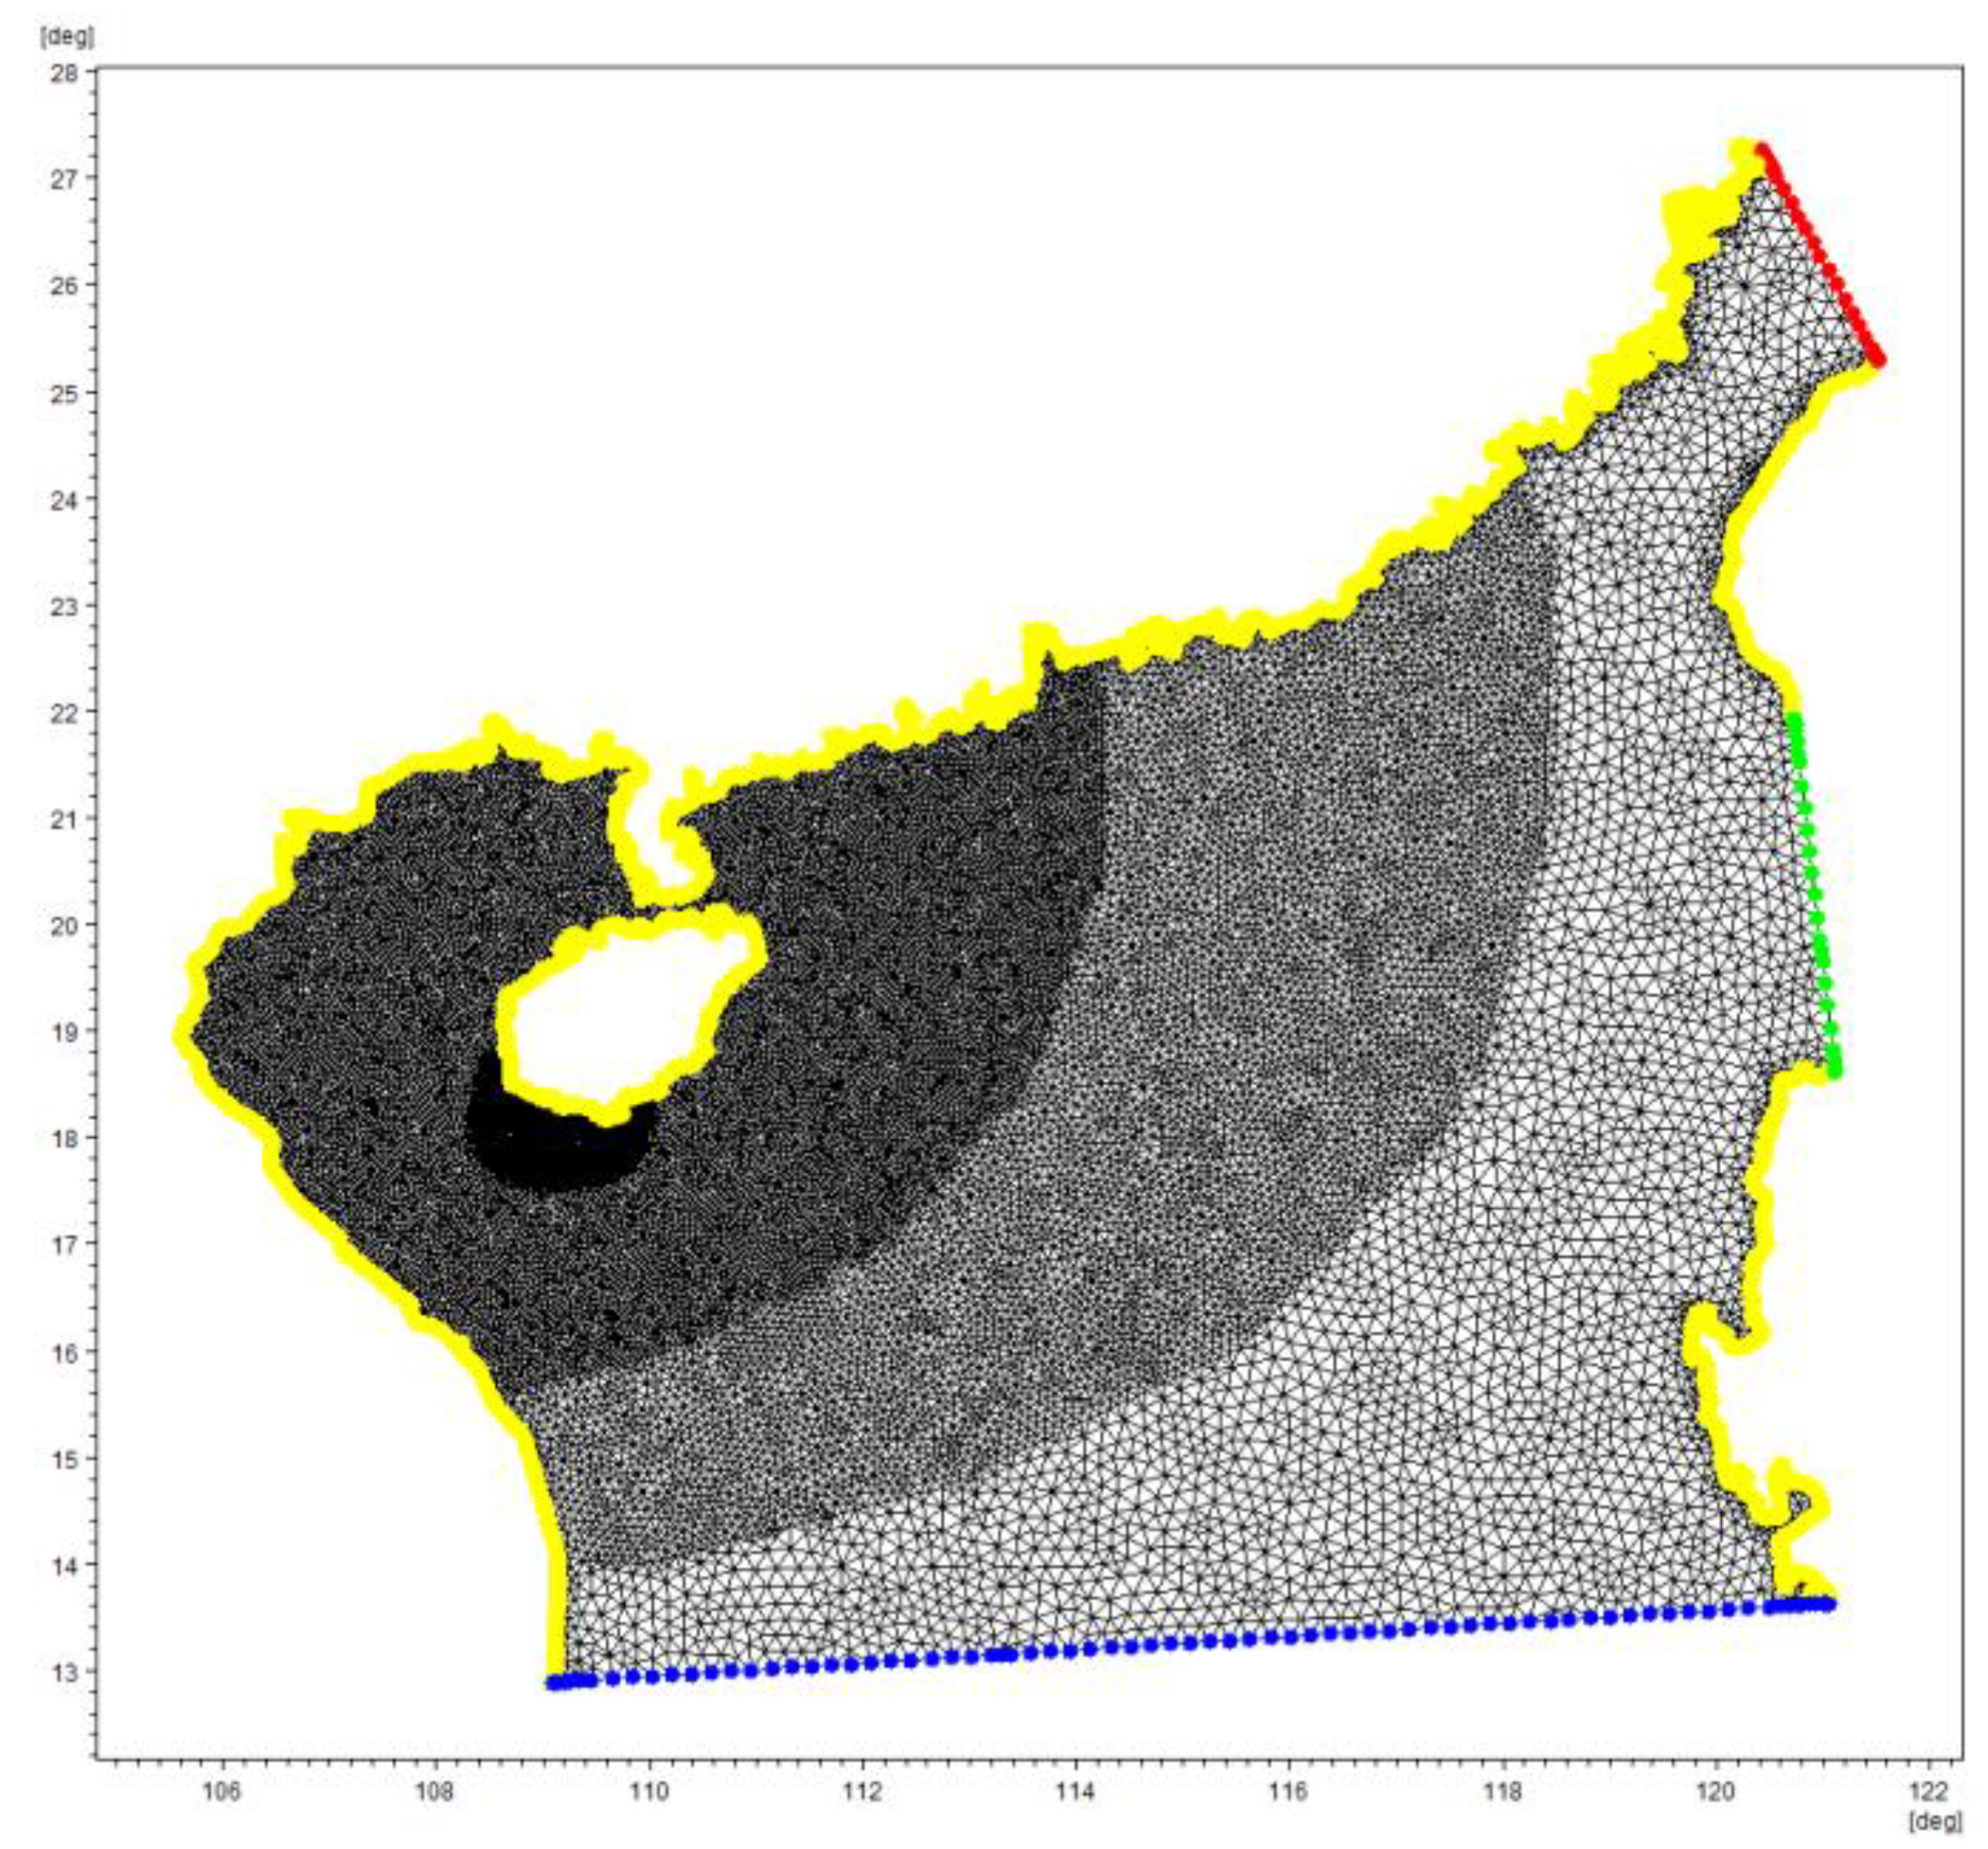
2.2.1. MIKE 21 SW Model

In horizontal Cartesian coordinates, the conservation equation for wave action can be written as:
t N + x c x N + y c y N + σ c σ N + θ c θ N = S σ ,
where N is the action density. c x , c y , c σ , and c θ are the propagation velocities of action in geographical ( x , y ) space, relative frequency, and wave propagation direction space dimensions, respectively. S is the source term of the energy density.
Here, S represents the superposition of source functions describing various physical phenomena:
S = S i n + S n 1 + S d s + S b o t + S s u r f
where S i n represents the generation of energy by wind, S n 1 is the wave energy transfer due to nonlinear wave-wave interaction, S d s is the dissipation of wave energy due to white capping, S b o t is the dissipation due to bottom friction, and S s u r f is the dissipation of wave energy due to depth-induced breaking.

2.2.2. MIKE 21 BW Model

The Boussinesq wave modules of MIKE 21 BW solve the enhanced Boussinesq equations [22]. These are expressed in one or two horizontal dimensions in terms of the free surface elevation ( ξ ), and the depth-integrated velocity components P and Q [22].
The Boussinesq equations read:
Continuity equation:
n ξ t + P x + Q y = 0
Momentum equations in the horizontal direction:
p t + x ( p 2 h ) + y ( p q h ) + g h ξ x + g p 2 h 2 + q 2 h 2 p h c 2 E ( 2 p x 2 + 2 p y 2 ) = 1 3 D h ( 3 p x 2 t + 3 q x y t )
q t + y ( q 2 h ) + x ( p q h ) + g h ξ y + g p 2 h 2 + q 2 h 2 q h c 2 E ( 2 q x 2 + 2 q y 2 ) = 1 3 D h ( 3 q y 2 t + 3 p x y t ) ξ
where ξ is the free surface elevation; p and q are flux densities in the directions x and y , respectively; h is the total water depth; D is the averaged water depth; and c is the Chezy resistance number, c = M h 1 / 6 . In this study, M is the Manning coefficient, which is taken as 32 m 1 / 3 / s . Finally, E is the turbulence coefficient, and g is the gravitational acceleration.

2.3. Assessment of the Berthing Quantity of the Fishing Port

To evaluate the berthing capacity of SYFP under the influence of the designed typhoons, single anchor mooring and multiple vessels side-by-side with a single anchor mooring are used in SYFP for evaluation according to the “Master Design Code of Fishery Port (SC/T 9010-2000, 2000)” [28].

2.3.1. Single Anchor Mooring

This method was applied to the anchoring of fishing vessels in wind sheltering. The mooring area is a circular area with radius R, which can be calculated as follows:
R = ( 5 ~ 6 ) h 3 + L c
where R is the mooring radius, h 3 is the water depth of the anchorage at an extremely high water level, and L c is the full length of the representing designed vessel.

2.3.2. Multiple Vessels Abreast with a Single Anchor

This method applies to anchoring when the wind direction and water level in the harbour are stable. The anchorage area can be calculated as follows:
F 1 = ( 1.5 L c + 6 h 3 ) ( 1 + m 2 ) B c
where F 1 is the mooring area of each group with multiple vessels side-by-side and single anchor mooring; m 2 is the number of corresponding fishing vessels in each group, which can be taken as 2–6, where a small value is taken for the large vessels, while the large value for the small ones; lastly, B c represents the full width of the designed vessel type.
The number of berthed vessels in the harbour basin were estimated in combination with the type of representative vessels in accordance with Equations (12) and (13).

3. Results and Discussion

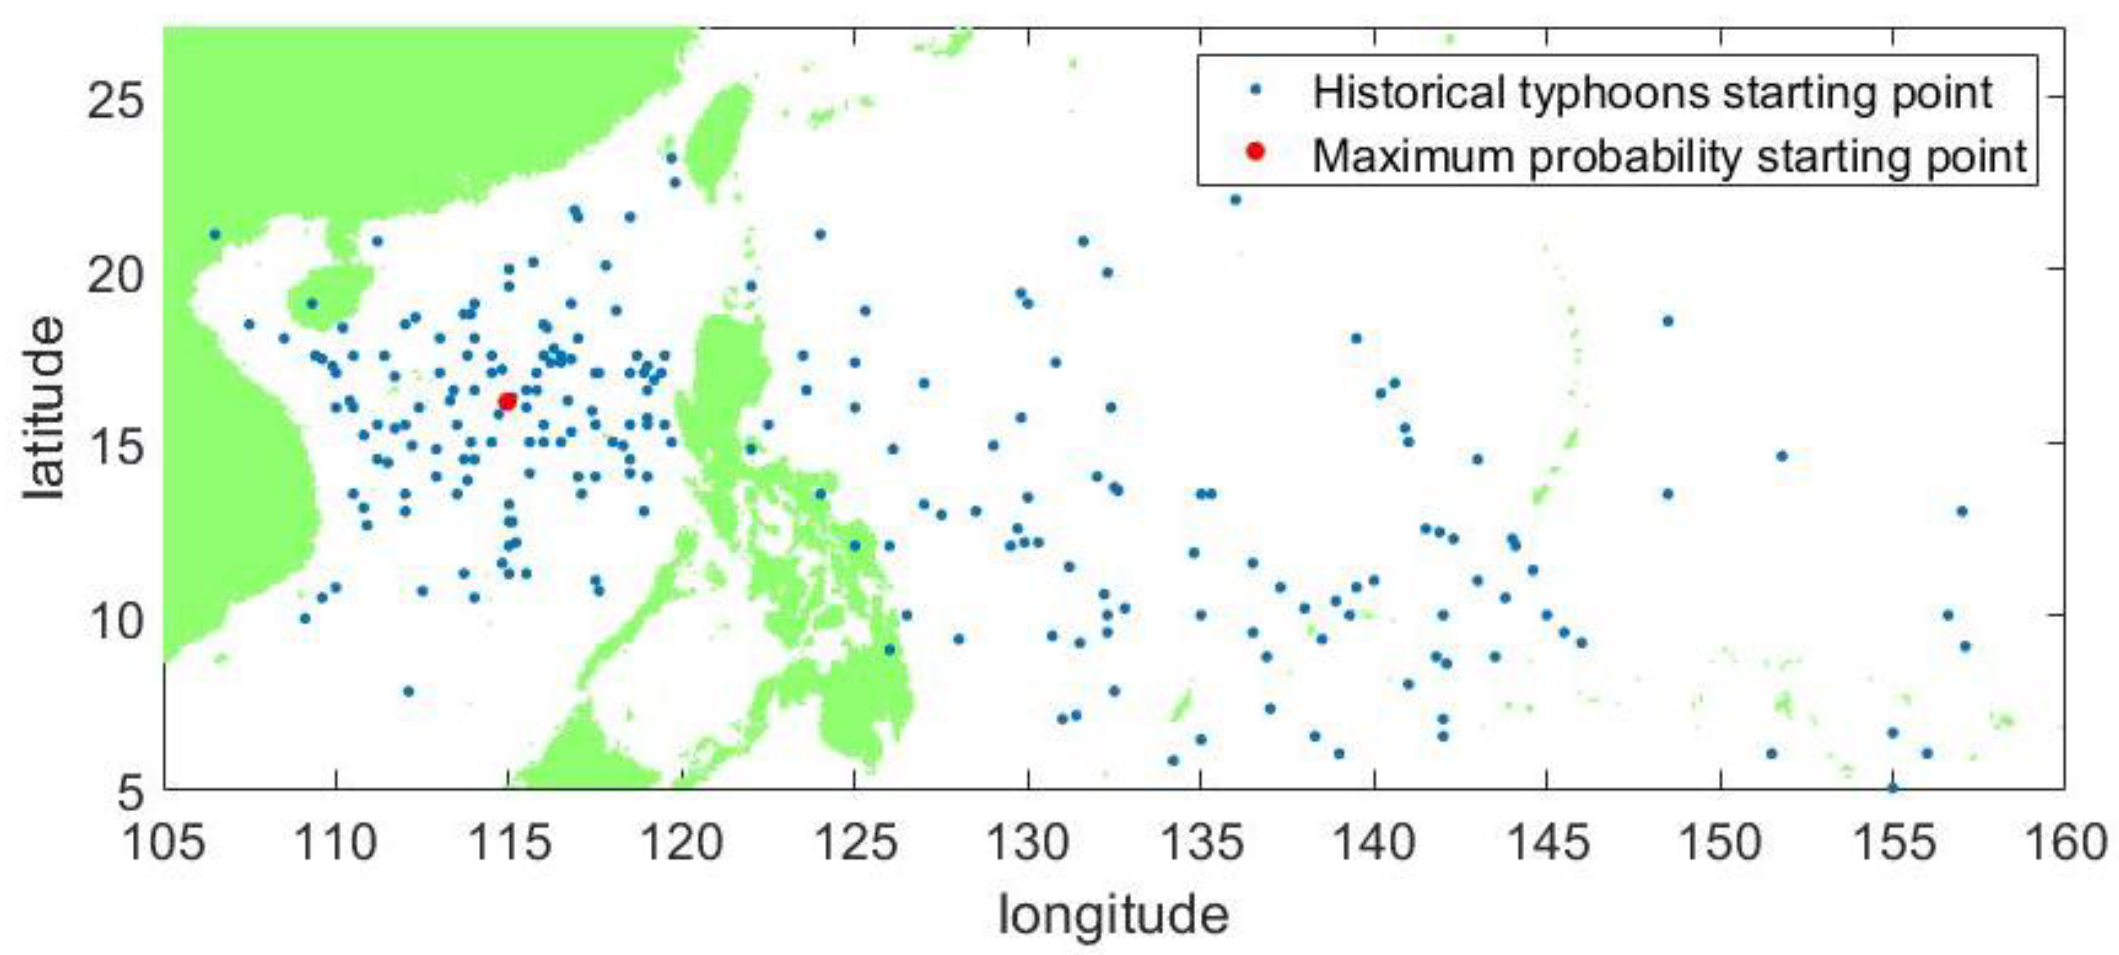
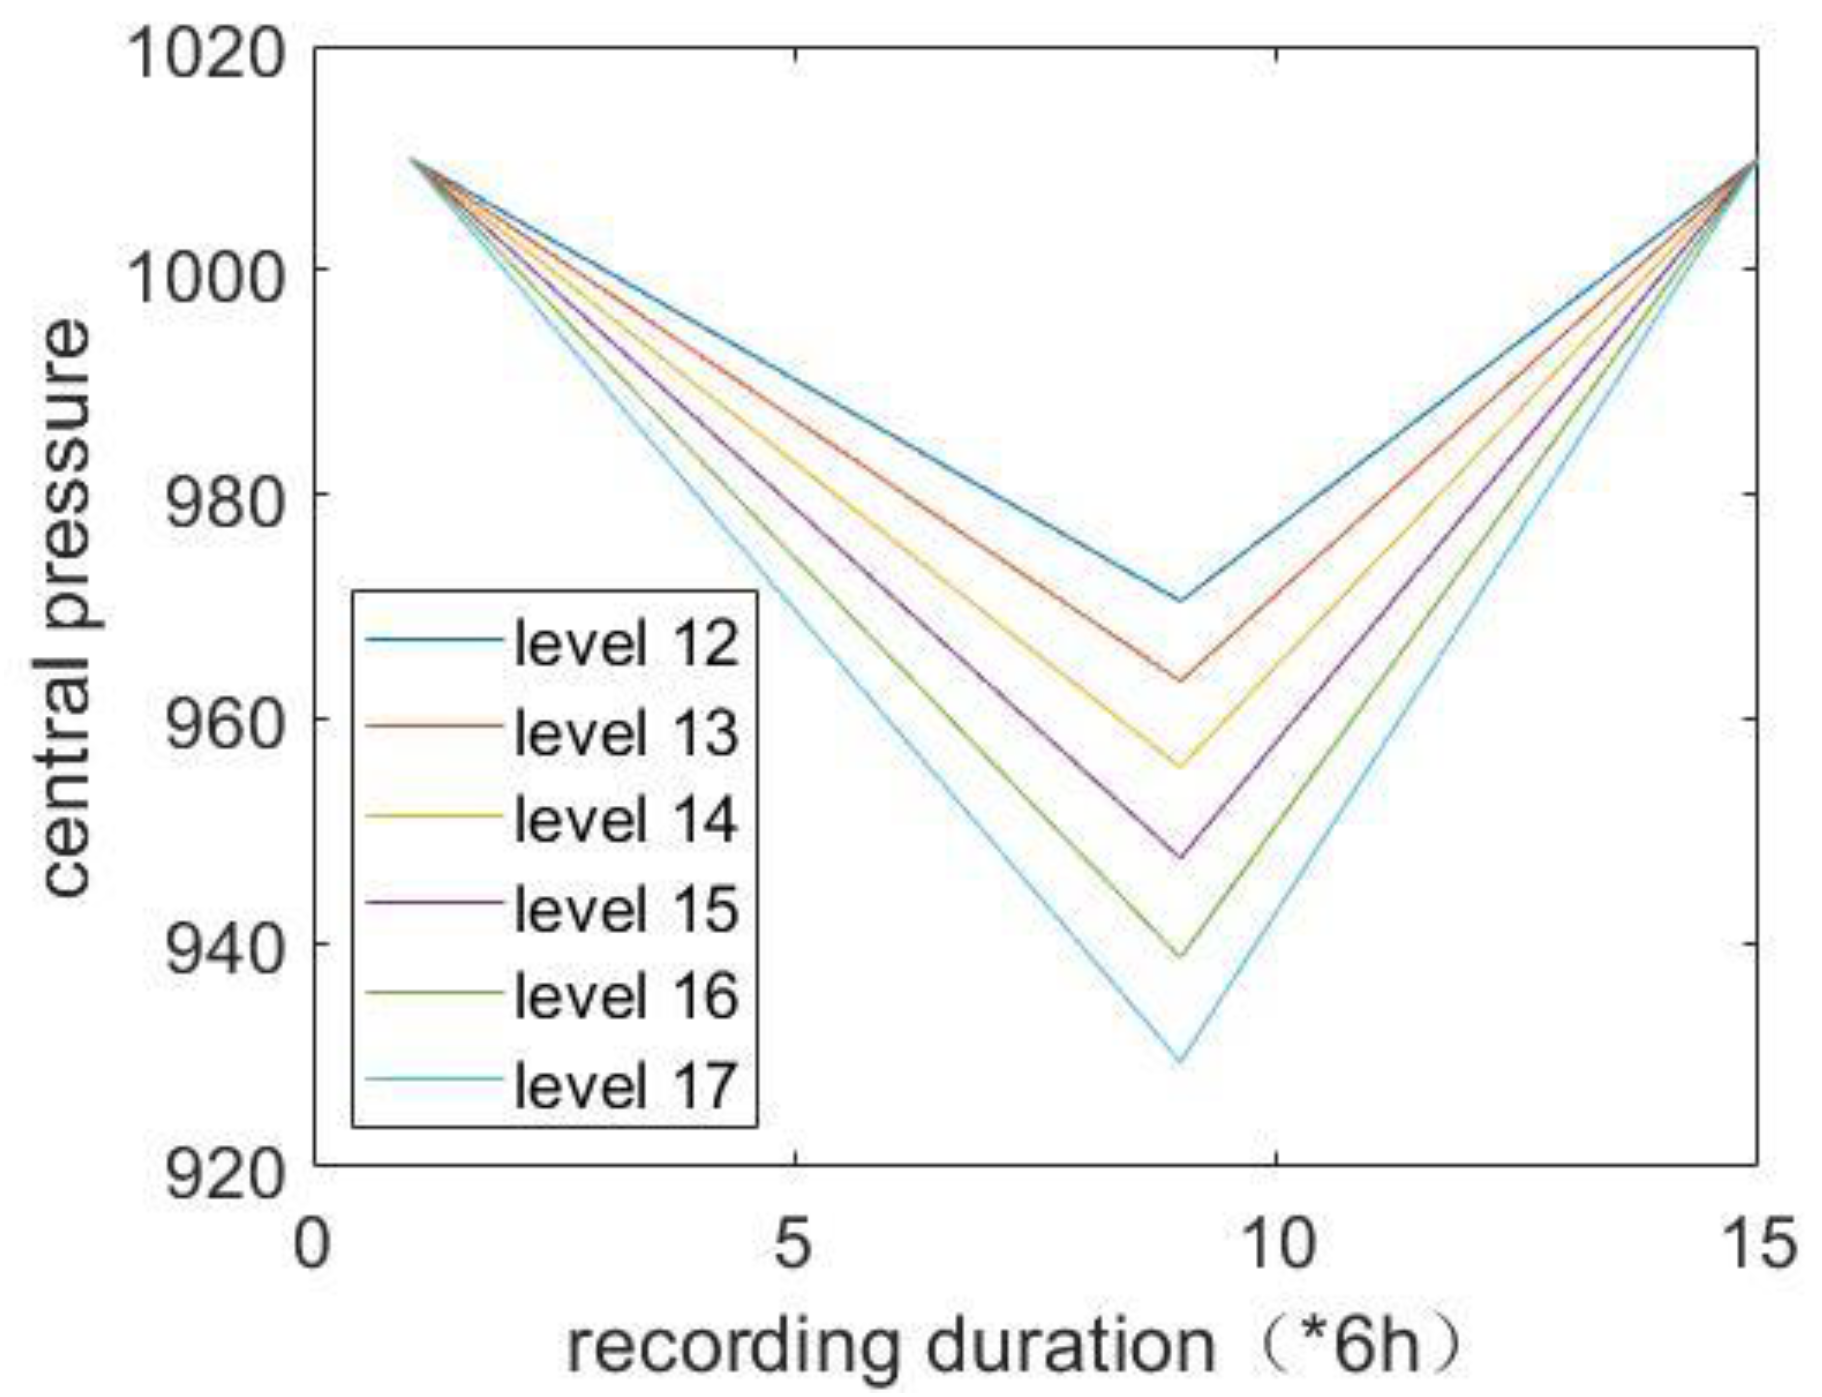
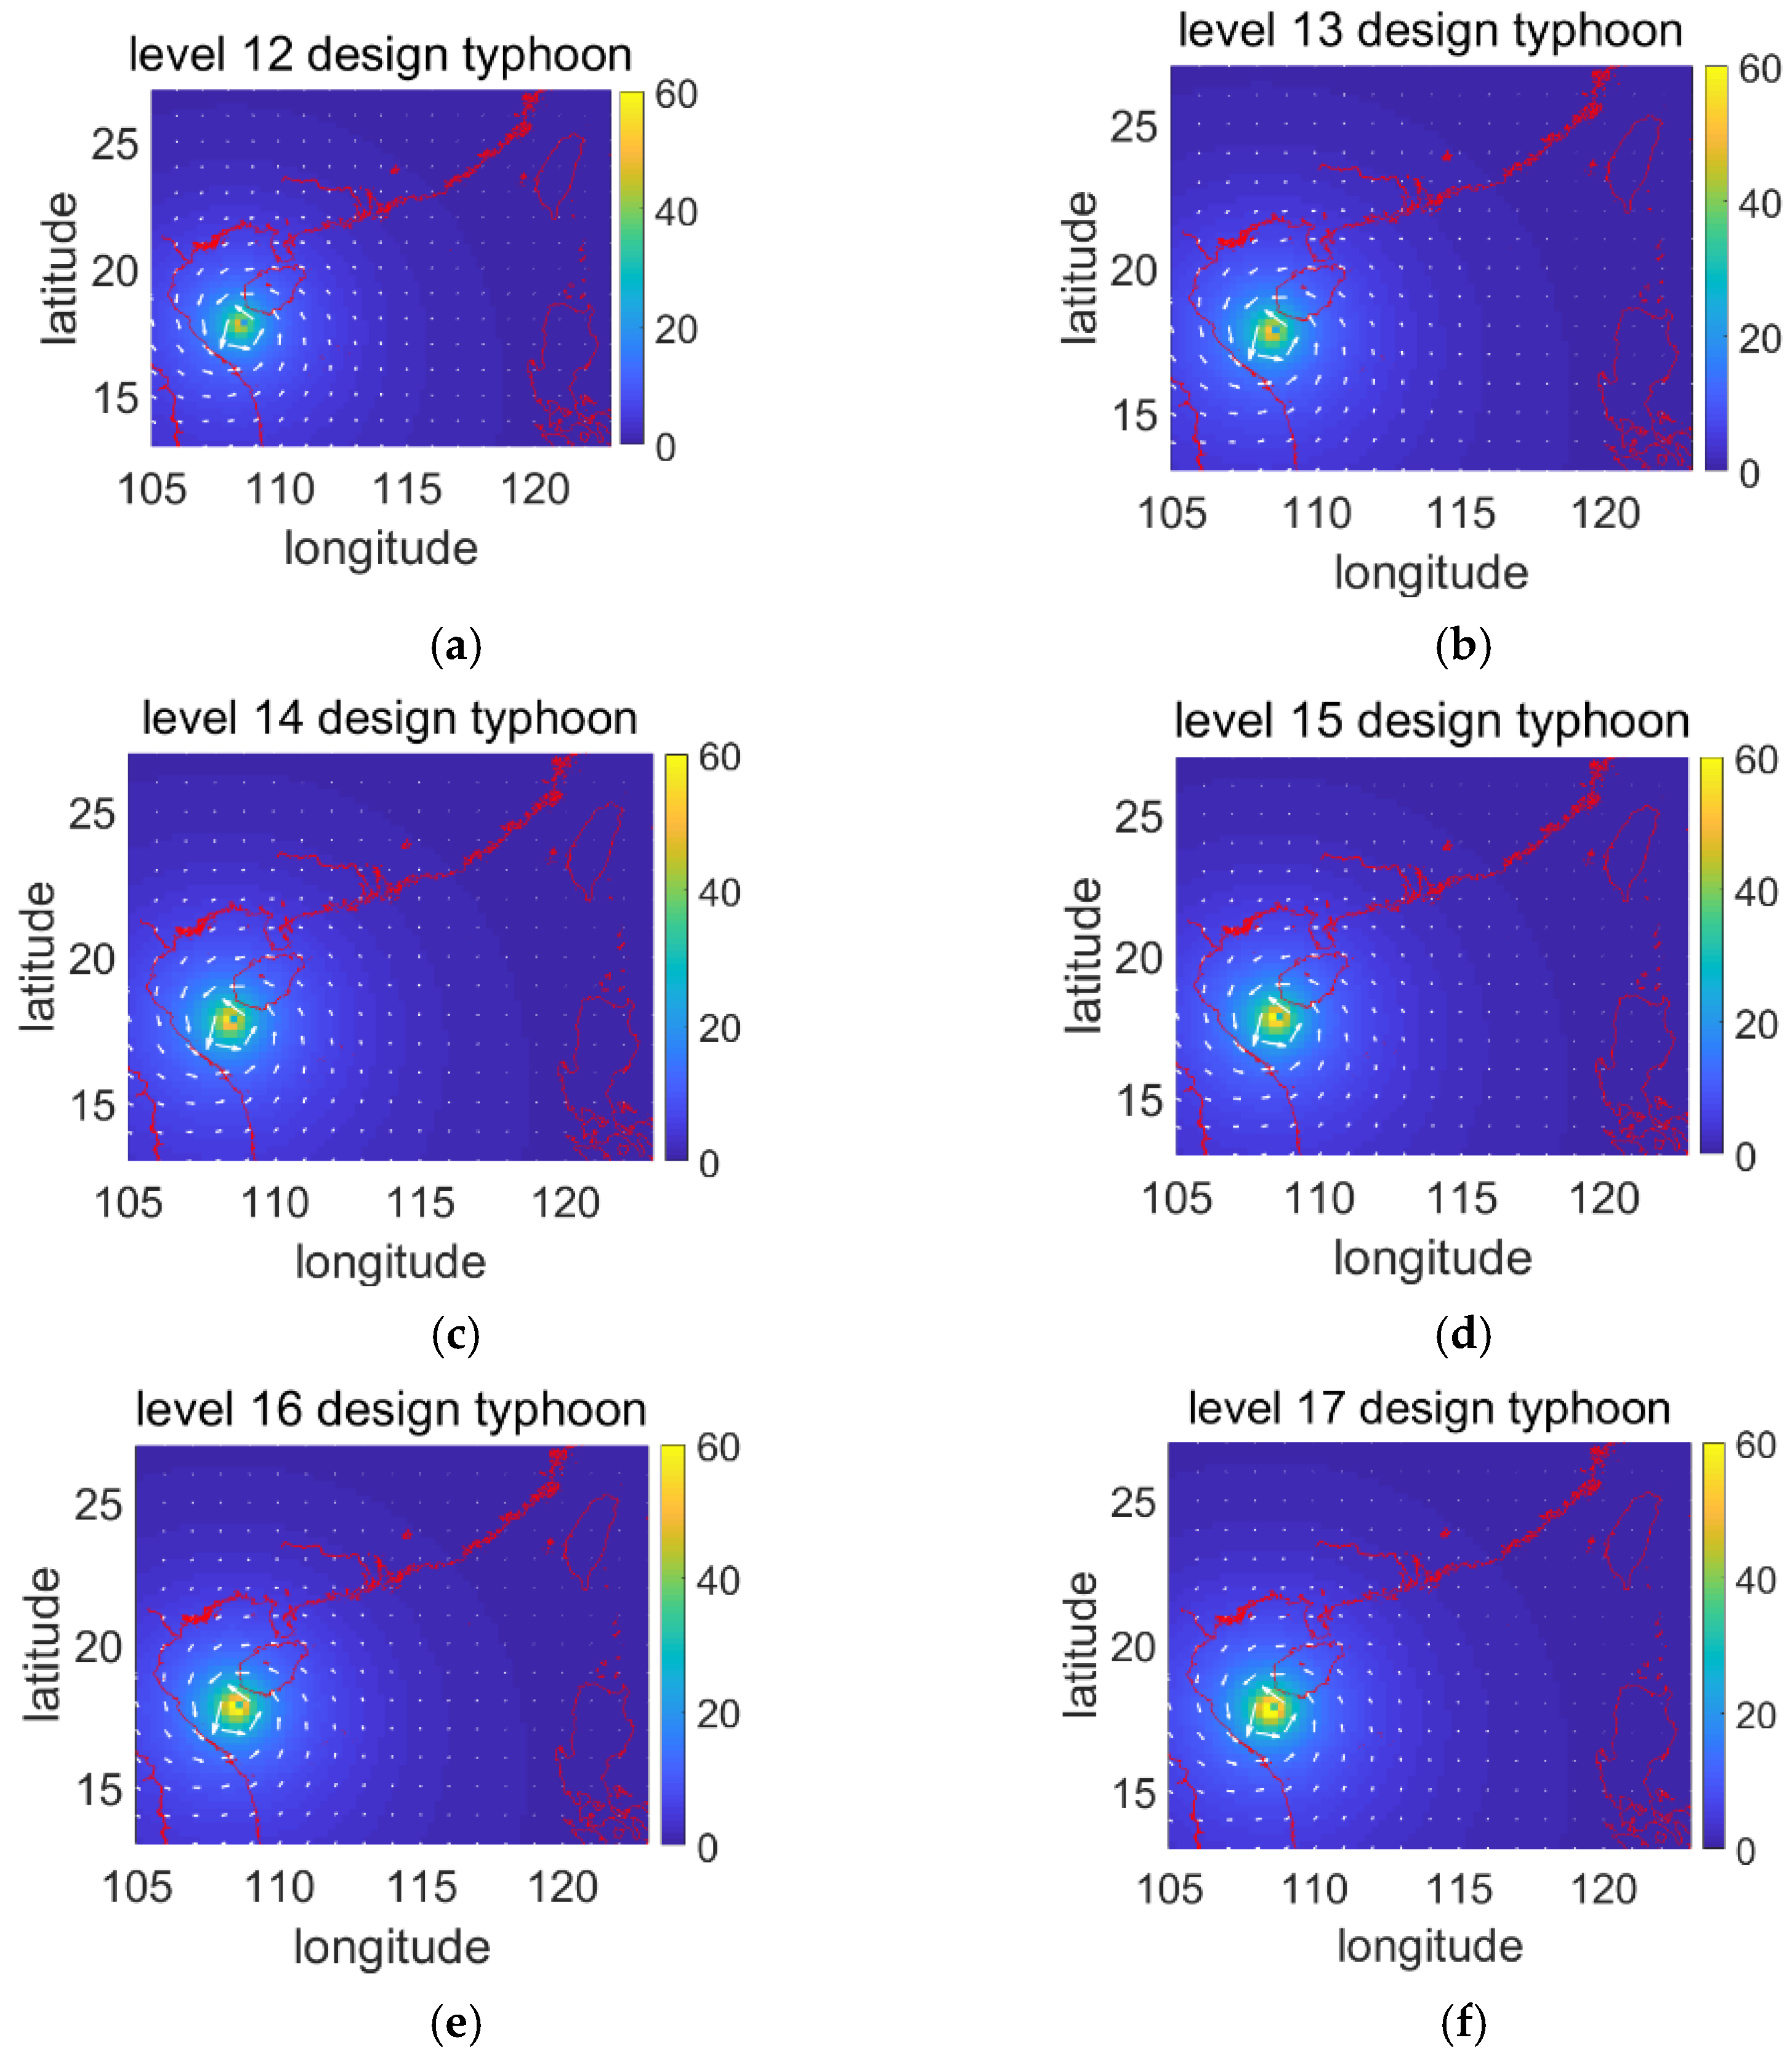
3.1. Wind Field Model

To obtain the representative designed typhoons, the typhoon paths with the maximum probability were determined based on the historical data of typhoons that passed through SYFP.
Firstly, the most likely starting point of the designed typhoon was determined. As shown in Figure 2, the blue dots indicate the starting points of typhoons within 200 km of SYFP. These are relatively scattered between the easternmost point, approaching 160° E, and the westernmost end close to the Indo-China Peninsula. Further, there are fewer points to the east of the Philippines and more points in the South China Sea.
The nonparametric regression method was used to calculate the position with the highest density of the starting points. Consider X 1 , X 2 , , X n as the sample from the population, and the kernel density estimate of the population density function as f ( x ) . At any point, x is defined as [29]:
f ^ h ( x ) = 1 n h i = 1 n K ( x X i h )
where K ( x X i h ) is the kernel function and h is the window width. When the population obeys N ( 0 , σ 2 ) , the distribution, and the function K ( x X i h ) is a Gaussian kernel function, the optimal window width is:
h ^ = 1.06 σ n 1 5
Therefore, as seen in Figure 2, the red point represents the starting point, whose latitude and longitude coordinates are 114.95° E, 16.17° N.
The motion of the typhoon is described in Figure 3. Consistent with the record of the CMA, the position and central pressure of the typhoons were recorded every 6 h. Therefore, the next location of the typhoon centre record point could be determined based on the distance and direction of the movement for 6 h. The method used in this study fit the 6-h distance and angle according to the historical data of the typhoons within 2° of the position. The maximum probability density was then calculated as the distance and direction of the point moving downward. Typhoons were terminated when the number of data points within 2° of the point was less than 10.
At the nearest record point in this port, different intensities of central air pressure were assigned, with the maximum wind speeds corresponding to level 12–17 typhoons, respectively. Both the central air pressures at the starting and ending points were set to 1010 hPa. It should be noted that the typhoon had the greatest impact on the study area when it was close to the fishing port, while the rest of the time it had less impact. Therefore, the nearest point from the port was set as the strongest point of the typhoon. The increase and decrease in typhoon intensity were then simplified to a linear change. The time–history curves of the central pressure of typhoons of different levels are shown in Figure 4.
Historical typhoon data in the study area suggests that typhoons below level 12 had little impact on the SYFP. Therefore, typhoons between levels 12 and 17 specified by the grade of tropical cyclones were taken as the designed typhoons for assessment, as shown in Figure 5a–f [30]. In the figure, the arrows indicate the wind direction, and the colours represent the wind speed.
An increase in typhoon levels leads to a gradual increase in the maximum wind speed. The maximum wind speeds of the level 12 and level 17 typhoons were 40 and approximately 60 m/s, respectively.

3.2. Verification

The MIKE 21 SW model combined with the designed typhoon wind field model was used to analyse the wave distribution near the SYFP. As shown in Figure 6, the computational domain must be sufficiently large to simulate waves generated by typhoons travelling long distances to SYFP [31].
Two historical typhoons, Typhoon Doksuri June in 2012 and Typhoon Kai-Tak in August in 2012, were selected for verification of the numerical models. Figure 7 shows the validation of the simulated and measured significant wave heights in the study area during the onset of typhoons Doksuri and Kai-Tak. The location that recorded the measured data of the two typhoons are ( 21.116 °   N , 112.617 °   E ) and ( 22.284 °   N , 115.592 °   E ). The simulated significant wave heights were in good agreement with the measured ones, indicating that the models were consistent with the actual situation. The SW model, therefore, provides a reasonable wave boundary for the next simulation calculation.

3.3. MIKE 21 BW Model

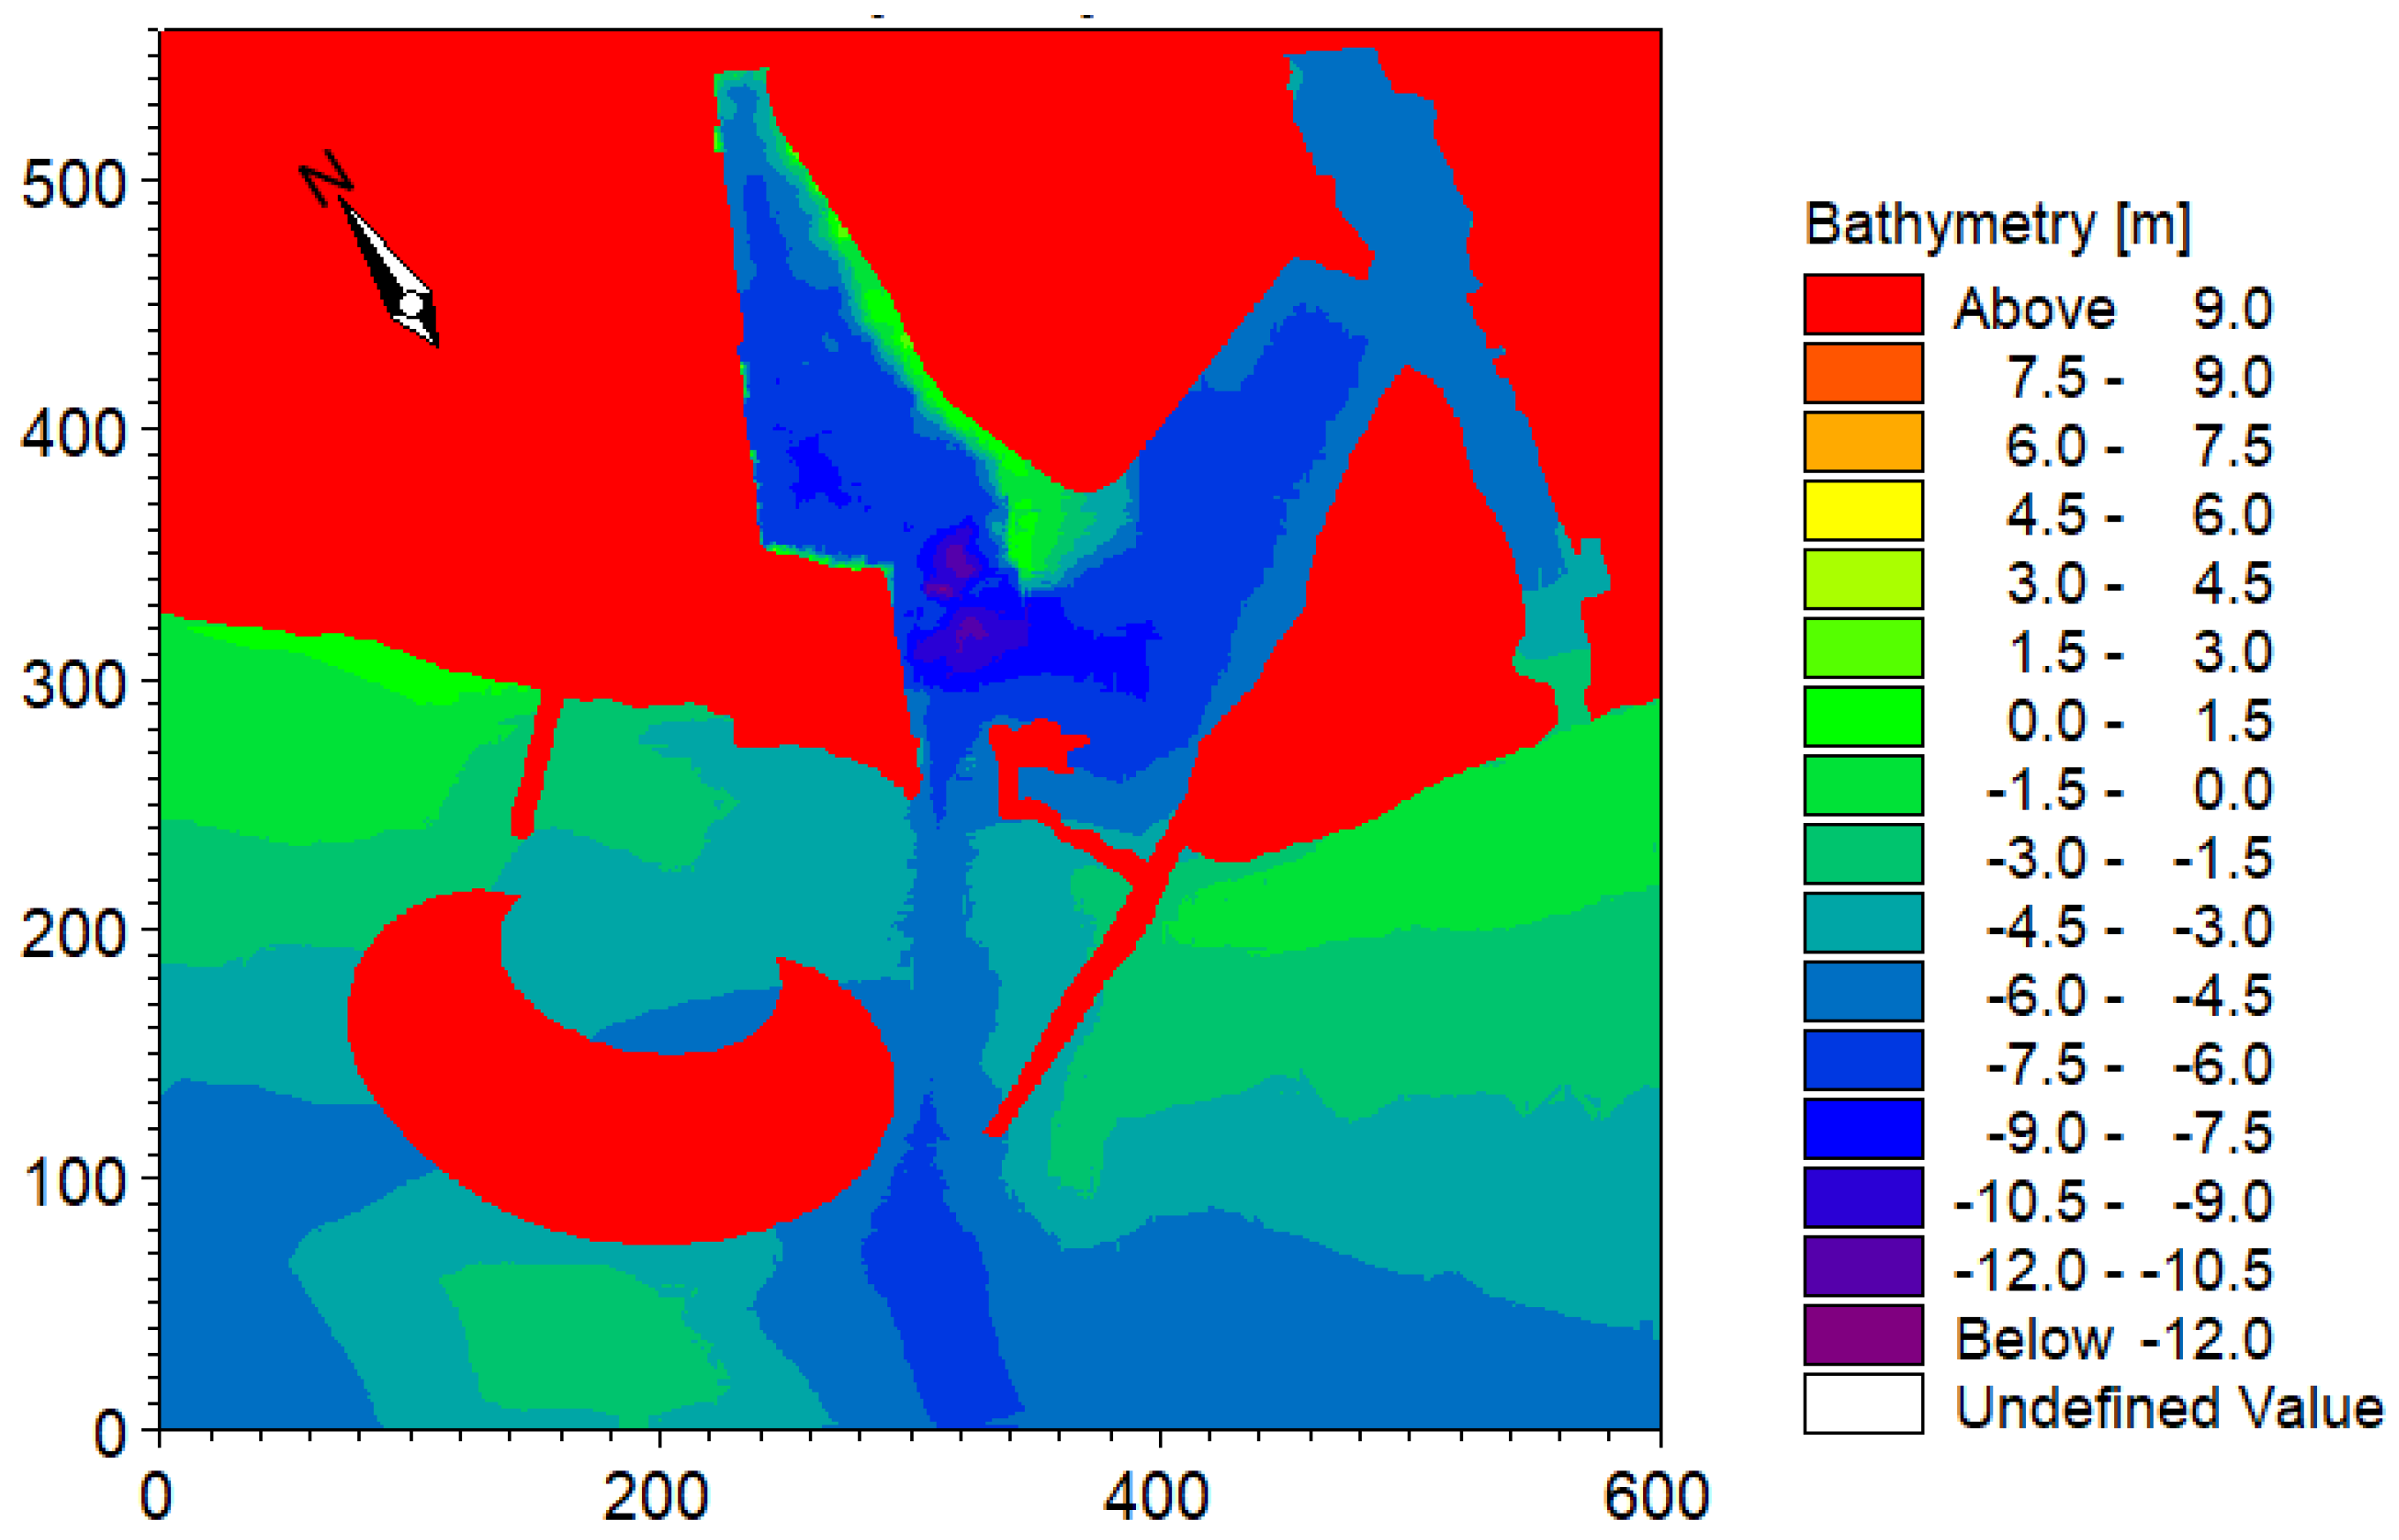
3.3.1. Setting of the Model

The range of the MIKE 21 BW model is shown in Figure 8. The water depth in the SYFP was obtained using a multi-beam sounding system in August 2017. The resolution of the measured water depth was approximately 10 m. For the purpose of this model, a structured rectangular grid was adopted. To obtain better simulation results, including the wave generation and evolution process in SYFP, the grid step was 10 m, as shown in Figure 9. There were 600 horizontal grids, 560 vertical grids, and 181,266 water grids.

3.3.2. Maximum Significant Wave Heights and Peak Wave Periods

The wave fields in large-scale areas were simulated using the SW model. The simulation results (including the maximum significant wave heights and peak wave periods) were obtained near the study area under the six designed typhoons. Then, the wave boundary conditions for the BW model of the six designed typhoons under the designed high water level were obtained, as shown in Table 1.

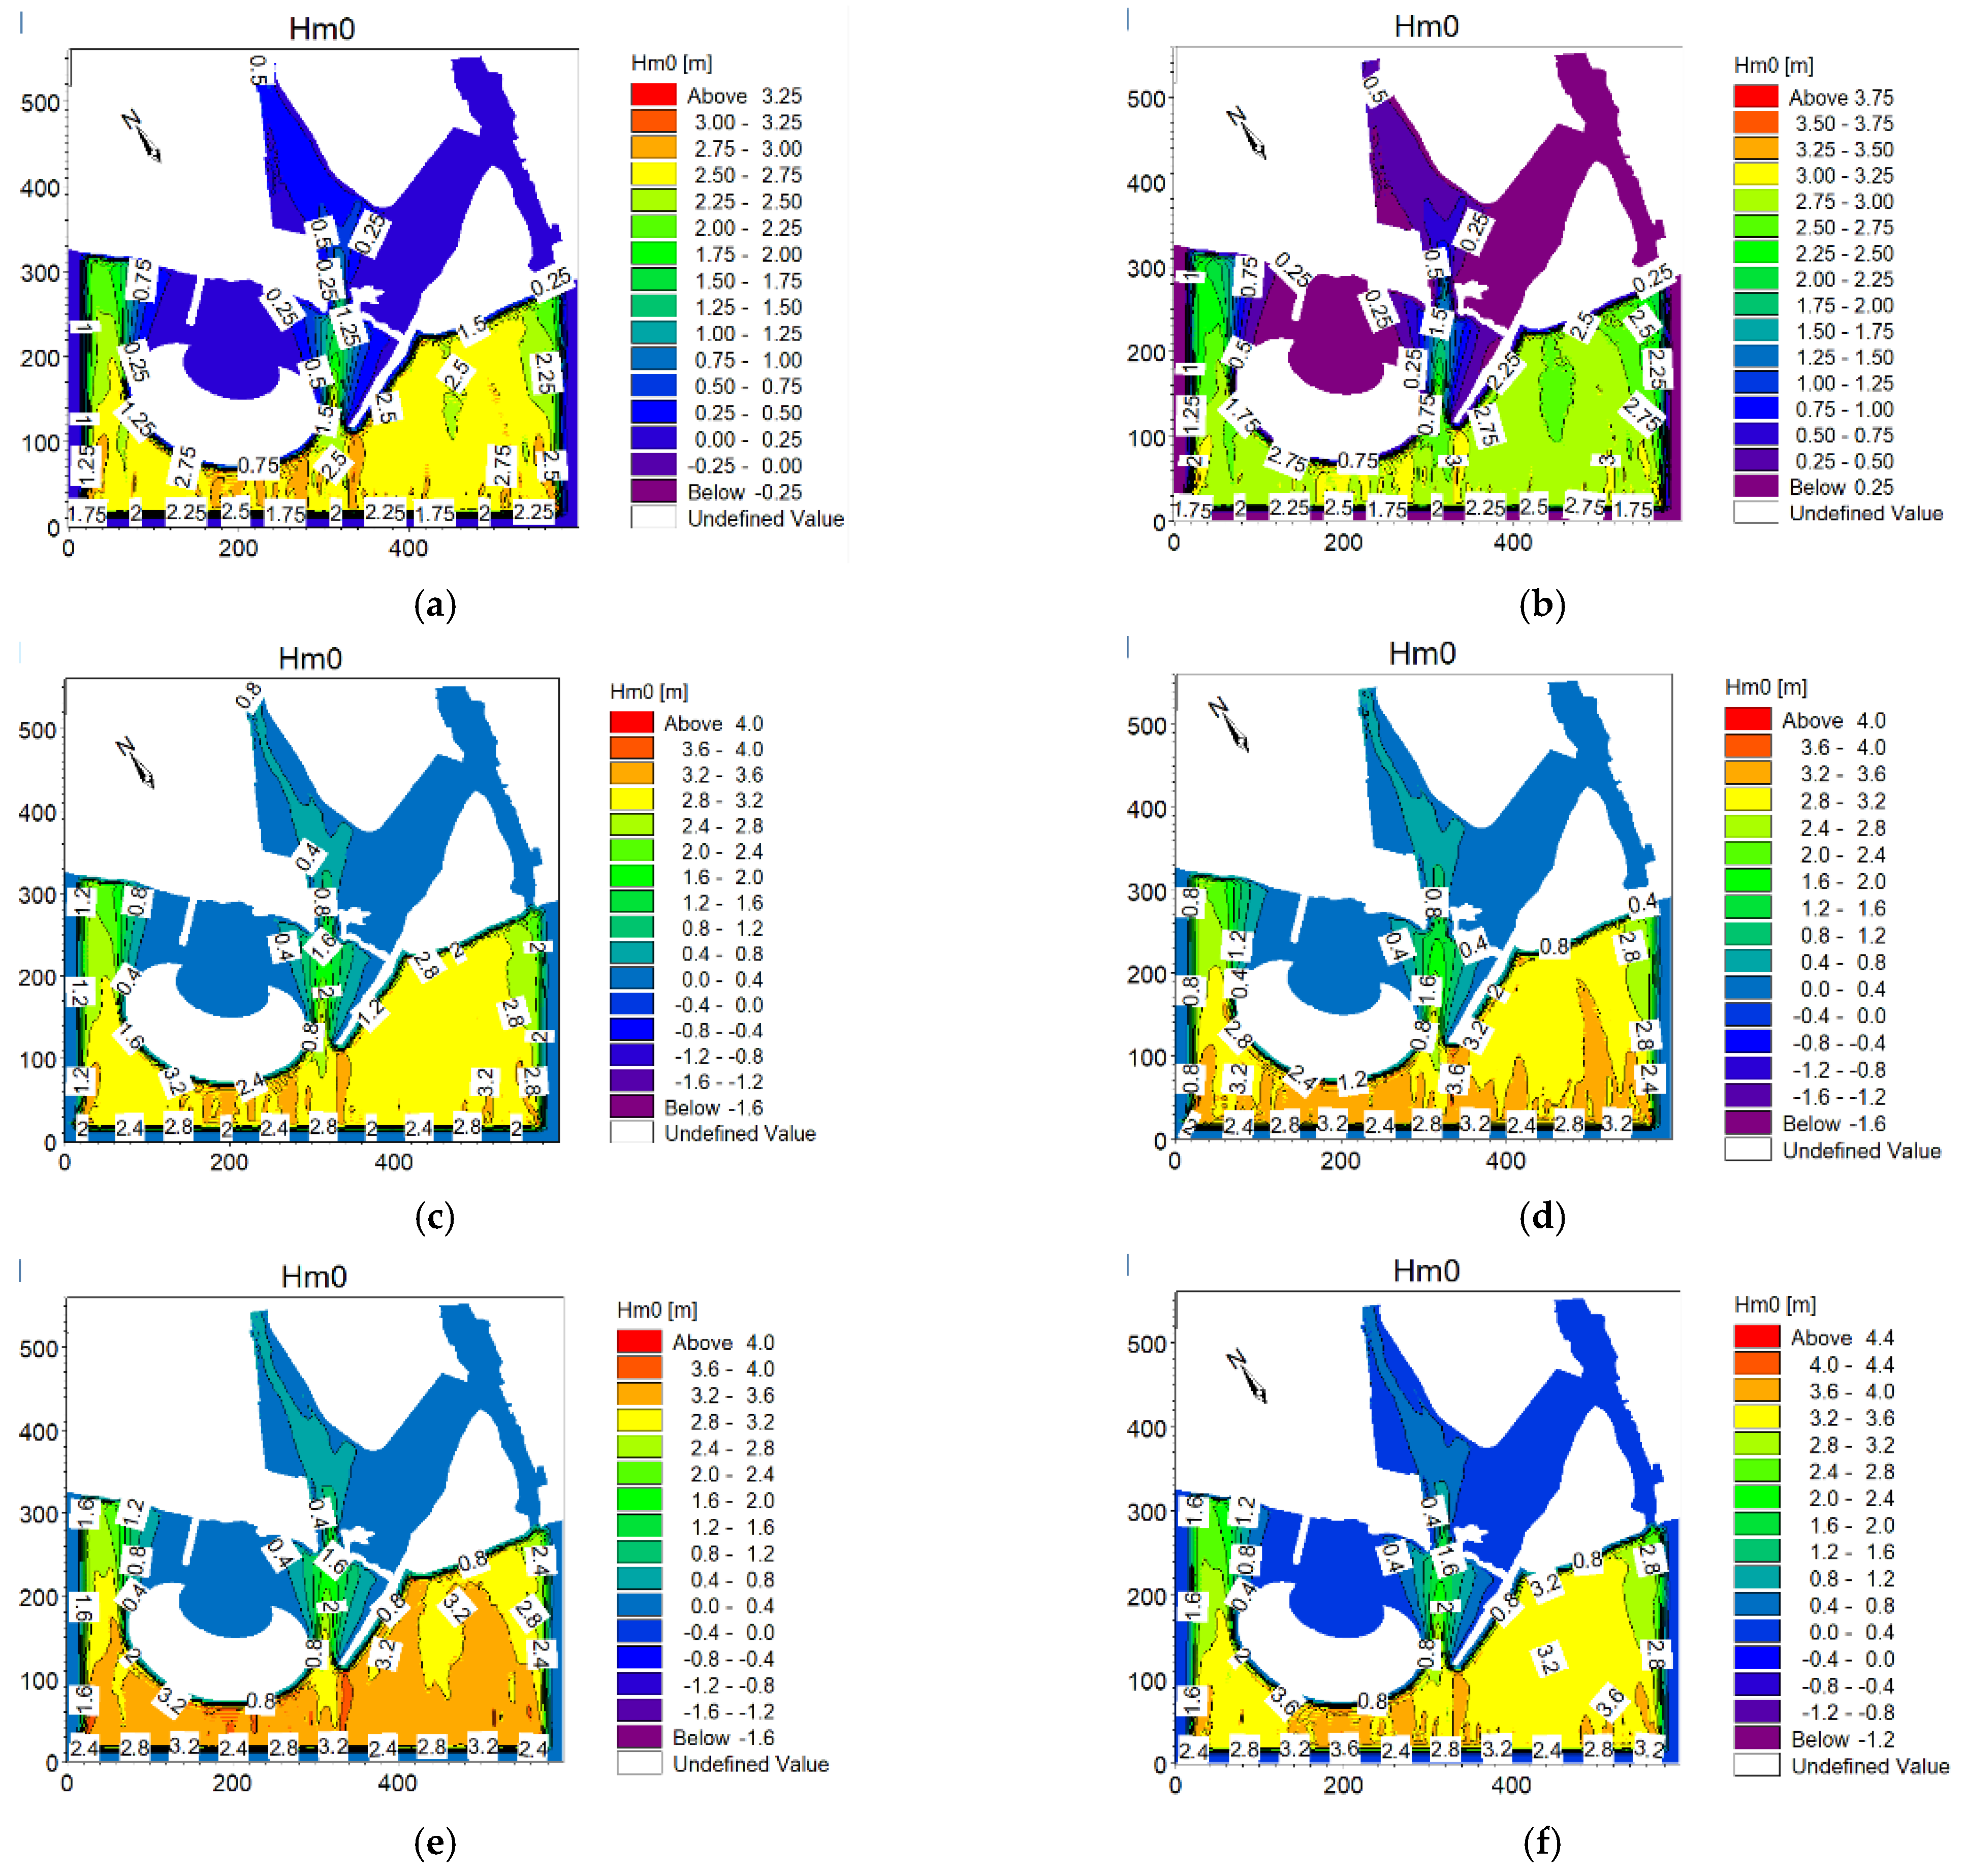
3.3.3. Wave Distribution in SYFP

The topography of the SYFP is complicated by a large proportion of shallow water areas. When the wave direction is in the WSW direction, the entrance of this port is almost parallel to the WSW direction. The positive wave incidence was adopted in this study to ensure that the wave propagates directly into the harbour basin [32]. In contrast, the port had a better shielding effect under other wave direction conditions. The calculation results of the wave distribution of the MIKE 21 BW model under the designed high water level are shown in Figure 10a–f.
With the propagation of directional wave trains travelling from deep to shallow water, wave refraction, diffraction, reflection, and breaking would occur, causing the wave energy to redistribute and create a new wave field. As shown in Figure 10, when the designed typhoon level was small, it had little influence on SYFP because of the good shielding of the harbour’s gate. However, when the designed typhoon level increased, the values of the significant wave height were close to 1 m in local areas and 2 m at the entrance of the basin. When the waves were incident from the WSW direction, they propagated directly into the harbour basin because the entrance of SYFP was almost directly parallel to the direction of WSW. As such, if the wave travelled into the interior of the SYFP, the significant wave height in the inner most part of the harbour would be the largest. Similarly, the significant wave height in the centre of the study area was higher than that on the two sides.
The BW model can accurately simulate the wave distribution in a small range based on the numerical solution of Boussinesq-type equations in the time domain and the nonlinearity and dispersion of waves. This means that it is more suitable for the berthing quantity evaluation of SYFP as indicated in this study.

3.4. Berthing Quantity of SYFP

The average depth in the basin is 6 m, and the berthing area of SYFP is approximately 460,000 m2 in fine weather. Under the influence of typhoons of different levels, the waves in the study area presented different distributions. According to the “Master Design Code of Fishery Port (SC/T 9010-2000)”, small- and medium-sized fishing vessels can withstand the significant wave heights within 0.5 m, medium and large fishing vessels can bear the significant wave heights within 0.75 m, and large fishing vessels can withstand the significant wave heights within 1 m. However, when the significant wave height exceeds 1 m, the fishing vessels can no longer be berthed.
In this section, the MIKE 21 BW model is used to calculate the wave distributions and to estimate the number of fishing vessels that can be accommodated in SYFP under typhoons of different levels. Berthing areas of different typhoon levels are shown in Figure 11a–f. The wave distribution at different levels is divided into four areas according to wave height: 0–0.5 m (green), 0.5–0.75 m (light blue), 0.75–1 m (yellow), and >1 m (red).
Under the influence of typhoons at level 12 or above, the significant wave height at the entrance of the basin exceeds 1 m (red area), so the fishing vessels cannot be berthed. Large vessels can only be docked anywhere except in the red area, medium and large fishing vessels can only be berthed in the light blue and green area, and small fishing vessels must try to avoid the northernmost end of the pier. At the entrance, there is an area of more than 10,000 m2 where the significant wave height exceeds 1 m.
When a typhoon strikes, vessels usually adopt the mode of multi-vessel side-by-side and single anchor mooring. At this time, the number of vessels that can be berthed is approximately 158 if the vessels are all large, while it is approximately 735 if all vessels are small. The total number of vessels that can be berthed in the basin using different anchoring ways during fair weather is shown in Table 2.
Based on the wave distribution in typhoons of level 12 or above, the significant wave height at the entrance is higher, and therefore, it is not suitable for berthing. The anchoring area of this fishing port is about 460,000 m2. Under the effect of different levels of typhoon, the waves in the harbour basin show different distributions. Table 3 shows the number of fishing vessels that can be berthed in SYFP under the influence of different levels of typhoons. It can be estimated that under typhoons of level 12 or above, the anchoring area of small vessels is decreasing. Therefore, the total number of small fishing vessels berthed is approximately 500–600. Due to the good shielding effect at the entrance, the anchorage area of the large vessel is within 450,000 m2 and the total number of large vessels is approximately 156.
The evaluation methods for the typhoon-resistant capability of fishing ports have been summarised in this paper. For the specific vessel type parameters, the typhoon-resistant capacity of the anchorage is improved when multiple vessels berth side-by-side with a single anchor when compared with single anchor mooring. However, if the representing parameters of the vessel type change, the corresponding results will also change.
From the perspective of the layout of the fishing port, the artificial islands and breakwater outside provide a better shielding effect for the harbour. This means that the wave effects weaken gradually as the waves propagate into the fishing port, which is caused by wave reflection and diffraction because of these buildings. Therefore, the arrangement of these structures stabilises the waves in most areas of the SYFP during typhoons [33]. At the same time, due to the influence of the port position, a typhoon moving to the northeast might have a great impact on the port when evaluating the berthing capacity of SYFP during the striking of typhoons. Aside from this, the most adverse wind direction for this port should also be considered.
It should be noted that the berthing capacity of a fishing port is not only related to the characteristics of fishing vessels, but also to the sediment conditions in the fishing port, the typhoon paths, and many other factors [34].

4. Conclusions

The berthing capability of Sanya Yazhou central fishing port was obtained under level 12–17 typhoons by assuming the WSW direction of the most unfavourable wave direction. Under the predicted typhoons of level 12 to 17, the anchoring area of small vessels at the entrance are: 385,000, 375,000, 3,700,000, 365,000, 350,000, and 315,000 m2, respectively. The anchorage area of the large vessel is within 450,000 m2.
This paper presents a method for evaluating the berthing capacity of fishing ports under hypothetical typhoons. The typhoon path with the maximum probability was determined based on the data of hypothetical typhoons passing through the port. In terms of the prediction of the starting point, the large sample information meant higher complexity, leading to an unclear existing trend. As such, applying the nonparametric regression method is of great significance in determining such a complex regression relationship. Typhoon wind fields were generated using the Holland model. The MIKE 21 SW model can provide wave boundary conditions for the MIKE 21 BW model by combining the typically designed typhoon field models. Finally, the assessment of the berthing capacity was concluded from the wave field distribution simulated by the MIKE 21 BW model. A study on the framework of a method for hazard assessment was set up for the berthing capacity in the coming typhoon-driven storm waves. In addition, a multi-factor coupling model can be established in the future including the sediment conditions in the fishing port, the typhoon paths, and other factors.

Author Contributions

Conceptualization, Z.W. and B.L.; methodology, H.G. and Z.W.; software, H.G.; validation, H.G., Z.Z. and Z.Y.; formal analysis, Z.L.; investigation, Z.W.; resources, Z.W. and B.L.; data curation, B.L.; writing—original draft preparation, H.G.; writing—review and editing, Z.W.; visualization, H.G.; supervision, B.L.; project administration, B.L.; funding acquisition, Z.W. and B.L. All authors have read and agreed to the published version of the manuscript.

Funding

This research was funded by the National Natural Science Foundation of China (Grant No. 51739010, 52101338), the Fundamental Research Funds for the Central Universities and the 111 Project (No. B14028).

Conflicts of Interest

The authors declare no conflict of interest.

References

  1. Chang, C.-H.; Shih, H.-J.; Chen, W.-B.; Su, W.-R.; Lin, L.-Y.; Yu, Y.-C.; Jang, J.-H. Hazard Assessment of Typhoon-Driven Storm Waves in the Nearshore Waters of Taiwan. Water 2018, 10, 926. [Google Scholar] [CrossRef] [Green Version]
  2. Yan, Z.; Liang, B.; Wu, G.; Wang, S.; Li, P. Ultra-long return level estimation of extreme wind speed based on the deductive method. Ocean Eng. 2020, 197, 106900. [Google Scholar] [CrossRef]
  3. Gopikrishna, B.; Deo, M. Changes in the shoreline at Paradip Port, India in response to climate change. Geomorphology 2018, 303, 243–255. [Google Scholar] [CrossRef]
  4. Doong, D.-J.; Chuang, H.-C.; Shieh, C.-L.; Hu, J.-H. Quantity, distribution, and impacts of coastal driftwood triggered by a typhoon. Mar. Pollut. Bull. 2011, 62, 1446–1454. [Google Scholar] [CrossRef]
  5. Liang, B.; Ge, H.; Zhang, L.; Liu, Y. Wave resonant scattering mechanism of sinusoidal seabed elucidated by Mathieu Instability theorem. Ocean Eng. 2020, 218, 108238. [Google Scholar] [CrossRef]
  6. Chen, W.-B.; Chen, H.; Hsiao, S.-C.; Chang, C.-H.; Lin, L.-Y. Wind forcing effect on hindcasting of typhoon-driven extreme waves. Ocean Eng. 2019, 188, 1–17. [Google Scholar] [CrossRef]
  7. Yan, Z.; Pang, L.; Dong, S. Analysis of Extreme Wind Speed Estimates in the Northern South China Sea. J. Appl. Meteorol. Clim. 2020, 59, 1625–1635. [Google Scholar] [CrossRef]
  8. Yan, Z.; Wu, G.; Liang, B.; Li, P. A Stochastic Tropical Cyclone Model for the Northwestern Pacific Ocean with Improved Track and Intensity Representations. Appl. Ocean Res. 2020, 105, 102423. [Google Scholar] [CrossRef]
  9. Kong, C.; Lu, Y.; Han, T. Assessment of typhoon prevention level at fishing port. In IOP Conference Series: Earth and Environmental Science; IOP Publishing: Bristol, UK, 2021. [Google Scholar]
  10. Sun, Z.; Wang, C.; Zhong, S.; Ji, H. Numerical simulation of storm surge coupled with wave in zhoushan fshing port. Mar. Sci. Bull. 2019, 38, 150–158. [Google Scholar]
  11. Wang, Y.; Shangguan, Z.; Dong, W.; Qi, Q. Structural reliability of fshing chains at a single anchor in fshing port under typhoon calamity. J. Dalian Ocean. Univ. 2016, 31, 692–695. [Google Scholar]
  12. Fan, K.; Wang, H. A New Approach to Forecasting Typhoon Frequency over the Western North Pacific. Weather. Forecast. 2009, 24, 974–986. [Google Scholar] [CrossRef]
  13. Remya, P.G.; Kumar, R.; Basu, S. An assessment of wind forcing impact on a spectral wave model for the Indian Ocean. J. Earth Syst. Sci. 2014, 123, 1075–1087. [Google Scholar] [CrossRef] [Green Version]
  14. Hu, Q.K.; Chen, Q.; Fitzpatrick, P. Assessment of a Parametric Hurricane Surface Wind Model for Tropical Cyclones in the Gulf of Mexico; InTch: London, UK, 2012. [Google Scholar]
  15. Holland, G.J. An Analytic Model of the Wind and Pressure Profiles in Hurricanes. Mon. Weather. Rev. 1980, 108, 1212–1218. [Google Scholar] [CrossRef]
  16. Holland, G.J.; Belanger, J.I.; Fritz, A. A Revised Model for Radial Profiles of Hurricane Winds. Mon. Weather. Rev. 2010, 138, 4393–4401. [Google Scholar] [CrossRef]
  17. Ge, H.; Liu, H.; Zhang, L. Accurate Depth Inversion Method for Coastal Bathymetry: Introduction of Water Wave High-Order Dispersion Relation. J. Mar. Sci. Eng. 2020, 8, 153. [Google Scholar] [CrossRef] [Green Version]
  18. Hou, W.; Zhang, R.; Zhang, P.; Xi, Y.; Ma, Q. Wave Characteristics and Berthing Capacity Evaluation of the Offshore Fishing Port under the Influence of Typhoons. Appl. Ocean Res. 2020, 106, 102447. [Google Scholar] [CrossRef]
  19. Lee, H.S.; Kim, K.O. Storm Surge and Storm Waves Modelling Due to Typhoon Haiyan in November 2013 with Improved Dynamic Meteorological Conditions. Procedia Eng. 2015, 116, 699–706. [Google Scholar] [CrossRef] [Green Version]
  20. Hsiao, S.-C.; Chen, H.; Chen, W.-B.; Chang, C.-H.; Lin, L.-Y. Quantifying the contribution of nonlinear interactions to storm tide simulations during a super typhoon event. Ocean Eng. 2019, 194, 106661. [Google Scholar] [CrossRef]
  21. Madsen, P.A.; Murray, R.; Sørensen, O.R. A new form of the Boussinesq equations with improved linear dispersion characteristics. Coast. Eng. 1991, 15, 371–388. [Google Scholar] [CrossRef]
  22. Madsen, P.A.; Murray, R.; Sørensen, O.R. A new form of the Boussinesq equations with improved linear dispersion characteristics. Part 2. A Slowly-varying bathymetry. Coast. Eng. 1992, 18, 183–204. [Google Scholar] [CrossRef]
  23. Wang, S.P.; Rui-Jie, L.I.; Ming, J.I.; Dong, X.T.; Zhu, W.J. Combined application of swan and cgwave model in calculation of design wave parameters. J. Waterw. Harb. 2015, 4, 308–312. [Google Scholar]
  24. Gou, H.; Luo, F.; Li, R.; Dong, X.; Zhang, Y. Modeling Study on the Hydrodynamic Environmental Impact Caused by the Sea for Regional Construction near the Yanwo Island in Zhoushan, China. Water 2019, 11, 1674. [Google Scholar] [CrossRef] [Green Version]
  25. Ying, M.; Zhang, W.; Yu, H.; Lu, X.; Feng, J.; Fan, Y.; Zhu, Y.; Chen, D. An Overview of the China Meteorological Administration Tropical Cyclone Database. J. Atmos. Ocean. Technol. 2014, 31, 287–301. [Google Scholar] [CrossRef] [Green Version]
  26. Graham, H.E. Meteorological Considerations Pertinent to Standard Project Hurricane; National Hurricane Research Project Report; US Department of Commerce, Weather Bureau: Washington, DC, USA, 1959.
  27. Olfateh, M.; Callaghan, D.P.; Nielsen, P.; Baldock, T.E. Tropical cyclone wind field asymmetry-Development and evaluation of a new parametric model. J. Geophys. Res. Oceans 2017, 122, 458–469. [Google Scholar] [CrossRef]
  28. Ministry of Agriculture and Rural Affairs of the People’s Republic of China. National Standards of People’s Republic of China: Master Design Code of Fishery Port; The Ministry of Agriculture of the People’s Republic of China Beijing: Beijing, China, 2000.
  29. John, F. Nonparametric Regression. Appendix to an R and S-PLUS Companion to Applied Regression; Sage Publications: Beverly Hills, CA, USA, 2002; pp. 67–82. [Google Scholar]
  30. PRC MOAT. Grade of Tropical Cyclones (GB/T19201-2006); China Meteorological Administration: Beijing, China, 2006. [Google Scholar]
  31. Hsiao, S.-C.; Chen, H.; Wu, H.-L.; Chen, W.-B.; Chang, C.-H.; Guo, W.-D.; Chen, Y.-M.; Lin, L.-Y. Numerical Simulation of Large Wave Heights from Super Typhoon Nepartak (2016) in the Eastern Waters of Taiwan. J. Mar. Sci. Eng. 2020, 8, 217. [Google Scholar] [CrossRef] [Green Version]
  32. Feng, W.B.; Huang, Y.N..; Li, J.H. Application of wave feild simulation in sheltered water based on BW model. Port Waterw. Eng. 2015, 11, 8–13. [Google Scholar]
  33. Zhao, J.; Yan, Z.; Chen, X.; Pang, L.; Lu, Y. The Calculation of Extreme Wind Speed Based on Bayesian Method. J. Coast. Res. 2020, 99, 105–114. [Google Scholar] [CrossRef]
  34. Huang, C.C.; Fang, H.T.; Ho, H.C.; Jhong, B.C. Interdisciplinary application of numerical and manchine-learing-based models to predict half-hourly suspended sediment concentrations during typhoons. J. Hydrol. 2019, 573, 661–675. [Google Scholar] [CrossRef]
Figure 1. Flowchart of the present method.
Jmse 09 01380 g001
Figure 2. Historical typhoon starting points and the maximum probability starting point.
Jmse 09 01380 g002
Figure 3. The paths of the designed typhoon.
Jmse 09 01380 g003
Figure 4. Time–history curve of the central pressure (hPa) distribution of typhoons of different levels.
Jmse 09 01380 g004
Figure 5. Maximum wind speeds (m/s) of level 12–17 designed typhoon. (a) level 12 (b) level 13 (c) level 14 (d) level 15 (e) level 16 (f) level 17.
Jmse 09 01380 g005
Figure 6. Range and mesh of the MIKE 21 SW model.
Jmse 09 01380 g006
Figure 7. Typhoon (Doksuri and Kai-Tak) verification results.
Jmse 09 01380 g007
Figure 8. Range of the MIKE 21 BW model.
Jmse 09 01380 g008
Figure 9. Mesh and bathymetry.
Jmse 09 01380 g009
Figure 10. Significant wave height (Hm0) distribution of designed level 12–17 wind fields at the designed high water level. (a) level 12 (b) level 13 (c) level 14 (d) level 15 (e) level 16 (f) level 17.
Jmse 09 01380 g010
Figure 11. Wave distribution at the berthing area of SYFP during level 12–17 typhoons. (a) level 12 (b) level 13 (c) level 14 (d) level 15 (e) level 16 (f) level 17.
Jmse 09 01380 g011aJmse 09 01380 g011b
Table 1. Wave boundary conditions for the BW model.
Level of TyphoonSignificant Wave Height (m)T (s)
122.2110.08
132.3910.38
142.5210.67
152.6310.50
162.7410.68
172.8211.33
Table 2. Total number of vessels that can be berthed in SYFP during level 12–17 typhoons.
Anchoring WayType of VesselMooring Area of Single/Single Group Fishing Vessel (m2)Number of Vessels
Single anchor mooringSmall13,74733
Large26,10117
Multiple vessels mooring side-by-side with a single anchorSmall (6 vessels one set)3755735
Large (2 vessels one set)5812158
Table 3. Number of accommodated fishing vessels in SYFP under different levels of typhoons (multiple vessels abreast with a single anchor).
Direction of TyphoonLevel of TyphoonNumber of Small VesselsAnchoring Area (m2) of Small VesselsNumber of Large VesselsAnchoring Area (m2) of Large Vessels
12615385,000156450,000
13599375,000156450,000
14591370,000156450,000
15583365,000156450,000
16559350,000156450,000
17503315,000156450,000
Publisher’s Note: MDPI stays neutral with regard to jurisdictional claims in published maps and institutional affiliations.

