
Fatigue Damage Evaluation of Compressor Blade Based on Nonlinear Ultrasonic Nondestructive Testing


Abstract
:1. Introduction
2. Materials and Methods
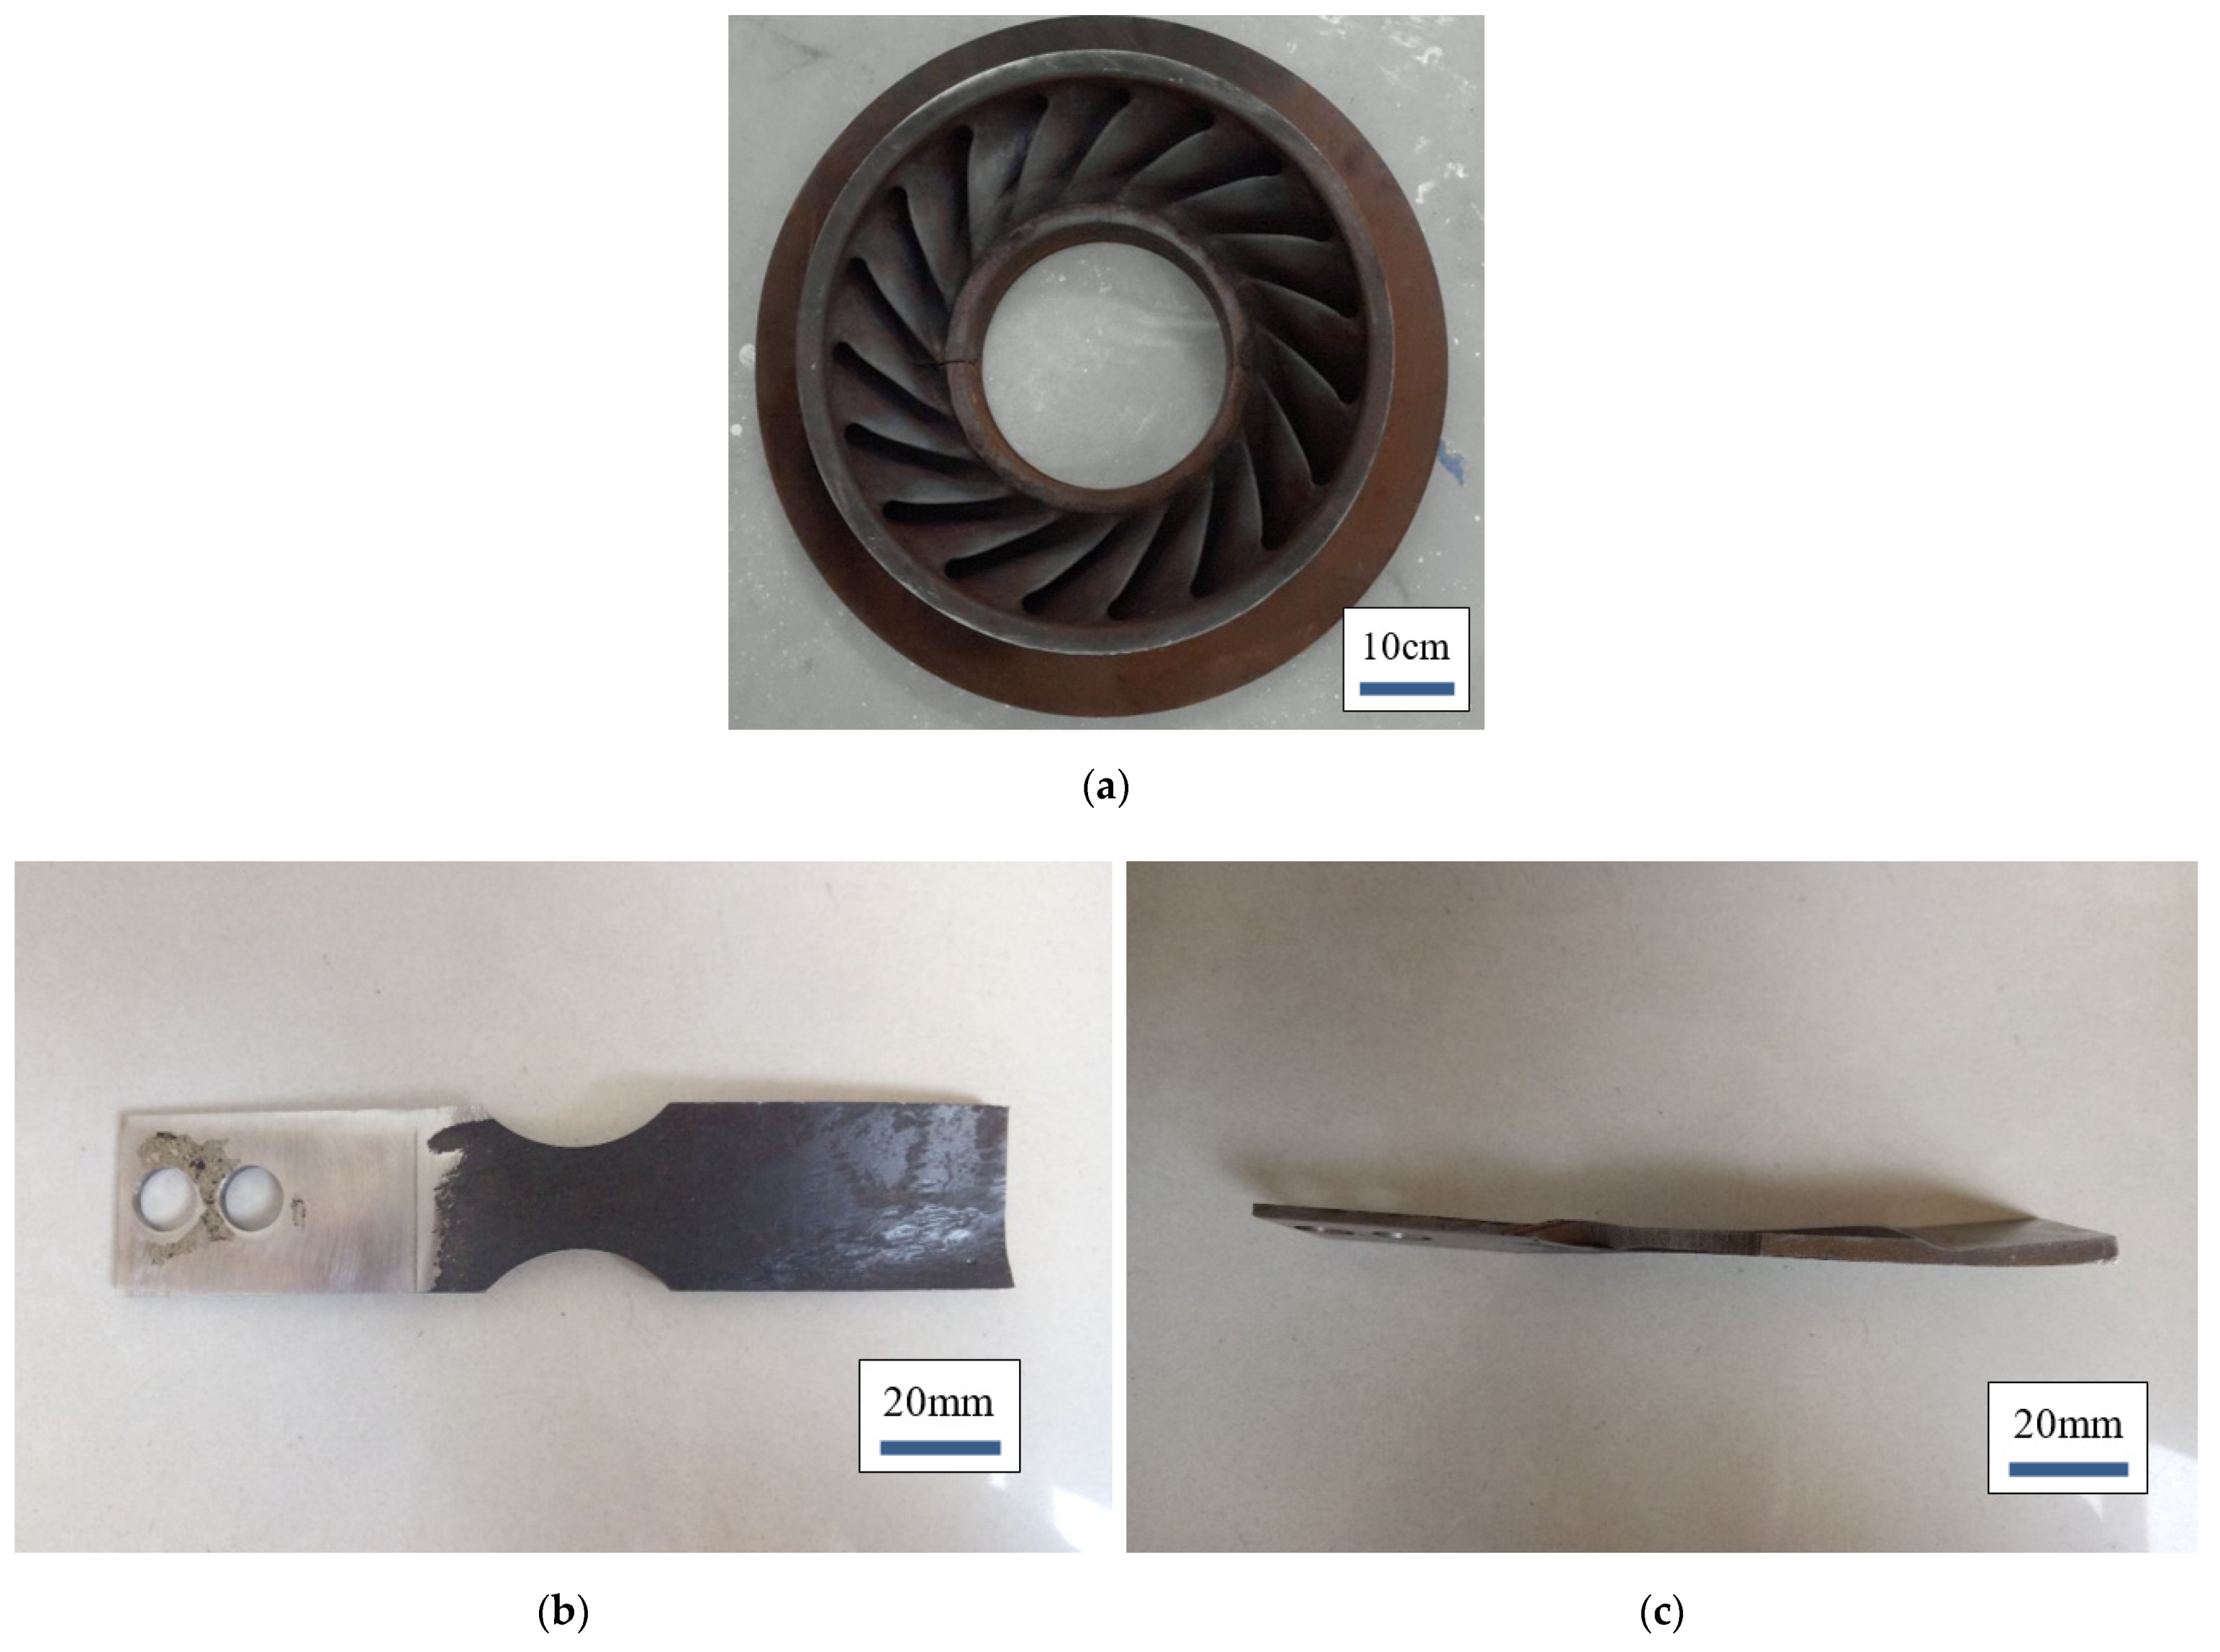
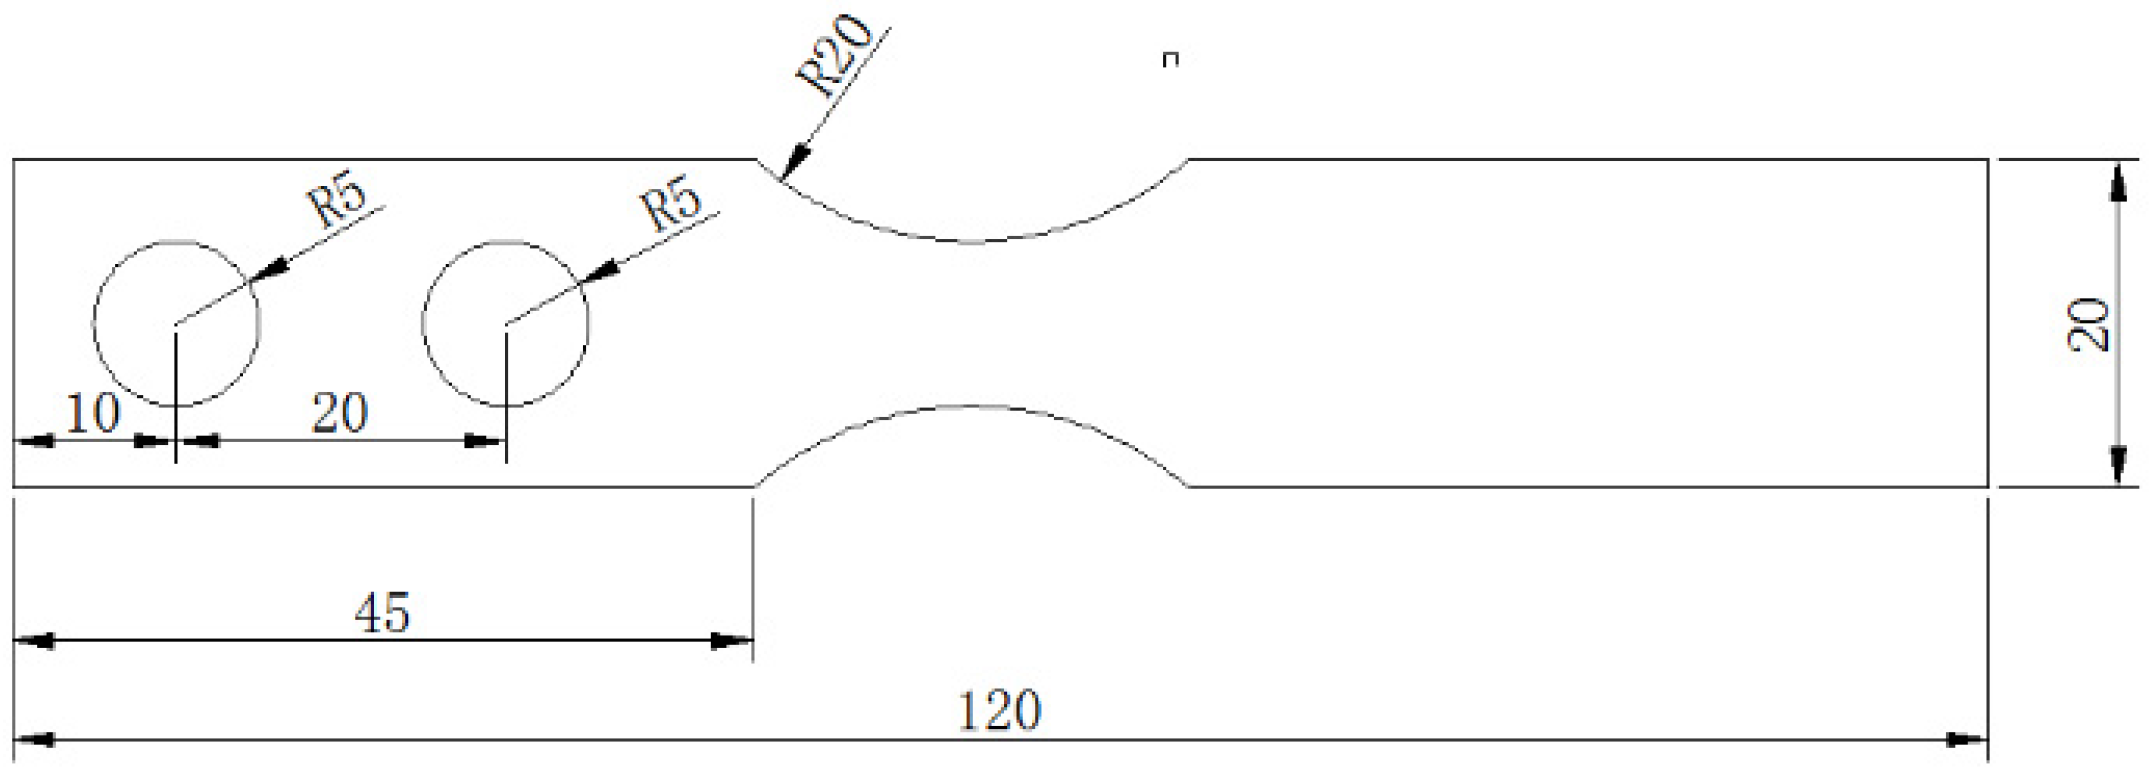
2.1. Experimental Materials
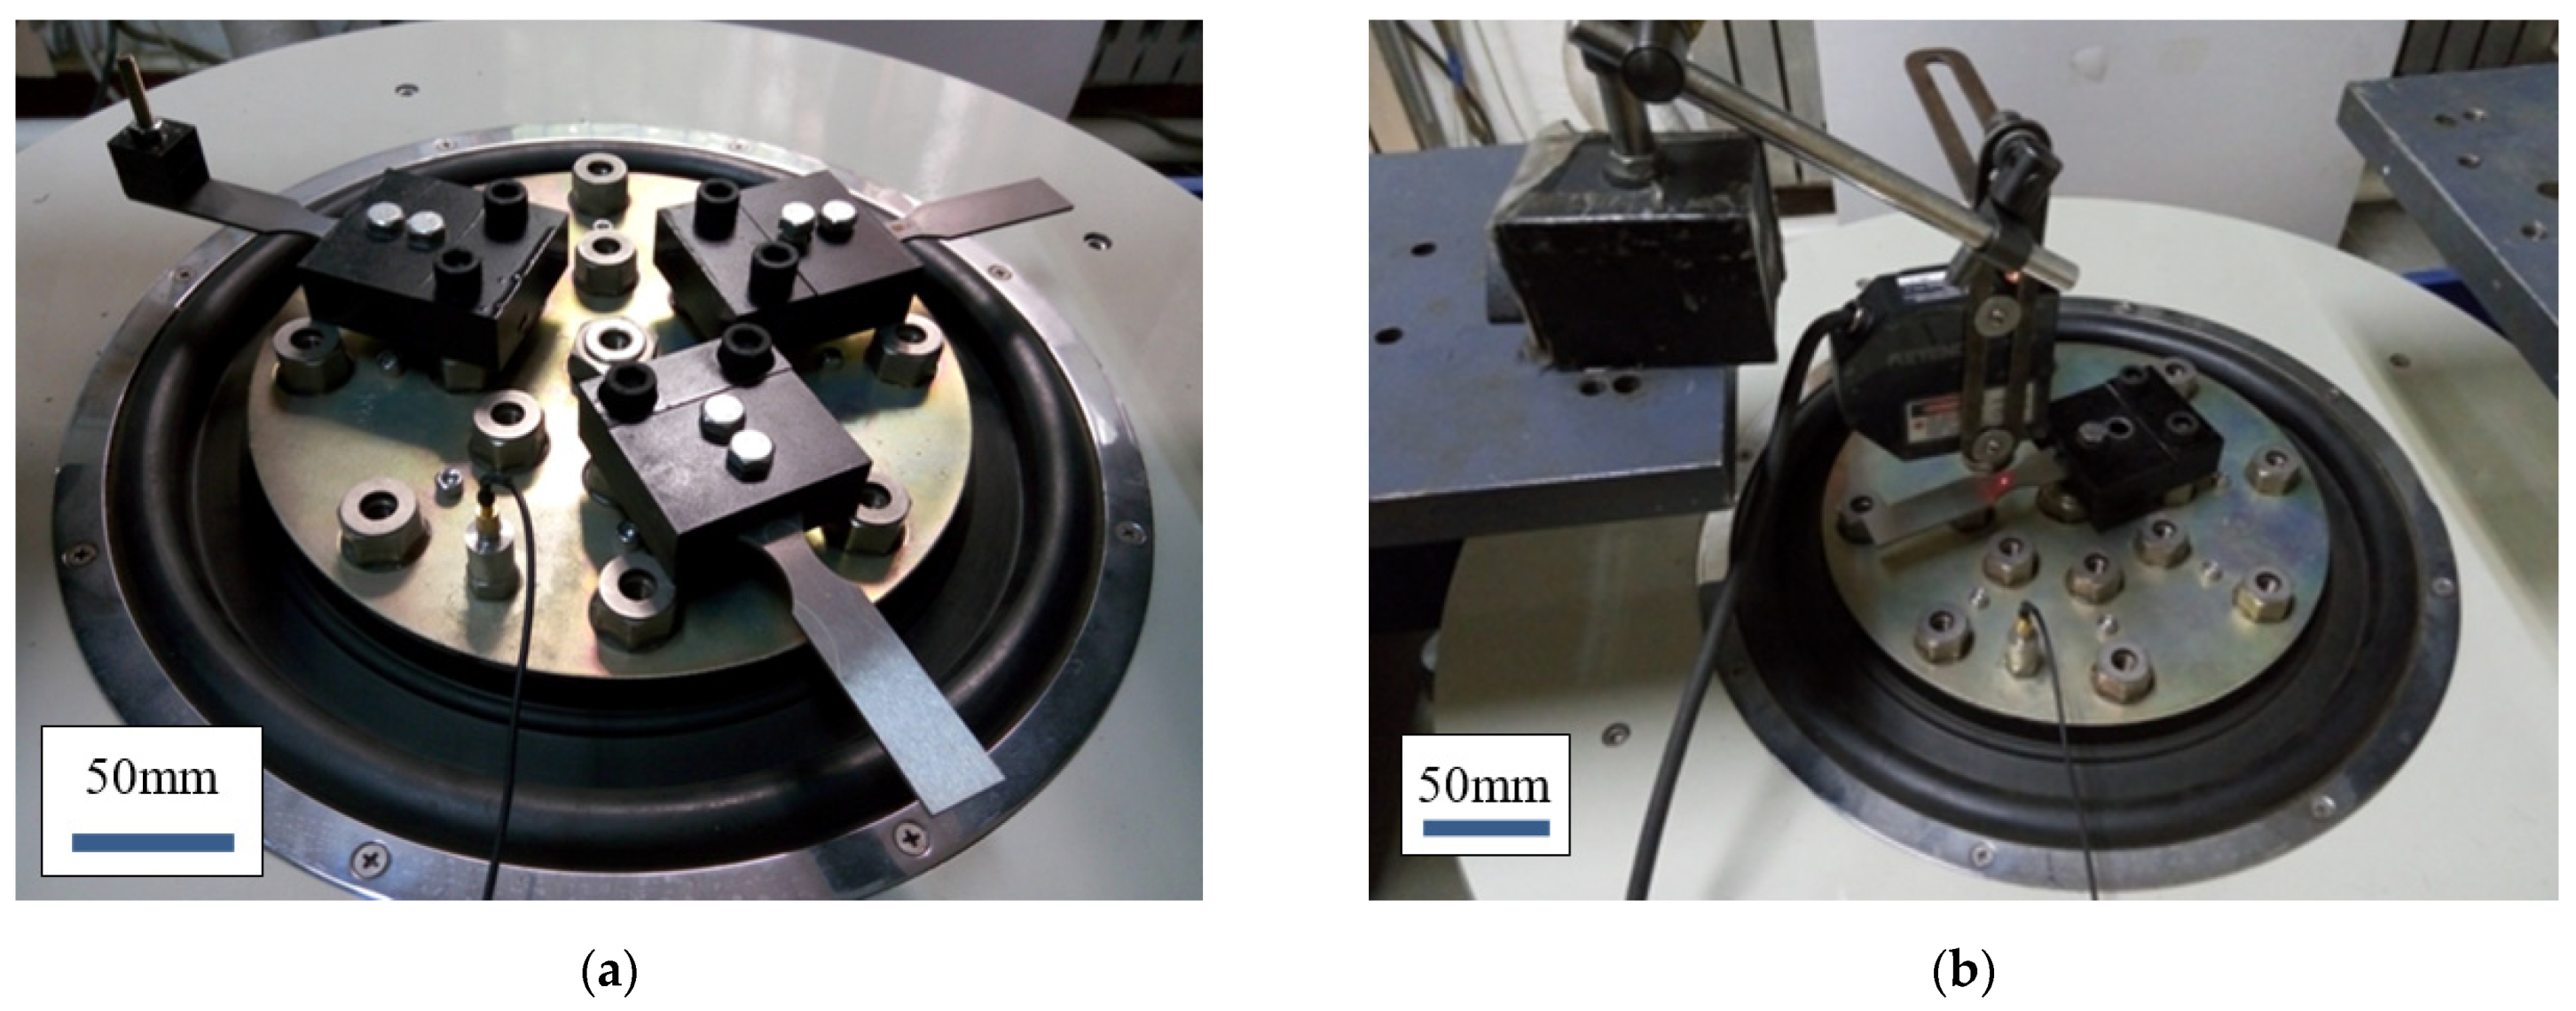
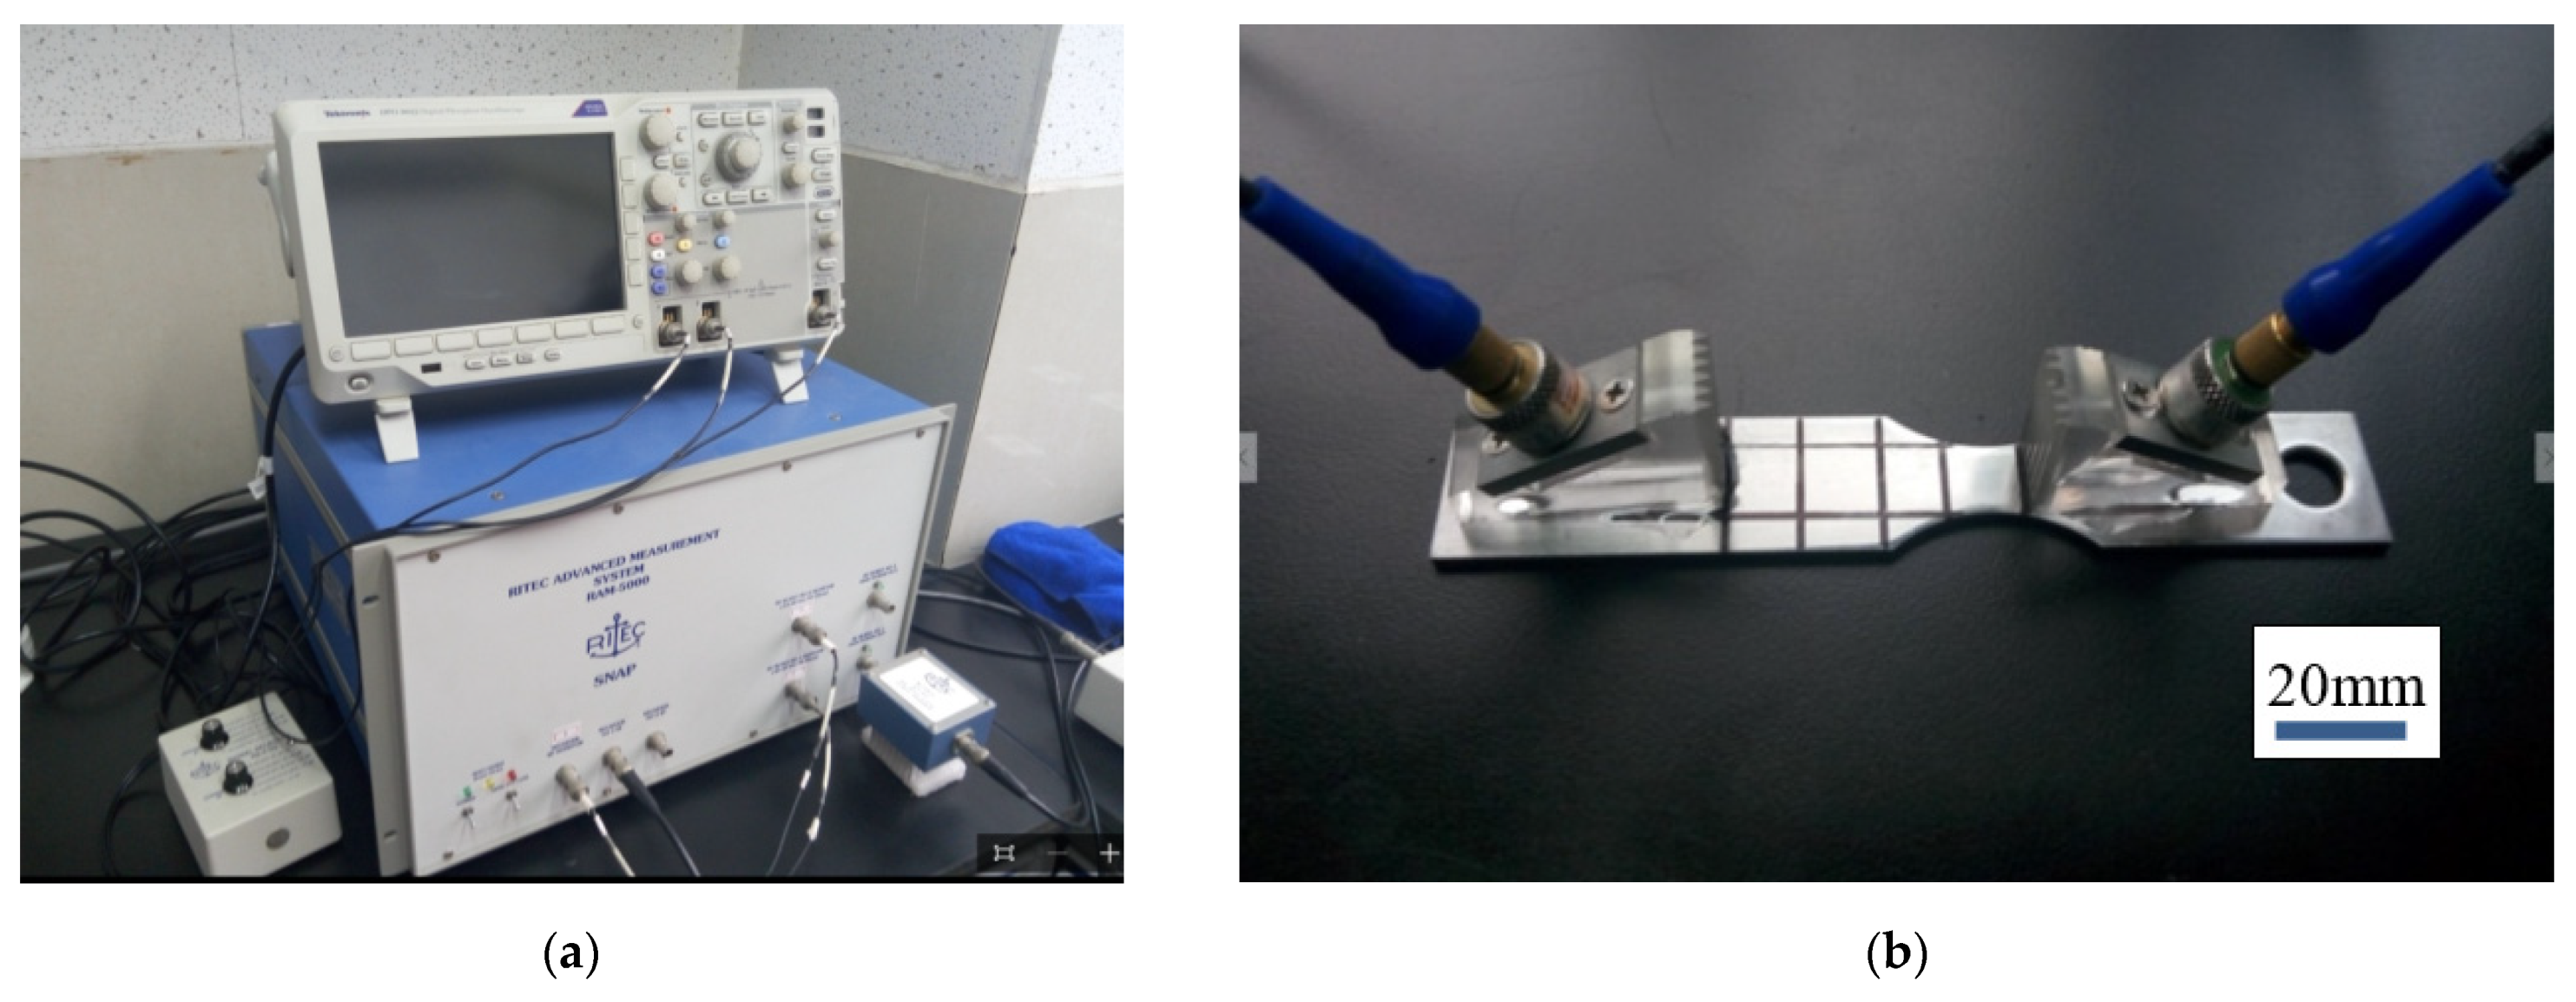
2.2. Experimental Methods
3. Results
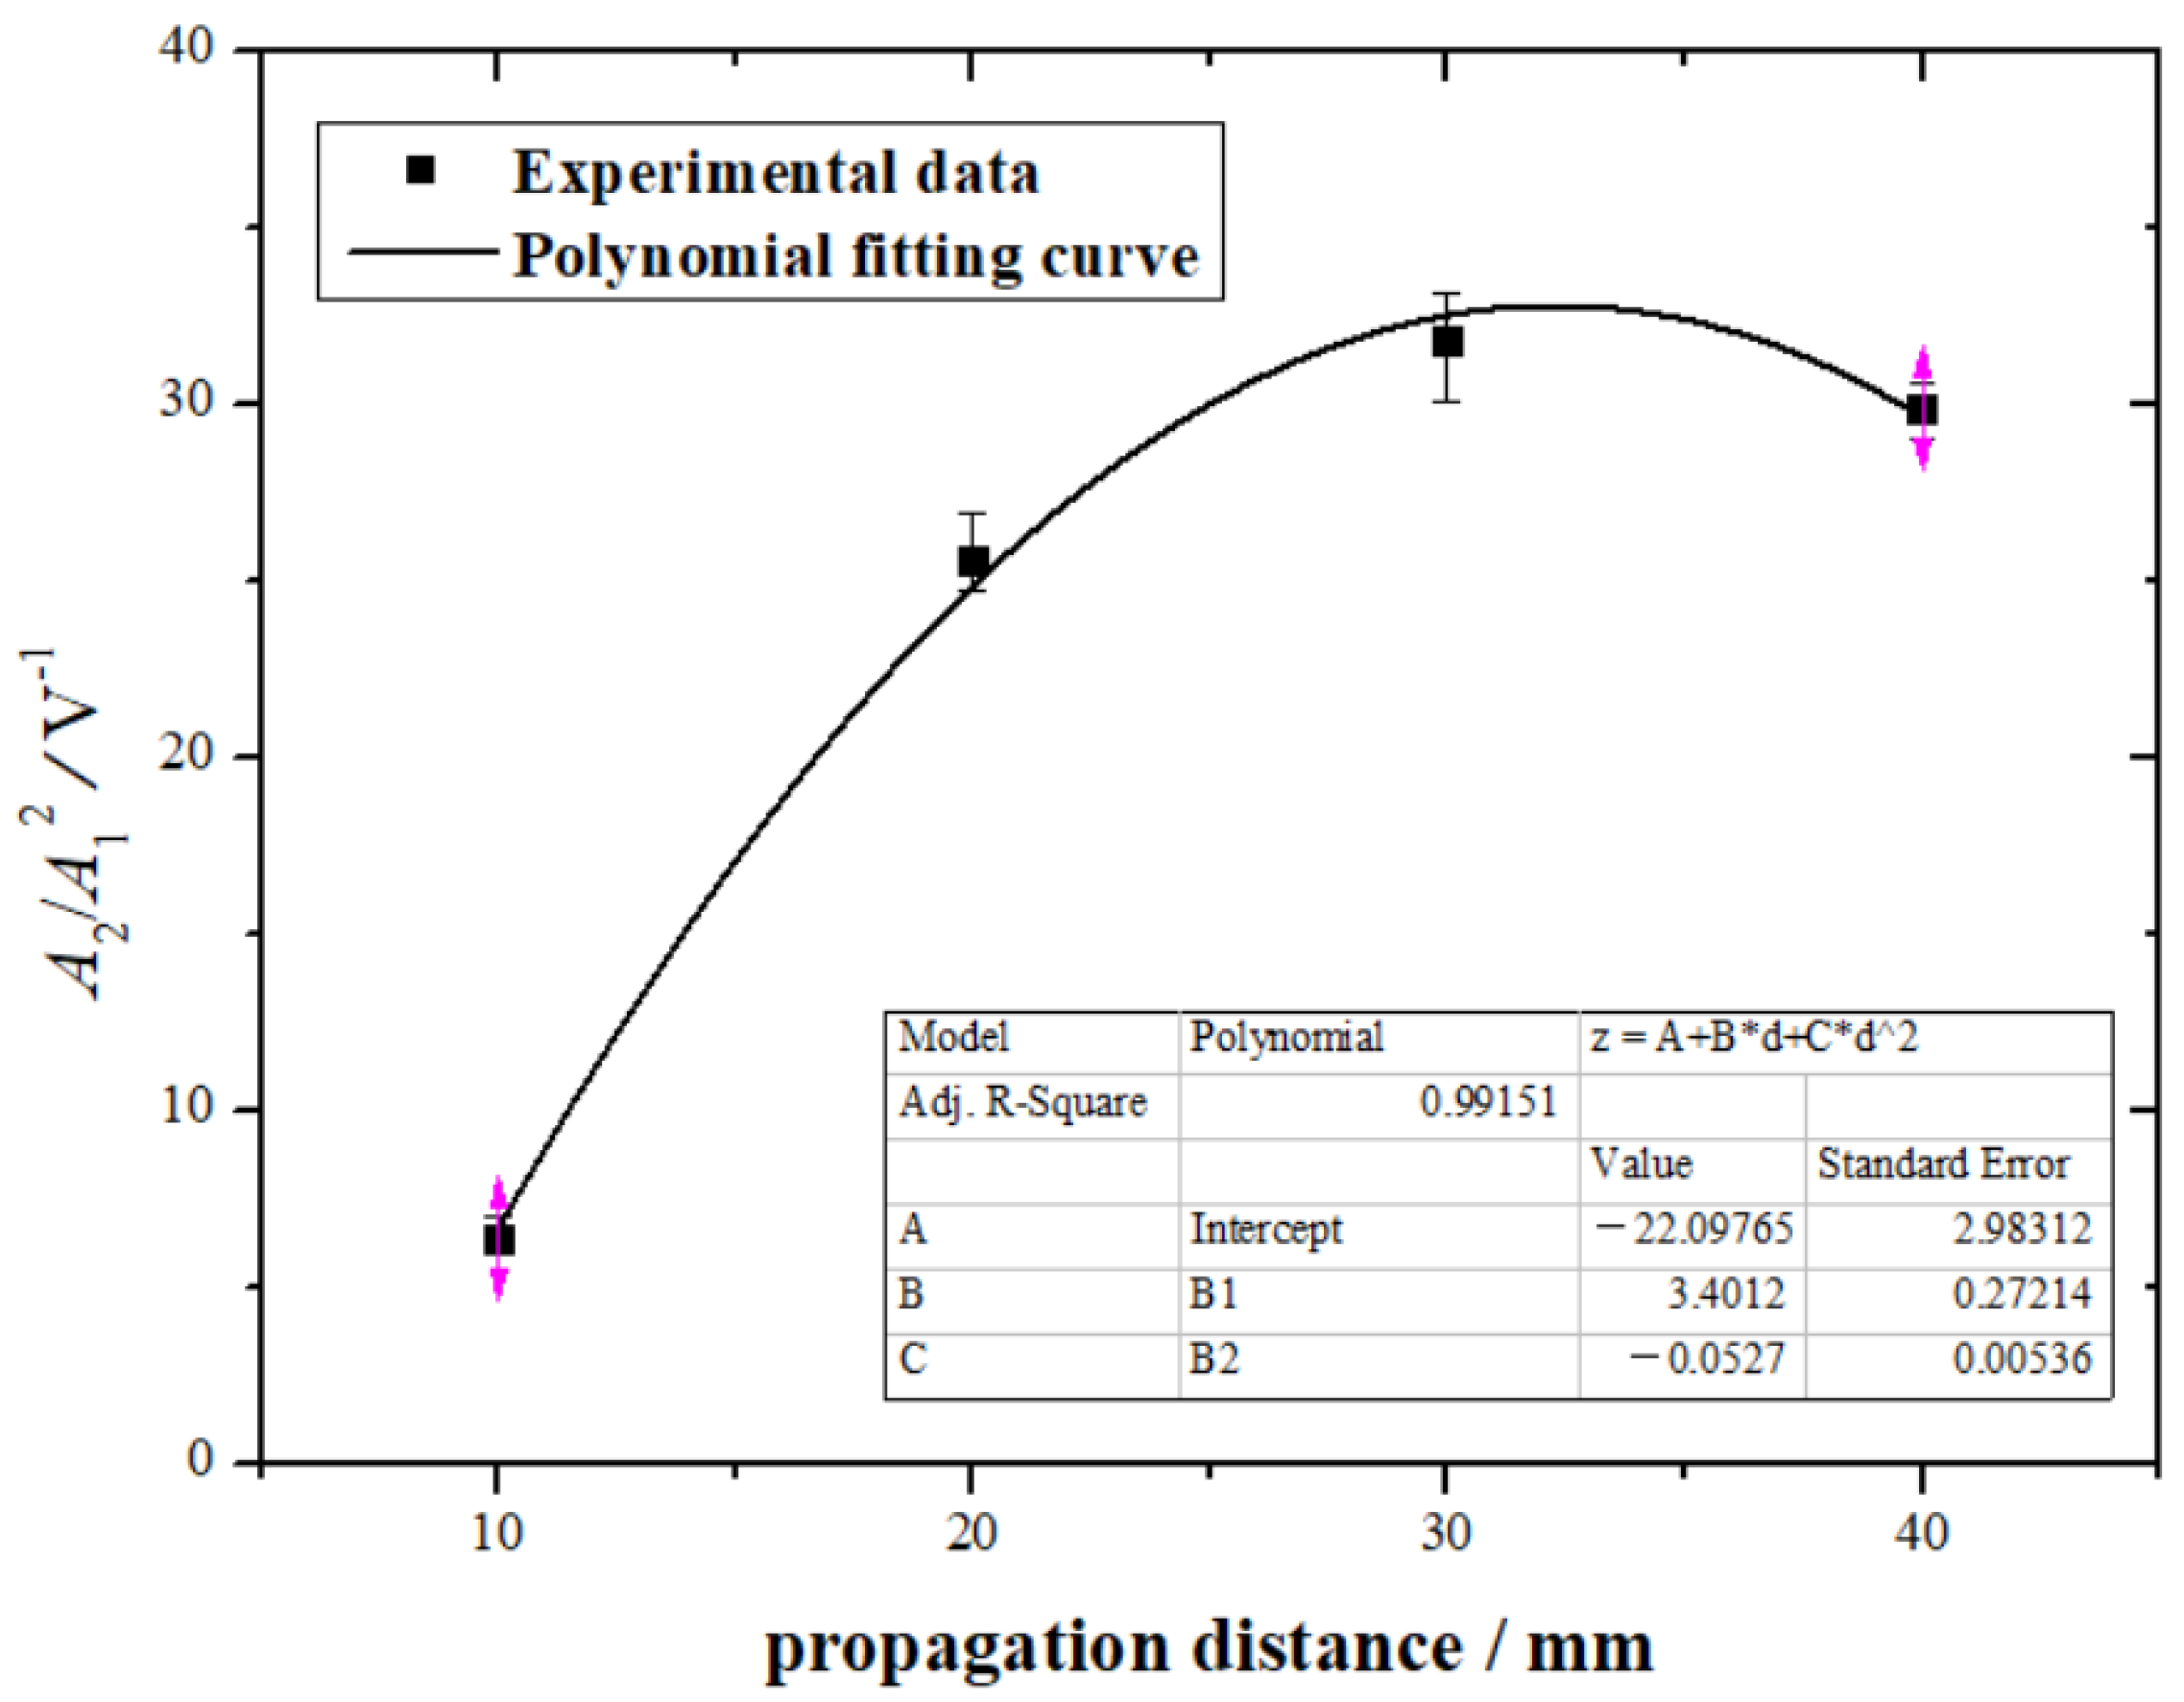
3.1. Dispersion Curve
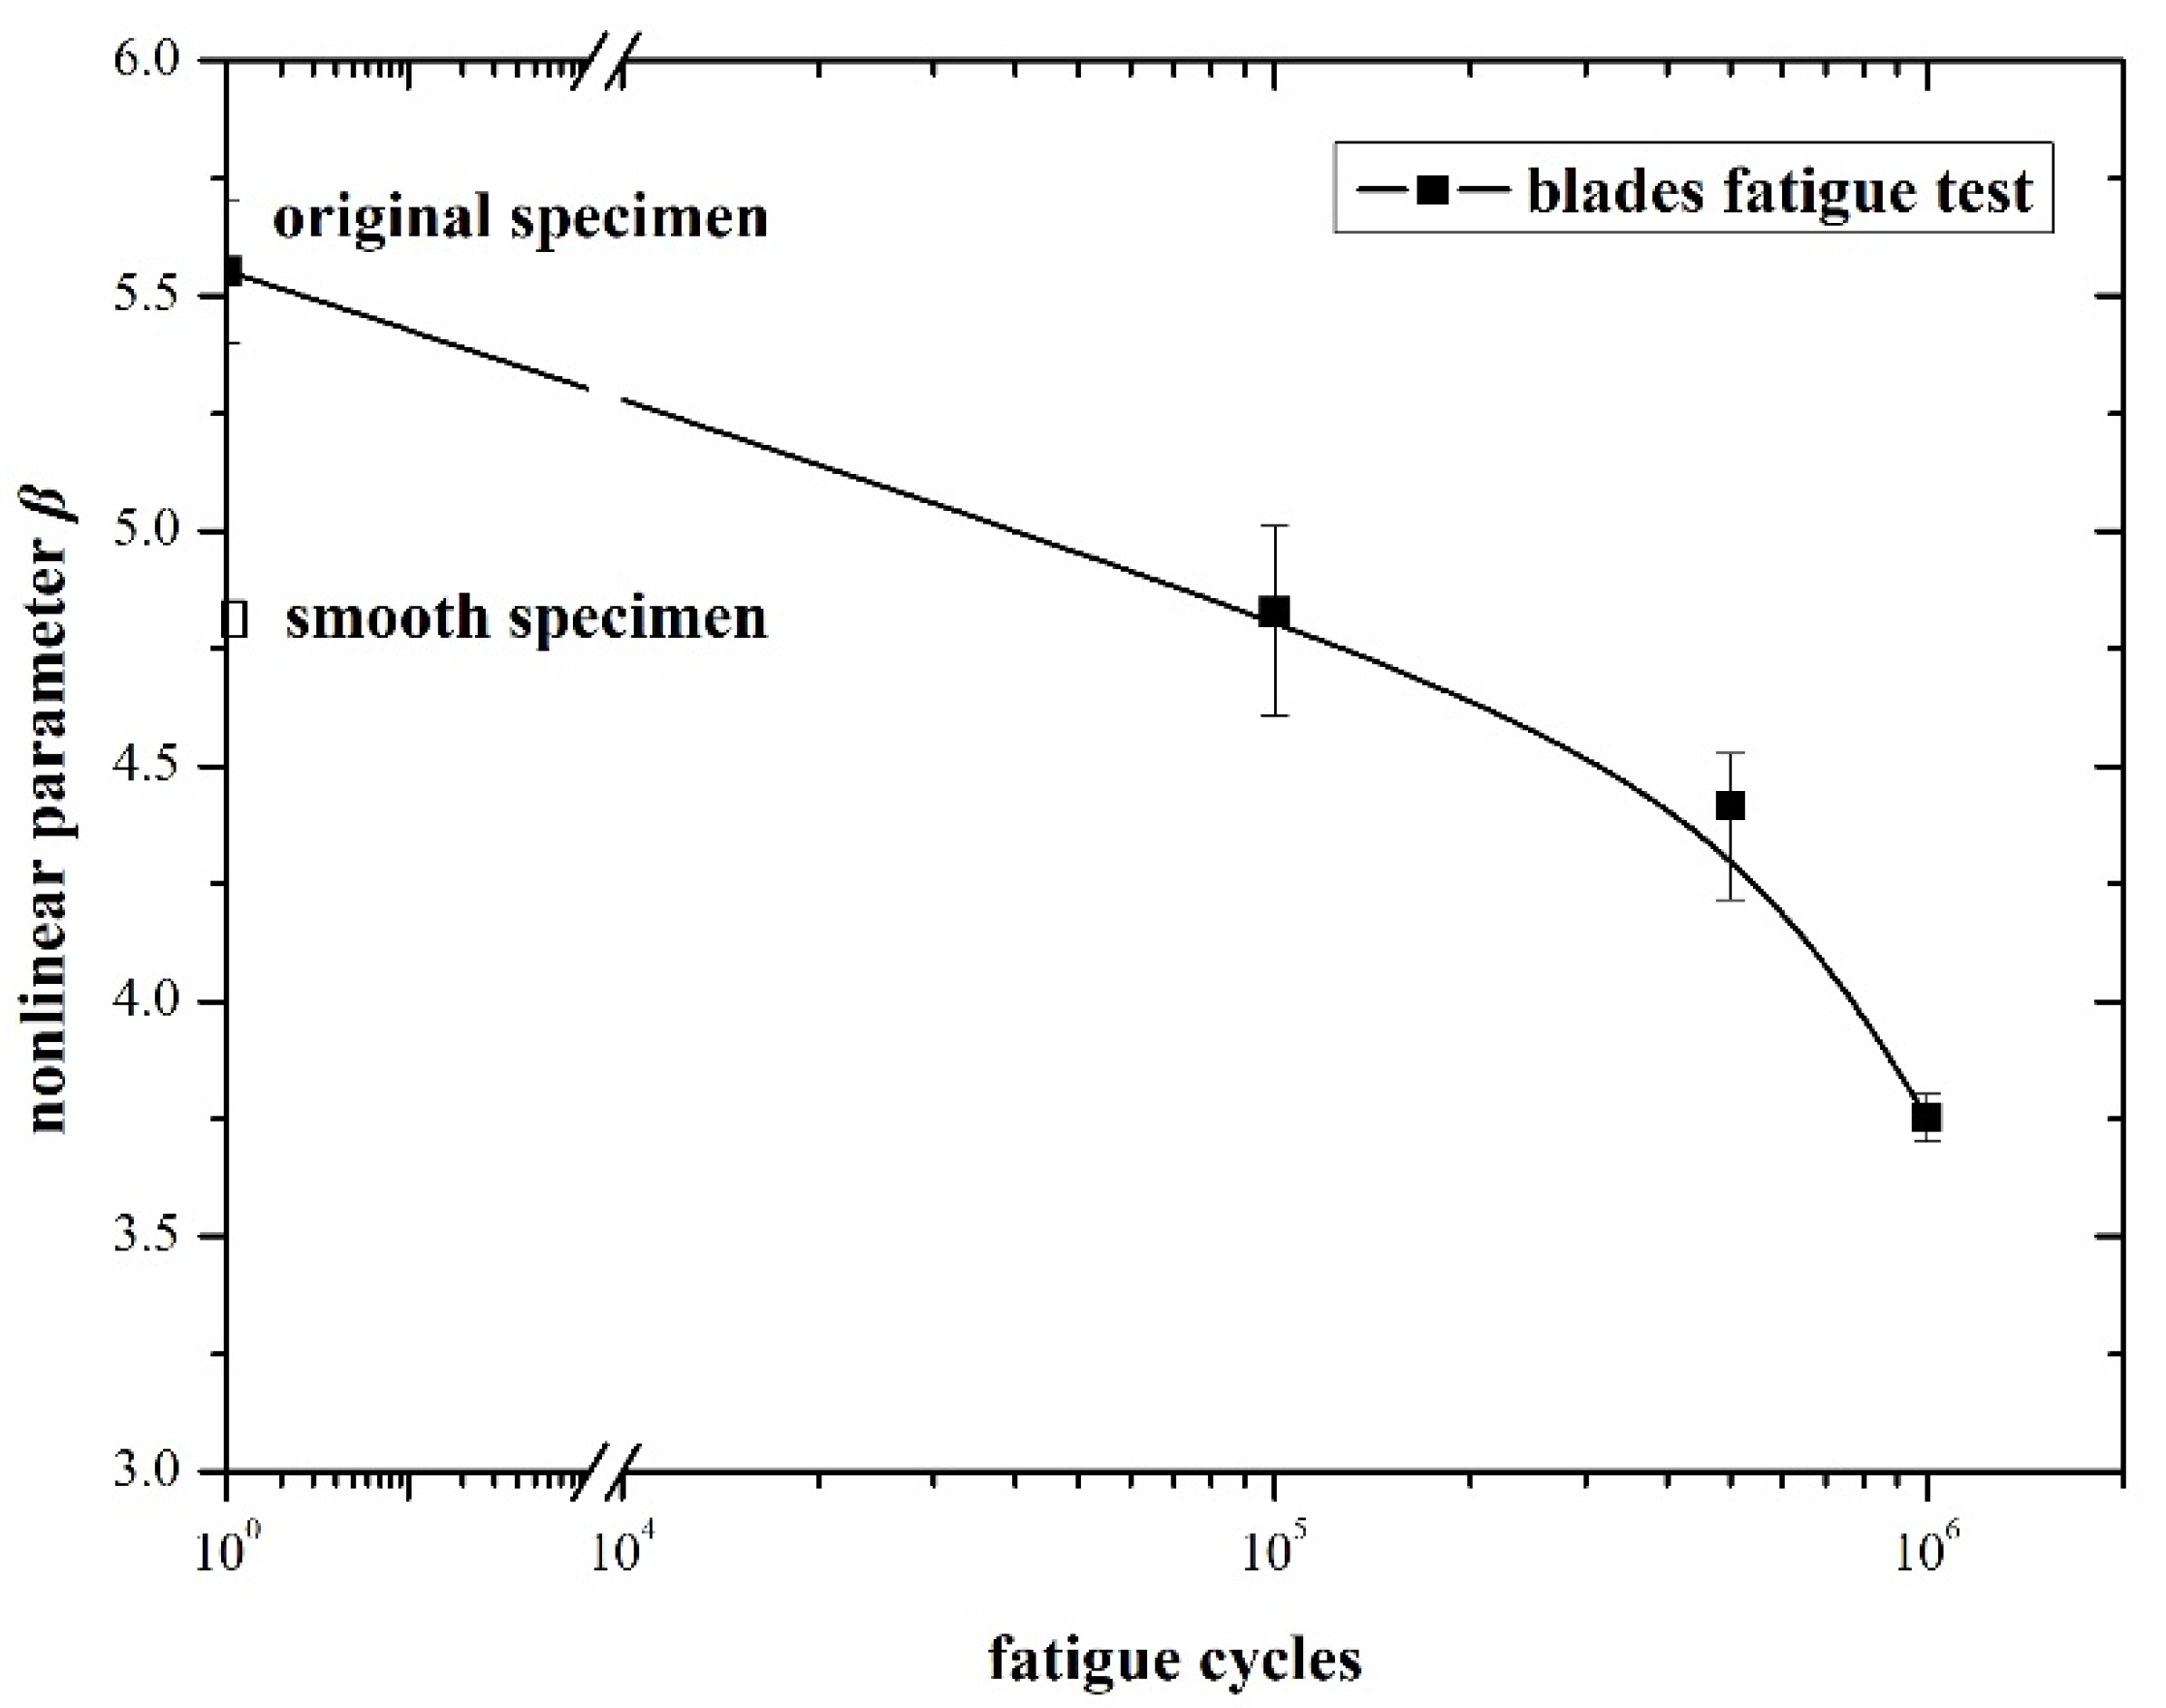
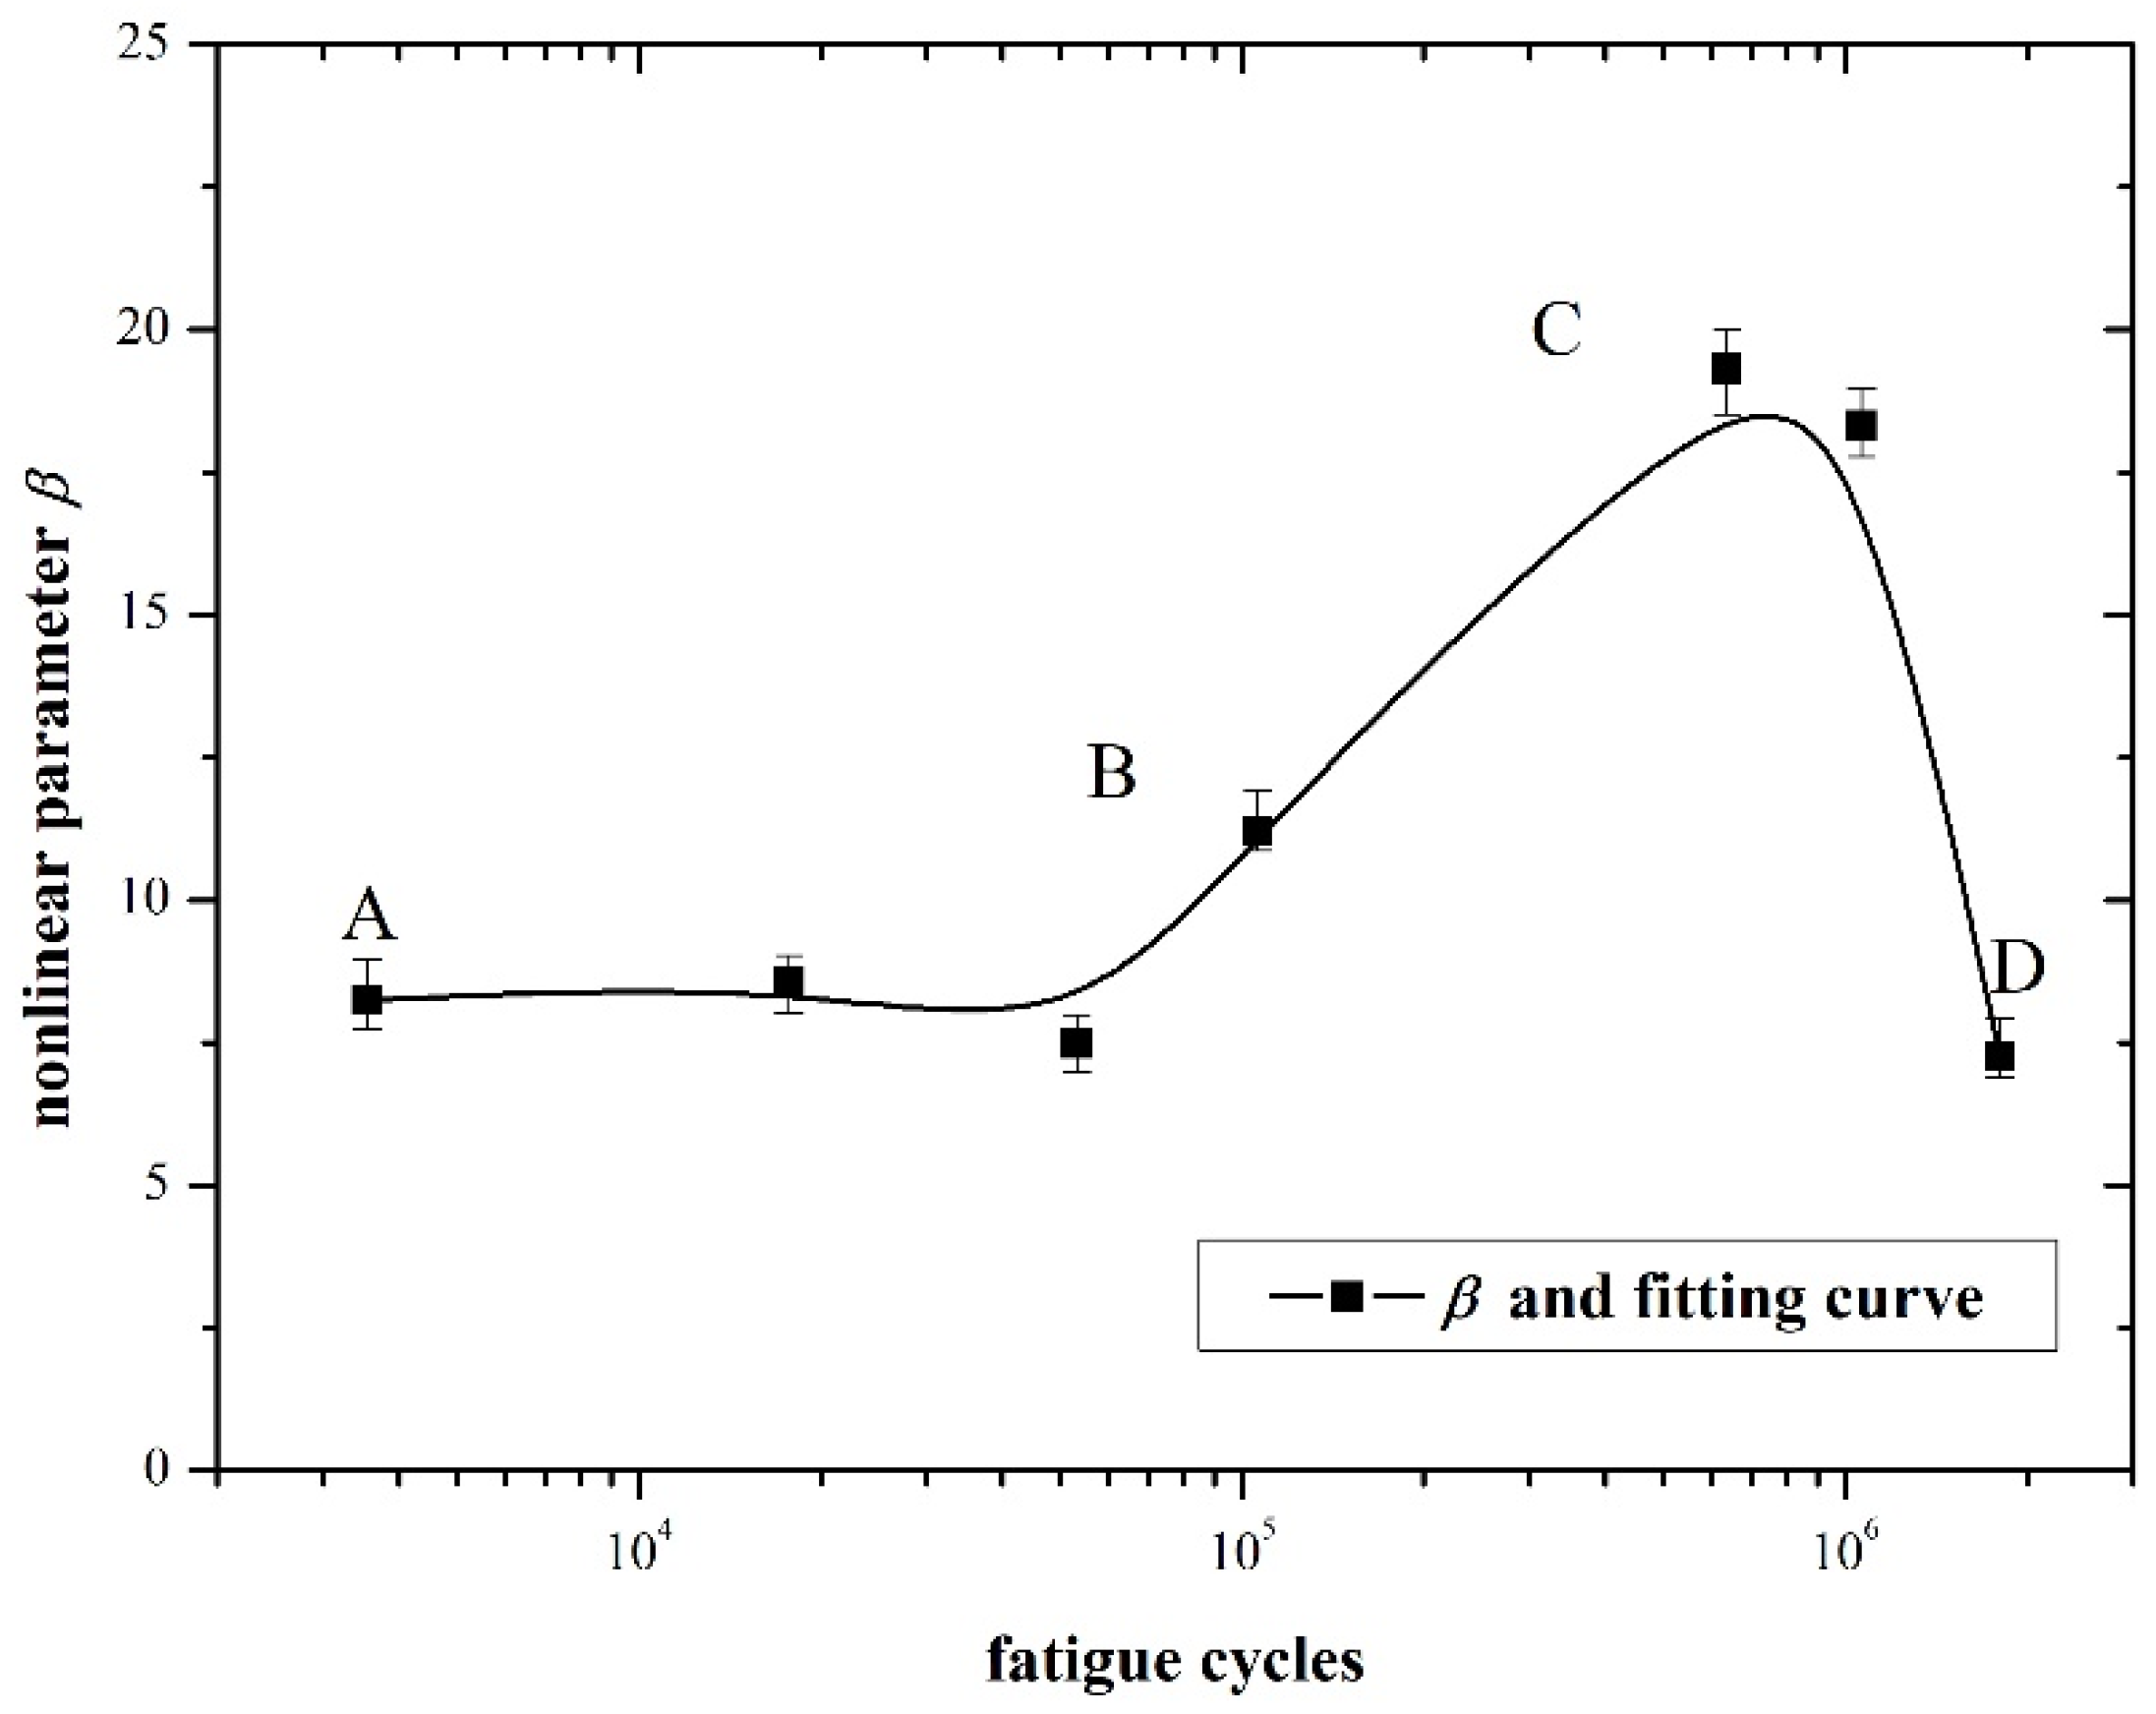
3.2. β–N Curve
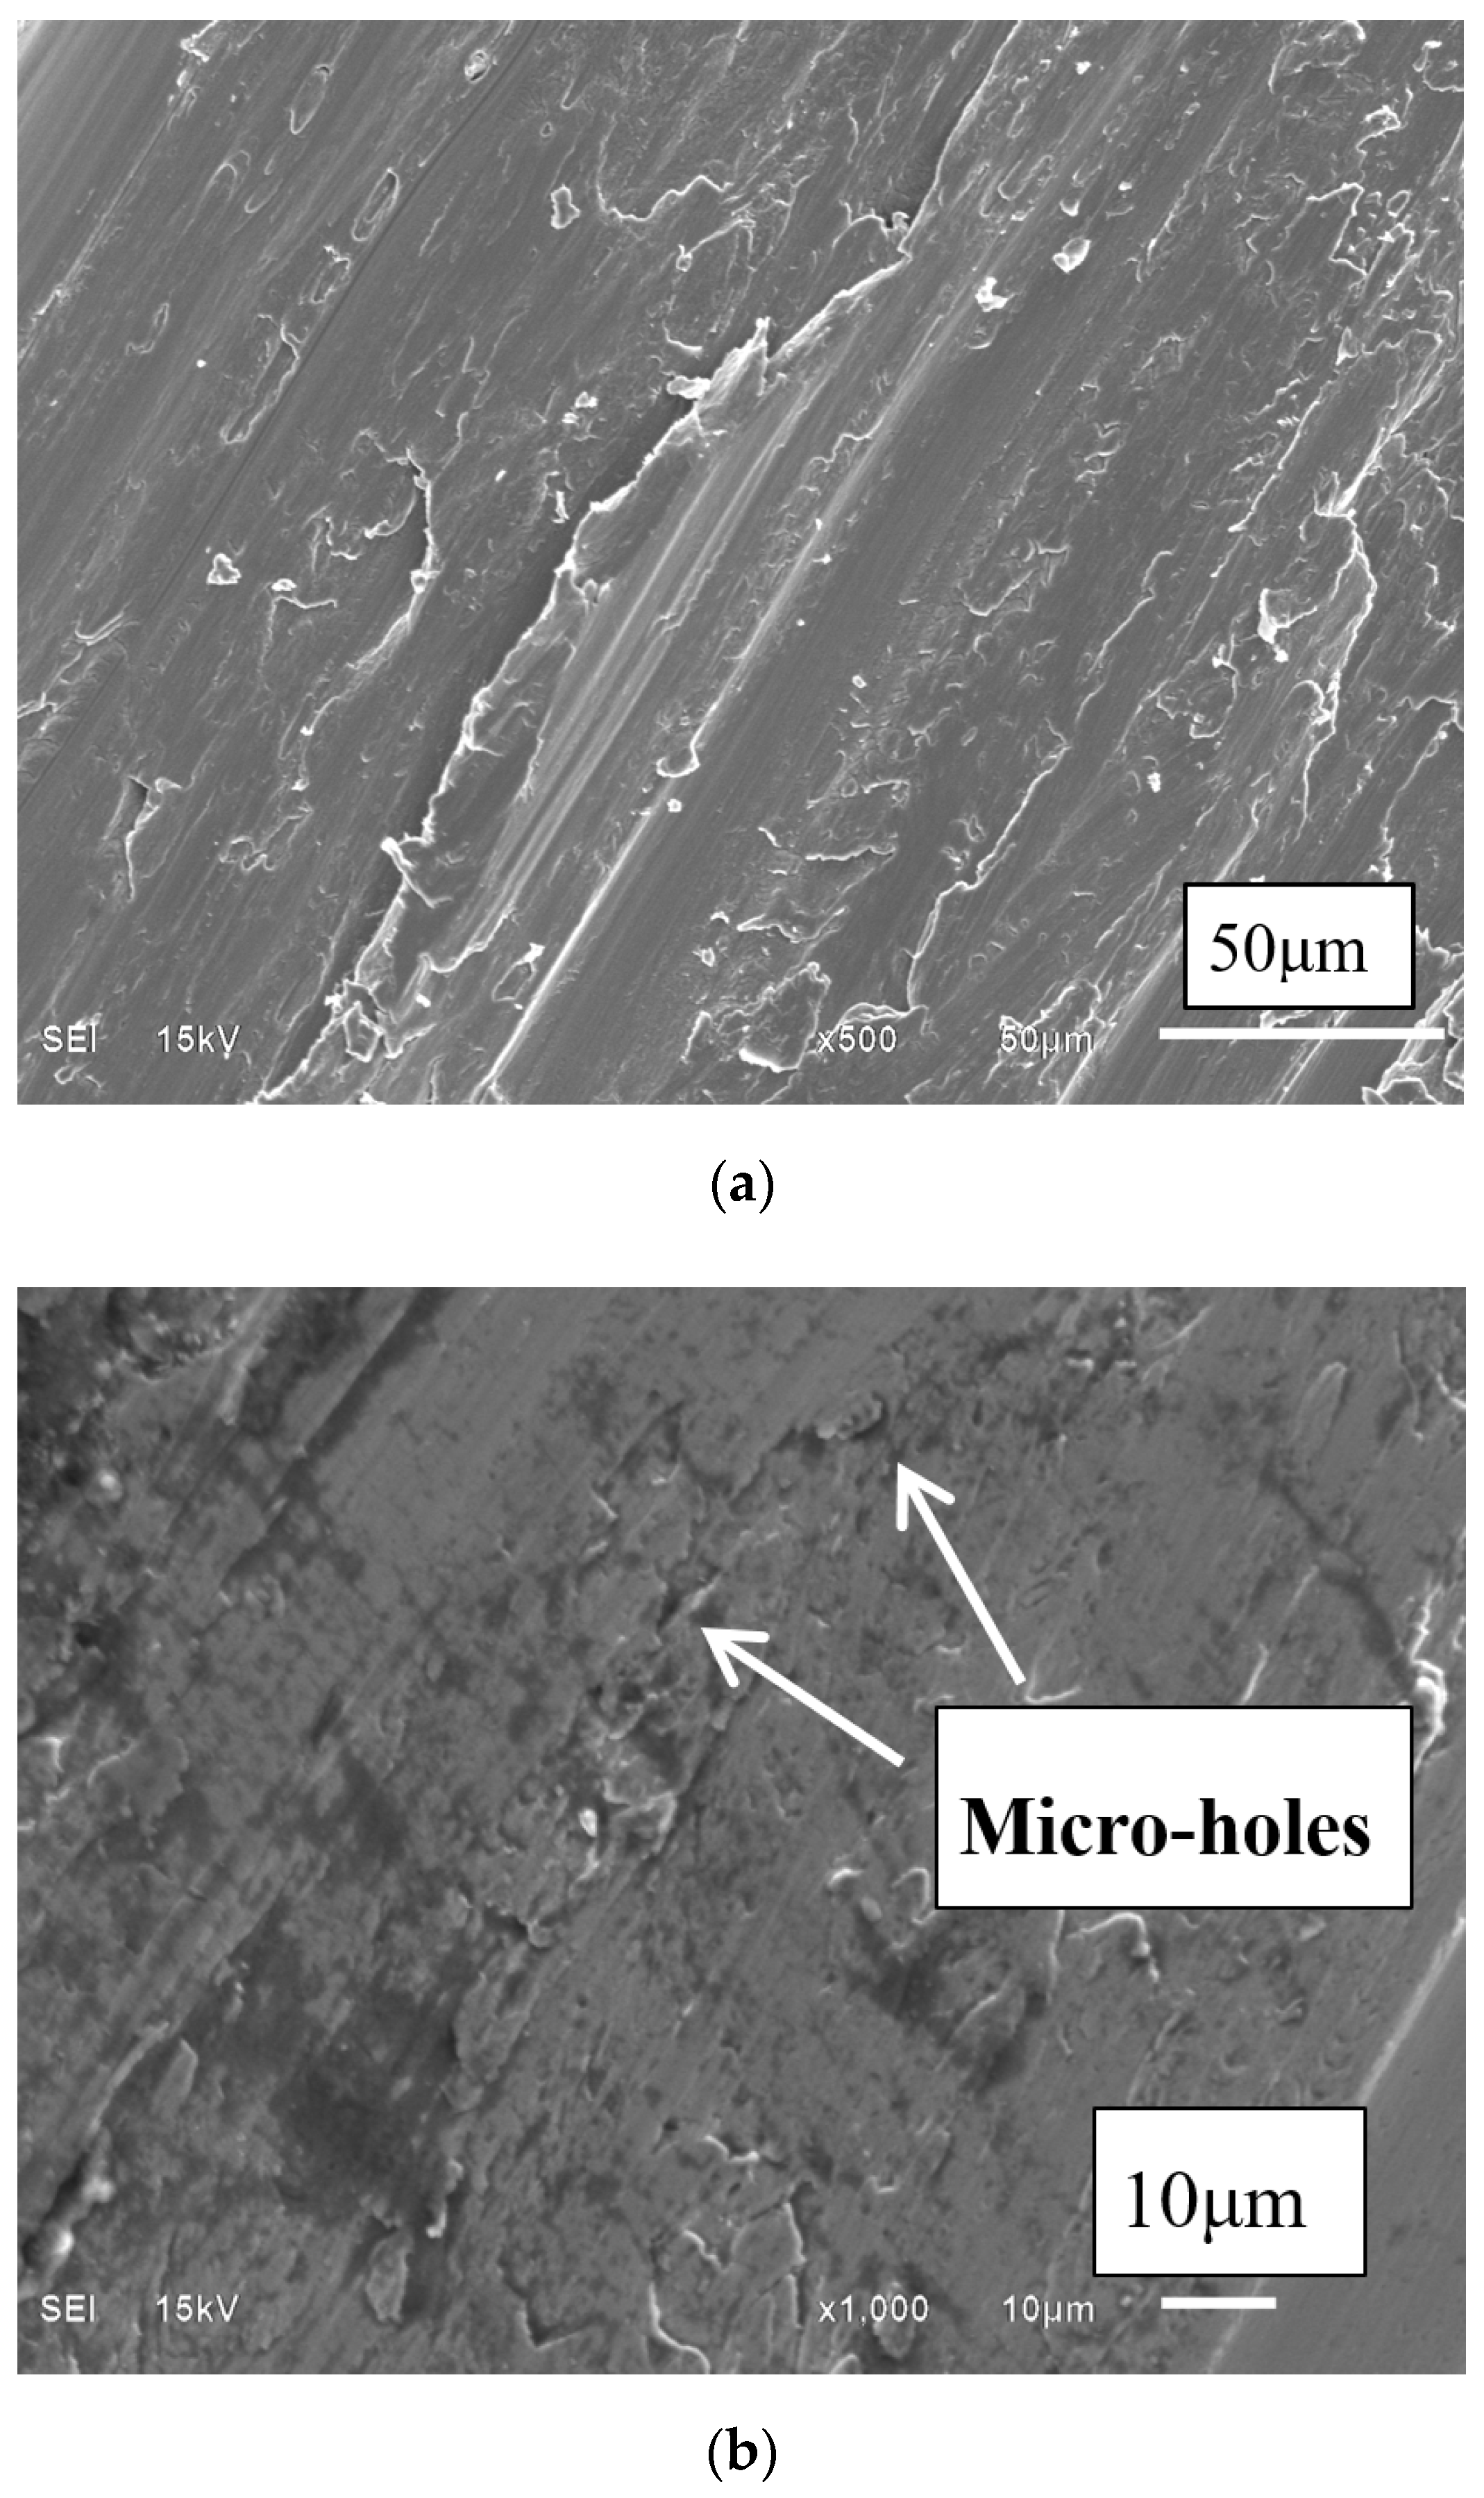
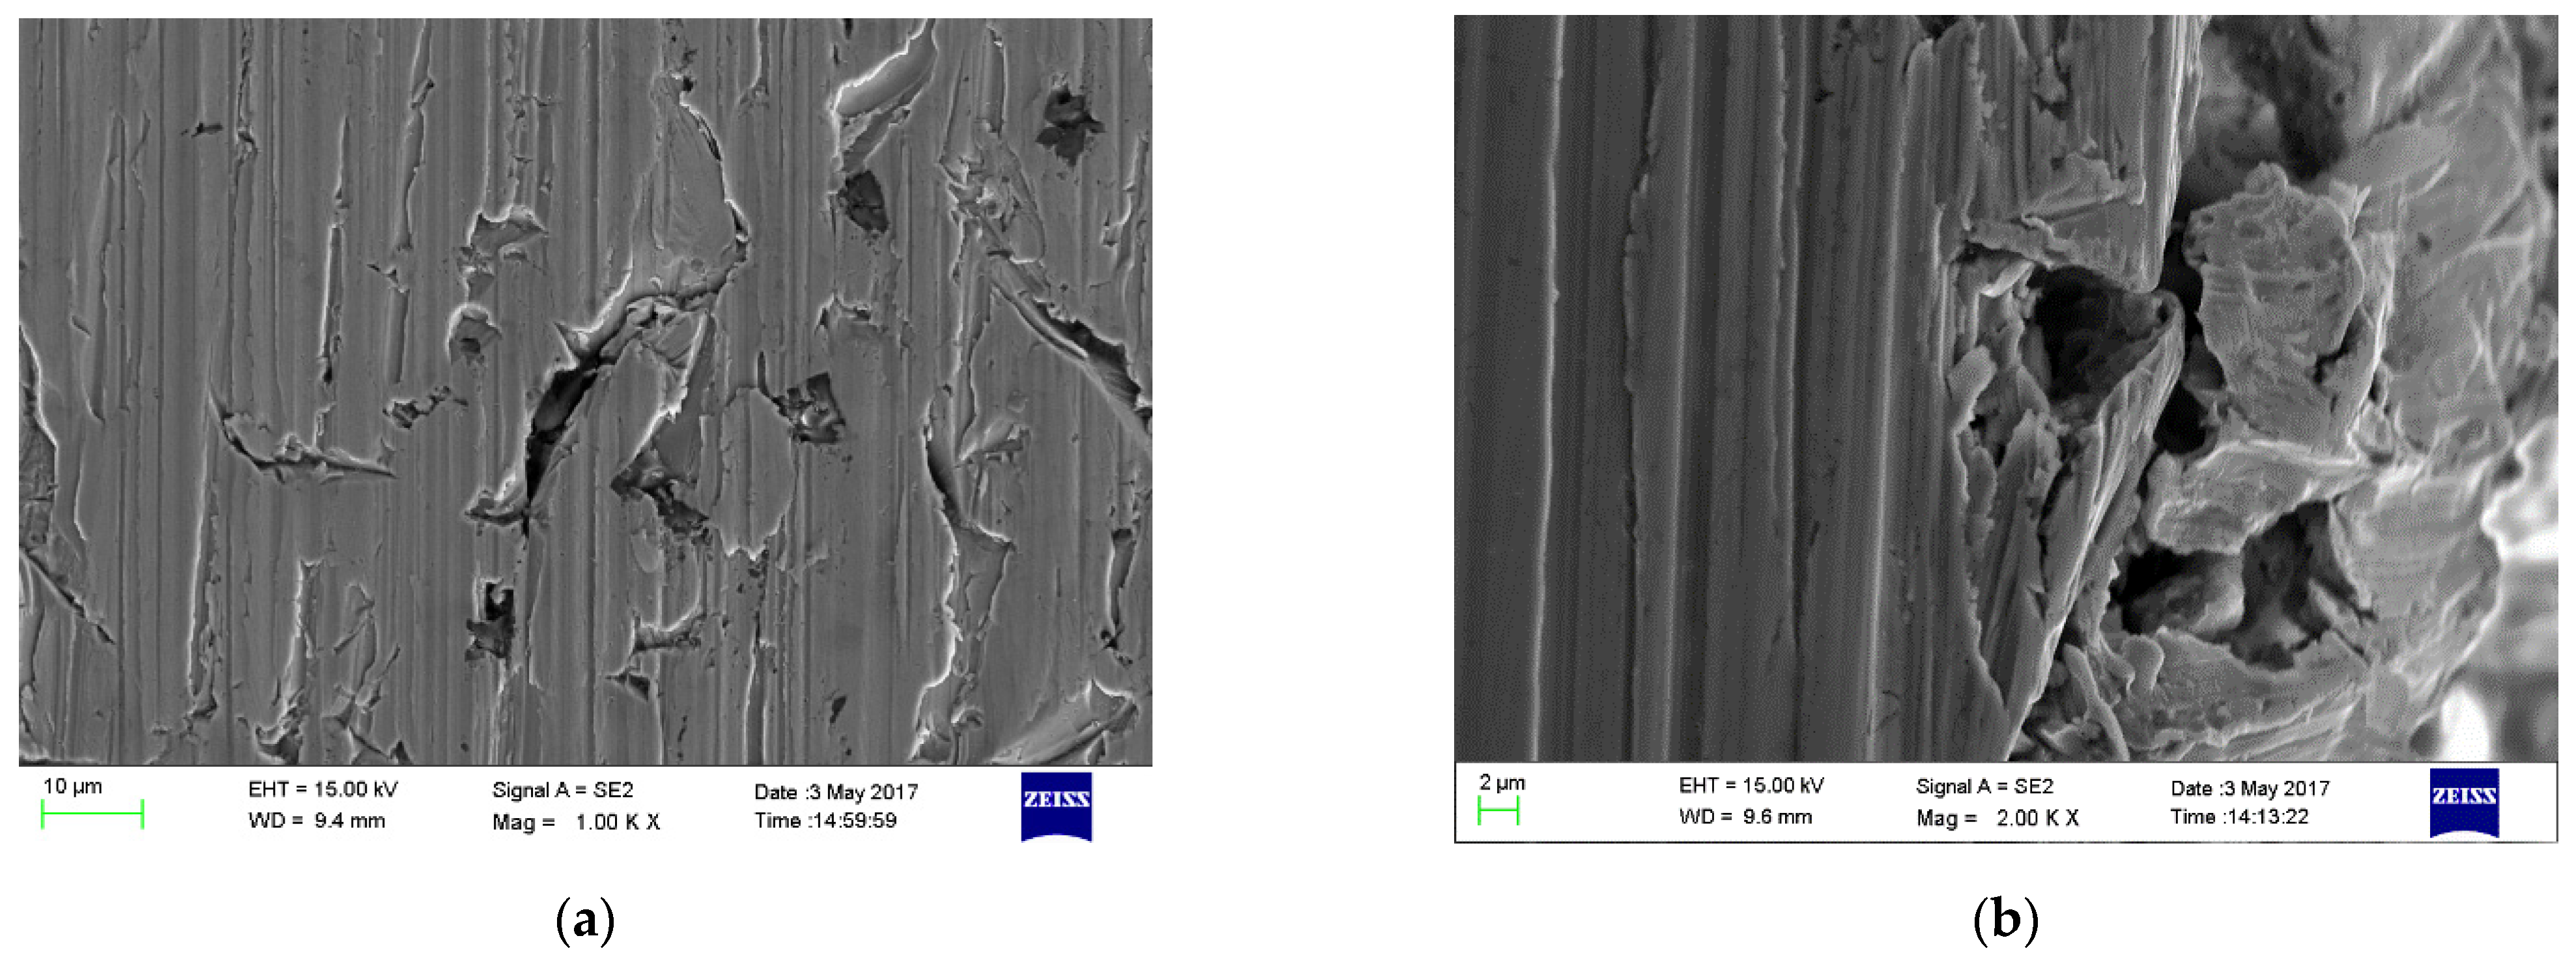
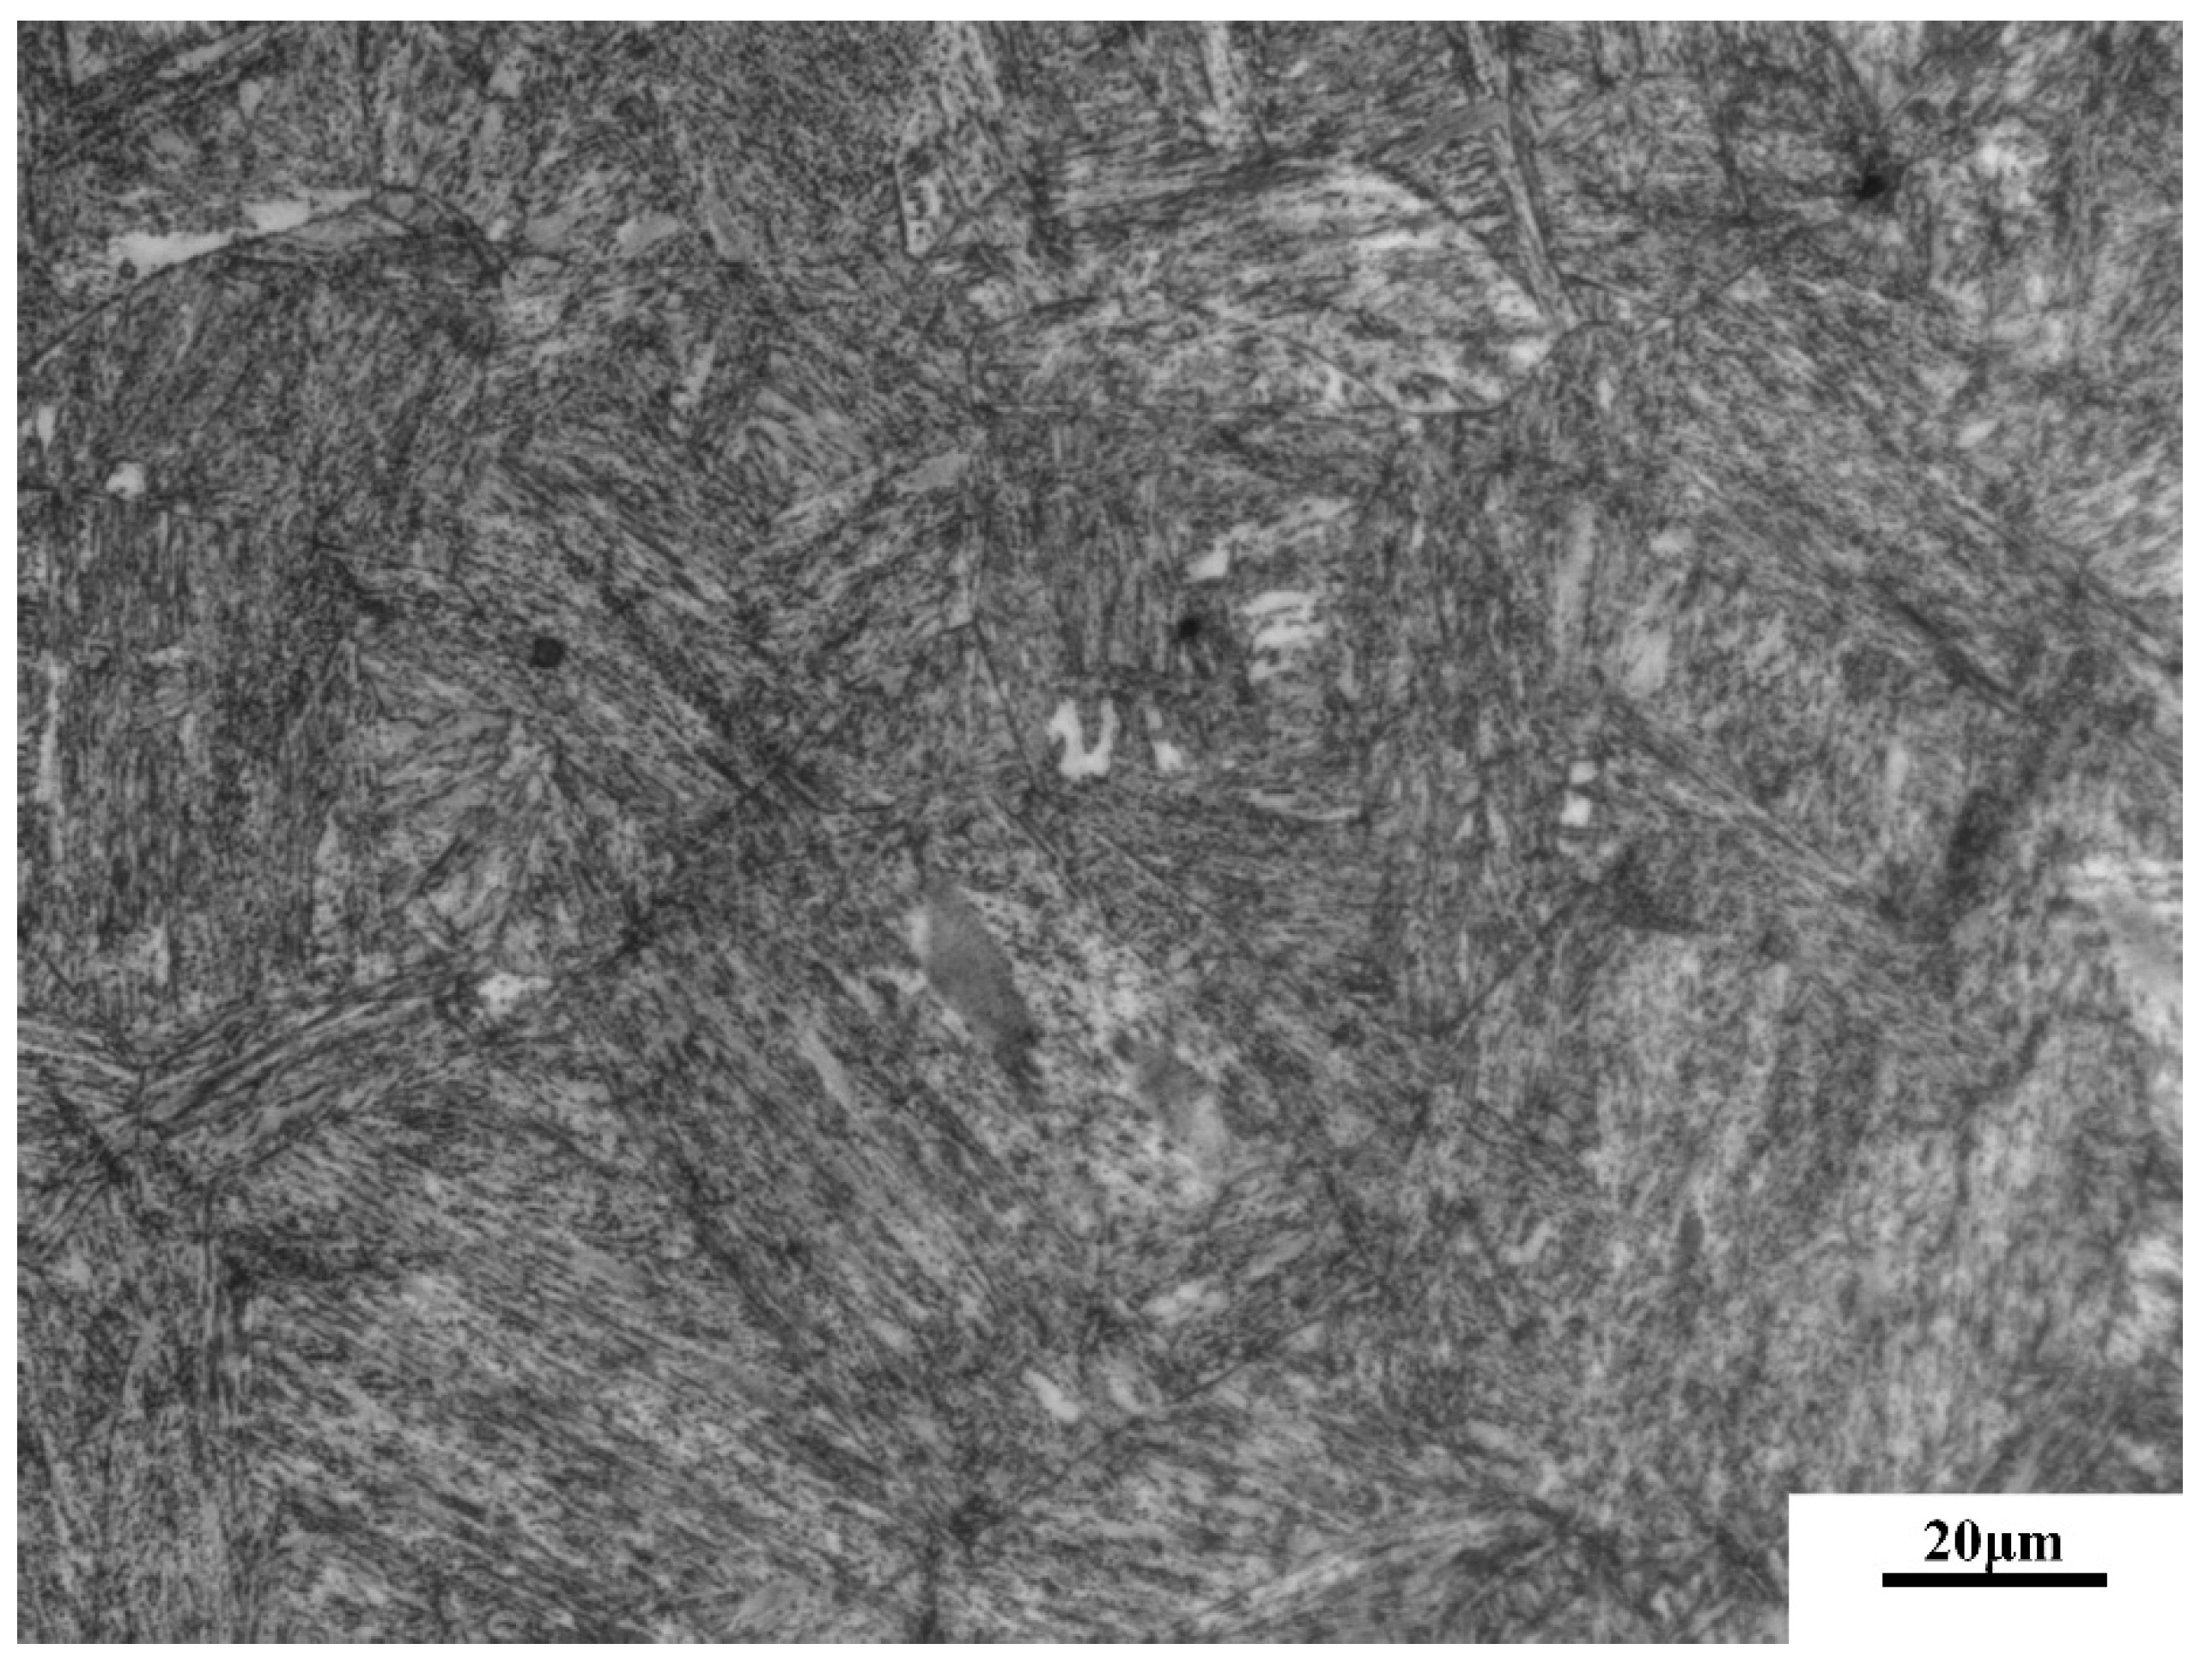
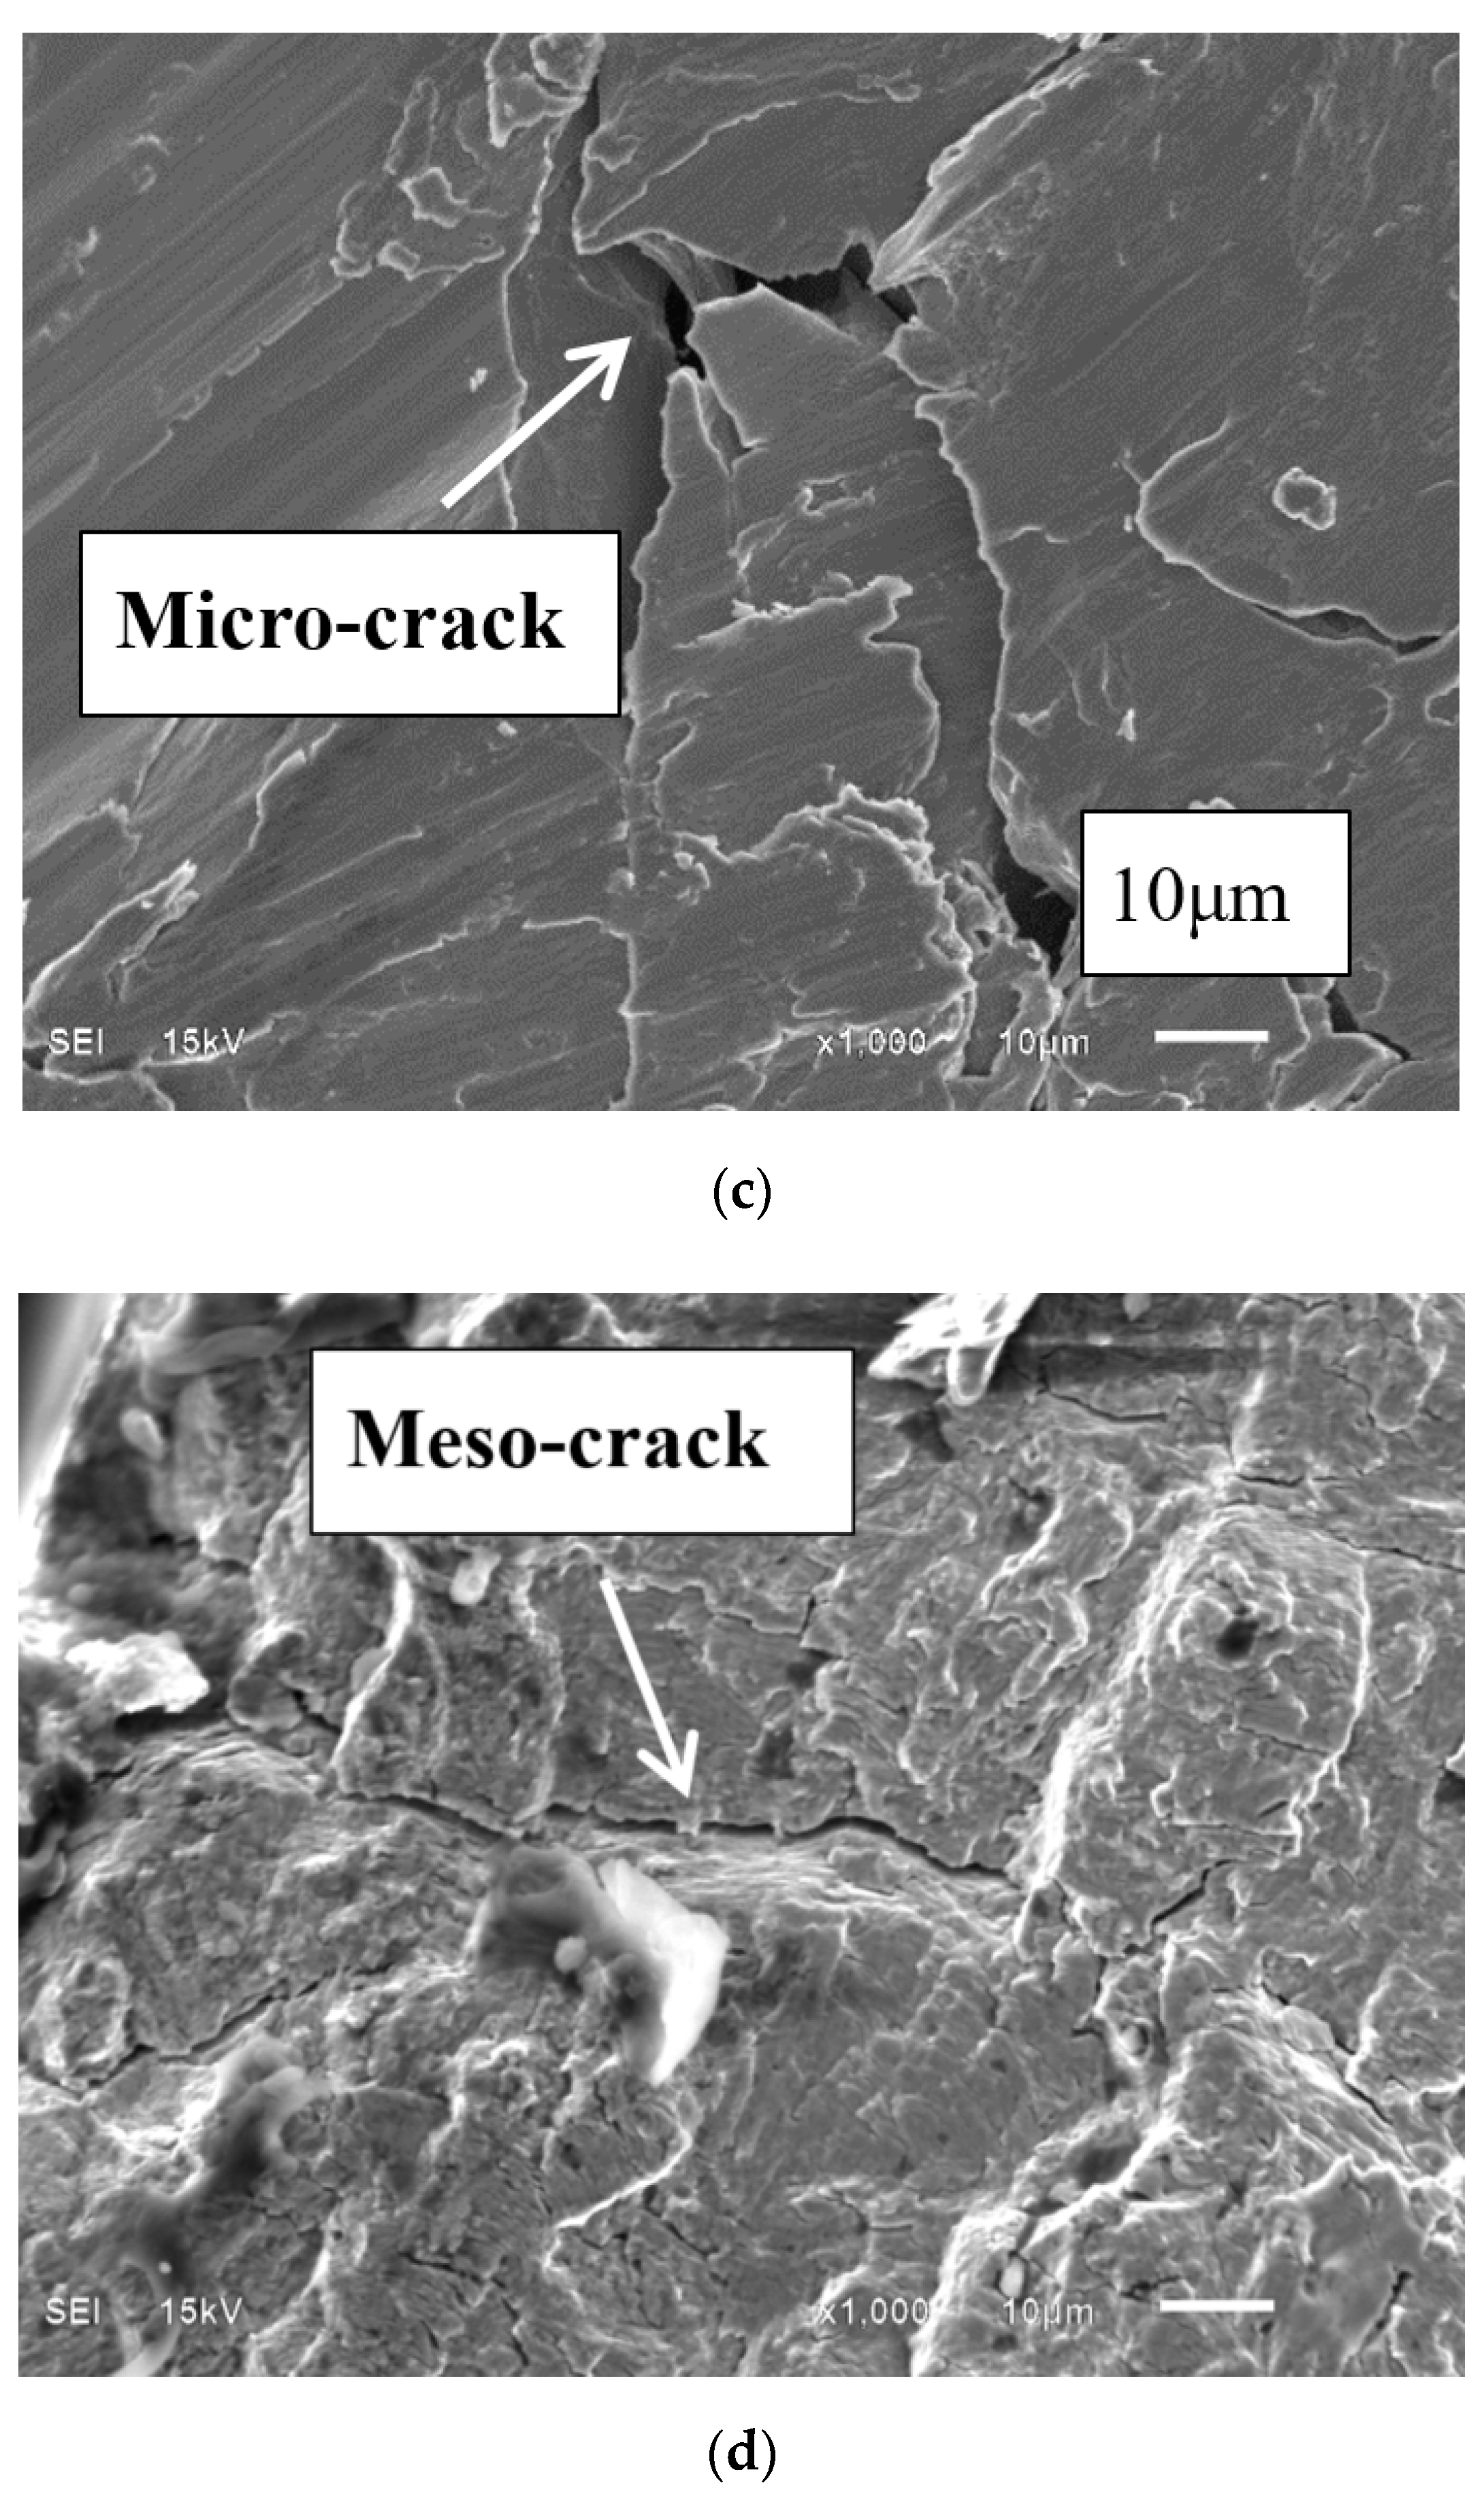
3.3. Microscopic Morphology Analysis
3.4. β–N Curve and Fracture Characteristics of Compressor Blade
4. Discussion
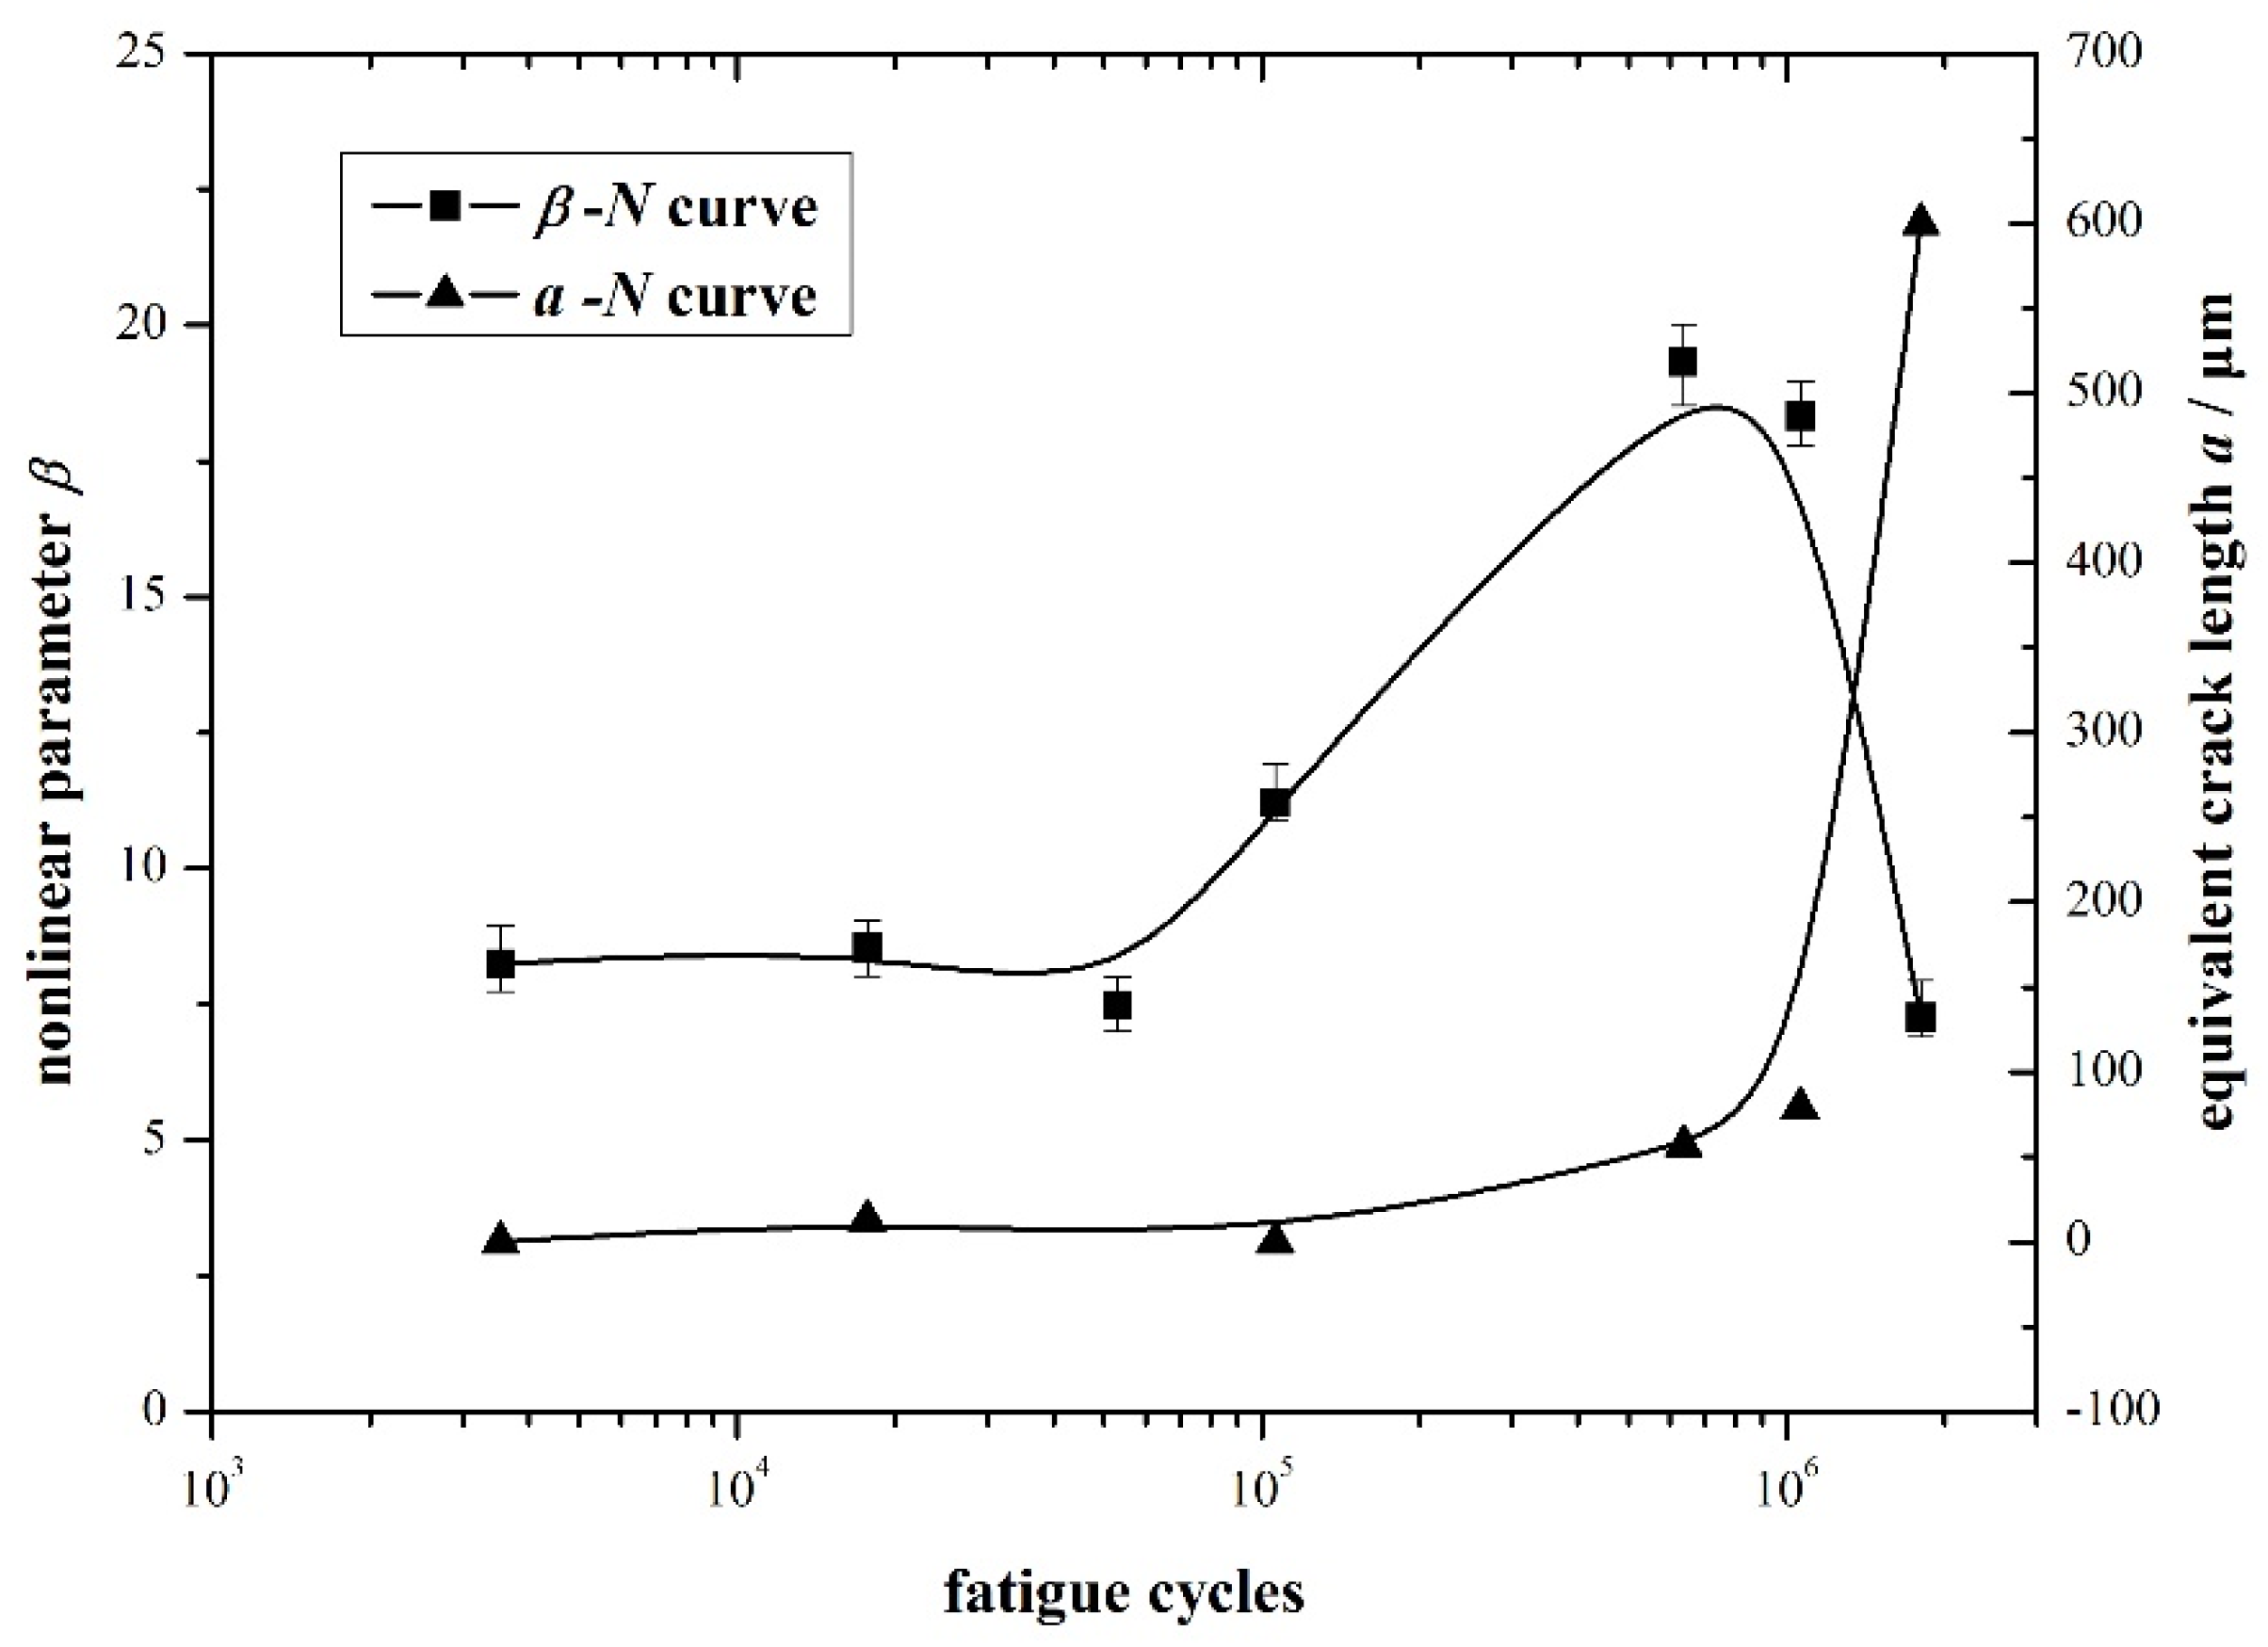
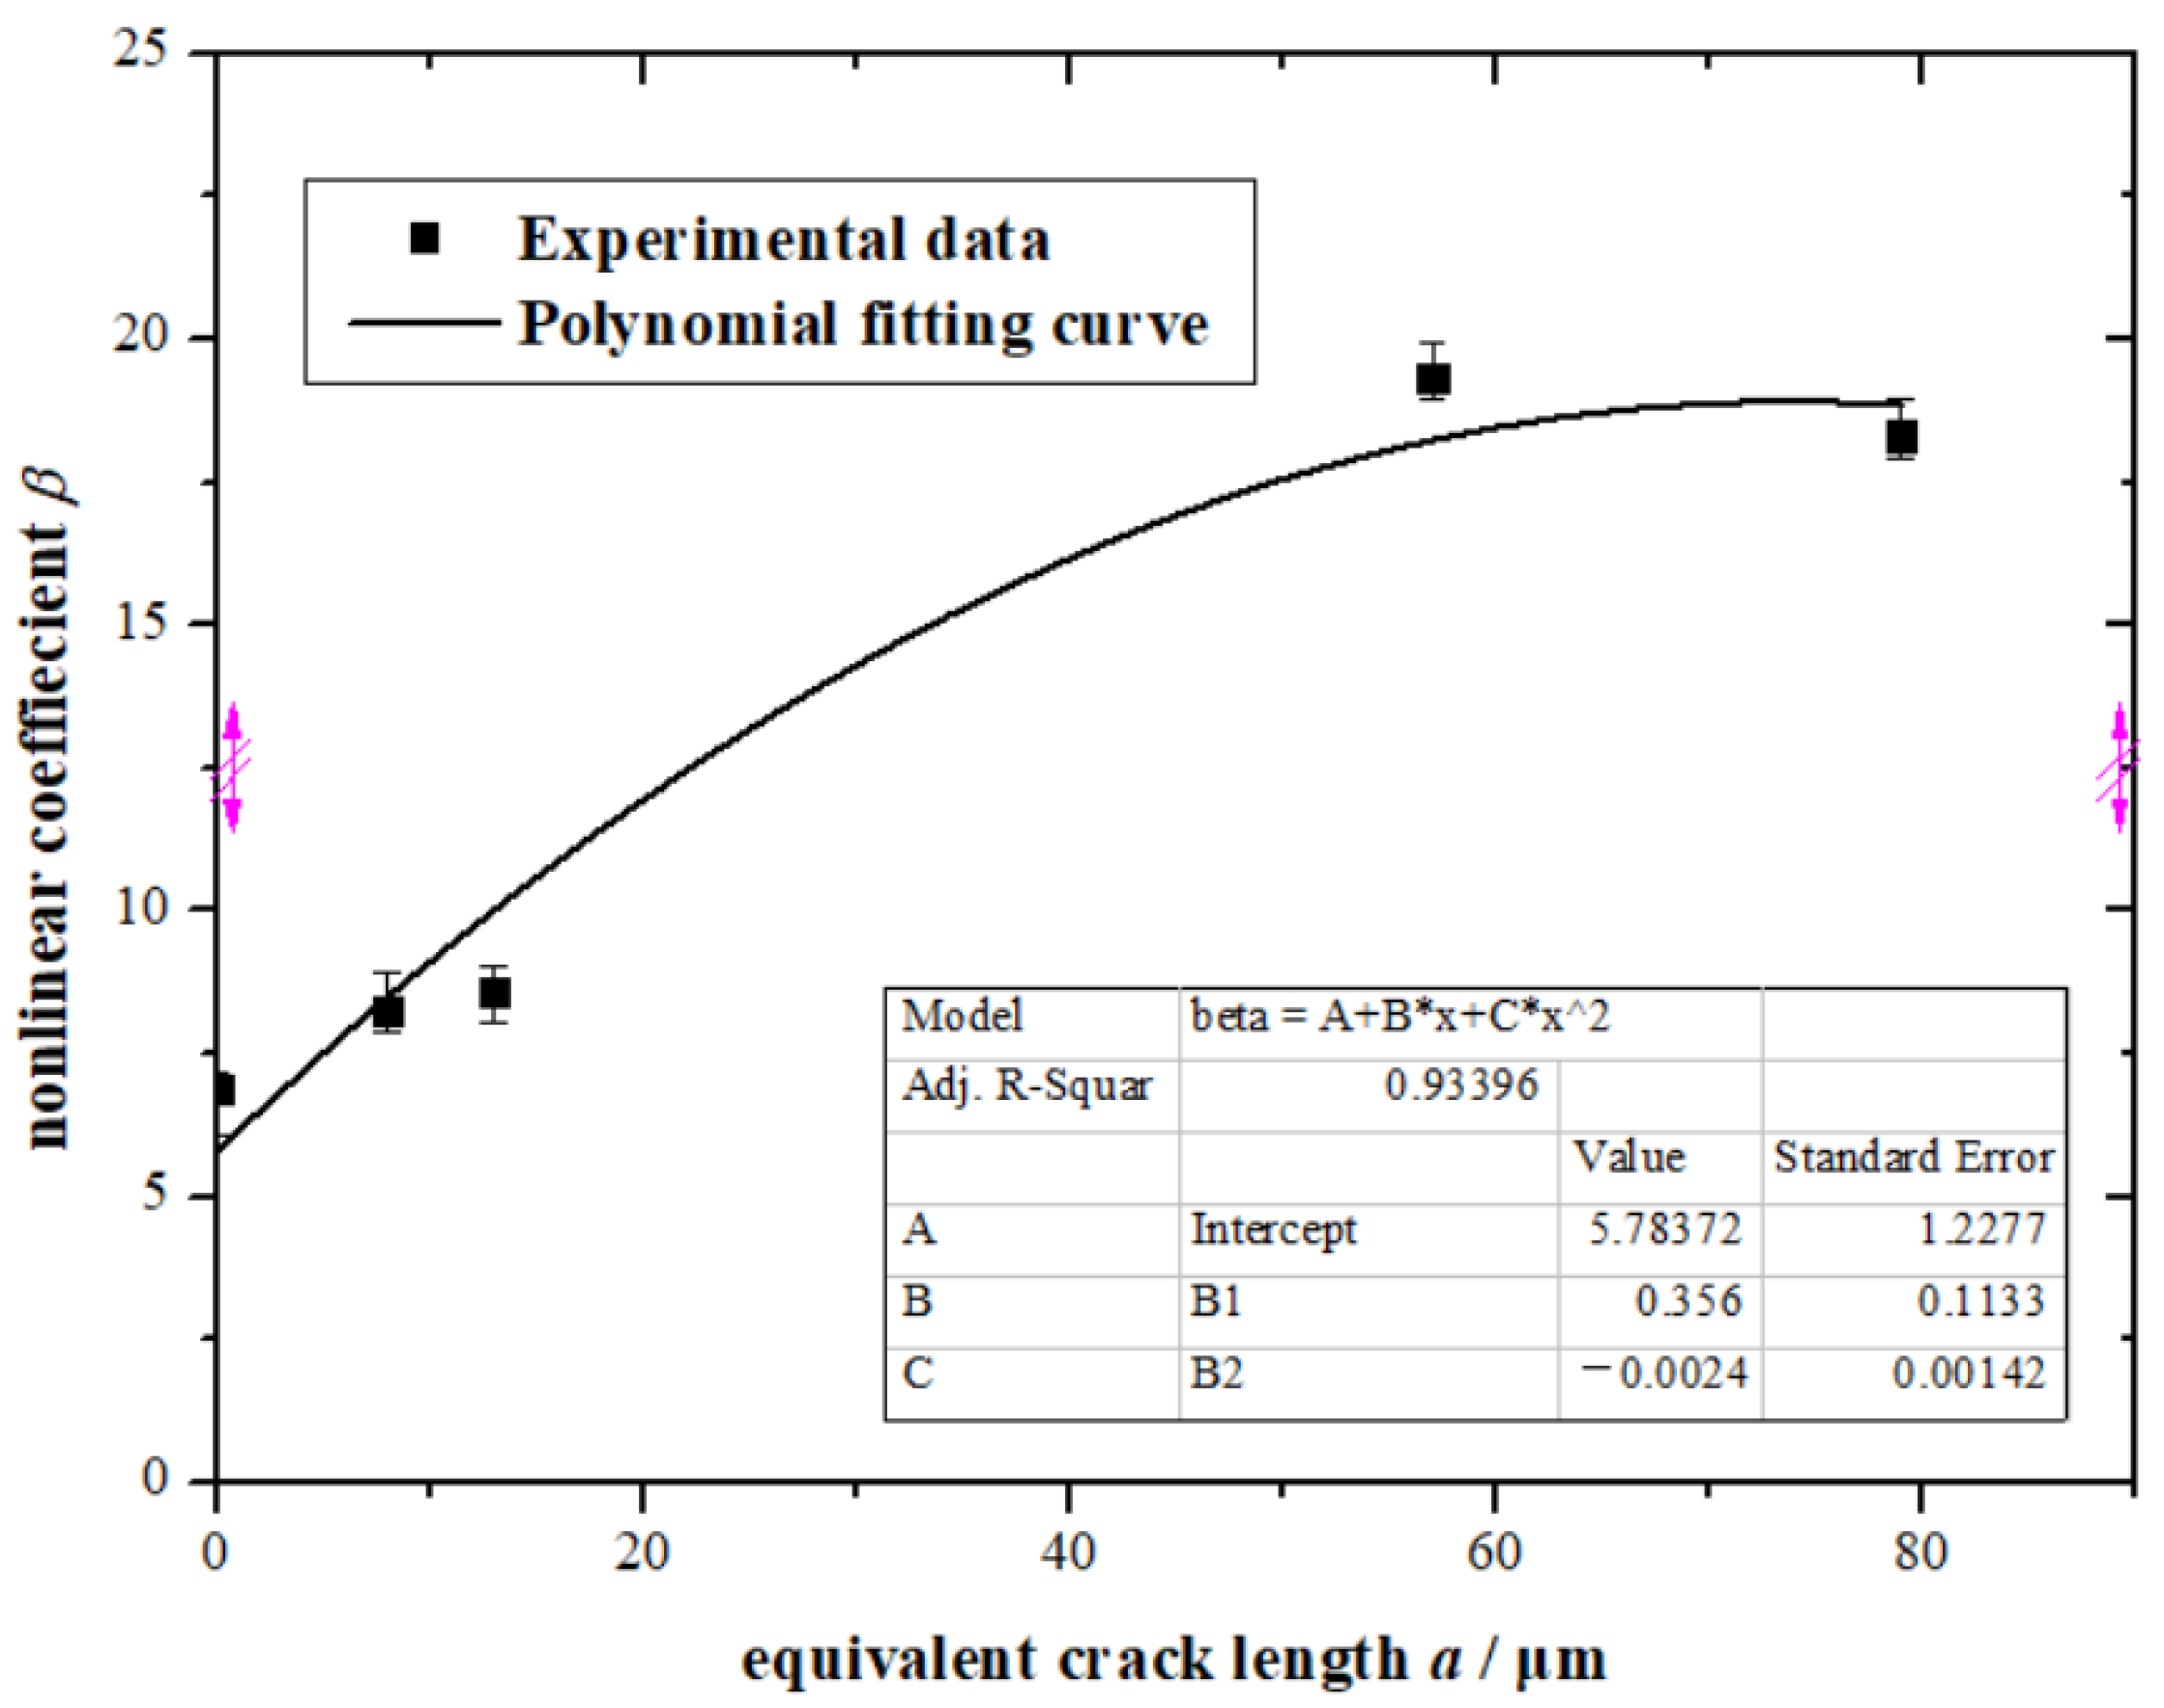
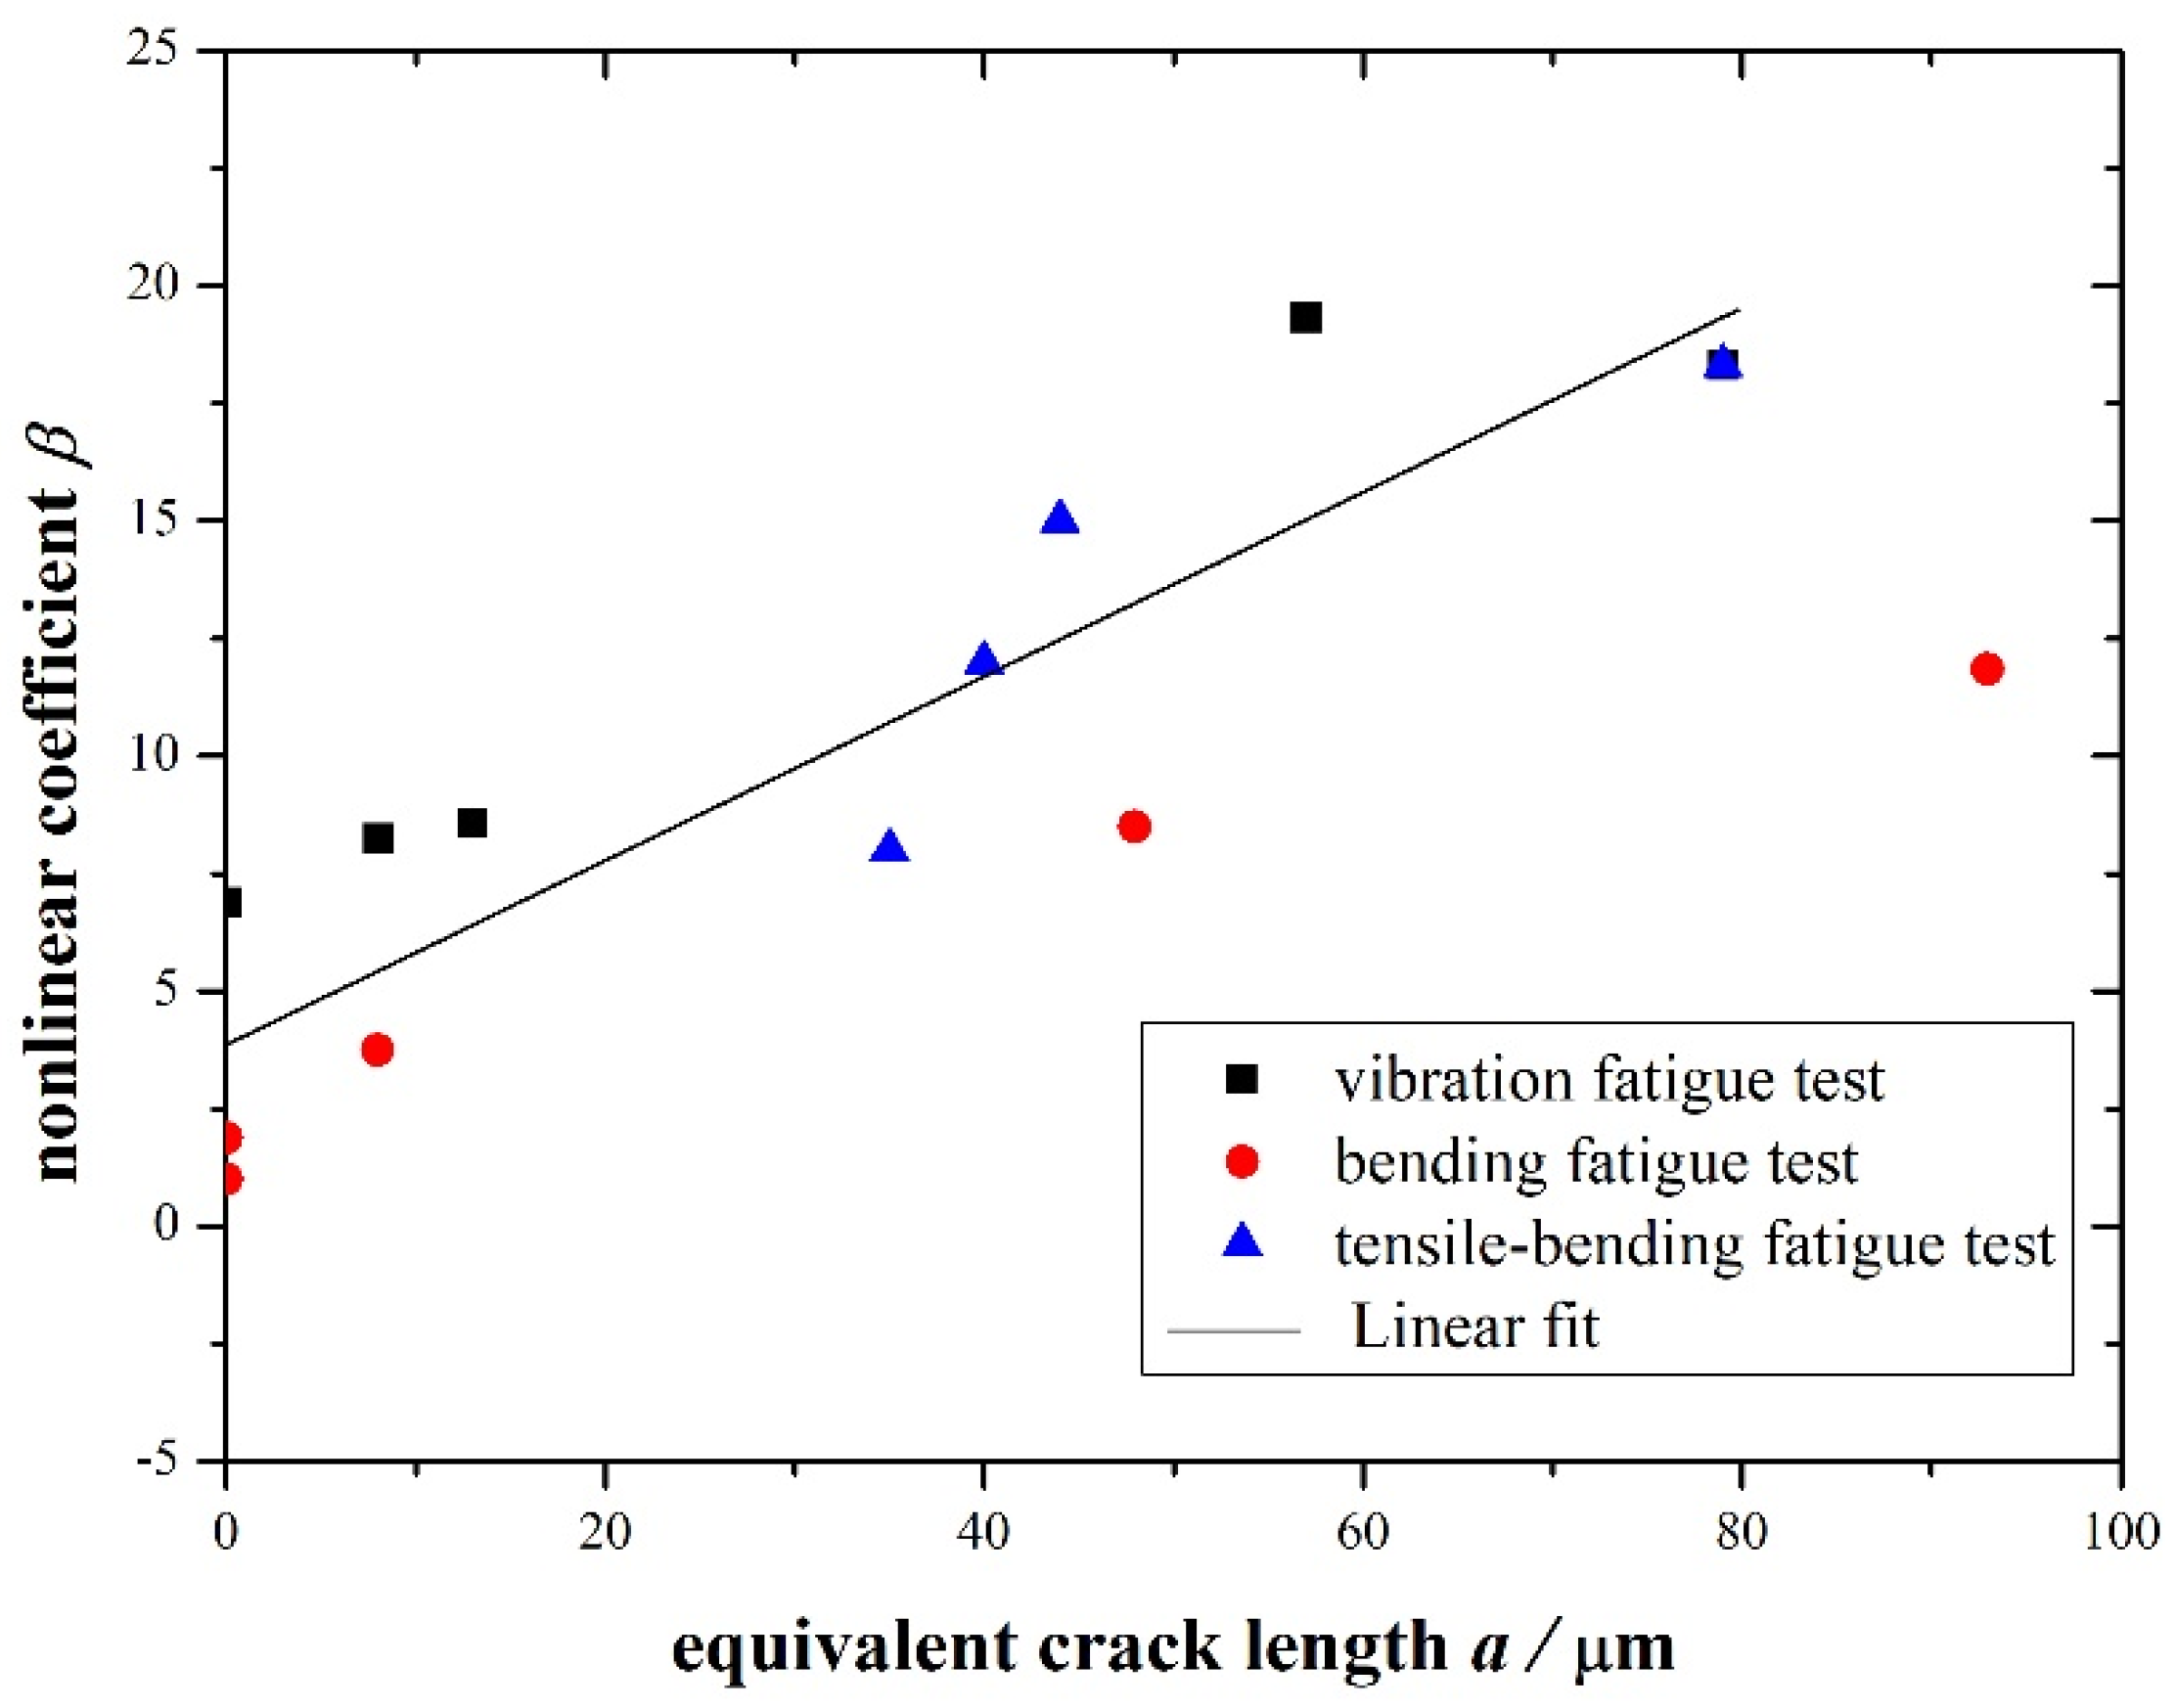
4.1. β–a Curve
4.2. Fatigue Damage Evaluation Method Based on Nonlinear Ultrasonic Detection
5. Conclusions
- (1)
- We obtained the nonlinear coefficient–fatigue cycle curve of the blade material KMN. It was found that the nonlinear coefficient of the material first increased and then decreased with an increase in the number of fatigue cycles.
- (2)
- The microstructure analysis of the cross section of the specimens was carried out, and the relationship between the expansion of the micro-crack inside the material and the nonlinear coefficient was analyzed. As the number of fatigue cycles increased, the microstructure of the specimen gradually deteriorated and cracks occurred. This proves that nonlinear ultrasonic detection can be used to characterize the micro-cracks in the early fatigue stage of materials. The nonlinear coefficient β of the material can be used to reflect the fatigue damage inside the material.
- (3)
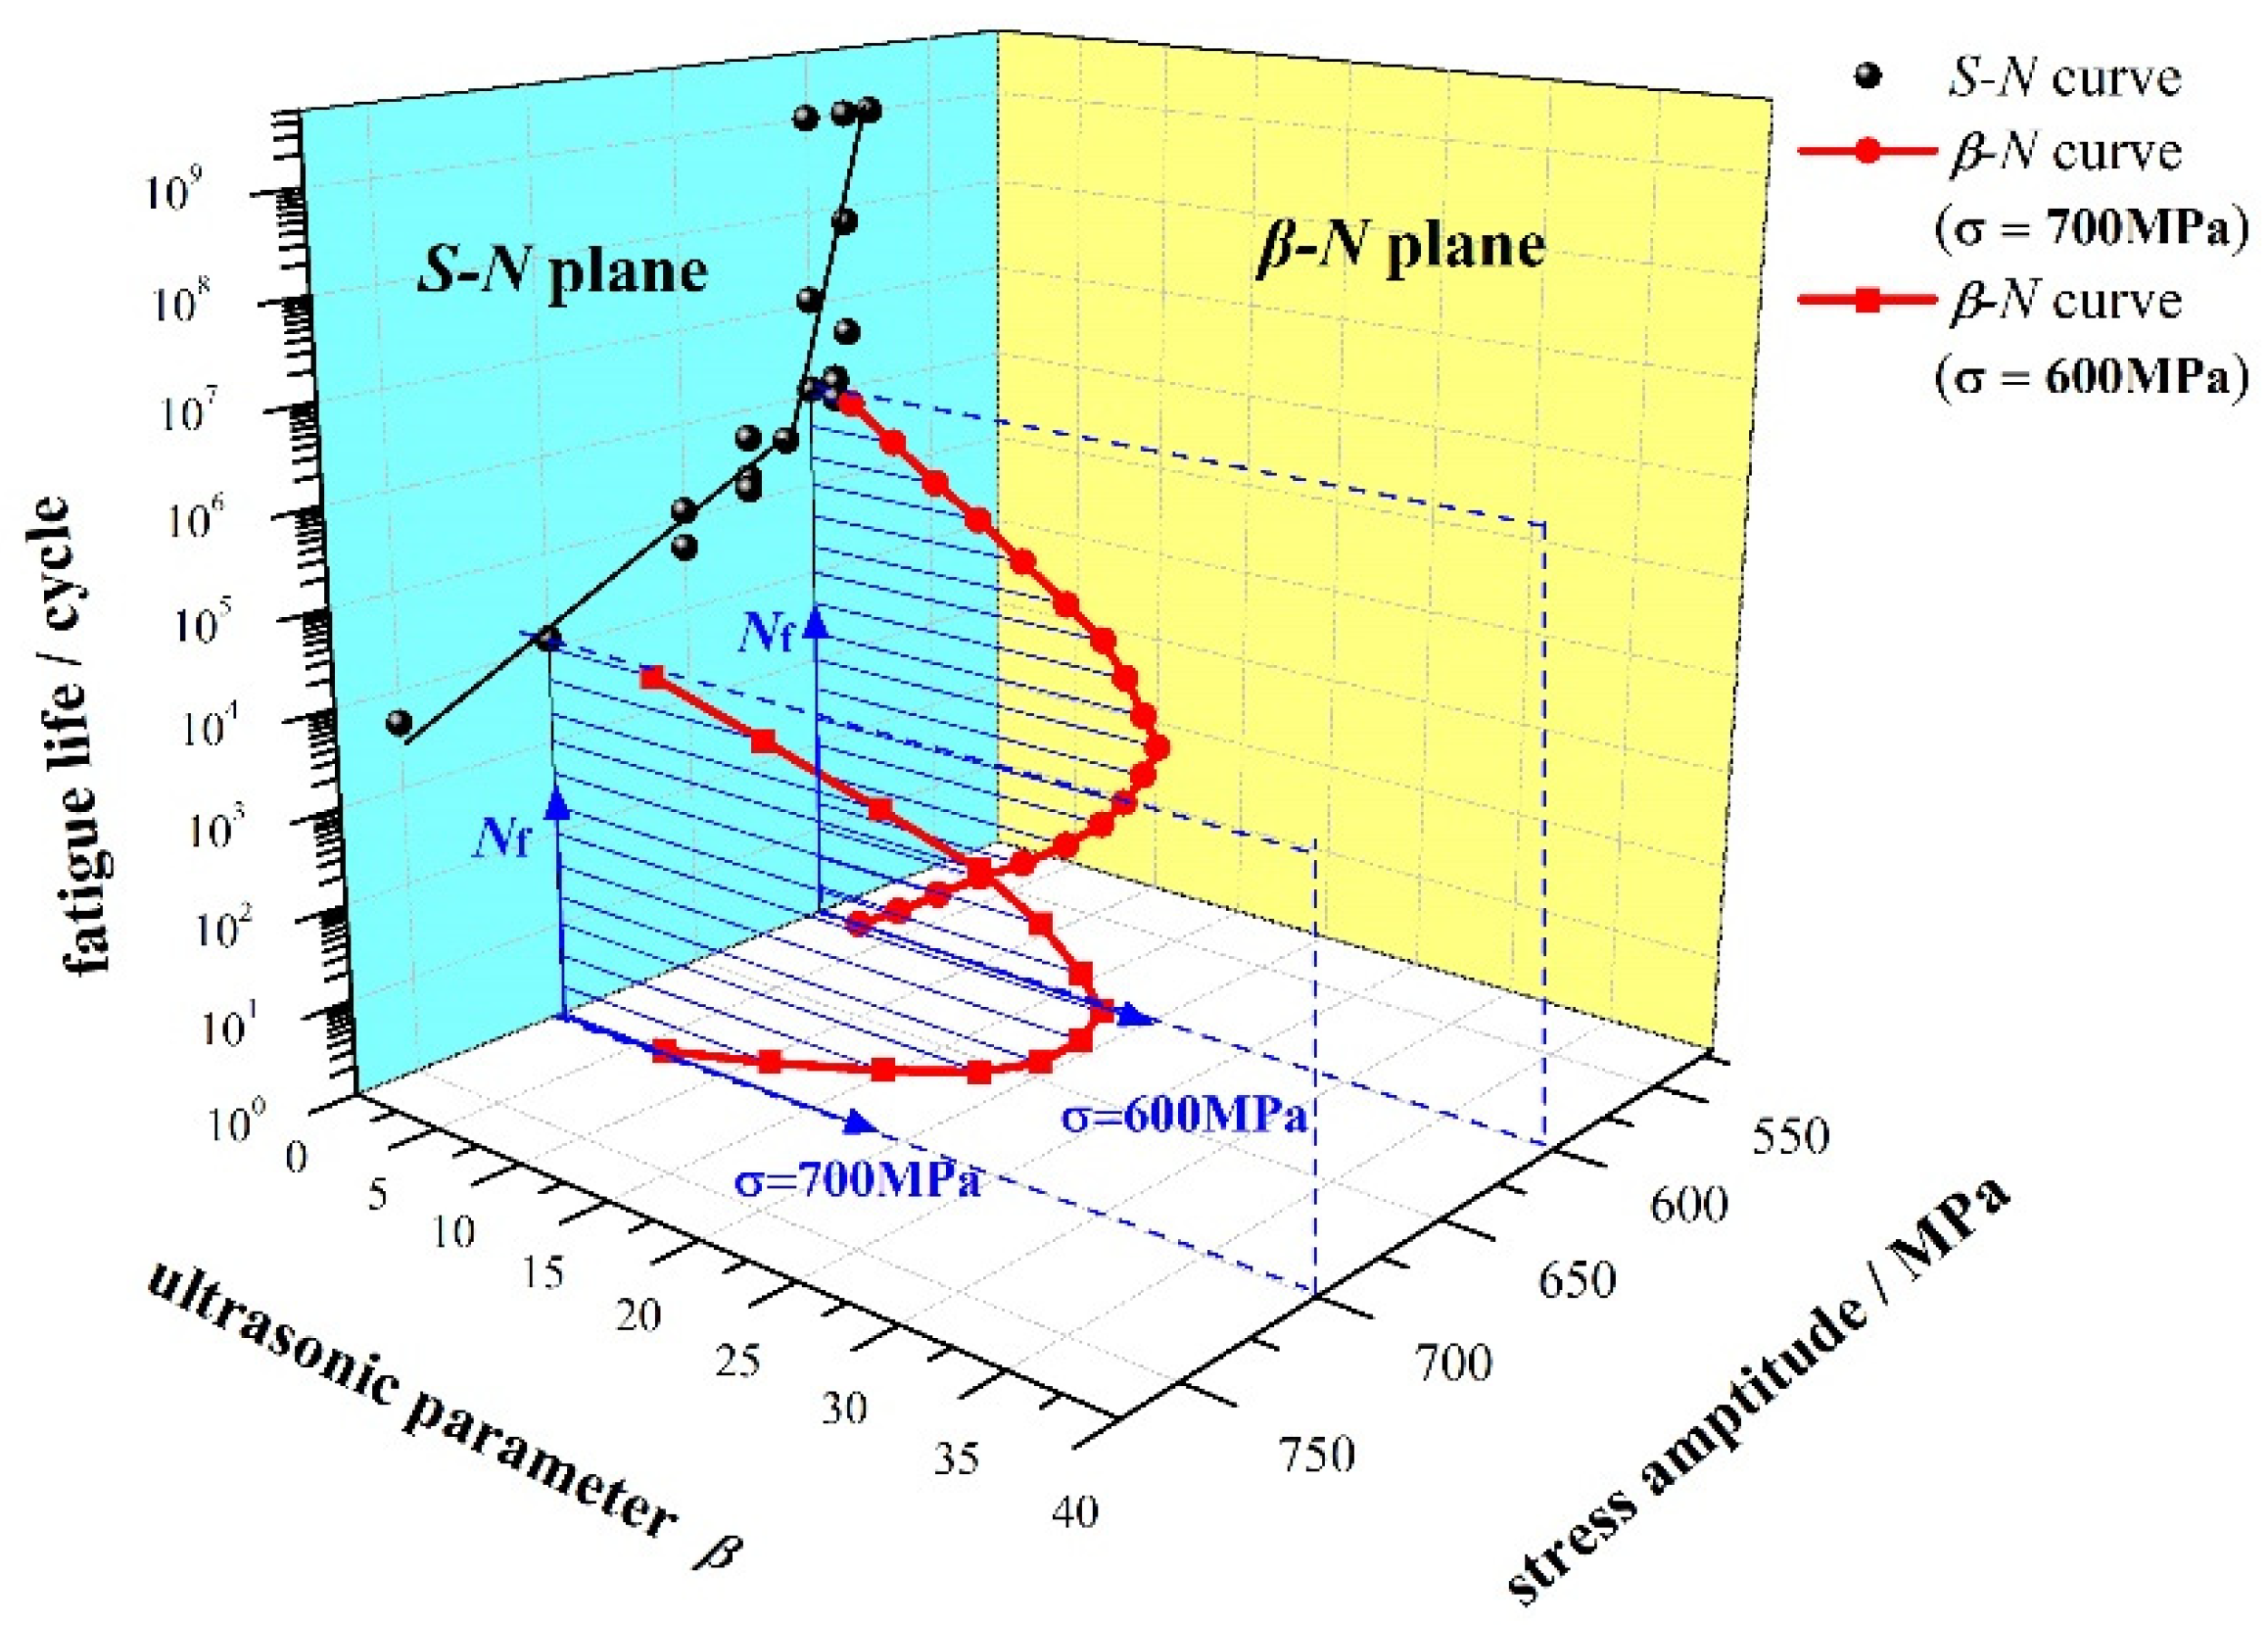
- Through the statistical analysis of the internal micro-crack size in the early fatigue damage test, the empirical formula of the nonlinear coefficient β and the equivalent crack size was obtained. Combining the β–N curve with the S–N curve of the blade material KMN under very high cycle fatigue, a β–S–N three-dimensional model was established, and then an evaluation for the initial fatigue damage of the blade fatigue based on nonlinear ultrasonic testing was proposed.
Author Contributions
Funding
Institutional Review Board Statement
Informed Consent Statement
Data Availability Statement
Acknowledgments
Conflicts of Interest
References
- Bai, Y.; Guo, T.; Wang, J.; Gao, J.; Gao, K.; Pang, X. Stress-sensitive fatigue crack initiation mechanisms of coated titanium alloy. Acta Mater. 2021, 217, 117179. [Google Scholar] [CrossRef]
- Cantrell, J.H. Substructural organization, dislocation plasticity and harmonic generation in cyclically stressed wavy slip metals. Proc. R. Soc. A 2004, 460, 757–780. [Google Scholar] [CrossRef]
- Ohtani, T. Acoustic damping characterization and microstructure evolution during high-temperature creep of an austenitic stainless steel. Metall. Mater. Trans. A 2005, 36, 2967–2977. [Google Scholar] [CrossRef]
- Herrmann, J.; Kim, J.Y.; Jacobs, L.J.; Qu, J.; Littles, J.W.; Savage, M.F. Assessment of material damage in a nickel-base superalloy using nonlinear Rayleigh surface waves. J. Appl. Phys. 2006, 99, 124913. [Google Scholar] [CrossRef]
- Kim, J.Y.; Jacobs, L.J.; Qu, J.; Littles, J.W. Experimental characterization of fatigue damage in a nickel-base superalloy using nonlinear ultrasonic waves. J. Acoust. Soc. Am. 2006, 120, 1266–1273. [Google Scholar] [CrossRef]
- Yan, B.S.; Wu, B.; Zeng, X.C.; He, C.F. FEM simulation and experimental study of fatigue damage measurement in magnesium using nonlinear ultrasonic. In Proceedings of the 2010 International Conference on Mechanic Automation and Control Engineering, Wuhan, China, 26–28 June 2010. [Google Scholar]
- Zhou, Z.G.; Liu, S.M. Research, application and development of nonlinear non-destructive testing technology. Chin. J. Mech. Eng. 2011, 47, 2–11. [Google Scholar] [CrossRef]
- Nagy, P.B. Fatigue damage assessment by nonlinear ultrasonic materials characterization. Ultrasonics 1998, 36, 375–381. [Google Scholar] [CrossRef]
- Jhang, K.Y.; Kim, K.C. Evaluation of material degradation using nonlinear acoustic effect. Ultrasonics 1999, 37, 39–44. [Google Scholar] [CrossRef]
- Kawashima, K.; Ito, T.; Nagata, Y. Detection and Imaging of Nonmetallic Inclusions in Continuously Cast Steel Plates by Higher Harmonics. Jpn. J. Appl. Phys. 2010, 49, 07HC11. [Google Scholar] [CrossRef]
- Viswanath, A.; Rao, B.P.C.; Mahadevan, S.; Parameswaran, P.; Jayakumar, T.; Baldev, R. Nondestructive assessment of tensile properties of cold worked AISI type 304 stainless steel using nonlinear ultrasonic technique. J. Mater. Process. Technol. 2011, 211, 538–544. [Google Scholar] [CrossRef]
- Cremer, M.; Zimmermann, M.; Christ, H.J. In-Situ Characterization of the Damage Evolution of Welded Aluminum Alloy Joints during Very High Cycle Fatigue (VHCF) with Nonlinear Ultrasonic Technique. In Supplemental Proceedings: Materials Properties, Characterization, and Modeling; John Wiley & Sons, Inc.: Hoboken, NJ, USA, 2012; Volume 2, pp. 839–846. [Google Scholar]
- Li, W.; Cui, H.; Wen, W.; Su, X.; Engler-Pinto, C.C., Jr. In situ nonlinear ultrasonic for very high cycle fatigue damage characterization of a cast aluminum alloy. Mater. Sci. Eng. A 2015, 645, 248–254. [Google Scholar] [CrossRef]
- Yan, H.J. Research on Nonlinear Ultrasonic Testing Method for Fatigue Damage of Metal Components. Ph.D. Thesis, Beijing Institute of Technology, Beijing, China, 2015. [Google Scholar]
- Yan, H.J.; Xu, C.G.; Xiao, D.G. Research on Nonlinear Ultrasonic Characteristics of Metallic Material Tensile Stress. J. Mech. Eng. 2016, 52, 22–29. [Google Scholar] [CrossRef]
- Feng, W. Multi-Point Rapid Non-Linear Ultrasonic Testing of Fatigue Damage of Aluminum Alloy. Ph.D. Thesis, Harbin Institute of Technology, Harbin, China, 2015. [Google Scholar]
- Li, H.Y.; Shi, Y.H.; Wang, Z.B. Using Nonlinear Surface Waves to Evaluate Material Fatigue Damage. Acoust. Technol. 2019, 38, 296–300. [Google Scholar]
- Gao, L.; Chen, Z.H.; Li, C.G. Non-linear guided wave detection of fatigue damage of aluminum alloy plates. Nondestruct. Test. 2020, 42, 61–65. [Google Scholar]
- Wang, H.F. Research on Metal Fatigue Damage Detection and Location Based on Nonlinear Ultrasound. Ph.D. Thesis, Tianjin University, Tianjin, China, 2017. [Google Scholar]
- Zhang, F.Y. Research on Material Damage Detection Based on Nonlinear Ultrasound. Ph.D. Thesis, Zhengzhou University, Zhengzhou, China, 2019. [Google Scholar]
- Bian, L.Y. Research on Plate Damage Identification and Location Based on Ultrasonic Lamb Wave. Ph.D. Thesis, Dalian University of Technology, Dalian, China, 2019. [Google Scholar]
- Wang, P.F.; Wang, W.Q.; Li, J.F. Research on Fatigue Damage of Compressor Blade Steel KMN-I Using Nonlinear Ultrasonic Testing. Shock. Vib. 2017, 2017, 4568460. [Google Scholar] [CrossRef]
- Wang, P.F.; Wang, W.Q.; Zhang, M.; Zhou, Q.W.; Gao, Z.L. Effects of Specimen Size and Welded Joints on the Very High Cycle Fatigue Properties of Compressor Blade Steel KMN-I. Coatings 2021, 11, 1244. [Google Scholar] [CrossRef]
- Wang, P.F.; Wang, W.Q.; Li, J.F. Fatigue behavior and mechanism of KMN in a very high cycle regime. Mater. Test. 2018, 60, 55–60. [Google Scholar] [CrossRef]
- Wang, P.F. Research on High/Very High Cycle Fatigue Mechanism and Residual Life Estimation Method of KMN Steel. Ph.D. Thesis, Shandong University, Jinan, China, 2018. [Google Scholar]
- Xiang, Y.X. Research on Nonlinear Ultrasonic Guided Wave Evaluation Method for Early Damage of High Temperature Components. Ph.D. Thesis, East China University of Science and Technology, Shanghai, China, 2011. [Google Scholar]
- Matlack, K.H.; Kim, J.Y.; Jacobs, L.J.; Qu, J. Review of Second Harmonic Generation Measurement Techniques for Material State Determination in Metals. J. Nondestruct. Eval. 2015, 34, 273. [Google Scholar] [CrossRef]
- Croxford, A.J.; Wilcox, P.D.; Drinkwater, B.W.; Nagy, P.B. The use of non-collinear mixing for nonlinear ultrasonic detection of plasticity and fatigue. J. Acoust. Soc. Am. 2009, 126, 117–122. [Google Scholar] [CrossRef] [Green Version]
- Cantrell, J.H.; Yost, W.T. Nonlinear ultrasonic characterization of fatigue microstructures. Int. J. Fatigue 2001, 23, 487–490. [Google Scholar] [CrossRef]
- Moura, D.M.; Morais, A.D. Equivalent crack based analyses of ENF and ELS tests. Eng. Fract. Mech. 2008, 75, 2584–2596. [Google Scholar] [CrossRef]
- Mikkola, E.; Murakami, Y.; Marquis, G. Equivalent crack approach for fatigue life assessment of welded joints. Eng. Fract. Mech. 2015, 149, 144–155. [Google Scholar] [CrossRef]
- Huang, Y.; Ye, X.; Hu, B.; Chen, L. Equivalent crack size model for pre-corrosion fatigue life prediction of aluminum alloy 7075-T6. Int. J. Fatigue 2016, 88, 217–226. [Google Scholar] [CrossRef]
- Luo, Y.H.; Wu, X.; Ding, Z.N.; Feng, X.H. Fatigue life prediction of box girder of bridge based on equivalent crack approach. J. Mech. Strength 2018, 40, 200–204. [Google Scholar]
- Wang, Q.Y.; Berard, J.Y.; Rathery, S.; Bathias, C. Technical note High-cycle fatigue crack initiation and propagation behaviour of high-strength spring steel wires. Fatigue Fract. Eng. Mater. Struct. 1999, 22, 673–677. [Google Scholar] [CrossRef]
- Hikata, A.; Chick, B.B.; Elbaum, C. Dislocation contribution to the second harmonic generation of ultrasonic waves. J. Appl. Phys. 1965, 36, 229–236. [Google Scholar] [CrossRef]
- Hikata, A.; Elbaum, C. Generation of ultrasonic second and third harmonics due to dislocations. I. Phys. Rev. 1966, 144, 469. [Google Scholar] [CrossRef]
- Hikata, A.; Sewell, F.A., Jr.; Elbaum, C. Generation of ultrasonic second and third harmonics due to dislocations. II. Phys. Rev. 1966, 151, 442. [Google Scholar] [CrossRef]
- Hull, D.; Bacon, D.J. Introduction to Dislocations; Butterworth-Heinemann: Oxford, UK, 2001. [Google Scholar]


| Mechanical Properties | Tensile Strength Rm (MPa) | Yield Strength Rp0.2 (MPa) | Elastic Modulus E (GPa) | Density ρ (kg/m3) | Hardness HV (kgf·mm−2) |
|---|---|---|---|---|---|
| KMN | 1193 | 1072 | 205 | 7840 | 335 |
| Standard deviation | 2.52 | 6.51 | 1.15 | 10.07 | 4.04 |
| Chemical Composition | C | Mn | Si | Mo | Cr | P | S |
|---|---|---|---|---|---|---|---|
| KMN | 0.13–0.18 | 0.5–0.8 | 0.17–0.37 | 0.9–1.1 | 2.2–2.5 | ≤0.030 | ≤0.030 |
| Heat Treatment | Temperature (°C) | Holding Time (h) | Cooling Method |
|---|---|---|---|
| Quenching | 970 ± 10 | 2.5–3 | Oil cooling |
| Tempering | 570 ± 10 | 4–5 | Air cooling |
| Fatigue Cycles | 5 × 10⁴ | 3 × 10⁵ | 5 × 10⁵ | 7 × 10⁵ | 106 | 107 |
|---|---|---|---|---|---|---|
| Number of cracks | 0 | 1 | 1 | 4 | 5 | >50 |
| Crack length/μm | 0 | 8 | 13 | 15, 12, 10, 20 | 8, 12, 14, 30, 15 | 70, 18, 26… |
| Equivalent crack length/μm | 0 | 8 | 13 | 57 | 79 | >600 |
| Standard deviation for crack length | - | - | - | 19.49 | 26.87 | - |
Publisher’s Note: MDPI stays neutral with regard to jurisdictional claims in published maps and institutional affiliations. |
© 2021 by the authors. Licensee MDPI, Basel, Switzerland. This article is an open access article distributed under the terms and conditions of the Creative Commons Attribution (CC BY) license (https://creativecommons.org/licenses/by/4.0/).
Share and Cite
Wang, P.; Wang, W.; Zheng, S.; Chen, B.; Gao, Z. Fatigue Damage Evaluation of Compressor Blade Based on Nonlinear Ultrasonic Nondestructive Testing. J. Mar. Sci. Eng. 2021, 9, 1358. https://doi.org/10.3390/jmse9121358
Wang P, Wang W, Zheng S, Chen B, Gao Z. Fatigue Damage Evaluation of Compressor Blade Based on Nonlinear Ultrasonic Nondestructive Testing. Journal of Marine Science and Engineering. 2021; 9(12):1358. https://doi.org/10.3390/jmse9121358
Chicago/Turabian StyleWang, Pengfei, Weiqiang Wang, Sanlong Zheng, Bingbing Chen, and Zengliang Gao. 2021. "Fatigue Damage Evaluation of Compressor Blade Based on Nonlinear Ultrasonic Nondestructive Testing" Journal of Marine Science and Engineering 9, no. 12: 1358. https://doi.org/10.3390/jmse9121358
APA StyleWang, P., Wang, W., Zheng, S., Chen, B., & Gao, Z. (2021). Fatigue Damage Evaluation of Compressor Blade Based on Nonlinear Ultrasonic Nondestructive Testing. Journal of Marine Science and Engineering, 9(12), 1358. https://doi.org/10.3390/jmse9121358