Abstract
Revetment elements and protective facilities on a breakwater can effectively weaken the impact of waves. In order to resist storm surges, there is a plan to build a breakwater on the northern shore of Meizhou Bay in Putian City, China. To better design it, considering different environmental conditions, physical and numerical experiments were carried out to accurately study the effects of the breakwater and its auxiliary structures on wave propagation. In the experiments, the influence of the wave type, initial water depth, and the structure of the fence plate are considered. The wave run-up and dissipation, the wave overtopping volume, and the structure stability are analyzed. The results indicate that the breakwater can effectively resist the wave impact, reduce the wave run-up and overtopping, and protect the rear buildings. In addition, under the same still water depth and significant wave height, the amount of overtopped water under regular waves is larger than that under irregular waves. With the increase of the still water depth and significant wave height, the overtopped water increases, which means that when the storm surge occurs, damage on the breakwater under the high tide level is greater than that under the low tide level. Besides, the fence plate can effectively dissipate energy and reduce the overtopping volume by generating eddy current in the cavity. Considering the stability and the energy dissipation capacity of the fence plate, it is suggested that a gap ratio of 50% is reasonable.
1. Introduction
Wave load is one of the main factors endangering coastal and marine structures. Breakwaters and protective facilities can be effective in resisting wave impacts. After the waves hit a breakwater, it may happen that the wave runs up and overtops over the breakwater, and the breakwater will be subjected to complex hydrodynamic actions (Goda, 2009; Borsje et al., 2010; Temmerman et al., 2013; Zhao et al., 2019) [1,2,3,4,5]. In order to study the wave dissipation and wave overtopping on the whole breakwater, some studies simplified the breakwater as a slope without the accessory structure, ignoring the complex breakwater structure. Dame (2016) [6] conducted an overall study on a breakwater without attached wave suppression structure, and presented the distribution of wave velocity, flow rate, water depth, volume, and peak shear stress at the top of the breakwater, thus improving the prediction accuracy of the overtopping volume. Pan et al. (2015) [7] also studied the complete breakwater without the accessory structure, observed the overtopping characteristics under the coupling action of wave and surge, and established two different empirical formulas for calculating the overtopping volume.
Furthermore, in order to improve the wave-absorbing ability of the breakwater, the working mechanism and hydrodynamic response characteristics of the breakwater with the attached wave suppression structure were investigated to understand the overall and macroscopic effects of breakwaters, such as block revetment, stepped revetment, and pebble revetment (Kerpen, 2017; Steeg et al., 2018; Gallach-Sánchez, 2018) [8,9,10]. The block revetment has large pores and strong water permeability, which can fully break waves. Capel (2015) [11] studied the effect of block stone on the wave. The results show that the block revetment has a good energy dissipation effect on both regular and irregular waves. Szmytkiewicz et al. (1994) [12] investigated the capability of wave run-up reduction of the different-height-block units under irregular waves. The results show that the higher the block height is, the more serious the wave attenuation is. The stepped revetment is established as a reinforced concrete structure which is filled by gravel and sand, resulting in good durability and environmental protection. Ward (2003) [13] studied the wave overtopping of the stepped revetment under the irregular waves, and obtained an empirical formula for wave overtopping prediction which involved the number and size of steps, the elevation of the slope and the width of the promenade. Krecic and Sayao (2003) [14] considered the incident wave height at the bottom of the structure based on research by Ward (2003) [13]. Kerpen and Schlurmann (2016) [15] summarized the previous studies on stepped revetment in the past 60 years from two aspects of wave overtopping and wave loads, and comprehensively evaluated the effects of stepped shape, slope angle, and step height on wave energy dissipation. Besides, pebble revetment is also common, which has a high tolerance for placement (Torum et al., 2012) [16].
However, most of the previous studies focused on a single revetment layer. There are many kinds of revetments that can be used in the breakwaters. For examples, the breakwaters in Figure 1 are located at Laizhou Port, Yantai and Haikou, Hainan, China, respectively. Recently, a new breakwater was built along the north shore of Meizhou Bay to resist typhoons and waves. The breakwater integrates three types of elements: a stepped revetment, a block revetment, and a fence plate revetment. As one of the commonly used revetment elements in engineering, fence plate revetments have excellent wave attenuation performance and good durability. The concave cavity of the fence plate is used to increase the roughness of the revetment structure to reduce the wave (Sasani and Akbari, 2019) [17]. When the wave climbs on the fence board, it forms a vortex in the cavity, and the collision and wave breaking occur, and significant wave energy of run-up is dissipated by the cavity. To provide support for the design of Meizhou Bay breakwater, physical experiments and numerical simulations were carried out. The physical experiments were based on the hydrological conditions of the north shore of Meizhou Bay, and the wave attenuation on the fence plate under the action of regular and irregular waves for different water levels was studied. In the numerical simulations, the hydrodynamic numerical model was established by solving the Navier–Stokes equations of incompressible flow. The wave run-up, wave dissipation, overtopping and breakwater stability were studied. The influence of the gap ratio of fence plate on the wave dissipation was analyzed. The rest paper is organized as follows. Section 2 introduces the setup and the methods of the physical and numerical experiments. Section 3 introduces the verification of the physical and numerical models. The results and discussion are given in Section 4. The conclusions of this work and future developments are given in Section 5.
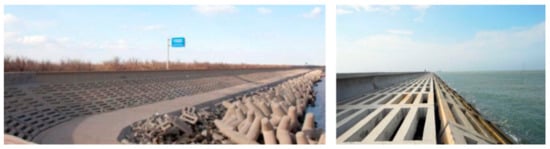
Figure 1.
Photos of the built breakwater.
2. Physical and Numerical Experiments
The physical and numerical models were defined based on the breakwater design layout to be built on the north shore of Meizhou Bay [18,19]. The breakwater adopts the stepped revetment structure composed of a wave platform, a first step slope, a berm, and a second step slope (Figure 2). The alternation of platforms and slopes is beneficial for the wave energy dissipation and wave breaking on a large scale. The whole surface of the breakwater is covered with a fence plate structure, which can break the waves on a small scale through the cavities. In addition, the block revetment structure is arranged on the breakwater, including the armor block at the foot of the breakwater and the wave dissipation ridge on the wave platform. The landslide prevention skirting at the foot of the breakwater is used to stabilize the superstructure. To further reduce the amount of overtopping, a wave retaining wall is placed at the top of the breakwater.
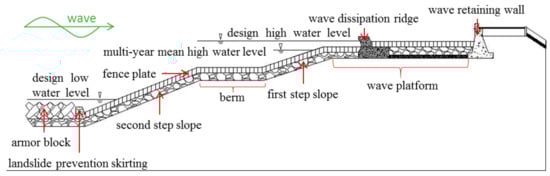
Figure 2.
Scheme of the breakwater structure.
The wave retaining wall is 0.3 m high and 0.3 m long, and its bottom elevation is 6.1 m (Wang and Hu, 2020) [20]. The wave dissipation ridge with a length of 1.2 m and a top elevation of 5.4 m is arranged on the wave platform, which divides the wave platform into two sections. The left section is 7.8 m in length and 5.0 m in height, and the right section is 2.5 m in length and 4.6 m in height. The total length of the wave platform and the wave dissipation ridge is 11.5 m. The berm with a length of 5.0 m and a height of 3.0 m is set under the wave platform. The slope of the first step is 1:3 with a total length of 5.06 m; the slope of the second step is 1:2.5 with a total length of 9.426 m. The landslide prevention skirting is trapezoidal, the length of the upper side is 0.5 m, the length of the lower side is 0.87 m, and the height is 1 m. The armor blocks are laid in a groove with a length of 4.2 m. The bottom elevation of the armor block is −1.1 m and the top elevation is 0.2 m.
2.1. Environmental Condition
Regular and irregular waves were considered in the experiments. Regular waves were defined according to Airy wave and irregular wave were generated based on JONSWAP spectrum (JS). The wave heights of regular and irregular waves are average wave height and significant wave height, respectively. Considering the hydrological conditions of Meizhou Bay and the design requirements of the breakwater, three water levels were chosen based on the statistical values of water levels and wave during the last 50 years. The design low water level (1 m) is the low tide level with the cumulative frequency of 90%, the multi-year mean high water level (4.8 m) is the average high tide level and the design high water level (5.55 m) is the high tide level with the cumulative frequency of 10% during the last 50 years. Under the condition of design high water level and multi-year mean high water level, waves can impact the whole breakwater and its auxiliary structures, which may cause overtopping and endanger the safety of breakwater (Akbari et al., 2019; Radfar et al., 2021) [21,22]. Under this condition, the wave run-up and dissipation and the stability of the whole breakwater and its auxiliary structures were tested. Under the condition of design low water level, the wave mainly acts on the bottom structure of breakwater, such as armor block and landslide prevention skirting. Once the bottom structure is unstable, the whole breakwater will be seriously damaged or even collapsed. Under this condition, the stability of breakwater bottom structure was tested. The geometric considered scale according to Froude similarity criteria is equal to 1:25. The still water depth and wave parameters considered are presented in Table 1. In order to accurately calculate the wave overtopping volume, three tests were carried out for the same case and the average wave overtopping volume was obtained.

Table 1.
Experimental environmental conditions
2.2. Physical Experimental Methodology
The wave channel is 60 m long, 0.6 m wide, and 1.5 m high. The waves are generated by the wave maker. In order to ensure that the waves reach the breakwater well developed, the distance between the breakwater and the wave maker is six times the longest wavelength in all the tests, which is about 30 m. Considering the local marine and geological environmental conditions and referring to the existing breakwater types, the breakwater with multi-stage and multi-type wave-absorbing accessory structures is designed, as shown in Figure 3. White fence plate is used on the second step slope, green fence plate is used on the platform and first step slope, and blue fence plate is used behind the wave dissipation ridge. The green armor blocks at the foot of the breakwater are slanted close together. The wave sensor is placed 1.0 m upstream from the submerged embankment to measure wave heights and periods. Water flow measuring equipment is set behind the breakwater for measuring the wave overtopping volume. The wave overtopping ratio is calculated by collecting and measuring the wave overtopping volume behind the wave elimination wall.

Figure 3.
Physical experimental layout; (a) side view; (b) top view.
2.3. Numerical Model
In the numerical model, the immersed boundary method (IBM) is used to discretize the whole computational domain (Zhao et al., 2021a; Zhao et al., 2021b) [23,24]. The incompressible flow continuity equation and the Reynolds-averaged Navier–Stokes equation are solved, which can be expressed as
where ∇ is a gradient operator; V is the velocity vector; S is the area fraction of the fluid in the grid; F is the volume fraction of the fluid. ρ is fluid density, p is pressure, Ag is acceleration vector, AF is viscous acceleration vector of flow.
According to the volume of fluid (VOF) method, the transportation equation of the free surface between water and air is formulated as
where is the water volume fraction in the free surface cell. = 0, 0 < < 1, and = 1 represent the different phases of air, interface and water. The viscous acceleration vector AF in the three directions of Cartesian coordinate can be written as
where i (i = x, y, z) is wall stress in three directions. The terms of shear stress are calculated as
To calculate the turbulent viscosity μ, two-equation κ-ε turbulence model is introduced as
where k is the turbulent kinetic energy; ε is turbulent energy dissipation rate; u, v and w are the velocities in x-, y-, and z-directions; TP is the turbulent kinetic energy production; TG is buoyancy production term; and TD and TDε demonstrate diffusion terms. The wave is generated at the inlet with the wave boundary condition. Both sides of the simulation domain are controlled by symmetrical boundary and the atmospheric pressure is applied on the top boundary. At the surface of the breakwater, a nonslip wall condition is imposed.
A numerical model was established according to the physical model. The length and height of the numerical tank are 20 m and 0.5 m, respectively. The still water depth is 0.222 m. The mesh resolution around the breakwater is 0.0025 m, while the mesh resolution of the other areas is 0.01 m (White, 2003) [25]. The origin of the coordinate system is at the bottom of the numerical flume. The inlet is the numerical wave-making boundary, and the outlet is the free outflow boundary. Corresponding to the physical experimental case 5 (the regular wave height H is 0.0625 m), the characteristics of wave run-up and dissipation under the regular wave with and without fence plate are studied numerically. To provide a reference for the design and engineering practice of the fence plate, the effects of the different gap ratio (θ) of the fence plate on the wave propagation are studied to find the wave-reducing law under different fence plate. The gap ratio refers to the proportion of the sunken area (si) to the whole area (L) of the fence plate. In the simulations, seven gap ratios are set as 0, 30, 40, 50, 60, and 70 percent. The gap ratio without the fence plate is 0. Two wave height sensors, G1 and G2, are set at 0.5 m and 6.5 m from the wave inlet boundary, respectively. The schematic diagram of numerical model is displayed in Figure 4.
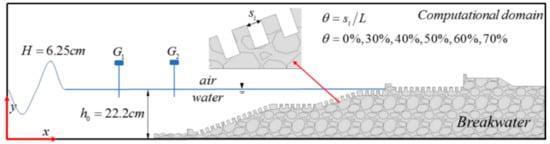
Figure 4.
Schematic diagram of the numerical model.
3. Wave Calibration
In order to ensure the accuracy of the experiments, it is very important to generate a wave that meets the requirements of the experimental cases (Table 1). Therefore, the accuracy of regular wave and irregular wave energy spectrum in the physical model and numerical model is verified before the experiment. Figure 5 shows the comparisons of the temporal evolution of the regular wave under the cases of 1, 3, and 5. The ratio (ζ = H/h) is of the wave height to the still water depth. The maximum ratios and the periods in the cases 1, 3, and 5 are 0.1375 and 3.5 s, 0.2083 and 3.4 s, and 0.2815 and 3.3 s, respectively. In Figure 5c, the results of the analysis, experiment, and simulation about case 5 are compared. The waves generated in the experiments in cases 3 and 5 are little larger than the theory waves. This may be because after the wave is made at the inlet, the wave generation velocity is slightly higher than the wave propagation wave and the experimental wave is with a large amplitude. Depending on the comparison of the regular waves, although there is a small deviation in comparisons, it is found that the results of the analysis, experiment, and simulation are in good agreement. Besides, Figure 6 shows the energy spectra comparison of irregular waves under the cases 2, 4. and 6. The ratios (ζ) of the significant wave heights to the still water depths are 0.1357, 0.2083, and 0.2552, respectively. The corresponding frequencies are 0.2857, 0.2941, and 0.3030 Hz, respectively. In the spectrum comparison, it fluctuates slightly due to the instability of the experiment. Nevertheless, the experimental results are in good agreement with the analysis results. According to the wave calibration, the physical and numerical experiments can generate the steady and accurate waves.
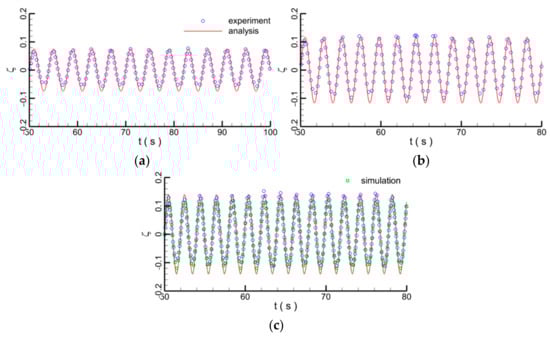
Figure 5.
Temporal evolution for the regular waves: (a) case 1; (b) case 3; (c) case 5.
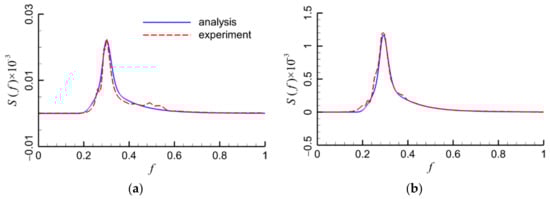
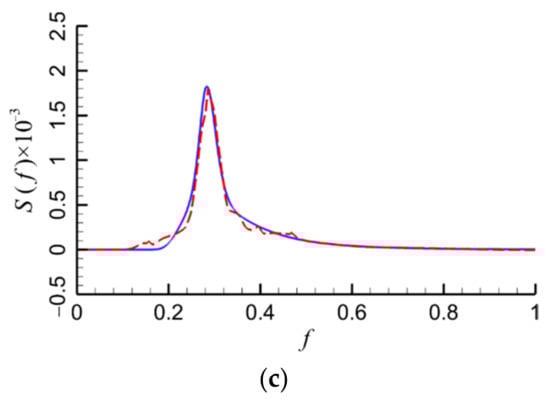
Figure 6.
Wave energy spectrum comparison for irregular waves: (a) case 2; (b) case 4; (c) case 6.
4. Results and Discussion
In order to further explore the separate and synergistic effects of different subsidiary structures of the breakwater on the wave run-up and overtopping and provide reference for the construction of the breakwater at the north shore section of Meizhou Bay, this part is discussed and analyzed in detail in four aspects. Firstly, the wave run-up and dissipation are investigated experimentally and numerically to discuss the effects of the single or the multiple subsidiary structures of the breakwater on the wave propagation at different stages. Secondly, after the wave overtopping, the wave overtopping volume is analyzed to evaluate whether the breakwater can effectively prevent waves and the overtopping volume is allowable. Thirdly, considering the different marine conditions and wave overtopping volume, the stability of the whole breakwater and its subsidiary structures is analyzed. Finally, in order to provide the reasonable gap in the fence revetment, the effects of six fence gap ratios on the wave propagation velocity, vorticity, turbulent kinetic energy, and overtopping volume are studied numerically.
4.1. Wave Run-Up and Dissipation
Figure 7 shows the flow field comparisons between the experimental and numerical results in case 5 at four different moments of 6.8 s, 7.6 s, 7.9 s, and 8.8 s. At the first moment (Figure 7a), the wave hits the breakwater and runs up along the breakwater. The free surface elevation on the left side of the second step slope increases with the wave crest propagation. The water free surface elevation drops significantly around the wave dissipation ridge, because the regular wave is periodic and the block of the wave dissipation ridge, a large amount of water contained in the last parodic wave accumulates between the wave retaining wall and the wave dissipation ridge. However, this periodic wave crest does not reach the wave dissipation ridge. With the propagation of the wave, the wave depth decreases, the wave height increases seriously and the shoaling effect appears at the second moment (Figure 7b). When the wave is around the first step slope, the free surface fluctuates violently and the waveform changes. At this stage, the wave breaks on the first step slope, while the wave energy dissipation and the gas entrapment occur. With the increase of the water elevation, the wave collides and overtops the retaining wall (Figure 7c). At this moment, the wave trough propagates in the breakwater. The free surface elevation decreases significantly at the left side of the second step slope, and it increases smoothly along the breakwater from the berm to the wave dissipation ridge. When the wave overtops the retaining wall, there is a splash of the water. Then, the overtopped water continues to flow at the right side of the wave retaining wall, which may endanger the safety of the coastal engineering. At the right side of the wave retaining wall, the water falls back after the wave overtopping (Figure 7d). The wave level on the whole breakwater decreases and the attenuation amplitude from the second step slope to the wave retaining wall increases. The water elevation between Figure 7a and c is similar, which means that a new single wave continues to hit the breakwater.
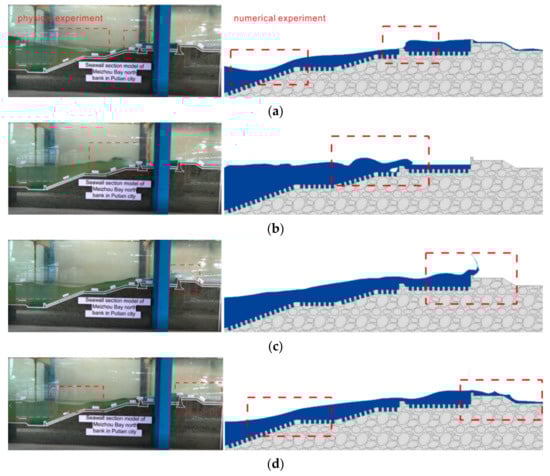
Figure 7.
Comparison of flow field between the physical and numerical experiment; (a) wave run-up; (b) wave breaking; (c) wave overtopping; (d) water falling back.
Furthermore, by comparing the left and right columns in Figure 7, it is found that the numerical results of wave propagation, run-up, and overtopping agree well with the physical results, verifying the high accuracy of the numerical model. In the numerical simulation, the air entrainment around the wave dissipation ridge and the wave splash are intuitively demonstrated (Figure 7b,c). Therefore, the numerical model can exactly analyze the effect of the different gap in the fence plate on the wave propagation in the breakwater.
4.2. Wave Overtopping Volume
In the experiment, the overtopped water is collected by the water collecting device, and then the volume and the unit discharge of the overtopped water are calculated. Table 2 shows the calculation results of the average unit discharge of the overtopped water under the various design conditions. In order to provide the values for the Meizhou Bay breakwater, referring to the unit discharge of the overtopped water in the experiment, the unit discharge of the prototype is also calculated according to the scale scaling and similarity criteria. In the cases of 1 and 2, the still water depth is at the second step slope according to the design low water level. Under the regular and irregular waves, the wave heights are always lower than the breakwater height, so there is no overtopping in these two cases. In the cases of 3 and 4, when the multi-year mean high water level is at the first step slope, the unit charges of the overtopped water under the prototype breakwater are 29.4 and 23.1 (m3/(m·s) × 10−3) under the regular and irregular waves, respectively, which means that the overtopped water under the regular wave is larger than that under the irregular wave when the wave height of the regular wave equals the significant wave height of the irregular wave. In the cases of 5 and 6, the design high water level is at the wave dissipation ridge, the unit charges of the overtopped water under the prototype breakwater are 77.9 and 51.5 (m3/(m·s) × 10−3) under the regular and irregular waves, respectively. In these two cases, the overtopped water under the regular wave is larger than that under the irregular wave because the once-in-a-hundred-years wave height of the regular wave is higher than the significant height of the irregular wave. According to the results, it is found that under the same wave—with the increase of the still water depth—the overtopped water increases, resulting in more disaster. Under the same still water depth and the significant wave height, the overtopped water under the regular wave is more than that under the irregular wave, which means that when studying the interaction between the wave and the breakwater, regular waves cannot reflect the actual waves accurately. Besides, with the increase of the wave height, the overtopped water also increases. It can be inferred that, when the storm surge occurs, damage to the breakwater under the high tide level is greater than that under the low tide level.
Table 2.
Wave overtopping volume under different test conditions
4.3. Breakwater Stability
Under different still water depths and waves, the stability of wave retaining wall, wave dissipation ridge, fence plate, armor block, and landslide prevention skirting is investigated. After the waves act on the breakwaters, the situation of each part of the breakwater in all cases is shown in Figure 8. For cases 1 and 2, the wave runs up and down on the second step slope, impacting the second step slope, the landslide prevention skirting and the armor block. It is found that both the armor block and land slide prevention skirting remain stable without movement or damage as the still water level is around the fence plate (Figure 8a,b). For cases 3 and 4, the still water level is the multi-year mean high water level around the first step slope. The waves act on the upper parts of the breakwater, such as the first step slope, the wave dissipation ridge, the wave platform, and the wave retaining wall. Figure 8c,d show that both the wave retaining wall and the wave dissipation ridge do not overturn, move, or reverse, indicating that they have a good blocking effect on the waves. In addition, the fence plate is also stable. When the still water level is the design high-water-level at the wave dissipation ridge which is directly impacted by the wave, it is noted that the ridge and other parts of the breakwater are still stable. However, there are some differences. In Figure 8e,f, a small amount of sediment is brought from below the fence plate at the wave platform to the surface of the fence plate around the wave dissipation ridge. In Figure 8f, some sediment is carried out and deposited on the armor block, which may lead to the burying of the armor blocks. When it is submerged, its wave-absorbing function is weakened, the still water depth is reduced and the wave has a strong action on the breakwater. In general, on one hand, under different environmental conditions, the breakwater and its elements can remain stable, indicating that the structure design of the breakwater is reasonable. This type of breakwater is suitable for the north shore section of Meizhou Bay. On the other hand, the high water level and the high waves are still important factors threatening the safety of the breakwater and its elements.
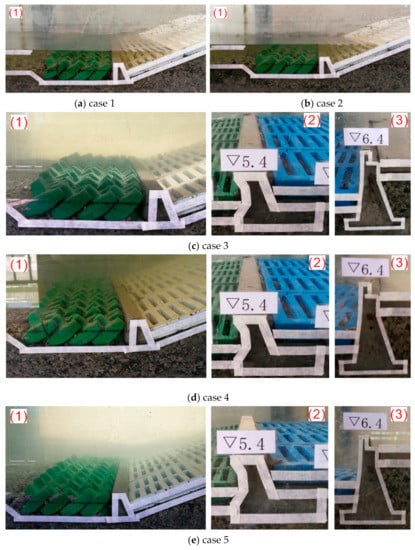
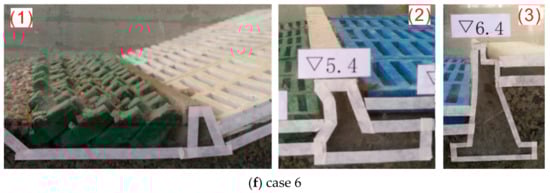
Figure 8.
State of each part of the breakwater model (a–f).
4.4. Fence Plate Structure
The numerical simulation is based on the case of 5, in which the effect of the wave on the structure is highest, and the overtopping volume is the largest. The process of regular waves acting on the fence plate with a different gap ratio is analyzed in four aspects. Firstly, the velocity distribution of the wave run-up and wave breaking is compared under the different fence plates. Secondly, the vorticity distribution near the berm of the breakwater is displayed and analyzed. Thirdly, the local turbulent kinetic energy around the different fence plate is shown to analyze the influence of different ratios on the wave energy dissipation. Fourthly, the free surface elevations and the overtopping volumes under the fence plate with different gap ratios are analyzed and discussed.
4.4.1. Velocity Intensity
Figure 9 shows the velocity distribution of wave run-up and wave breaking with and without the fence plate. The gap ratio of the fence plate is 0.5. When the wave crest reaches the second step slope, a high-speed flow area appears on the second step slope during the wave impacting the second step slope and run-up along the slope (Figure 9a–c). The water behind the wave retaining wall also has a high flow velocity. Compared with the velocities around these two parts, the flow velocities around the other parts of the breakwater are lower due to two reasons: firstly, the wave crest approaches the second step slope; secondly, the slope increasing and turning induces the accumulation of the water and the increase of the velocity. The local damage easily occurs at the corner of the slope. At this moment, comparing Figure 9a with Figure 9c, when the fence plate is without the gap, the velocity is higher and the high-speed flow area at the second step slope is larger, but the contrast is not remarkable, because the shape and the slope rate of the second step slope play a dominant role in the velocity distribution rather than the fence plate. When the wave hits and runs up the breakwater, the steeper the slope is, the stronger the disturbance of the slope to the wave is. Besides, the propagation length of the wave on the fence plate is relatively short, and the influence of the gap on the fence plate is rather weak. The water in the gap flows slowly (Figure 9c). With the run-up of the wave, the velocity around the armor block and the landslide prevention skirting increases, which can disturb the flow and dissipate the wave energy. With the wave propagation, the wave is deformed due to the shoaling and the wave crest is on the berm. When the waves act on the first step slope and the wave dissipation ridge, the wave breaks and the high velocity flow is near the first step slope and the wave retaining wall. The high velocity flow field on the first step slope without the fence plate (Figure 9b) is larger than that with the fence plate (Figure 9d), because the effect of the fence plate and the wave dissipation ridge on the wave propagation begins to strengthen. Besides, the wave head flow surface is smoother under the fence plate, which can also reduce the air entrainment. As shown in Figure 9b or Figure 9d, the air between the flow and the breakwater with the fence plate is less than that without fence plate. After the effect of the breakwater, the wave energy reduces, the wave run-up height decreases, and the wave impact weakens. To sum up, under the synergistic action of the various affiliated structures of the breakwater, the fence plate can reduce the flow velocity and the air entrainment volume, and cause wave breaking. This breakwater has a good wave-dissipating effect.
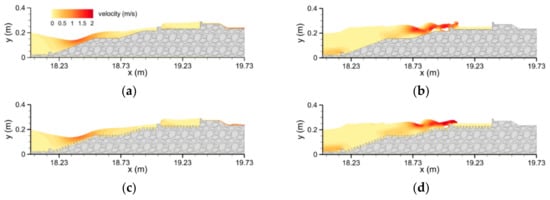
Figure 9.
Velocity distribution during wave run-up and wave breaking with and without the fence plate; (a,b) without fence plate; (c,d) with fence plate.
Figure 10 shows the velocity near the breakwater at different locations with and without fence plate, where when the gap ratio is 0%, the breakwater is without the fence plate. Although the wave velocity depends on the location, it is still periodic. The maximum velocity on the second step slope is the largest because of wave run-up. With the propagation of the wave, the velocity decreases and the velocity on the wave platform is minimal, because the effect of the berm on the wave energy dissipation results in the velocity plummeting, and then the wave energy is further dissipated by the first step slope. When the breakwater is without the fence plate, the maximum velocity on the second step slope is about 1.2 m/s which is higher than 1.05 m/s with the effect of the fence plate. Besides, the maximum velocity at different locations of the breakwater without the fence plate is higher than that with the fence plate, which means that the effect of elements on the slopes and platforms plays a certain role in wave propagation.
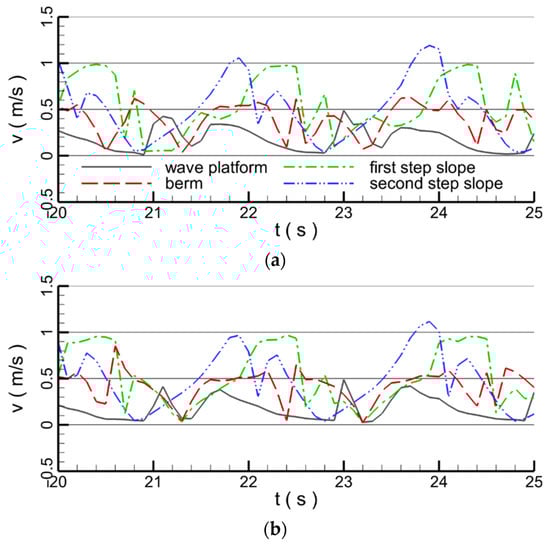
Figure 10.
Velocity near the breakwater at different locations; (a) without fence plate; (b) with fence plate.
Figure 11 shows the maximum velocity at different locations for different gap ratios. With the increase of the gap ratio, the velocity on the second step slope decreases linearly from 1.2 m/s to 1.1 m/s. However, when the gap ratio is 50%, the maximum velocity on the first step slope, the berm, and the second step slope is lower than that under other gap ratios. In general, when waves propagate onto the second step slope, the individual fence plate on this slope is involved in energy dissipation, and as waves continue to propagate, the number of breakwater accessory structures involved in energy dissipation increases. With wave run-up, the kinetic energy of the wave decreases and the gravity potential energy increases and the stepped structure has strong energy dissipation ability. Besides, it is found that when the gap ratio is 50%, the maximum velocity on the breakwater is the minimum, indicating that this gap ratio is beneficial to the attenuation of velocity.
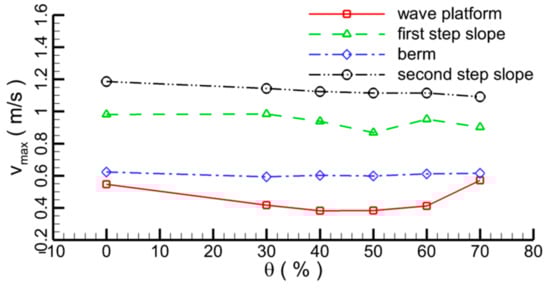
Figure 11.
Variation of maximum velocity with gap ratio at different locations.
4.4.2. Vorticity Intensity
Figure 12 shows the vorticity distribution on the berm and adjacent slopes for different gap ratios, where the blue layer and the red layer present the clockwise vorticity and the counterclockwise vorticity, respectively. When the wave runs up on the second step slope and the berm, the vortex of the water body rotates clockwise. On the first step slope, the water body left by the last wave slips down and the vortex rotates counterclockwise in the gap. When the fence plate is without the gap, there is almost no vorticity distribution on the smooth surface of the slope. With the increase of the gap, the obvious vorticity distributes along the surface from Figure 12b–f. This suggests that the existence of the fence plate has a significant influence on the vorticity distribution. As the gap ratio of the fence plate increases from Figure 12b–d, the vorticity distribution along the fence plate gradually widens. As the gap ratio continues to increase (Figure 12e,f), the vorticity in the gap of the fence plate begins to shed. When the gap is small, the vortex in the cavity attaches before they are completely shed, while when the gap is large, the vortex in the cavity can fall off completely. This indicates that the fence plate with a larger gap ratio is beneficial to the development of vortex on the fence surface.
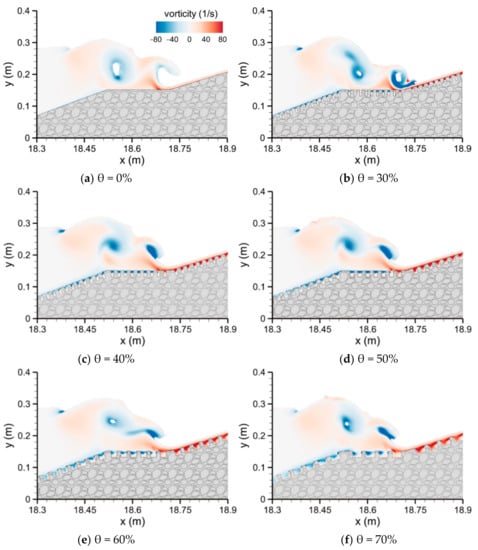
Figure 12.
Vorticity distribution on the berm and its adjacent slopes for different gap ratios (a–f).
Furthermore, the gap ratio has an effect on the air entrainment. With the increase of the gap ratio, the air entrainment volume in the water decreases, because the larger the gap ratio is, the better the development of the vortex generated by the wave passing through the fence plate is, the more energy is dissipated, leading to the reduction of wave breaking and air entrapment on the berm. However, in Figure 12e,f, a small amount of air is trapped in the water when the gap ratio of the fence plate is greater than 50%. This shows that a larger gap ratio is not necessarily better when the fence plate and the stepped structure work together.
In general, the larger gap ratio of the fence plate is beneficial to the development of vortex in the cavity of the fence plate, which is better for the wave energy dissipation. However, with an increase of the gap ratio to 50%, the air entrainment in the water will increase.
4.4.3. Turbulent Kinetic Energy
In order to analyze in detail and intuitively the effect of the fence plate on the wave energy dissipation, the local turbulent kinetic energy distribution of the fence plate is demonstrated. Figure 13 shows the turbulent kinetic energy distribution near the cavities of the fence plate on the second step slope for different gap ratios. It can be seen that the turbulent kinetic energy is distributed in the serrated edges and cavities of the fence plate. With the increase of the gap ratio, the distribution range of turbulent kinetic energy increases, and the value of turbulent kinetic energy in the cavity increases. The greater the turbulence kinetic energy value is, the higher the turbulence kinetic energy dissipation is, so the greater the gap ratio of the fence plate is, the greater the energy dissipation capacity of the fence plate is. However, considering the structural stability and strength of the fence plate, the gap rate should not be too large in practical engineering application. Moreover, a large gap ratio leads to the reduction of the cavities, which reduces the effect of the fence plate. In general, the analysis of the distribution of turbulent kinetic energy on the second step slope also shows that a larger gap ratio is more conducive to energy dissipation.
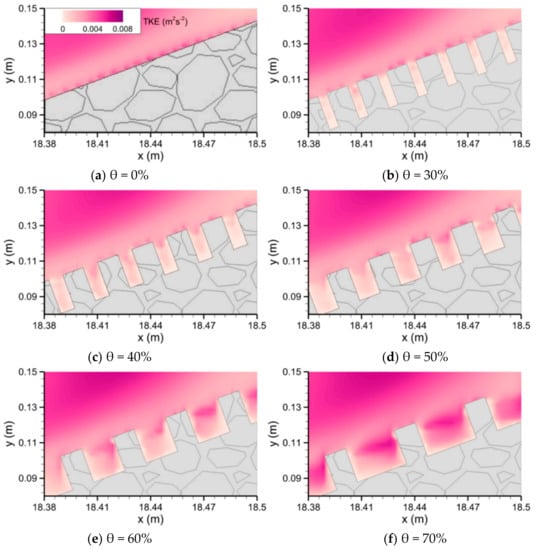
Figure 13.
Turbulent kinetic energy distribution near cavities of fence plate from x = 18.38 m to 18.5 m for different gap ratios (a–f).
4.4.4. Overtopping Volume
Figure 14 shows the temporal evolution of the wave overtopping volume under different gap ratios. When the gap ratio (θ) is 0, the maximum overtopping volume is about 0.7 m3/(m·s) × 10−3, which is larger than those under other cases. With the increase of the gap ratio from 30% to 50%, the volume decreases, indicating that the fence plate can reduce the wave overtopping volume. Then, when the gap ratio continues to increase, the volume increases, which indicates that the energy dissipation capacity is the strongest when the gap ratio is 50% under the synergistic condition of fence plate and stepped structure. Besides, considering the stability of the fence structure and the breakwater, the gap ratio should not be too large or too small. A small gap ratio will result in too much complexity in the production process and poor wave-reducing ability. If the gap ratio is too large, the fence plate will be too fragile and easily damaged. Therefore, it is suggested that the gap ratio of 50% in the fence plate is reasonable.
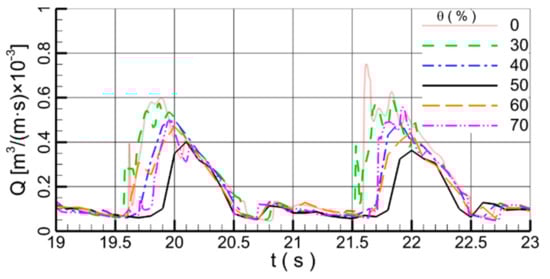
Figure 14.
Temporal evolution of the wave overtopping volume for different gap ratios.
5. Conclusions
In this paper, the characteristics of the physical and numerical models of the stepped breakwater are defined for the protection of the Meizhou Bay. The physical experiments are carried out with regular and irregular waves for three water levels: design low water level, multi-year mean high water level and design high water level. The numerical simulations are carried out for six fence plates with different gap ratios. The wave run-up, wave dissipation, wave overtopping and breakwater stability are analyzed. The effects of the breakwater and its elements on the wave propagation and energy dissipation are discussed under different gap ratios.
Under the multi-year mean high water level, when the wave propagates on the breakwater, the water depth decreases, and the wave height increases due to the shoaling effect. Then, the wave breaks up and the wave energy dissipation, gas entrapment, and overtopping occur. The wave dissipation ridge causes the second disturbance. The results indicate that the breakwater can effectively block waves. When the still water depth is equal to the multi-year mean high water level, the unit discharges of the overtopped water volume for the prototype are 29.4 and 23.1 m3/(m·s) × 10−3 under the regular and irregular waves, respectively, which indicates that the overtopped water under the regular wave is larger than that under the irregular wave, for the same still water depth and the significant wave height. When the still water depth is equal to the design high water level, the unit discharges of the overtopped water volume for the prototype are 77.9 and 51.5 m3/(m·s) × 10−3 for the regular and irregular waves, respectively, which indicates that the overtopped water increases with the increase of the wave height.
Fence plate on the breakwater surface can effectively dissipate energy and reduce the overtopping volume by creating a vortex in the cavity. The larger the gap ratio of the fence plate is, the more beneficial it is to the development of vortex in the cavity. However, with the increase of the gap ratio of 50%, the air entrainment in water will be more serious and the overtopping volume increases. It is suggested that the gap ratio of 50% in the fence plate is reasonable for the breakwater established on the north shore of Meizhou Bay. Besides, wave penetration through breakwater layers and its effect on the wave attenuation along the breakwater slope have not been considered in this study, which is important especially in the case of composite breakwaters with impermeable caissons (Akbari and Taherkhani, 2018; Akbari and Torabbeigi, 2021) [26,27]. In the future, the corresponding research will be conducted.
Author Contributions
Conceptualization, Z.H., X.W. and E.Z.; methodology, Z.H., X.W. and E.Z.; software, J.S.; validation, Z.H., X.W. and J.S.; investigation, Z.H. and X.W.; data curation, J.S.; writing—original draft preparation, E.Z. and J.S.; writing—review and editing, L.M., Z.Z. and E.Z. All authors have read and agreed to the published version of the manuscript.
Funding
This research was funded by Key Special Project for Introduced Talents Team of Southern Marine Science and Engineering Guangdong Laboratory (Guangzhou) (Grant No. GML2019ZD0604), National Natural Science Foundation of China (Grant No. U2006210) and Shenzhen Fundamental Research Program (Grant No. JCYJ20200109110220482).
Institutional Review Board Statement
Not applicable.
Informed Consent Statement
Not applicable.
Conflicts of Interest
The authors declare no conflict of interest.
References
- Goda, Y. Derivation of unified wave overtopping formulas for breakwaters with smooth, impermeable surfaces based on selected CLASH datasets. Coast. Eng. 2009, 56, 385–399. [Google Scholar] [CrossRef]
- Borsje, B.W.; van Wesenbeeck, B.K.V.; Dekker, F.; Paalvast, P.; Bouma, T.J.; Katwijk, M.M.V.; Vries, M.B.D. How ecological engineering can serve in coastal protection. Ecol. Eng. 2011, 37, 113–122. [Google Scholar] [CrossRef]
- Temmerman, S.; Meire, P.; Bouma, T.J.; Herman, P.M.J.; Ysebaert, T.; De Vriend, H.J. Ecosystem-based coastal defence in the face of global change. Nature 2013, 504, 79. [Google Scholar] [CrossRef] [PubMed]
- Akbari, H. Simulation of wave overtopping using an improved SPH method. Coast. Eng. 2017, 126, 51–68. [Google Scholar] [CrossRef]
- Zhao, E.; Qu, K.; Mu, L. Numerical Study of Morphological Response of the Sandy Bed After Tsunami-Like Wave Overtopping an Impermeable Seawall. Ocean Eng. 2019, 186, 106076. [Google Scholar] [CrossRef]
- Damme, M.V. Distributions for wave overtopping parameters for stress strength analyses on flood embankments. Coast. Eng. 2016, 116, 195–206. [Google Scholar] [CrossRef][Green Version]
- Pan, Y.; Kuang, C.P.; Li, L.; Amini, F. Full-scale laboratory study on distribution of individual wave overtopping volumes over a levee under negative freeboard. Coast. Eng. 2015, 97, 11–20. [Google Scholar] [CrossRef]
- Kerpen, N.B. Wave-Induced Responses of Stepped Revetments. Ph.D. Thesis, Gottfried Wilhelm Leibniz University, Hannover, Germany, 2017. [Google Scholar]
- Steeg, P.V.; Joosten, R.A.; Steendam, G.J. Physical model tests to determine the roughness of stair shaped revetments. In Proceedings of the 3rd International Conference on Protection against Overtopping, Grange-over-Sands, UK, 6–8 June 2018. [Google Scholar]
- Gallach-Sánchez, D. Experimental Study of Wave Overtopping Performance of Steep Low-Crested structures. Ph.D. Thesis, Ghent University, Zwijnaarde, Belgium, 2018. [Google Scholar]
- Capel, A. Wave run-up and overtopping reduction by block revetments with enhanced roughness. Coast. Eng. 2015, 104, 76–92. [Google Scholar] [CrossRef]
- Szmytkiewicz, M.; Zeidler, R.B.; Pilarczyk, K.W. Irregular wave run-up on composite rough slopes. In Coastal Dynamics94; ASCE: Reston, VA, USA, 1994; pp. 599–613. [Google Scholar]
- Ward, D.L. Overtopping Studies of a Stepped Revetment for City of Chicago, Illinois; Engineer Research and Development Center Vicksburg Ms Coastal and Hydraulicslab: Vicksburg, MI, USA, 2003. [Google Scholar]
- Krecic, M.R.; Sayao, O.J. Wave overtopping on Chicago shoreline revetment. In Proceedings of the Coastal Structures 2003, Portland, OR, USA, 26–30 August 2003; pp. 542–554. [Google Scholar]
- Kerpen, N.B.; Schlurmann, T. Stepped revetments—revisited. In Proceedings of the 6th International Conference on the Application of Physical Modelling in Coastal and Port Engineering and Science (Coastlab16), Ottawa, ON, Canada, 10–13 May 2016. [Google Scholar]
- Torum, A.; Moghim, M.N.; Westeng, K.; Hidayati, N.; Arntsen, O. On berm breakwaters: Recession, crown wall wave forces, reliability. Coast. Eng. 2012, 60, 299–318. [Google Scholar] [CrossRef]
- Sasani, B.A.; Akbari, H. Numerical study of wave run-up and overtopping considering bed roughness using SPH-GPU. Coast. Eng. J. 2019, 61, 502–519. [Google Scholar] [CrossRef]
- British Standard Institution. BS 6349: 2000—British Standard Code of Practice for Maritime Structures—Part 7: Guide to the Design and Construction of Breakwater; British Standard Institution: London, UK, 2000. [Google Scholar]
- The PRC Ministry of Construction. GB 50286-98, Code for Design of Levee Project; The PRC Ministry of Construction: Beijing, China, 1998. (In Chinese)
- Wang, X.Q.; Hu, Z.Y. Report on Remediation Project of Putian Blue Bay; Fujian Provincial Investigation, Design & Research Institute of Water Conservancy & Hydropower: Fujian, China, 2020. (In Chinese) [Google Scholar]
- Akbari, H.; Panahi, R.; Amani, L. A double-peaked spectrum for the northern parts of the Gulf of Oman: Revisiting extensive field measurement data by new calibration methods. Ocean. Eng. 2019, 180, 187–198. [Google Scholar] [CrossRef]
- Radfar, S.; Shafieefar, M.; Akbari, H.; Galiatsatou, P.A.; Mazyak, A.R. Design of a rubble mound breakwater under the combined effect of wave heights and water levels, under present and future climate conditions. Appl. Ocean. Res. 2021, 112, 102711. [Google Scholar] [CrossRef]
- Zhao, E.; Dong, Y.; Tang, Y.; Sun, J. Numerical Investigation of Hydrodynamic Characteristics and Local Scour Mechanism Around Submarine Pipelines Under Joint Effect of Solitary Waves and Currents. Ocean. Eng. 2021, 222, 108553. [Google Scholar] [CrossRef]
- Zhao, E.; Dong, Y.; Tang, Y.; Xia, X. Performance of Submerged Semi-Circular Breakwater under Solitary Wave in Consideration of Porous Media. Ocean. Eng. 2021, 223, 108573. [Google Scholar] [CrossRef]
- White, F.M. Fluid Mechanics, 5th ed.; McGraw-Hill: New York, NY, USA, 2003; p. 467. [Google Scholar]
- Akbari, H.; Taherkhani, A. Numerical study of wave interaction with a composite breakwater located on permeable bed. Coast. Eng. 2018, 146, 1–13. [Google Scholar] [CrossRef]
- Akbari, H.; Torabbeigi, M. SPH modeling of wave interaction with reshaped and non-reshaped berm breakwaters with permeable layers. Appl. Ocean. Res. 2021, 112, 102714. [Google Scholar] [CrossRef]
Publisher’s Note: MDPI stays neutral with regard to jurisdictional claims in published maps and institutional affiliations. |
© 2021 by the authors. Licensee MDPI, Basel, Switzerland. This article is an open access article distributed under the terms and conditions of the Creative Commons Attribution (CC BY) license (https://creativecommons.org/licenses/by/4.0/).