Article

Variability of Heat and Water Fluxes in the Red Sea Using ERA5 Data (1981–2020)

1
Oceanography Department, Faculty of Science, Alexandria University, Alexandria 21500, Egypt
2
Marine Institute, Oranmore, H91 R673 Co. Galway, Ireland
3
Department of Arctic Geophysics, University Centre in Svalbard, 9171 Longyearbyen, Norway
*
Author to whom correspondence should be addressed.
J. Mar. Sci. Eng. 2021, 9(11), 1276; https://doi.org/10.3390/jmse9111276
Submission received: 2 October 2021 / Revised: 28 October 2021 / Accepted: 14 November 2021 / Published: 16 November 2021
(This article belongs to the Special Issue Models of Ocean-Wave-Atmosphere Interaction Processes)

Abstract

:
The study of heat and water fluxes is one of the most essential components for understanding the interactions and exchanges between the ocean and atmosphere. Heat transfer across the air–sea interface is an important process in ocean–atmosphere dynamics. In this study, a 40-year (1981–2020) high-resolution (0.25° × 0.25°) ERA-5 reanalysis dataset from the European Centre for Medium-Range Weather Forecasts (ECMWF) is used to estimate the variability and trends of heat and water flux components in the Red Sea. The results show that the surface net heat flux is negative (loss) in the Northern Red Sea (NRS) and positive (gain) in the Southern Red Sea (SRS). The highest seasonal surface net heat flux is observed in the spring and early summer, while the lowest is reported in the winter. A significant linear trend is found in the surface net heat flux over the NRS and SRS, with values of about −0.12 ± 0.052 (W/m2)/yr and +0.20 ± 0.021 (W/m2)/yr, respectively. The annual mean surface net water flux loss to the atmosphere over the entire Red Sea is +1.46 ± 0.23 m/yr. The seasonal surface net water flux peak occurs in winter as a result of the northeast monsoon wind, which increases evaporation rate over the whole length of the Red Sea. The highest surface net water flux (+2.1 m/yr) is detected during 2020, while the lowest value (+1.3 m/yr) is observed during 1985.

1. Introduction

The Red Sea is a narrow, elongated basin that connects northeastern Africa to the Arabian Peninsula [1], as shown in Figure 1. The surface buoyancy fluxes caused by the exchange of heat and freshwater between the atmosphere and the ocean are thought to drive the Red Sea circulation [2]. It is completely bordered by dry and semiarid regions and receives very little precipitation and very little seasonal freshwater along the Eritrean coast [3,4]. At the same time, the Red Sea has one of the highest evaporation rates in the world, reaching 2 m/yr [5] and sometimes exceeding 3 m/yr in the Northern Red Sea (NRS) according to [6]. Because exchanges between the Red Sea and the Mediterranean via the Suez Canal are negligible, heat and freshwater exchanges at Bab Al Mandab act as a strong constraint on Red Sea heat and freshwater surface fluxes [5]. Furthermore, it is one of the enclosed seas, with warm and highly saline outflow [2,7], and it contributes significantly to the circulation of the Gulf of Aden and the Arabian Sea.
Several studies have calculated the Red Sea’s net heat and freshwater fluxes [1,2,5,6,8,9,10,11,12,13,14,15,16].
Ref. [9] calculated the net heat flux from seven stations on the Red Sea’s east coast using meteorological data from 1970 to 1984. They discovered that the Red Sea’s net heat flux was −22 W/m2. Ref. [17] mentioned that the Red Sea’s surface deficit (7 W/m2) was compensated by the advective heat surplus into the Red Sea (+6 W/m2) through Bab AI-Mandab Strait, resulting in a total net heat flux of −1 w/m2. They used climatological monthly mean data at four coastal stations along the Red Sea’s eastern coast. One station covered from 1961 to 1990, and the other three were from 1985 to 1991.
Ref. [5] estimated the Red Sea’s heat and freshwater budgets using historical air–sea flux data from a revised version of the Comprehensive Ocean–Atmosphere Data Set (UWM/COADS). This dataset was based on the initial COADS released by [18] and was objectively analyzed on a 1° × 1° global grid. It covered the 45-yr period from January 1945 to December 1989. The study discovered that the Red Sea annual surface net heat flux was −8 ± 2 W/m2 based on the UWM/COADS dataset. The annual net water flux rate evaporation (E)–precipitation (P) was found to be 1.60 ± 0.35 m/yr, the UWM/COADS estimated P was 0.15 m/yr, and evaporation rate was E = 1.75 m/yr.
Ref. [10] investigated the Red Sea’s heat and freshwater budgets using direct observations at Bab Al-Mandab. The observations were collected between June 1995 and November 1996. The heat and water fluxes information came from transport resolving current-meter arrays and temperature–salinity chain moorings. According to the study the annual mean water flux over the Red Sea was estimated to be 2.06 ± 0.22 m/yr, while the annual mean heat flux loss was approximately 11 ± 5 W/m2.
Ref. [1] used the NASA Modern-Era Retrospective Analysis for Research and Applications (MERRA) reanalysis with a resolution of (⅔° × ½°) and the objectively analyzed air–sea fluxes (OAFlux) satellite reanalysis datasets from 1979 to 2013 to investigate the effects of climate modes on air–sea heat exchange in the Red Sea. They noticed different water and atmospheric characteristics from north to south Red Sea according to the seasonal monsoon wind system [1,19]. The study defined the geographical latitude of 20° N as the separating imaginary line between the northern and southern basins (see Figure 1). They discovered that the mean net heat flux in the Northern Red Sea during the winter season was −200 W/m2, whereas the mean net heat gain went up to 60–80 W/m2 in the southernmost basin. During the summer season, the net heat gain across the whole basin was greater than 50 W/m2, with the southern area having higher values than the northern region by 100 W/m2.
Using a high-resolution, nonhydrostatic, hindcast MIT general circulation model, Ref. [12] estimated the net water flow for the Red Sea from 1993 to 2013. They concluded that the net water flux for summer showed a significant increasing trend of ~1.45 m/yr, while it dropped to ~1.22 m/yr during winter over the 19-yr period.
Recently, Ref. [20] applied an end-to-end analysis and prediction system in the Red Sea for meteorological, climate and marine applications. The authors used 5 km to 600 m resolution atmospheric models to address weather (1980–2018) and climate challenges and 4 km to 50 m resolution ocean models with regional and coastal configurations (2001–2015). They found the annual mean net water flux was ~2 m/yr, and the net heat flux was −11 W/m2.
The main objectives of this study are to investigate the variability and trends in Red Sea heat and water fluxes, to estimate the relative importance of different heat flux components, to assess the spatial distribution pattern of each component using ERA5 hourly high-resolution datasets (0.25° × 0.25°) from 1981 to 2020, and to determine and estimate the main factors affecting the surface net water flux over the Red Sea.

2. Data and Methodology
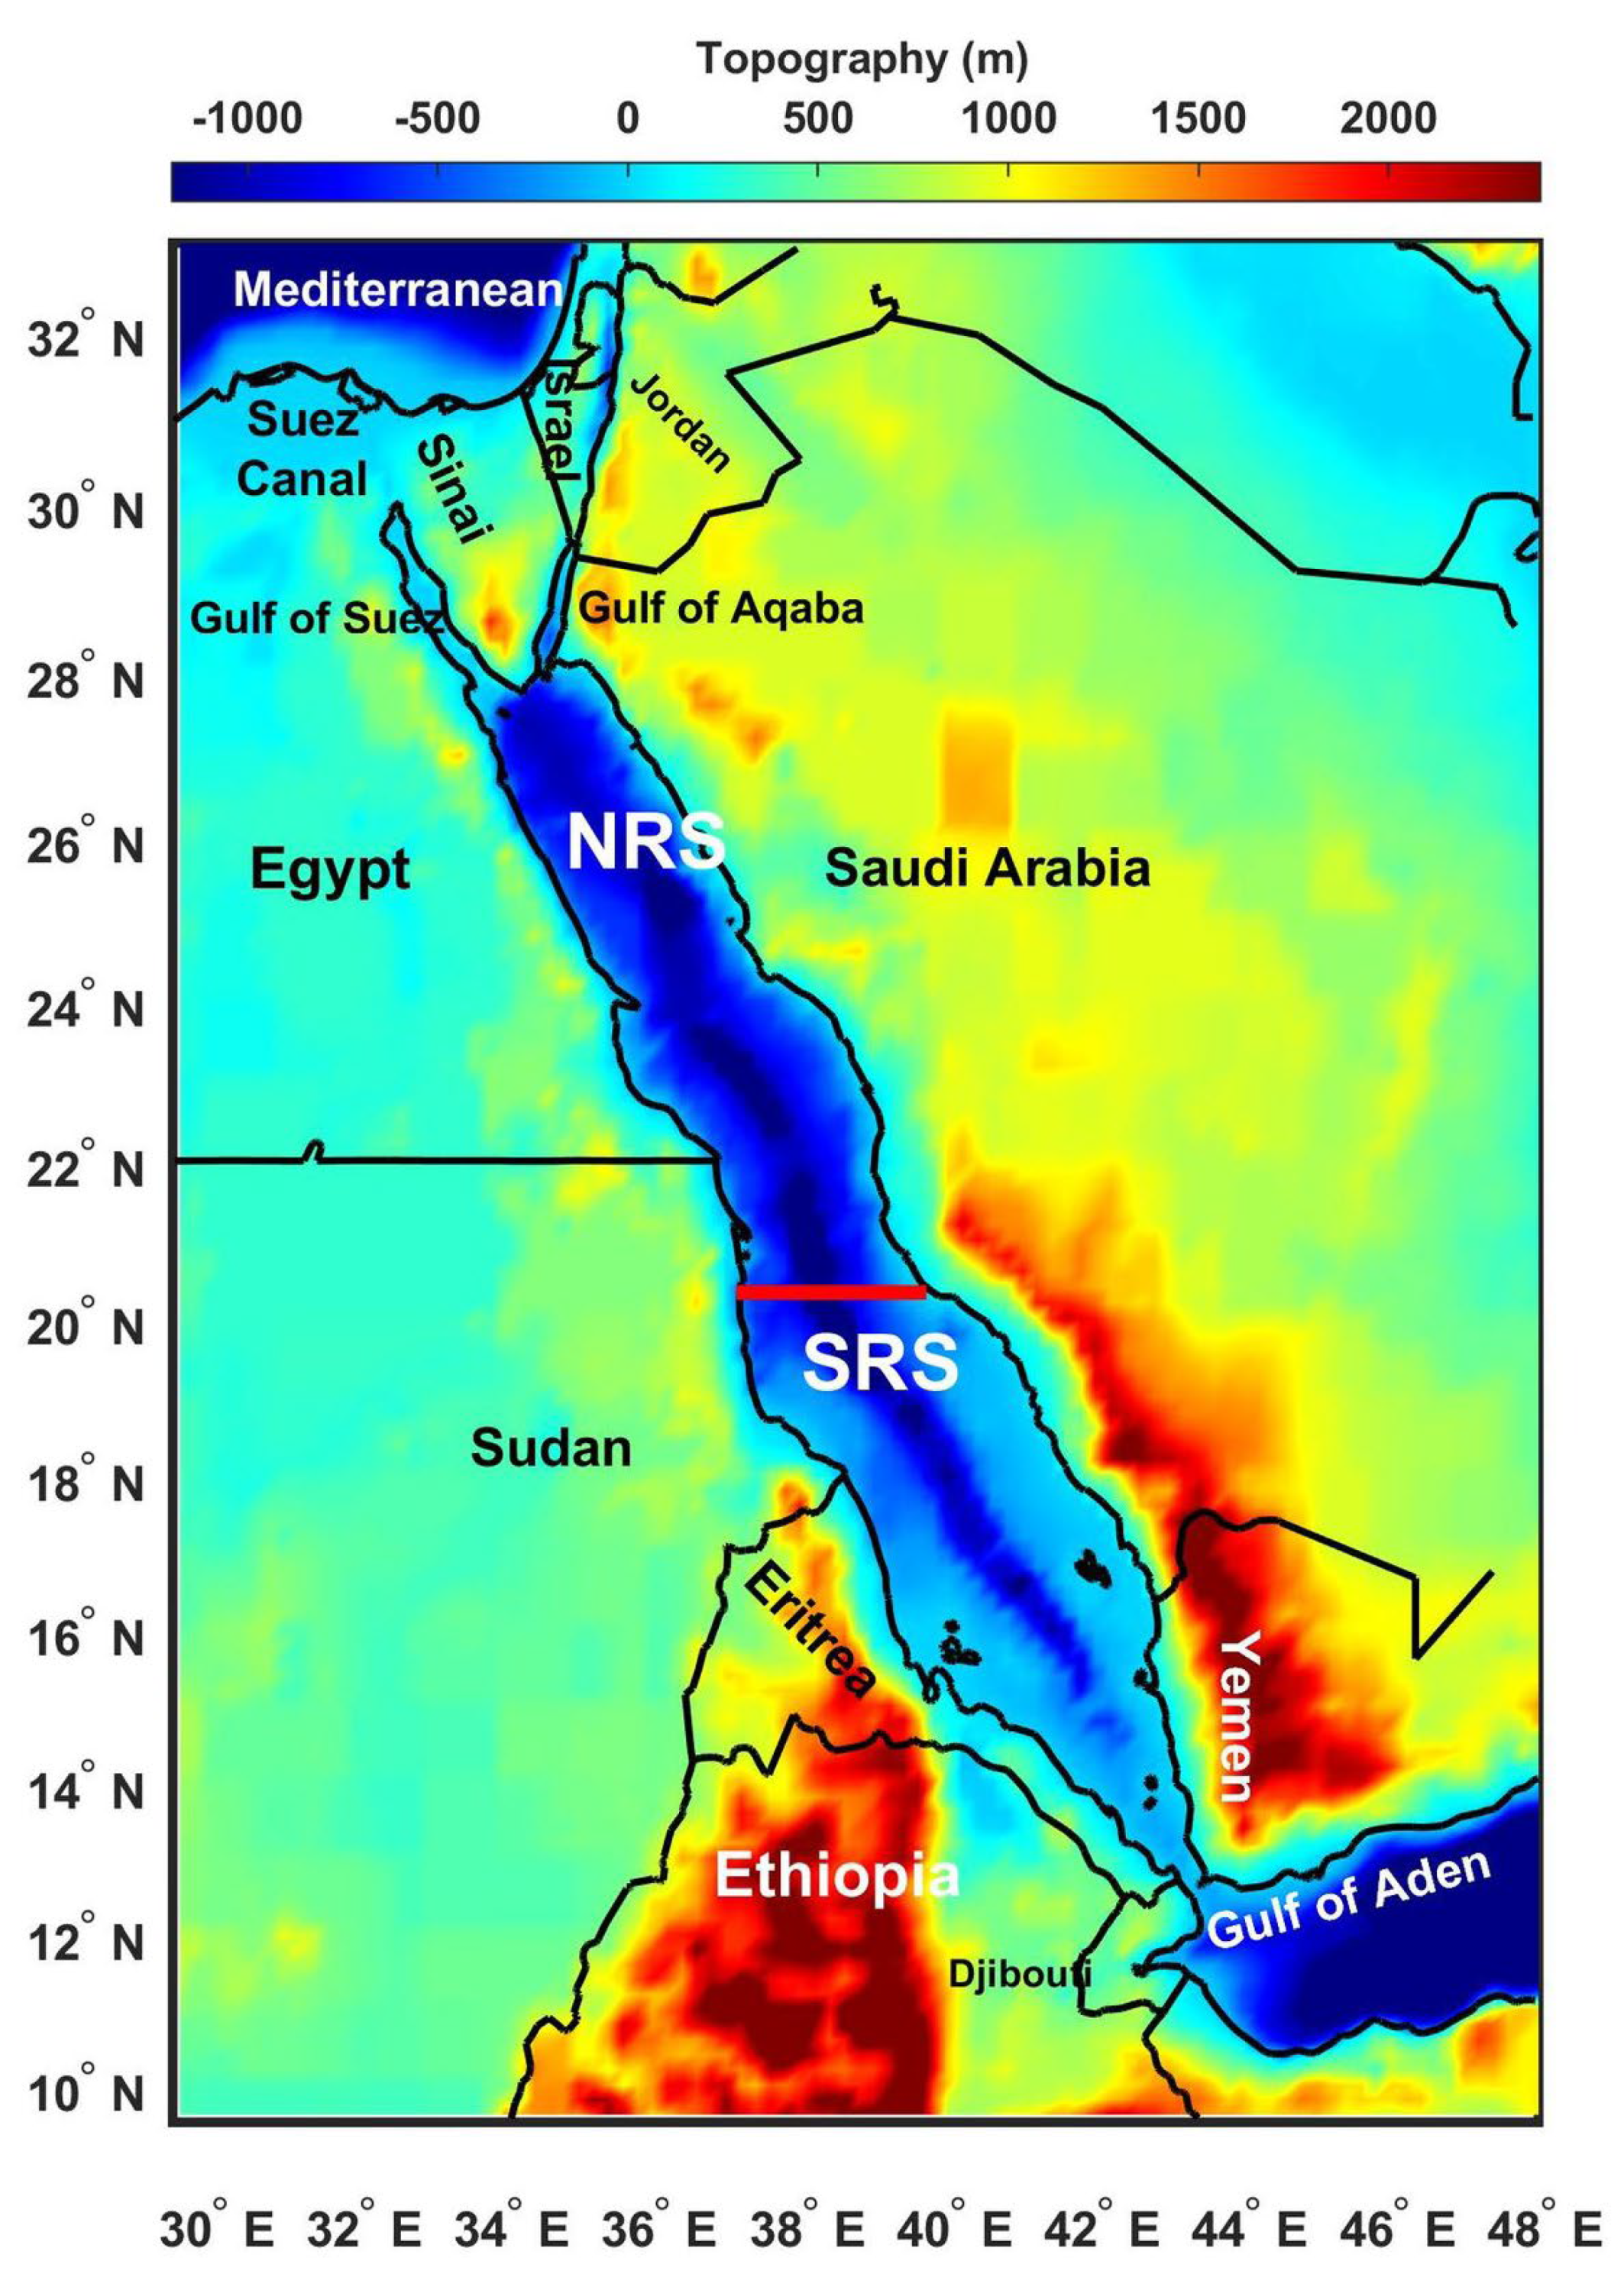
2.1. Study Area

The Red Sea is connected to the Gulf of Aden-Indian Ocean via the Strait of Bab Al-Mandab, which has a sill depth of 160 m and a maximum width of 25 km [21]. The study area extends from 10° N to 31° N and from 32° E to 46° E. In our study, we divided the Red Sea into the North Red Sea (NRS) and South Red Sea (SRS) at the geographical latitude line depicted in Figure 1. The separation was made due to differences in water and atmospheric characteristics from north to south in the Red Sea as a result of the seasonal monsoon wind system [1,19]. The wind system is strong in the SRS, and the wind direction changes seasonally in conjunction with the Indian monsoon system [10]. In particular, the reversal of the monsoons in the SRS modifies the exchange between the Red Sea and Gulf of Aden flow through the Strait of Bab Al-Mandab [5,22]. During the summer, from April to October, a northwest (NW) wind blows along the entire length of the sea, with speeds of 10 m/s approaching and frequently exceeding 15 m/s [23,24]. During the winter, the same northerly wind dominates over the northern part of the basin, while southeastern (SE) winds associated with the Indian Ocean’s northeastern (NE) monsoon prevail over the SRS. The coexistence of northerly and southerly winds creates a convergence zone near the Red Sea’s center, approximately at a latitude of 20° N [24,25].

2.2. Data Sets

The atmospheric data for the computation of the surface net heat flux were taken from the European Centre for Medium-Range Weather Forecasts (ECMWF) ERA5 from 1 January 1981 to 31 December 2020 [26] (https://cds.climate.copernicus.eu/cdsapp#!/dataset/reanalysis-era5-single-levels (accessed on 20 August 2021)). The data set has a 0.25° × 0.25° spatial resolution with an hourly temporal step. The atmospheric field used is the hourly air temperature at a 2 m elevation (T2m), surface net longwave backscatter radiation (Qb), surface net shortwave solar radiation (Qs), surface sensible heat flux (Qh), surface latent heat flux (Qe), evaporation (E), total runoff (R) and total precipitation (P). Daily means were calculated by averaging ERA5 hourly data using the same period from 1981 to 2020.

2.3. Surface Net Heat and Water Fluxes Mean and Trend Estimations

The surface net heat flux QT (W/m2) was computed using ERA5 data sets from 1 January 1981 to 31 December 2020 according to [27] and described in [28,29] as follow:
QT = Qs + Qb + Qe + Qh
where Qb and Qs represent the radiative terms [30], while Qh and Qe represent the turbulent terms [31]. The word radiative refers to the transmission of heat from the sun to the sea (Qs), which is the primary source of energy for the worldwide ocean. The infrared longwave radiation Qb returns some of the absorbed solar energy to the atmosphere, but a portion of this radiation is dispersed by clouds and atmospheric moisture and returns to the sea. Cloud cover has the greatest influence on the radiative terms (Qb and Qs), whereas specific humidity, air and sea surface temperature have less influence on their fluctuation [32,33,34]. The turbulent terms (Qh and Qe) are affected by specific humidity, difference between air and sea surface temperature and wind speed [1,5,16,35,36].
The surface net water flux is calculated from the hourly ERA5 reanalysis data as follows:
The surface net water flux = (E − P − R)
where E is evaporation in m/yr, P is total precipitation over the Red Sea in m/yr, and R is the total runoff in m/yr. We included in this study the very little seasonal freshwater runoff along the Eritrean coast [3,4] which is around 0.01 m/yr, to improve the precision of water flux calculations across the Red Sea.
Furthermore, the spatial and temporal annual linear trends of surface net heat and water fluxes were calculated using the least squares method [37]. The original two-tailed modified Mann–Kendall test with a 95% confidence interval was used to assess the statistical significance of these trends [38,39].

3. Results

In this section, we show the spatiotemporal variability of heat and water fluxes in the Red Sea using ERA5 data (1981–2020).

3.1. Mean and Trend of the Surface Net Heat Flux Components

In this part, we discuss the mean spatial distribution of the heat flux components, as well as the total surface net heat flux for the Red Sea, over the study period (1981–2020), based on ERA5 hourly datasets. We illustrate the spatial and temporal trends for the surface net heat flux over the Red Sea and, furthermore, the annual and seasonal surface net heat flux over the Red Sea.

3.1.1. Spatial Distribution of the Mean Surface Heat Flux Components

Figure 2a–d depicts the spatial distribution pattern for the surface heat flux components Qb, Qs, Qh and Qe for the Red Sea from 1981 to 2020 based on ERA5 hourly data. Table 1 provides further information on surface net heat flux components and 2 m air temperature basin averages with two times standard deviation (± 2σ) and trend values for the NRS and SRS, as well as the whole Red Sea, from 1981 to 2020. Figure 2a shows the spatial distribution of the surface net longwave radiation (Qb), and we can see different patterns (i.e., values) in the NRS (<−80 W/m2; mean: −104 ± 5.00; trend: −0.03 ± 0.00) compared to the SRS (>−80 W/m2; mean: −76 ± 7.00; trend: −0.08 ± 0.007) over the study period (1981–2020). The difference between the two patterns can be seen at the Lat 20° N line, which separates the Red Sea into north and south basins. Higher absolute values of Qb appeared in the NRS, including both Suez and Aqaba Gulfs. These findings show that NRS loses more heat than the SRS. Figure 2b exhibits that the highest net shortwave radiation values (Qs) (>235 W/m2) are in the NRS (i.e., ~Lat: >20° N; mean: 233 ± 5.00; trend: 0.05 ± 0.005), except in both Aqaba and Suez Gulfs. Qs represents the transfer of heat via solar radiation to the sea. Lower values (<235 W/m2) are found in the SRS (i.e., ~Lat: <20° N; mean: 230 ± 3.00; trend: 0.12 ± 0.001). In Figure 2c, the highest absolute surface sensible heat flux values (Qh) (>20 W/m2) are found along the coastal Red Sea and in the NRS (i.e., ~Lat: >20° N; mean: −20 ± 0.65; trend: −0.01 ± 0.001). The lowest absolute Qh are detected in the SRS (<20 W/m2; mean: −16 ± 0.35; trend: −0.2 ± 0.002). Figure 2d shows that the SRS (i.e., ~Lat: <20° N; mean: −111 ± 2.00; trend: −123 ± 2.00) has the lowest absolute values (<120 W/m2) for the surface latent heat flux (Qe), with the exception of Bab Al-Mandab Strait. The highest absolute surface latent heat flux values (>130 W/m2) are recorded in the NRS (mean: −131 ± 3.00; trend: −0.13 ± 0.010) south of the Sinai Peninsula. Figure 3a,b demonstrates the mean and spatial trend of the air temperature during the entire study period (1981–2020). The NRS has the greatest air temperature mean (28.60 ± 0.72 °C), while the SRS has the lowest mean (25.5 ± 0.39 °C), with a total Red Sea mean of 27 ± 0.54 °C (see Figure 3a and Table 1). The SRS, off the southern coasts of Yemen and Eritrea, has the highest air temperature trend (trend: >0.5 °C/Decade), as shown in Figure 3b. The whole Red Sea air temperature trend is 0.30 ± 0.09 °C/Decade, compared to 0.38 ± 0.11 °C/Decade for the SRS and 0.19 ± 0.06 °C/Decade) for the NRS (see Table 1).

3.1.2. Mean and Trend of the Surface Net Heat Flux

Figure 4a,b shows the mean and spatial trend of the surface net heat flux during the entire study period (1981–2020). Nonsignificant values (p > 0.05) are overlaid on the trend map. The surface net heat flux (QT) ranges from −60 to 60 W/m2, as shown in Figure 4a. Maximum values (>50 W/m2) were seen in the SRS (mean: +27 ± 0.48; trend: 0.20 ± 0.021) in front of Yemen and Eritrea’s coastal regions. This might be due to lower shortwave radiation (Qs) values (<235 W/m2) in the southern half of the basin, as described earlier by [1]. The minimum surface net heat flux (QT) (<−55 W/m2) is observed in the NRS (mean: −22 ± 0.82; trend: −0.12 ± 0.052) south of the Sinai Peninsula and Gulf of Suez. The difference between the two patterns is clearly seen at the Lat 20° N line for the NRS (i.e., ~Lat: >20° N; heat loss; -QT) and SRS (i.e., ~Lat: <20° N; heat gain; + QT). The mean surface net heat flux across the Red Sea is −1 ± 0.62 W/m2. There is an interesting similarity between the surface latent heat flux (Qe) and surface net heat flux (QT) fields across the NRS (see Figure 2d and Figure 4a). This similarity between Qe and QT might explain the north–south gradient in the heat exchange, as mentioned in [1].
The maximum significant surface net heat flux trend (p < 0.05; trend: >0.5 W/m2/yr) was found in the SRS, off the southern coast of Yemen and Eritrea (see Figure 4b). Negative surface net heat flow trends (<0 W/m2/yr) were found to be nonsignificant (p > 0.05), whereas all positive trends were determined to be significant (p < 0.05) over the whole Red Sea. Over the whole study period (1981–2020), the mean surface net heat flux trend is +0.21 ± 0.020 W/m2 for the entire Red Sea.

3.1.3. Temporal Evolution of the Surface Net Heat Flux

Figure 5a,b demonstrates the annual and the climatological seasonal surface net heat flux for the Red Sea over the whole study period (1981–2020). The surface net heat flux temporal evolution for the Red Sea region displays a clear ascending trend over the study period, as shown in Figure 5a. The Red Sea surface net heat flux temporal trend is about +0.18 ± 0.057 (W/m2)/yr over the study period (i.e., 1981–2020). The maximum surface net heat flux (+15.2 W/m2) is detected during 2019, while the minimum value (−5.5 W/m2) is recorded in 1992 (see Figure 5a). The results show that the temporal annual surface net heat flux has positive values in the last nine years (i.e., 2012–2020) over the study period. Figure 5b depicts the highest surface net heat flux is >80 W/m2 during spring and early summer (i.e., from May to June). The lowest surface net heat flux is <−80 W/m2 during winter (i.e., December and January), which is consistent with [1,5,17].

3.2. Surface Net Water Flux (E-P-R)

In this section, the authors present the spatial distribution patterns for the surface water flux components (evaporation (E) and precipitation (P)), the surface net water flux for the Red Sea during the entire study period (1981–2020) and the temporal and seasonal distribution for the surface net water flux.

3.2.1. Spatial Distribution for the Evaporation, Precipitation and Surface Net Water Flux

Figure 6a–c describes the spatial distribution patterns for the surface water flux components E, P and the surface net water flux for the Red Sea during the entire study period (1981–2020). Table 2 shows the surface net water flux component basin averages (E, P and R) and the surface net water flux for the NRS and SRS, as well as the whole Red Sea, during the aforementioned time period. Figure 6a demonstrates that the NRS (i.e., ~Lat: >20° N; mean: 1.68 ± 0.33 m/yr) has the largest evaporation rate (>1.6 m/yr). The SRS (i.e., ~Lat: <20° N; mean: 1.40 ± 0.22 m/yr) has the lowest values (<1.5 m/yr). The spatial mean evaporation over the whole Red Sea is 1.54 ± 0.26 m/yr, which is consistent with the findings of [5].
Figure 6b shows that the SRS (i.e., ~Lat: <20° N; mean: 0.12 ± 0.03) has more precipitation than the NRS (i.e., ~Lat: >20° N; mean: 0.04 ± 0.01). The average annual precipitation over the entire Red Sea is 0.08 ± 0.02 m/yr. Figure 6c indicates that the annual mean water loss to the atmosphere over the Red Sea is greater in the NRS (i.e., ~Lat: >20° N; mean: 1.64 ± 0.31) than the SRS (i.e., ~Lat: <20° N; mean: 1.27 ± 0.18). This might be due to the high precipitation rate and the runoff from the Eritrean coast (0.01 m/yr) in the SRS. Figure 6c shows the average surface net water flux of 1.46 ± 0.23 m/yr for the entire Red Sea over the study period 1981–2020. It is obvious that the rate of evaporation surpasses the rate of precipitation over the Red Sea. The evaporation and surface net water flux fields are quite similar. Overall, evaporation rate is a significant factor in estimating surface net water flux over the Red Sea.

3.2.2. Temporal Evolution of the Surface Net Water Flux (E-P-R)

To understand the seasonal behavior of surface water flux, we first focus on the evaporation and precipitation seasonal cycles (main water flux components). Figure 7a depicts a time series of the surface seasonal averaged daily mean evaporation rate (m/yr) against a time series of seasonal daily mean average precipitation. This double-scale graphic shows that the evaporation rate of the Red Sea is the most important factor influencing the surface net water flux. The highest evaporation rate (~2 m/yr) is recorded during the winter season (i.e., December and January), and this finding is similar to [17]. The minimum evaporation rate (~1 m/yr) is detected during spring and early summer (i.e., May and June). The precipitation rate is fluctuating between ~0 m/yr (summer: June and July) and 0.25 m/yr (late autumn: mid-November).
Figure 7b demonstrates the seasonal daily climatology (1981–2020) mean cycle of the surface net water flux (m/yr). The surface water flux seasonal cycle is following exactly the seasonal cycle of the evaporation rate. The highest (1.9 m/yr) surface net water flux is observed during winter (i.e., December). The lowest (<+1 m/yr) surface net water flux was found during late spring and early summer (i.e., May and June), which agrees with [1,5].
Figure 8 demonstrates the temporal annual surface net water flux for the Red Sea over the whole study period (1981–2020). The maximum surface net water flux (+2.1 m/yr) is recorded during 2020, while the minimum value (+1.3 m/yr) is noticed during 1985 (see Figure 8). The results show that the temporal annual surface net water flux has positive values (i.e., freshwater loss to the atmosphere) over the entire study period.

4. Discussion

The spatial variability of all heat flux components (Qb, Qs, Qh and Qe) differs between the NRS and SRS (i.e., higher absolute values in NRS and lower values in SRS), as shown in Figure 2a–d.
Higher absolute values of Qb (<−80 W/m2) were found in the NRS (mean: −104 ± 5.00; trend: −0.03 ± 0.005), including both Suez and Aqaba Gulfs (Figure 2a). These findings are consistent with [1,5,10], which demonstrate that the NRS loses more heat than the SRS. Figure 2b shows that the highest Qs values (>235 W/m2) were found in the NRS (mean: 233 ± 5.00; trend: 0.05 ± 0.005), except in the Gulfs of Aqaba and Suez, in agreement with [1,16,20]. The highest absolute Qh flux values (5–10 W/m2; Figure 2c) were found along the Red Sea coast and in the NRS (i.e., ~Lat: >20° N; mean: −20 ± 0.65; trend: −0.01 ± 0.001). This is due to the large disparity in air and sea surface temperatures, as well as the high relative humidity in these locations [16], which are regarded as the primary factors influencing Qh [35,36]. Figure 2d shows that the lowest absolute values (<120 W/m2) for Qe were found in the SRS (i.e., ~Lat: <20° N; mean: −111 ± 2.00; trend: −123 ± 2.00), except at Bab Al-Mandab. This might be due persistence of the strong monsoon wind system in the SRS [10]. As previously stated, the small absolute Qe value (~170 W/m2) at Bab Al-Mandab Strait may be due to the significant wind variability in this specific area [6]. The highest absolute Qe values (>130 W/m2) were noticed in the NRS (mean: −131 ± 3.00; trend: −0.13 ± 0.010), particularly south of the Sinai Peninsula, in agreement with [5]. According to Table 1 and Figure 3, we found that the NRS has the highest air temperature mean (28.60 ± 0.72 °C), while the SRS has the lowest mean (25.5 ± 0.39 °C), with a total Red Sea mean of 27 ± 0.54 °C. The highest air temperature trend (trend: >0.5 °C/Decade) was found off the southern coasts of Yemen and Eritrea. The whole Red Sea air temperature trend was 0.30 ± 0.09 °C/Decade, compared to 0.38 ± 0.11 °C/Decade for the SRS and 0.19 ± 0.06 °C/Decade) for the NRS (see Table 1).
Figure 4a shows a surface net heat flux gain (>50 W/m2) was noticed in the SRS (mean: +27 ± 0.48; trend: 0.20 ± 0.021) in front of Yemen and Eritrea’s coastal regions, in accordance with [1,5,10,16]. This may be because of reduced shortwave radiation (Qs) values (<235 W/m2) over the southern part of the basin, as previously mentioned by [1]. The NRS experienced a loss in surface net heat flux (QT) (−55 W/m2), particularly south of the Sinai Peninsula and the Gulf of Suez (mean: −22 ± 0.82; trend: −0.12 ± 0.052), in agreement with [17]. We discovered an interesting resemblance between the surface latent heat flux (Qe) and surface net heat flux (QT) fields over the NRS. This similarity between Qe and QT plays a crucial role in defining the north–south gradient in the heat exchange, as mentioned in [1]. The surface net heat flux fields showed a distinct difference between the NRS (heat loss) and SRS (heat gain) defined by the Lat 20° N line, as shown in Figure 4a. We found that the mean surface net heat flux across the Res Sea was −1 ± 0.62 W/m2. This finding agrees with [9,10,40]. Figure 4b demonstrates that the maximum significant surface net heat flux trend (i.e., p < 0.05; trend: >0.5 W/m2/yr) was observed in the SRS, off the southern coast of Yemen and Eritrea. All positive trends were found to be significant (p < 0.05) over the whole Red Sea (Figure 4b). Negative surface net heat flux trends (i.e., <0 W/m2/yr) were found to be nonsignificant (p > 0.05). The mean surface net heat flux trend was +0.2 ± 0.020 W/m2 for the entire Red Sea. The authors described the annual and the seasonal surface net heat flux (Figure 5a,b) for the Red Sea over the whole study period (1981–2020). We discovered a positive surface net heat flux temporal trend of +0.18 ± 0.057 (W/m2)/yr over the study period (i.e., 1981–2020) (Figure 5a). As recently highlighted by [41], the rising trend of the surface net heat flux could be influenced by global warming. Additionally, according to a study by [42], the interannual variations in the heat content of the 0–100 m layer in the Red Sea are largely caused by changes in air temperature (i.e., global warming). The highest surface net heat flux was >80 W/m2 during spring and early summer (i.e., from May to June). The lowest surface net heat flux was <−80 W/m2 during winter (i.e., December and January), which is consistent with [1,5].
The evaporation rates were ~Lat: >20° N and mean: 1.68 ± 0.33 m/yr for the NRS, ~Lat: <20° N and mean: 1.40 ± 0.22 m/yr for the SRS and for the whole Red Sea 1.54 ± 0.26 m/yr, as shown in Figure 6a. The Red Sea evaporation rate is considered to be the greatest in the global ocean [10]. The high evaporation rate over the Red Sea might be due to the strong monsoon winds and high air temperature, as previously mentioned by [1,5,6,10,17,43]. Precipitation rates were found to be higher in the SRS (i.e., ~Lat: <20° N; mean: 0.12 ± 0.03) than in the NRS (i.e., ~Lat: >20° N; mean: 0.04 ± 0.01), and the average annual precipitation throughout the whole Red Sea is 0.08 ± 0.02 m/yr, as shown in Figure 6b. From the results, we deduced that the evaporation rate exceeds the precipitation rate over the entire Red Sea, in agreement with [5,6]. The annual mean water loss to the atmosphere over the Red Sea is greater in the NRS (i.e., ~Lat: >20° N; mean: 1.64 ± 0.31) than the SRS (i.e., ~Lat: <20° N; mean: 1.27 ± 0.18) (Figure 6c). The annual mean water loss to the atmosphere over the Red Sea was 1.46 ± 0.23 m/yr. The authors discovered that the evaporation and surface net water flux fields are quite similar (see Figure 6a,c). In summary, evaporation rate is a significant factor in estimating surface net water flux over the entire Red Sea. We created a double-scale graph (comparing seasonal daily climatological mean evaporation and precipitation rates) to demonstrate that evaporation is the primary factor influencing surface net water flux over the Red Sea. The authors found that the surface water flux seasonal cycle exactly followed the seasonal cycle of the evaporation rate. The maximum (1.9 m/yr) surface net water flux is during winter (i.e., December), while the minimum (<+1 m/yr) surface net water flux is during late spring and early summer (i.e., May and June) (Figure 7b). The surface net water flux peaks observed in winter are due to southeastern (SE) winds associated with the Indian Ocean’s northeastern (NE) monsoon winds, which blow up with speeds of 10 m/s approaching and frequently exceeding 15 m/s over the whole length of the Red Sea [23,24]. The highest surface net water flux (+2.1 m/yr) was detected during 2020, while the lowest value (+1.3 m/yr) was observed during 1985 (see Figure 8).

5. Conclusions

This study provides the variability of heat and water fluxes over the Red Sea using ERA5 reanalysis dataset over 40 years (1981–2020). The authors determined the relative significance of various heat and water flux components and illustrated their geographical distribution patterns.
The highest absolute values of surface sensible heat flux (Qh) were found in the NRS. This might be due to the large difference between air and sea surface temperatures, as well as the high relative humidity in this region. The SRS had the lowest absolute values for surface latent heat flux (Qe), with the exception of the Bab Al-Mandab Strait. This might be due to the SRS’s strong monsoon wind system, which fluctuates in conjunction with the Indian monsoon system. The spatial patterns of the latent heat flux (Qe) and net heat flux (QT) coincided in the NRS. This similarity between Qe and QT could explain the north–south gradient in heat exchange.
In general, the spatial pattern in the NRS surface net heat flux (QT) was negative (i.e., heat loss) and positive in the SRS (i.e., heat gain), with average values of −22 ± 0.82 W/m2 and +27 ± 0.48 W/m2, respectively. We found linear trends for surface net heat flux in the NRS of −0.12 ± 0.052 (W/m2)/yr and +0.20 ± 0.021 (W/m2)/yr in the SRS, with an average trend value of +0.21 ± 0.020 (W/m2)/yr for the entire Red Sea. According to the temporal variability of the surface net heat flux, the Red Sea was in a different state before and after 2001. (i.e., there is an unaccelerated trend from 1981 to 2001, followed by a higher trend from 2002 to 2020).
The evaporation rate was a significant factor in estimating surface net water flow over the entire Red Sea. Over the whole study period, the results deduced that the temporal annual surface net water flux has positive values (i.e., freshwater loss to the atmosphere). The surface net water flux peak observed in winter could be attributed to the NE monsoon wind, which increases evaporation and has a direct impact on the surface net water flux along the entire length of the Red Sea.
The highest surface net water flux (+2.1 m/yr) was detected during 2020, while the lowest value (+1.3 m/yr) was observed during 1985.

Author Contributions

Conceptualization, O.I., B.M. and H.N.; methodology, H.N., B.M. and O.I.; formal analysis, O.I., H.N. and B.M., investigation, O.I., B.M. and H.N.; resources, B.M., O.I. and H.N.; data curation, B.M, H.N. and O.I.; writing—original draft preparation, O.I., B.M. and H.N.; writing—review and editing H.N., O.I. and B.M.; visualization, B.M., O.I. and H.N.; supervision, H.N., B.M. and O.I. All authors have read and agreed to the published version of the manuscript.

Funding

This research received no external funding.

Institutional Review Board Statement

Not applicable.

Informed Consent Statement

Not applicable.

Data Availability Statement

Not applicable.

Acknowledgments

The authors would like to acknowledge the organizations that provided the sources of the data used in this work, the European Centre for Medium-Range Weather Forecasts (ECMWF) ERA5 (https://cds.climate.copernicus.eu/cdsapp#!/dataset/reanalysis-era5-single-levels, accessed on 20 August 2021). We wish also to thank the anonymous reviewers for their constructive comments, which helped us to improve the manuscript.

Conflicts of Interest

The authors declare no conflict of interest.

References

  1. Abualnaja, Y.; Papadopoulos, V.P.; Josey, S.A.; Hoteit, I.; Kontoyiannis, H.; Raitsos, D.E. Impacts of Climate Modes on Air–Sea Heat Exchange in the Red Sea. J. Clim. 2015, 28, 2665–2681. [Google Scholar] [CrossRef] [Green Version]
  2. Alshreem, B.M.; Alsaafani, M.A.; Alraddadi, T.M.; Abdulla, C.P. Heat Balance in the Sharm Obhur and Exchange with the Red Sea. Earth Syst. Environ. 2019, 3, 483–490. [Google Scholar] [CrossRef]
  3. Khalil, A.S.M. Mangroves of the Red Sea. Red Sea 2015, 585–597. [Google Scholar] [CrossRef]
  4. Carvalho, S.; Kürten, B.; Krokos, G.; Hoteit, I.; Ellis, J. The red sea. In World Seas: An Environmental Evaluation: Volume II: The Indian Ocean to the Pacific; Elsevier: Amsterdam, The Netherlands, 2018; Volume 2, pp. 49–74. [Google Scholar] [CrossRef]
  5. Tragou, E.; Garrett, C.; Outerbridge, R.; Gilman, C. The heat and freshwater budgets of the Red Sea. J. Phys. Oceanogr. 1999, 29, 2504–2522. [Google Scholar] [CrossRef]
  6. Papadopoulos, V.P.; Abualnaja, Y.; Josey, S.A.; Bower, A.; Raitsos, D.E.; Kontoyiannis, H.; Hoteit, I. Atmospheric Forcing of the Winter Air–Sea Heat Fluxes over the Northern Red Sea. J. Clim. 2013, 26, 1685–1701. [Google Scholar] [CrossRef] [Green Version]
  7. Abdulla, C.P.; Alsaafani, M.A.; Alraddadi, T.M.; Albarakati, A.M. Mixed layer depth variability in the Red Sea. Ocean Sci. 2018, 14, 563–573. [Google Scholar] [CrossRef] [Green Version]
  8. Patzert, W.C.V. Wind-Induced Reversal in Red Sea Circulation; Pergamon Press: Oxford, UK, 1974; Volume 21. [Google Scholar]
  9. Ahmad, F.; Sultan, S.A.R. Surface heat fluxes and their comparison with the oceanic heat flow in the Red Sea. Oceanol. Acta 1989, 12, 33–36. [Google Scholar]
  10. Sofianos, S.S.; Johns, W.E.; Murray, S.P. Heat and freshwater budgets in the Red Sea from direct observations at Bab el Mandeb. Deep. Res. Part II Top. Stud. Oceanogr. 2002, 49, 1323–1340. [Google Scholar] [CrossRef]
  11. Ahmad, F.; Albarakati, A.M.A. Heat Balance of the Red Sea. In The Red Sea; Rasul, N., Stewart, I., Eds.; Springer Earth System Sciences: Berlin/Heidelberg, Germany, 2015; pp. 355–361. [Google Scholar] [CrossRef]
  12. Xie, J.; Krokos, G.; Sofianos, S.; Hoteit, I. Interannual Variability of the Exchange Flow Through the Strait of Bab-al-Mandeb. J. Geophys. Res. Oceans 2019, 124, 1988–2009. [Google Scholar] [CrossRef] [Green Version]
  13. Raitsos, D.E.; Hoteit, I.; Prihartato, P.K.; Chronis, T.; Triantafyllou, G.; Abualnaja, Y. Abrupt warming of the Red Sea. Geophys. Res. Lett. 2011, 38, 14601. [Google Scholar] [CrossRef] [Green Version]
  14. Ahmad, F.; Sultan, S.A.R.; Moammar, M.O. Monthly variations of net heat flux at the air-sea interface in coastal waters near Jeddah, Red Sea. Atmos. Ocean 2010, 27, 406–413. [Google Scholar] [CrossRef]
  15. Smeed, D. Seasonal variation of the flow in the strait of Bab al Mandab. Oceanol. Acta 1997, 20, 773–781. [Google Scholar]
  16. Matsoukas, C.; Banks, A.C.; Pavlakis, K.G.; Hatzianastassiou, N.; Stackhouse, P.W.; Vardavas, I. Seasonal heat budgets of the Red and Black seas. J. Geophys. Res. Oceans 2007, 112, 1–15. [Google Scholar] [CrossRef]
  17. Abdelrahman, S.; Ahmad, F. Red Sea Surface Heat Fluxes and Advective Heat Transport through Bab EI Mandab. J. King Abdulaziz Univ. Sci. 1995, 6, 3–13. [Google Scholar] [CrossRef]
  18. Woodruff, S.D.; Slutz, R.J.; Jenne, R.L.; Steurer, P.M. A Comprehensive Ocean-Atmosphere Data Set. Bull. Am. Meteorol. Soc. 1987, 68, 1239–1250. [Google Scholar]
  19. Viswanadhapalli, Y.; Dasari, H.P.; Langodan, S.; Challa, V.S.; Hoteit, I. Climatic features of the Red Sea from a regional assimilative model. Int. J. Climatol. 2017, 37, 2563–2581. [Google Scholar] [CrossRef]
  20. Hoteit, I.; Abualnaja, Y.; Afzal, S.; Ait-El-Fquih, B.; Akylas, T.; Antony, C.; Dawson, C.; Asfahani, K.; Brewin, R.J.; Cavaleri, L.; et al. Towards an end-to-end analysis and prediction system for weather, climate, and Marine applications in the Red Sea. Bull. Am. Meteorol. Soc. 2021, 102, E99–E122. [Google Scholar] [CrossRef]
  21. Mohamed, B.; Nagy, H.; Ibrahim, O. Spatiotemporal Variability and Trends of Marine Heat Waves in the Red Sea over 38 Years. J. Mar. Sci. Eng. 2021, 9, 842. [Google Scholar] [CrossRef]
  22. Maillard, C.; Soliman, G. Hydrography of the Red Sea and exchanges with the Indian Ocean in summer. Oceanol. Acta 1986, 9, 249–269. [Google Scholar]
  23. Langodan, S.; Cavaleri, L.; Vishwanadhapalli, Y.; Pomaro, A.; Bertotti, L.; Hoteit, I. The climatology of the Red Sea—Part 1: The wind. Int. J. Climatol. 2017, 37, 4509–4517. [Google Scholar] [CrossRef]
  24. Mittal, H.V.R.; Langodan, S.; Zhan, P.; Li, S.; Knio, O.; Hoteit, I. Hazard assessment of oil spills along the main shipping lane in the Red Sea. Sci. Rep. 2021, 11, 1–14. [Google Scholar] [CrossRef]
  25. Langodan, S.; Cavaleri, L.; Viswanadhapalli, Y.; Hoteit, I. Wind-wave source functions in opposing seas. J. Geophys. Res. Oceans 2015, 120, 6751–6768. [Google Scholar] [CrossRef] [Green Version]
  26. Hersbach, H.; Bell, B.; Berrisford, P.; Hirahara, S.; Horányi, A.; Muñoz-Sabater, J.; Nicolas, J.; Peubey, C.; Radu, R.; Schepers, D.; et al. The ERA5 global reanalysis. Q. J. R. Meteorol. Soc. 2020, 146, 1999–2049. [Google Scholar] [CrossRef]
  27. Pinardi, N.; Allen, I.; Demirov, E.; De Mey, P.; Korres, G.; Lascaratos, A.; Le Traon, P.-Y.; Maillard, C.; Manzella, G.; Tziavos, C. The Mediterranean ocean forecasting system: First phase of implementation (1998–2001). Ann. Geophys. 2003, 21, 3–20. [Google Scholar] [CrossRef] [Green Version]
  28. Nagy, H.; Elgindy, A.; Pinardi, N.; Zavatarelli, M.; Oddo, P. A nested pre-operational model for the Egyptian shelf zone: Model configuration and validation/calibration. Dyn. Atmos. Oceans 2017, 80, 75–96. [Google Scholar] [CrossRef]
  29. Nagy, H.; Lyons, K.; Nolan, G.; Cure, M.; Dabrowski, T. A Regional Operational Model for the North East Atlantic: Model Configuration and Validation. J. Mar. Sci. Eng. 2020, 8, 673. [Google Scholar] [CrossRef]
  30. Zhang, Y.; Rossow, W.B.; Lacis, A.A.; Oinas, V.; Mishchenko, M.I. Calculation of radiative fluxes from the surface to top of atmosphere based on ISCCP and other global data sets: Refinements of the radiative transfer model and the input data. J. Geophys. Res. Atmos. 2004, 109, 19105. [Google Scholar] [CrossRef] [Green Version]
  31. Yu, L.; Jin, X.; Weller, R.A. Multidecade Global Flux Datasets from the Objectively Analyzed Air-Sea Fluxes (OAFlux) Project: Latent and Sensible Heat Fluxes, Ocean Evaporation, and Related Surface Meteorological Variables; OAFlux Project Technical Report. OA-2008-01; Woods Hole Oceanographic Institution: Falmouth, MA, USA, 2008; p. 64. [Google Scholar] [CrossRef]
  32. Castellari, S.; Pinardi, N.; Leaman, K. A model study of air-sea interactions in the Mediterranean Sea. J. Mar. Syst. 1998, 18, 89–114. [Google Scholar] [CrossRef]
  33. Schiano, M.E.; Borghini, M.; Castellari, S.; Luttazzi, C. Climatic features of the Mediterranean Sea detected by the analysis of the longwave radiative bulk formulae. Ann. Geophys. 2000, 18, 1482–1487. [Google Scholar] [CrossRef]
  34. Josey, S.A.; Pascal, R.W.; Taylor, P.K.; Yelland, M.J. A new formula for determining the atmospheric longwave flux at the ocean surface at mid-high latitudes. J. Geophys. Res 2003, 108, 3108. [Google Scholar] [CrossRef]
  35. Bignami, F.; Marullo, S.; Santoleri, R.; Schiano, M.E. Longwave radiation budget in the Mediterranean Sea. J. Geophys. Res. 1995, 100, 2501–2514. [Google Scholar] [CrossRef]
  36. Gilman, C.; Rrett, C.G. Heat flux parameterizations for the Mediterranean Sea: The role of atmospheric aerosols and constraints from the water budget. J. Geophys. Res. 1994, 99, 5119–5134. [Google Scholar] [CrossRef]
  37. Wilks, D.S. Statistical Methods in the Atmospheric Sciences; Academic Press: Cambridge, MA, USA, 2011; ISBN 0123850223. [Google Scholar]
  38. Hamed, K.H.; Ramachandra Rao, A. A modified Mann-Kendall trend test for autocorrelated data. J. Hydrol. 1998, 204, 182–196. [Google Scholar] [CrossRef]
  39. Wang, F.; Shao, W.; Yu, H.; Kan, G.; He, X.; Zhang, D.; Ren, M.; Wang, G. Re-evaluation of the Power of the Mann-Kendall Test for Detecting Monotonic Trends in Hydrometeorological Time Series. Front. Earth Sci. 2020, 8, 14. [Google Scholar] [CrossRef]
  40. Ahmad, F.; Sultan, S.A.R. On the heat balance terms in the central region of the Red Sea. DSRA 1987, 34, 1757–1760. [Google Scholar] [CrossRef]
  41. Agulles, M.; Jordà, G.; Hoteit, I.; Agustí, S.; Duarte, C.M. Assessment of Red Sea temperatures in CMIP5 models for present and future climate. PLoS ONE 2021, 16, e0255505. [Google Scholar] [CrossRef]
  42. Agulles, M.; Jordà, G.; Jones, B.; Agustí, S.; Duarte, M.C. Temporal evolution of temperatures in the red sea and the gulf of aden based on in situ observations (1958–2017). Ocean Sci. 2020, 16, 149–166. [Google Scholar] [CrossRef] [Green Version]
  43. Sun, R.; Subramanian, A.C.; Cornuelle, B.D.; Mazloff, M.R.; Miller, A.J.; Ralph, F.M.; Seo, H.; Hoteit, I. The Role of Air–Sea Interactions in Atmospheric Rivers: Case Studies Using the SKRIPS Regional Coupled Model. J. Geophys. Res. Atmos. 2021, 126. [Google Scholar] [CrossRef]
Figure 1. Red Sea topography with the main geographic features (e.g., countries) according to a 5 min (1/12 degree) global grid of topography from the World digital elevation model (ETOPO5) dataset, https://www.eea.europa.eu/data-and-maps/data/world-digital-elevation-model-etopo5 (accessed on 20 August 2021), where the solid red line at the 20° N geographical latitude separates the North Red Sea (NRS) and South Red Sea (SRS).
Jmse 09 01276 g001
Figure 2. Spatial distribution for the surface net heat flux components (W/m2) in the Red Sea over the study period (1981–2020): (a) surface net longwave backscatter radiation (Qb); (b) surface net shortwave solar radiation (Qs); (c) surface sensible heat flux (Qh); (d) surface latent heat flux (Qe).
Jmse 09 01276 g002
Figure 3. Spatial distribution for (a) air temperature at 2 m elevation (°C) and (b) mean trend (°C/decade) for the Red Sea from 1981 to 2020.
Jmse 09 01276 g003
Figure 4. (a) Spatial distribution of the mean surface net heat flux (W/m2) over the Red Sea from 1981 to 2020; (b) mean trend ((W/m2)/yr) for the Red Sea from 1981 to 2020, where the black dots indicate the change is not significantly different (p > 0.05).
Jmse 09 01276 g004
Figure 5. (a) Annual surface net heat flux (W/m2) time series for the Red Sea is denoted by a continuous black line from 1981 to 2020, while the surface net heat flux trend is represented by a continuous red line. (b) Temporal evolution of the daily basin averaged surface net heat flux (W/m2) from 1981 to 2020 for the Red Sea.
Jmse 09 01276 g005
Figure 6. (a) Spatial distribution of the evaporation (m/yr) over the Red Sea from 1981 to 2020. (b) Spatial distribution of the precipitation (m/yr) over the Red Sea from 1981 to 2020. (c) Spatial distribution of the surface net water flux (m/yr) over the Red Sea from 1981 to 2020.
Jmse 09 01276 g006aJmse 09 01276 g006b
Figure 7. (a) Temporal evolution of the daily basin averaged evaporation (E) m/yr in red line (left y-axis and precipitation (P) m/yr in blue line (right y-axis) from 1981 to 2020 for the whole Red Sea. (b) Temporal evolution of the daily basin averaged surface net water flux (m/yr) from 1981 to 2020 for the Red Sea.
Jmse 09 01276 g007
Figure 8. Annual surface net water flux (m/yr) time series for the Red Sea is denoted by a continuous black line from 1981 to 2020.
Jmse 09 01276 g008
Table 1. Mean net heat flux (QT = Qb + Qs + Qh + Qe) in W/m2 and air temperature at 2 m elevation (T2m) in (°C) with standard deviation (± 2 σ, W/m2) and trends [(W/m2)/yr) and (°C/decade)] for the North, South, and whole Red Sea from 1981 to 2020.
North Red SeaSouth Red SeaRed Sea
Mean ± 2σTrendMean ± 2σTrendMean ± 2σTrend
Qb−104 ± 5.00−0.03 ± 0.005−76 ± 7.00−0.08 ± 0.007−92 ± 5.00−0.05 ± 0.004
Qs233 ± 5.000.05 ± 0.005230 ± 3.000.12 ± 0.001232 ± 4.000.08 ± 0.007
Qh−20 ± 0.65−0.01 ± 0.001−16 ± 0.35−0.20 ± 0.002−18 ± 0.48−0.10 ± 0.005
Qe−131 ± 3.00−0.13 ± 0.010−111 ± 2.00−0.22± 0.020−123 ±2.00−0.18 ± 0.020
T2m28.6 ± 0.720.19 ± 0.0625.5 ± 0.390.38 ± 0.1127 ± 0.540.30 ± 0.09
QT−22 ± 0.82−0.12 ± 0.05227 ± 0.480.20 ± 0.021−1 ± 0.620.21 ± 0.020
Table 2. Mean net water flux components (evaporation, precipitation and runoff) in m/yr with standard deviation (± 2σ, m/yr) for the NRS, SRS and whole Red Sea from 1981 to 2020.
NRS SRSRed Sea
Evaporation (mean ± 2σ) 1.68 ± 0.331.40 ± 0.221.54 ± 0.26
Precipitation (mean ± 2σ)0.04 ± 0.010.12 ± 0.030.08 ± 0.02
Runoff00.010.001
Surface net water flux (mean ± 2σ)1.64 ± 0.311.27 ± 0.181.46 ± 0.23
Publisher’s Note: MDPI stays neutral with regard to jurisdictional claims in published maps and institutional affiliations.

