Article

The Influence of Sizing of Wave Energy Converters on the Techno-Economic Performance

Department of Maritime & Transport Technology, Delft University of Technology, 2628 CD Delft, The Netherlands
*
Author to whom correspondence should be addressed.
J. Mar. Sci. Eng. 2021, 9(1), 52; https://doi.org/10.3390/jmse9010052
Submission received: 25 November 2020 / Revised: 29 December 2020 / Accepted: 29 December 2020 / Published: 5 January 2021

Abstract

:
Currently, the techno-economic performance of Wave Energy Converters (WECs) is not competitive with other renewable technologies. Size optimization could make a difference. However, the impact of sizing on the techno-economic performance of WECs still remains unclear, especially when sizing of the buoy and Power Take-Off (PTO) are considered collectively. In this paper, an optimization method for the buoy and PTO sizing is proposed for a generic heaving point absorber to reduce the Levelized Cost Of Energy (LCOE). Frequency domain modeling is used to calculate the power absorption of WECs with different buoy and PTO sizes. Force constraints are used to represent the effects of PTO sizing on the absorbed power, in which the passive and reactive control strategy are considered, respectively. A preliminary economic model is established to calculate the cost of WECs. The proposed method is implemented for three realistic sea sites, and the dependence of the optimal size of WECs on wave resources and control strategies is analyzed. The results show that PTO sizing has a limited effect on the buoy size determination, while it can reduce the LCOE by 24% to 31%. Besides, the higher mean wave power density of wave resources does not necessarily correspond to the larger optimal buoy or PTO sizes, but it contributes to the lower LCOE. In addition, the optimal PTO force limit converges at around 0.4 to 0.5 times the maximum required PTO force for the corresponding sea sites. Compared with other methods, this proposed method shows a better potential in sizing and reducing LCOE.

1. Introduction

Wave energy has been highlighted as a renewable energy resource for decades. However, large scale utilization of wave energy is still far from commercialization [1,2]. An important obstacle in the development of Wave Energy Converters (WECs) is that their techno-economic performance is not competitive with offshore wind and other renewable technologies [3]. Another challenge is the wide variety of WEC types [4], which makes it hard to converge the attention and investment. During the last 40 years, over 200 WEC concepts have been proposed [1]. To select the promising WECs, it is necessary to compare and evaluate their viability at different potential sea sites.
The feasibility of WECs has already been evaluated in existing literature. A set of technical and economic indicators of various WEC concepts have been presented [5]. During the operation of WECs, power production relies not only on the wave resources available but also on the operating principles of the particular device [4]. In Reference [5], a benchmarking of 8 types of WECs was established considering 5 different representative sea sites, and a series of cost-related metrics of different WECs was analyzed and compared. In Reference [6], based on a cost estimation model, a techno-economic evaluation for 6 types of WECs was conducted for different devices. The sensitivity of the Levelized Cost Of Energy (LCOE) to wave resources, array configurations, Capital Expenditure (CAPEX), and Operational Expenditure (OPEX) was also discussed.
Apart from the variation of wave resources and types of WECs, the size determination also has a significant impact on the techno-economic evaluation of WECs. Firstly, the power performance of WECs depends strongly on their size [4]. Secondly, given the variation of operating principles, the sensitivity of power performance to the size of WECs also varies considerably [7]. Thirdly, the cost is highly related to the size of WECs [8]. Thus, the size optimization of WECs is expected to make a difference in the evaluation results. However, the optimization is not widely considered in evaluation studies even though the original sizes of WECs are usually designed to suit only some specific sea sites.
Independently or integrated with evaluation studies, size optimization of WECs has been discussed in existing literature. In Reference [9,10], the theoretical ratio of absorbed power to the buoy volume was derived based on linear wave theory. It was concluded that the smaller the volume of the floating WEC is, the higher this ratio is. In Reference [11], a theoretical method for determining the suitable buoy size of WECs for different sea sites was proposed based on Budal diagram. By means of that method, the volume of the buoy could be selected to guarantee the required working time at full capacity of devices for a certain sea site. In Reference [4,7,12], the optimal characteristic lengths of WECs were demonstrated from the perspective of maximizing Capture Width Ratio (CWR), concluding that the optimal characteristic length depends on sea sites. Furthermore, the effect of sizing of WECs on their techno-economic performance has been investigated [8,13], and the results showed that size optimization is able to reduce the LCOE dramatically. However, above-mentioned literature regarding size optimization of WECs concentrated mainly on buoy sizing without considering Power Take-Off (PTO) sizing. Mostly, the PTO size is simply scaled with the same scaling factor used for the buoy.
As a core component, the PTO system is significantly influential to the techno-economic performance of WECs [14]. On the one hand, its cost normally accounts for over 20% of the total CAPEX [15]. On the other hand, the PTO size is highly related to the rated power and the force constraint, which can directly affect the absorbed power. The affecting factors on PTO sizing have been investigated, as well. In Reference [16,17], a series of studies on the influence of the generator rating and control strategies on the power performance was conducted through simulations and experiments. In Reference [14,18], the impact of the control strategies on the PTO sizing of point absorbers was investigated. Although these studies made a profound contribution to presenting the impact of PTO sizing on the absorbed power, buoy sizing was not taken into account collectively. Recently, the influence of PTO sizes has started to be considered in a few of studies regarding buoy geometry optimization. In Reference [19], the geometry optimization of a cylindrical WEC with only a few of different force constraints was performed. The paper indicates that the PTO force constraint has a notable influence on the optimization results, and this finding is highly valuable for the design optimization of WECs. However, there are some limitations in Reference [19]. Firstly, the force constraint is not treated as an optimization variable and only a limited number of force constraints were included. Secondly, the optimization is conducted to maximize the absorbed power for the specific sea states, which is not necessarily beneficial for improving the techno-economic performance at realistic sea sites.
To the authors’ knowledge, there is a lack of studies considering both PTO and buoy sizing of WECs. Thus, the aim of this paper was to investigate the collective influence of PTO sizing and buoy sizing on the LCOE. To achieve this aim, four research questions were addressed. Firstly, what are the optimal buoy sizes and PTO sizes for minimizing the LCOE in different wave resources and control strategies? Secondly, how much reduction in the LCOE can be gained by including PTO sizing? Thirdly, how does PTO sizing interact with buoy sizing from the techno-economic perspective? Fourthly, how much difference on the size determination and the optimized LCOE will there be when using different size optimization methods?
It should be acknowledged that one of the important factors affecting the LCOE is related to the system survivability and safety of WECs. Therefore, the techno-economic performance in practice is strongly related to the recurrence of extreme conditions, such as the roughest sea state for 50 or 100 years in the deployment site. In this way, the total LCOE could be significantly higher than the optimized value based on the current study, which could mitigate the effects of sizing on the techno-economic performance. However, a better understanding on the collective influence of buoy and PTO sizing of WECs can clearly contribute to a more suitable WEC design. In addition, sizing of a single WEC could make a difference in the total number of units selected for a wave farm or array, where the operation and maintenance costs are directly influenced by the number of WECs. For instance, a wave farm with a large number of small individual WECs is expected to result in the increased number of operation and maintenance activities, leading to higher operation and maintenance costs. On the other hand, larger WECs can reduce the number of units in the wave farm, but their requirements for service operation vessels could be higher [8]. Thus, as stated in Reference [20], estimating an accurate value for OPEX is a difficult task since there is not enough available information in practical projects. For the sake of simplicity this study will be limited to the analysis of a single device using general values of OPEX costs derived from existing literature.
In this paper, a size optimization method considering both buoy and PTO sizing is established, and it is applied to a generic heaving point absorber. The optimization is performed based on an exhaustive search algorithm. Firstly, frequency domain modeling is used to calculate the power performance of WECs with different buoy and PTO sizes. The implementation of the PTO sizing using passive and reactive control is demonstrated, respectively. In addition, a preliminary economic model is described to build a cost function with the aim to minimize the LCOE. Next, based on the proposed method, size optimization of WECs is carried out for three realistic sea sites. The interaction between buoy and PTO sizing is analyzed, and the dependence of size determination on wave resources and control strategies is presented. Furthermore, a comparison between this proposed size optimization method and other methods is performed. Finally, conclusions are drawn based on the obtained results.

2. Methodology

This section starts with the description of the heaving spherical WEC concept and chosen sea sites. Next, the equations of motion and frequency domain modeling of WECs are presented. Finally, the size optimization method is established, in which the approaches to perform PTO sizing, buoy sizing, and the cost estimation of WECs are explained in detail.

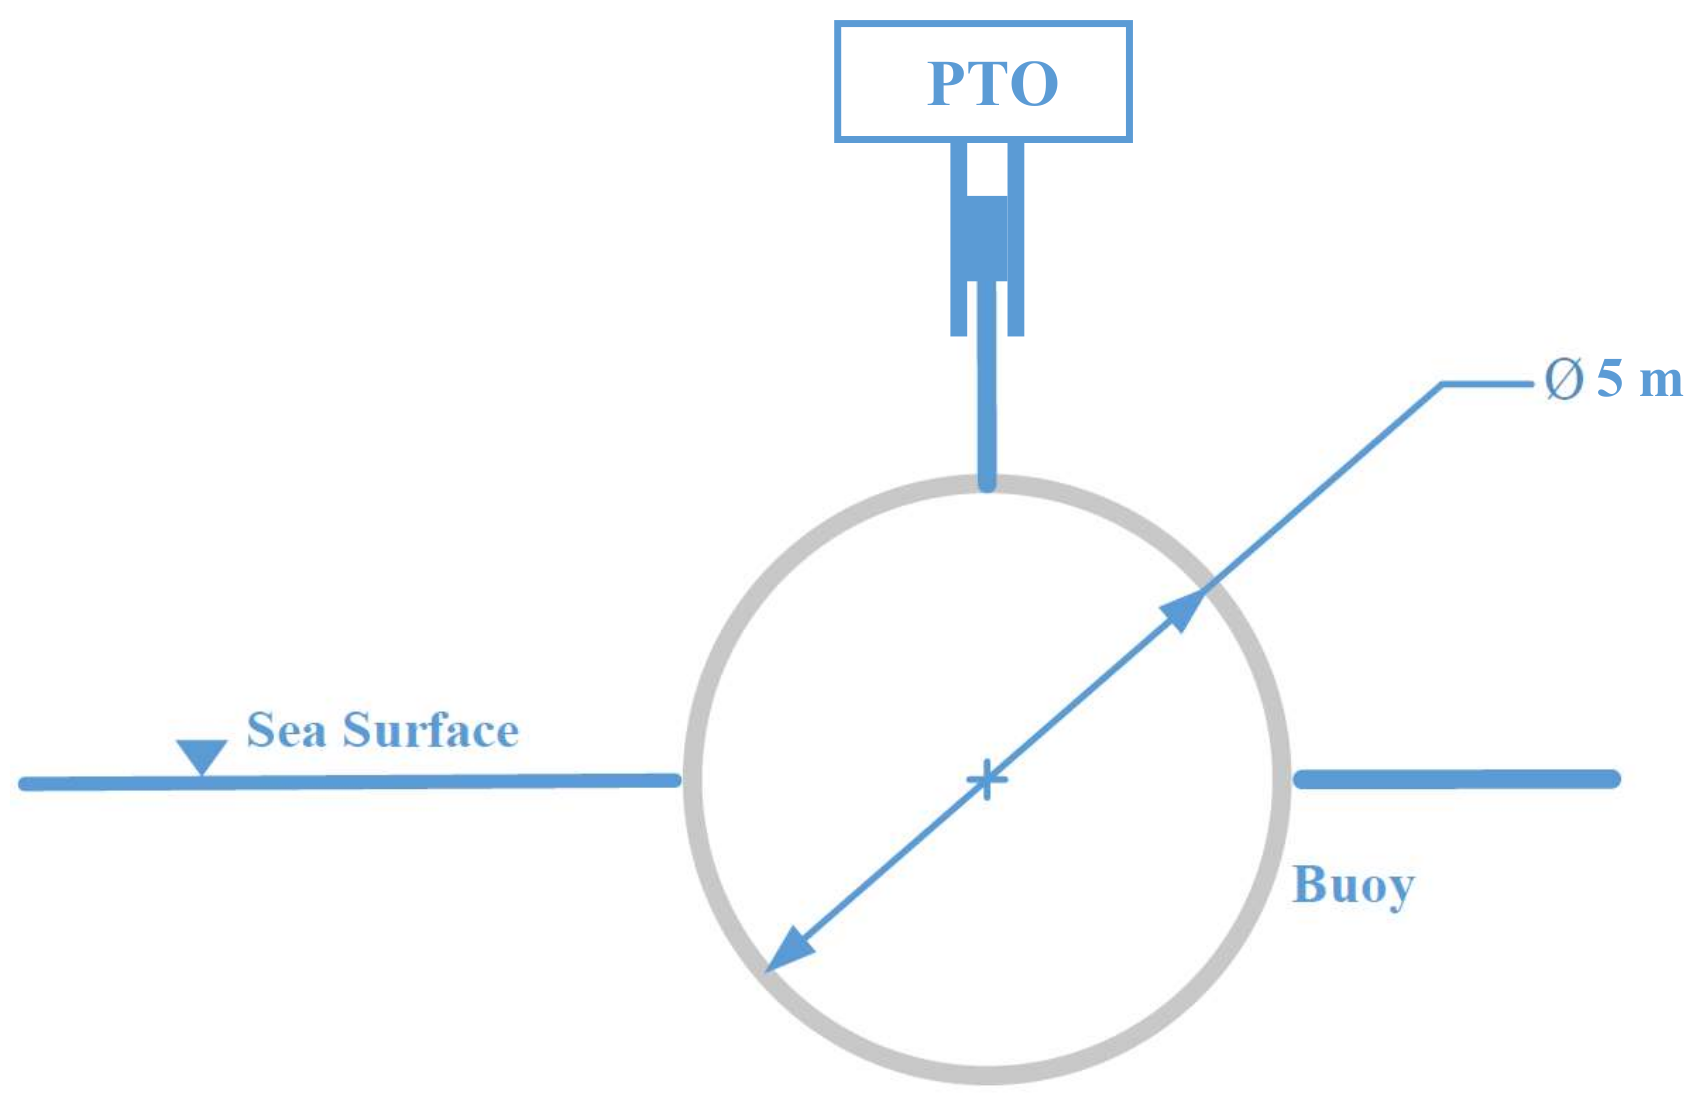
2.1. WEC Concept Description

A generic heaving point absorber [21,22] is used in this study as WEC reference. The diameter of the buoy in the original size is 5 m. The average density of the buoy in all sizes is assumed to be identical and with a value of half of the water density (1025 kg/m 3 ). The schematics of the concept are shown in Figure 1. In practice, the amplitude of the buoy motion has to be limited to protect the mechanical structure, and the displacement limit of this WEC is set as 0.8 times the radius of the buoy. In addition, WECs have to be stopped from operating at severe sea states. Thus, there must be a maximum operational wave height for protection. A similar prototype to the WEC in this work is WaveStar, which is a semi-spherical heaving point absorber [23]. The maximum operational wave height of WaveStar is 6 m and the diameter of WaveStar is 5 m. Therefore, the maximum operational wave height for the original WEC in this case is estimated as H s = 5 m, in a conservative way.
Three realistic sea sites are selected to investigate the techno-economic performance of WECs. They are Yeu Island, in the oceanic territory of France, Biscay Marine Energy Park (BIMEP) in Spain, and DK North Sea Point 2 (DK2) in Denmark. The scatter diagrams of these sea sites are taken from Reference [8], which are shown in Table 1, Table 2 and Table 3. In these scatter diagrams, H s and T z represent the significant wave height and the mean zero-crossing wave period, respectively, and the time of the corresponding occurrence are depicted in each cell as the number of occurrence hours in a year for that particular sea state. It should be pointed out that Yeu, BIMEP, and DK2 are geographically far from each other and their most frequent wave heights and periods differ significantly. Hence, these three sea sites are chosen to be the representatives of European wave characteristics.

2.2. Frequency Domain Modeling

In this subsection, the frequency domain model of WECs is presented based on linear wave theory. As the device in this paper is assumed to oscillate only in heave motion, the frequency domain modeling of the WEC is only discussed for the heaving degree of freedom. According to Newton’s law, the motion of the WEC as a rigid body can be described through Equation (1).
m a ( t ) = F h s ( t ) + F e ( t ) + F p t o ( t ) + F r ( t ) ,
where textitm is the mass of the oscillating body, F h s is the hydrostatic force, F e is the wave excitation force, F r is the wave radiation force, F p t o is the PTO force, and a ( t ) is the acceleration. If the body is assumed to perform harmonic motion and a linear PTO model is used to simulate the behavior of the PTO system, (1) could be rewritten in the form of complex amplitudes [10], as
F ^ e ( ω ) = [ R i ( ω ) + R p t o ] u ^ + i ω u ^ [ m + M r ( ω ) ] + i u ^ [ K p t o ω S w l ω ] ,
where R i ( ω ) is the hydrodynamic damping coefficient, R p t o is the PTO damping coefficient, ω is the wave frequency, m and M r ( ω ) are the mass and the added mass of the WEC, u ^ is complex amplitude of the vertical velocity, K p t o is the PTO stiffness coefficient, and S w l is the hydrostatic stiffness. The intrinsic impedance of the heaving buoy and PTO impedance can be introduced as
Z i ( ω ) = R i ( ω ) + i X i ( ω ) ,
X i ( ω ) = ω [ m + M r ( ω ) ] S w l ω ,
where Z i ( ω ) is the intrinsic impedance of the heaving buoy, and X i ( ω ) is the intrinsic reactance. Similarly, the impedance of PTO can be given as:
Z p t o ( ω ) = R p t o ( ω ) + i X p t o ( ω ) ,
X p t o ( ω ) = K p t o ω ,
where Z p t o ( ω ) is the PTO impendence, and X p t o ( ω ) is the PTO reactance. So, (2) is rewritten as
F ^ e ( ω ) = [ Z i ( ω ) + Z p t o ( ω ) ] u ^ .
The hydrodynamic characteristics of WECs, including M r ( ω ) , R i ( ω ) , and F e ( ω ) , are calculated using the Boundary Element Method through the open source software Nemoh [24]. Then, by solving (7), the complex amplitude of velocity u ^ could be obtained as
u ^ = F ^ e Z i + Z p t o .
Then, the complex amplitude of the motion displacement is expressed as
z ^ = F ^ e i ω ( Z i + Z p t o ) .
For regular wave conditions, the time averaged absorbed power can be obtained and expressed as
P a v e _ r e = 1 2 R p t o u ^ 2 .
The above analysis is based on the assumption of harmonic motion, but incoming waves in real sea states are always irregular. In this work, the calculation of power absorption in irregular waves is conducted based on the superposition of regular waves [25]. So, the power absorption in each sea state is calculated by integrating over frequency the product of the spectrum density with the power absorption in regular waves which can be expressed as
P a v e _ i r r = 0 R p t o ( | z ^ | ζ a , ω ) 2 S ζ a ( ω ) d ω ,
where ζ a is the wave amplitude of the regular wave components, and S ζ a ( ω ) is the spectral density of the defined unidirectional wave spectrum. In this work, JONSWAP spectrum, together with the peakedness factor of 3.3, is used to represent the irregular waves for the North Sea [26].
It must be acknowledged that frequency domain modeling has limited applicability. Firstly, it is restricted to the linear theory. The accuracy of this approach around the resonance of WECs is limited where the motion amplitude is too high and the linear assumption is violated [27]. However, the displacement limit is considered in this paper, which could ease this problem [11]. Secondly, frequency domain modeling does not allow the implementation of real-time control strategies by which PTO parameters can be adjusted instantaneously with the PTO force saturation and buoy displacement constraints [19,28]. Although there are limitations in frequency domain modeling, it is considered reasonable given the purpose of this paper to get insight into the influence of sizing on the techno-economic performance. Frequency domain models are more computationally efficient compared to time domain approaches, which makes it highly suitable in the optimization studies that requires a large number of iterations. In addition, the energy production of WECs in different buoy and PTO sizes is calculated based on the same frequency domain model, which is fair for the size determination and techno-economic analysis.

2.3. Size Optimization Method

A proposed size optimization method for improving the techno-economic performance of WECs is presented in the following part, and the methods to conduct PTO sizing and buoy sizing are explained, respectively. An economic model is established to calculate the corresponding costs. The flowchart of this size optimization method is shown in the Figure 2. The cost function for the size optimization adopted in this paper is LCOE, which is introduced in more detail in Section 2.3.3. An exhaustive search algorithm is used in the optimization. The buoy scale factor λ and a normalized factor for PTO sizing, namely PTO sizing ratio, are treated as the optimization variables. Before defining the PTO sizing ratio, it is necessary to introduce the unconstrained PTO force and the maximum required PTO force. The unconstrained PTO force is defined based on the sea state, and it represents the PTO forces required to maximize the power absorption without any force constraint for the particular sea state. The maximum required PTO force is defined based on the sea site and is the largest value of unconstrained PTO forces for all operational sea states in a particular sea site. This largest value occurs at the operational sea state with largest wave power density. Then, the PTO sizing ratio is equal to the PTO force limit divided by the maximum required PTO force at the corresponding sea site, and the PTO force limit is the force constraint for the PTO system with the particular size. The maximum required PTO force varies with the wave resource, the buoy size, and the control strategy. So, in each case, the maximum required PTO force is recalculated for each sea site and buoy scale factor λ . The initial bounds of the buoy scale factor λ and PTO sizing ratio are set as 0.3,2.0 and 0.1,1.0, respectively. If the the optimal solution is not found within these ranges during iterations, the bounds would be automatically extended until a solution is obtained. A discrete iteration step of 0.1 is used in the exhaustive searching algorithm for both buoy scale factors λ and PTO sizing ratios. The proposed size optimization method is also compatible with other optimization algorithms, which may provide more precise solutions or save computational costs. However, it is beyond the scope of this paper to discuss the relative impacts of optimization algorithms in detail.

2.3.1. PTO Sizing

Here, the PTO sizing implies the implementation of determining the optimal PTO size for different sea sites. The PTO size is directly related to the rated power, PTO force limits, displacement limits, and PTO peak power constraints of WECs [29]. In this work, the PTO force limit is used to represent the PTO size. According to (5) and (8), the PTO force amplitude can be expressed as
F ^ p t o   =   u ^ Z p t o   = Z p t o Z i + Z p t o F ^ e   =   F ^ e R p t o 2 + X p t o 2 ( R p t o + R i ) 2 + ( X i + X p t o ) 2 .
As is shown in (12), the PTO force amplitude is a function of R p t o and X p t o . Therefore, one approach to restrict the PTO force amplitude is to adjust PTO parameters. Reactive control and passive control are typical control strategies in WECs. In the reactive control, both the PTO reactance and the PTO damping coefficient could be varied to tune the device. However, in the passive control, only the PTO resistance load (damping force) is provided. Next, the methods to determine the PTO parameters for limiting the PTO force amplitude in the passive control strategy and the reactive control strategy are explained, respectively.
  • The determination of PTO parameters in passive control:
    Here, the PTO force amplitude is constrained by means of adjusting the PTO parameters. Besides, the PTO parameters are also expected to be determined to limit the stroke and maximize the absorbed power.
    First, let us discuss the PTO force constraints. In the passive control strategy, only PTO damping can be varied and the PTO reactance equals zero. Therefore, the PTO force amplitude expressed in (12) can be simplified as
    F ^ p t o   =   F ^ e R p t o ( R p t o + R i ) 2 + X i 2 .
    To reveal the relationship between | F ^ p t o | and R p t o , the derivation of (13) with respect to R p t o is calculated and gives
    d ( | F ^ p t o | ) d R p t o =   F ^ e R p t o R i + X i 2 + R p t o 2 ( R p t o + R i ) 2 + X i 2 3 2 .
    It can be deduced that (14) is always positive as R p t o and R i are greater than 0, which also implies that F ^ p t o is a monotonic function of R p t o . In other words, limiting the PTO damping can directly constrain the PTO force amplitude. During size optimization, the PTO sizing ratio and buoy scale factor λ are used as optimization variables. However, to determine PTO parameters with the force limit, the PTO force limit should be derived to be explicit. According to the definition of the PTO sizing ratio, the PTO force limit can be calculated by multiplying the given PTO sizing ratio with the maximum required PTO force for the particular buoy scale factor and considered sea site. Therefore, the PTO force limit is directly related to each set of optimization variables. Here, the PTO force limit is represented by F p t o _ l i m i t , and the maximum allowed PTO damping R p t o _ f o r c e can be obtained by solving (15), in which only the positive solution should be retained.
    F ^ e R p t o _ f o r c e ( R p t o _ f o r c e + R i ) 2 + X i 2 = F p t o _ l i m i t .
    Therefore, for constraining the PTO force amplitude, R p t o should satisfy
    R p t o R p t o _ f o r c e .
    Secondly, except PTO force constraints, the displacement limit should be considered during the selection of PTO parameters. It can be deduced from (8) that the u ^ decreases with R p t o increasing. If the stroke constraint of the buoy, S m , comes to play, the PTO resistance should be increased to limit the velocity amplitude, which is shown as
    u ^ = F ^ e R p t o + Z i u m .
    In this way, for constraining the stroke amplitude, R p t o should satisfy
    R p t o ( F ^ e u m ) 2 X i 2 ) R i = R p t o _ s t r o k e ,
    where u m is the velocity limit, which is equal to ω S m . Therefore, it can be seen from (16) and (18) that the upper bound and the lower bound of the available PTO damping are decided by the PTO force limit and the stoke limit, respectively, which could also be expressed as
    R p t o _ s t r o k e R p t o R p t o _ f o r c e .
    Thus, the PTO damping should be selected from the range expressed in (19) to satisfy the constraints.
    According to Reference [28], the optimal PTO damping for maximizing the absorbed power without any constraint is expressed as
    R p t o _ o p t = | Z i | = R i 2 + X i 2 .
    To maximize the absorbed power of WECs, R p t o should be as close to R p t o _ o p t as possible. So, the principle of PTO damping selection in PTO sizing can be presented as:
    If R p t o _ s t r o k e R p t o _ o p t R p t o _ f o r c e , the optimal R p t o should be selected as R p t o _ o p t .
    If R p t o _ o p t < R p t o _ s t r o k e or R p t o _ o p t > R p t o _ f o r c e , the optimal R p t o should be selected as the one of R p t o _ s t r o k e and R p t o _ f o r c e which is closer to R p t o _ o p t .
    In case R p t o _ f o r c e < R p t o _ s t r o k e , there is no feasible PTO damping coefficient satisfying both of the constraints. This case would happen when the PTO force limit is very low or the wave power is very high, which realistically means the device has to be stopped from operation for protecting itself from frequently violating the physical constraints.
  • The determination of PTO parameters in reactive control:
    Unlike PTO sizing in passive control, both R p t o and X p t o can be varied to meet the requirement of motion and PTO force constraints. Given the complexity of the multivariable optimization with nonlinear constraints, a numerical optimization tool is used to select the optimal combination of R p t o and X p t o , and it can be expressed in the form as
    m a x i m i z e f = P a b s o r b e d ( R p t o , X p t o ) s u b j e c t t o | F ^ p t o ( R p t o , X p t o ) | F p t o _ l i m i t | u ^ ( R p t o , X p t o ) | u m R p t o 0 X p t o R .
    The optimization is performed based on the “interior point” algorithm in MATLAB environment, and the tolerance of the function is set as 1e-4. To avoid the local optimal solution, the ‘MultiStart’ solver is adopted. In this solver, iterations start with multiple random points, in which the global optimal solution is expected to be found [30]. In this work, the number of multiple starting points is set as 20, and the bounds of the PTO damping and PTO reactance are set as [0,10 R i ( ω ) ] and [−10 X i ( ω ) , 10 X i ( ω ) ] for each sea state. In case that no feasible solution is found in the optimization, the PTO absorbed power would be treated as 0.
Based on the above method, PTO parameters for different PTO force constraints can be obtained for each wave condition. Then, the corresponding power performance of WECs can be calculated. Hence, this method takes into account the effects of PTO sizing on the power performance of WECs. However, it has to be clarified that the above PTO sizing method is established based on regular wave conditions. To constrain the buoy displacement and PTO force in irregular wave conditions, it is necessary to calculate their instantaneous solutions, in which time domain modeling is required. However, the inefficiency of time domain simulation would make the iteration process much more time consuming, which is not preferable for the optimization problem. To simplify this problem, in this paper PTO parameters are selected only to suit the typical characteristics of irregular wave conditions, referring to Reference [18]. According to Reference [10], the time-averaged power transport per unit length of wave front of incoming waves at regular wave conditions and irregular wave conditions can be calculated as
P w a v e _ r e = 1 32 π ρ g 2 H 2 T ,
P w a v e _ i r r = 1 64 π ρ g 2 H s 2 T e .
By equaling (22) to (23) at the case of the same energy period, namely T equaling T e , the corresponding wave height in regular wave condition is solved as H s / 2 . To transfer the T z in scatter diagrams to T e , the wave period ratio between T e and T z is selected as 1.18 given the JONSWAP spectrum and the peakedness factor of 3.3 [31]. Then, PTO parameters for irregular wave conditions can be selected to suit regular wave conditions whose period and height correspond to T e and H s / 2 , respectively [18]. The purpose of the transfer between irregular wave conditions and regular wave conditions is to simplify the determination of PTO parameters for PTO sizing. However, the selected PTO parameters based on regular wave condition cannot strictly guarantee that the PTO force and stroke constraints would not be violated at the corresponding irregular wave conditions. Considering the purpose of this paper to investigate the impacts of sizing on the techno-economic performance, it is considered to be acceptable. In this paper, all the power absorption of WECs are calculated based on irregular wave conditions, and the PTO parameters are optimized for each sea state. As an example, the optimized PTO parameters of WEC in the original buoy size for different sea states are shown in Figure 3 and Figure 4.
Therefore, as the PTO parameters are determined, the absorbed power of WECs at each sea state can be obtained and the AEP (Annual Energy Production) at the specific sea site is calculated as
A E P = A · η · x = 1 x = n P a b s o r b e d ( x ) · T ( x ) ,
where η is the overall conversion efficiency from the annual absorbed energy to the AEP and is assumed 70% [32]; A is the availability of WECs to work, and it is set as 90% due to the necessary operation and maintenance [23]; T represents the total hours of the appearance of a certain sea state, which is presented in the scatter diagram in Table 1, Table 2 and Table 3; x represents the sea state in scatter diagrams.

2.3.2. Buoy Sizing

During the iterations of the size optimization, the buoy size of WECs are scaled following geometrical similarity. Therefore, the hydrodynamic coefficients of buoys in different sizes can be obtained by means of Froude scaling law [33],
λ = L s L o = H s H o ω s = ω o λ 0.5 F e _ s = F e _ o λ 3 B r _ s = B r _ o λ 2.5 M r _ s = M r _ o λ 3 ,
where λ is the buoy scale factor; L is the geometrical length of the buoy; ω is the wave frequency; F e , B r , and M r are the excitation force, the radiation damping, and the added mass coefficients, respectively; and the subscript s and o represent the “scaled device” and the “original device”, respectively. Hence, this allows the hydrodynamic coefficients of the original buoy to be transferred to the scaled buoy instead of using BEM method to calculate the hydrodynamic coefficients in each iteration. In this way, the computing efficiency can be significantly improved. The density of the buoy structure in different sizes are assumed to be same. The maximum operation wave height and the displacement limit of WECs are scaled with the buoy scale factor λ .

2.3.3. Economic Modeling for Cost Estimation

LCOE is an important techno-economic metric of WECs. For evaluating the LCOE, it is essential to establish an economic model to estimate the CAPEX and OPEX of WECs.
Following Reference [34], the steel price is selected as 1.6 GBP (British Pounds)/kg and the structure cost is calculated by assuming that all the structure cost comes from the steel cost. Based on the inflation calculator tool [35], the cumulative inflation rate of GBP from 2017 to 2020 is 5.89% and the exchange rate of Euros to GBP is set as 0.87. Referring to Reference [34], the statistical percentages of CAPEX-related components in total LCOE can be found. The percentage values are recalculated as the average percentage in total CAPEX, shown in Table 4. According to Table 4, the cost of “Foundation and Mooring” and “Installation” accounts for 19.1% and 10.2% averagely of CAPEX, respectively. Comparatively, the cost of the structure accounts for 38.2% of CAPEX in average. Therefore, mass-related capital cost can be calculated as
C M a s s = C S + C F + C I = ( P F & M P S + P I P S + 1 ) C S ,
where C M a s s represents the Mass-related-capital-cost; C S , C F , and C I are the cost of the structure, foundation, and the installation, respectively, and P s , P F & M , and P I are their corresponding percentages in the total LCOE. It can be seen from Table 4 that the cost of “Connection” and “PTO” averagely accounts for 8.3% and 24.2% of CAPEX, respectively. Similarly, power-related capital cost can be calculated as
C P o w e r = C P + C C = ( P C P P + 1 ) C P T O ,
where C P o w e r represents the power-related capital cost; C P and C C are the cost of the PTO and the connection, respectively; and P P and P C are their corresponding percentages in the total LCOE. Therefore, the CAPEX is calculated as
C A P E X = C M a s s + C P o w e r .
In this paper, PTO is assumed to be a direct drive generator and all PTO costs come from the generator. The generator cost is divided into the cost of active material and the cost of manufacturing. The amount of active material required is approximately related to the PTO force limit and the force density of generators. Referring to Reference [36], the maximum force density in this work is assumed as 44 kN/m 2 , which generally ranges from 30 to 60 kN/m 2 depending on the design. The cost of active material of this generator in series production is estimated as 12,000 Euros/m 2 based on the currency value in 2006. The cumulative inflation rate from 2006 to 2020 is 22.1% [35]. Taking the inflation into account, the active material of this generator in this paper is estimated as 14,655.31 Euros/m 2 . Regarding the manufacturing cost, it is approximately assumed as half of the total cost of the generator [37]. So, the cost of PTO can be expressed as
C P T O = C o s t M a t e r i a l + C o s t M a n u f a c t u r i n g .
In this paper, the annual OPEX is assumed as 8% of the CAPEX, and the discount rate r is assumed as 8% with the lifespan of 20 years, referring to Reference [8]. Then, the LCOE of WECs is calculated as
L C O E = C A P E X + t = 1 n O P E X t ( 1 + r ) t t = 1 n A E P t ( 1 + r ) t ,
where n represents the total years of the lifespan, and t represents the evaluated year.
It has to be clarified that it is a preliminary economic model, and the parameters in the model differ from one to another project in practice. For instance, reactive control is associated with negative power flow, which could lead to larger losses and related wear. Therefore, control strategies in practice is able to affect the OPEX and conversion efficiency. However, the specific effects are related to the PTO design and maintenance strategy, which is outside the scope of this paper. Given the purpose of this paper to identify the influence of sizing on the techno-economic performance, the assumption on the constant OPEX percentage and conversion efficiency for both control strategies is considered reasonable. Furthermore, survivability of WECs in practice is complex and related to many affecting factors. For instance, the increase of the buoy size results in the larger exerted force and input power flow, which could make the WEC more vulnerable. However, it is also dependent on the mooring design, material and even control strategies of WECs. For simplicity, the lifespan for WECs in all sizes is assumed to be constant. Nevertheless, our aim based on the economic analysis is not to give a final judgement of the optimal size of the WEC but to use the LCOE as an indication for providing an insight about the effects of sizing on the techno-economic performance. Overall, the proposed size optimization method has pure theoretical characteristics, and a more complex size optimization study is required in practical applications.

3. Results and Discussion

This section starts with the discussion about the effects of buoy sizing and PTO sizing on the performance of the WEC. Next, the size optimization results for the sea sites are presented. The interaction between PTO sizing and buoy sizing and the benefits of downsizing PTO size for decreasing LCOE are analyzed. Finally, a comparison between this proposed method and other existing methods for size optimization is performed.

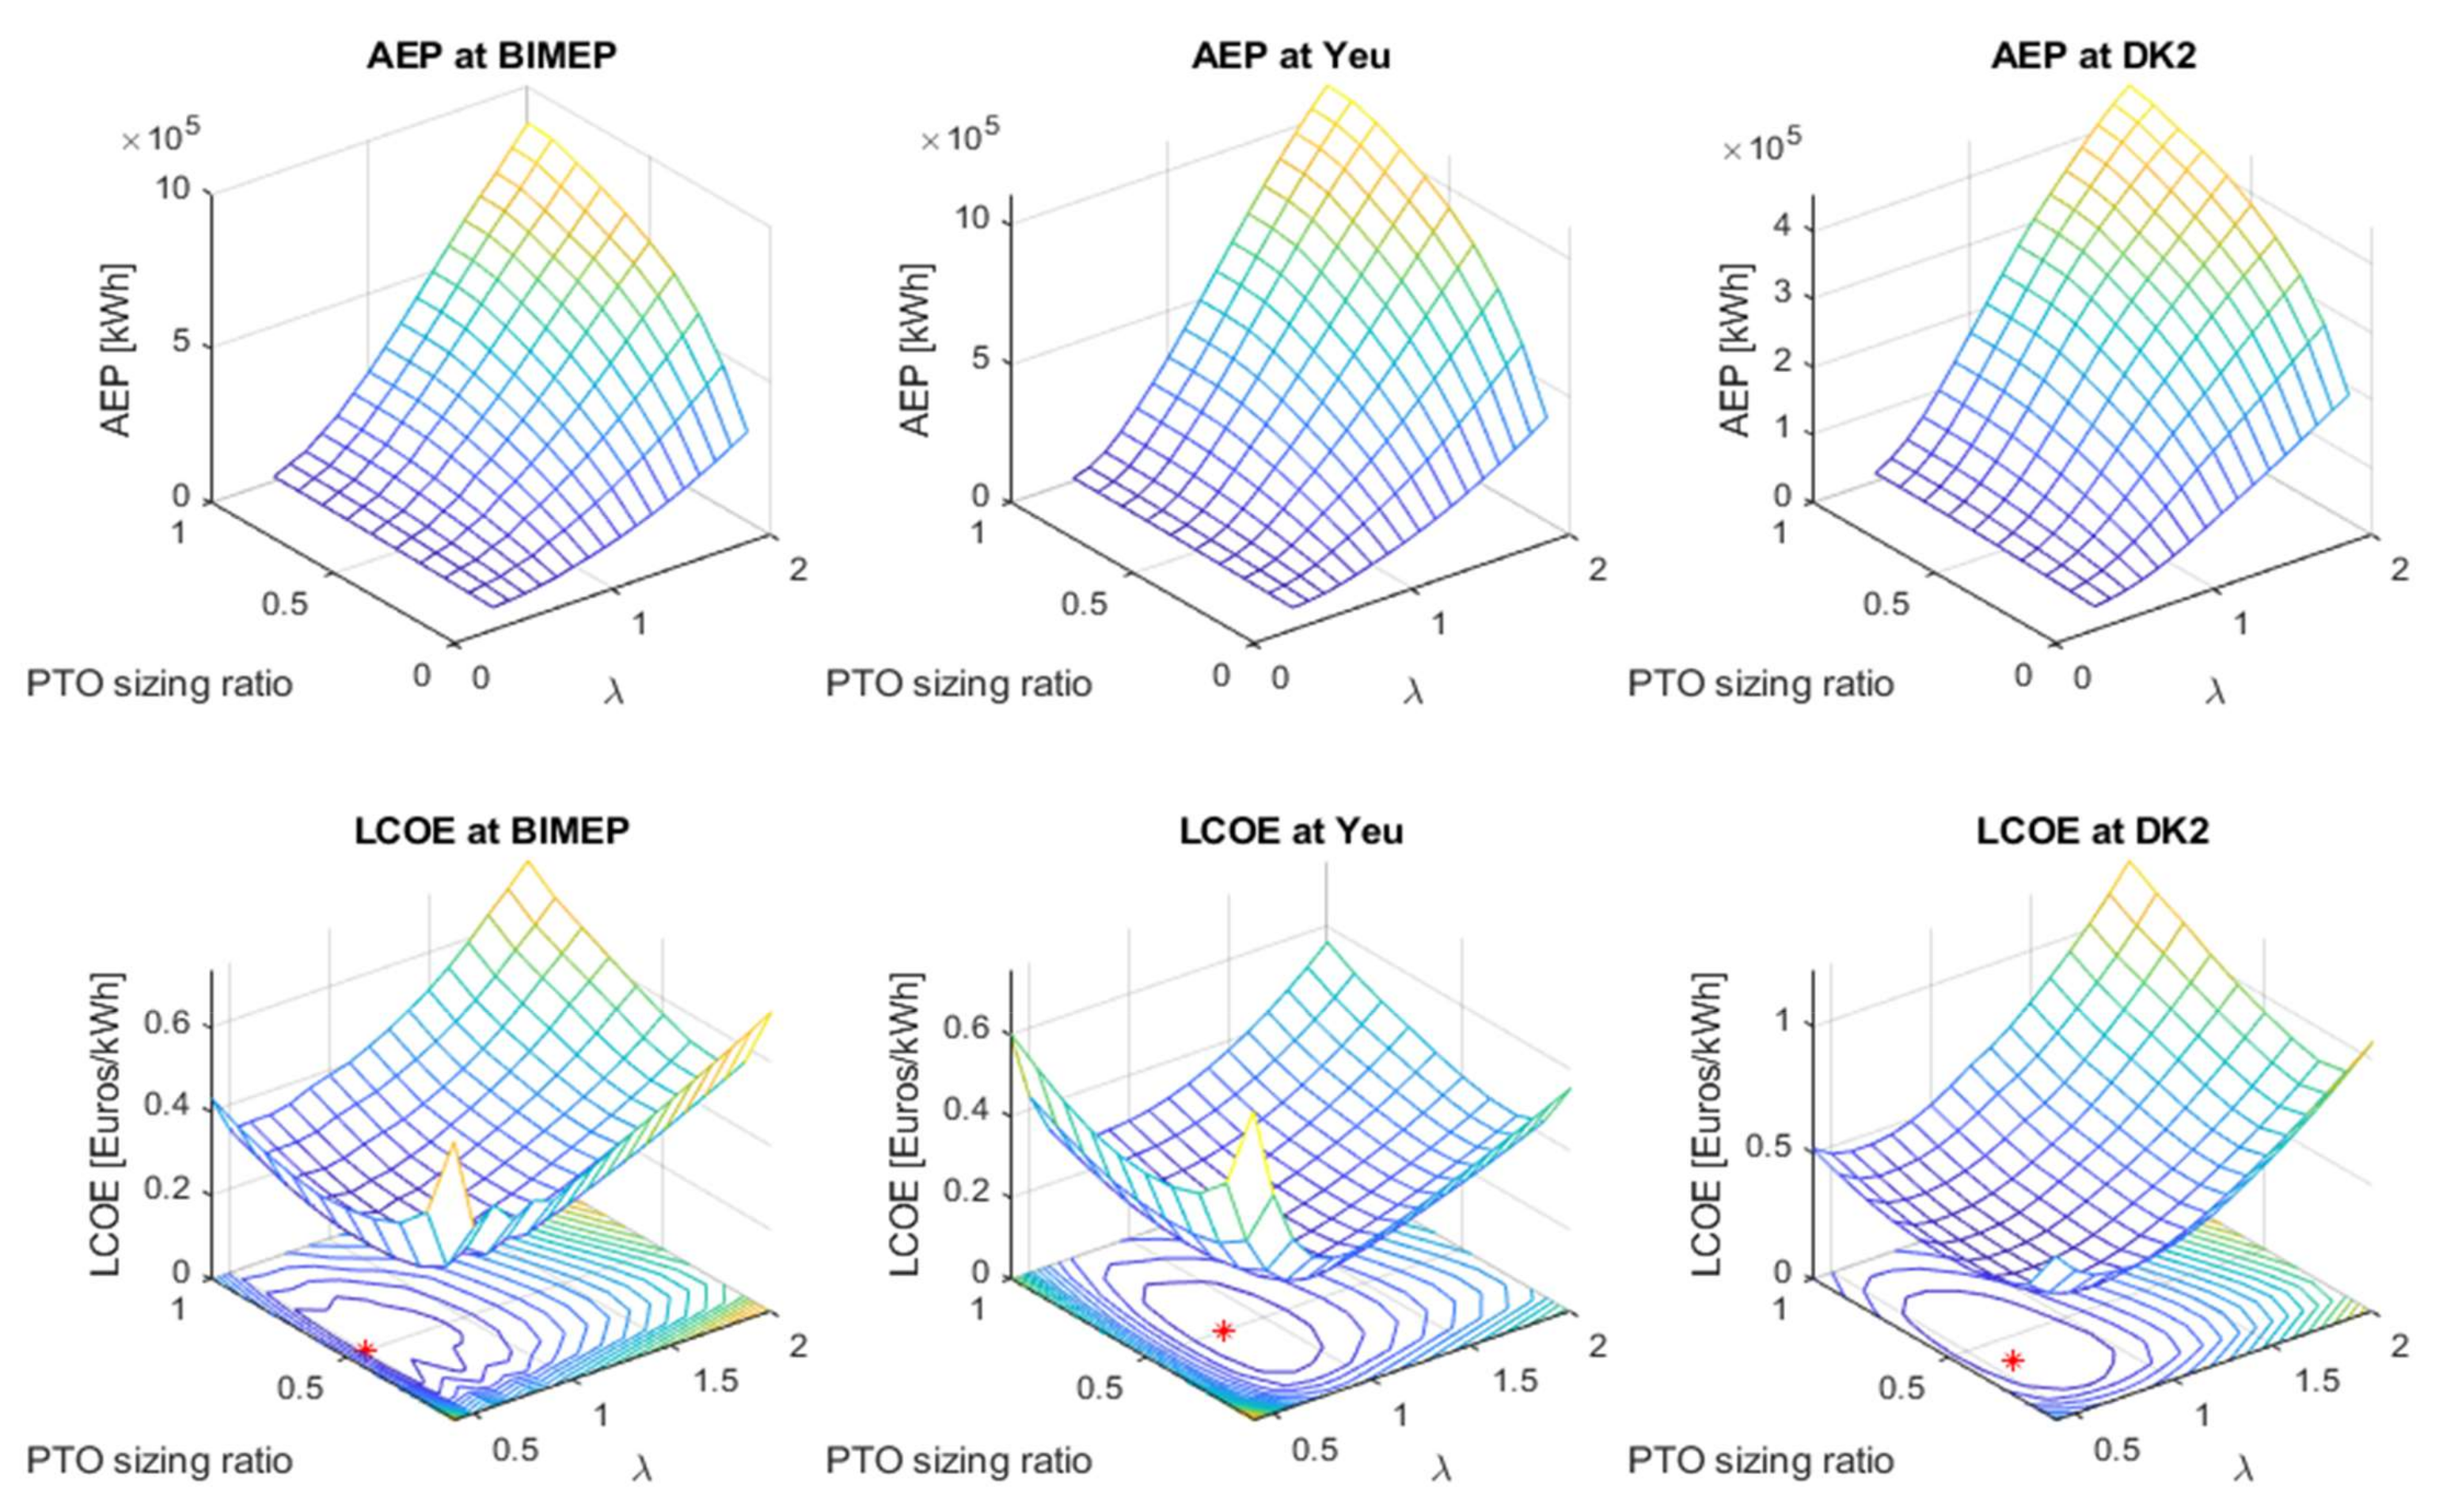
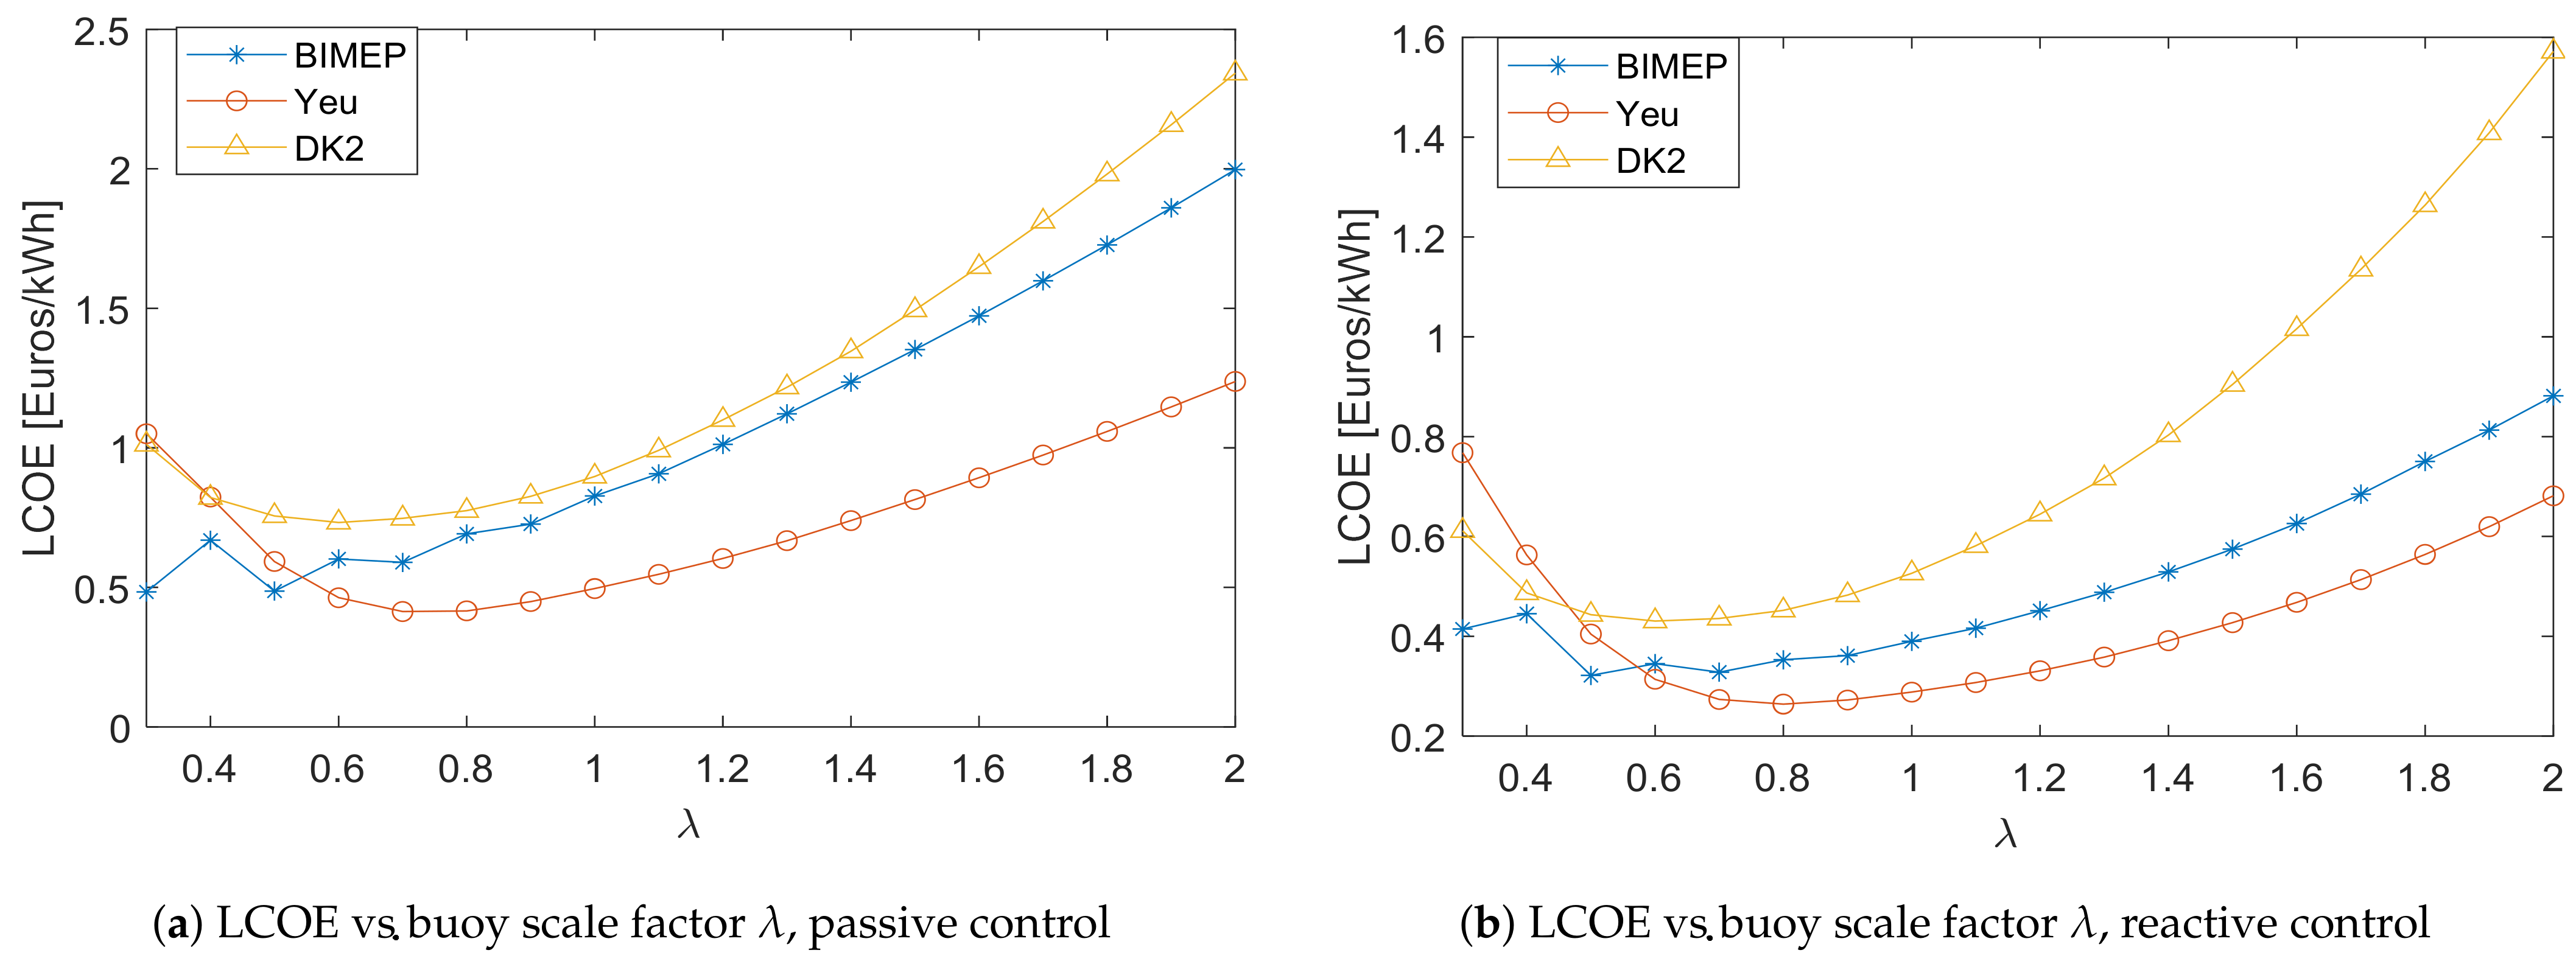
3.1. The Effects of Sizing on the Performance of the Wec

Taking one single sea state ( H s = 1.5 m, T z = 5 s) as an example, the effects of PTO sizing and buoy sizing on the performance of the WEC are investigated. In Figure 5 and Figure 6, the effects on the absorbed power, economic performance and PTO parameters of the WEC with passive control and reactive control are presented, respectively. The horizontal axis in Figure 5 and Figure 6 is expressed as “PTO force limit/unconstrained PTO force”. Here, the unconstrained PTO force corresponds to the PTO force required to maximize the power absorption for the considered sea state ( H s = 1.5 m, T z = 5 s). The PTO parameters corresponding to each PTO size and buoy size were calculated following the method described in Section 2.3.1. From Figure 5 and Figure 6, it is noted that both the power performance and the economic performance are highly related to the sizing of the WEC. In Figure 5a and Figure 6a, it can be seen that the absorbed power of the WEC increases with the PTO size and the buoy size. In Figure 5b and Figure 6b, the proportion of the power-related capital cost to the total CAPEX increases with the PTO size, but it decreases with the rise of the buoy scale factor λ . Therefore, at a certain PTO sizing ratio, the CAPEX would be more dominated by the mass-related capital cost than power-related capital cost with the increase of the buoy scale factor λ . Comparing Figure 5 and Figure 6, it can be found that the effects of sizing on the WEC are also related to the control strategy. Firstly, the absorbed power of the WEC with reactive control is significantly higher than that in passive control. Secondly, the proportion of power-related capital cost to the total CAPEX in the WEC with reactive control is much higher than that with passive control. This phenomenon can be explained by that the reactive control strategy is associated with higher PTO force limits than the passive control strategy. The higher PTO force then leads to the increase of the proportion. Thirdly, the trends of PTO parameters changing with the force limit depend on the control strategy. In Figure 5c, the PTO damping coefficient increases with the ratio “PTO force limit/unconstrained PTO force” when the passive control strategy is used. This is logical as the PTO force monotonically increases with the PTO damping, which has been explained in (14). Comparatively, it can be seen from Figure 6c,d, with the increase of “PTO force limit/unconstrained PTO force”, the PTO damping coefficient tends to decrease, while the PTO reactance increases. The reason is that the PTO in reactive control would act more like a pure damper to reduce its required force, when the force constraint becomes tighter.

3.2. Size Optimization for Typical Realistic Sea Sites

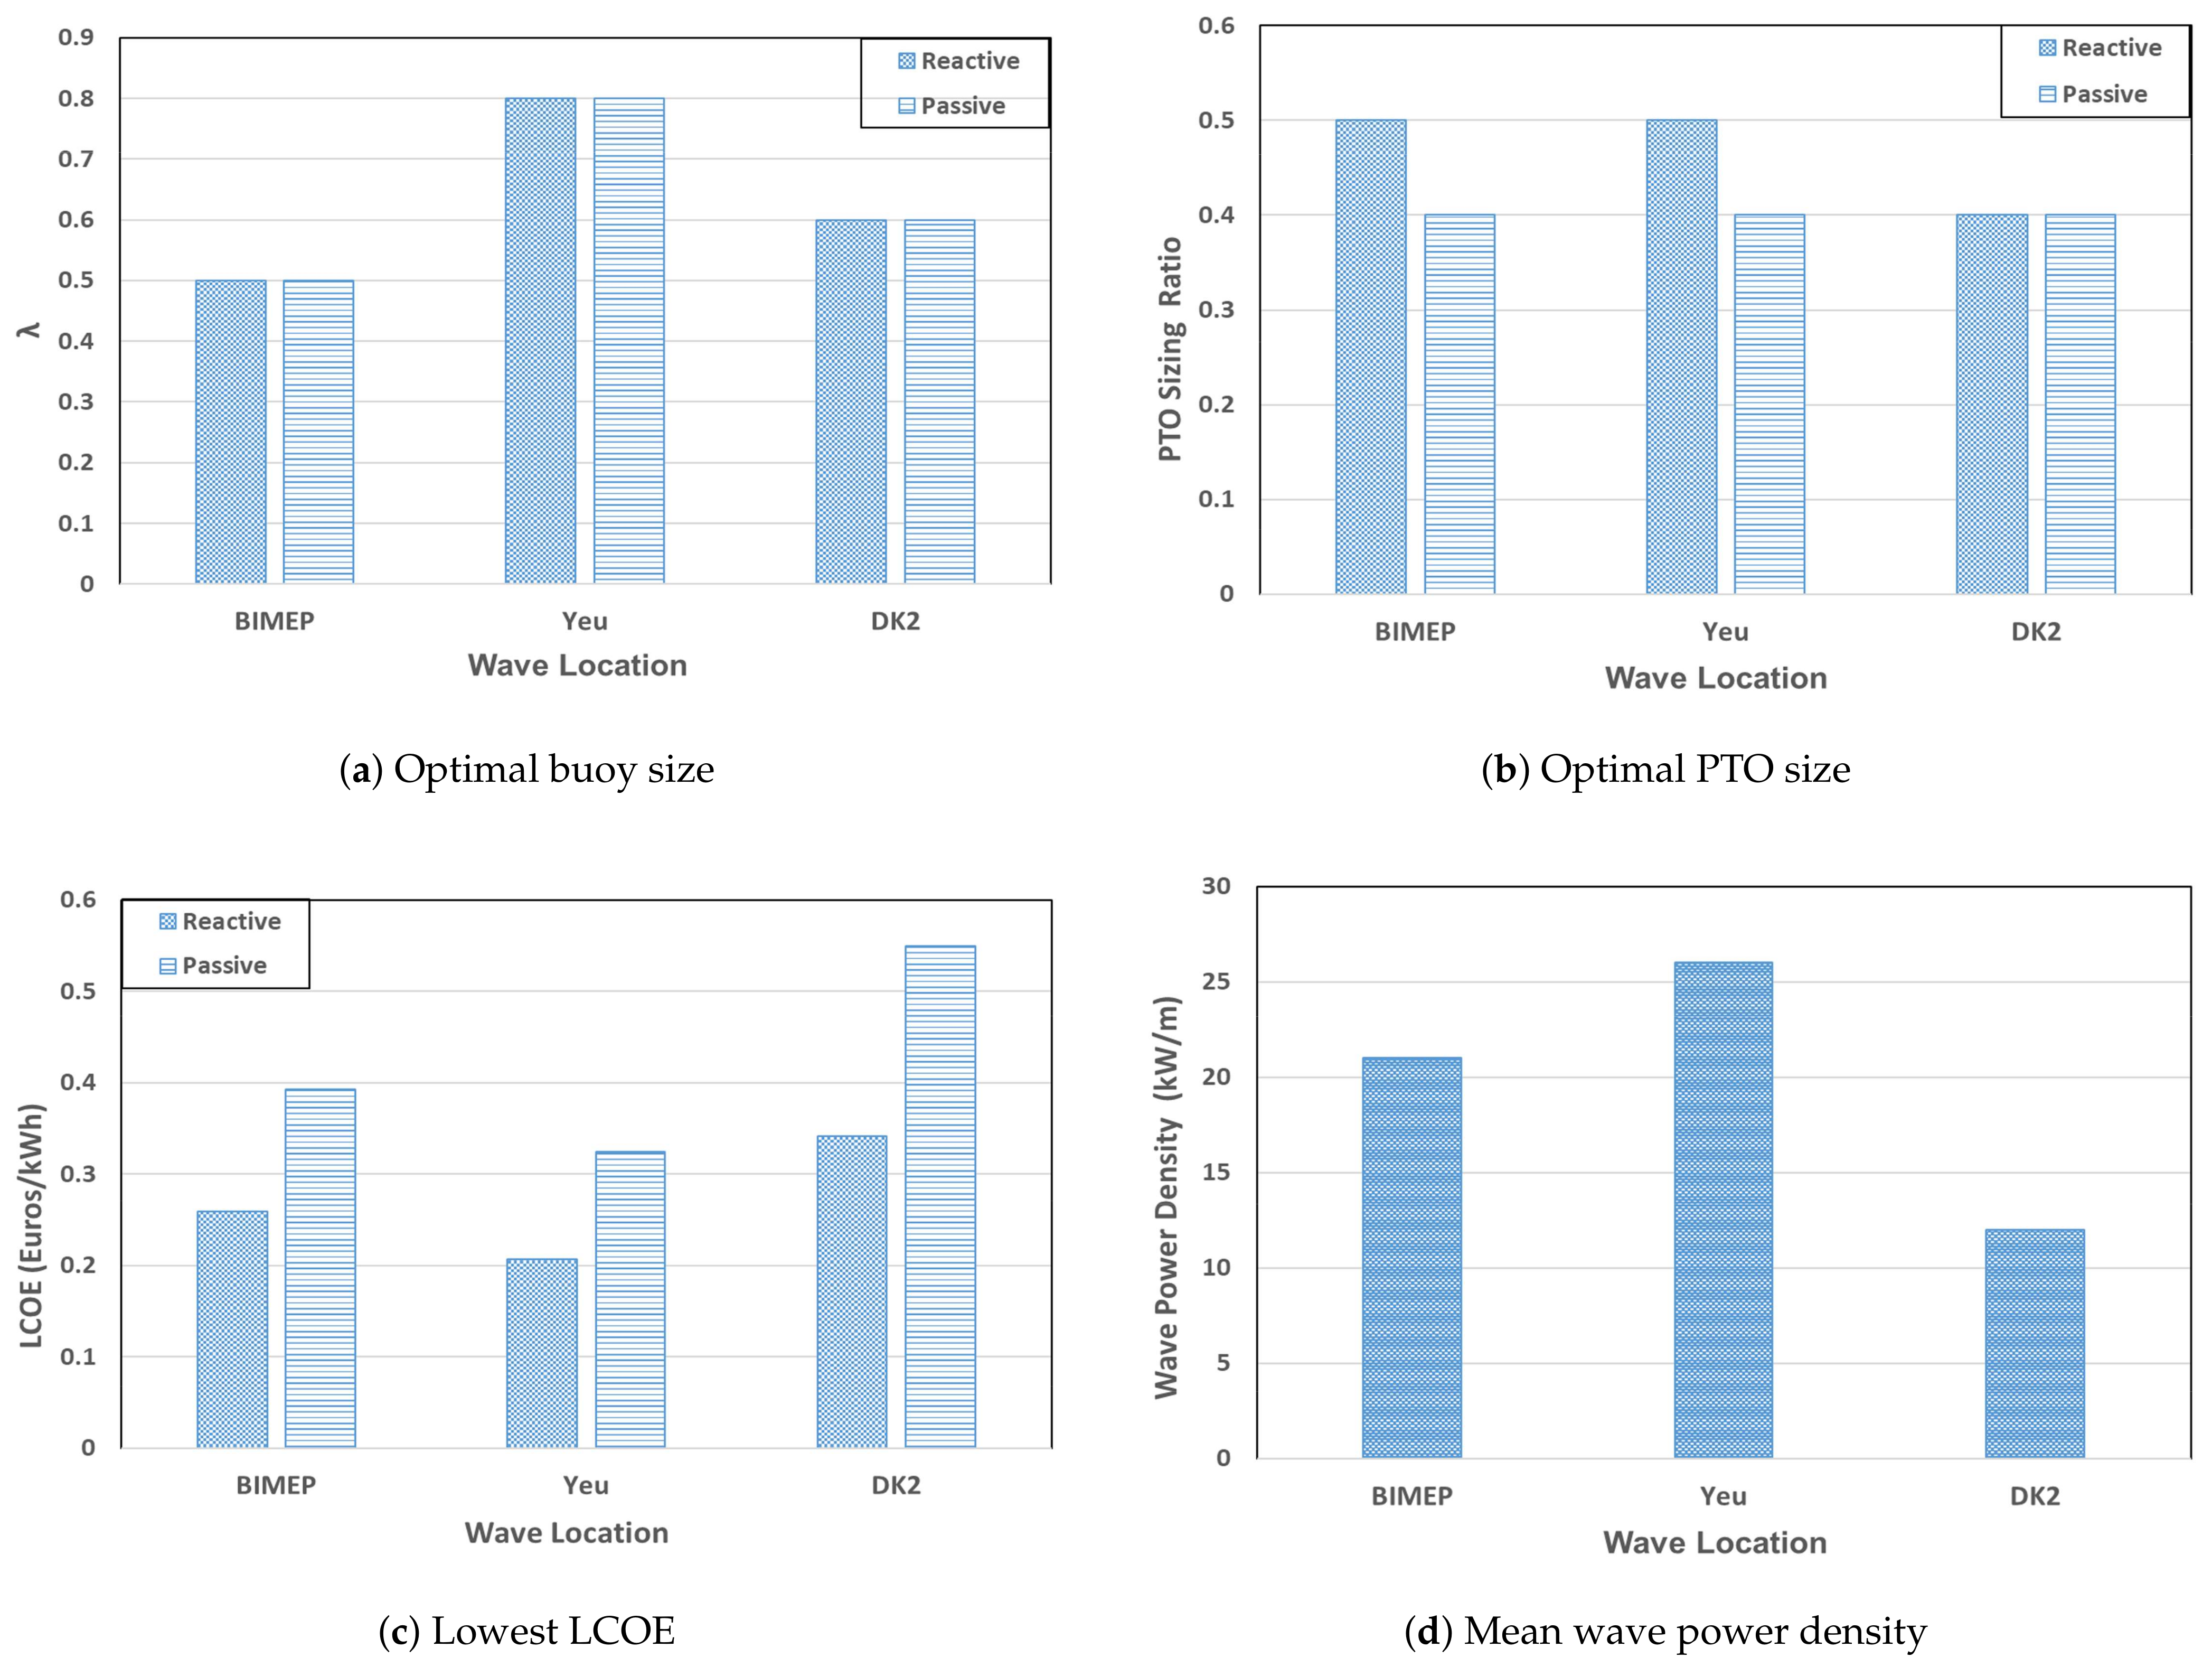
3.2.1. Results of Size Optimization

Based on the proposed method, the size optimization of the WEC for three sea sites is performed. First, to define the PTO sizing ratio, it is necessary to obtain the maximum required PTO forces corresponding to each buoy size. They are calculated by (12), and the results are shown in Figure 7. Figure 7a shows the relation of unconstrained PTO forces of the WEC in original buoy size to sea states, and the maximum required PTO forces for different sea sites are picked. It can be found from Figure 7b that the maximum required PTO force increases dramatically with the increase of the buoy size. In addition, the maximum required PTO forces in the WEC with reactive control are much higher than those with passive control. This is to be expected as PTO forces in reactive control consist of PTO damping-induced forces and PTO reactance-induced forces, while there are only PTO damping-induced forces in the case of passive control.
The size optimization results of the WEC using passive and reactive control for the three sea sites are depicted in Figure 8 and Figure 9, respectively. It can be clearly seen from these figures that both the LCOE and the AEP can be significantly influenced by sizing of the WEC, no matter in which sea site or with what kind of control strategies. Therefore, for improving the viability of the WEC, it is highly suggested to conduct size optimization of the WEC for the considered wave resources. Next, it can be noted that upscaling buoy size is able to improve the AEP, while it cannot necessarily reduce the LCOE of the WEC. Similarly, the AEP is highly sensitive to the PTO sizing ratio, and the increase of the PTO size can make a significant contribution to the improvement of the AEP. However, from the techno-economic point of view, enlarging PTO size does not necessarily result in a lower LCOE. In this case, it can be noted that downsizing the PTO size to a suitable level is beneficial for reducing the LCOE. Hence, to improve the techno-economic performance, it is significant to conduct PTO sizing for compromising the AEP and the cost.
In Figure 10, the dependence of size optimization of the WEC on wave resources and control strategies is shown. From Figure 10a,d, it can be found that there is not a direct relationship between the buoy size determination and the mean wave power density of wave resources. In other words, the optimal buoy size cannot be indicated by the mean wave power density. For instance, the mean wave power density in BIMEP is almost twice as much as that in DK2, but DK2 corresponds to a higher optimal buoy scale factor λ . As is seen in Figure 10a, control strategies do not have a notable influence on the buoy size determination for a given sea site. The reason is that the trends of the AEP changing with the buoy scale factor λ are comparable in both cases of reactive and passive control. Though control strategies lead to an notable difference in the absolute values of the AEP. Regarding PTO sizing, it can be found from Figure 10b that the optimal PTO sizing ratios in the WEC with the reactive control are slightly higher than those with passive control in BIMEP and Yeu. The only exception occurs in DK2 where the reactive and the passive control are associated with the same optimal PTO sizing ratio. In addition, it is noteworthy that the optimal PTO sizing ratio is relatively independent of wave resources, and it converges at around 0.4 to 0.5.
Different from the size determination, the optimized LCOE is highly related to wave resources and control strategies. It can be found from Figure 10c that the LCOE of the WEC with reactive control is much lower than the WEC with passive control, and the reduction can reach at 35 % in average for these sea sites. The optimized LCOE of the WEC with reactive control ranges around 0.2 to 0.35 Euros/kWh, while this value ranges around 0.35 to 0.55 Euros/kWh in the case of passive control. This is to be expected since the WEC with reactive control produces much more power than the WEC with passive control at the same sea state. From Figure 10c,d, it can be found that the higher the mean wave power density, the lower the optimal LCOE.
After the optimal buoy and PTO size have been determined for each sea site, the optimal cost proportion of the WEC can be obtained. The proportion of the PTO cost to the total CAPEX at the optimal sizing condition is shown in Figure 11. It can be seen that this cost proportion tends to be relatively independent of wave resources, while it is highly related to the control strategy of the WEC. In this case, the PTO cost of the WEC with reactive control accounts for 45% to 50% of the total CAPEX. Comparatively, for the WEC with passive control, this proportion decreases dramatically to around 30%. This can be explained by that the required PTO forces in the WEC with reactive control are much higher than those with passive control. It also implies that the PTO size in the WEC with reactive control should be designed larger than that with passive control. Besides, it is noticed that the optimized cost proportion of PTO is much higher than the statistic value of 24.2% depicted in Table 4. The reason is that the WECs investigated in the literature [34] are generally in large scales, and the costs of the structure are dominating. However, the optimized buoy size of the WEC in this case is relatively small, with the diameter ranging around 2.5 m to 4 m ( λ = 0.5 0.8 ). As a consequence, the PTO cost is more weighted compared with the structure cost. This phenomenon has also been explained in Section 3.1 as the proportion of power-related capital cost decreases with the buoy scale factor λ .

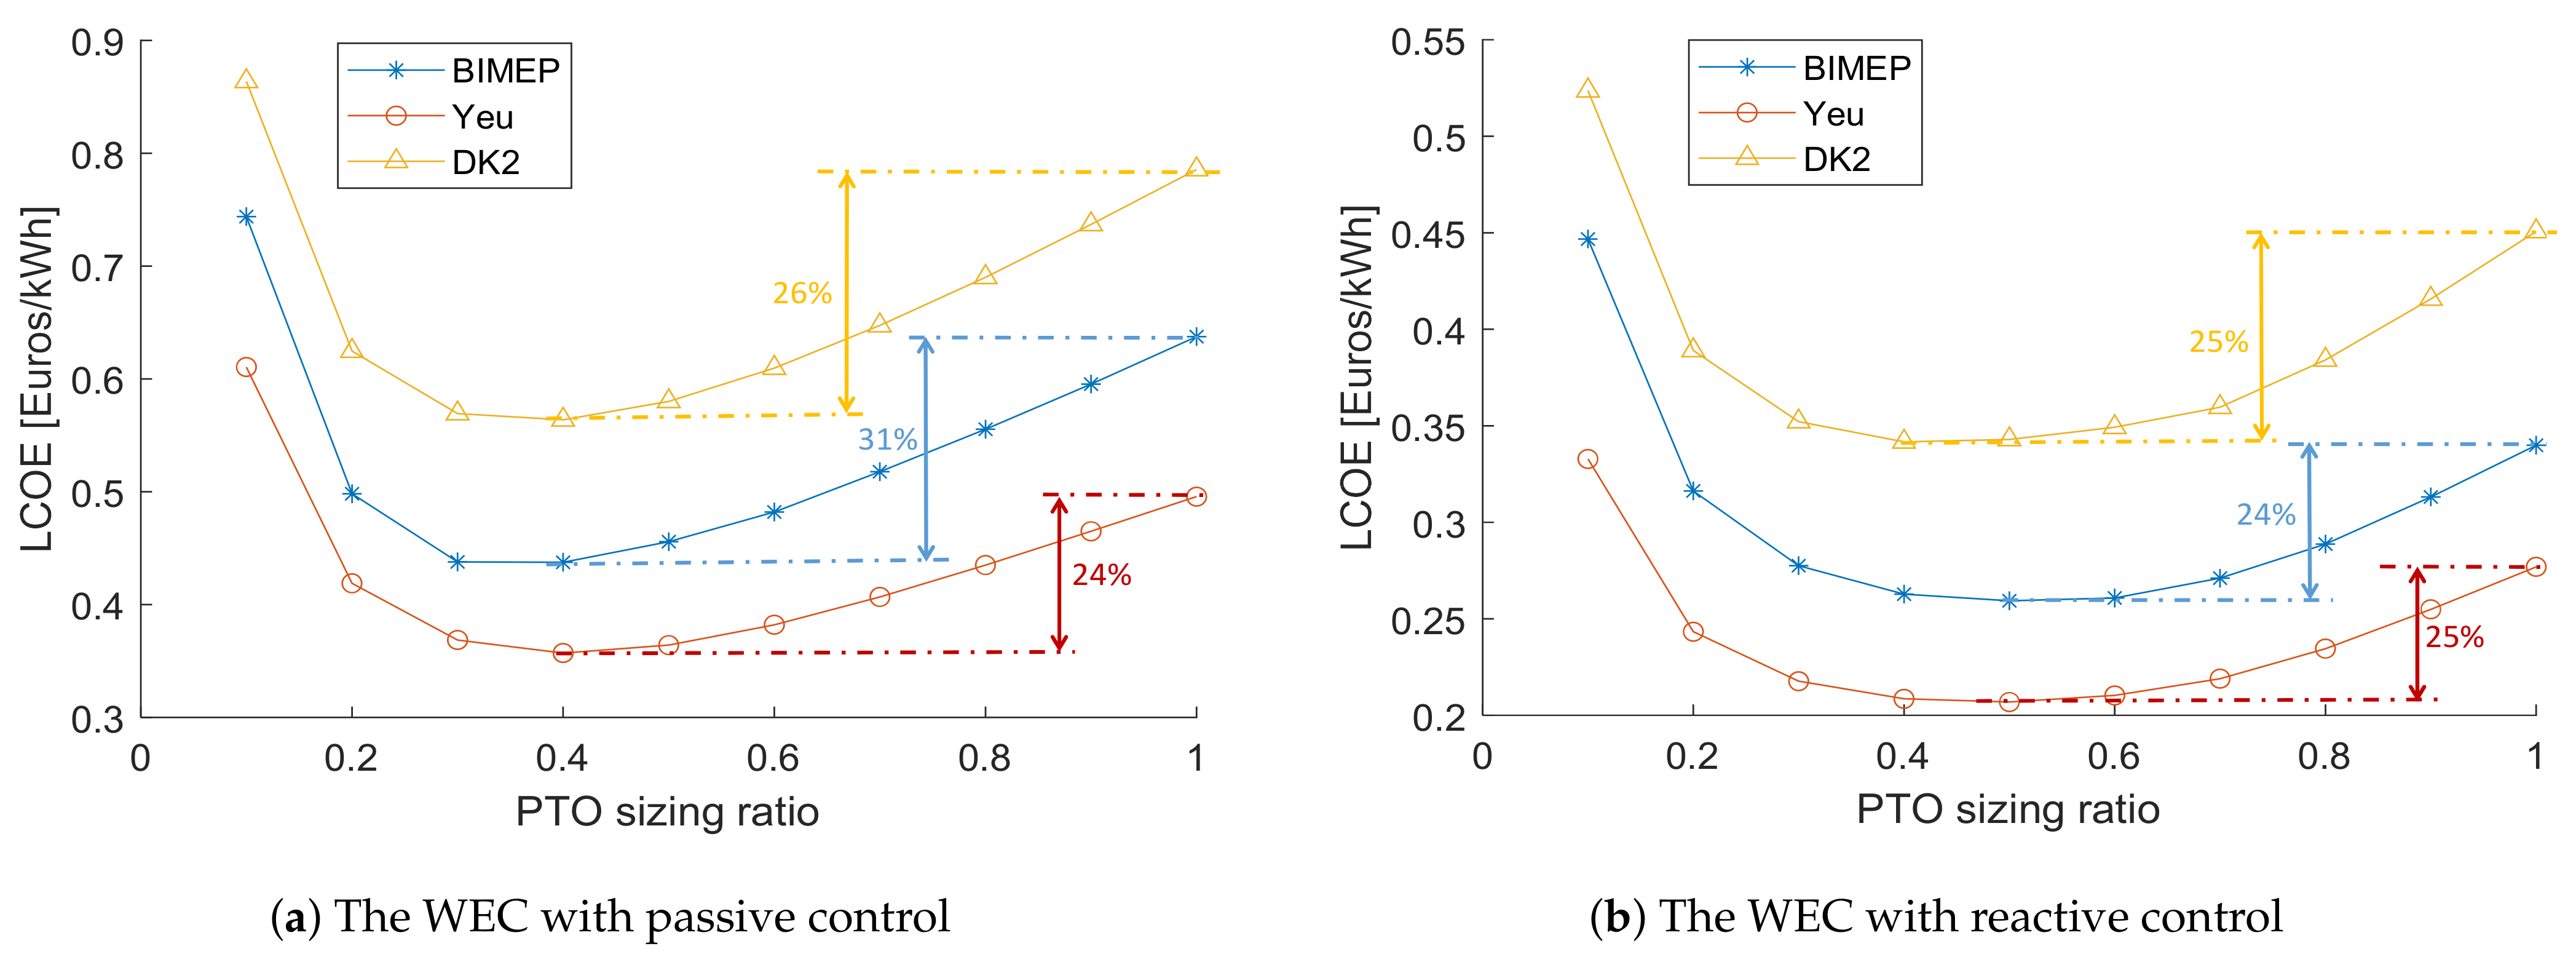
3.2.2. The Benefits of PTO Downsizing for the Techno-Economic Performance

The benefits of PTO sizing for reducing the LCOE of the WEC at the optimal buoy sizes are presented in Figure 12. It can be seen that the LCOE can be significantly reduced by downsizing the PTO size even though the buoy sizes have been optimized. In this case, downsizing the PTO sizing ratio to around 0.4 to 0.5 is preferable to minimize the LCOE. For the WEC with the passive control, downsizing the PTO size is able to reduce the LCOE by 24% to 31%, and it could reduce the LCOE by 24% to 25% in the case of reactive control. Hence, it is essential to take PTO size optimization into account when conducting sizing of the WEC. It also indicates that the techno-economic performance of WECs are generally underestimated due to the absence of PTO sizing in evaluation studies.

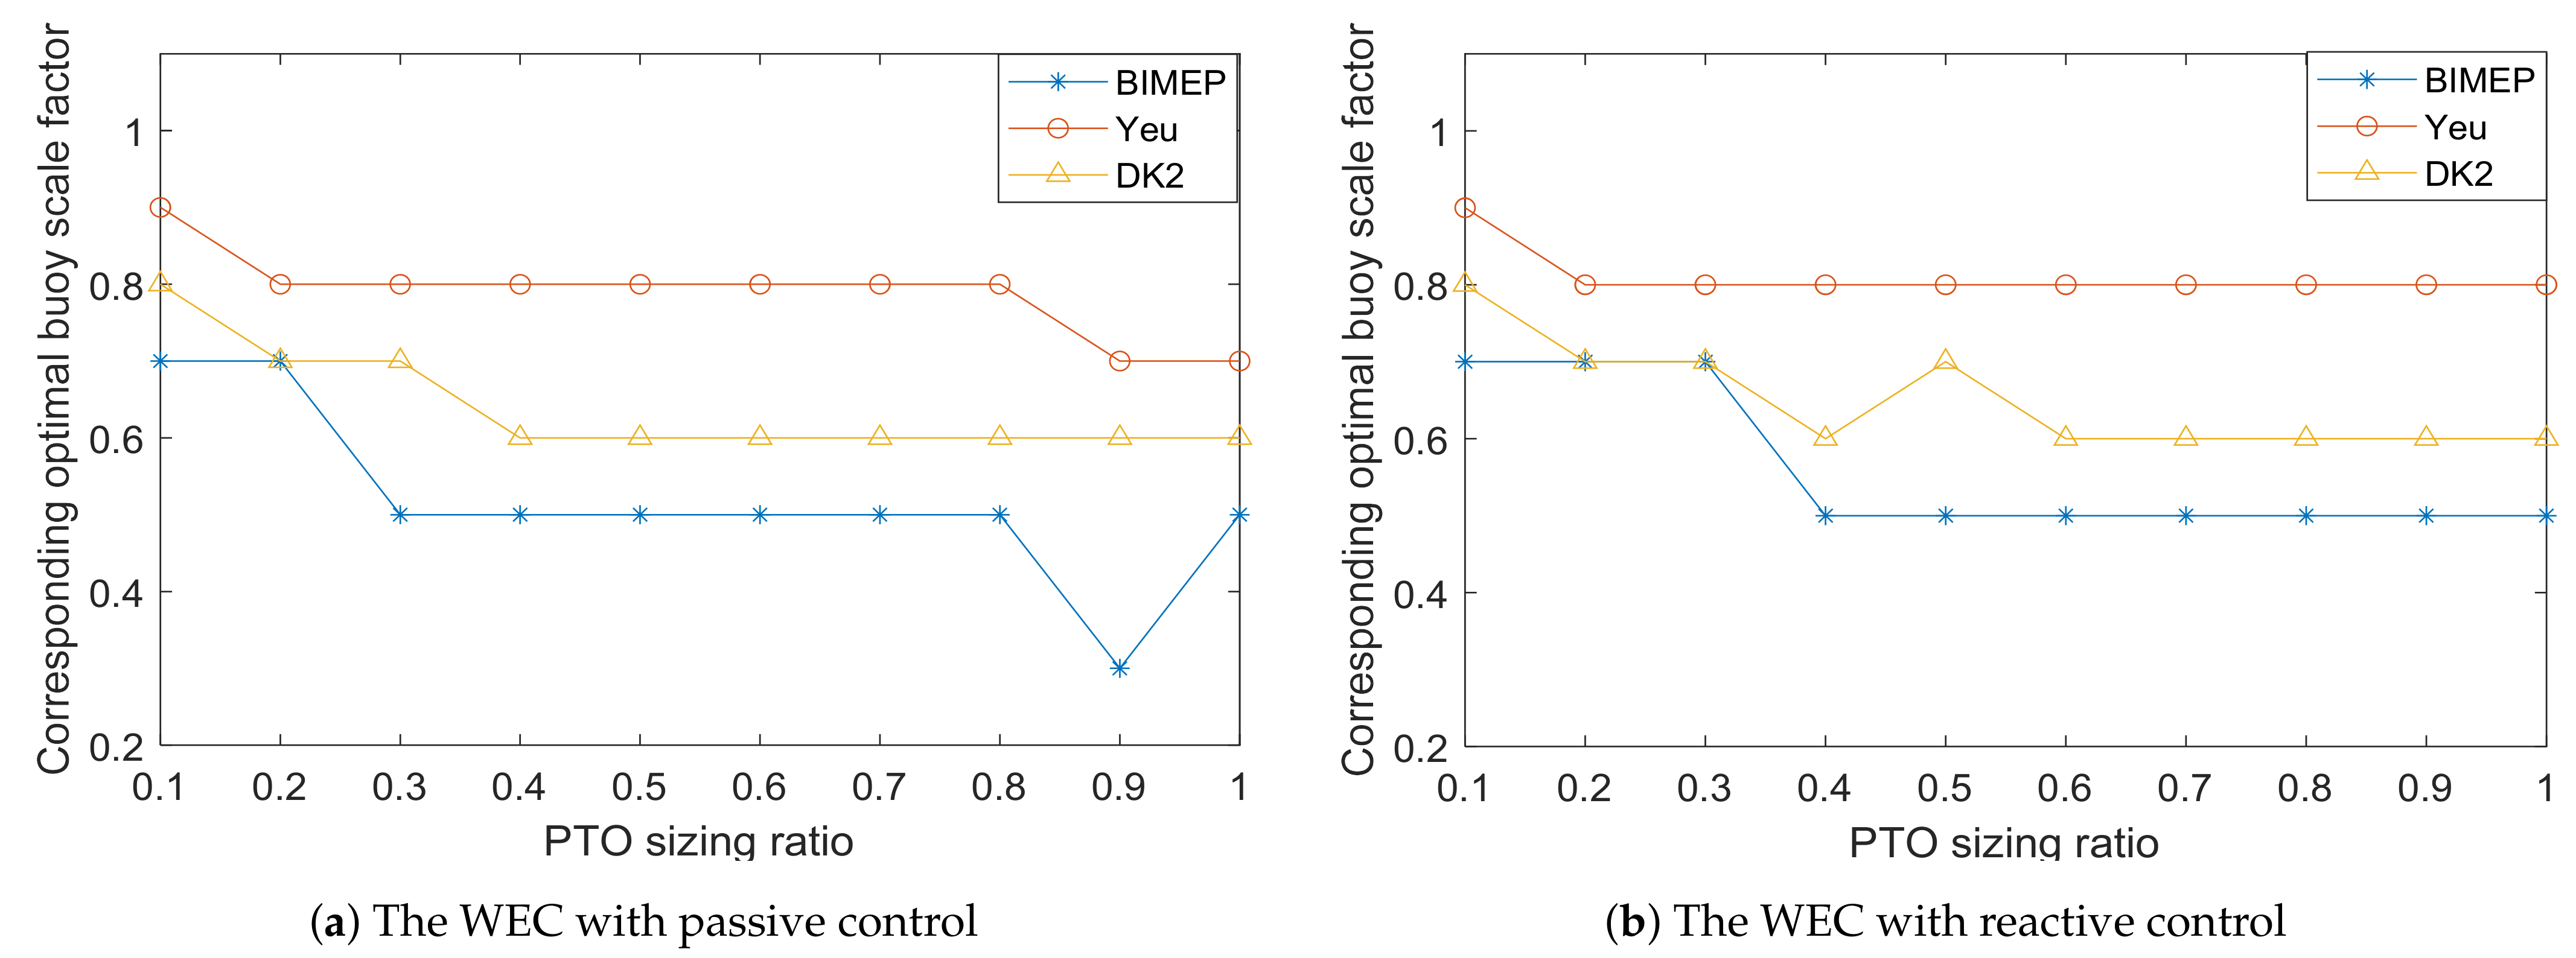
3.2.3. The Interaction between PTO Sizing and Buoy Sizing

The interaction between PTO sizing and buoy sizing is shown in Figure 13. It can be seen that the optimal buoy size generally declines with the corresponding PTO sizing ratio. However, this effect is limited and the optimal buoy size tends to be constant as the PTO sizing ratio is higher than 0.3 or 0.4. Hence, in this case, it can be noted that the buoy size optimization can be influenced by PTO sizing, but only to a limited extent. However, it should be pointed out that the interaction between PTO sizing and buoy sizing is related to wave resources, WEC principles, and economic parameters. Therefore, for avoiding the misestimate of the optimal buoy size, it is suggested to conduct PTO sizing simultaneously with buoy sizing. Besides, comparing Figure 13a,b, it is observed that there is no notable difference between the WEC with passive control and reactive control regarding the impact of PTO sizing on the buoy size determination.

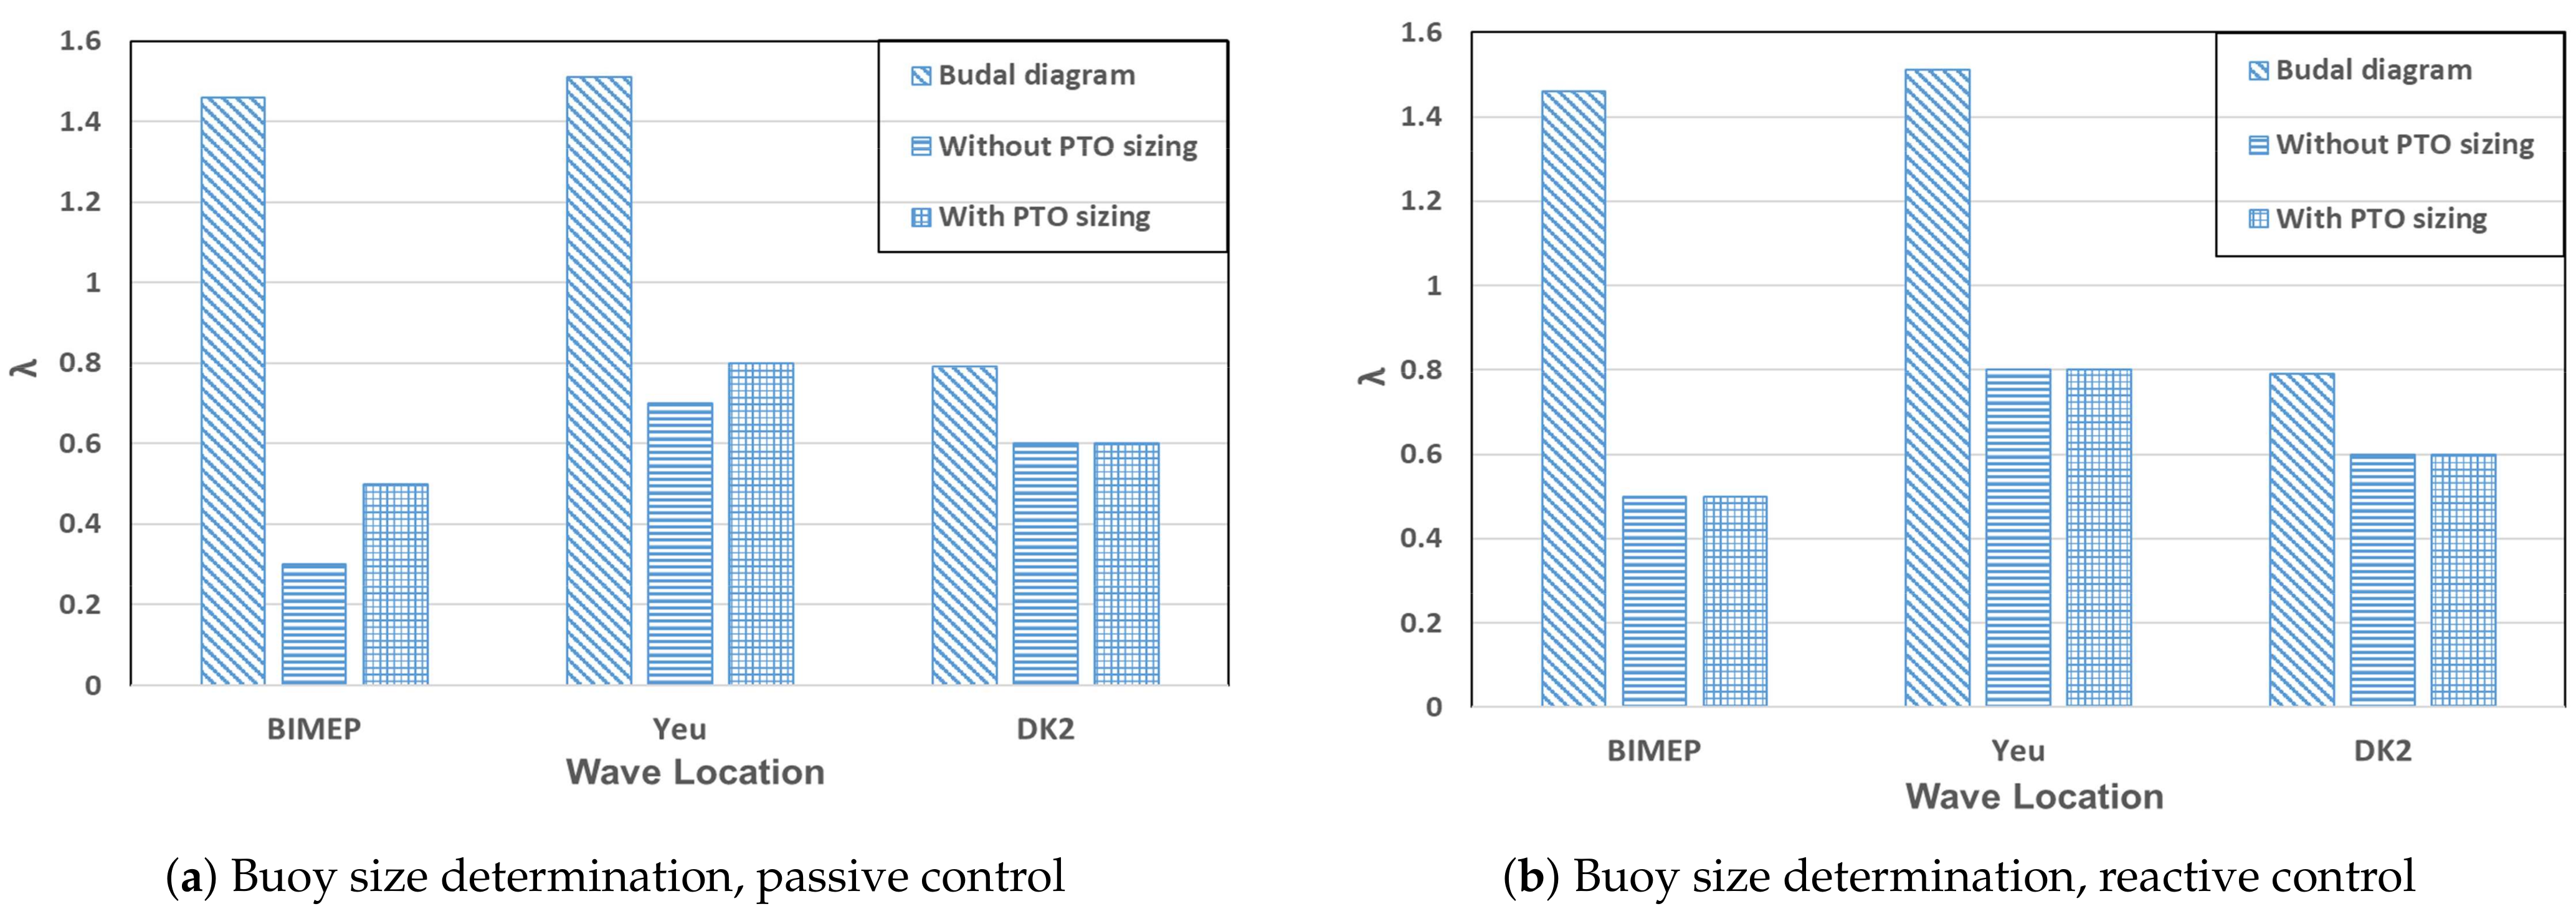
3.3. The Proposed Method Versus Other Size Optimization Methods

3.3.1. Budal Diagram

Budal diagram is a useful tool to estimate the theoretical absorbed power of the WEC. According to Budal diagram, there are two upper absorbed power bounds in regular wave conditions, namely P A and P B . P A bound is related to the maximum amount of power that could be extracted from incoming waves, while P B reflects the bound of power that could be absorbed by the realistically sized WEC [9,11]. P A corresponds to the maximum absorbed power at the high wave frequency limit and is expressed as
P A = J / k = ρ g 3 H 2 T 3 128 π 3 ;
here, ρ is the water density; g is the gravity acceleration; H is the wave height; ω is the wave frequency of incoming waves; k is the wave number; and J is the wave-energy transport per unit frontage of the incident wave and deep water condition. Another power bound P B corresponds to the maximum absorbed power at the low wave frequency limit and is expressed as
P B = π ρ g H V 4 T ,
where V is the volume of the buoy. The size of the WEC should match the wave resource to enable the WEC viable. Therefore, combined with the information of wave resources, Budal diagram could be used to select the suitable size of the WEC [9,11]. However, for calculating V in (32), the designed working condition (H and T) should be explicit. In Reference [11], the WEC is assumed to be commercially viable if the amount of working time at full capacity exceeds one third of the annual time. Thus, the size of the WEC should match “one third wave power threshold” of the wave resource. Based on the power threshold, the wave height H D and wave period T D in the designed wave condition can be calculated. The selection of suitable size of the WEC is conducted following these steps [9]:
  • calculate the wave power threshold J T ( W / m ) which is being exceeded one third of the annual time in the concerned wave climate;
  • choose the most frequent wave period in scatter diagrams as the designed wave period T D which corresponds to T in (31) and (32);
  • since T D and J T are already known from step 1 and 2, in harmonic waves, the wave height H D can be calculated;
  • the suitable volume V can be calculated by solving P A = P B ; and
  • finally, as the buoy volume is determined, the optimal PTO force limit is selected as the value which is required to maximize the absorbed power of the WEC at the designed wave condition ( H D and T D ).
Therefore, the suitable size of the WEC could be estimated by Budal diagram without calculating the power performance of the WEC in different sizes. However, in this method, the volume V depends on the assumption of viable conditions, such as “working at full capacity over one third of the annual time” [11]. In addition, Budal diagram is derived as the theoretical power bounds without considering the influence of PTO control strategies. So, the dependence of buoy size determination on the control strategies of the WEC cannot be reflected in this method. The size selection of the WEC is shown in Table 5.

3.3.2. The Size Optimization without PTO Downsizing

As is introduced in Section 1, existing literature regarding size optimization of WECs focused only on buoy sizing without considering PTO sizing. In those studies, the buoy size was optimized for the chosen sea sites, but the PTO size was simply scaled with the buoy scale factor λ [8,13]. This kind of buoy size optimization is conducted based on Froude scaling. With the aim to compare different size optimization methods, the size optimization without PTO sizing is conducted as a reference in this paper. The original buoy diameter is still defined as 5 m, the original PTO size is selected to sustain the maximum required force for the considered sea site, namely without PTO downsizing. Then, PTO force limits of the WEC in other buoy scale factors λ are scaled following Froude law, as (33).
F P T O _ l i m i t _ s c a l e d = F P T O _ l i m i t _ o r i g i n a l λ 3 .
The power performance and the cost of the WEC at each buoy size are calculated by frequency domain modeling and the economic modeling, respectively. Therefore, the LCOE of the WEC at each buoy scale factor λ can be obtained. The optimization results are shown in Figure 14.

3.3.3. Comparison of Size Optimization Methods

As is explained above, there are several methods available to conduct the size optimization for improving techno-economic performance of the WEC. A comparison among these methods is performed and the results are shown in Figure 15. Firstly, from Figure 15a,b, it can be observed that Budal diagram is not capable of determining the suitable sizes of the WEC. The deviation of the selected size between Budal diagram and the proposed method differs with wave resources, and this deviation tends to be random. For instance, the selected buoy scale factor λ for BIMEP is three times as much as that estimated by this proposed method, while the difference of selected sizes for DK2 is relatively small. However, as a theoretical and efficient approach, Budal diagram can be used to narrow the scope of size selection for potential sea sites. Secondly, compared with Budal diagram, size optimization without PTO downsizing shows a better ability to estimate the suitable buoy size of the WEC. Generally, without PTO sizing, the buoy size optimization can still acquire the suitable buoy size. This phenomenon also verifies the finding in Section 3.2.3. Thirdly, it can be seen from Figure 15c,d that the LCOE of the WEC optimized by this proposed method is clearly lower than those by the other two methods, no matter which control strategy is adopted. Hence, it can be concluded that this proposed method is able to result in a further improvement on the techno-economic performance of the WEC.

4. Conclusions

In this paper, a size optimization method of the WEC is proposed for improving the techno-economic performance and applied to a spherical heaving point absorber. Both buoy sizing and PTO sizing are taken into account. A frequency domain model and a preliminary economic model are established to calculate the power performance and economic performance of the WEC in various sizes, respectively. Besides, PTO force limits are used to represent different PTO sizes. For the determination of PTO parameters, a theoretical method is derived to maximize the power absorption under certain force constraints. The reactive control strategy and the passive control strategy are considered, respectively. Based on the proposed method, the size optimization is carried out for three typical sea sites. Furthermore, a comparison between the proposed method and other size optimization methods is performed. The following conclusions are drawn:
Firstly, as expected, both buoy sizing and PTO sizing are able to affect the techno-economic performance of the WEC. To improve the techno-economic performance, it is highly suggested to perform the buoy size optimization and PTO size optimization collectively.
Secondly, the optimal buoy size differs with wave resources, but it is not necessarily proportional to the mean wave power density. In this case, the optimal buoy scale factor λ ranges from 0.5 to 0.8. Besides, in most sea sites, the optimal PTO sizing ratios in the WEC with reactive control are slightly higher than those with passive control. The optimal PTO sizing ratios converge at around 0.4 to 0.5 for different sea sites. Furthermore, the higher mean wave power density and reactive control can clearly contribute to the reduction of the LCOE.
Thirdly, downsizing the PTO size would penalize the AEP, but it is beneficial for reducing the LCOE. In this case, the LCOE can be reduced by 24% to 31% through downsizing the PTO sizing ratio from 1 to around 0.4 to 0.5.
Fourthly, the corresponding optimal buoy size tends to slightly decrease with the PTO sizing ratio, but the influence of PTO sizing on the buoy size determination is limited.
Finally, Budal diagram is not able to estimate the suitable buoy size, but size optimization without PTO sizing can make the approximate estimate. Compared with other methods, a further reduction in the LCOE can be achieved by this proposed method.

Author Contributions

Conceptualization, J.T. and H.P.; methodology, J.T., H.P., and A.J.L.; software, J.T.; validation, J.T.; formal analysis, J.T., H.P., and A.J.L.; investigation, J.T.; resources, S.A.M.; data curation, J.T.; writing—Original draft preparation, J.T.; writing—Review and editing, J.T., H.P., and A.J.L.; visualization, J.T.; supervision, H.P., P.W., and S.A.M.; project administration, S.A.M.; funding acquisition, S.A.M. and H.P. All authors have read and agreed to the published version of the manuscript.

Funding

This research has received funding from China Scholarship Council under Grant: 20180695 0003.

Institutional Review Board Statement

Not applicable.

Informed Consent Statement

Not applicable.

Data Availability Statement

The data presented in this study are available on request from the corresponding author.

Acknowledgments

The authors wish to thank the ODE (Offshore Dredging Engineering) group in Delft University of Technology for supporting this research. The authors also would like to thank Giuseppe Giorgi for informing us about this special issue.

Conflicts of Interest

The authors declare no conflict of interest. The funders had no role in the design of the study; in the collection, analyses, or interpretation of data; in the writing of the manuscript; or in the decision to publish the results.

References

  1. Aderinto, T.; Li, H. Ocean Wave energy converters: Status and challenges. Energies 2018, 11, 1250. [Google Scholar] [CrossRef] [Green Version]
  2. Lehmann, M.; Karimpour, F.; Goudey, C.A.; Jacobson, P.T.; Alam, M.R. Ocean wave energy in the United States: Current status and future perspectives. Renew. Sustain. Energy Rev. 2017, 74, 1300–1313. [Google Scholar] [CrossRef]
  3. De Andrés, A.; Macgillivray, A.; Guanche, R.; Jeffrey, H. Factors affecting LCOE of Ocean energy technologies: A study of technology and deployment attractiveness. In Proceedings of the 5th International Conference on Ocean Energy, Halifax, NS, Canada, 4–6 November 2014; pp. 1–11. [Google Scholar]
  4. Pecher, A. Handbook of Ocean Wave Energy; Springer: Berlin/Heidelberg, Germany, 2017; Volume 7. [Google Scholar] [CrossRef] [Green Version]
  5. Babarit, A.; Hals, J.; Muliawan, M.J.; Kurniawan, A.; Moan, T.; Krokstad, J. Numerical benchmarking study of a selection of wave energy converters. Renew. Energy 2012, 41, 44–63. [Google Scholar] [CrossRef]
  6. Chang, G.; Jones, C.A.; Roberts, J.D.; Neary, V.S. A comprehensive evaluation of factors affecting the levelized cost of wave energy conversion projects. Renew. Energy 2018, 127, 344–354. [Google Scholar] [CrossRef]
  7. Babarit, A. A database of capture width ratio of wave energy converters. Renew. Energy 2015, 80, 610–628. [Google Scholar] [CrossRef]
  8. De Andres, A.; Maillet, J.; Todalshaug, J.H.; Möller, P.; Bould, D.; Jeffrey, H. Techno-economic related metrics for a wave energy converters feasibility assessment. Sustainability 2016, 8, 1109. [Google Scholar] [CrossRef] [Green Version]
  9. Sergiienko, N.Y.; Cazzolato, B.S.; Ding, B.; Hardy, P.; Arjomandi, M. Performance comparison of the floating and fully submerged quasi-point absorber wave energy converters. Renew. Energy 2017, 108, 425–437. [Google Scholar] [CrossRef] [Green Version]
  10. Falnes, J. Ocean Waves and Oscillating Systems; Cambridge University Press: Cambridge, UK, 2003; Volume 30, p. 953. [Google Scholar] [CrossRef]
  11. Falnes, J.; Hals, J. Heaving buoys, point absorbers and arrays. Philos. Trans. R. Soc. Math. Phys. Eng. Sci. 2012, 370, 246–277. [Google Scholar] [CrossRef] [Green Version]
  12. Pecher, A. Performance Evaluation of Wave Energy Converters; River Publishers: Hakodate, Denmark, 2014; pp. 1–107. [Google Scholar] [CrossRef] [Green Version]
  13. O’Connor, M.; Lewis, T.; Dalton, G. Techno-economic performance of the Pelamis P1 and Wavestar at different ratings and various locations in Europe. Renew. Energy 2013, 50, 889–900. [Google Scholar] [CrossRef]
  14. Tai, V.C.; See, P.C.; Merle, S.; Molinas, M. Sizing and control of the electric power take off for a buoy type point absorber wave energy converter. Renew. Energy Power Qual. J. 2012, 1, 1614–1619. [Google Scholar] [CrossRef]
  15. Tokat, P. Performance Evaluation and Life Cycle Cost Analysis of the Electrical Generation Unit of a Wave Energy Converter; Chalmers Tekniska Hogskola: Gothenburg, Sweden, 2018. [Google Scholar]
  16. Shek, J.; Macpherson, D.; Mueller, M. Phase and amplitude control of a linear generator for wave energy conversion. In Proceedings of the 4th IET International Conference on Power Electronics, Machines and Drives (PEMD 2008), York, UK, 2–4 April 2008; pp. 66–70. [Google Scholar] [CrossRef]
  17. Shek, J.; Macpherson, D.; Mueller, M. Experimental verification of linear generator control for direct drive wave energy conversion. IET Renew. Power Gener. 2010, 4, 395–403. [Google Scholar] [CrossRef]
  18. Tedeschi, E.; Carraro, M.; Molinas, M.; Mattavelli, P. Effect of control strategies and power take-off efficiency on the power capture from sea waves. IEEE Trans. Energy Convers. 2011, 26, 1088–1098. [Google Scholar] [CrossRef]
  19. Garcia-Rosa, P.; Bacelli, G.; Ringwood, J. Control-informed geometric optimization of wave energy converters: The impact of device motion and force constraints. Energies 2015, 8, 13672–13687. [Google Scholar] [CrossRef]
  20. Astariz, S.; Iglesias, G. The economics of wave energy: A review. Renew. Sustain. Energy Rev. 2015, 45, 397–408. [Google Scholar] [CrossRef]
  21. Hals, J.; Bjarte-Larsson, T.; Falnes, J. Optimum Reactive Control and Control by Latching of a Wave-Absorbing Semisubmerged Heaving Sphere. In Proceedings of the 21st International Conference on Offshore Mechanics and Arctic Engineering, Oslo, Norway, 23–28 June 2002; pp. 415–423. [Google Scholar] [CrossRef]
  22. Tedeschi, E.; Molinas, M. Tunable control strategy for wave energy converters with limited power takeoff rating. IEEE Trans. Ind. Electron. 2012, 59, 3838–3846. [Google Scholar] [CrossRef]
  23. Kramer, M.M.; Marquis, L.; Frigaard, P. Performance Evaluation of the Wavestar Prototype. In Proceedings of the 9th European Wave and Tidal Conference, Southampton, UK, 5–9 September 2011; pp. 5–9. [Google Scholar]
  24. Penalba, M.; Kelly, T.; Ringwood, J. Using NEMOH for Modelling Wave Energy Converters: A Comparative Study with WAMIT. In Proceedings of the 12th European Wave and Tidal Energy Conference, Cork, Ireland, 27 Auguest–1 September 2017; p. 10. [Google Scholar]
  25. Pastor, J.; Liu, Y. Frequency and time domain modeling and power output for a heaving point absorber wave energy converter. Int. J. Energy Environ. Eng. 2014, 5, 1–13. [Google Scholar] [CrossRef] [Green Version]
  26. Journée, J.M.J.; Massie, W.W.; Huijsmans, R.H.M. Offshore Hydrodynamics; Delft University of Technology: Delft, The Netherlands, 2015. [Google Scholar]
  27. Penalba, M.; Giorgi, G.; Ringwood, J.V. Mathematical modelling of wave energy converters: A review of nonlinear approaches. Renew. Sustain. Energy Rev. 2017, 78, 1188–1207. [Google Scholar] [CrossRef] [Green Version]
  28. Hals, J.; Falnes, J.; Moan, T. Constrained Optimal Control of a Heaving Buoy Wave-Energy Converter. J. Offshore Mech. Arct. Eng. 2010, 133, 011401. [Google Scholar] [CrossRef] [Green Version]
  29. Prado, M.; Polinder, H. Direct Drive Wave Energy Conversion Systems: An Introduction; Woodhead Publishing Limited: Sawston, Cambridge, 2013; pp. 175–194. [Google Scholar] [CrossRef]
  30. Ugray, Z.; Lasdon, L.; Plummer, J.; Glover, F.; Kelly, J.; Martí, R. Scatter Search and Local NLP Solvers: A Multistart Framework for Global Optimization. Informs J. Comput. 2007. [Google Scholar] [CrossRef]
  31. Cahill, B.; Lewis, A.W. Wave period ratios and the calculation of wave power. In Proceedings of the 2nd Marine Energy Technology Symposium, Seattle, WA, USA, 15–18 April 2014; pp. 1–10. [Google Scholar]
  32. Chozas, J.; Kofoed, J.; Helstrup, N. The COE Calculation Tool for Wave Energy Converters; Version 1.6; DCE Technical Reports; No. 161; Aalborg University: Aalborg, Denmark, 2014. [Google Scholar]
  33. Payne, G. Guidance for the experimental tank testing of wave energy converters. SuperGen Mar. 2008, 254. [Google Scholar]
  34. De Andres, A.; Medina-Lopez, E.; Crooks, D.; Roberts, O.; Jeffrey, H. On the reversed LCOE calculation: Design constraints for wave energy commercialization. Int. J. Mar. Energy 2017, 18, 88–108. [Google Scholar] [CrossRef]
  35. Bank of England. Inflation Calculator-Bank of England [EB/OL]. Available online: https://www.bankofengland.co.uk/monetary-policy/inflation/inflation-calculator (accessed on 4 October 2020).
  36. Polinder, H. Principles of Electrical Design of Permanent Magnet Generators for Direct Drive Renewable Energy Systems; Woodhead Publishing Limited: Cambridge, UK, 2013; pp. 30–50. [Google Scholar] [CrossRef]
  37. Tokat, P.; Thiringer, T. Sizing of IPM Generator for a Single Point Absorber Type Wave Energy Converter. IEEE Trans. Energy Convers. 2018, 33, 10–19. [Google Scholar] [CrossRef]
Figure 1. Schematic of the heaving point absorber concept.
Jmse 09 00052 g001
Figure 2. Flowchart of the size optimization method of Wave Energy Converters (WECs).
Jmse 09 00052 g002
Figure 3. Optimized Power Take-Off (PTO) damping of the WEC with passive control for various sea states ( λ = 1 and PTO force limit = 50 kN).
Jmse 09 00052 g003
Figure 4. Optimized PTO parameters of the WEC with reactive control for various sea states ( λ = 1 and PTO force limit = 250 kN).
Jmse 09 00052 g004
Figure 5. Performance of the WEC with passive control under different PTO sizes and buoy scale factor λ , at H s = 1.5   m and T z = 5   s .
Jmse 09 00052 g005
Figure 6. Performance of the WEC with reactive control under different PTO sizes and buoy scale factor λ , a H s = 1.5   m and T z = 5   s .
Jmse 09 00052 g006
Figure 7. Maximum required PTO forces for various sea sites and buoy scale scale factor λ .
Jmse 09 00052 g007
Figure 8. Size optimization of the WEC with passive control.
Jmse 09 00052 g008
Figure 9. Size optimization of the WEC with reactive control.
Jmse 09 00052 g009
Figure 10. The dependence of size optimization on wave resources and control strategies.
Jmse 09 00052 g010
Figure 11. The proportion of cost on PTO to total CAPEX at the optimal buoy size and PTO size.
Jmse 09 00052 g011
Figure 12. The effects of PTO downsizing on Levelized Cost Of Energy (LCOE) of the WEC at the optimal buoy size.
Jmse 09 00052 g012
Figure 13. The interaction between PTO and buoy sizing.
Jmse 09 00052 g013
Figure 14. The size optimization of the WEC without PTO sizing.
Jmse 09 00052 g014
Figure 15. Comparison among different size optimization methods.
Jmse 09 00052 g015aJmse 09 00052 g015b
Table 1. Scatter diagram showing yearly hours of occurrence of sea states in the Yeu Island (Yeu), France.
Hours T z  (s)2.142.863.574.295.005.716.437.147.898.579.2910.0010.7111.4312.14
H s  (m)
0.50 1.2755.7079.7567.0964.5662.0337.9812.661.27
1.00 56.97219.00268.37337.99369.64244.32135.4562.033.801.271.27
1.50 1.2736.71163.30278.50281.03215.20145.58124.0686.0817.723.802.53
2.00 69.62225.33235.46175.98146.8464.5662.0322.7911.396.33
2.50 81.02345.59324.07272.17106.3472.1643.0411.392.53
3.00 15.19281.03340.53250.66112.6687.3558.2331.6610.13
3.50 69.62293.69192.42118.9965.8351.9036.7122.797.601.27
4.00 3.80110.13127.8665.8349.3727.8527.8522.7915.193.80
4.50 26.5843.0460.7621.5212.666.335.06 1.27
5.00 2.5320.2534.1815.197.601.27
5.50 7.6024.0512.666.33
6.00 3.8013.928.86 1.27
6.50 2.537.601.27
Table 2. Scatter diagram showing yearly hours of occurrence of sea states in Biscay Marine Energy Park (BIMEP), Spain.
Hours T z (s)5.007.009.0011.0013.0015.0017.00
H s (m)
0.75 148.92219.0078.8417.52
1.50 858.482664.521445.40508.0878.848.76
2.50 744.60560.64324.12157.6835.04
3.50 87.60262.8061.3252.5635.048.76
4.50 105.1235.048.768.768.76
5.50 8.7626.28
Table 3. Scatter diagram showing yearly hours of occurrence of sea states in DK North Sea Point 2 (DK2), Denmark.
Hours T z  (s)2.503.504.505.506.507.508.509.50
H s  (m)
0.25 584.00634.00113.0029.007.001.00
0.75 20.001552.00610.00153.0056.0016.006.002.00
1.25 188.001397.00123.0025.009.007.003.00
1.75 1.00621.00501.008.002.001.001.00
2.25 14.00709.0018.001.00
2.75 286.00224.001.00
3.25 10.00314.002.00
3.75 190.0034.00
4.25 17.00121.00
4.75 77.001.00
5.25 26.0011.00
5.75 2.0016.00
6.25 10.00
6.75 4.001.00
7.25 1.00
Table 4. Percentages of Capital Expenditure (CAPEX)-related components of WECs in total CAPEX.
CAPEXCategoriesAverage Percentage
Mass-related capital costStructure P S = 38.2%
Foundation and mooring P F & M = 19.1%
Installation P I = 10.2%
Power-related capital costPTO component P P = 24.2%
Connection P C = 8.3%
Table 5. Size selection based on Budal diagram.
Sea SiteWave Power Density Threshold T D H D Buoy VolumePTO Force Limit
ReactivePassive
Yeu Island30.4 kW/m7.8 s2.00 m224 m 3 985 kN216 kN
BIMEP14.6 kW/m8.4 s1.33 m206 m 3 946 kN145 kN
DK28.2 kW/m5.4 s1.24 m33 m 3 142 kN36 kN
Publisher’s Note: MDPI stays neutral with regard to jurisdictional claims in published maps and institutional affiliations.

