Article

Effects of Fine Sediment on Seagrass Meadows: A Case Study of Zostera muelleri in Pāuatahanui Inlet, New Zealand

by
Iñigo Zabarte-Maeztu
1,2,*,
Fleur E. Matheson
1,
Merilyn Manley-Harris
2,
Robert J. Davies-Colley
1,
Megan Oliver
3 and
Ian Hawes
4
1
National Institute of Water & Atmospheric Research, Hamilton 3216, New Zealand
2
School of Science, University of Waikato, Hamilton 3260, New Zealand
3
Greater Wellington Regional Council, PO Box 11646, Wellington 6142, New Zealand
4
Coastal Marine Field Station, University of Waikato, Tauranga 3110, New Zealand
*
Author to whom correspondence should be addressed.
J. Mar. Sci. Eng. 2020, 8(9), 645; https://doi.org/10.3390/jmse8090645
Submission received: 17 June 2020 / Revised: 14 August 2020 / Accepted: 19 August 2020 / Published: 21 August 2020

Abstract

:
Seagrass meadows are vulnerable to fine sediment (mud) pollution, with impacts usually attributed to reduction in submerged light. Here we tested two non-exclusive hypotheses, that mud particles (<63 µm) impact seagrasses through both (1) the light climate and (2) changes in substrate physico-chemistry. We tested these hypotheses in Pāuatahanui Inlet, New Zealand, by comparing seagrass presence, abundance, and health, together with light climate and substrate physico-chemistry at contrasting habitats where (1) seagrass used to thrive but no longer grows (historical seagrass), (2) seagrass still persists (existing seagrass) and (3) seagrass has been present recently, but not currently (potential seagrass). Historical seagrass substrate had significantly higher mud (35% average), bulk density (1.5 g cm−3), porewater ammonium concentration (65 µM), and a more reduced redox profile (negative redox at only 2 cm soil depth) as well as a lower light availability when submerged compared to other habitats, while total daily light exposure differed little between habitats. This suggests that failure of seagrass to recolonize historical seagrass habitat reflects substrate muddiness and consequent unfavorable rhizosphere conditions. Our results provide evidence for the multi-stressor effects of fine sediment on seagrasses, with substrate suitability for seagrass being detrimentally affected even where light exposure seems sufficient.

1. Introduction

Seagrass meadows are one of the most important and threatened ecosystems on the planet [1]. They have immense ecological and socio-economic value [1,2,3,4], yet as a result of human activities, these ecosystems are increasingly threatened [5].
A major contributor to global anthropogenic stress on seagrass is the reduction of available light, particularly photosynthetically active radiation (PAR), the primary driver of seagrass growth [6,7,8,9,10,11,12]. The usual cause of underwater PAR reduction is increased suspended sediment loads to coastal waters. Natural events, such as runoff and windstorms, can provoke sedimentary movement to and within coastal systems leading to acute, large-scale alteration of seagrass habitat [13,14,15]. However, acute and chronic human-induced impacts, resulting from land clearance and other activities that increase fine sediment concentrations, can result in complete and perhaps irreversible, extinction of seagrass meadows [16,17,18,19].
While impacts of suspended fine sediments on seagrasses via reduced underwater PAR exposure are widely reported [20,21], sediments may also affect seagrasses after they settle. Fine sediment, initially settled as nepheloid layers, continue to shade seagrasses [22,23] and may also restrict solute flux by reducing substrate porosity. This may exacerbate hypoxia [24] and drive changes to substrate biogeochemistry. Seagrass substrate typically becomes anaerobic a few millimeters or centimeters below the bed surface as a result of slow oxygen diffusion rates and a high microbial oxygen demand associated with mineralization of organic matter (OM) within the rhizosphere [25]. Anoxia may lead to high porewater concentrations of phytotoxic compounds such as sulfide and metals [26,27,28].
In New Zealand, fine sediments are considered to be the most pervasive contaminant affecting estuaries and sheltered coastal embayments [29,30,31,32]. Fine sediment is thought to have contributed substantially to documented losses of seagrass meadows in a number of New Zealand estuaries [33,34]. In Pāuatahanui Inlet, ca. 39 ha of seagrass in the inner estuary in 1980 [35] and earlier, has been subsequently lost. This loss has been tentatively, but plausibly, attributed to anthropogenic catchment development and increased sedimentation and eutrophication of the estuary [36]. Nevertheless, in the better-flushed, outer part of this estuary, seagrass beds still persist and are a prominent feature of the intertidal zone. For this study, we investigated potential causes of seagrass decline and failure to recover by comparing light climate and substrate physical and chemical characteristics at habitats with and without seagrass. We hypothesized that high fine sediment affects seagrass through multiple stresses caused by deposited sediment in addition to PAR attenuation by suspended and re-suspended sediment. To test our hypothesis, we quantified and compared conditions (PAR, substrate grain size, and biogeochemistry) at habitats with and without seagrass in Pāuatahanui Inlet. Specifically we investigated (1) sites in the inner estuary where seagrass used to thrive but no longer grows (historical seagrass), (2) sites where seagrass still persists in the outer estuary (existing seagrass), and (3) sites in the outer estuary, adjacent to existing seagrass beds, where seagrass has been present intermittently for the past decade, but where seagrass is not currently growing (potential seagrass). Comparisons among these sites potentially would allow disentanglement of the effect of anthropogenic sediments on biogeochemistry in the absence of seagrass, the impacts of seagrass on biogeochemistry in the absence of anthropogenic sedimentation, and the effects of habitat on light regime.

2. Materials and Methods
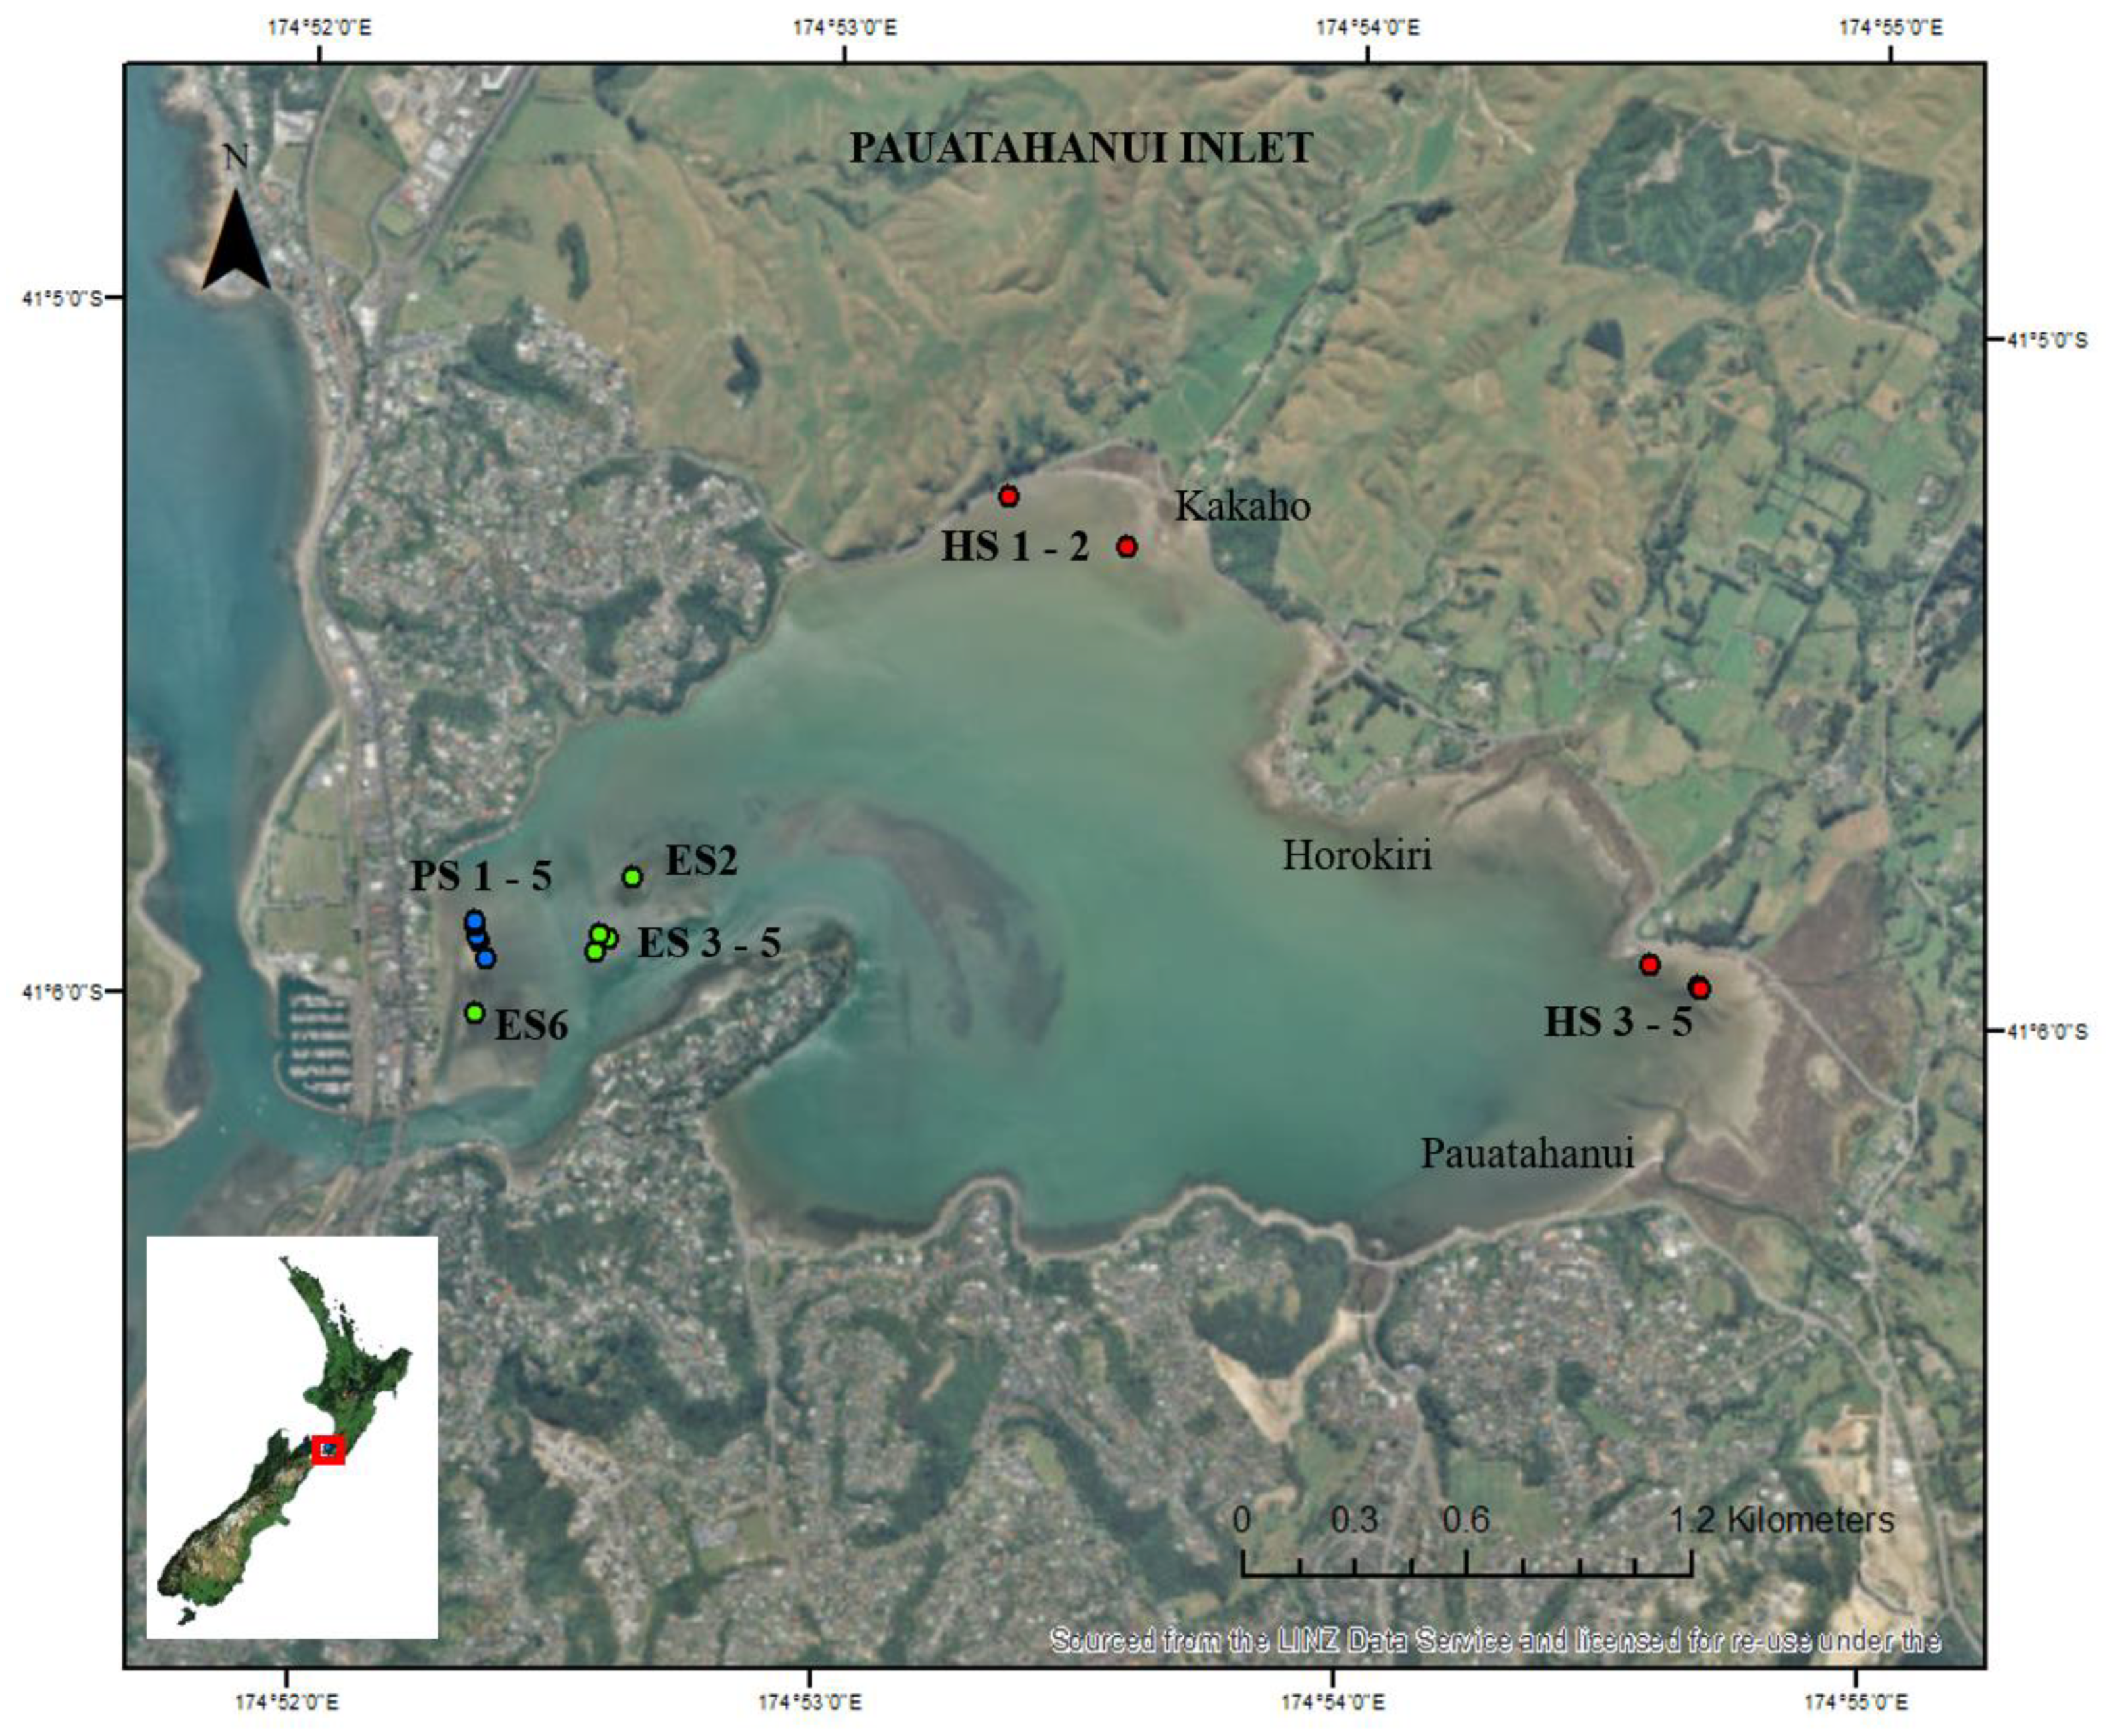
2.1. Study Location

Pāuatahanui Inlet is a natural inlet and wildlife reserve on New Zealand’s North Island south-western coast (Figure 1). It is the eastern arm of Porirua Harbour which has a total catchment area of 199 km2, comprising a land area of 185 km2 and a harbour area of 14 km2. The maximum elevation of the catchment is 530 m at the head of the Horokiri sub-catchment and mean altitude is 150 m. Average annual rainfall is 1200 mm and the mean air temperature is 12.9 °C, with prevailing winds from the North and North-West [37].
The Pāuatahanui catchment is 109 km2 [38] and has six sub-catchments. The Pāuatahanui, Horokiri, and Kakaho streams are the major sources of sediment (Figure 1). Within these, predominantly pastoral sub-catchments, soil erosion and runoff has resulted in high downstream sedimentation rates and land use has driven moderate eutrophication [39]. These inputs have almost certainly contributed to estuary infilling and have likely contributed to the loss of seagrass meadows from inner parts of the Inlet (historical seagrass, HS), which has occurred since 1980 [36]. From 1974 to 2009 the mean sedimentation rate for Pāuatahanui Inlet was 9.1 mm yr−1 [40] which is high compared to rates of <1 mm yr−1 expected in natural, undeveloped catchments in this region and elsewhere [41,42]. In the better-flushed, outer part of this estuary, seagrass beds still persist and are a prominent feature of the intertidal zone (existing seagrass, ES). Seagrasses are very dynamic plants [43,44] and have been present in the southern (potential seagrass, PS) areas in the recent past, but were not observed there during this study (Supplementary materials, Figure S1). From 2012, Greater Wellington Regional Council (GWRC) implemented a local catchment management plan to reduce sediment loads with a target average sedimentation rate of 1 mm yr−1 for Porirua Harbour. The latest data suggests that this rate was close to being achieved in 2016 [39]. However, while this strategy may limit further deterioration in estuary conditions, it does not address the legacy effects of fine sediment previously washed into the Inlet which may be re-suspended.

2.2. Field Sampling

Five sites in each of historical, existing, and potential seagrass habitats (HS, ES, PS, respectively) were sampled in southern hemisphere winter (23–31 August 2018) and again in summer (8–15 February 2019). At each site substrate condition, light climate and seagrass traits were measured. A 10 m transect was laid out parallel to shore along an elevation contour in the intertidal zone (0.2–0.4 m below mean sea level), along which five equidistant 0.5 m × 0.5 m (0.25 m2) sampling plots were located. At each plot, a photograph was taken for subsequent determination of seagrass percent cover and two 12 cm diameter cores, each 10 cm deep, were randomly collected within the plot for laboratory analysis of substrate properties and seagrass traits. In the first, third, and fifth plot of each transect, porewater was extracted at two soil depth ranges (0–5 and 5–10 cm) using a hollow, 10 cm stainless steel cannula drilled with 1 mm diameter pores at intervals of 3 mm [45]. Extracted porewater was passed promptly through a 0.45 µm pore filter on site and then stored in a vial out of sunlight at 0 °C (chilled by slush ice), before freezing on return to shore base within 3 h. One 50 mL vial and one 15 mL vial of porewater was extracted per plot; the first for nutrient analysis and the second for hydrogen sulfide analysis. Two drops of zinc acetate were added to 15 mL vials prior to sampling to capture free sulfides as ZnS precipitate (APHA 4500-S2-D). Adjacent to each transect at least two redox potential (Eh) profiles were measured with readings taken at 0, 2, 4, 6, and 8 cm depths. A platinum redox electrode was used to measure potential versus an Ag/AgCl reference electrode filled with 3M KCl solution. Field observations showed that most seagrass roots and rhizomes were confined to the upper 4 cm of the substrate, and we define this as the root zone (RZ). Average RZ Eh was calculated as the mean of 0, 2, and 4 cm values.
Sensors were deployed for long term (months) monitoring of PAR, temperature, and water level. An ECOPAR™ sensor by Sea-Bird Scientific, Bellevue, WA, USA, (http://www.seabird.com/ecopar) was deployed at one site in each of HS, PS, and ES habitats to directly measure PAR (mol m−2 d−1). To address variability within habitats, HOBO loggers by Onset Computer Corporation, Bourne, MA, USA (http://www.onsetcomp.com/), measuring luminous flux (lux) and temperature, were deployed adjacent to the first plot at each site. Luminous flux was converted to PAR following [46] as validated by running each Hobo logger alongside a calibrated ECO-PAR sensor [47]. A U20L water level data logger (http://www.onsetcomp.com/) was deployed at one site in each habitat to record water level.
Loggers were deployed from 23 August 2018 to 3 October 2018 (winter) and from 8 February 2019 to 21 March 2019 (summer), in both cases covering a complete lunar cycle with the aim of characterizing every possible tidal exposure. Water level data were used to calculate the periods of immersion and emersion and the received PAR was calculated separately for these two periods using the different in-water and out of water calibration factors supplied by the manufacturer for each ECOPAR instrument. We also calculated mean daily PAR. Unfortunately, HOBO loggers were lost from sites HS2, PS4, and PS5 in winter and PS3, PS5, and HS1 in summer, potentially due to exposure to public during spring tides.

2.3. Laboratory Analysis

In the laboratory we homogenized each substrate sample over the 0–10 cm depth range and subsamples were used for analysis. Substrate organic matter content (% OM) was estimated as weight loss-on-ignition through combustion (450 °C for 4 h) [48] and bulk density (g m−3) was determined as weight of dry solids in a known pre-determined substrate volume. Grain size was measured using a laser diffraction particle size analyzer (Malvern Mastersizer 2000) over the particle size range 0.05–2000 μm [49]. We used grain size categories as defined by [50], and defined mud (silt + clay) as <63 µm particles. Porewater samples were analyzed for dissolved inorganic nutrients: nitrate NO₃, nitrite NO₂, ammonium NH4+, and phosphate PO4³ ion concentrations using standard colorimetric techniques on a Lachat Quick Chem 8000 series flow injection analyzer (FIA) + (Zellweger Analytics Inc., Milwaukee, WI 53218, USA).
Seagrass cover was estimated to the nearest 5% by visual inspection of photographs following the approach recommended by [5]. Shoot density was determined by counting the number of seagrass shoots in each core. Plant material was extracted from each core, rinsed with water, and separated into above-ground biomass (AGB—shoots and leaves) and below-ground biomass (BGB—roots and rhizomes), respectively. Plant samples were dried at 80 °C to constant weight to determine biomass per unit area (g m−2) [5].

2.4. Hydrodynamic Model Results and Background Information for Study Sites

We used an existing hydrodynamic model for Porirua Harbour [51] to characterize hydrodynamic condition. The model predicts current velocity, wave period, wave height, salinity, and suspended sediment concentration (SSC) across both arms of the harbour, at 30 min intervals and was validated with field monitoring [51]. The model uses wind, precipitation, and insolation as meteorological drivers, and we summarized predictions for 2010, which is considered a typical year, with existing bathymetry. Predictions were averaged to provide annual mean (± SE) values for each modelled characteristic.
Current velocity, wave period, and salinity were predicted to be similar at ES and PS, and higher in comparison with HS. In contrast, SSC and sediment deposition rates were predicted to be significantly lower at ES and PS compared to HS (Table 1).

2.5. Data Analysis

Statistical analysis of data was performed using the R statistical package (RStudio Team 2015) Boston, MA, USA. Normality of data was tested, and parameters were log-transformed to reduce skewness if appropriate. Mean values are presented with standard errors of the mean (mean ± SE). Two way-analysis of variance (ANOVA) (with post-hoc Tukey HSD tests) [52] was used to detect significant differences in seagrass traits, PAR, and substrate properties between habitats and seasons. Pearson’s product-moment correlation coefficients were calculated to indicate associations between habitat and seagrass variables, and, where nonlinear relationships were apparent, we applied logistic or logarithmic (power-law) models, and report goodness of fit (R2).

3. Results

3.1. Substrate Conditions

Substrate grain size composition showed no summer–winter differences, but significant differences between HS and both ES and PS habitats. These last two did not differ significantly from each other (Table 2). HS sites had high average substrate mud contents (33.8–38.8%), compared to ES and PS (average values ranging from 11.1–15.3% and 10.3–13.6%, respectively) (Table 2). Sand was the dominant size fraction at ES and PS, whereas HS has significantly lower fine sand content and more coarse sand, particularly in winter (Figure 2).
A principal component analysis (PCA) of grain size category distribution across sites separates HS from ES and PS primarily along Axis-1 which correlates with mud vs. fine sand. Axis-2 correlates with coarse sand, which was, on average, higher and more variable at HS than other habitats. Amongst HS sites, HS2 was notably higher for coarse sand, reflecting proximity to an inflowing stream. Overall the PCA showed greater heterogeneity of grain size among HS than either PS or ES, (which were not significantly different). HS had a strong tendency for a high proportion of very fine particles, and relatively low fractions of intermediate-sized particles (sand and fine sand) (Figure 2).

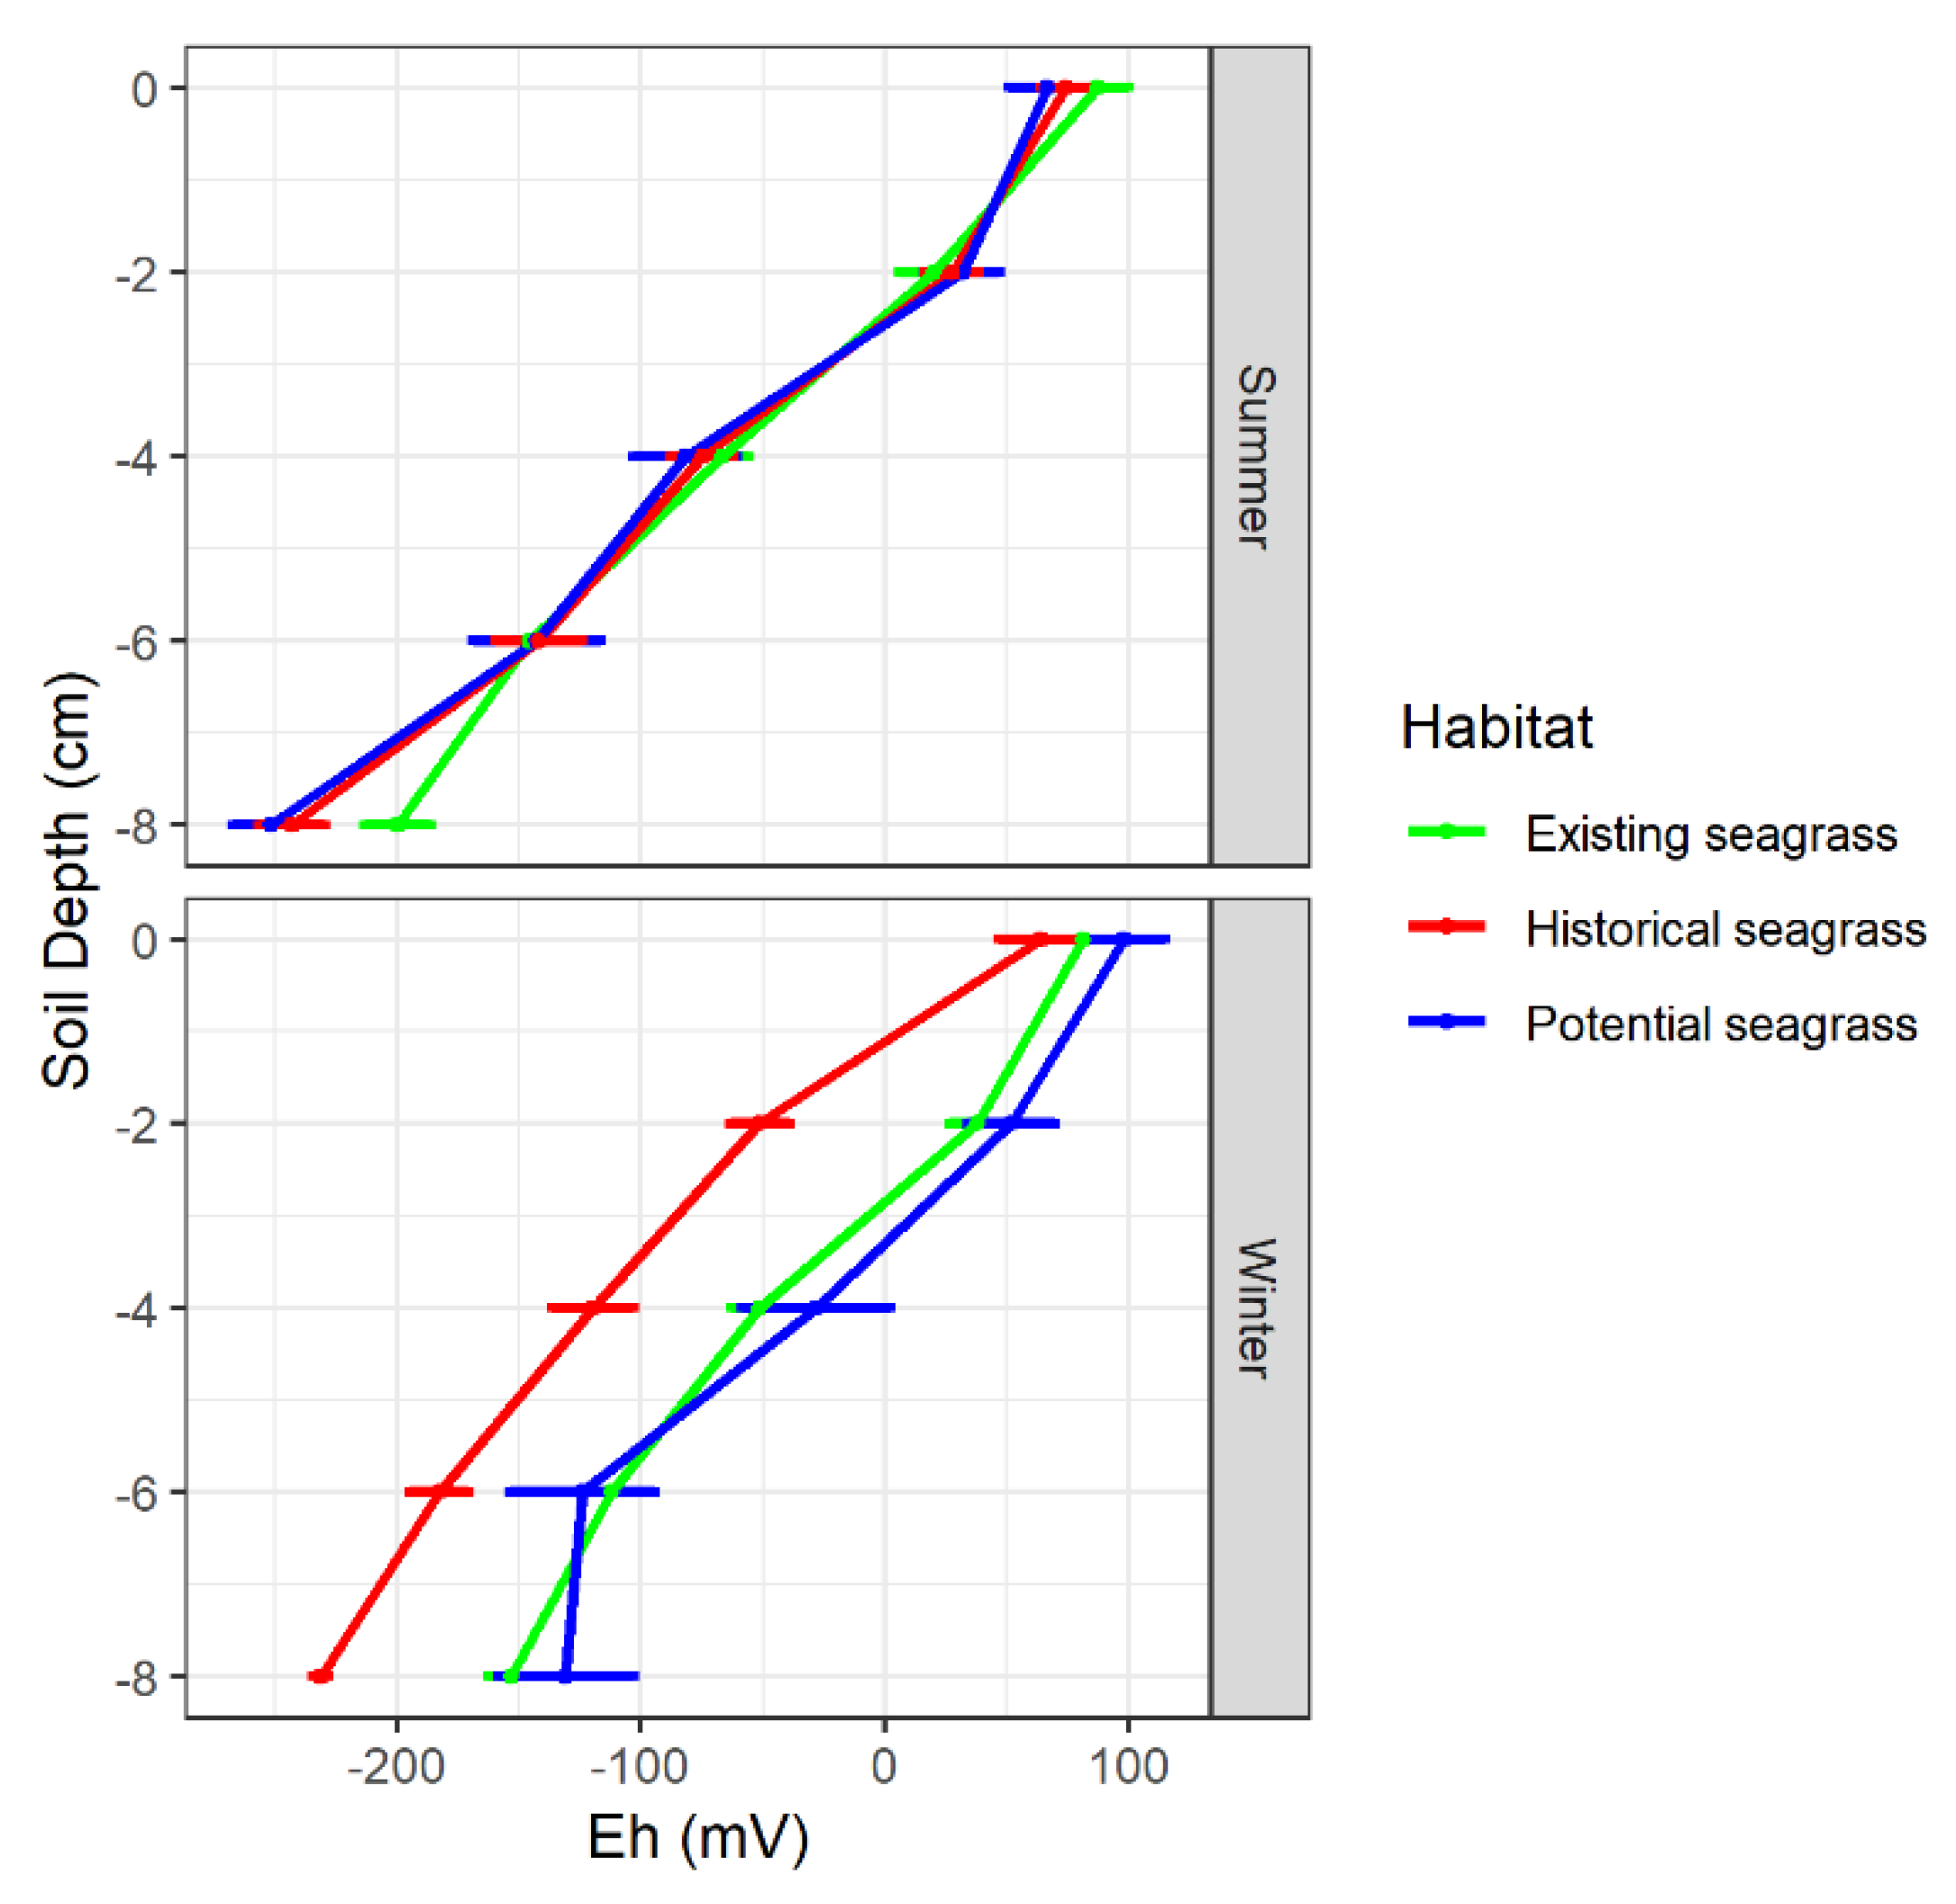
3.2. Substrate Bulk Density, Organic Matter and Redox Potential

Substrate bulk density was higher at HS than PS and ES (the last two were similar) and substrates at all sites were somewhat denser in summer than in winter (Table 2). The latter could indicate compaction of sediments under drier summer conditions. Substrate organic content was significantly higher at HS and ES than PS. HS had significantly higher organic content compared to ES during winter and significantly lower during summer (Table 2). These patterns suggest organic content at ES is related to seagrass productivity during summer, whereas organic content at HS is linked to catchment runoff and fine sediment (and organic) inputs during generally wetter winters [37].
Redox (Eh) profiles all had similar gradients but were more negative at HS than at PS and ES during winter (Figure 3). Profiles were very similar for all habitats in summer (Figure 3). Eh values became negative between 0 and 2 cm depth for HS in winter, while in summer, and in both seasons for PS and ES, negative values commenced at greater depth, between 2 and 4 cm (Figure 3). ES and PS habitats root zone’s Eh values showed a range from −45 to −20 mV whereas all HS root zone readings were below −45 mV.

3.3. Porewater Chemistry

Porewater analyses for NO₃ and NO₂ were below detection limits (<0.01 µM) at all sites, in both seasons and at both depth ranges. Overall, PO4³ was lower in PS than either HS or ES, which were similar. In winter PO4³ was lower near the surface in all habitats. Deeper (5–10 cm) PO4³ concentrations varied little from winter to summer, and were similar to near-surface (0–5 cm) values in summer. A similar seasonal depth pattern emerged for both NH4+ and sulfide, with concentrations at depth similar in both winter and summer, but with near-surface (0–5 cm) values significantly lower in winter. NH4+ was similar at ES and PS but was considerably higher for all date/depth combinations in the HS habitat. Hydrogen sulfide tended to have lower concentrations at PS than either HS or ES habitats, which were similar (Table 3).

3.4. Photosynthetically Available Radiation (PAR)

The PAR data shows that all habitats receive >90% of their daily PAR dose while emerged (Table 4) reflecting high irradiance attenuation in the (often muddy) water during submersion under higher than mid-tide water levels. During winter, total PAR (submerged + emerged) increased from ES, through PS to HS, whereas in summer this order was reversed (Table 4). The last is surprising, and the summer PAR values might be biased (low) because of shading of sensors due to fouling by drifting macroalgae (Ulva sp.) that were frequently observed during field work in this season. Data as a timeseries plot and the number of days below a daily average compensation irradiance level (CI) are shown in Supplementary materials, Table S2.
HS also experienced a higher number of days in winter and in summer when total PAR availability was on average below a CI of 3.9 mol m−2 d−1 for Zostera muelleri based on the reported value of 45 µmol m−2 s−1 [53] (Table 4).

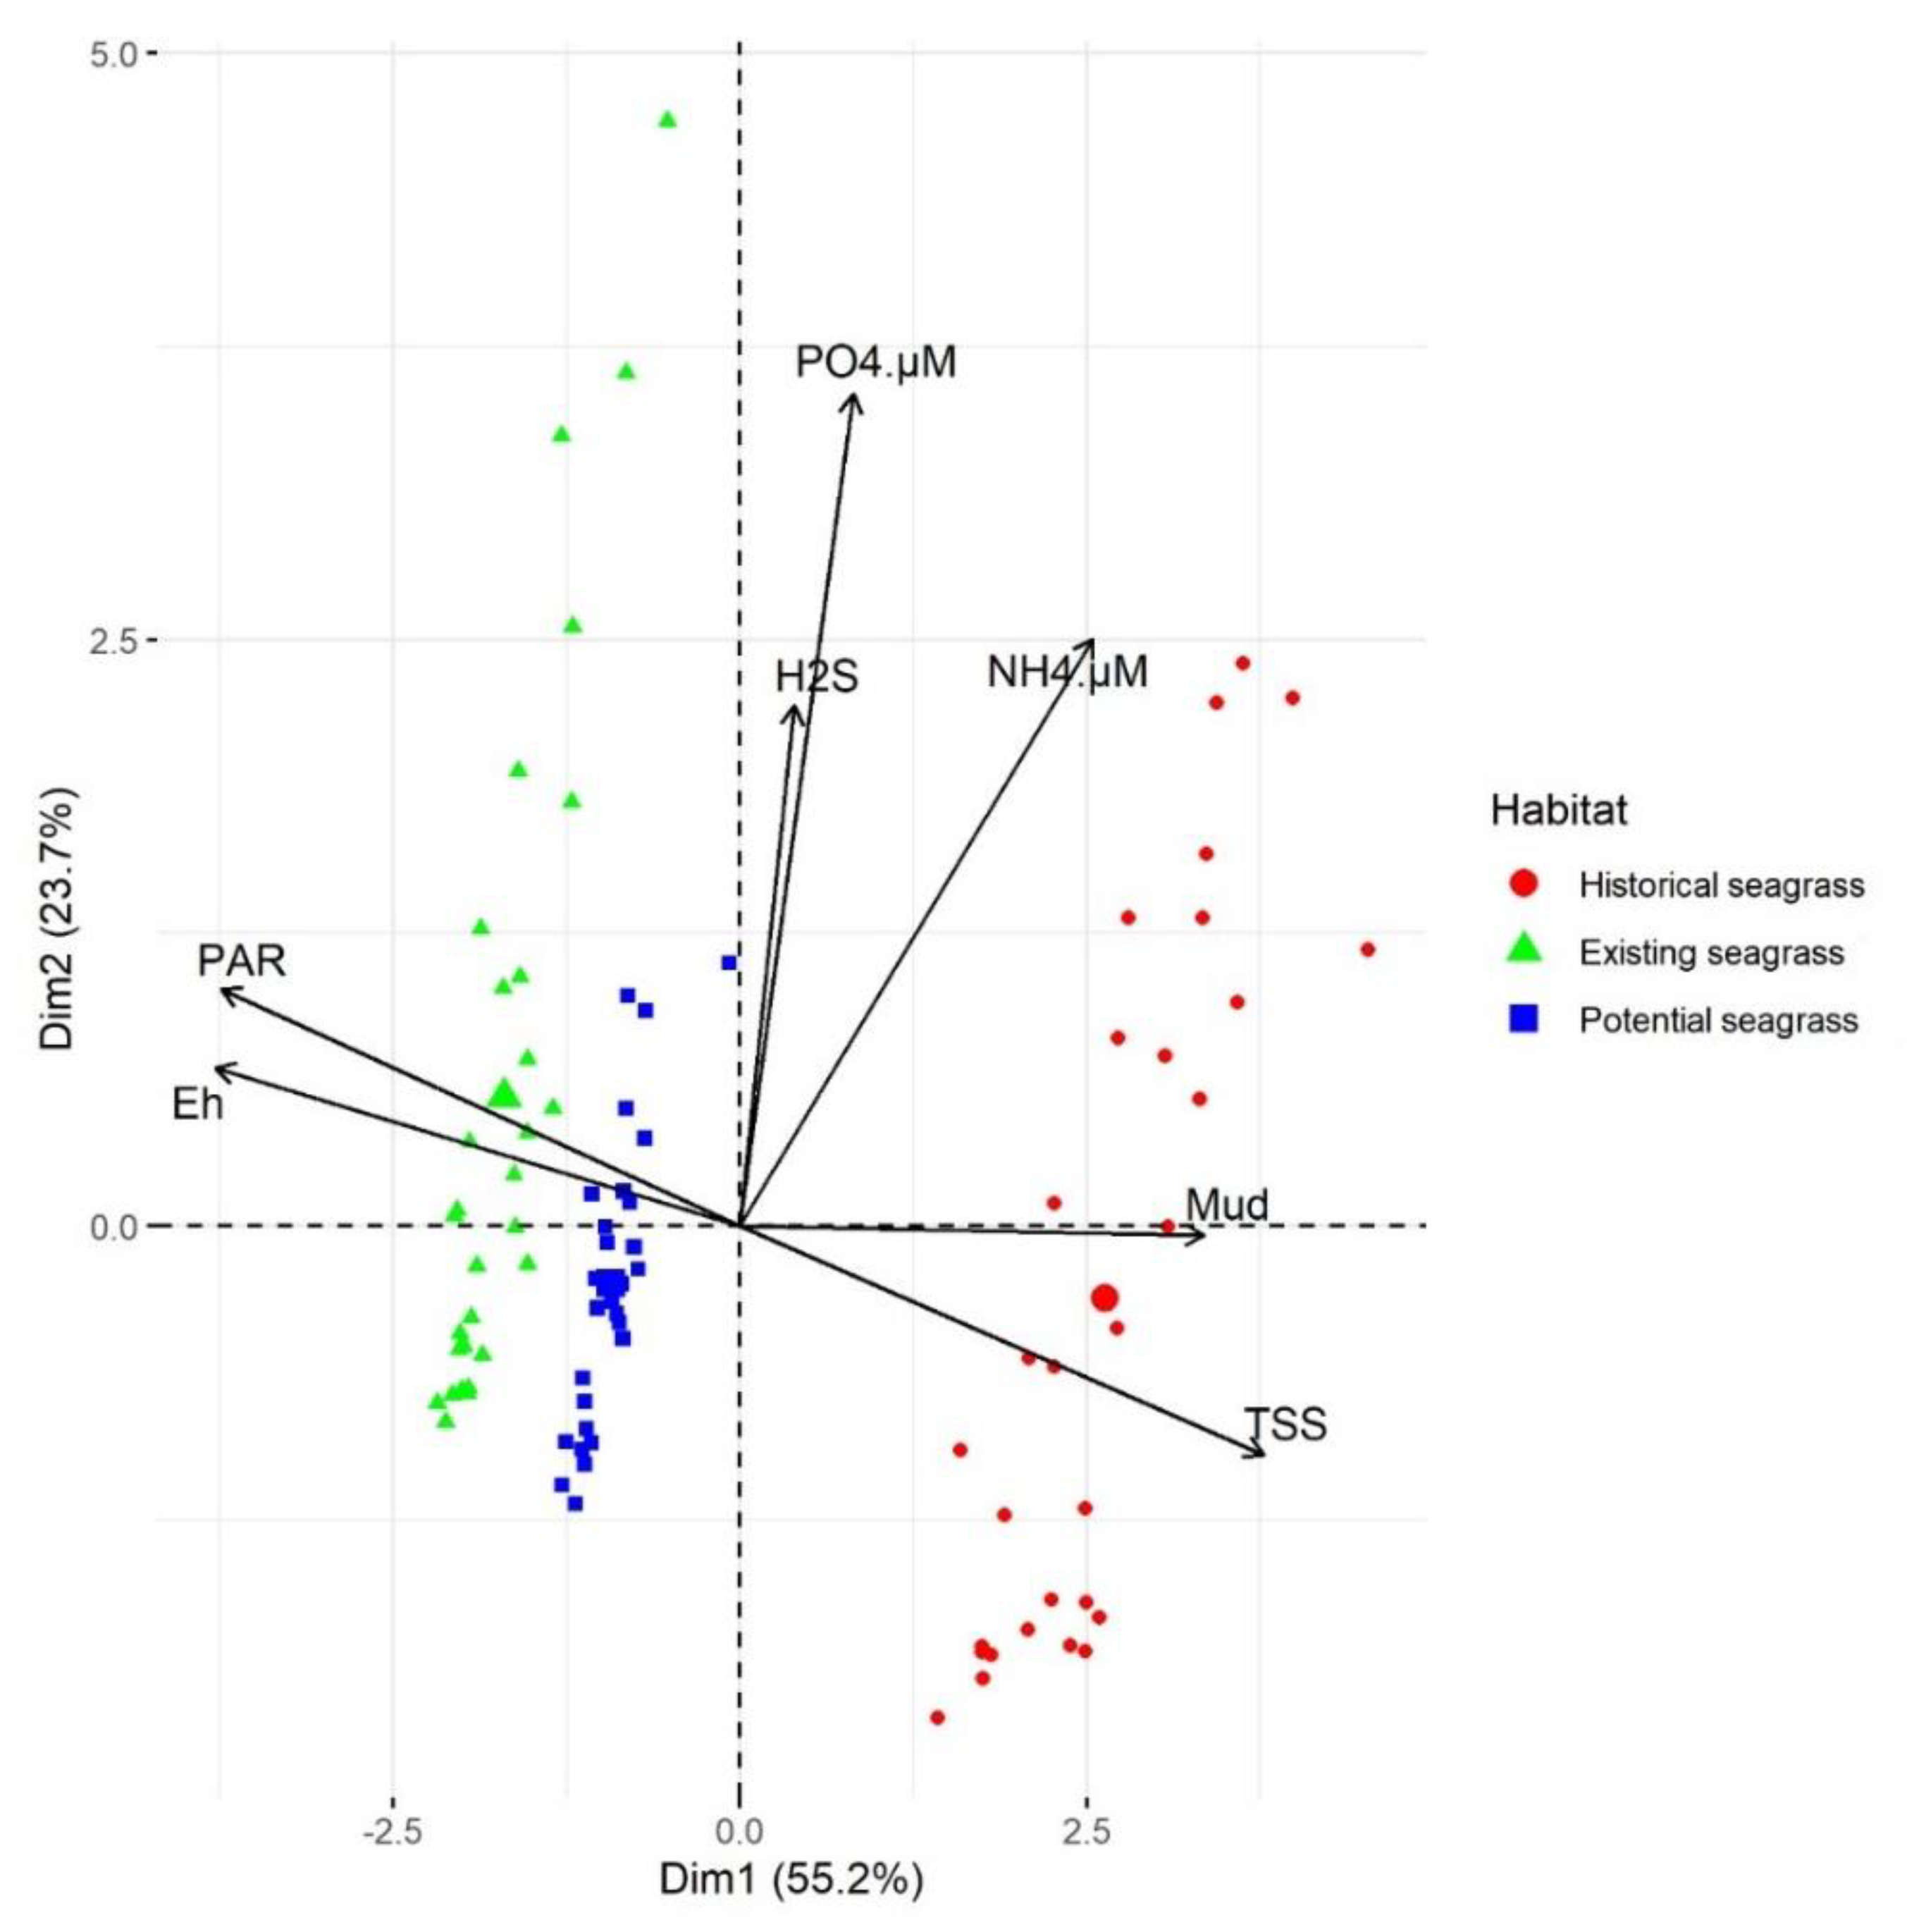
3.5. Relationship of Habitat to Substrate Characteristics and PAR

A PCA ordination of all independent variables effectively segregates the three habitats along PCA axis 1, which is linked to % mud, total suspended solids (TSS), total PAR, and Eh (Figure 4). HS sites had high muddiness and suspended sediment concentrations (and low Eh and PAR) whereas sites in PS and ES habitat had lower muddiness and higher PAR and redox potential. PCA Axis 2 separates mostly within habitat, and is driven by variation in porewater chemistry. The degree of scatter along this axis indicates more variability in porewater chemistry within ES and HS than PS.

3.6. Seagrass Traits

At ES sites seagrass cover ranged from 10% to 95%, shoot density from 172 to 700 shoots m−2, and total biomass from 33 to 243 g m−2 (Table 5). Below-ground biomass was always higher than above-ground biomass with the average summer and winter BGB:AGB ratio varying slightly (15.9 versus 17.9, differences not significant). BGB and total biomass were significantly higher in summer (average 150.7 g m−2) than in winter (87.8 g m−2), whereas AGB was not significantly higher in summer than in winter.

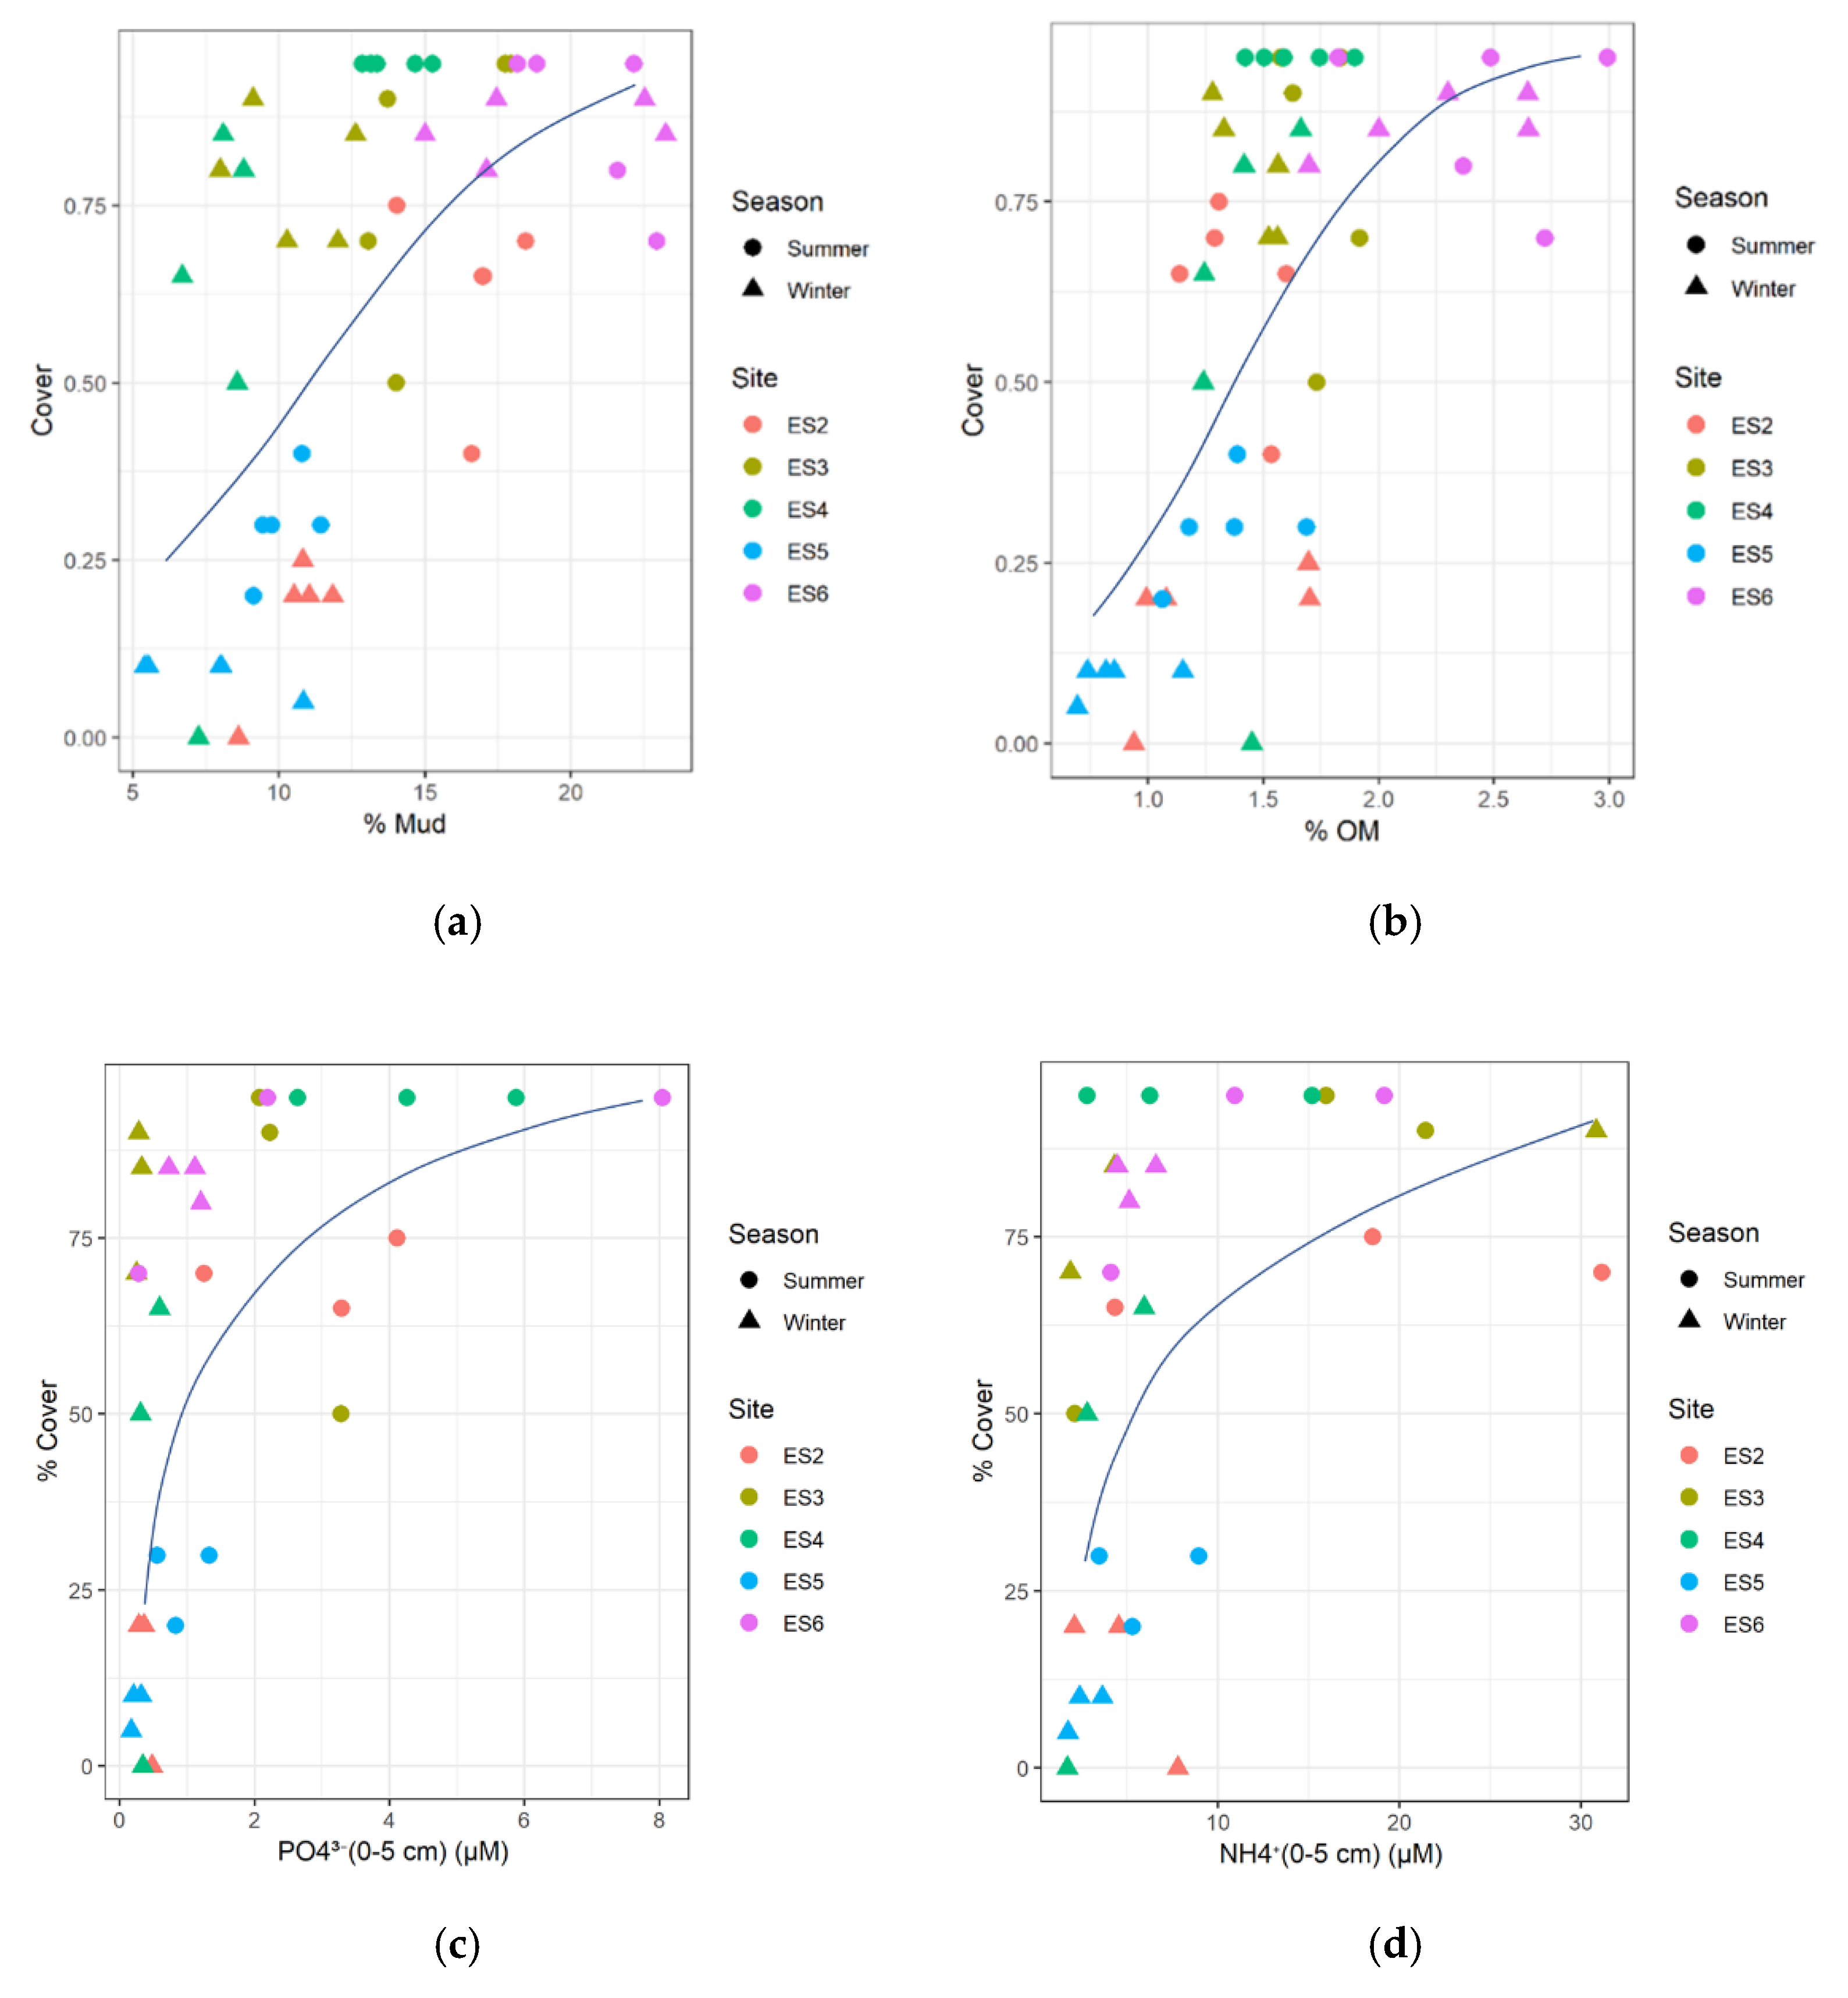
3.7. Seagrass Relationships with Substrate Conditions

Seagrass cover increase was associated with an increase in percent mud, percent OM, and recycled dissolved inorganic nutrients. Percentage of mud and percent OM followed a logistic relationship (Figure 5a,b) whereas a saturation relationship was the best fit for porewater PO4³ and NH4+ (Figure 5d). Equations are shown in Supplementary materials. Maximum seagrass cover occurred where substrate mud content was in the range 13–23% and organic content 1.3–3% with optimums (maximum slope) of 13% mud and 1.3% OM. Porewater recycled nutrients followed saturation relationships with saturation concentrations of 2 and 8 µM for PO4³ and NH4+, respectively. None of the seagrass traits followed a significant relationship with PAR presumably because no ES sites were strongly light-limited. Mutual scatter plots between different biomass indices and substrate conditions, porewater chemistry are shown in the Supplementary materials, Table S4.

4. Discussion

Our study addresses relationships between seagrasses, light climate, fine sediment, and substrate conditions by comparing three habitats, HS where seagrass was present many years ago and has never recovered, ES where seagrass is currently present, and PS where seagrass has been present in recent years but is currently absent. We used these data to address two non-exclusive, hypothetical mechanisms for seagrass decline; light attenuation and substrate degradation.
HS substrates had significantly higher mud content (34–39%), bulk density (1.3–1.6 g cm³), porewater ammonium concentration (13–72 µM), a more reduced redox profile (negative redox at 2 cm soil depth), and higher (modelled) sedimentation rates (6 mm yr−1) than both PS and ES (which were broadly similar). Differences in substrate organic content were less clear, and while HS had significantly higher organic content than ES during winter the opposite pattern occurred during summer. PS substrate organic content was consistently lower than the other two sites, but again slightly, but significantly, lower in summer than in winter. We infer that during the warmer summer months the mineralization of organic matter in the two seagrass-free sites temporarily exceeds accumulation, while the summer growth in seagrass cover in ES habitat causes an increase in substrate OM. This summer observation of incremented OM in ES habitat concurred with a study performed at Puerto Morelos Mexico on the effects of Thalassia testudinum seagrass on substrate biogeochemistry [54]. Accumulation of phosphate and ammonium ions in the upper substrate at all sites during summer is consistent with increased mineralization of OM in this season.
That the presence of seagrass is a significant source of organic material is supported by the higher substrate OM concentrations at ES than PS, and this is well established in the literature [55,56,57,58,59,60]. That the organic content at ES exceeds that at HS at times, suggests that the amount of organic material per se does not exclude seagrass at HS. The simplest explanation of the more reduced substrate at HS, and the accumulation of reduced chemical species, is reduced diffusivity accompanying the higher proportion of mud (and greater bulk density implying lower pore space) at HS compared to the ES substrate. Under seagrass, root oxygen release [24,25,26,28,61], together with enhanced burrowing by invertebrates, mainly bivalves such as Austrovenus stutchburyi and Macocoma liliana [62,63,64] are processes expected to make redox potential less negative.
Unfavorable alterations to substrate chemistry as a result of fine sediment deposition is a likely cause of the failure of seagrass to colonize at HS while persisting at ES. Our results suggest that the significantly higher mud content, bulk density, and more reduced conditions of the substrate at HS, is likely to be associated with a lower availability of interstitial oxygen compared to substrates at ES and PS. A poor substrate oxygen status, linked to denser substrates and higher oxygen-demanding organic matter content, can affect the capability of seagrasses to grow and is a potential cause of seagrass demise [65]. Nevertheless, there appear to be strong differences between species in their ability to tolerate anoxia [25]. A Mediterranean species Cymodocea nodosa did not die after sucrose additions to generate anoxia, in a manipulative experiment, and temperate Zostera marina did not show leaf growth reduction until 2 months post treatment. However, Thalassia hemprichii suffered mortality in a multi-specific meadow under a similar experimental regime [25]. Substrate redox values previously measured in substrates under seagrass ranged from −108 to 55 mV in three New Zealand estuaries [31]. At HS in Pāuatahanui Inlet we measured values ranging from −230 to 70 mV and −50 mV at a substrate depth of just 2 cm below the surface indicating very reducing conditions. The redox values are also lower than the typical range reported for seagrass substrates of −100 and 200 mV in the first 10 cm of the substrate by [25].
Despite the more reducing conditions in HS substrates in winter we did not find consistently increased concentrations of hydrogen sulfide and phosphate, which tend to accumulate under these conditions [26,27,28]. However, ammonium ion concentrations were higher in HS than other habitats in both seasons. In marine substrates, sulphate reduction is a major pathway for the mineralization of the organic matter leading to production of hydrogen sulfide [8,57]. However, our results for porewater hydrogen sulfide analysis showed values under 4 µM at all sites, which is below the 10 and 13 µM thresholds considered to trigger decline in seagrasses [66,67]. This may be explained by high concentration of iron II (Fe2+), which reacts with sulfide to form stable precipitates [68], and iron-rich substrates have low hydrogen sulfide, hence low toxicity for seagrass [69]. HS substrate samples were noticeably dark, suggesting the presence of iron sulfide. Iron solubilization (Fe³+ → Fe2+) occurs at −47 mV redox potential which seems consistent with the values of Eh at PS and ES. Levels of iron in Pāuatahanui Inlet were typical of other New Zealand estuaries [37,70,71]. However, further research into iron–sulphide interactions seems desirable. Potentially phytotoxic heavy metals such as zinc, lead, ferrous iron, and copper bound to ferric oxy-hydroxides are released when Fe (III) is reduced and may also be implicated in sediment toxicity [72]. Chromium, copper, lead, and zinc were determined to have maximum values of 1.68, 1.1, 3.3, 9.7 mg L−1, respectively, at other sites in Pāuatahanui Inlet [73]. These copper and lead concentrations exceed the reported thresholds of 1 mg L−1 reported to have incipient effects on seagrass physiological traits [72].
For the ammonium ion, which is the most common form of N in pore waters of New Zealand estuaries [74], concentrations at HS (up to 71 µM) were higher than at ES and PS and no seagrass was found to thrive at sites over 30.8 µM. However, concentration at all sites were below levels considered phytotoxic for the related species Z. nolti 200–4000 µM; [75,76]. Therefore, direct hydrogen sulfide and/or ammonium ion phytotoxicity appears unlikely to have contributed to seagrass loss and failure to re-establish at HS in Pāuatahanui Inlet. That lack of apparent influence of sulfide and ammonia is consistent with the PCA plot for different sites showing strong separation of habitat along ‘mud’ gradients, but separation along pore-water chemistry only within habitats.
Nevertheless, the reducing HS substrates implies that, for seagrasses to recolonize, high release of oxygen into the rhizosphere would be required to oxygenate it which, in turn, implies an increased light demand. This effect may be preventing the establishment of different seagrass species in other coastal locations around the world such as the Mediterranean Sea, Southeast Asia, the North Sea [25], and other areas which may be under duress of fine sediment pollution. Degradation of the oxic-microshield protecting the vital basal meristems may be the initial external chemical mechanism behind seagrass die-off events in highly reduced marine substrates [24], such as HS in Pāuatahanui Inlet.
Reduced underwater PAR availability is often considered the leading cause of seagrass decline in estuaries suffering high sediment pollution. Increased suspended sediment loads to coastal waters have an indirect negative effect on seagrasses by reducing the available PAR penetrating through the water to the seabed [6,17]. The Pāuatahanui Inlet study sites were located in the intertidal zone, whereas many studies that have implicated light limitation have been carried out at subtidal locations or with specimens cultivated in permanently submerged conditions [11,12,77,78]. In intertidal locations, the irradiance during the emerged periods is much higher than when submerged (by ca. 10-fold in winter and 12-fold in summer, in our study) which can compensate for poor light penetration of muddy water during immersion. Being at the same tidal height, we found no significant differences in emerged irradiance between the three habitats in either summer or winter. Any effect of sediment mediated through attenuation of downwelling irradiance therefore must be expressed in the submerged irradiance, which was lowest at HS habitats during winter (but not summer), and highest in the ES habitat, perhaps reflecting both proximity of sediment sources (to HS) and the capacity of seagrasses (at ES) to enhance sedimentation and thus generate a clearer overhead environment [79]. The efficiency of PAR use under submerged and emerged conditions becomes critical in evaluating the role of PAR limitation, since the effect of the elevated fines on seagrass light climate at HS sites appears to be relatively small and seasonal.
Daily emerged PAR dose has been proven to be key to providing resilience to inter-tidal seagrasses [80,81,82]. However, at HS PAR during emersion was high and yet seagrass has not re-stablished there suggesting that emerged production cannot sustain the plants or, more likely, that other factors are dominant. Considering the submerged irradiance, the average winter value for HS is close to the PAR determined at maximum depth limit for subtidal specimens of this species, in winter, in Kaipara Harbour (2.1 ± 0.19 mol m−2d−1) [78]. However, our sites in Pāuatahanui Inlet, including HS, experience on average at least this amount of PAR when submerged and a higher amount when emerged, thus leading to an expectation of total net photosynthetic gains, year round [81]. Furthermore, total PAR at HS, ES and PS exceeds the CI value of 3.9 mol m−2d−1 reported by [53], (by at least ca. 12-fold at both seasons). Light availability alone therefore does not appear to explain the failure of seagrass to re-establish, at HS in Pāuatahanui Inlet.
In addition to alteration to substrate physico-chemistry and low winter submerged PAR availability, periodic smothering of seagrass plants by sedimentation events may have also contributed to seagrass loss, and failure to recover, at HS. Recently settled fine sediment within nepheloid layers not only shades seagrass [22] but may also exert an oxygen demand and inhibit oxygen transfer so contributing to deoxygenation. Seagrass was present at HS around 1980 [35] but disappeared sometime afterwards [36]. A large sedimentation event occurred in 1981 which delivered a sediment load of about 40,000 tons to the inlet [51]. It was linked to a particularly wet spring and winter and to a large rainfall event during May (150 mm in a week). It is plausible that this event may have caused an acute and catastrophic loss of seagrass from the inner part of the inlet, where plants have not subsequently re-established. However, it is also apparent that HS continues to experience chronically elevated fine sediment. The rate of sediment accumulation in most NZ estuaries under natural conditions is below 1 mm yr−1 [42]. However, HS is predicted to experience fine sediment deposition of about 6 mm yr−1 compared to rates of 3.6 and 1.2 mm yr−1 at ES and PS, respectively. Moreover, forcing might be highly nonlinear such that extreme windstorms or large floods may be disproportionally important as regards consequent suspended sediment ‘climate’ and therefore must be further considered [83].
Intertidal flats of relatively undeveloped estuaries with healthy seagrass meadows are typically characterized by sandy substrates with minimal mud content [31]. We showed here that multi stressor effects of mud are strong determinants of seagrass growth and persistence. Moreover, fine sediment often interacts with other factors such as nutrient enrichment leading to increased organic matter which may interact with mud loading by both increased shading by phytoplankton and epiphytes and extra oxygen demand, further complicating seagrass response [84,85].
We also showed that seagrass grew at ES sites throughout the year, but plant cover, shoot density, and biomass were 1.4-fold, 1.5-fold, and 1.7-fold higher, in summer than in winter. For ES sites maximum seagrass cover occurred in an intermediate range of substrate mud content ranging from 13% to 23%. Substrate grain size has been proposed as an influence on seagrass growth [67,86,87,88,89,90,91,92]. The substrate mud range (13–23%) in which seagrass grows in Pāuatahanui Inlet is higher than the silt (3.9 < 63 µm) threshold determined for this species in another New Zealand estuary, Tauranga Harbour, of 13% [92]. However, we note that our measurements are for a substrate depth of 0–10 cm whereas samples taken in Tauranga Harbour are for the 0–2 cm depth range (Table 6) so results are not directly comparable. Nevertheless, this suggest that Zostera muelleri may have a broader tolerance for mud than we thought, initially, based on the Tauranga experience. This suitable substrate muddiness range is local and may vary for different estuaries depending on the nature of the mud and interaction with other stressors, for example presence of other particle sizes, percent OM, oxygen demand, and pore water condition. Studies in other countries report a wide range of substrate muddiness thresholds ranging from 13% to 70% (Table 5), but note differences in depth of substrate sampled. Furthermore, tolerances of seagrasses to substrate muddiness are likely to vary between species and between geographical locations due to interactions with other biogeochemical characteristics of the substrates [67].

5. Conclusions

We attribute loss of the seagrass, Zostera muelleri, from some habitats in Pāuatahanui Inlet to pollution with fine sediment, which exerts multiple stresses, particularly deoxygenation of the root zone. Light exposure does not appear to be an important factor limiting inter-tidal seagrass—which get sufficient PAR during emergence even where very muddy waters attenuate light strongly during submerged periods. Nor do toxic materials such as sulfide in porewaters appear to be implicated. However, further research combined with determination of concentration of potentially phytotoxic heavy metals is desirable. We recommend further experiments to isolate mechanisms of mud damage to seagrass and to improve our understanding of its interactions with other factors such as light deprivation and eutrophication. This will assist policy makers to better manage this pollutant for seagrass protection and restoration when considering mitigation and remediation strategies. The results of this study highlight the critical importance of catchment strategies that reduce fine sediments to estuaries.

Supplementary Materials

The following are available online at https://www.mdpi.com/2077-1312/8/9/645/s1, included with this manuscript submission.

Author Contributions

Conceptualization, I.Z.-M.; F.E.M.; M.M.-H. and I.H.; methodology, I.Z.-M.; validation, F.E.M.; M.M.-H.; I.H. and R.J.D.-C.; formal analysis, I.Z.-M.; investigation, I.Z.-M.; resources, F.E.M.; R.J.D.-C.; data curation, I.Z.-M.; writing—original draft preparation, I.Z.-M.; writing—review and editing, F.E.M.; M.M.-H.; I.H.; R.J.D.-C. and M.O.; supervision, I.H.; F.E.M. and M.M.-H. project administration, F.E.M. and R.J.D.-C.; funding acquisition, I.H.; F.E.M. and R.J.D.-C. All authors have read and agreed to the published version of the manuscript.

Funding

This research was funded by the Strategic Science Investment programme Managing Mud from National Institute of Water and Atmospheric Research NIWA, grant number FWCE2011 and the APC was funded by NIWA and University of Waikato. We also acknowledge the Greater Wellington Regional Council for supporting this work with its Science and Research Fund.

Acknowledgments

We thank Andrew Swales NIWA’s Managing Mud programme leader. NIWA-Wellington field staff: Peter Notman, Owen Anderson, and Warrick Lyon for field assistance. Margaret McMonagle (NIWA-Hamilton, Water Quality Laboratory staff) is thanked for helping with assays of sulfide on estuarine porewater samples. Rebecca Gibson (University of Waikato) for the help provided with nutrient analysis with FIA. We thank NIWA-Hamilton field surveyor Ron Ovenden for measuring elevation of study sites and John Oldman from DHI New Zealand for the aid with modelled hydrodynamics data. We extend our appreciation to four anonymous reviewers for their thoughtful comments and suggestions to improve our manuscript.

Conflicts of Interest

The authors declare no conflict of interest.

References

  1. Waycott, M.; Duarte, C.M.; Carruthers, T.J.B.; Orth, R.J.; Dennison, W.C.; Olyarnik, S.; Calladine, A.; Fourqurean, J.W.; Heck, K.L.; Hughes, A.R.; et al. Accelerating loss of seagrasses across the globe threatens coastal ecosystems. Proc. Natl. Acad. Sci. USA 2009, 106, 12377–12381. [Google Scholar] [CrossRef] [Green Version]
  2. Orth, R.J.; Carruthers, T.J.B.; Dennison, W.C.; Duarte, C.M.; Fourqurean, J.W.; Heck, K.L.; Hughes, A.R.; Kendrick, G.A.; Kenworthy, W.J.; Olyarnik, S.; et al. A Global Crisis for Seagrass Ecosystems. Bioscience 2006, 56, 987–996. [Google Scholar] [CrossRef] [Green Version]
  3. Burkholder, J.M.; Tomasko, D.A.; Touchette, B.W. Seagrasses and eutrophication. J. Exp. Mar. Biol. Ecol. 2007, 350, 46–72. [Google Scholar] [CrossRef]
  4. Cunha, A.H.; Marbà, N.; Van Katwijk, M.M.; Pickerell, C.; Henriques, M.; Bernard, G.; Ferreira, M.A.; García, S.; Garmendia, J.M.; Manent, P. Changing Paradigms in Seagrass Restoration. Restor. Ecol. 2012, 20, 427–430. [Google Scholar] [CrossRef]
  5. Short, F.T.; Coles, R.G. Global Seagrass Research Methods; Elsevier: Amsterdam, The Netherlands, 2001. [Google Scholar]
  6. Duarte, C.M. Seagrass depth limits. Aquat. Bot. 1991, 40, 363–377. [Google Scholar] [CrossRef]
  7. Dennison, W.C.; Orth, R.J.; Moore, K.A.; Stevenson, J.C.; Carter, V.; Kollar, S.; Bergstrom, P.W.; Batiuk, R.A. Assessing Water Quality with Submersed Aquatic Vegetation. Bioscience 1993, 43, 86–94. [Google Scholar] [CrossRef]
  8. Duarte, C.M.; Marbà, N.; Santos, R. What may cause loss of seagrasses. In European Seagrasses: An Introduction to Monitoring and Management; Borum, J., Duarte, C.M., Krause-Jensen, D., Greve, T.M., Eds.; The M&MS Project: Copenhagen, Denmark, 2004; Available online: http://www.seagrasses.org (accessed on 18 May 2020).
  9. Ralph, P.J.; Gademann, R. Rapid light curves: A powerful tool to assess photosynthetic activity. Aquat. Bot. 2005, 82, 222–237. [Google Scholar] [CrossRef]
  10. Adams, M.P.; Hovey, R.K.; Hipsey, M.R.; Bruce, L.C.; Ghisalberti, M.; Lowe, R.; Gruber, R.K.; Ruiz-Montoya, L.; Maxwell, P.S.; Callaghan, D.P.; et al. Feedback between sediment and light for seagrass: Where is it important? Limnol. Oceanogr. 2016, 61, 1937–1955. [Google Scholar] [CrossRef]
  11. Chartrand, K.M.; Bryant, C.; Carter, A.B.; Ralph, P.J.; Rasheed, M.A. Light Thresholds to Prevent Dredging Impacts on the Great Barrier Reef Seagrass, Zostera muelleri ssp. capricorni. Front. Mar. Sci. 2016, 3, 106. [Google Scholar] [CrossRef] [Green Version]
  12. Collier, C.J.; Adams, M.P.; Langlois, L.; Waycott, M.; O’Brien, K.R.; Maxwell, P.; McKenzie, L.J. Thresholds for morphological response to light reduction for four tropical seagrass species. Ecol. Indic. 2016, 67, 358–366. [Google Scholar] [CrossRef]
  13. Kirkman, H.; Kuo, J. Pattern and process in southern Western Australian seagrasses. Aquat. Bot. 1990, 37, 367–382. [Google Scholar] [CrossRef]
  14. Fourqurean, J.W.; Rutten, L.M. The impact of Hurricane Georges on soft-bottom, back reef communities: Site-and species-specific effects in south Florida seagrass beds. Bull. Mar. Sci. 2004, 75, 239–257. [Google Scholar]
  15. Suykerbuyk, W.; Bouma, T.J.; Govers, L.L.; Giesen, K.; De Jong, D.J.; Herman, P.; Hendriks, A.J.; Van Katwijk, M.M. Surviving in Changing Seascapes: Sediment Dynamics as Bottleneck for Long-Term Seagrass Presence. Ecosystems 2015, 19, 296–310. [Google Scholar] [CrossRef] [Green Version]
  16. Short, F.T.; Wyllie-Echeverria, S. Natural and human-induced disturbance of seagrasses. Environ. Conserv. 1996, 23, 17–27. [Google Scholar] [CrossRef]
  17. Erftemeijer, P.L.A.; Lewis, R.R.R. Environmental impacts of dredging on seagrasses: A review. Mar. Pollut. Bull. 2006, 52, 1553–1572. [Google Scholar] [CrossRef] [PubMed]
  18. Cabaco, S.; Santos, R.; Duarte, C.M. The impact of sediment burial and erosion on seagrasses: A review. Estuar. Coast. Shelf Sci. 2008, 79, 354–366. [Google Scholar] [CrossRef]
  19. Benham, C.F.; Jackson, E.L.; Beavis, S.G. Tolerance of tropical seagrasses Zostera muelleri and Halophila ovalis to burial: Toward an understanding of threshold effects. Estuar. Coast. Shelf Sci. 2019, 218, 131–138. [Google Scholar] [CrossRef]
  20. Ralph, P.; Durako, M.; Enríquez, S.; Collier, C.J.; Doblin, M.A. Impact of light limitation on seagrasses. J. Exp. Mar. Biol. Ecol. 2007, 350, 176–193. [Google Scholar] [CrossRef]
  21. Moore, K.A.; Wetzel, R.L.; Orth, R.J. Seasonal pulses of turbidity and their relations to eelgrass (Zostera marina L.) survival in an estuary. J. Exp. Mar. Biol. Ecol. 1997, 215, 115–134. [Google Scholar] [CrossRef]
  22. Pedersen, T.M.; Gallegos, C.; Nielsen, S.L. Influence of near-bottom re-suspended sediment on benthic light availability. Estuar. Coast. Shelf Sci. 2012, 106, 93–101. [Google Scholar] [CrossRef]
  23. Bainbridge, Z.; Lewis, S.; Bartley, R.; Fabricius, K.; Collier, C.J.; Waterhouse, J.; Garzon-Garcia, A.; Robson, B.; Burton, J.; Wenger, A.S.; et al. Fine sediment and particulate organic matter: A review and case study on ridge-to-reef transport, transformations, fates, and impacts on marine ecosystems. Mar. Pollut. Bull. 2018, 135, 1205–1220. [Google Scholar] [CrossRef] [PubMed]
  24. Brodersen, K.E.; Hammer, K.J.; Schrameyer, V.; Floytrup, A.; Rasheed, M.A.; Ralph, P.J.; Kühl, M.; Pedersen, O. Sediment Resuspension and Deposition on Seagrass Leaves Impedes Internal Plant Aeration and Promotes Phytotoxic H2S Intrusion. Front. Plant Sci. 2017, 8, 657. [Google Scholar] [CrossRef] [PubMed] [Green Version]
  25. Terrados, J.; Duarte, C.M.; Kamp-Nielsen, L.; Agawin, N.; Gacia, E.; Lacap, D.; Fortes, M.; Borum, J.; Lubanski, M.; Greve, T. Are seagrass growth and survival constrained by the reducing conditions of the sediment? Aquat. Bot. 1999, 65, 175–197. [Google Scholar]
  26. Borum, J.; Pedersen, O.; Greve, T.M.; Frankovich, T.A.; Zieman, J.C.; Fourqurean, J.W.; Madden, C.J. The potential role of plant oxygen and sulphide dynamics in die-off events of the tropical seagrass, Thalassia testudinum. J. Ecol. 2005, 93, 148–158. [Google Scholar] [CrossRef]
  27. Koch, M.; Schopmeyer, S.; Kyhn-Hansen, C.; Madden, C. Synergistic effects of high temperature and sulfide on tropical seagrass. J. Exp. Mar. Biol. Ecol. 2007, 341, 91–101. [Google Scholar] [CrossRef]
  28. Brodersen, K.E.; Nielsen, D.A.; Ralph, P.J.; Kühl, M. Oxic microshield and local pH enhancement protects Zostera muelleri from sediment derived hydrogen sulphide. New Phytol. 2014, 205, 1264–1276. [Google Scholar] [CrossRef] [Green Version]
  29. Green, E.P.; Short, F.T. World Atlas of Seagrasses; University of California Press: Berkeley, CA, USA, 2003. [Google Scholar]
  30. Thrush, S.; Hewitt, J.; Cummings, V.; Ellis, J.; Hatton, C.; Lohrer, A.; Norkko, A. Muddy waters: Elevating sediment input to coastal and estuarine habitats. Front. Ecol. Environ. 2004, 2, 299–306. [Google Scholar] [CrossRef]
  31. Matheson, F.E.; Schwarz, A.-M. Growth responses of Zostera capricorni to estuarine sediment conditions. Aquat. Bot. 2007, 87, 299–306. [Google Scholar] [CrossRef]
  32. Morrison, M.A.; Lowe, M.; Parsons, D.; Usmar, N.; McLeod, I. A Review of Land-Based Effects on Coastal Fisheries and Supporting Biodiversity in New Zealand; New Zealand Aquatic Environment and Biodiversity Report No. 37; Ministry of Fisheries: Wellington, New Zealand, 2009; p. 100. Available online: http://fs.fish.govt.nz/Page.aspx?pk=113&dk=22003 (accessed on 6 July 2020).
  33. Inglis, G. Seagrasses of New Zealand. In World Atlas of Seagrasses; Green, E.P., Short, F.T., Eds.; University of California Press: Berkeley, CA, USA, 2003; pp. 148–157. [Google Scholar]
  34. Matheson, F.E.; Lundquist, C.; Gemmill, C.E.; Pilditch, C. New Zealand seagrass—More threatened than IUCN review indicates. Biol. Conserv. 2011, 144, 2749–2750. [Google Scholar] [CrossRef]
  35. Healy, W.B. Pāuatahanui Inlet: An environmental study; DSIR Information Series 141; Science Information Division: Wellington, New Zealand, 1980. [Google Scholar]
  36. Matheson, F.E.; Wadhwa, S. Seagrass in Porirua Harbour. In Preliminary Assessment of Restoration Potential. Report No. HAM2012-037; Prepared for Greater Wellington Regional Council; National Institute of Water and Atmospheric Research: Hamilton, New Zealand, 2012; p. 35. Available online: http://www.gw.govt.nz/assets/Seagrass-restoration-in-Porirua-Harbour.pdf (accessed on 8 March 2019).
  37. Blaschke, P.; Woods, J.; Forsyth, F. The Porirua Harbour and Its Catchment: A Literature Summary and Review; Porirua City Council: Porirua, New Zealand, 2010; p. 99.
  38. Milne, J.R.; Warr, S. Annual Coastal Monitoring Report for the Wellington Region; Report No GW/EMI-T-07/224; Environmental Monitoring and Investigation Department, Greater Wellington Regional Council: Wellington, New Zealand, 2007.
  39. Stevens, L.; Robertson, B. Porirua Harbour: Sediment Plate Monitoring 2015/16. In Report Prepared for Greater Wellington Regional Council; Wriggle Coastal Management: Nelson, New Zealand, 2016; p. 16. Available online: http://www.gw.govt.nz/assets/council-publications/Porirua-Harbour-Sediment-plate-monitoring-2016.pdf (accessed on 8 March 2018).
  40. Gibb, J.G.; Cox, G.J. Patterns and Rates of Sedimentation within Porirua Harbour; Porirua City Council: Porirua, New Zealand, 2009.
  41. Swales, A.; Bentley, S.; McGlone, M.; Ovenden, R.; Hermanspahn, N.; Budd, R.; Hill, A.; Pickmere, S.; Haskew, R.; Okey, M. Pauatahanui Estuary: Effects of Historical Catchment Landcover Changes on Estuary Sedimentation; National Institute of Water & Atmospheric Research Ltd.: Auckland, New Zealand, 2005. [Google Scholar]
  42. Townsend, M.; Lohrer, D. ANZECC Guidance for Estuary Sedimentation; Prepared for the Ministry for the Environment by NIWA; NIWA: Hamilton, New Zealand, 2015. [Google Scholar]
  43. Waycott, M.; Longstaff, B.J.; Mellors, J. Seagrass population dynamics and water quality in the Great Barrier Reef region: A review and future research directions. Mar. Pollut. Bull. 2005, 51, 343–350. [Google Scholar] [CrossRef]
  44. Duarte, C.M.; Fourqurean, J.W.; Krause-Jensen, D.; Olesen, B. Dynamics of Seagrass Stability and Change. In Seagrasses: Biology, Ecologyand Conservation; Larkum, A.W., Orth, R.J., Duarte, C.M., Eds.; Springer: Dordrecht, The Netherlands, 2007; pp. 271–294. Available online: https://doi.org/10.1007/978-1-4020-2983-7_11 (accessed on 1 May 2019).
  45. McGlathery, K.J.; Berg, P.; Marino, R. Using porewater profiles to assess nutrient availability in seagrass-vegetated carbonate sediments. Biogeochemistry 2001, 56, 239–263. [Google Scholar] [CrossRef]
  46. Thimijan, R.W.; Heins, R.D. Photometric, radiometric, and quantum light units of measure: A review of procedures for interconversion. HortScience 1993, 18, 818–822. [Google Scholar]
  47. Matheson, F.E.; Zabarte-Maeztu, I.; Mackay, G.; Middleton, C.; Oliver, M.; Griffiths, R.; Ovenden, R.; Davies-Colley, R.J. Estuary muddiness and seasonally low light constrains seagrass restoration. Mar. Pollut. Bull. (Under Review).
  48. Mook, D.H.; Hoskin, C.M. Organic determinations by ignition: Caution advised. Estuar. Coast. Shelf Sci. 1982, 15, 697–699. [Google Scholar] [CrossRef]
  49. Singer, J.; Anderson, J.; Ledbetter, M.; McCave, I.; Jones, K.; Wright, R. An assessment of analytical techniques for the size analysis of fine-grained sediments. J. Sediment. Res. 1988, 58, 534–543. [Google Scholar]
  50. Folk, R.L. Petrology of Sedimentary Rocks; Hemphill’s: Austin, TX, USA, 1968; p. 85. [Google Scholar]
  51. Porirua Harbour-Modelling for Whaitua Collaborative Modelling Group. Report 44800943/01 Prepared for GWRC for the Development of the Te Awarua-o’Porirua Whaitua Implementation Programme; DHI: Wellington, New Zealand, 2019. [Google Scholar]
  52. Zar, J.H. Biostatistical Analysis; Prentice-Hall: Englewood Cliffs, NY, USA, 1984. [Google Scholar]
  53. Flanigan, Y.S.; Critchley, C. Light response of D1 turnover and photosystem II efficiency in the seagrass Zostera capricorni. Planta 1996, 198, 319–323. [Google Scholar] [CrossRef]
  54. Enríquez, S.; Marbà, N.; Duarte, C.M.; Van Tussenbroek, B.I.; Reyes-Zavala, G. Effects of seagrass Thalassia testudinum on sediment redox. Mar. Ecol. Prog. Ser. 2001, 219, 149–158. [Google Scholar] [CrossRef] [Green Version]
  55. Romero, J.; Perez, M.; Mateo-Pérez, M.A.; Sala, E. The belowground organs of the Mediterranean seagrass Posidonia oceanica as a biogeochemical sink. Aquat. Bot. 1994, 47, 13–19. [Google Scholar] [CrossRef]
  56. Gacia, E.; Duarte, C.M. Sediment Retention by a Mediterranean Posidonia oceanica Meadow: The Balance between Deposition and Resuspension. Estuar. Coast. Shelf Sci. 2001, 52, 505–514. [Google Scholar] [CrossRef]
  57. Holmer, M.; Andersen, F.Ø.; Nielsen, S.L.; Boschker, H.T. The importance of mineralization based on sulfate reduction for nutrient regeneration in tropical seagrass sediments. Aquat. Bot. 2001, 71, 1–17. [Google Scholar] [CrossRef]
  58. Gacia, E.; Duarte, C.M.; Marbà, N.; Terrados, J.; Kennedy, H.; Fortes, M.; Tri, N. Sediment deposition and production in SE-Asia seagrass meadows. Estuar. Coast. Shelf Sci. 2003, 56, 909–919. [Google Scholar] [CrossRef]
  59. Larkum, A.W.; Orth, R.J.; Duarte, C.M. Seagrasses; Springer: Dordrecht, The Netherlands, 2006; p. 691. [Google Scholar]
  60. Fourqurean, J.W.; Duarte, C.M.; Kennedy, H.; Marbà, N.; Holmer, M.; Mateo-Pérez, M.A.; Apostolaki, E.T.; Kendrick, G.A.; Krause-Jensen, D.; McGlathery, K.J.; et al. Seagrass ecosystems as a globally significant carbon stock. Nat. Geosci. 2012, 5, 505–509. [Google Scholar] [CrossRef]
  61. Brodersen, K.E.; Kühl, M.; Nielsen, D.A.; Pedersen, O.; Larkum, A.W.D. Rhizome, Root/Sediment Interactions, Aerenchyma and Internal Pressure Changes in Seagrasses. In Seagrasses of Australia; Larkum, A.W.D., Kendrick., G.A., Ralph, P.J., Eds.; Springer Cham: Dordrecht, The Netherlands, 2018; pp. 393–418. [Google Scholar]
  62. Lohrer, A.M.; Thrush, S.F.; Gibbs, M.M. Bioturbators enhance ecosystem function through complex biogeochemical interactions. Nature 2004, 431, 1092–1095. [Google Scholar] [CrossRef] [PubMed]
  63. Lohrer, A.M.; Halliday, N.; Thrush, S.F.; Hewitt, J.E.; Rodil, I.F. Ecosystem functioning in a disturbance-recovery context: Contribution of macrofauna to primary production and nutrient release on intertidal sandflats. J. Exp. Mar. Biol. Ecol. 2010, 390, 6–13. [Google Scholar] [CrossRef]
  64. Lohrer, A.M.; Townsend, M.; Hailes, S.F.; Rodil, I.F.; Cartner, K.; Pratt, D.; Hewitt, J.E. Influence of New Zealand cockles (Austrovenus stutchburyi) on primary productivity in sandflat-seagrass (Zostera muelleri) ecotones. Estuar. Coast. Shelf Sci. 2016, 181, 238–248. [Google Scholar] [CrossRef]
  65. Pérez, M.; Invers, O.; Ruiz, J.M.; Frederiksen, M.S.; Holmer, M. Physiological responses of the seagrass Posidonia oceanica to elevated organic matter content in sediments: An experimental assessment. J. Exp. Mar. Biol. Ecol. 2007, 344, 149–160. [Google Scholar] [CrossRef]
  66. Calleja, M.L.; Marbà, N.; Duarte, C.M. The relationship between seagrass (Posidonia oceanica) decline and sulfide porewater concentration in carbonate sediments. Estuar. Coast. Shelf Sci. 2007, 73, 583–588. [Google Scholar] [CrossRef]
  67. Krause-Jensen, D.; Carstensen, J.; Nielsen, S.L.; Dalsgaard, T.; Christensen, P.; Fossing, H.; Rasmussen, M. Sea bottom characteristics affect depth limits of eelgrass Zostera marina. Mar. Ecol. Prog. Ser. 2011, 425, 91–102. [Google Scholar] [CrossRef] [Green Version]
  68. Nielsen, A.H.; Lens, P.N.L.; Vollertsen, J.; Hvitvedjacobsen, T. Sulfide–iron interactions in domestic wastewater from a gravity sewer. Water Res. 2005, 39, 2747–2755. [Google Scholar] [CrossRef]
  69. Ruiz-Halpern, S.; Macko, S.A.; Fourqurean, J.W. The effects of manipulation of sedimentary iron and organic matter on sediment biogeochemistry and seagrasses in a subtropical carbonate environment. Biogeochemistry 2008, 87, 113–126. [Google Scholar] [CrossRef]
  70. Stoffers, P.; Glasby, G.P.; Plüger, W.L.; Walter, P. Reconnaissance survey of the mineralogy and geochemistry of some New Zealand lake and nearshore sediments. N. Z. J. Mar. Freshw. Res. 1983, 17, 461–480. [Google Scholar] [CrossRef]
  71. Glasby, G.P.; Moss, R.L.; Stoppers, P. Heavy metal pollution in Porirua Harbour, New Zealand. N. Z. J. Mar. Freshw. Res. 1990, 24, 233–237. [Google Scholar] [CrossRef]
  72. Macinnis-Ng, C.M.; Ralph, P.J. In situ impact of multiple pulses of metal and herbicide on the seagrass, Zostera capricorni. Aquat. Toxicol. 2004, 67, 227–237. [Google Scholar] [CrossRef] [PubMed]
  73. Hooper, K.L. The Impact of Stormwater Discharges on Freshwater, Marine Water and Marine Sediments and the Implications for Environmental Management of the Pauatahanui Inlet, Porirua, New Zealand: A Thesis Prepared in Partial Fulfilment of Master of Applied Science (Natural Resource Management). Master’s Thesis, Massey University, Palmerston North, New Zealand, 2002. [Google Scholar]
  74. Tay, H.; Bryan, K.R.; De Lange, W.; Pilditch, C.; De Lange, W. The hydrodynamics of the southern basin of Tauranga Harbour. N. Z. J. Mar. Freshw. Res. 2013, 47, 249–274. [Google Scholar] [CrossRef] [Green Version]
  75. Brun, F.G.; Hernández, I.; Vergara, J.; Peralta, G.; Perez-Llorens, J.L. Assessing the toxicity of ammonium pulses to the survival and growth of Zostera noltii. Mar. Ecol. Prog. Ser. 2002, 225, 177–187. [Google Scholar] [CrossRef] [Green Version]
  76. Govers, L.L.; De Brouwer, J.H.; Suykerbuyk, W.; Bouma, T.J.; Lamers, L.P.; Smolders, A.J.; Van Katwijk, M.M. Toxic effects of increased sediment nutrient and organic matter loading on the seagrass Zostera noltii. Aquat. Toxicol. 2014, 155, 253–260. [Google Scholar] [CrossRef] [PubMed] [Green Version]
  77. Longstaff, B.J. Investigations into the Light Requirements of Seagrasses in Northeast Australia. Ph.D. Thesis, University of Queensland, Brisbane, Australia, 2003. [Google Scholar]
  78. Bulmer, R.H.; Kelly, S.; Jeffs, A.G. Light requirements of the seagrass, Zostera muelleri, determined by observations at the maximum depth limit in a temperate estuary, New Zealand. N. Z. J. Mar. Freshw. Res. 2016, 50, 183–194. [Google Scholar] [CrossRef]
  79. De Boer, W.F. Seagrass–sediment interactions, positive feedbacks and critical thresholds for occurrence: A review. Hydrobiologia 2007, 591, 5–24. [Google Scholar] [CrossRef]
  80. Vermaat, J.E.; Agawin, N.; Fortes, M.; Uri, J.; Duarte, C.; Marba, N.; Enriquez, S.; Van Vierssen, W. The capacity of seagrasses to survive increased turbidity and siltation: The significance of growth form and light use. Ambio 1997, 26, 499–504. [Google Scholar]
  81. Schwarz, A.-M. Contribution of photosynthetic gains during tidal emersion to production of Zostera capricorni in a North Island, New Zealand estuary. N. Z. J. Mar. Freshw. Res. 2004, 38, 809–818. [Google Scholar] [CrossRef]
  82. Drylie, T.; Lohrer, A.M.; Needham, H.R.; Bulmer, R.H.; Pilditch, C. Benthic primary production in emerged intertidal habitats provides resilience to high water column turbidity. J. Sea Res. 2018, 142, 101–112. [Google Scholar] [CrossRef]
  83. Marbà, N.; Cebrián, J.; Enríquez, S.; Duarte, C.M. Growth patterns of Western Mediterranean seagrasses: Species-specific responses to seasonal forcing. Mar. Ecol. Prog. Ser. 1996, 133, 203–215. [Google Scholar] [CrossRef]
  84. Walker, D.; McComb, A. Seagrass degradation in Australian coastal waters. Mar. Pollut. Bull. 1992, 25, 191–195. [Google Scholar] [CrossRef]
  85. Gladstone-Gallagher, R.V.; Hughes, R.W.; Douglas, E.J.; Pilditch, C. Biomass-dependent seagrass resilience to sediment eutrophication. J. Exp. Mar. Biol. Ecol. 2018, 501, 54–64. [Google Scholar] [CrossRef]
  86. Kenworthy, W.; Fonseca, M. Reciprocal transplant of the seagrass Zostera marina L. Effect of substrate on growth. Aquaculture 1977, 12, 197–213. [Google Scholar] [CrossRef]
  87. Short, F.T. Effects of sediment nutrients on seagrasses: Literature review and mesocosm experiment. Aquat. Bot. 1987, 27, 41–57. [Google Scholar] [CrossRef]
  88. Koch, E.W. Beyond Light: Physical, Geological, and Geochemical Parameters as Possible Submersed Aquatic Vegetation Habitat Requirements. Estuaries 2001, 24, 1–17. [Google Scholar] [CrossRef]
  89. Leschen, A.S.; Ford, K.H.; Evans, N.T. Successful Eelgrass (Zostera marina) Restoration in a Formerly Eutrophic Estuary (Boston Harbor) Supports the Use of a Multifaceted Watershed Approach to Mitigating Eelgrass Loss. Chesap. Sci. 2010, 33, 1340–1354. [Google Scholar] [CrossRef]
  90. Moksnes, P.-O.; Eriander, L.; Infantes, E.; Holmer, M. Local Regime Shifts Prevent Natural Recovery and Restoration of Lost Eelgrass Beds Along the Swedish West Coast. Chesap. Sci. 2018, 41, 1712–1731. [Google Scholar] [CrossRef] [Green Version]
  91. Edgar, G.; Shaw, C. The production and trophic ecology of shallow-water fish assemblages in southern Australia III. General relationships between sediments, seagrasses, invertebrates and fishes. J. Exp. Mar. Biol. Ecol. 1995, 194, 107–131. [Google Scholar] [CrossRef]
  92. Park, S.; Donald, R. Environment Bay of Plenty Tauranga Harbour Regional Plan Environmental Investigations; Ecology of Tauranga Harbour. Environment Bay of Plenty Environmental Report 94/8; Environment BOP: Whakatane, New Zealand, 1994; p. 177. [Google Scholar]
Figure 1. Locations of the 15 sampling sites are shown. Sites in the inner Pāuatahanui Inlet are where seagrass occurred historically but no longer grows (red, HS 1–5), sites in the outer estuary are where seagrass continues to persist (green, ES 2–6) and sites in the outer estuary where seagrass declined recently but the environment is sufficiently similar to ES to be considered potential seagrass habitat (blue, PS 1–5). Kakaho, Horokiri, and Pāuatahanui streams are major sources of water and sediment to the Inlet. Bathymetry and site coordinates are tabulated in Supplementary materials, Table S1.
Jmse 08 00645 g001
Figure 2. Principal component analysis (PCA) of the grain size categories for historical seagrass (HS), existing seagrass (ES), and potential seagrass (PS) habitats. Fine sand (F. sand) and coarse sand (C. sand). Dimension 1 (Dim1) and dimension 2 (Dim2) together explain 90.7% of the variation on measured grain sizes. Dim1 explains 73.4% of the variability and Dim2 17.3%. Larger symbols show averages for HS, ES, and PS.
Jmse 08 00645 g002
Figure 3. Redox potential (Eh) profiles (means ±SE) for historical seagrass (HS), existing seagrass (ES), and potential seagrass (PS) habitats in summer and in winter.
Jmse 08 00645 g003
Figure 4. Principal component analysis (PCA) of porewater nutrients, sulfide, total photosynthetically available radiation (PAR), Redox (Eh), and % Mud from historical seagrass (HS), existing seagrass (ES), and potential seagrass (PS). Dimension 1 (Dim1) and dimension 2 (Dim2) of the PCA explain 55.2% and 23.7% of the variation, respectively. Larger symbols show averages for HS, ES, and PS.
Jmse 08 00645 g004
Figure 5. Scatter plots of seagrass cover versus substrate conditions at (existing seagrass, ES). (a) Seagrass cover versus substrate % mud; (b) seagrass cover versus substrate % organic matter; (c) seagrass cover vs. porewater PO43−; (d) seagrass cover versus porewater NH4+.
Jmse 08 00645 g005
Table 1. Predicted hydrodynamics parameters and salinity for historical seagrass (HS), existing seagrass (ES), and potential seagrass (PS) sites using the model of [51]. Values are means (±SE). Significant differences (p < 0.05, Tukey HSD (honestly significant difference)) are indicated by different alphabetic superscripts.
HabitatCurrent Velocity (m s−1)Wave Period (s)Salinity (PSU)SSC (mg L−1)Deposition (mm yr−1)
HS0.05 ± 0.003 a0.59 ± 0.010 a18.67 ± 0.76 a10.72 ± 0.570 b6.4 ± 2.10 c
ES0.15 ± 0.010 c0.66 ± 0.010 c25.63 ± 0.24 b2.35 ± 0.095 a3.6 ± 0.90 b
PS0.08 ± 0.005 b0.61 ± 0.001 b25.99 ± 0.01 b2.17 ± 0.020 a1.22 ± 0.02 a
Table 2. Substrate properties at historical seagrass (HS), existing seagrass (ES), and potential seagrass (PS) sites. Values are means (±SE). Significant differences (p < 0.05, Tukey HSD test) among habitats and seasons for each substrate property are indicated by different alphabetic superscripts.
HabitatSeasonClay (%)Silt (%)Mud (%)Fine Sand (%)Coarse Sand (%)Sand (%)Bulk Density
(g cm−3)
% OM 1Eh 2 (mV) Mean (0–10 cm)
RZ 3 (0–4 cm)
HSWinter6.3 ± 0.8 e27.5 ± 2.5 c33.7 ± 5.8 b48.1 ± 4.1 a17.8 ± 2.7 d65.9 ± 3.2 a1.32 ± 0.05 b1.79 ± 0.13 d−79.8 ± 13.1 a
Eh (RZ) −35.7 a’
Summer8.0 ± 0.9 e30.8 ± 1.9 c38.8 ± 1.9 b 49.9 ± 3.2 a11.3 ± 0.9 b61.2 ± 2.6 a1.63 ± 0.07 c1.60 ± 0.09 c−71.6 ± 17.3 a
Eh (RZ) 8.9 b’
ESWinter2.0 ± 0.2 a9.1 ± 0.7 a11.1 ± 2.1 a78.5 ± 1.8 b10.1 ± 0.9 b88.7 ± 0.9 c1.01 ± 0.03 a1.53 ± 0.14 c−33.8 ± 11.4 b
Eh (RZ) 22.6 c’
Summer3.3 ± 0.1 c12.1 ± 0.7 b15.3 ± 1.7 a73.7 ± 1.4 b10.5 ± 0.4 b84.7 ± 0.8 b1.28 ± 0.05 b1.71 ± 0.09 d−22.3 ± 21.5 b
Eh (RZ) 13.6 c’
PSWinter2.6 ± 0.2 b7.7 ± 0.7 a10.3 ± 0.8 a74.8 ± 1.2 b12.6 ± 0.4 c87.4 ± 1 c1.09 ± 0.05 a1.39 ± 0.04 b−14.4 ± 14.8 c
Eh (RZ) 40.6 d’
Summer4.7 ± 0.4 d8.9 ± 0.8 a13.6 ± 1.0 a76.9 ± 0.8 b9.5 ± 0.3 a86.4 ± 0.7 c1.16 ± 0.05 a1.14 ± 0.02 a−41.6 ± 22.2 b
Eh (RZ) 5.6 b’
1 Organic matter (OM); 2 redox potential (Eh); 3 root zone (RZ).
Table 3. Substrate porewater nutrients and sulfide concentrations at historical seagrass (HS), existing seagrass (ES), and potential seagrass (PS) for two sampling depths. Values are means (±SE). Significant differences (p < 0.05, Tukey HSD test) among habitats and seasons for a particular substrate property are indicated by different alphabetic superscripts.
HabitatSeasonSampling DepthPO4³ (µM)NH4+ (µM)H₂S (µM)
HSWinter(0–5 cm)0.04 ± 0.004 a12.47 ± 3.49 b1.11± 0.29 b
(5–10 cm)0.27 ± 0.03 d61.43 ± 5.93 c2.69 ± 0.53 d
Summer(0–5 cm)0.40 ± 0.09 e51.72 ± 21.23 c2.89 ± 0.18 d
(5–10 cm)0.24 ± 0.07 d71.52 ± 15.14 c3.22 ± 0.12 e
ESWinter(0–5 cm)0.05 ± 0.01 b5.71 ± 1.89 a0.83 ± 0.22 a
(5–10 cm)0.29 ± 0.06 d22.12 ± 4.93 b3.23 ± 0.71 e
Summer(0–5 cm)0.29 ± 0.04 d12.70 ± 3.05 b2.10 ± 0.19 c
(5–10 cm)0.25 ± 0.04 d14.97 ± 5.21 b2.61 ± 0.23 d
PSWinter(0–5 cm)0.07 ± 0.01 b8.76 ± 1.33 a1.55 ± 0.41 b
(5–10 cm)0.12 ± 0.01 c21.84 ± 1.44 b1.62 ± 0.47 b
Summer(0–5 cm)0.17 ± 0.04 c14.41 ± 2.77 b1.58 ± 0.21 b
(5–10 cm)0.16 ± 0.01 c14.53 ± 3.16 b1.46 ± 0.14 b
Table 4. Photosynthetically available radiation (PAR) at historical seagrass (HS), existing seagrass (ES), and potential seagrass (PS) during winter (from 23 August 2018 to 3 October 2018) and summer (from 8 February 2019 to 21 March 2019) deployments. Values are daily mean PAR (±SE). PAR doses when submerged and emerged are shown as well as the number of days each habitat was below a compensation irradiance for Zostera muelleri (CI, 3.9 mol m−2 d−1) during deployments. The value given is the total number of days and the figure in parentheses is the longest number of consecutive days below CI. Significantly different mean values (ANOVA, Tukey HSD, p < 0.05) among habitats and seasons are indicated by different alphabetic superscripts and (*), respectively.
HabitatSeasonPAR When Submerged
(mol m−2 d−1)
PAR When Emerged
(mol m−2 d−1)
Number of Days Where Total Mean PAR Was Below Compensation Irradiance
(Days)
HSWinter2.2 ± 0.2 a30.9 ± 2 a6 (2) b
Summer5.2 ± 0.2 d*60 ± 2.5 d*3 (1) b*
ESWinter4.4 ± 0.3 c44.3 ± 2 b3 (1) a
Summer4.0 ± 0.2 c 46.1 ± 2 b1 (0) a*
PSWinter3.5 ± 0.2 b33.0 ± 2 a5 (0) a
Summer4.6 ± 0.2 c*53.1 ± 2.4 c*0 (0) a*
Table 5. Seagrass traits at existing seagrass habitat (ES). Statistical parameters are mean (±SE), maximum, minimum, and median. Significant seasonality (ANOVA, Tukey HSD, p < 0.05) in traits is indicated by different alphabetic superscripts.
TraitSeasonMean ± SEMaxMinMedian
% CoverWinter49.4 ± 7.1 a90065
Summer71.0 ± 5.2 b95075
Shoot density (m−2)Winter444 ± 51.7 a8280414
Summer670 ± 51.7 b1401159700
AGB (g m−2)Winter9.4 ± 1.6 a22.70.136.1
Summer10.2 ± 1.0 a22.72.111.3
BGB (g m−2)Winter87.8 ± 15.9 a302.51.946.9
Summer150.7 ± 24.2 b488.84.6111.5
BGB/AGBWinter17.9 ± 4.5 a95.12.0411.5
Summer15.9 ±2.3 a44.80.713.4
Biomass (g m−2)Winter97.2 ± 17 a321.62.564.5
Summer161 ± 24.6 b50010.9122.9
Table 6. Substrate percent mud ranges for Zostera genus occurrence and transplanting success (if available) reported in the literature.
Study LocationSeagrass SpeciesDepth of Substrate SampledMeans of Determination Substrate Mud (%) Where Seagrass Thrives or Recommended for TransplantingReferences
New Bedford Harbour, USAZ. marina0–10 cmx<70%[87]
Multiple locations,
Review
Z. marinaxx2.3–56.3%
<20%
[88]
Boston Harbour, USAZ. marina0–10 cmx<35%
[89]
At >57%
transplant failed
NW coast, SwedenZ. marina0–9 cmWet sievingSurvival at 35%[90]
no survival where >60%
Western Port, AustraliaZ. muellerixx0.5–72%[91]
Tauranga Harbour,
New Zealand
Z. muelleri0–2 cmx<13 % silt threshold[92]
Porirua Harbour,
New Zealand
Z. muelleri0–10 cmLaser analyzer8–23%This study
x Not defined.

