Holocene Boulder Beach Eroded from Chromite and Dunite Sea Cliffs at Støypet on Leka Island (Northern Norway)


Abstract
1. Introduction
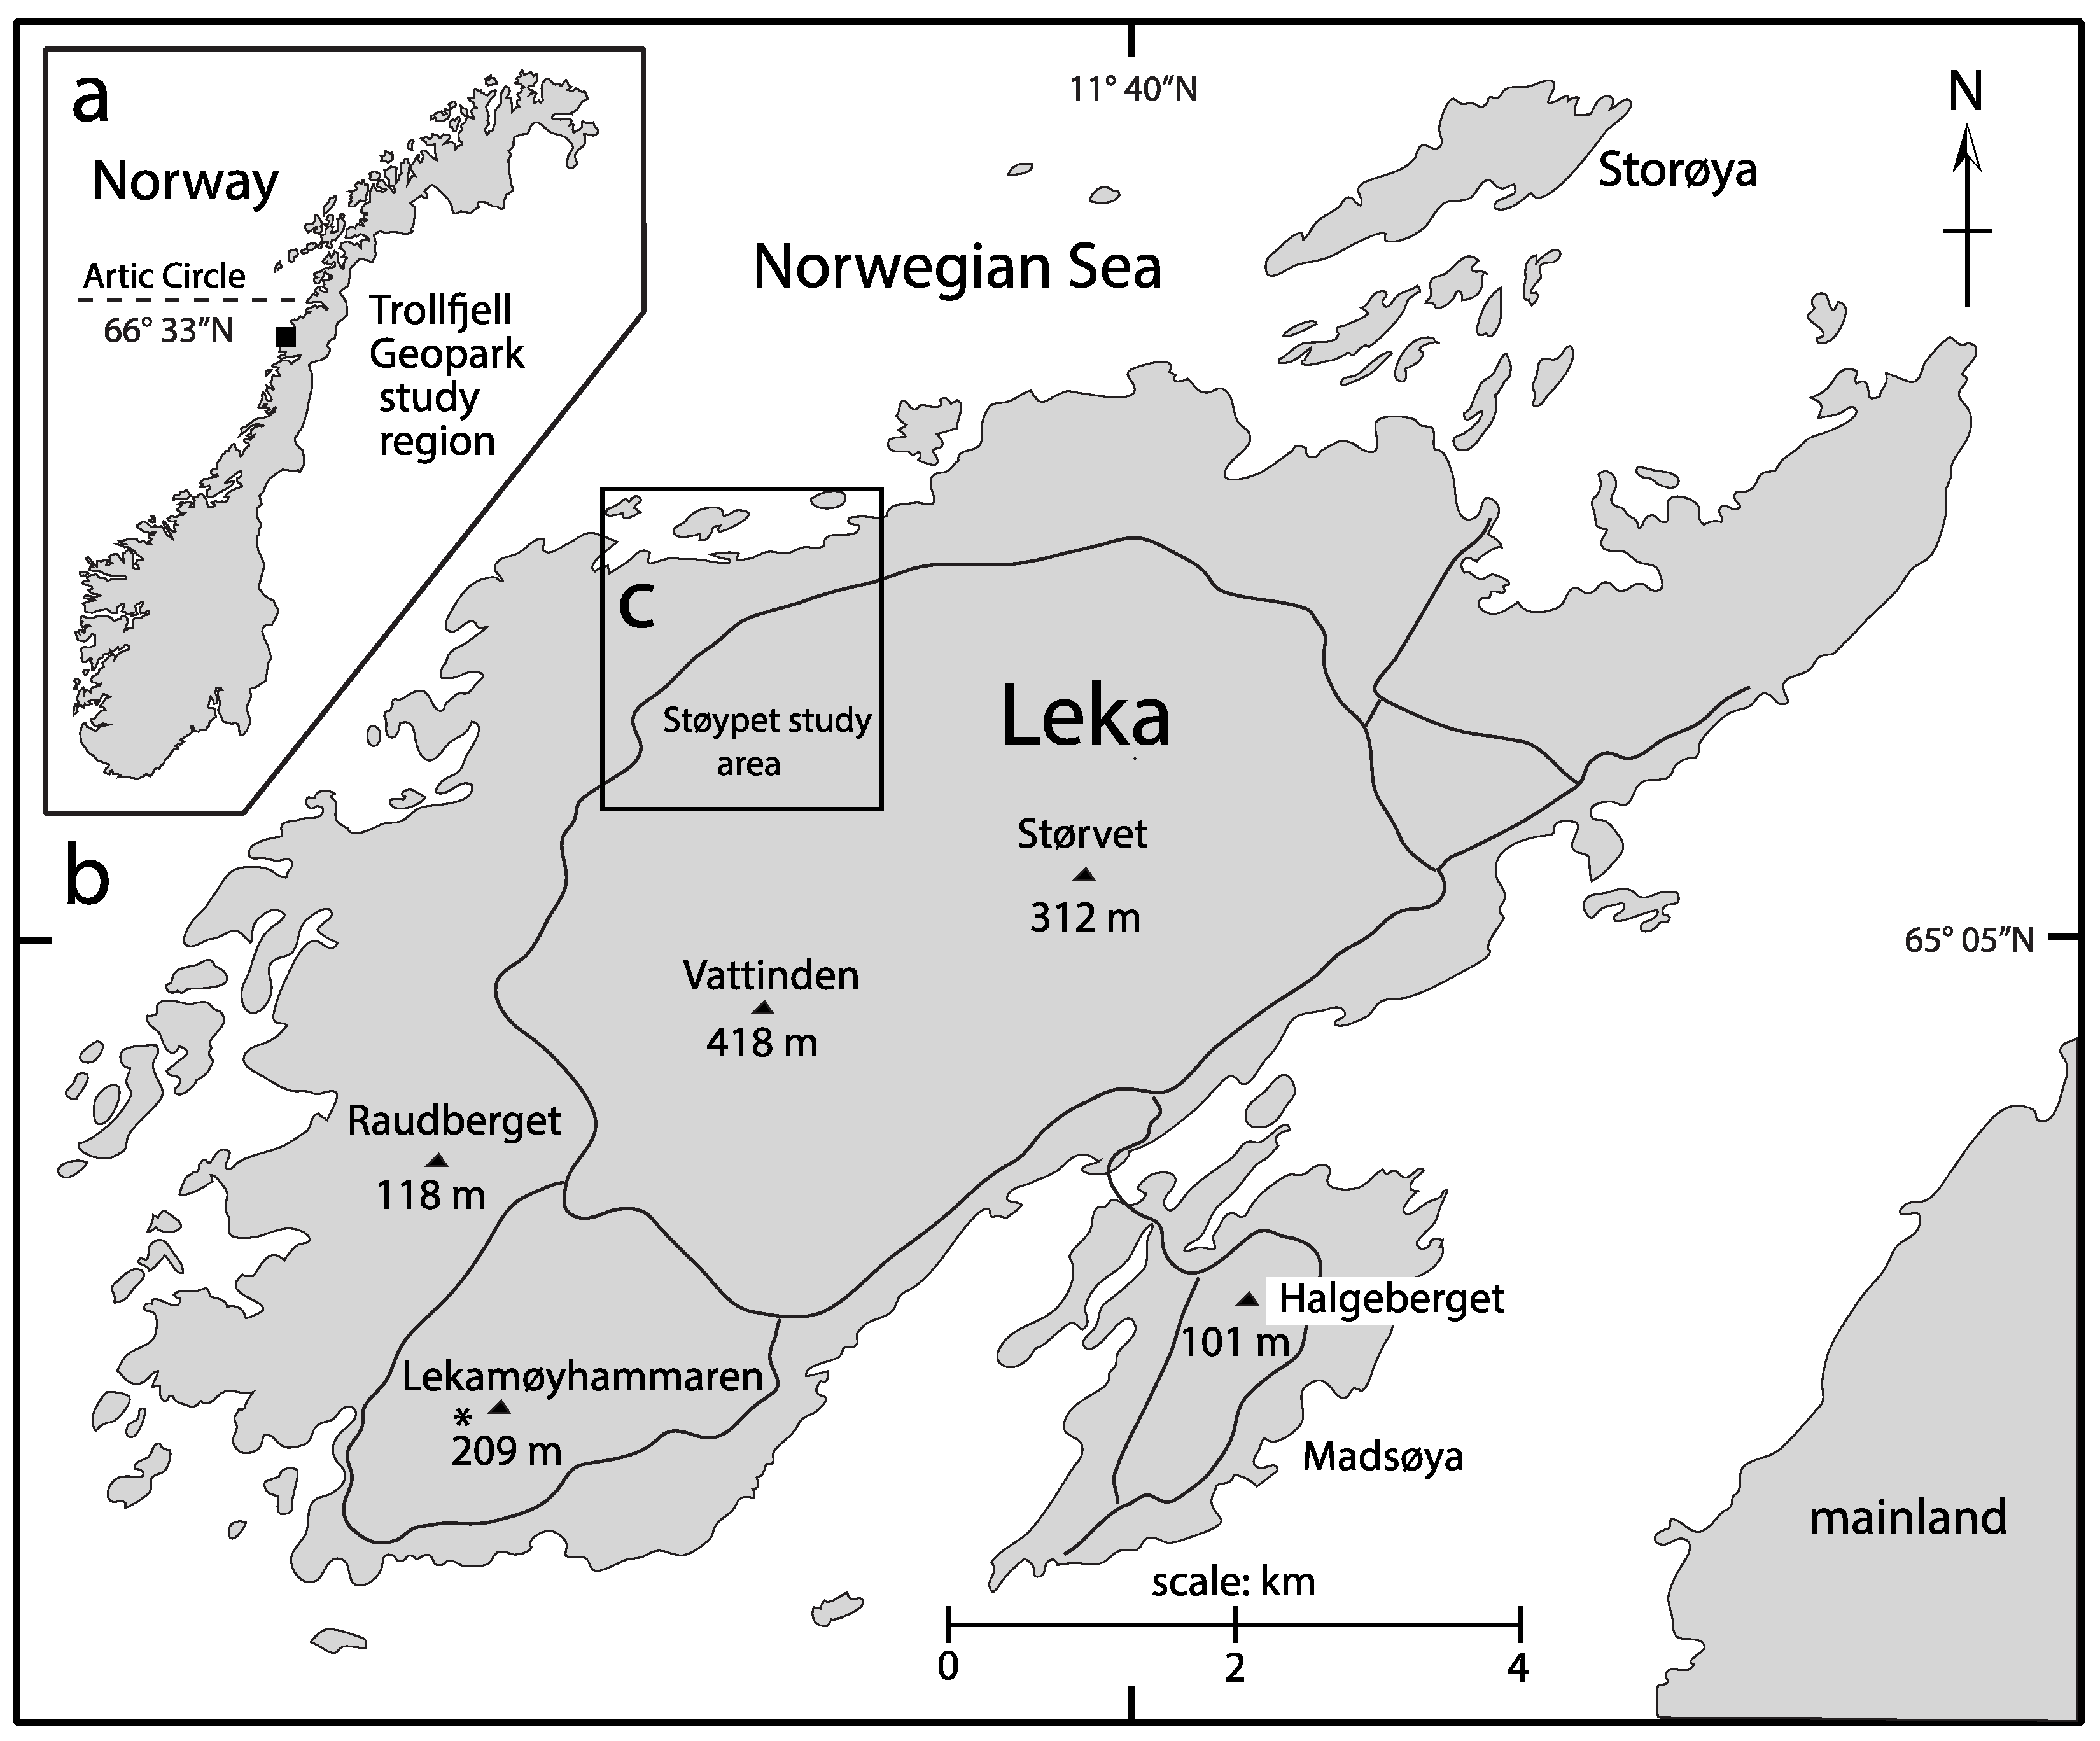
2. Geographical and Geological Setting
3. Materials and Methods
3.1. Data Collection
3.2. Hydraulic Model
4. Results
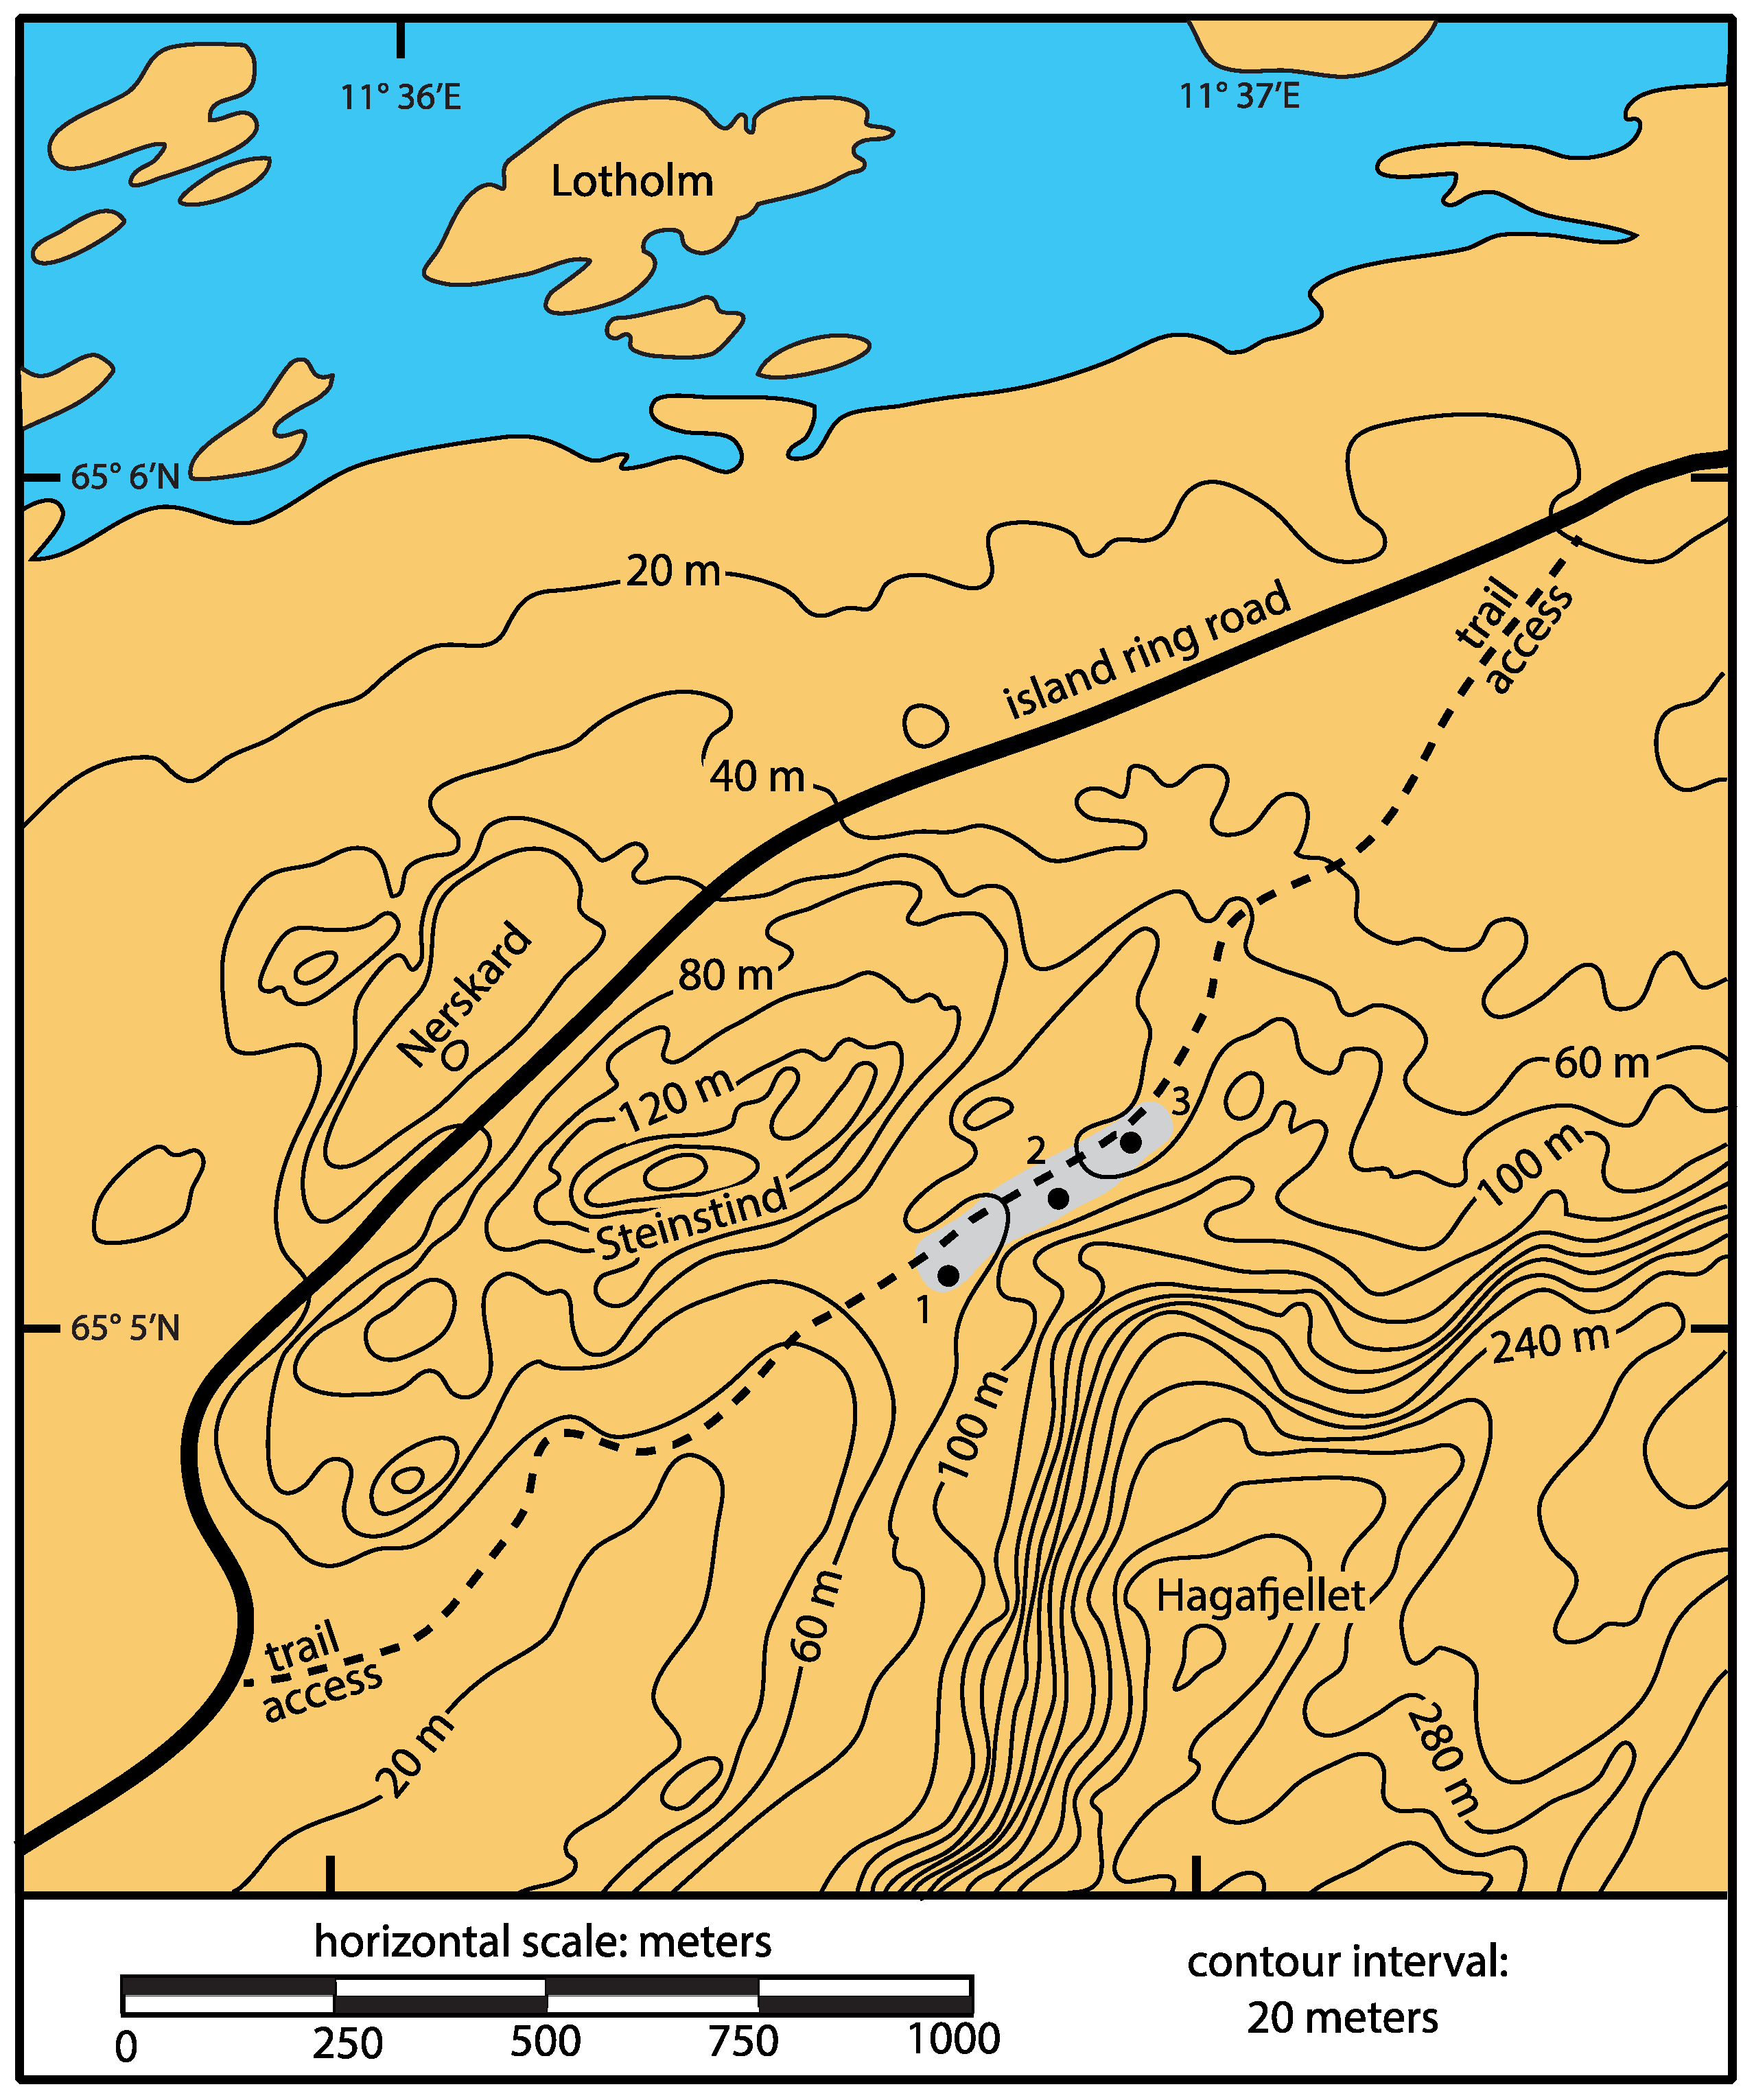
4.1. Base Map
4.2. Fracture Pattern in Støypet Valley Chromite Layers
4.3. Chromite Ore Density
4.4. Comparative Variation in Clast Shapes
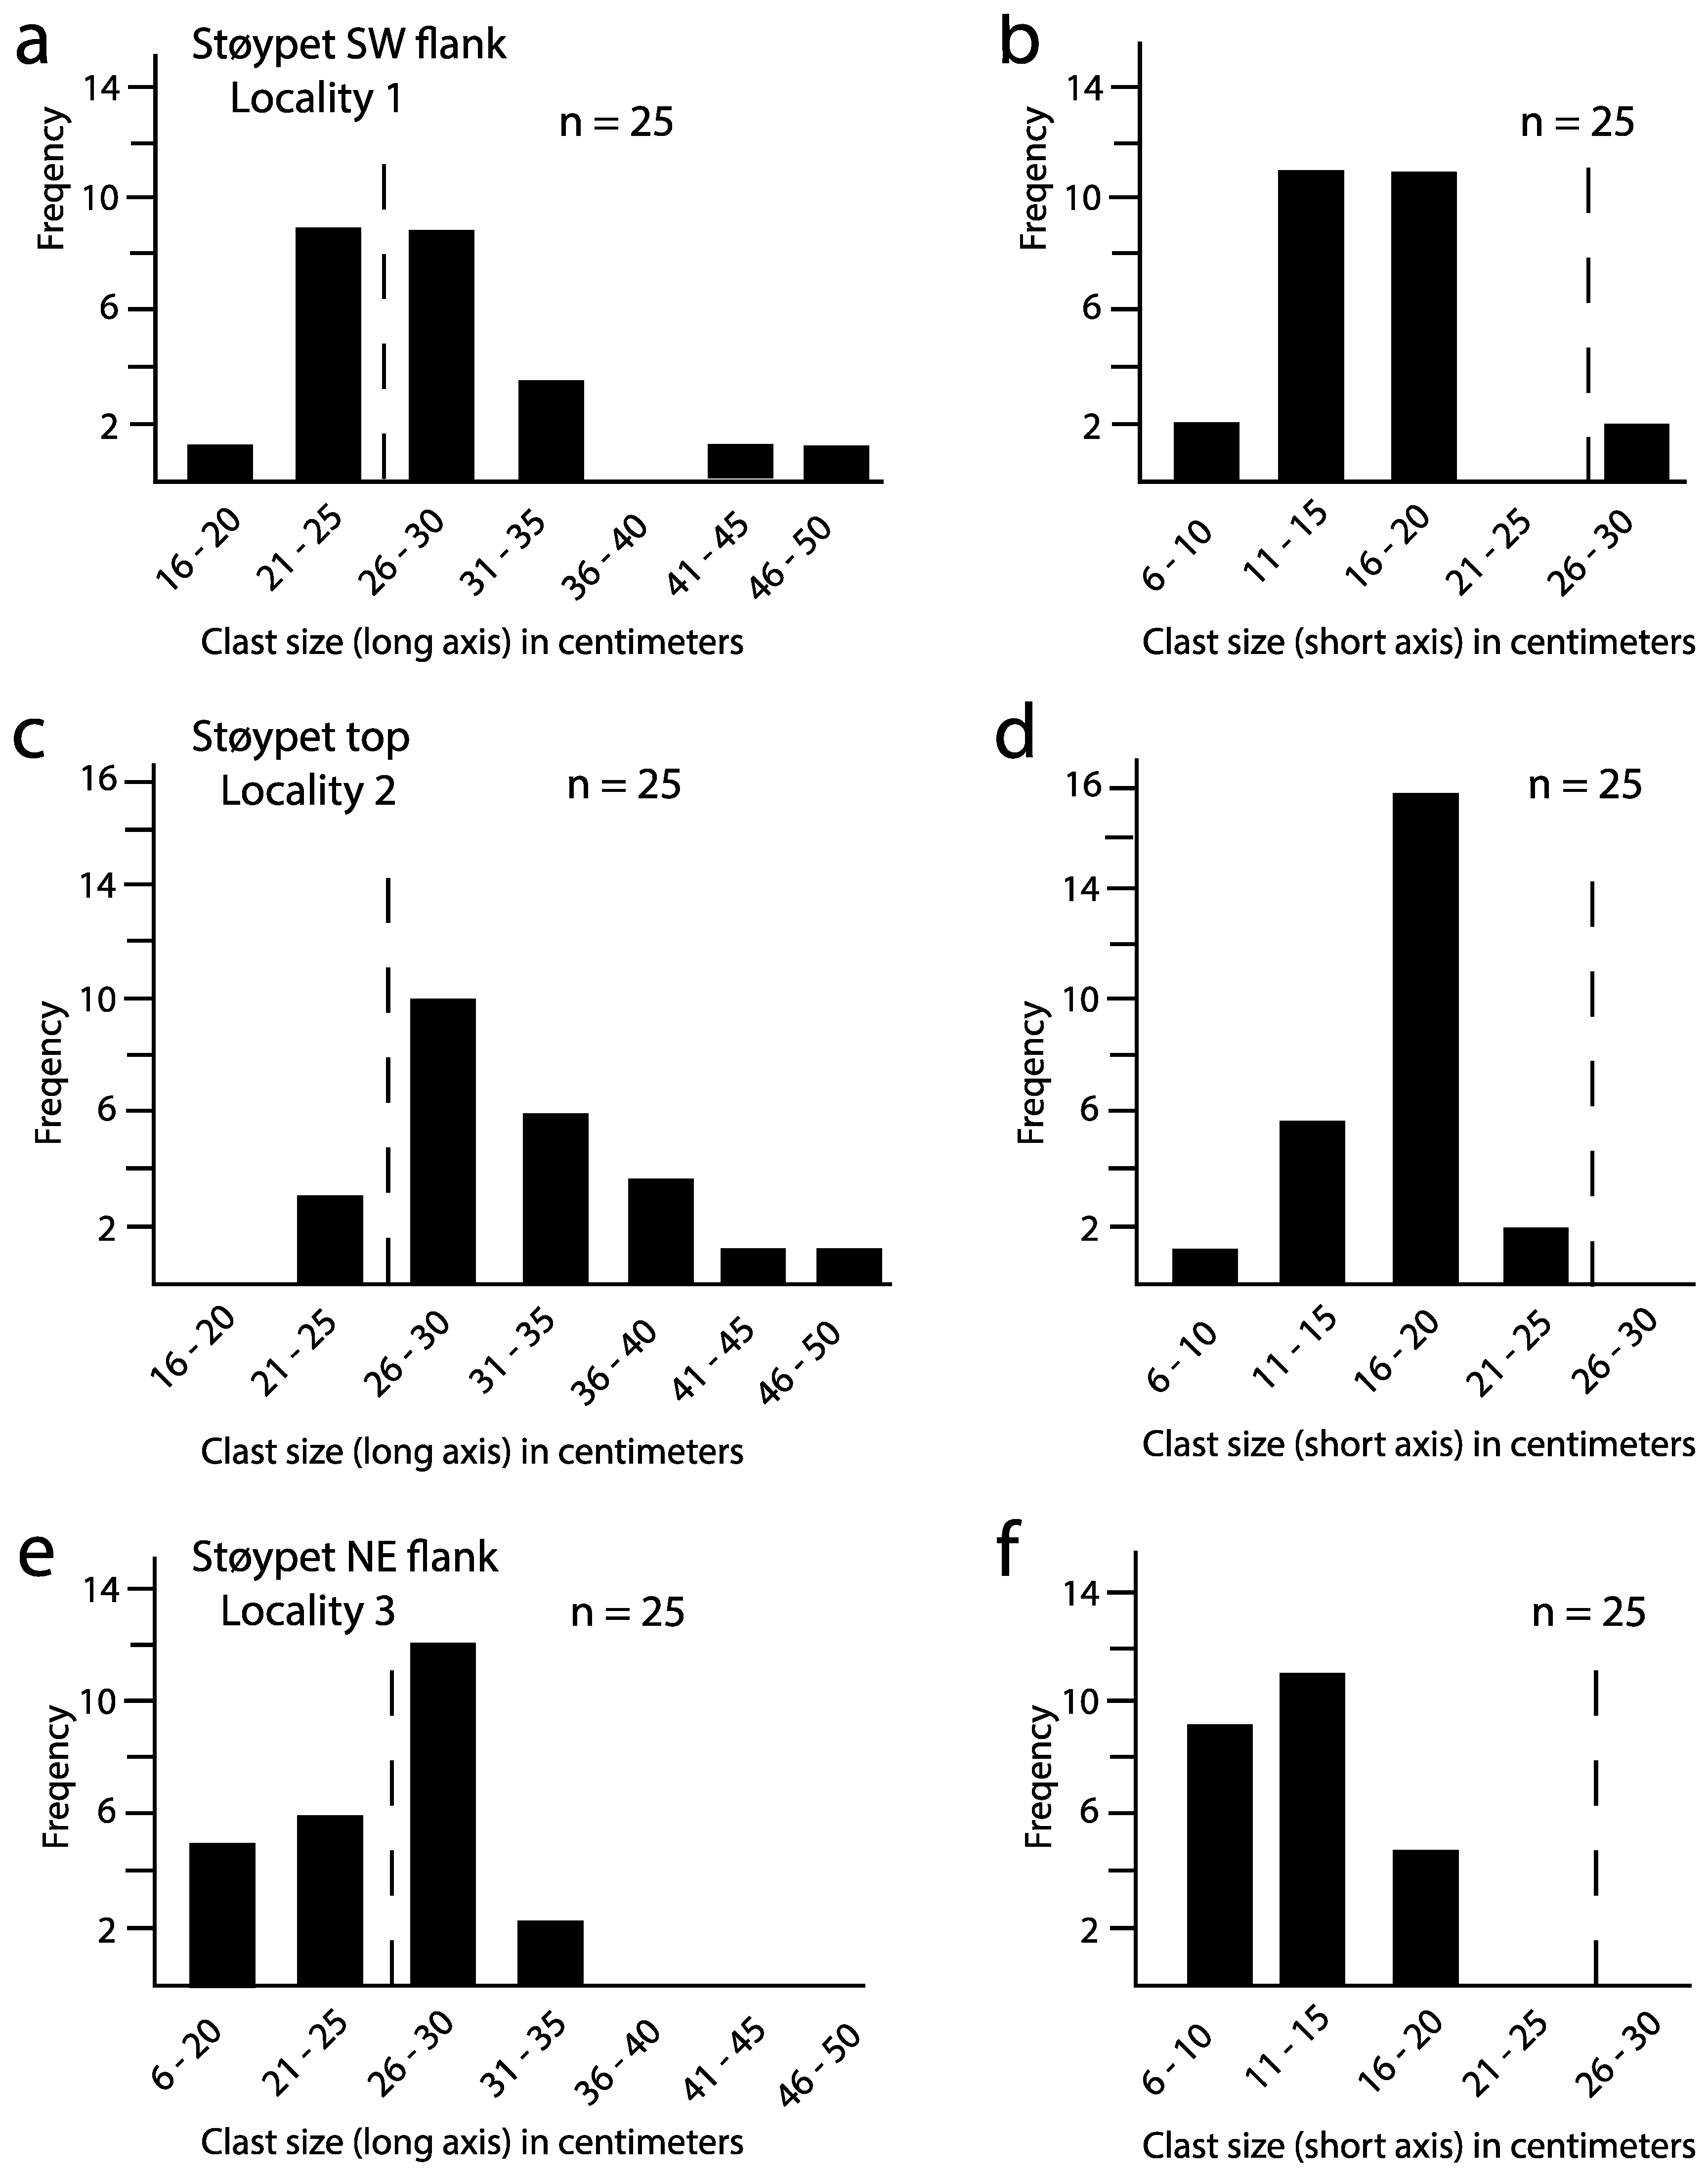
4.5. Comparative Variation in Clast Sizes
4.6. Storm Intensity as Function of Estimated Wave Height
5. Discussion
5.1. Physiographic Changes in Island Size
5.2. Direction of Holocene Storms
5.3. Inference from Historical Storms
6. Conclusions
- The unconsolidated cobble-boulder beach preserved as a Holocene deposit in Støypet valley is unique due to components of low-grade chromite ore and the igneous rock dunite that originated deep within the Earth’s crust. In particular, chromite is a dense rock seldom exposed at the surface and more rarely in coastal settings subject to wave erosion.
- Present-day Støypet valley originated as a marine channel that separated part of the island’s north shore from the rest of the island in early Holocene time when free passage from one end to the other end was possible prior to surface rebound after the retreat of glacial ice. The valley’s mid-point is close to 100 m above present-day sea level with the upper 25 m occupied by the cobble-boulder beach.
- Data on size variations in clast size from three field samples in Støypet valley suggest that Holocene storms entered the former channel from the SW, which is consistent with the approach by recent storms of hurricane strength on the same coast in North Trondelag and Nordland near the Polar Circle.
- The density of constituent clasts derived from low-grade chromite ore eroded by storm waves from joint-bound sea cliffs is 45% more dense than limestone boulders and 25% more dense than andesite boulders previously studied in coastal deposits elsewhere. Although chromite boulders from Leka Island are small in comparison, the energy expended by storm waves to free blocks of chromite from joint-bound sea cliffs would have been greater normalized for unit volume than for limestone or other igneous rocks like andesite.
- Different equations used to estimate the height of storm waves eroding sea cliffs with joint-bound rocks differ in results as found in the formulations applied from Nott [17] and updated by Pepe et al. [19]. In this study, the latter yielded estimates from 12% to 24% higher depending on analysis of mean clast size or maximum clast size. Holocene wave heights estimated by both equations are within the range of observed wave heights during major storms in the same region.
Funding
Acknowledgments
Conflicts of Interest
Appendix A

| Sample | Long Axis (cm) | Intermediate Axis (cm) | Short Axis (cm) | Volume (cm3) | Adjust to 80% | Weight (kg) | Ewh Nott [17] (m) | Ewh Pepe et al. [19] (m) |
|---|---|---|---|---|---|---|---|---|
| 1 | 29 | 19 | 16 | 8816 | 7053 | 23 | 3.7 | 4.6 |
| 2 | 22 | 18 | 18 | 7128 | 5702 | 19 | 2.8 | 5.2 |
| 3 | 24 | 22 | 12 | 6336 | 5069 | 17 | 3.1 | 3.4 |
| 4 | 23 | 14 | 12 | 3864 | 3091 | 10 | 3.0 | 3.4 |
| 5 | 25 | 18 | 6 | 2700 | 2160 | 7 | 3.2 | 1.7 |
| 6 | 18 | 14 | 11 | 2772 | 2218 | 7 | 2.3 | 3.1 |
| 7 | 32 | 17 | 12 | 6528 | 5222 | 17 | 4.1 | 3.4 |
| 8 | 23 | 20 | 20 | 9200 | 7360 | 24 | 3.0 | 5.7 |
| 9 | 32 | 17 | 15 | 8160 | 6528 | 22 | 4.1 | 4.3 |
| 10 | 34 | 20 | 20 | 13,600 | 10,880 | 36 | 4.4 | 5.7 |
| 11 | 30 | 20 | 20 | 12,000 | 9600 | 32 | 3.9 | 5.7 |
| 12 | 26 | 19 | 15 | 7410 | 5928 | 20 | 3.4 | 4.3 |
| 13 | 50 | 30 | 28 | 42,000 | 33,600 | 112 | 6.5 | 8.0 |
| 14 | 34 | 23 | 20 | 15,640 | 12,512 | 42 | 4.4 | 5.7 |
| 15 | 27 | 24 | 17 | 11,016 | 8813 | 29 | 3.5 | 4.9 |
| 16 | 24 | 24 | 20 | 11,520 | 9216 | 31 | 3.1 | 5.7 |
| 17 | 22 | 17 | 10 | 3740 | 2992 | 10 | 2.8 | 2.9 |
| 18 | 28 | 20 | 18 | 10,080 | 8064 | 27 | 3.6 | 5.2 |
| 19 | 26 | 18 | 16 | 7488 | 5990 | 20 | 3.4 | 4.6 |
| 20 | 23 | 17 | 15 | 5865 | 4692 | 16 | 3.0 | 4.3 |
| 21 | 44 | 30 | 27 | 35,640 | 28,512 | 95 | 5.7 | 7.7 |
| 22 | 26 | 20 | 14 | 7280 | 5824 | 19 | 3.4 | 4.0 |
| 23 | 26 | 17 | 14 | 6188 | 4950 | 16 | 3.4 | 4.0 |
| 24 | 26 | 14 | 14 | 5096 | 4077 | 14 | 3.4 | 4.0 |
| 25 | 23 | 14 | 13 | 4186 | 3349 | 11 | 3.0 | 3.7 |
| Average | 27.9 | 19.4 | 16.1 | 10,170 | 8136 | 27 | 3.6 | 4.6 |
| Sample | Long Axis (cm) | Intermediate Axis (cm) | Short Axis (cm) | Volume (cm3) | Adjust to 80% | Weight (kg) | EWH Nott [17] (m) | EWH Pepe et al. [19] (m) |
|---|---|---|---|---|---|---|---|---|
| 1 | 38 | 21 | 16 | 12,768 | 10,214 | 34 | 4.9 | 4.6 |
| 2 | 33 | 22 | 19 | 13,794 | 11,035 | 37 | 4.3 | 5.4 |
| 3 | 42 | 26 | 19 | 20,748 | 16,995 | 56 | 5.4 | 5.4 |
| 4 | 27 | 20 | 12 | 6480 | 5184 | 17 | 3.3 | 3.4 |
| 5 | 32 | 16 | 15 | 7680 | 6144 | 20 | 4.1 | 4.3 |
| 6 | 27 | 15 | 10 | 4050 | 3240 | 11 | 3.3 | 2.9 |
| 7 | 22 | 20 | 18 | 7920 | 6336 | 21 | 2.8 | 5.2 |
| 8 | 33 | 23 | 16 | 12,144 | 9715 | 32 | 4.3 | 4.6 |
| 9 | 26 | 19 | 18 | 8892 | 7113 | 24 | 3.4 | 5.2 |
| 10 | 36 | 22 | 16 | 12,672 | 10,137 | 34 | 4.7 | 4.6 |
| 11 | 24 | 19 | 13 | 5928 | 4742 | 16 | 3.1 | 3.7 |
| 12 | 29 | 20 | 18 | 10,440 | 8352 | 28 | 3.7 | 5.2 |
| 13 | 26 | 20 | 19 | 9880 | 7904 | 26 | 3.4 | 5.4 |
| 14 | 26 | 17 | 16 | 7072 | 5658 | 19 | 3.4 | 4.6 |
| 15 | 46 | 26 | 20 | 23,920 | 19,136 | 64 | 5.9 | 5.7 |
| 16 | 29 | 20 | 11 | 6380 | 5104 | 17 | 3.7 | 3.1 |
| 17 | 37 | 28 | 25 | 23,125 | 18,500 | 61 | 4.8 | 7.2 |
| 18 | 30 | 29 | 13 | 11,310 | 9048 | 30 | 3.9 | 3.7 |
| 19 | 35 | 29 | 20 | 20,300 | 16,240 | 54 | 4.5 | 5.7 |
| 20 | 33 | 23 | 20 | 15,180 | 12,144 | 40 | 4.3 | 5.7 |
| 21 | 30 | 19 | 19 | 10,830 | 8664 | 29 | 3.9 | 5.4 |
| 22 | 23 | 18 | 14 | 5796 | 4637 | 15 | 3.0 | 4.0 |
| 23 | 30 | 22 | 17 | 11,220 | 8976 | 30 | 3.9 | 4.9 |
| 24 | 40 | 30 | 22 | 26,400 | 21,120 | 70 | 5.2 | 6.3 |
| 25 | 34 | 18 | 17 | 10,404 | 8323 | 28 | 4.4 | 4.9 |
| Average | 31.5 | 21.7 | 17 | 12,213 | 9786 | 33 | 4.1 | 4.8 |
| Sample | Long Axis (cm) | Intermediate Axis (cm) | Short Axis (cm) | Volume (cm3) | Adjust to 80% | Weight (kg) | EWH Nott [17] (m) | EWH Pepe et al. [19] (m) |
|---|---|---|---|---|---|---|---|---|
| 1 | 29 | 20 | 16 | 9280 | 7424 | 25 | 3.7 | 4.6 |
| 2 | 30 | 19 | 18 | 10,260 | 8208 | 27 | 3.9 | 5.2 |
| 3 | 34 | 20 | 16 | 10,880 | 8704 | 29 | 4.4 | 4.6 |
| 4 | 26 | 15 | 15 | 5850 | 4680 | 16 | 3.4 | 4.3 |
| 5 | 29 | 20 | 14 | 8120 | 6496 | 22 | 3.7 | 4.0 |
| 6 | 26 | 21 | 12 | 6552 | 5242 | 17 | 3.4 | 3.4 |
| 7 | 24 | 20 | 14 | 6720 | 5376 | 18 | 3.1 | 4.0 |
| 8 | 21 | 16 | 8 | 2688 | 2150 | 7 | 2.7 | 2.3 |
| 9 | 20 | 19 | 13 | 4940 | 3952 | 13 | 2.6 | 3.7 |
| 10 | 17 | 17 | 16 | 4624 | 3699 | 12 | 2.2 | 4.6 |
| 11 | 18 | 15 | 13 | 3510 | 2808 | 9 | 2.3 | 3.7 |
| 12 | 26 | 17 | 10 | 4420 | 3536 | 12 | 3.4 | 2.9 |
| 13 | 27 | 20 | 16 | 8640 | 6912 | 23 | 3.5 | 4.6 |
| 14 | 27 | 20 | 10 | 5400 | 4320 | 14 | 3.5 | 2.9 |
| 15 | 32 | 24 | 15 | 11,520 | 9216 | 31 | 4.1 | 4.3 |
| 16 | 24 | 12 | 11 | 3168 | 2534 | 8 | 3.1 | 3.1 |
| 17 | 30 | 20 | 13 | 7800 | 6240 | 21 | 3.9 | 3.7 |
| 18 | 28 | 27 | 12 | 13,608 | 10,886 | 36 | 3.6 | 3.4 |
| 19 | 20 | 15 | 6 | 1800 | 1440 | 5 | 2.6 | 1.7 |
| 20 | 18 | 13 | 8 | 1872 | 1498 | 5 | 2.3 | 2.3 |
| 21 | 26 | 20 | 8 | 4160 | 3328 | 11 | 3.4 | 2.3 |
| 22 | 26 | 22 | 13 | 7436 | 5949 | 20 | 3.4 | 3.7 |
| 23 | 25 | 20 | 8 | 4000 | 3200 | 11 | 3.2 | 2.3 |
| 24 | 25 | 20 | 10 | 5000 | 4000 | 13 | 3.2 | 2.9 |
| 25 | 20 | 15 | 8 | 2400 | 1920 | 6 | 2.6 | 2.3 |
| Average | 25 | 18.7 | 12 | 6186 | 4949 | 16 | 3.2 | 3.5 |
References
- Farsani, N.T.; Coelho, C.; Costa, C. Geotourism and geoparks as novel strategies for socio-economic development in rural areas. Int. J. Tour. Res. 2011, 13, 68–81. [Google Scholar] [CrossRef]
- Olafsdóttir, R.; Dowling, R. Geotourism and geoparks—A tool for geoconservation and rural development in vulnerable environments: A case study from Iceland. Geoheritage 2014, 6, 71–87. [Google Scholar] [CrossRef]
- Dahl, R.M.E.; Carstens, H.; Haukdal, G. The election of a National Norwegian Geological Monument: At tool for raising awareness of geological Heritage. GeoJ. Tour. Geosites 2011, 4, 178–184. [Google Scholar]
- Prestvik, T. Alpine-type mafic and ultramafic rocks of Leka, Nord-Trøndelog. Nor. Geol. Unders. 1972, 273, 23–24. [Google Scholar]
- Pedersen, R.-B.; Johannesen, G.M.; Boyd, R. Stratiform platinum-group element mineralization in the ultramafic cumulates of the Leka Ophiolite Complex, Central Norway. Econ. Geol. 1993, 88, 782–803. [Google Scholar] [CrossRef]
- Johnson, M.E.; Ledesma-Vázquez, J.; Guardado-France, R. Coastal geomorphology of a Holocene hurricane deposit on a Pleistocene marine terrace from Isla Carmen (Baja California Sur, Mexico). J. Mar. Sci. Eng. 2018, 6, 108. [Google Scholar] [CrossRef]
- Johnson, M.E.; Guardado-France, R.; Johnson, E.M.; Ledesma-Vázquez, J. Geomorphology of a Holocene Hurricane deposit eroded from rhyolite sea cliffs on Ensenada Almeja (Baja California Sur, Mexico). J. Mar. Sci. Eng. 2019, 7, 193. [Google Scholar] [CrossRef]
- Johnson, M.E.; Guardado-France, R.; Ledesma-Vázquez, J. Holocene hurricane deposits eroded as coastal barriers from andesite sea cliffs at Puerto Escondido (Baja California Sur, Mexico). J. Mar. Sci. Eng. 2020, 8, 75. [Google Scholar] [CrossRef]
- Ávila, S.P.; Johnson, M.E.; Rebelo, A.C.; Baptista, L.; Melo, C.S. Comparison of modern and Pleistocene (MIS 5e) coastal Boulder deposits from Santa Maria Island (Azores Archipelago, NE Atlantic Ocean). J. Mar. Sci. Eng. 2020, 8, 386. [Google Scholar] [CrossRef]
- Jones, B.; Boudjelas, S.; Mitchelson-Jacob, E.G. Topographic steering of winds in Vestfjorden, Norway. Weather 1997, 52, 304–311. [Google Scholar] [CrossRef]
- Høgaas, F.; Sveian, H. The Younger Dryas Main Line on Leka Norway, as determined from a high resolution digital elevation model derived from airborne LiDAR data. Geomorphology 2015, 231, 63–71. [Google Scholar] [CrossRef]
- Burzynski, M. Gros Morne National Park; Breakwater Books, Ltd.: St. John’s, NL, Canada, 1999. [Google Scholar]
- Wentworth, C.K. A scale of grade and class terms for clastic sediments. J. Geol. 1922, 27, 377–392. [Google Scholar] [CrossRef]
- Ruban, D.A. Costal boulder deposits of the Neogene world: A synopsis. J. Mar. Sci. Eng. 2019, 7, 446. [Google Scholar] [CrossRef]
- Sneed, E.D.; Folk, R.L. Pebbles in the lower Colorado River of Texas: A study in particle morphogenesis. J. Geol. 1958, 66, 114–150. [Google Scholar] [CrossRef]
- Leka Commune Authority. Leka Turkart (målestokk 1:35 000). Single-Sheet Folded Map; Leka Commune Authority: Stockholm, Sweden, 2017. [Google Scholar]
- Nott, J. Waves, coastal bolder deposits and the importance of pre-transport setting. Earth Planet. Sci. Lett. 2003, 210, 269–276. [Google Scholar] [CrossRef]
- Nandasena, N.A.K.; Paris, R.; Tanaka, N. Reassessment of hydrodynamic equations: Minimum flow velocity to initiate boulder transport by high energy events (storms, tsunamis). Mar. Geol. 2011, 281, 70–84. [Google Scholar] [CrossRef]
- Pepe, F.; Corradino, M.; Parrino, N.; Besio, G.; Presti, V.L.; Renda, P.; Calcagnile, L.; Quarta, G.; Sulli, A.; Antonioli, F. Boulder coastal deposits at Favignana Island rocky coast (Sicily, Italy): Litho-structural and hydrodynamic control. Geomorphology 2018, 303, 191–209. [Google Scholar] [CrossRef]
- Nash, G.; Smiseth, M.T. Art and intimacy within the prehistoric landscapes of Norway. In Ritual Landscapes and Borders within Rock Art Research; Stebergløkken, H., Berge, R., Lindgaard, E., Stuedal, H.V., Eds.; Archaeopress Publ. Ltd.: Oxford, UK, 2015; pp. 31–46. ISBN 978-1-78491-159-1. [Google Scholar]
- Møller, J.J. Shoreline relation and prehistoric settlement in northern Norway. Nor. Geogr. Tidsskr. 1987, 41, 45–60. [Google Scholar] [CrossRef]
- May, S.M.; Engel, M.; Brill, D.; Squire, P.; Scheffers, A.; Kelletat, D. Coastal hazards from tropical cyclones and extratropical winter storms based on Holocene storm chronologies. In Coastal Hazards; Finkl, C.W., Ed.; Springer: Berlin/Heidelberg, Germany, 2013; Volume 6, pp. 557–585. [Google Scholar]
- Dass, P. The Trumpet of Nordland; Helgaland Museum: Mosjøen, Norway, 2015. [Google Scholar]
- Kvamme, D.; Abildsnes, H. Ekstremev Ær Rapport DAGMAR, 25 December 2011. Norsk Meteorologisk Institute. 2012, Dagmar E-Rapport. p. 52. Available online: https://www.met.no/publikasjoner/met-info/ekstremvaer/_/attachment/download/69803fbb-7c26-41ce-83e9-0479891c043d:c28f40bfb1fd2c4a07672bd8132b40bcc44717c3/dagmar-e-rapport.pdf (accessed on 21 August 2020).
- Anonymous. Ekstremev Ær Rapport HILDE, 16–17 November 2013. Norsk Meteorologisk Institute. 2013. Hilde E-Rapport. p. 19. Available online: https://www.met.no/publikasjoner/met-info/ekstremvaer/_/attachment/download/eacf68c3-9237-417b-b8bc-6feb2af01dea:ccc0476b8d4ecb716bd14a80b8da590c71971b55/ekstrem_rapport_hilde.pdf (accessed on 21 August 2020).
- Anonymous. Ekstremev Ær Rapport TOR, 29–30 January 2016. Norsk Meteorologisk Institute. 2016. Tor E-Rapport. p. 19. Available online: https://www.met.no/publikasjoner/met-info/ekstremvaer/_/attachment/download/f9f30fbc-e10a-43bf-8ac8-54f35139ced7:04f39c24d58c79b43cdcf924b62e4192e5d3926c/MET-info-14-2016.pdf (accessed on 21 August 2020).
- Olsen, A.-M.; Berge, H. Ekstremev Ær Rapport CORA, January 2018. Norsk Meteorologisk Institute. 2018. Cora E-Rapport. p. 16. Available online: https://www.met.no/publikasjoner/met-info/ekstremvaer/_/attachment/download/099ee978-df9a-4a35-88f1-9b8ece0ccea1:d9f7f511ab78b9e517275c3818b72880d4626310/Met-info-14-2018.pdf (accessed on 21 August 2020).
- Pielou, E.C. The Energy of Nature; University of Chicago Press: Chicago, IL, USA, 2001. [Google Scholar]
- Kennedy, A.B.; Mori, N.; Yasuda, T.; Shimozono, T.; Tomiczek, T.; Donahue, A.; Shimura, T.; Imai, Y. Extreme block and boulder transport along a cliffed coastline (Calicoan Island, Philippines) during Super Typhoon Haiyan. Mar. Geol. 2017, 383, 65–77. [Google Scholar] [CrossRef]
- Cox, R.; Jahn, K.L.; Watkins, O.G.; Cox, P. Extraordinary boulder transport by storm waves (west of Ireland, winter 2013–2014), and criteria for analyzing coastal boulder deposits. Earth Sci. Rev. 2018, 177, 623–636. [Google Scholar] [CrossRef]


| Støypet Locality | Number of Samples | Average Boulder Volume (cm3) | Average Boulder Weight (kg) | EAWH (m) Nott [17] | EAWH (m) Pepe et al. [19] | Max. Boulder Volume (cm3) | Max. Boulder Weight (kg) | EMWH (m) Nott [17] | EMWH (m) Pepe et al. [19] |
|---|---|---|---|---|---|---|---|---|---|
| 1 | 25 | 8136 | 27 | 3.6 | 4.6 | 33,600 | 112 | 6.5 | 7.7 |
| 2 | 25 | 9786 | 33 | 4.1 | 4.8 | 21,120 | 70 | 5.2 | 7.2 |
| 3 | 25 | 4949 | 16 | 3.2 | 3.5 | 10,886 | 36 | 3.6 | 5.2 |
| Average | 25 | 7624 | 25 | 3.6 | 4.3 | 21,869 | 73 | 5.1 | 6.7 |
| Storm Name | Date of Landfall | Direction of Arrival | Maximum Wind Speed (m/s) | Maximum Wave Height (m) |
|---|---|---|---|---|
| Dagmar [24] | 25 December 2011 | SW to W | 35–40 | Unknown |
| Hilde [25] | 16 November 2013 | SW | 40–50 | 12–24 |
| Tor [26] | 7 January 2016 | SW | 35–45 | 9–12 |
| Cora [27] | 1 January 2018 | SW to NW | 45–55 | Unknown |
© 2020 by the author. Licensee MDPI, Basel, Switzerland. This article is an open access article distributed under the terms and conditions of the Creative Commons Attribution (CC BY) license (http://creativecommons.org/licenses/by/4.0/).
Share and Cite
Johnson, M.E. Holocene Boulder Beach Eroded from Chromite and Dunite Sea Cliffs at Støypet on Leka Island (Northern Norway). J. Mar. Sci. Eng. 2020, 8, 644. https://doi.org/10.3390/jmse8090644
Johnson ME. Holocene Boulder Beach Eroded from Chromite and Dunite Sea Cliffs at Støypet on Leka Island (Northern Norway). Journal of Marine Science and Engineering. 2020; 8(9):644. https://doi.org/10.3390/jmse8090644
Chicago/Turabian StyleJohnson, Markes E. 2020. "Holocene Boulder Beach Eroded from Chromite and Dunite Sea Cliffs at Støypet on Leka Island (Northern Norway)" Journal of Marine Science and Engineering 8, no. 9: 644. https://doi.org/10.3390/jmse8090644
APA StyleJohnson, M. E. (2020). Holocene Boulder Beach Eroded from Chromite and Dunite Sea Cliffs at Støypet on Leka Island (Northern Norway). Journal of Marine Science and Engineering, 8(9), 644. https://doi.org/10.3390/jmse8090644