Reduction of Wave Overtopping and Force Impact at Harbor Quays Due to Very Oblique Waves

 ,
,  ,
,  ,
, 

Abstract
1. Introduction
2. Overtopping and Force Reduction
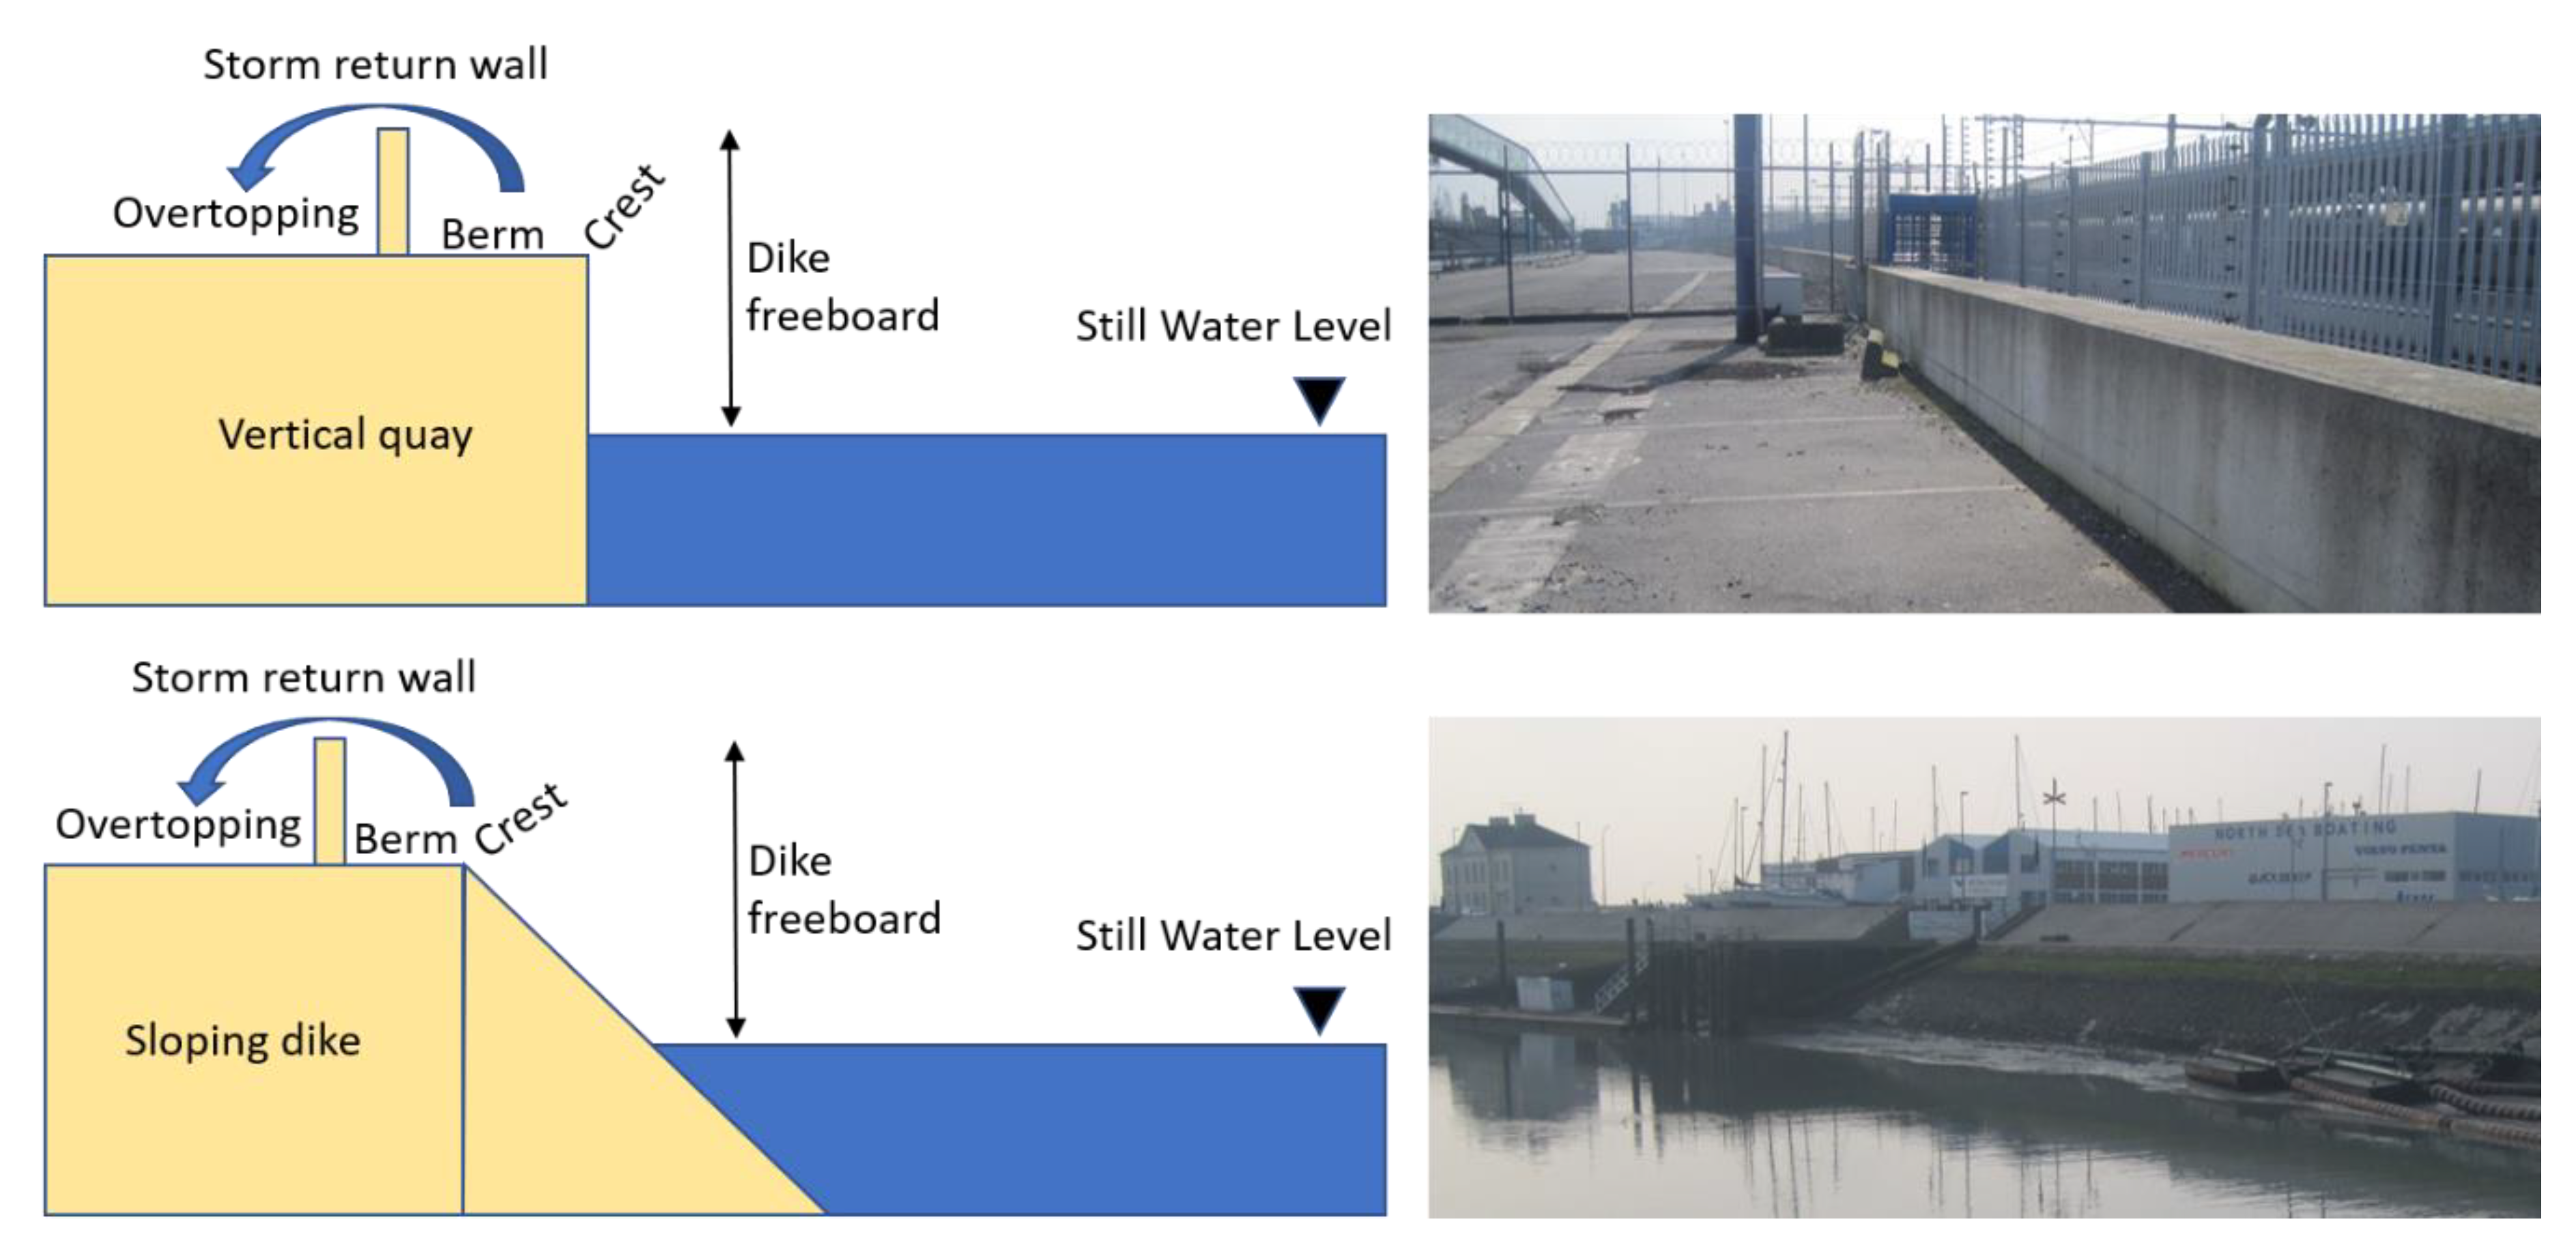
2.1. Vertical Quay
2.2. Sloping Dike
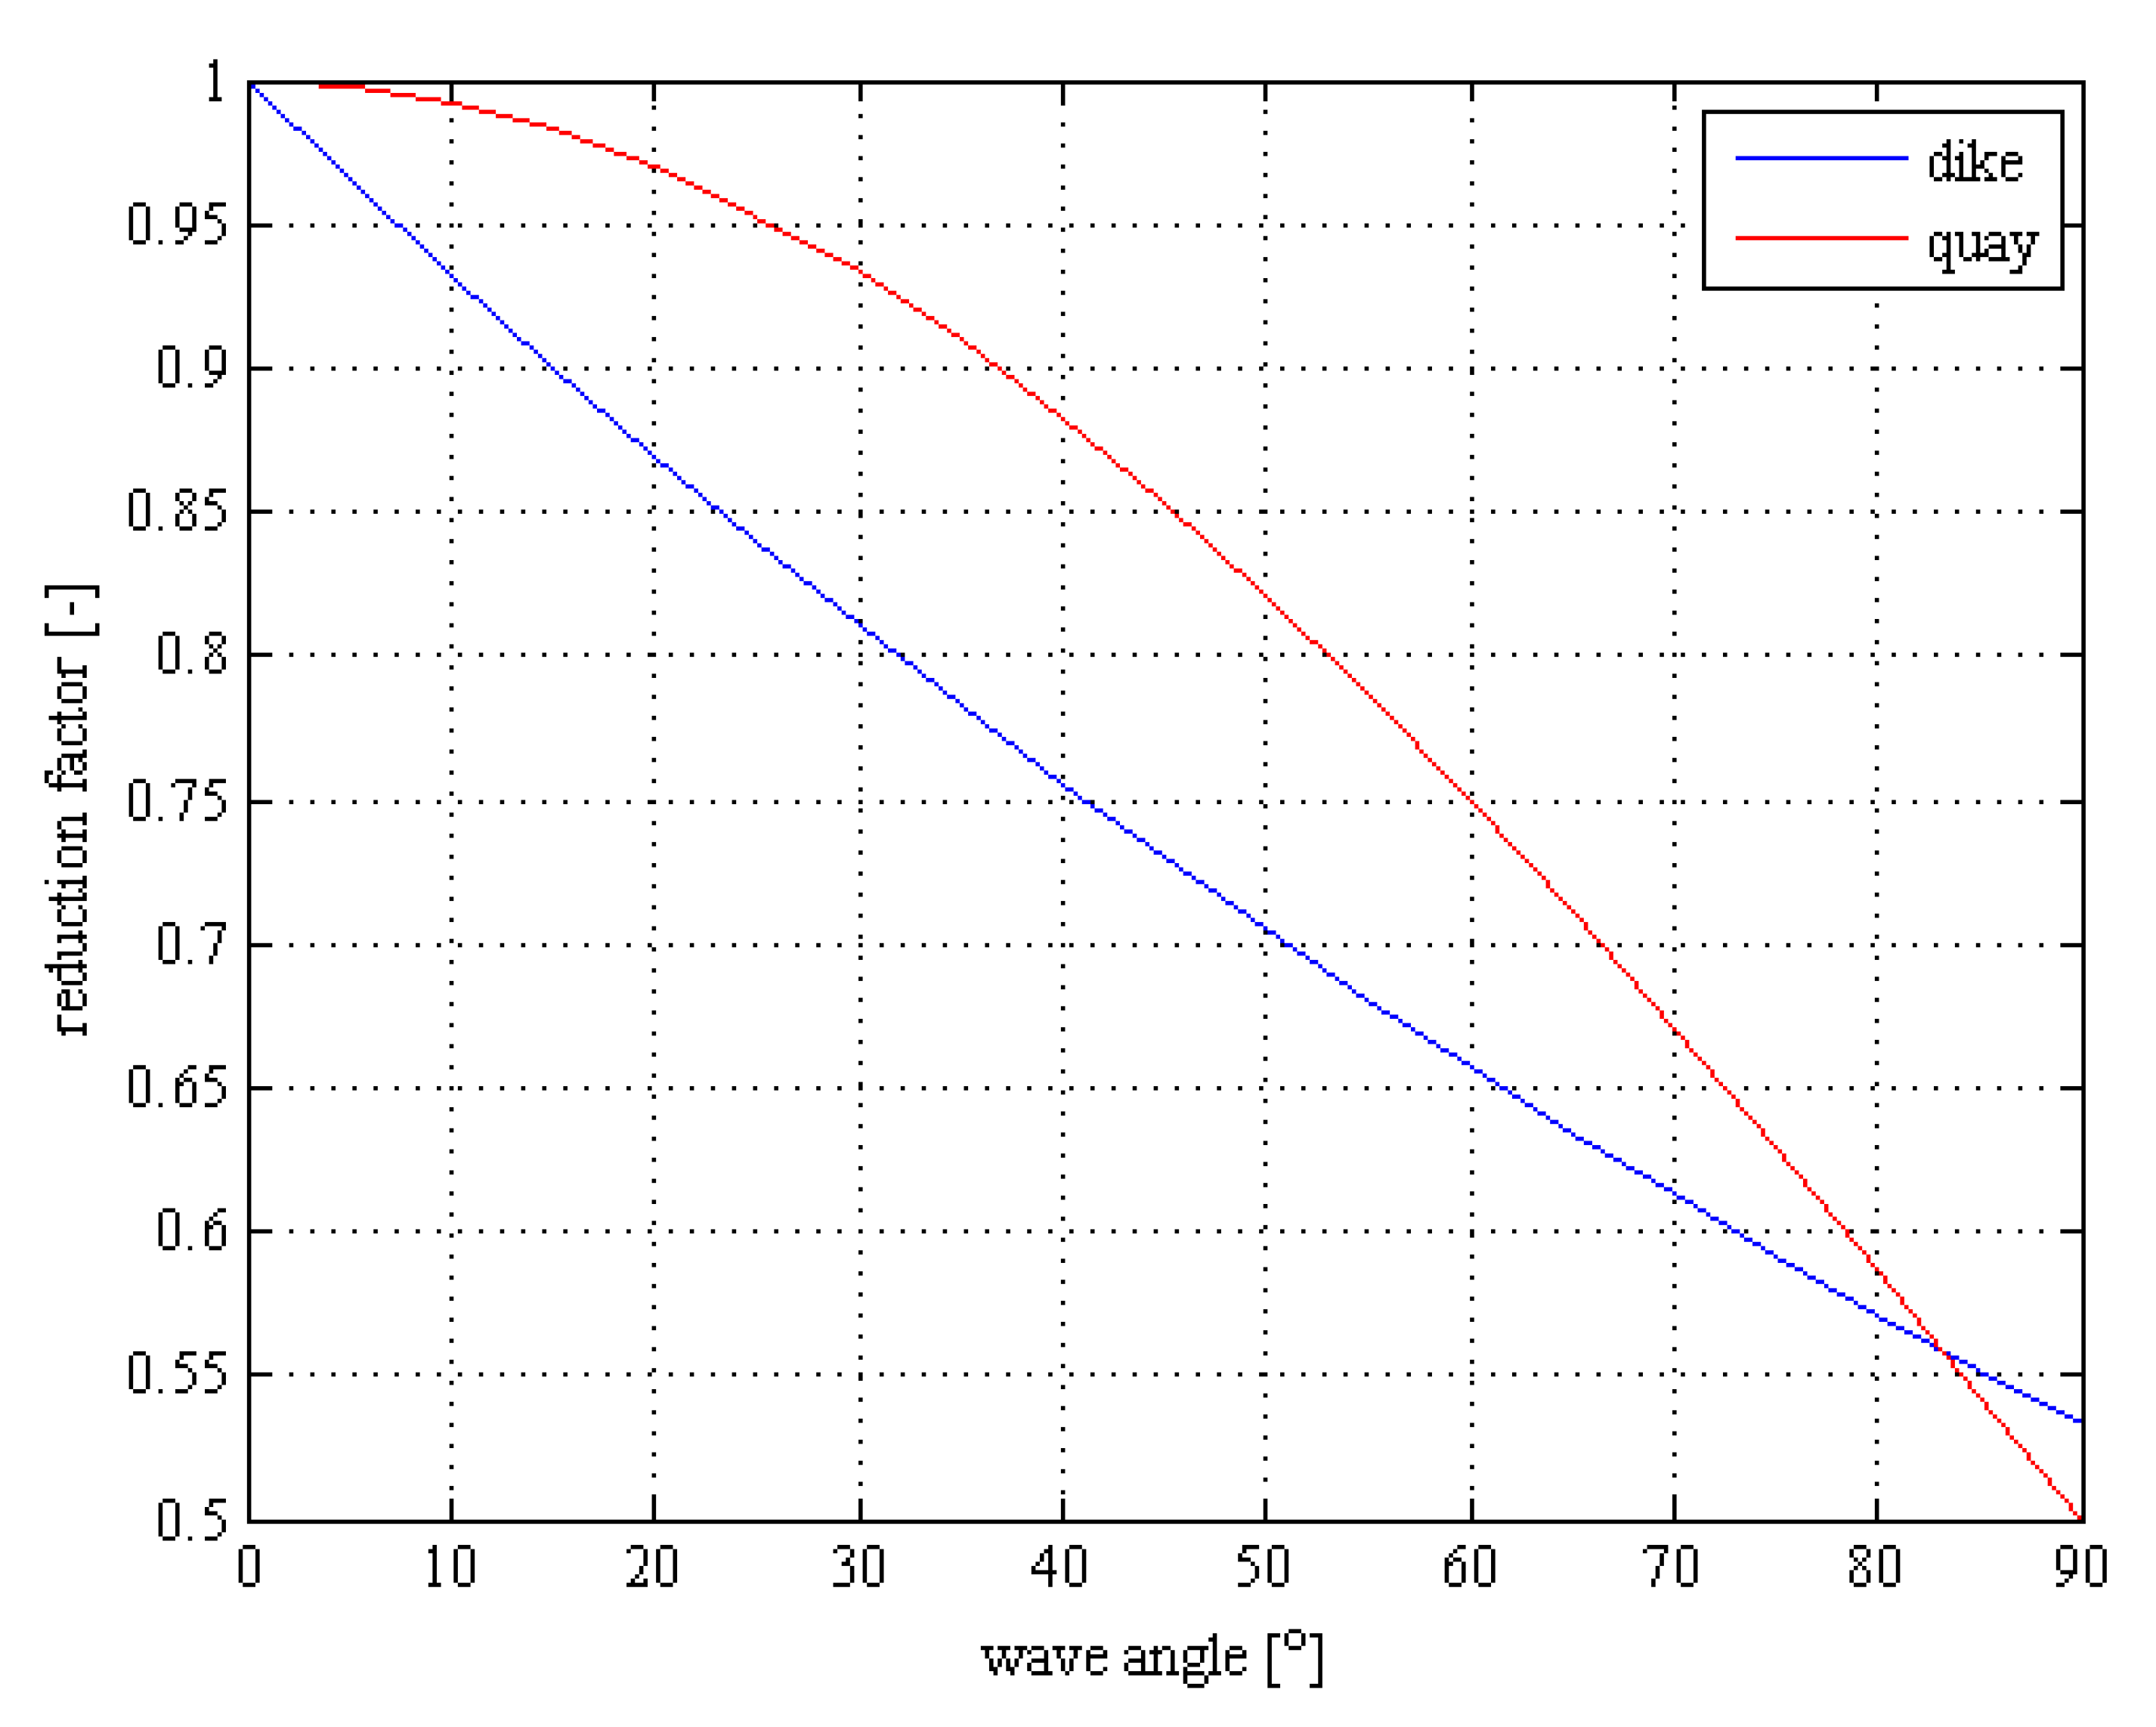
2.3. Force Reduction
3. Methods and Instrumentation
3.1. Model Settings of Overtopping Tests
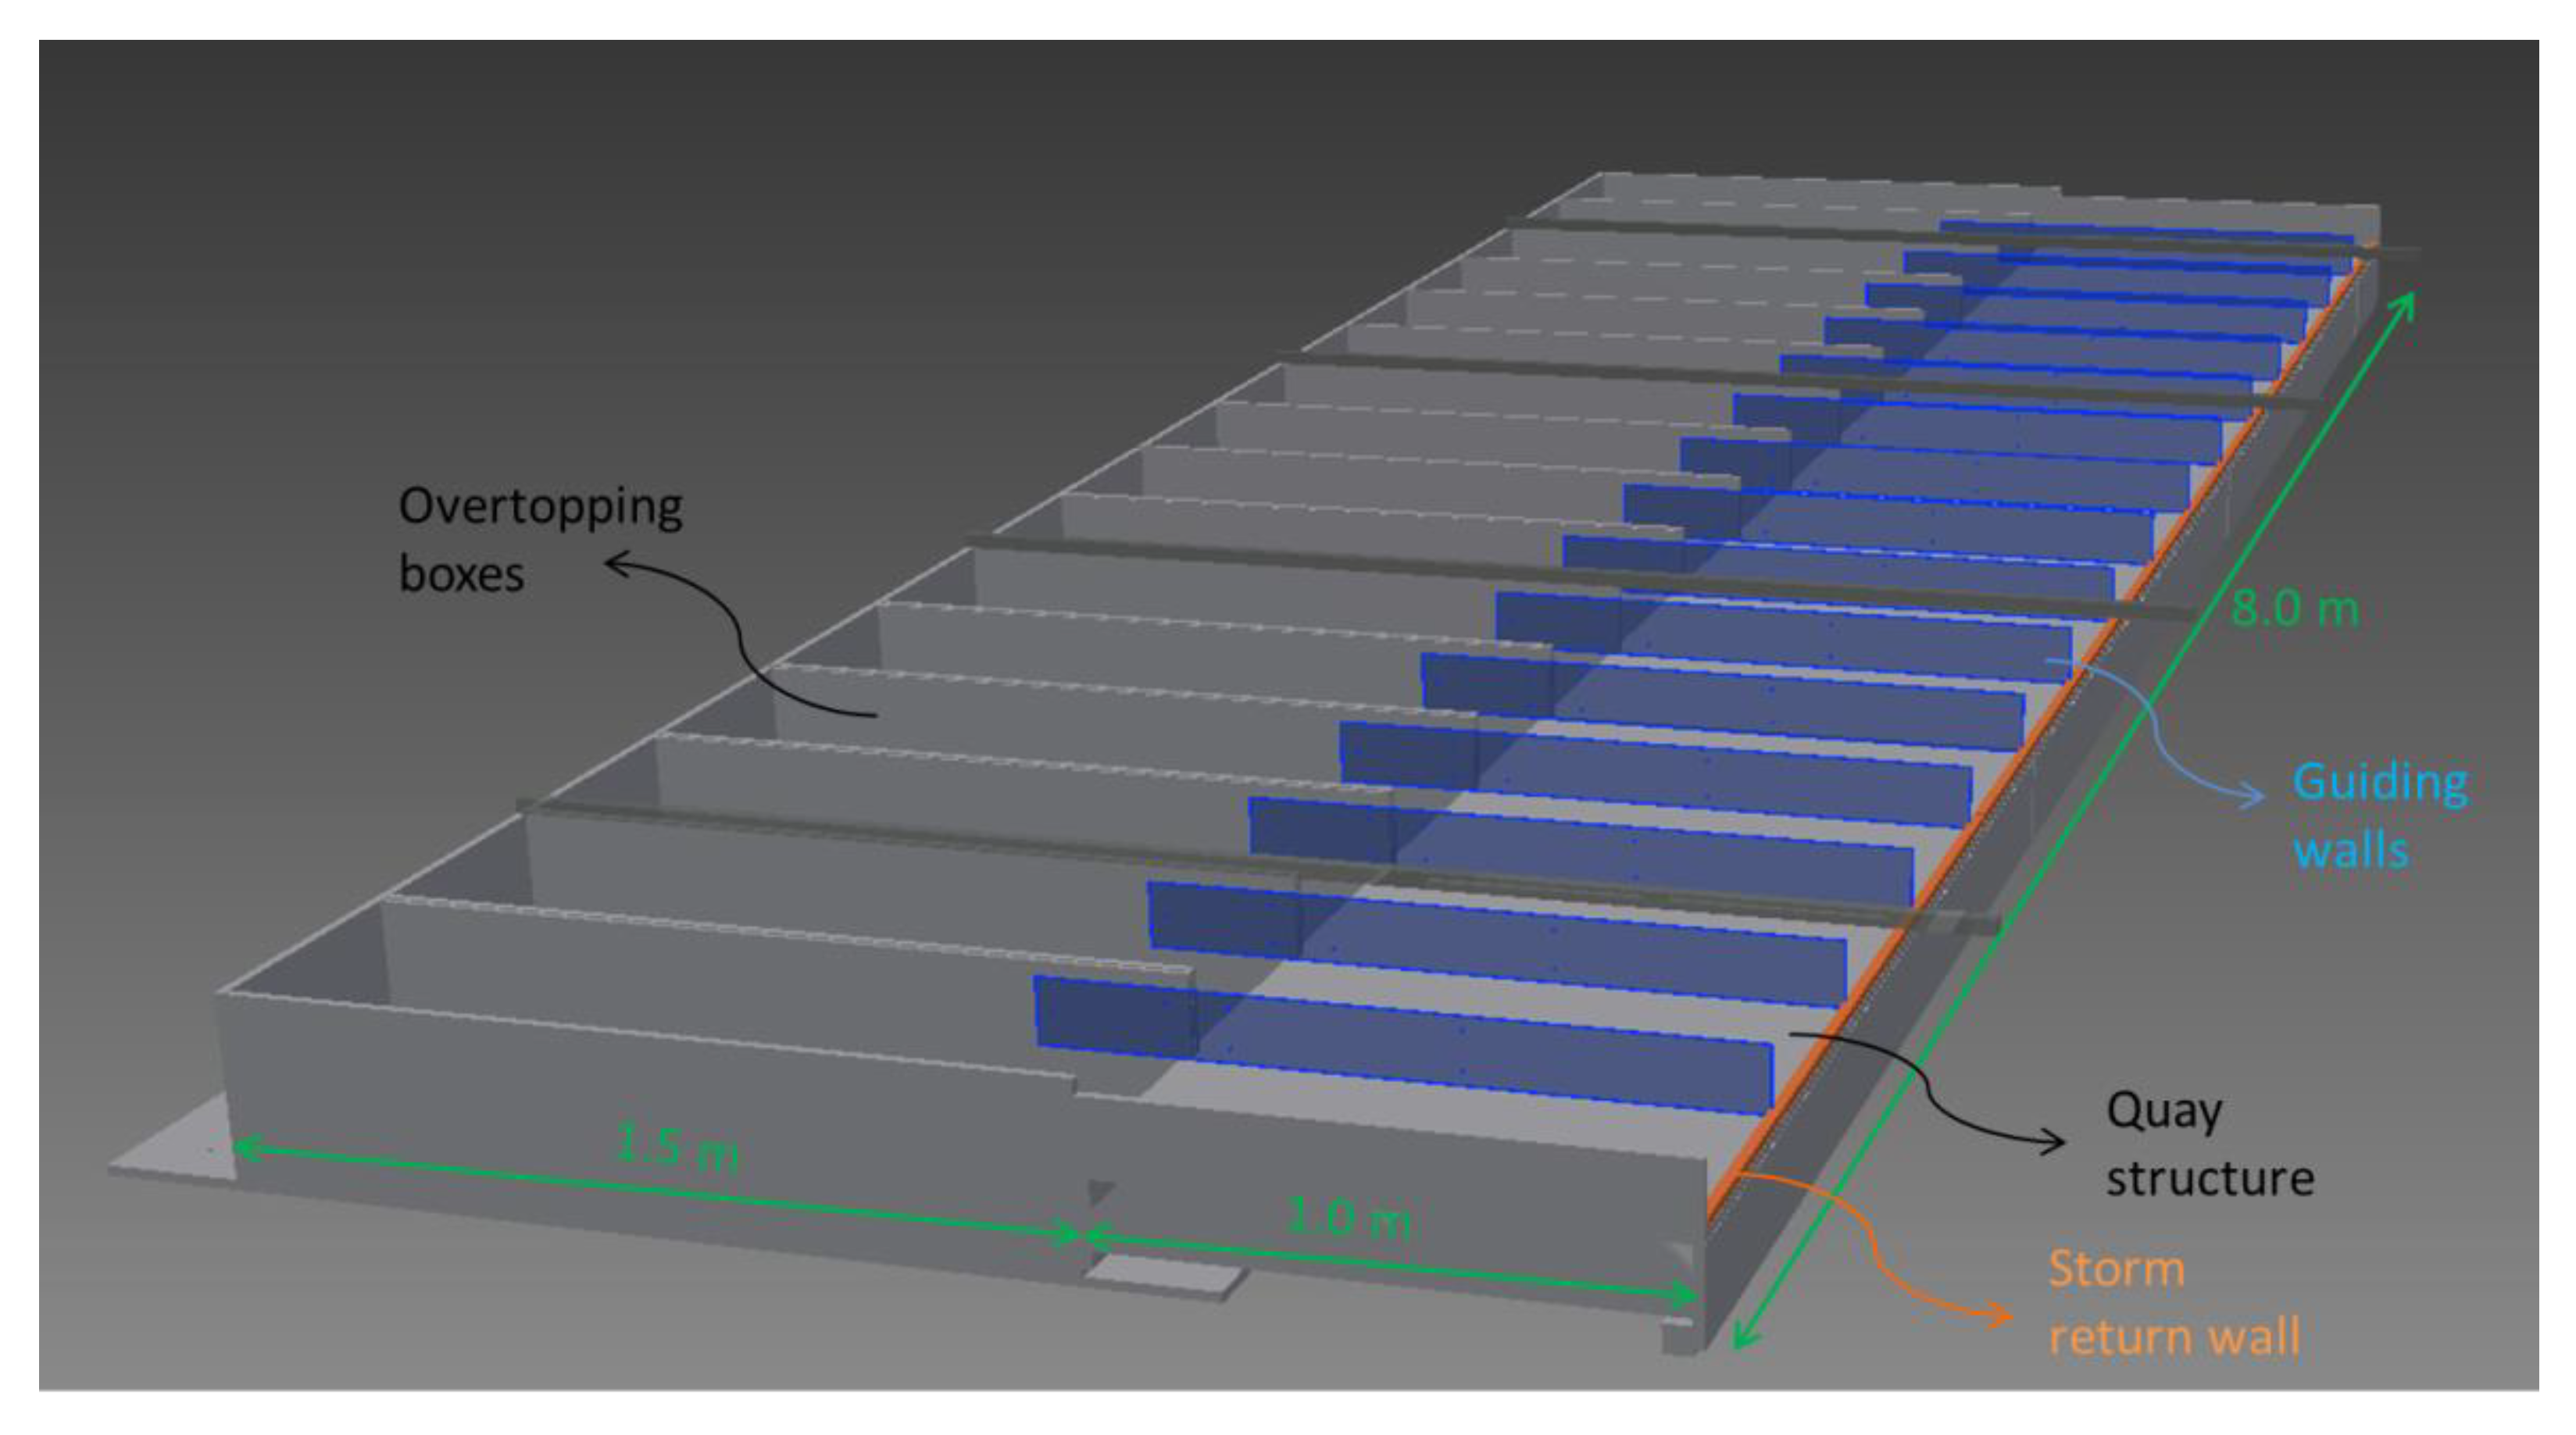
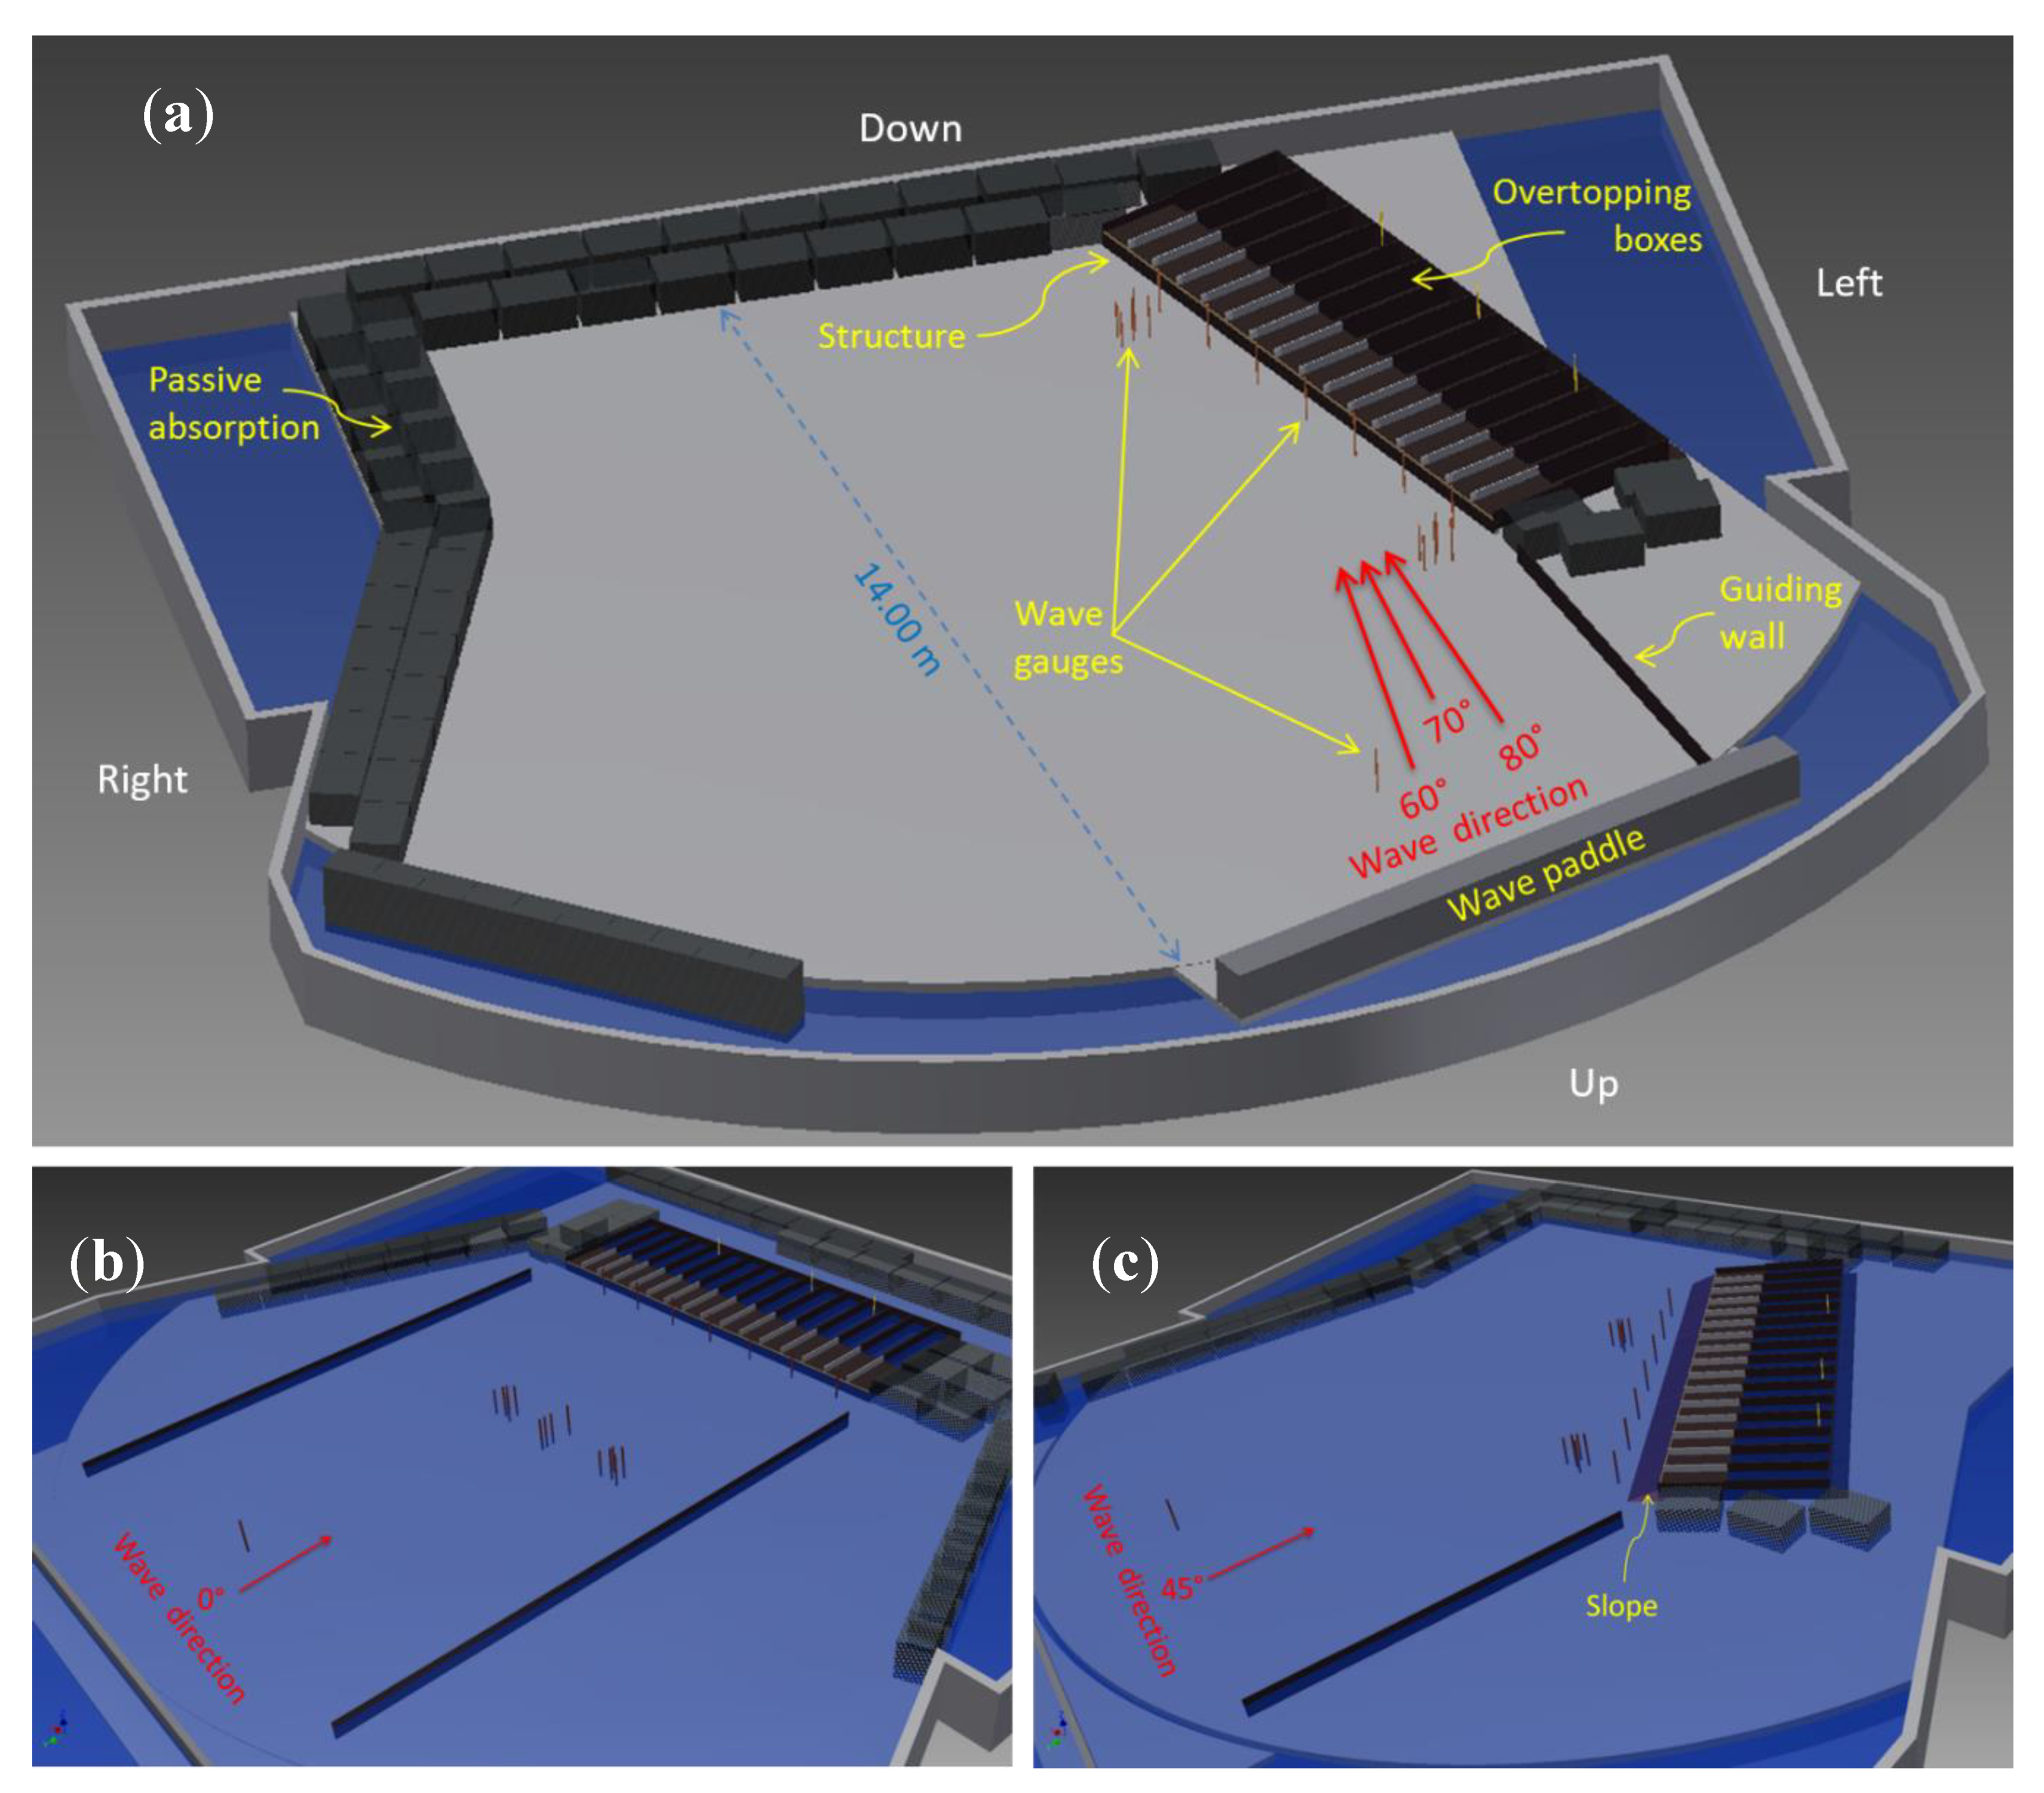
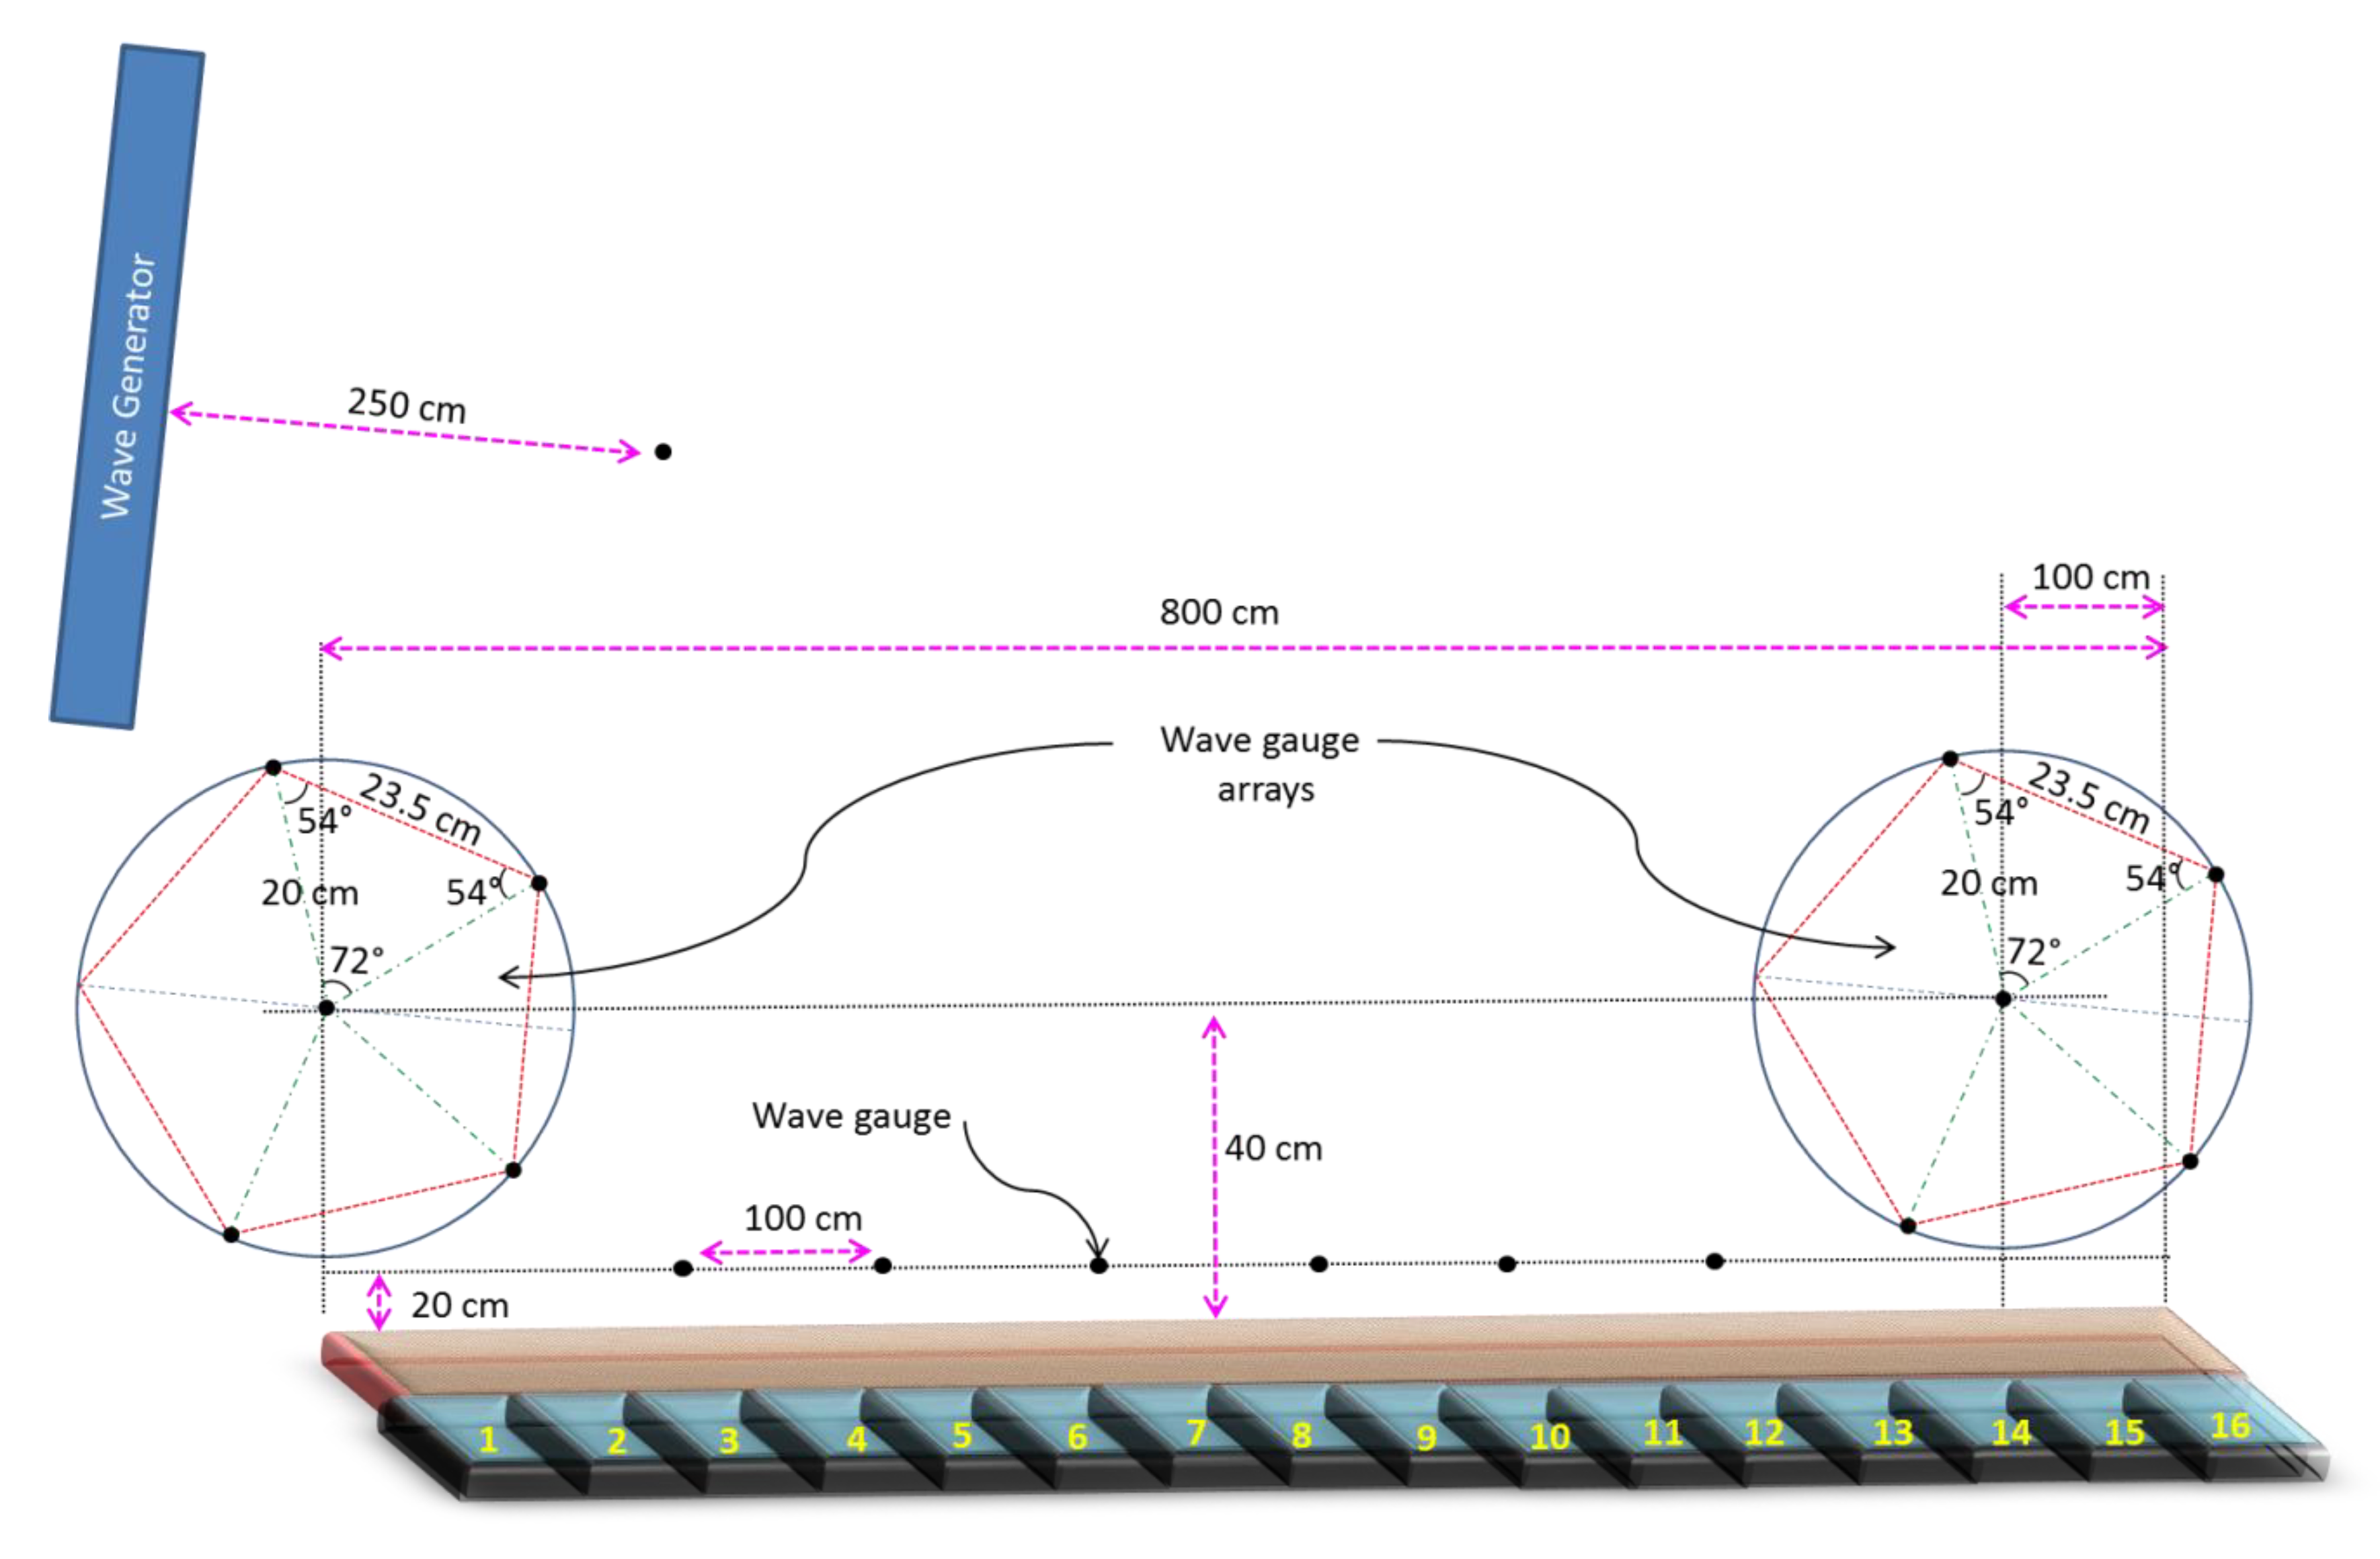
3.1.1. Instrumentation
3.1.2. Test Programme
- -
- For each test the berm length was calculated as a distance between the edge (crest) of the quay (sea dike) and the crown wall.
- -
- For each angle the projection of the berm length was measured on the wave direction; this is the effective berm length that the wave has to run before reaching the wall.
- -
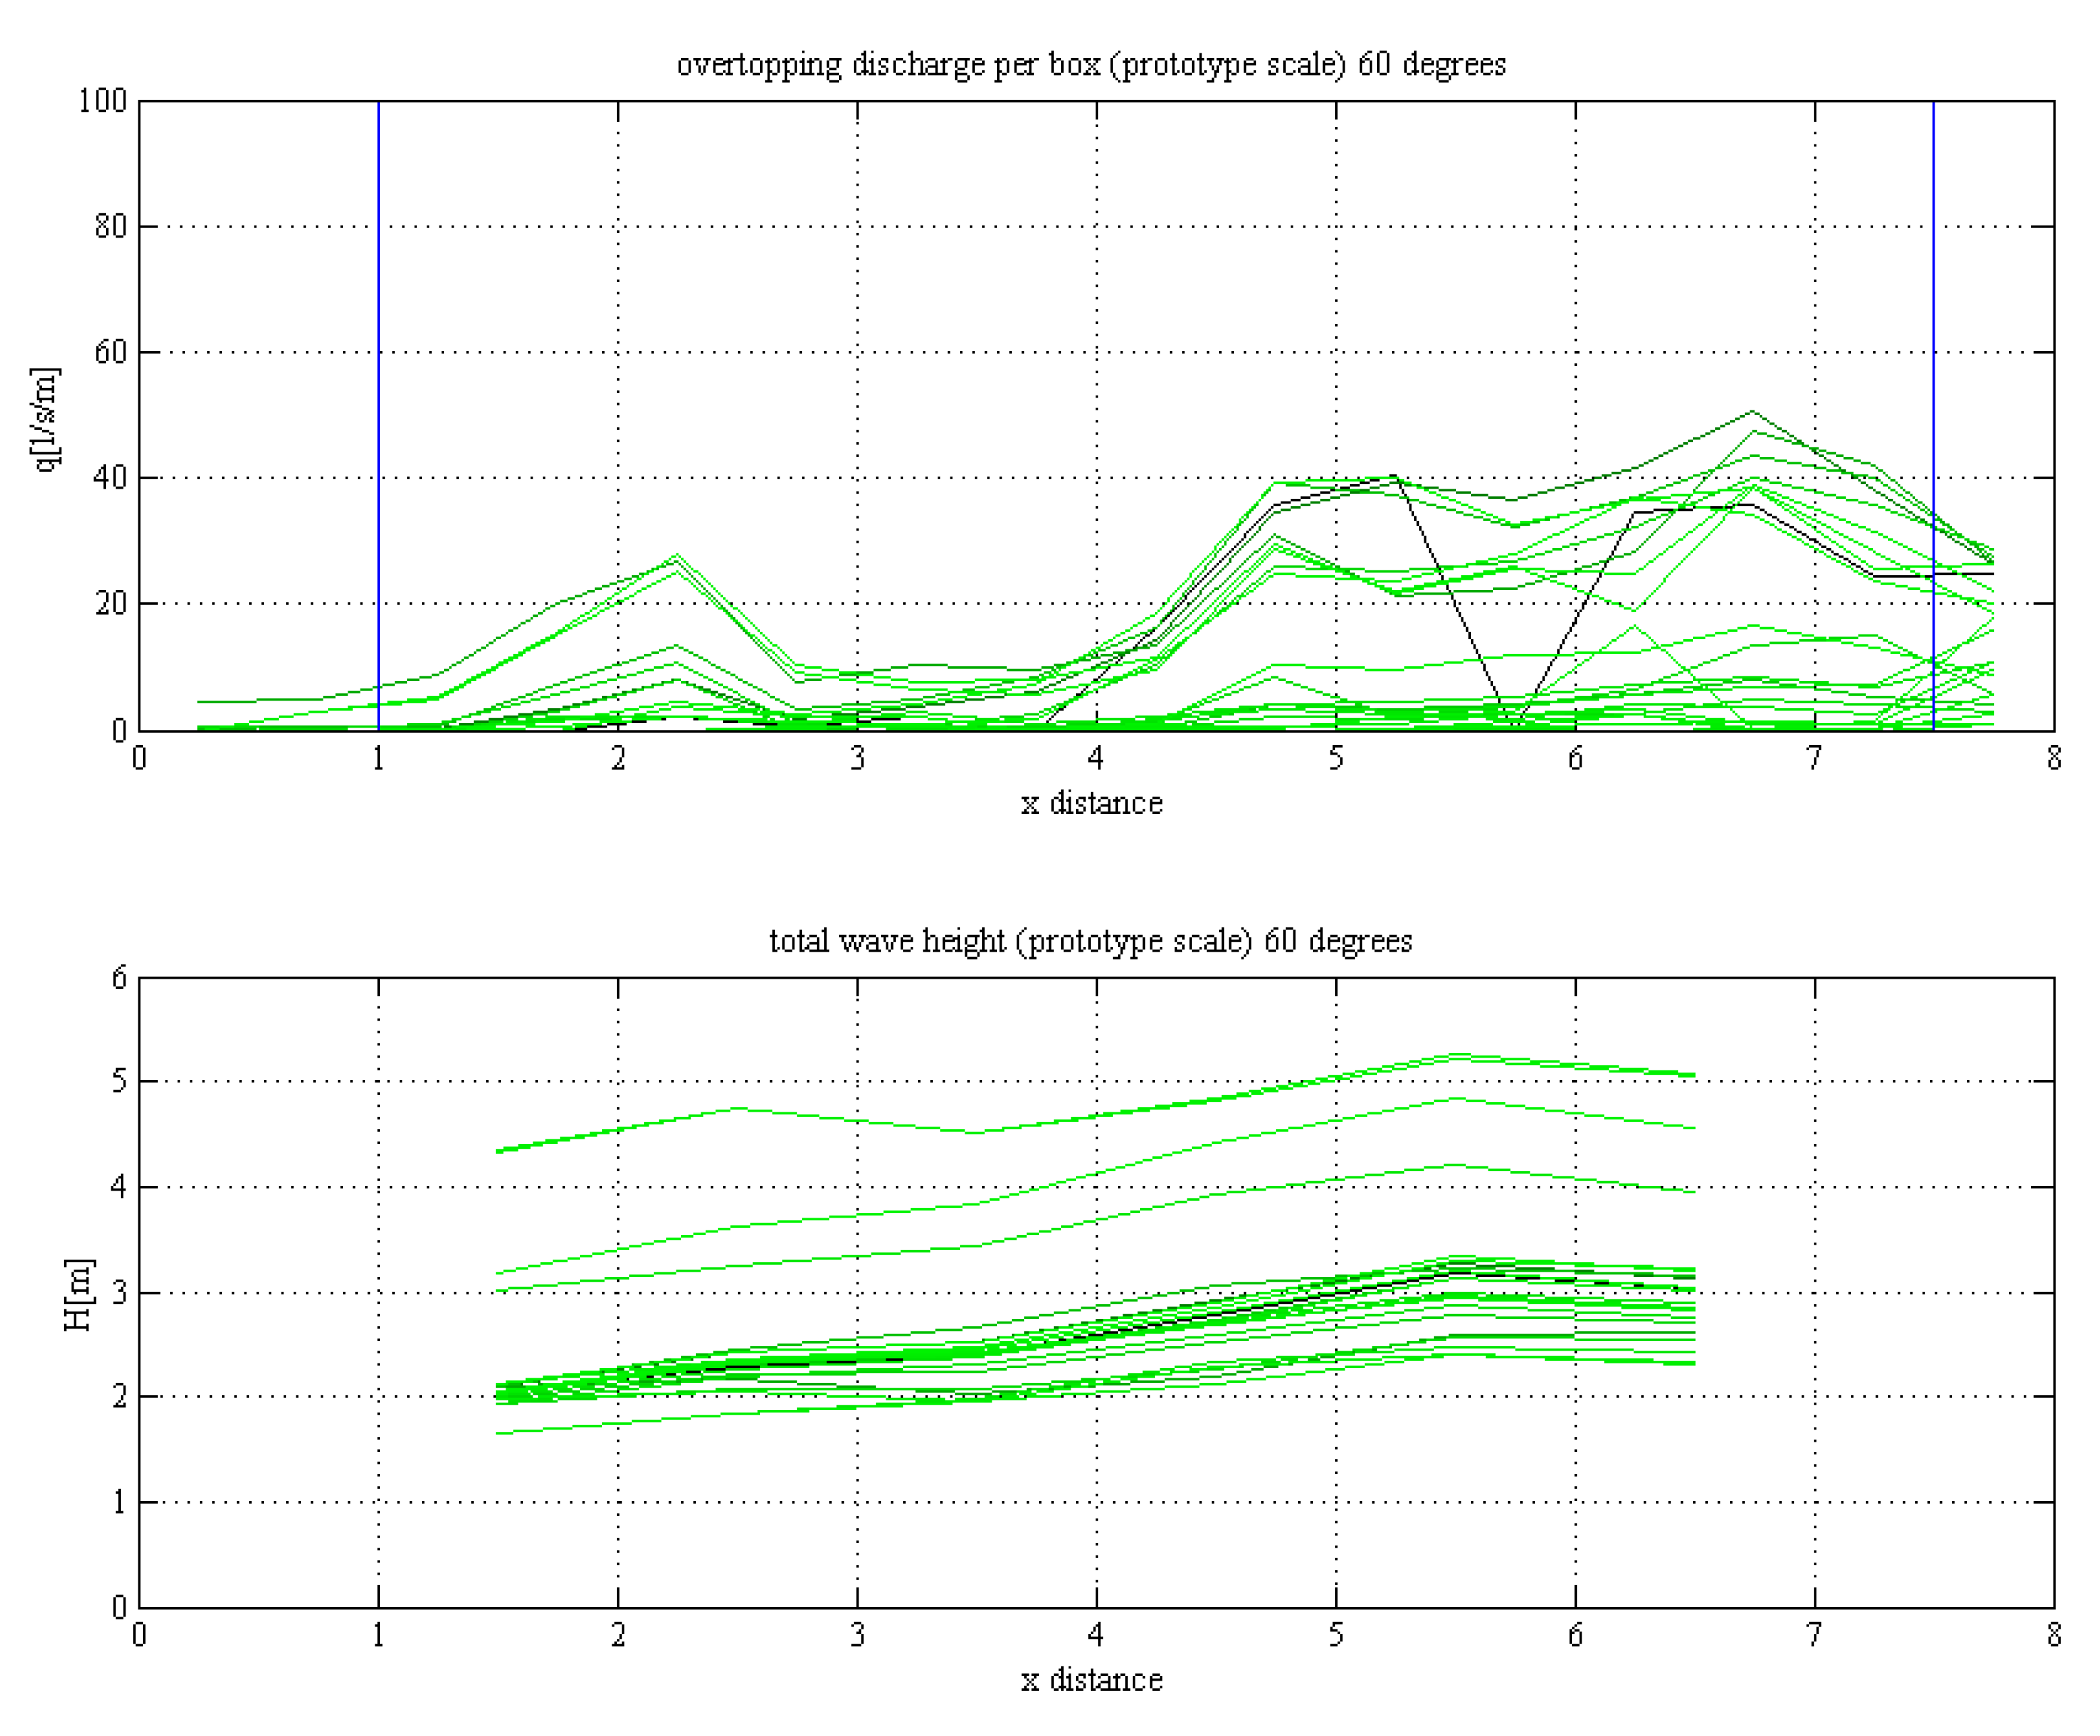
- To calculate the mean overtopping for the entire quay some buffer zones at both edges of the structure were skipped (where possible model effects are noticed). For instance, in the case with no crown wall or crown wall on the quay edge, the entire quay length (8 m) was considered excluding the two overtopping boxes situated at the edges of the structure.
- -
- It was verified on video recordings that the peaks in the overtopping volume were not due to model effects (boundary reflection), but they were due to the wave attack.
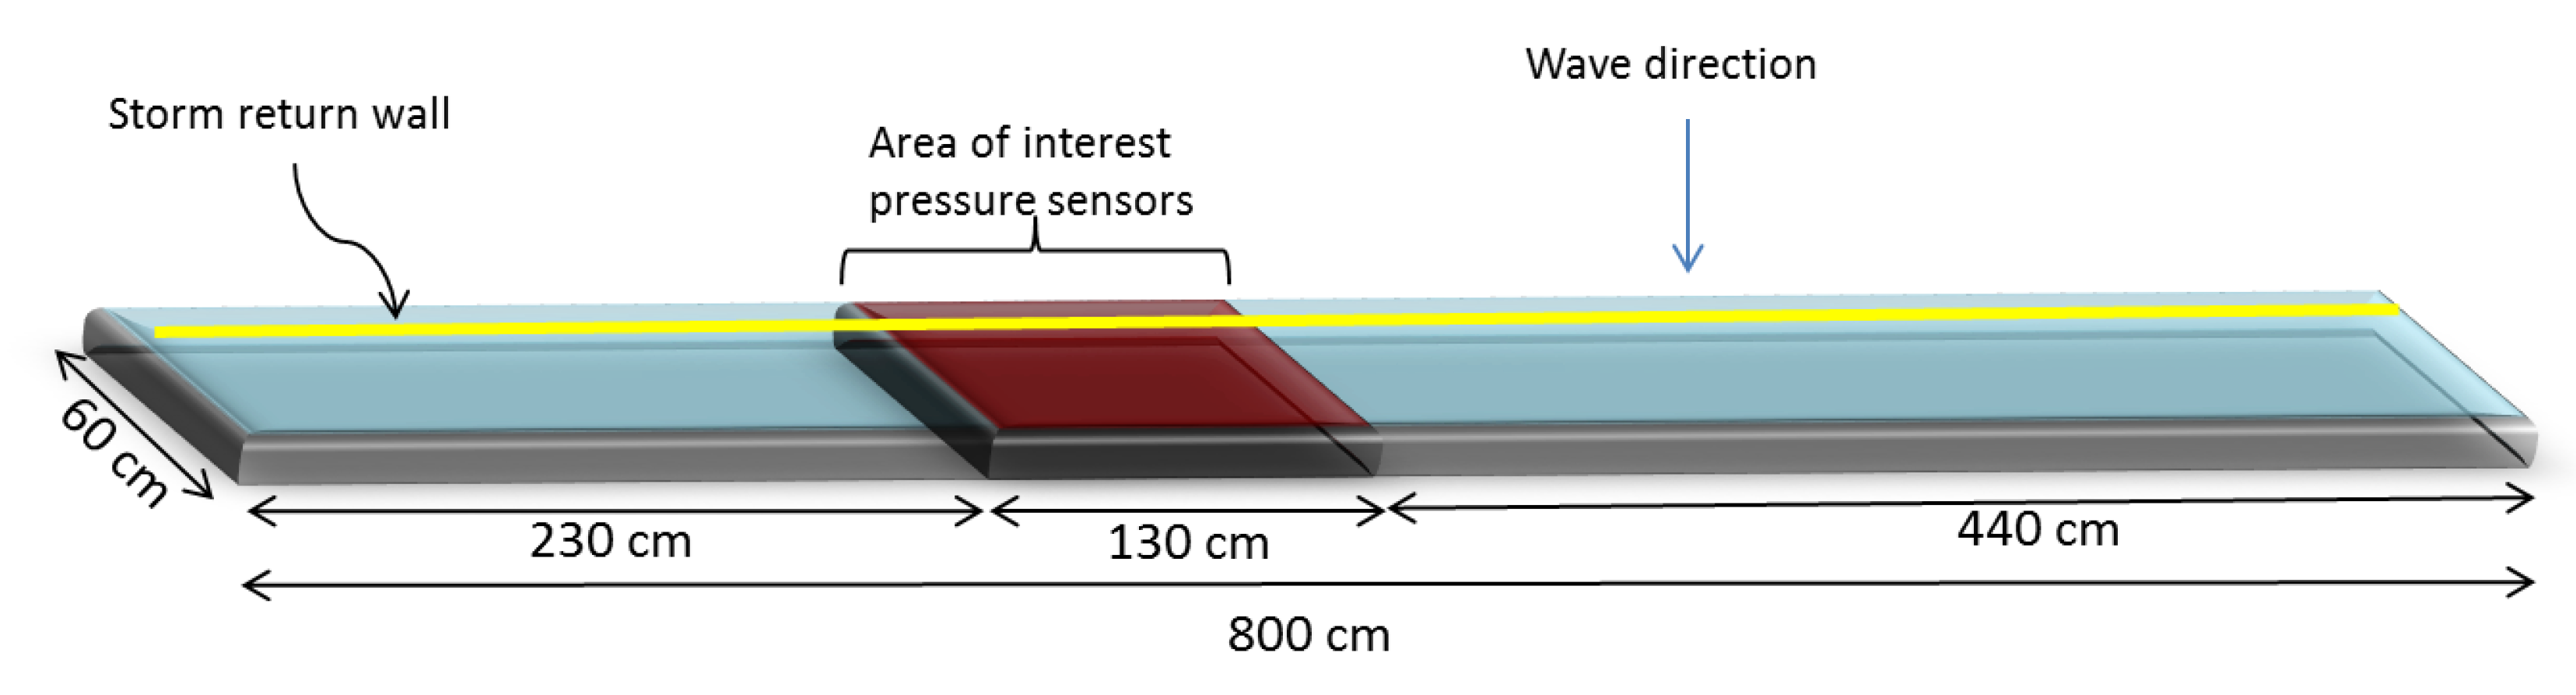
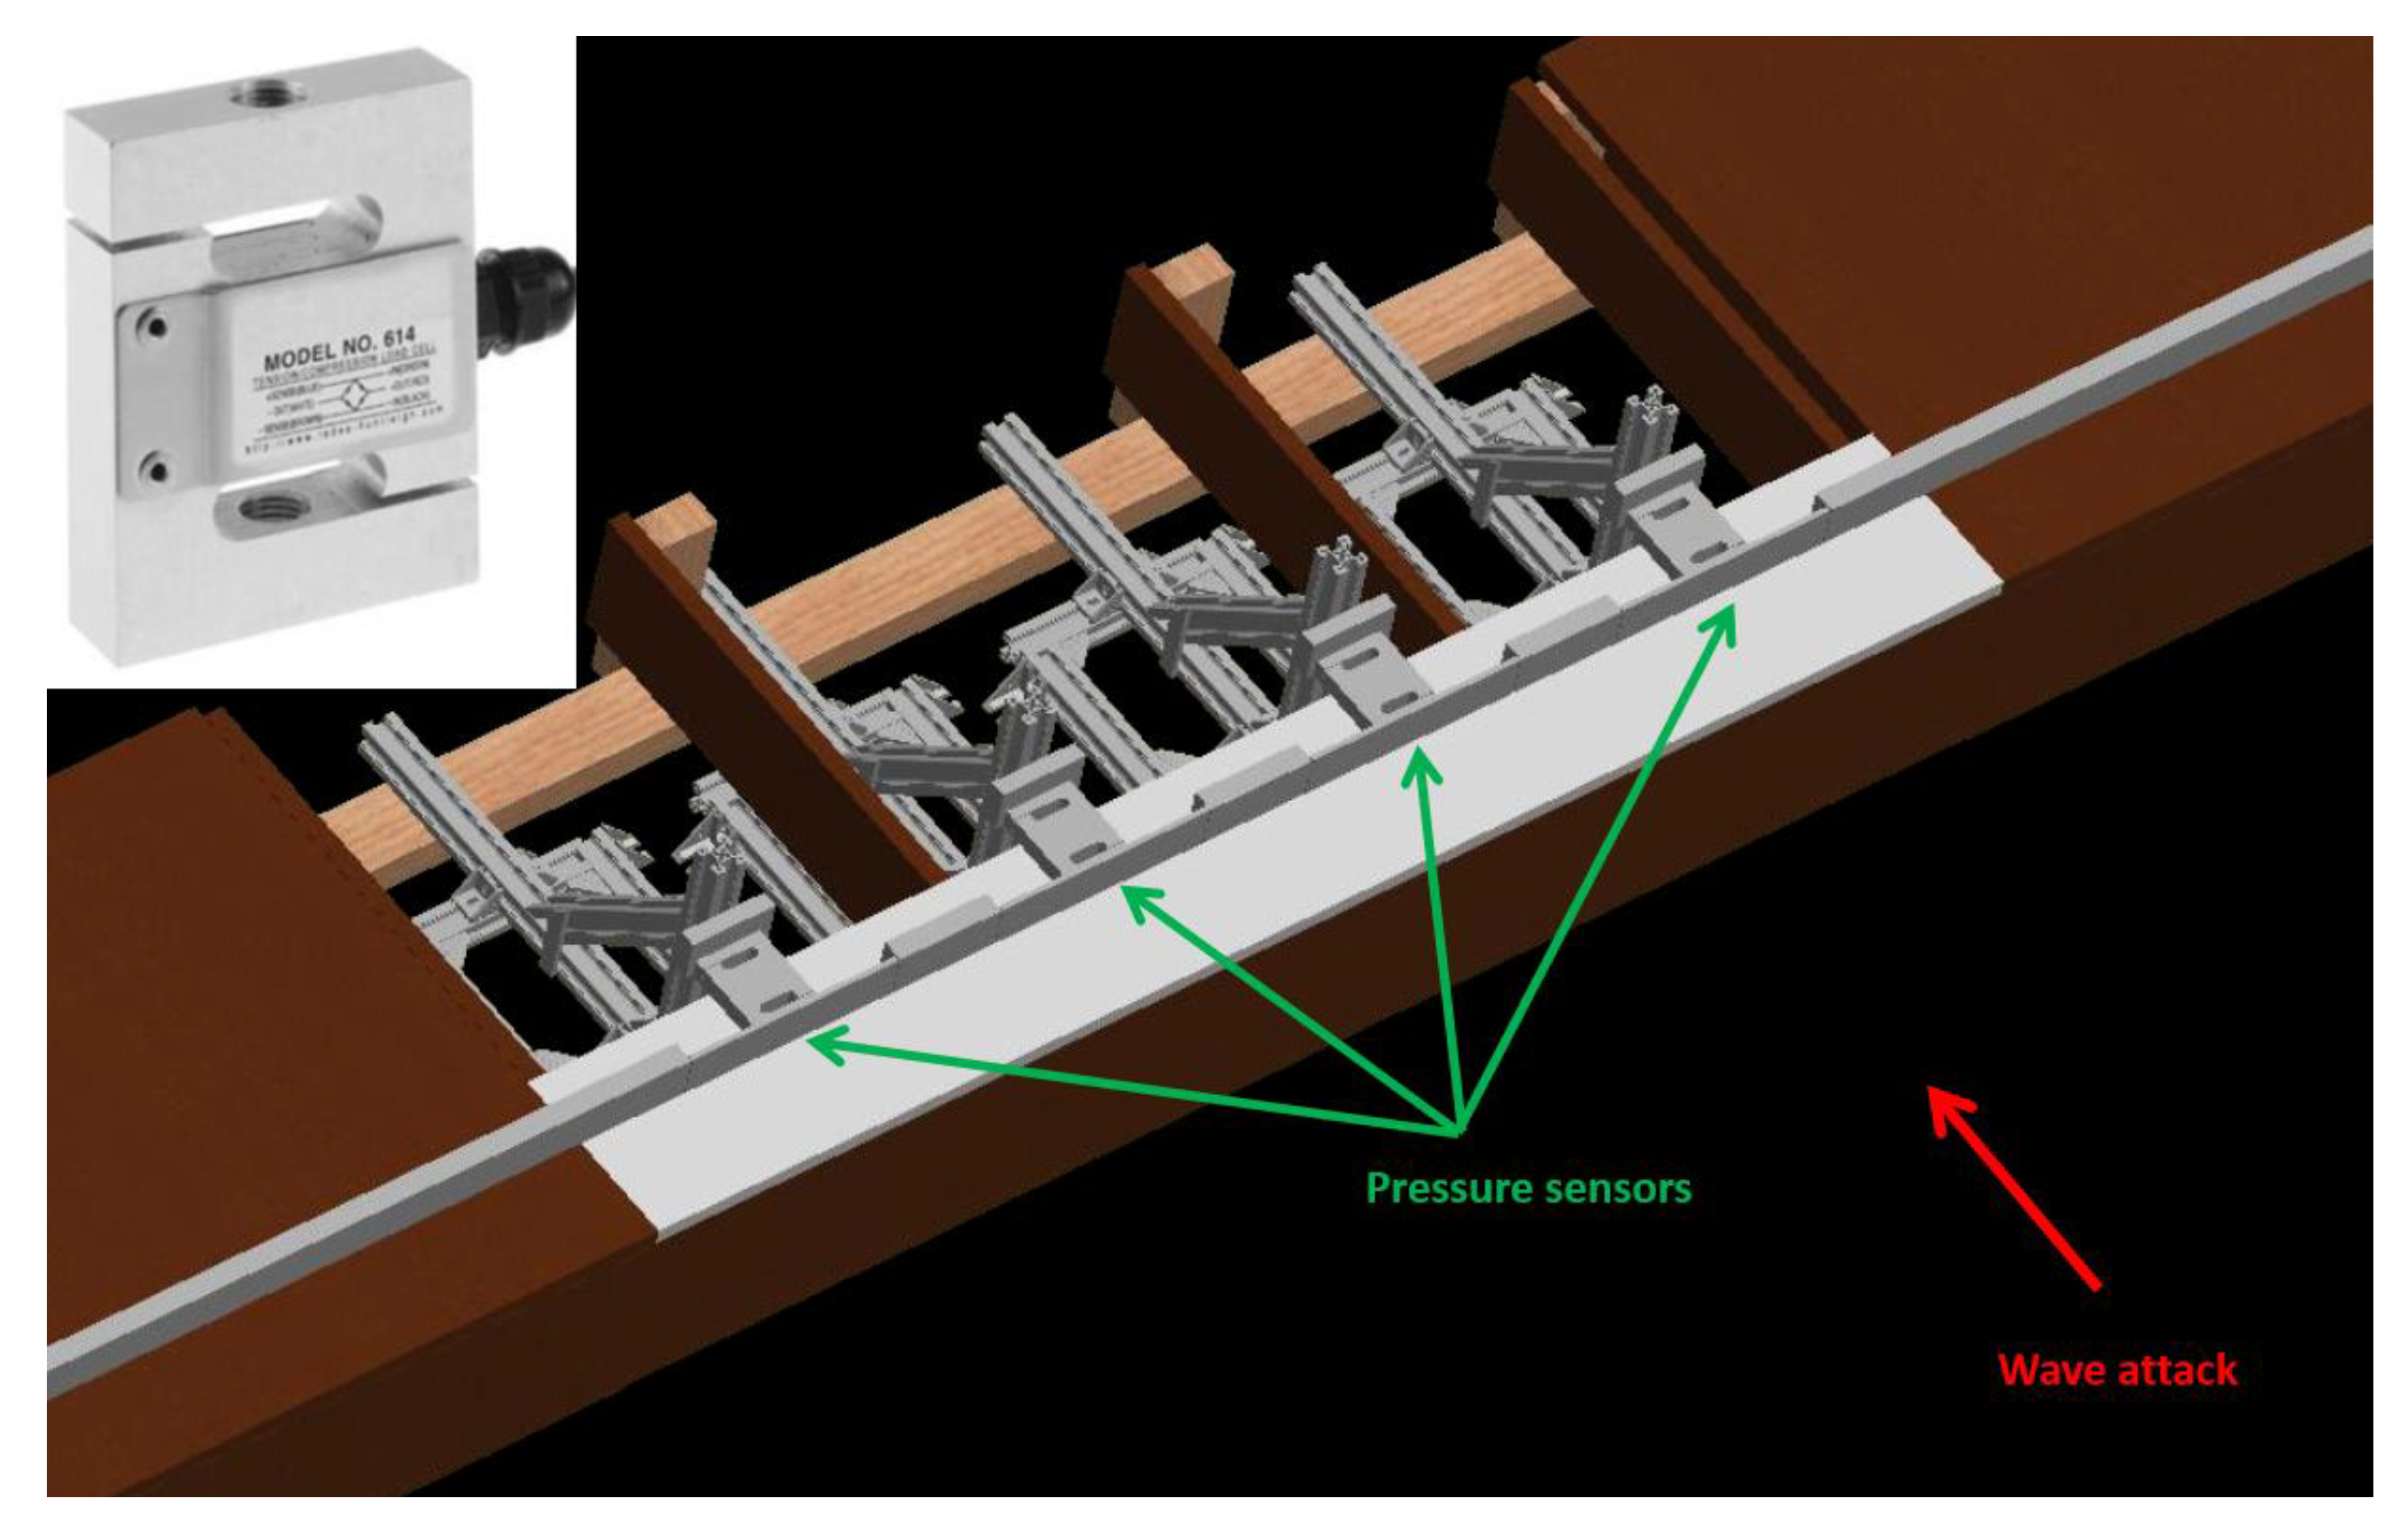
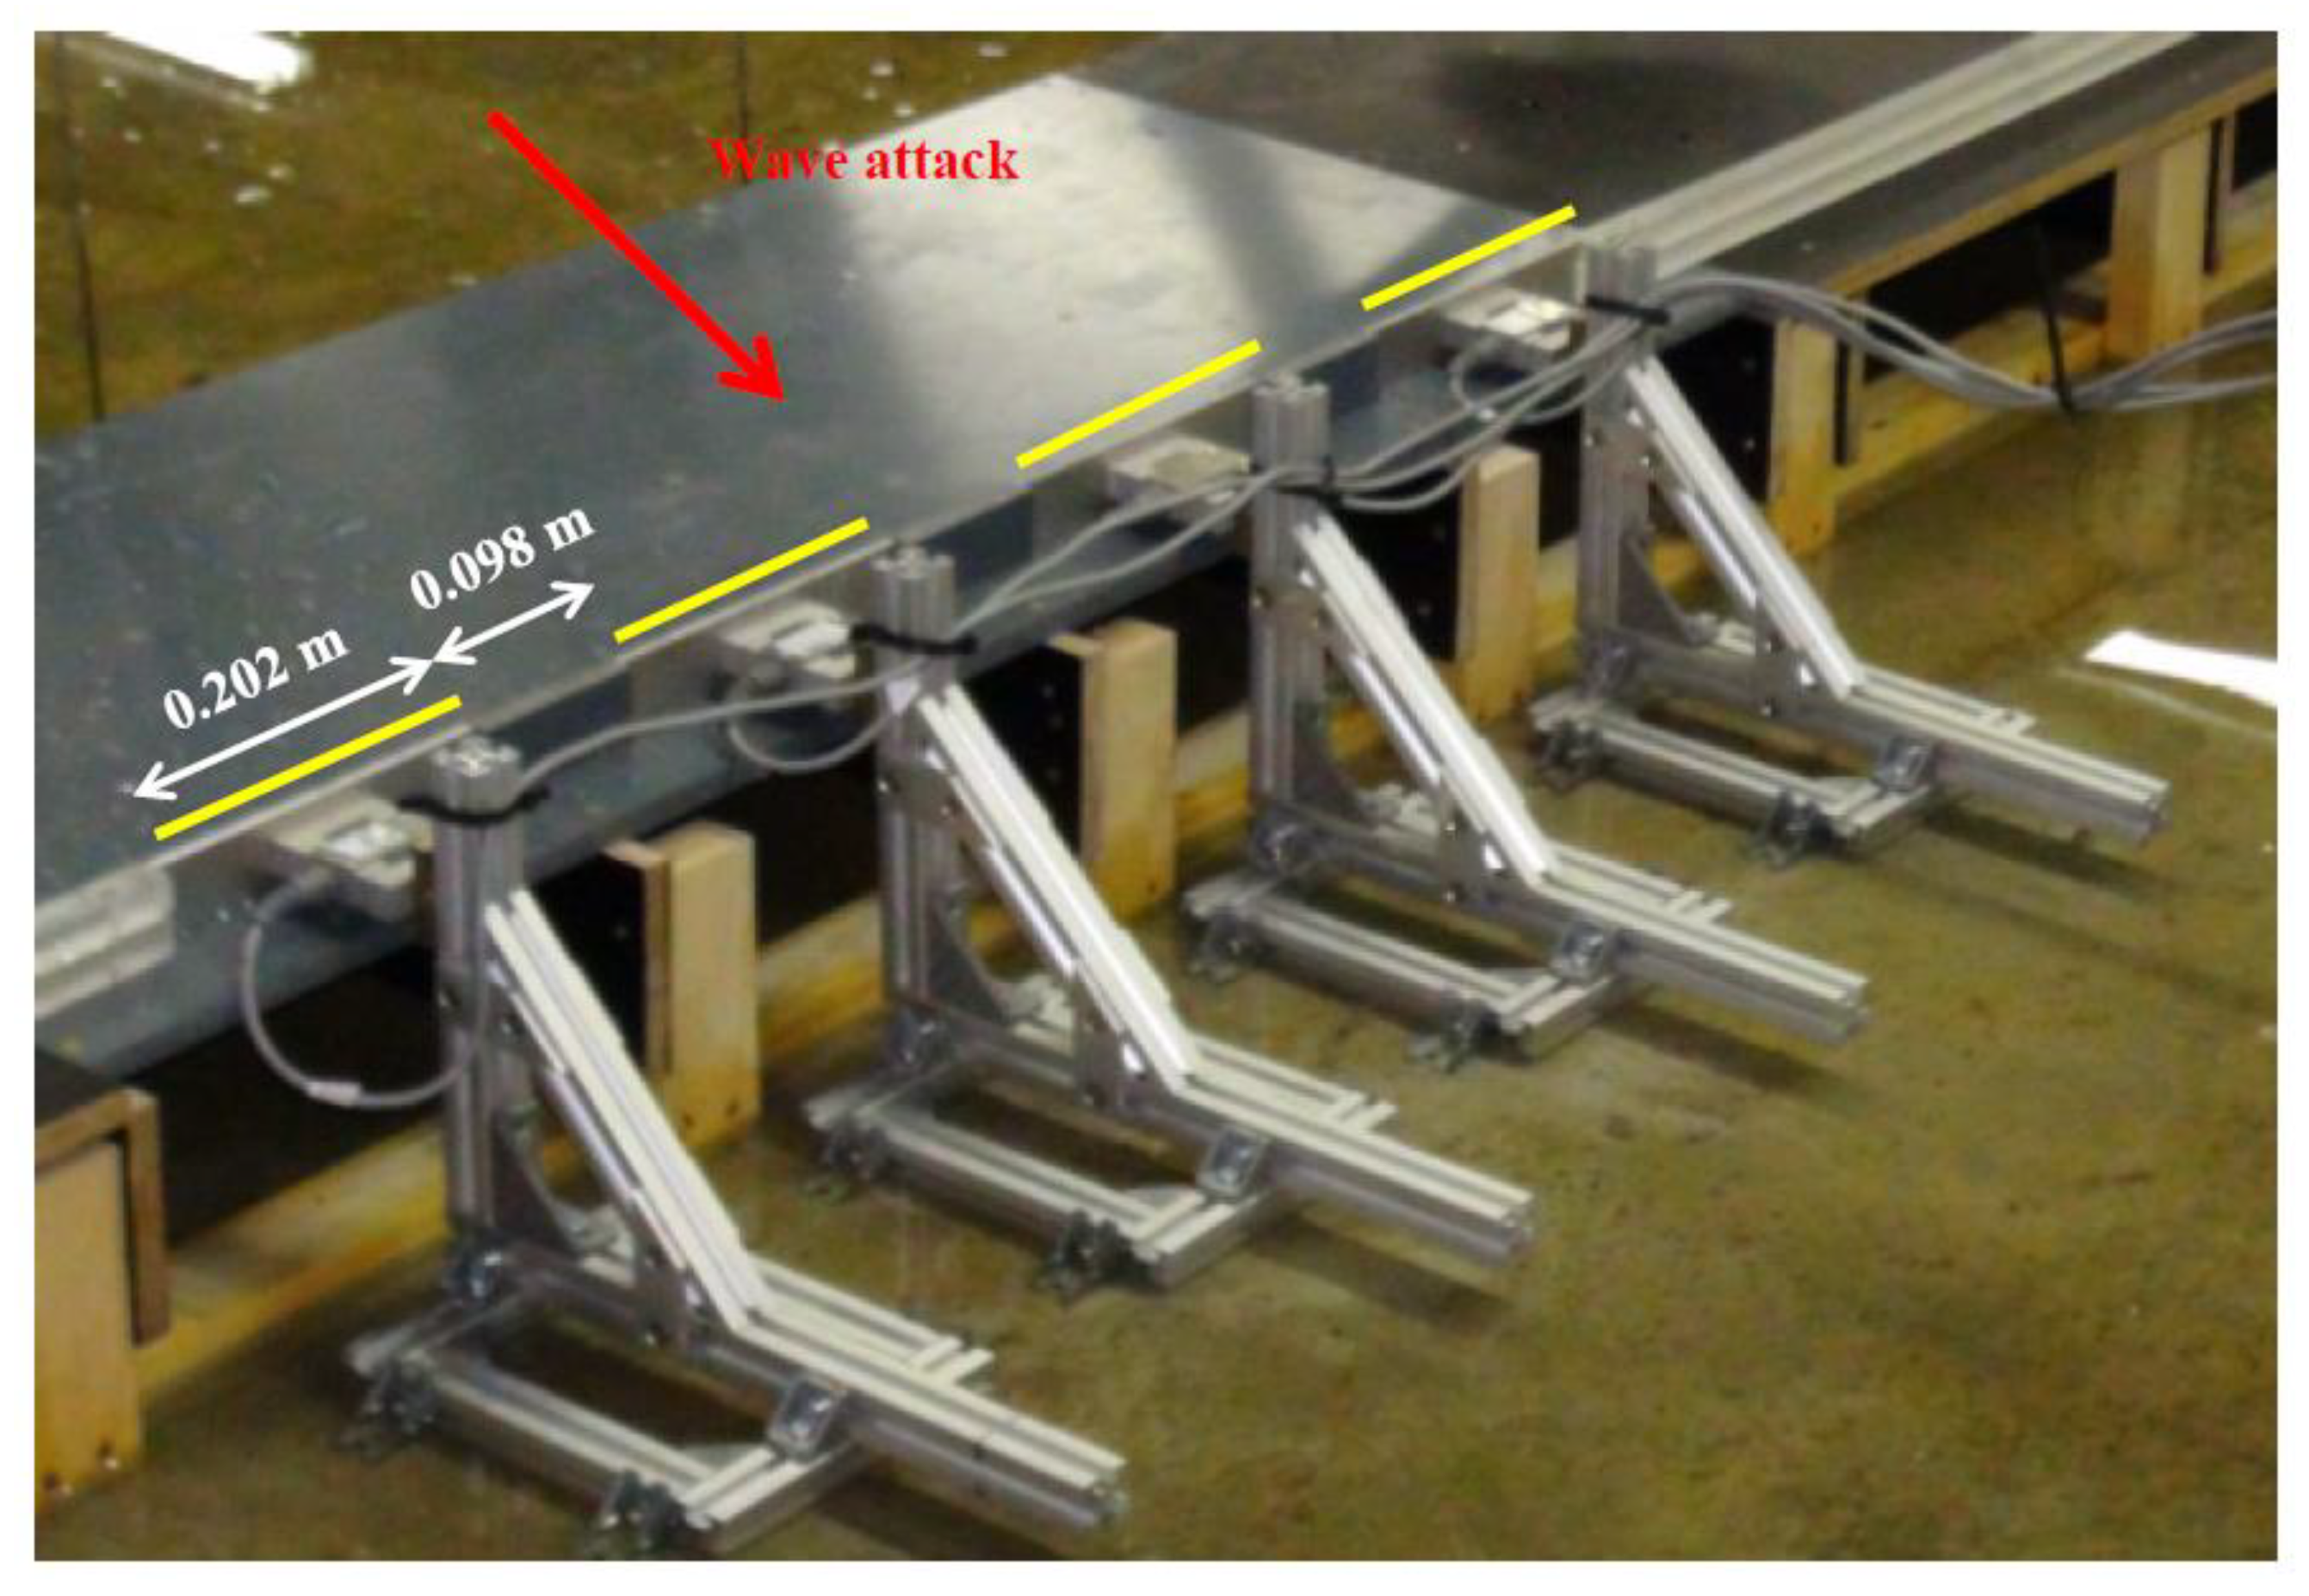
3.2. Model Settings of Force Test
Instrumentation
4. Results
4.1. Overtopping Reduction
- For each test, the berm length was calculated as a distance between the edge of the quay (sea dike) and the crown wall.
- For each angle, the projection of the berm length along the wave direction was assessed; this represents the effective berm length that the wave has to run before reaching the wall.
- Starting from the first corner of the dike, the projection of the effective berm along the quay gives the minimum distance before which no wave reaches the wall.
- The width considered to calculate the mean overtopping for the entire quay is equal to the quay length minus the calculated distance and some buffer zones at the edge (where possible model effects are noticed).
- -
- Sloping dike: only CLASH data with slope between 1:4 and 1:2 with gentle or no foreshore were considered.
- -
- Vertical quay: only tests with gentle or without foreshore were considered.
4.1.1. Vertical Quay Wall
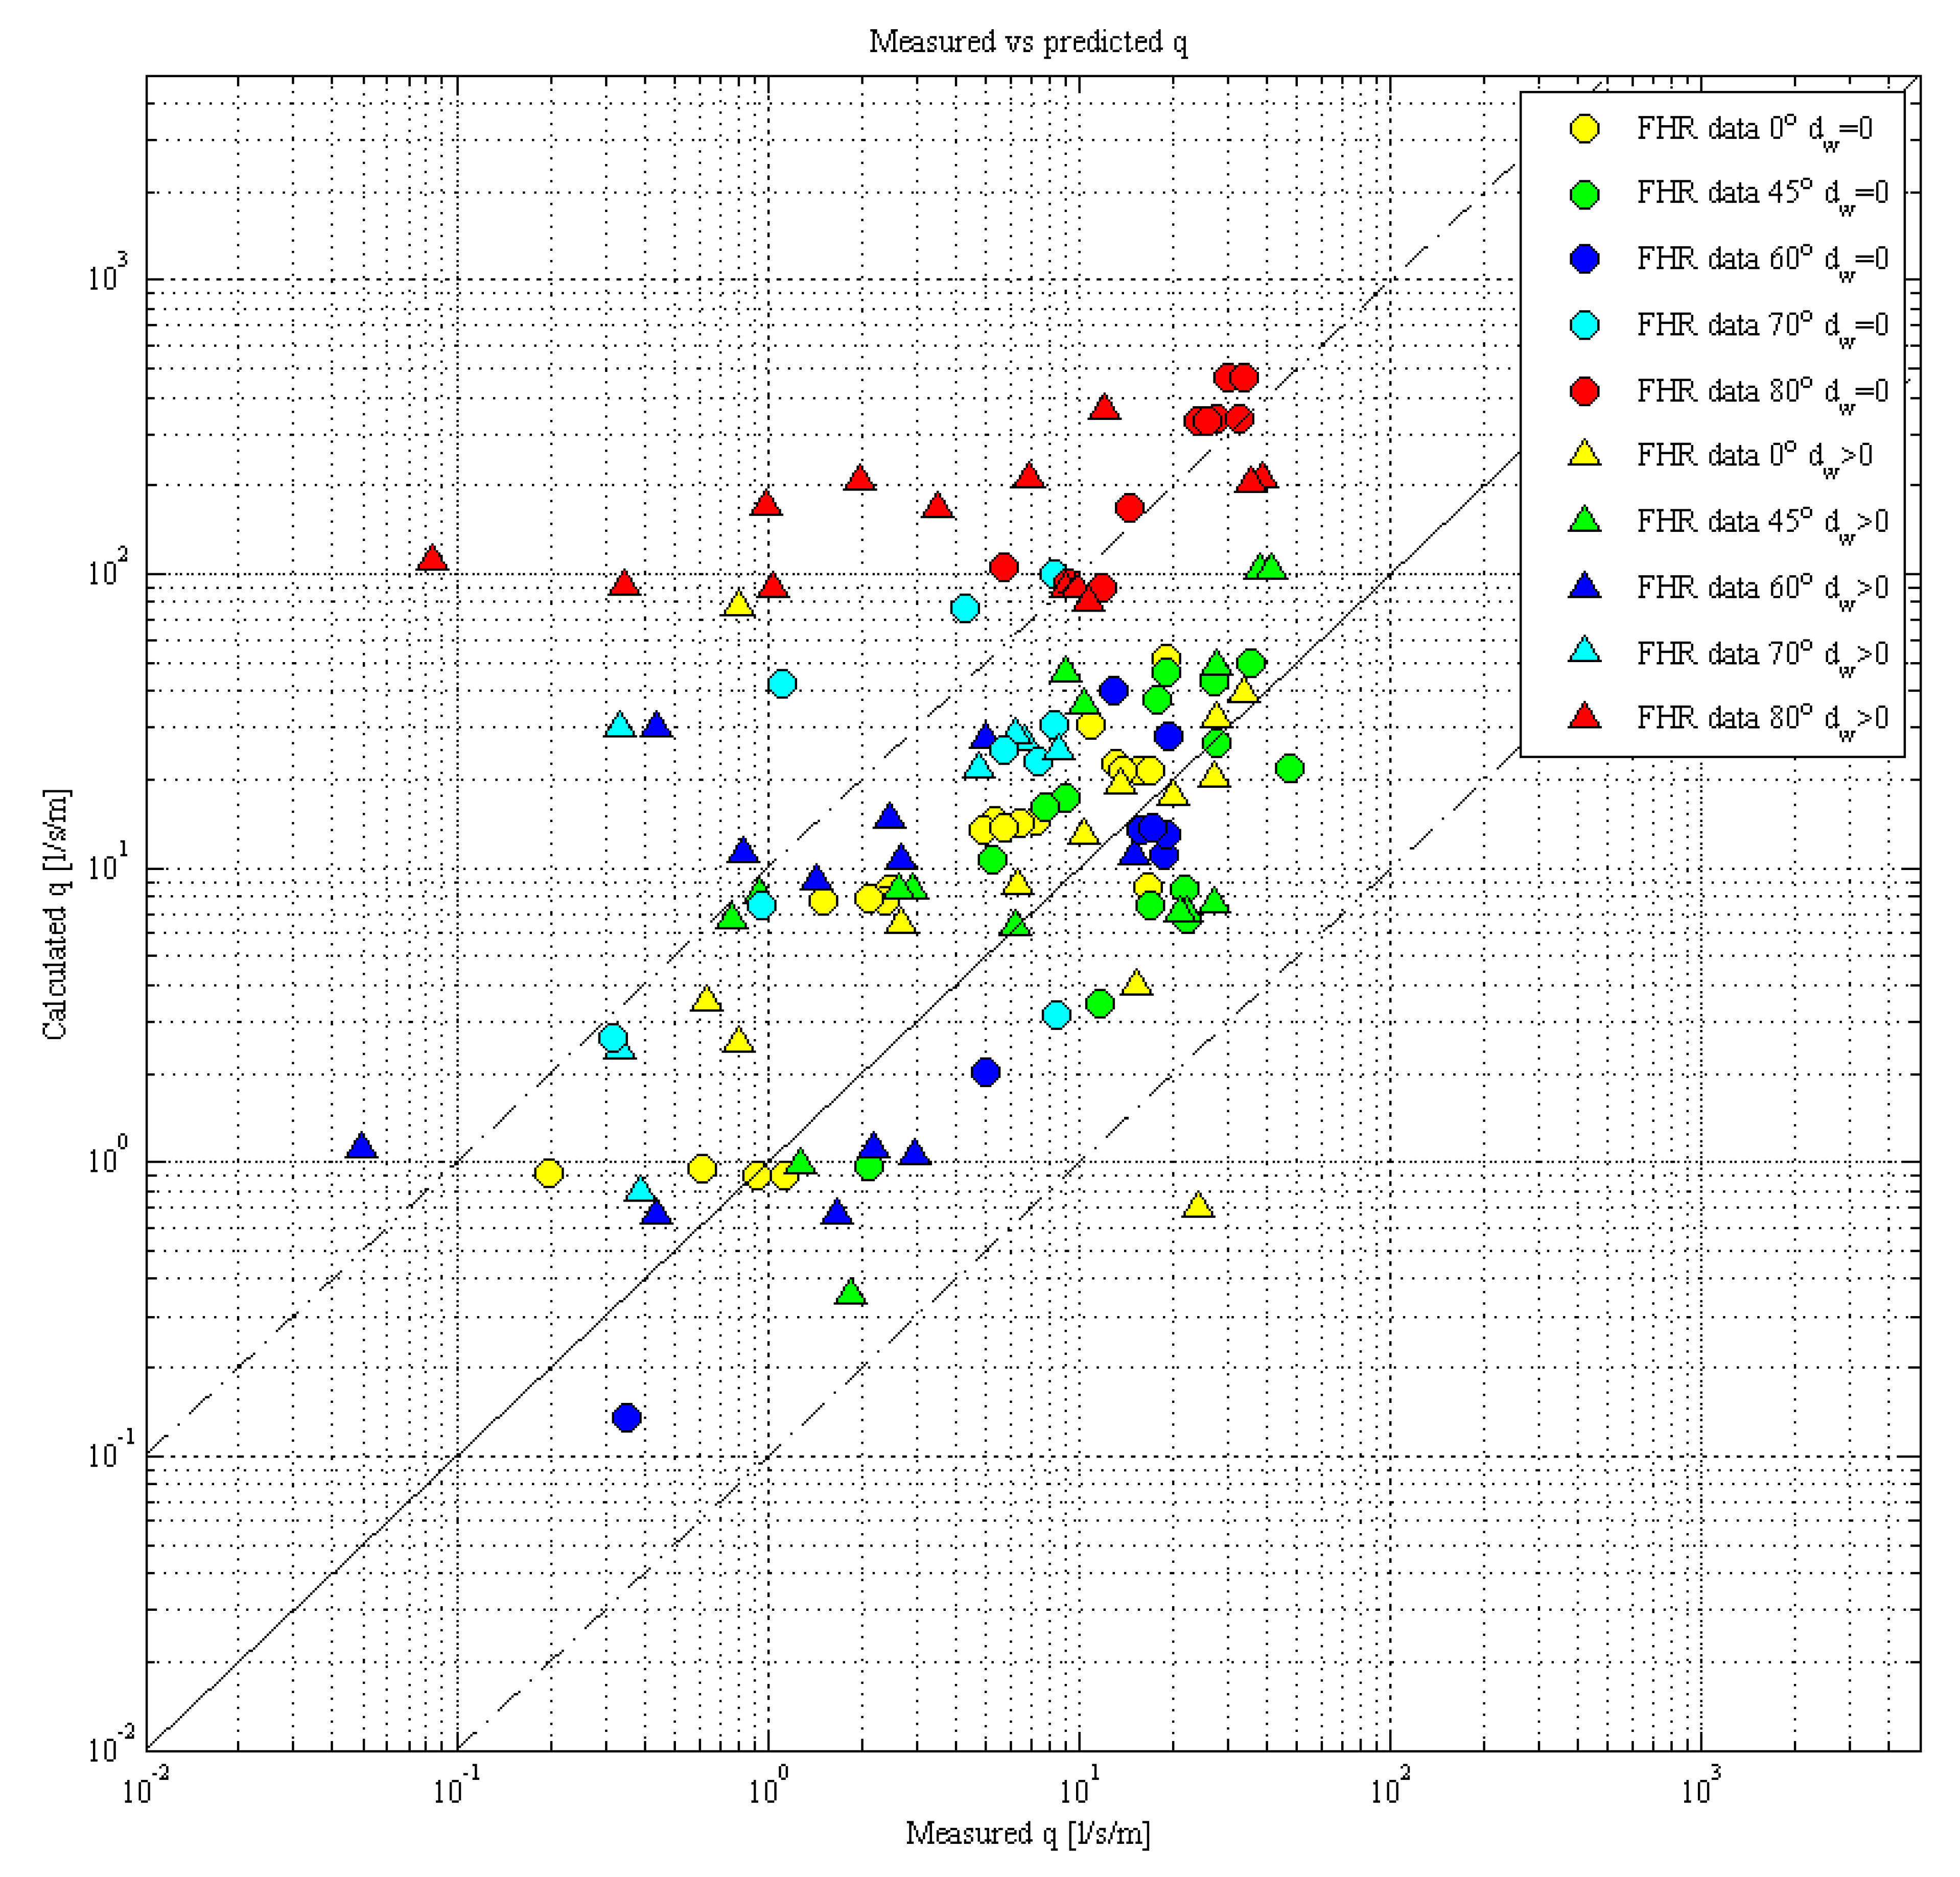
- A = 0.040 and B = 2.6 in EurOtop [1],
- A = 0.033 and B = 2.3 in Goda [3], and
- A = 0.116 and B = 3.0 in Franco and Franco [18].
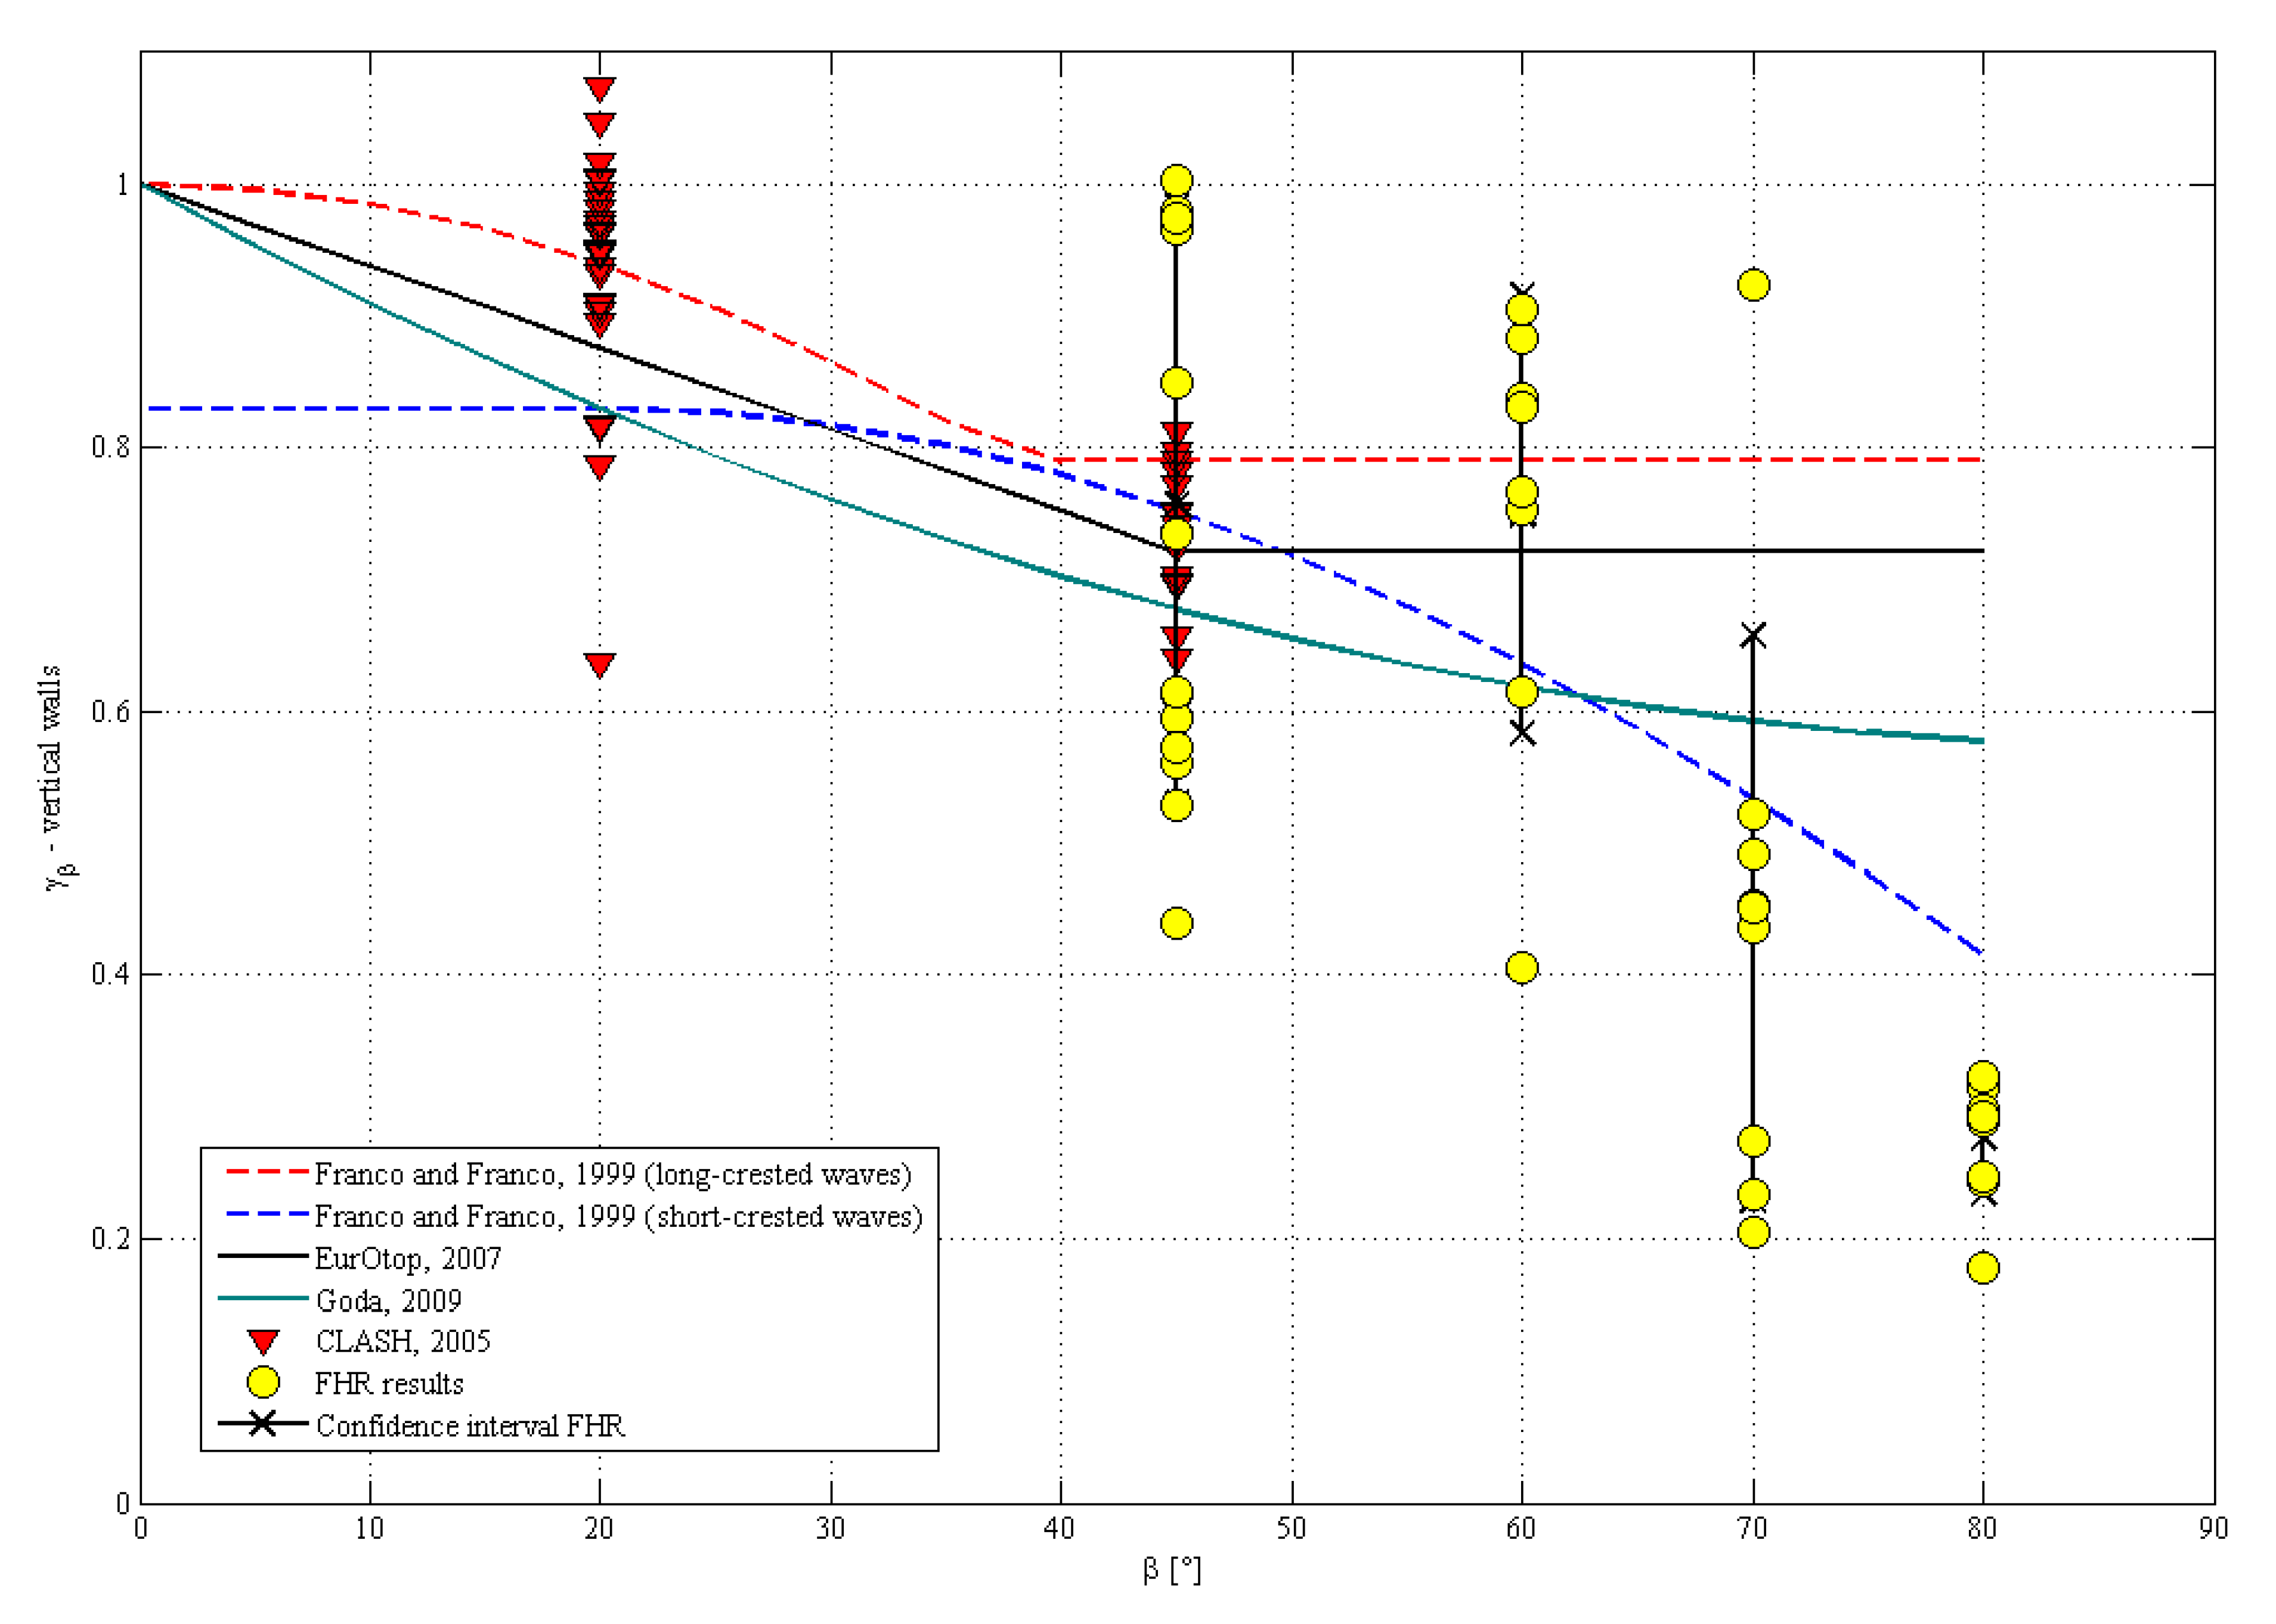
- γβ = 0.76 (σ = 0.23), for β = 45°;
- γβ = 0.75 (σ = 0.17), for β = 60°;
- γβ = 0.44 (σ = 0.21), for β = 70°; and
- γβ = 0.28 (σ = 0.04), for β = 80°.
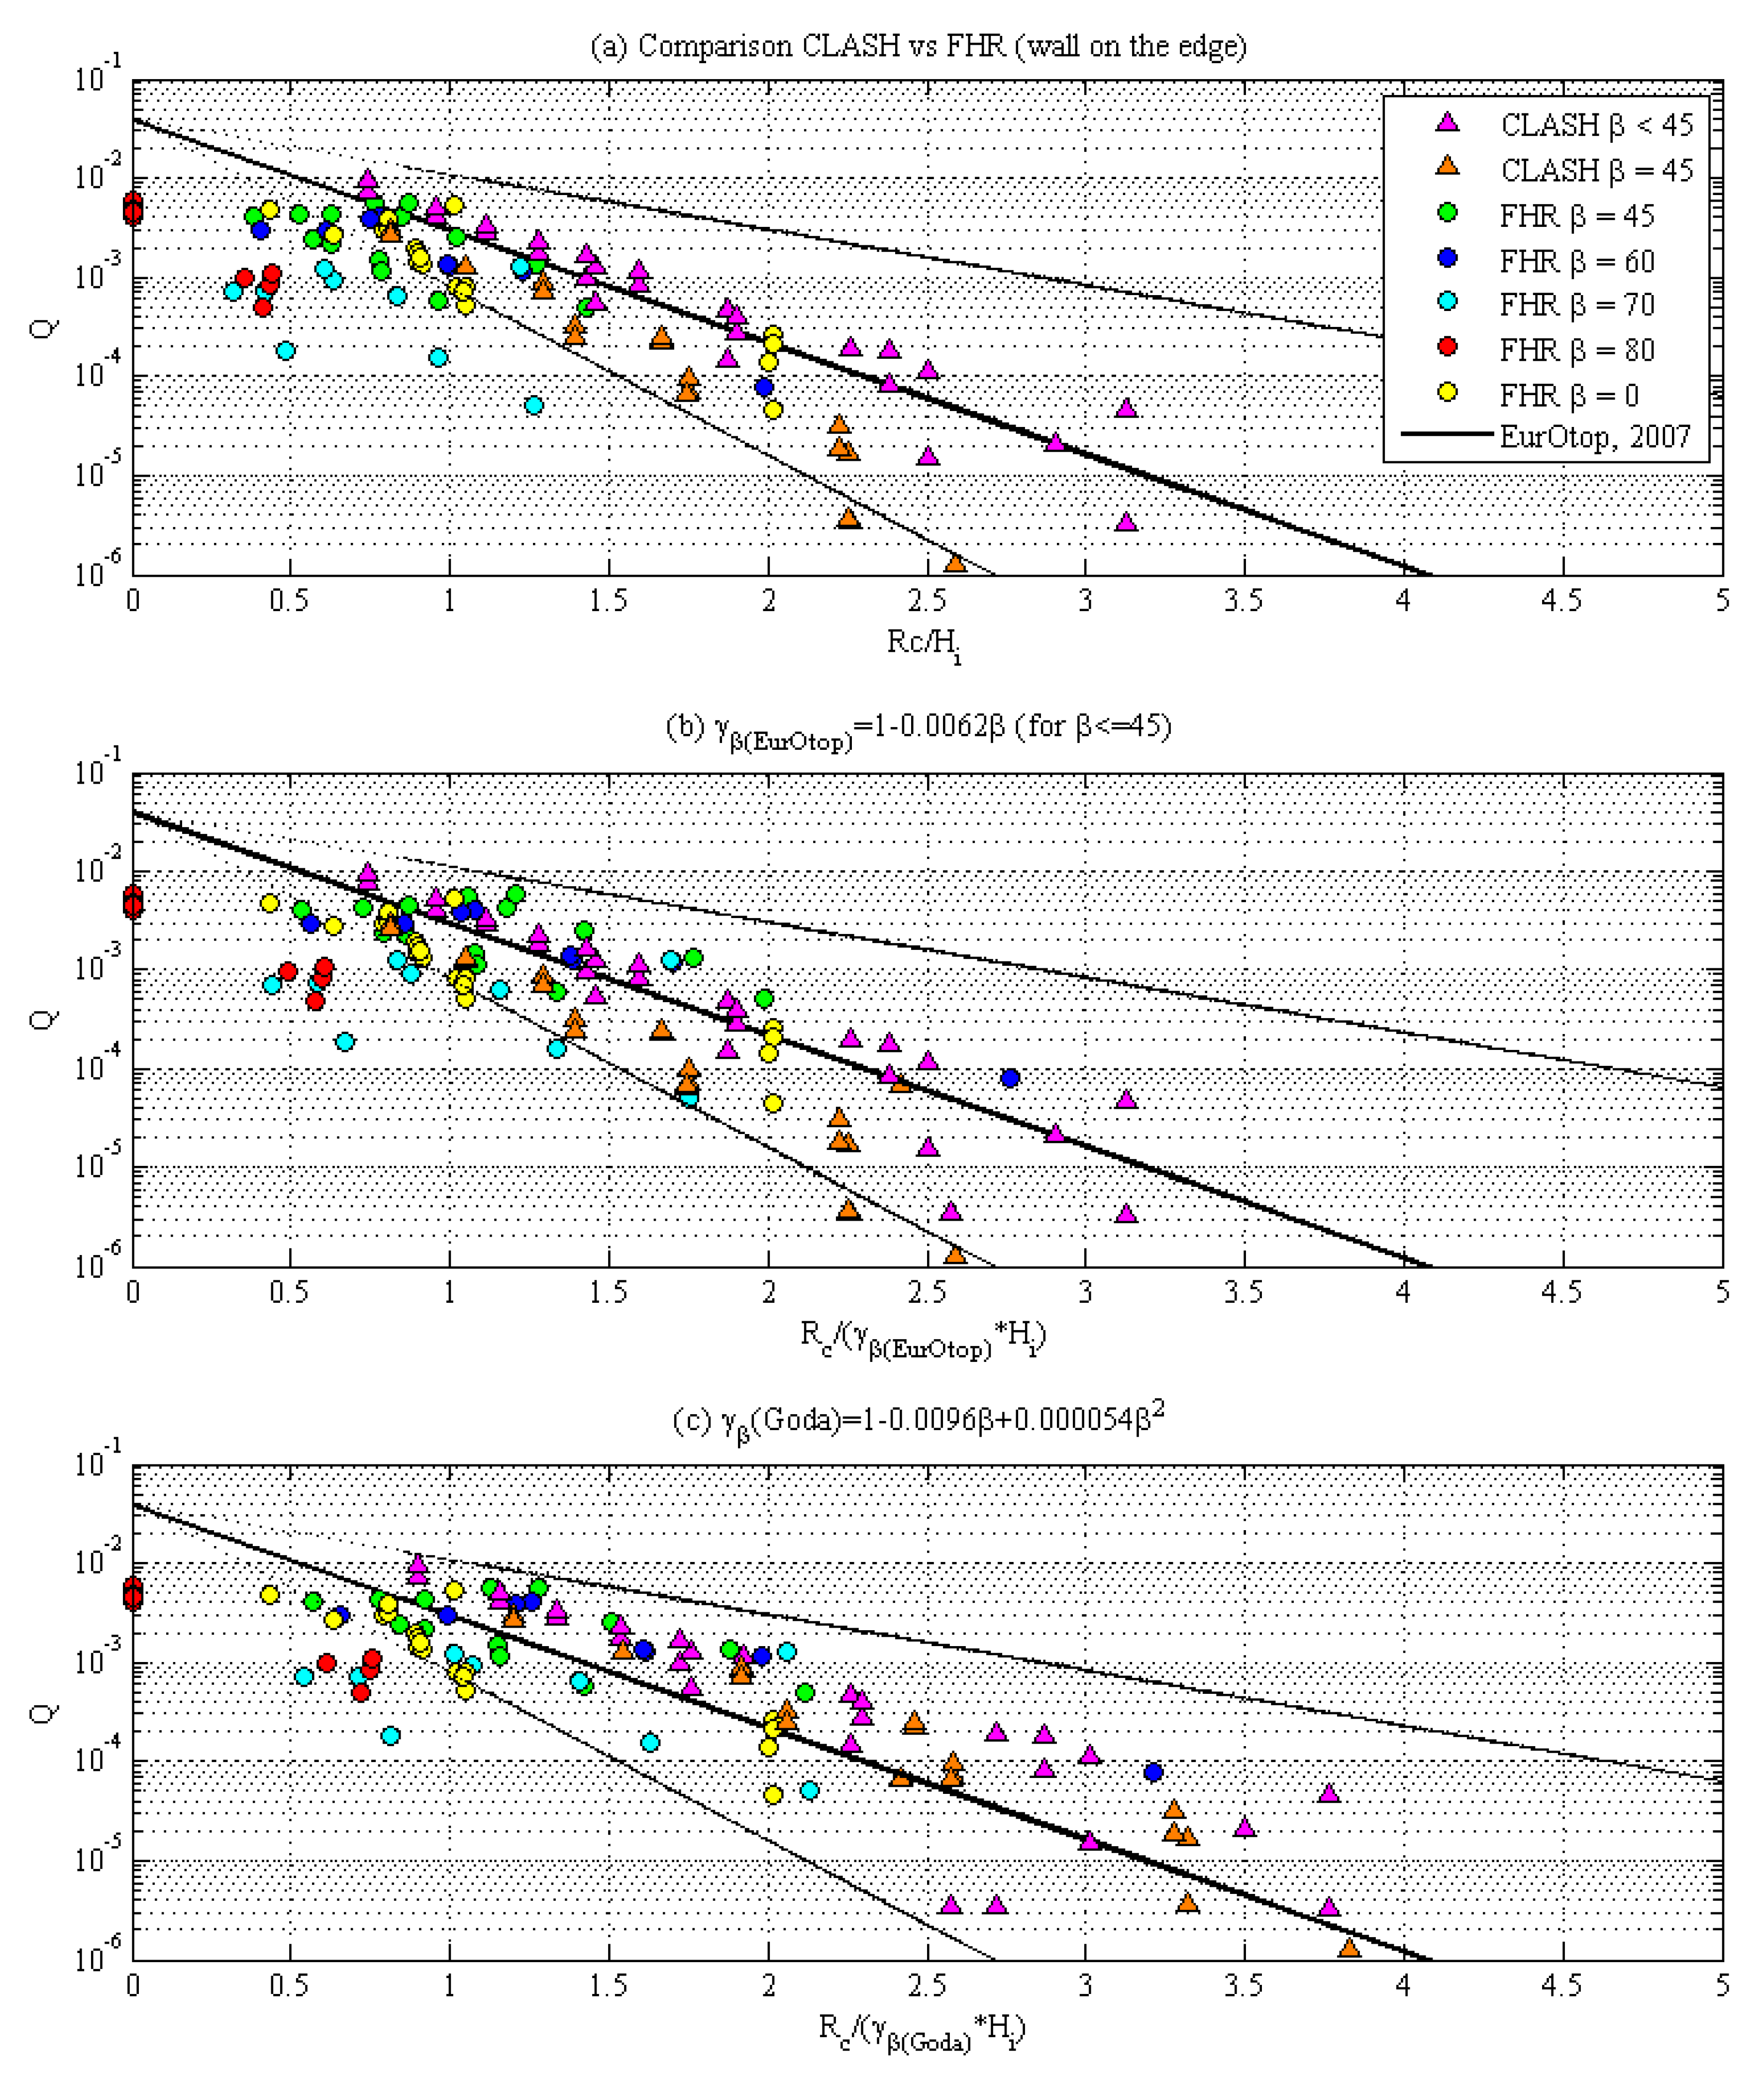
- (a)
- the values of Q are plotted against the non-dimensional freeboard Rc/Hi;
- (b)
- the values of Q are plotted against the non-dimensional freeboard Rc/Hiγβ (EurOtop), where γβ (EurOtop) is the correction coefficient calculated using the EurOtop (2007) formula; and
- (c)
- (the values of Q are plotted against the non-dimensional freeboard Rc/Hiγβ(Goda), where γβ (Goda) is the correction coefficient calculated using the Goda [3] formula.
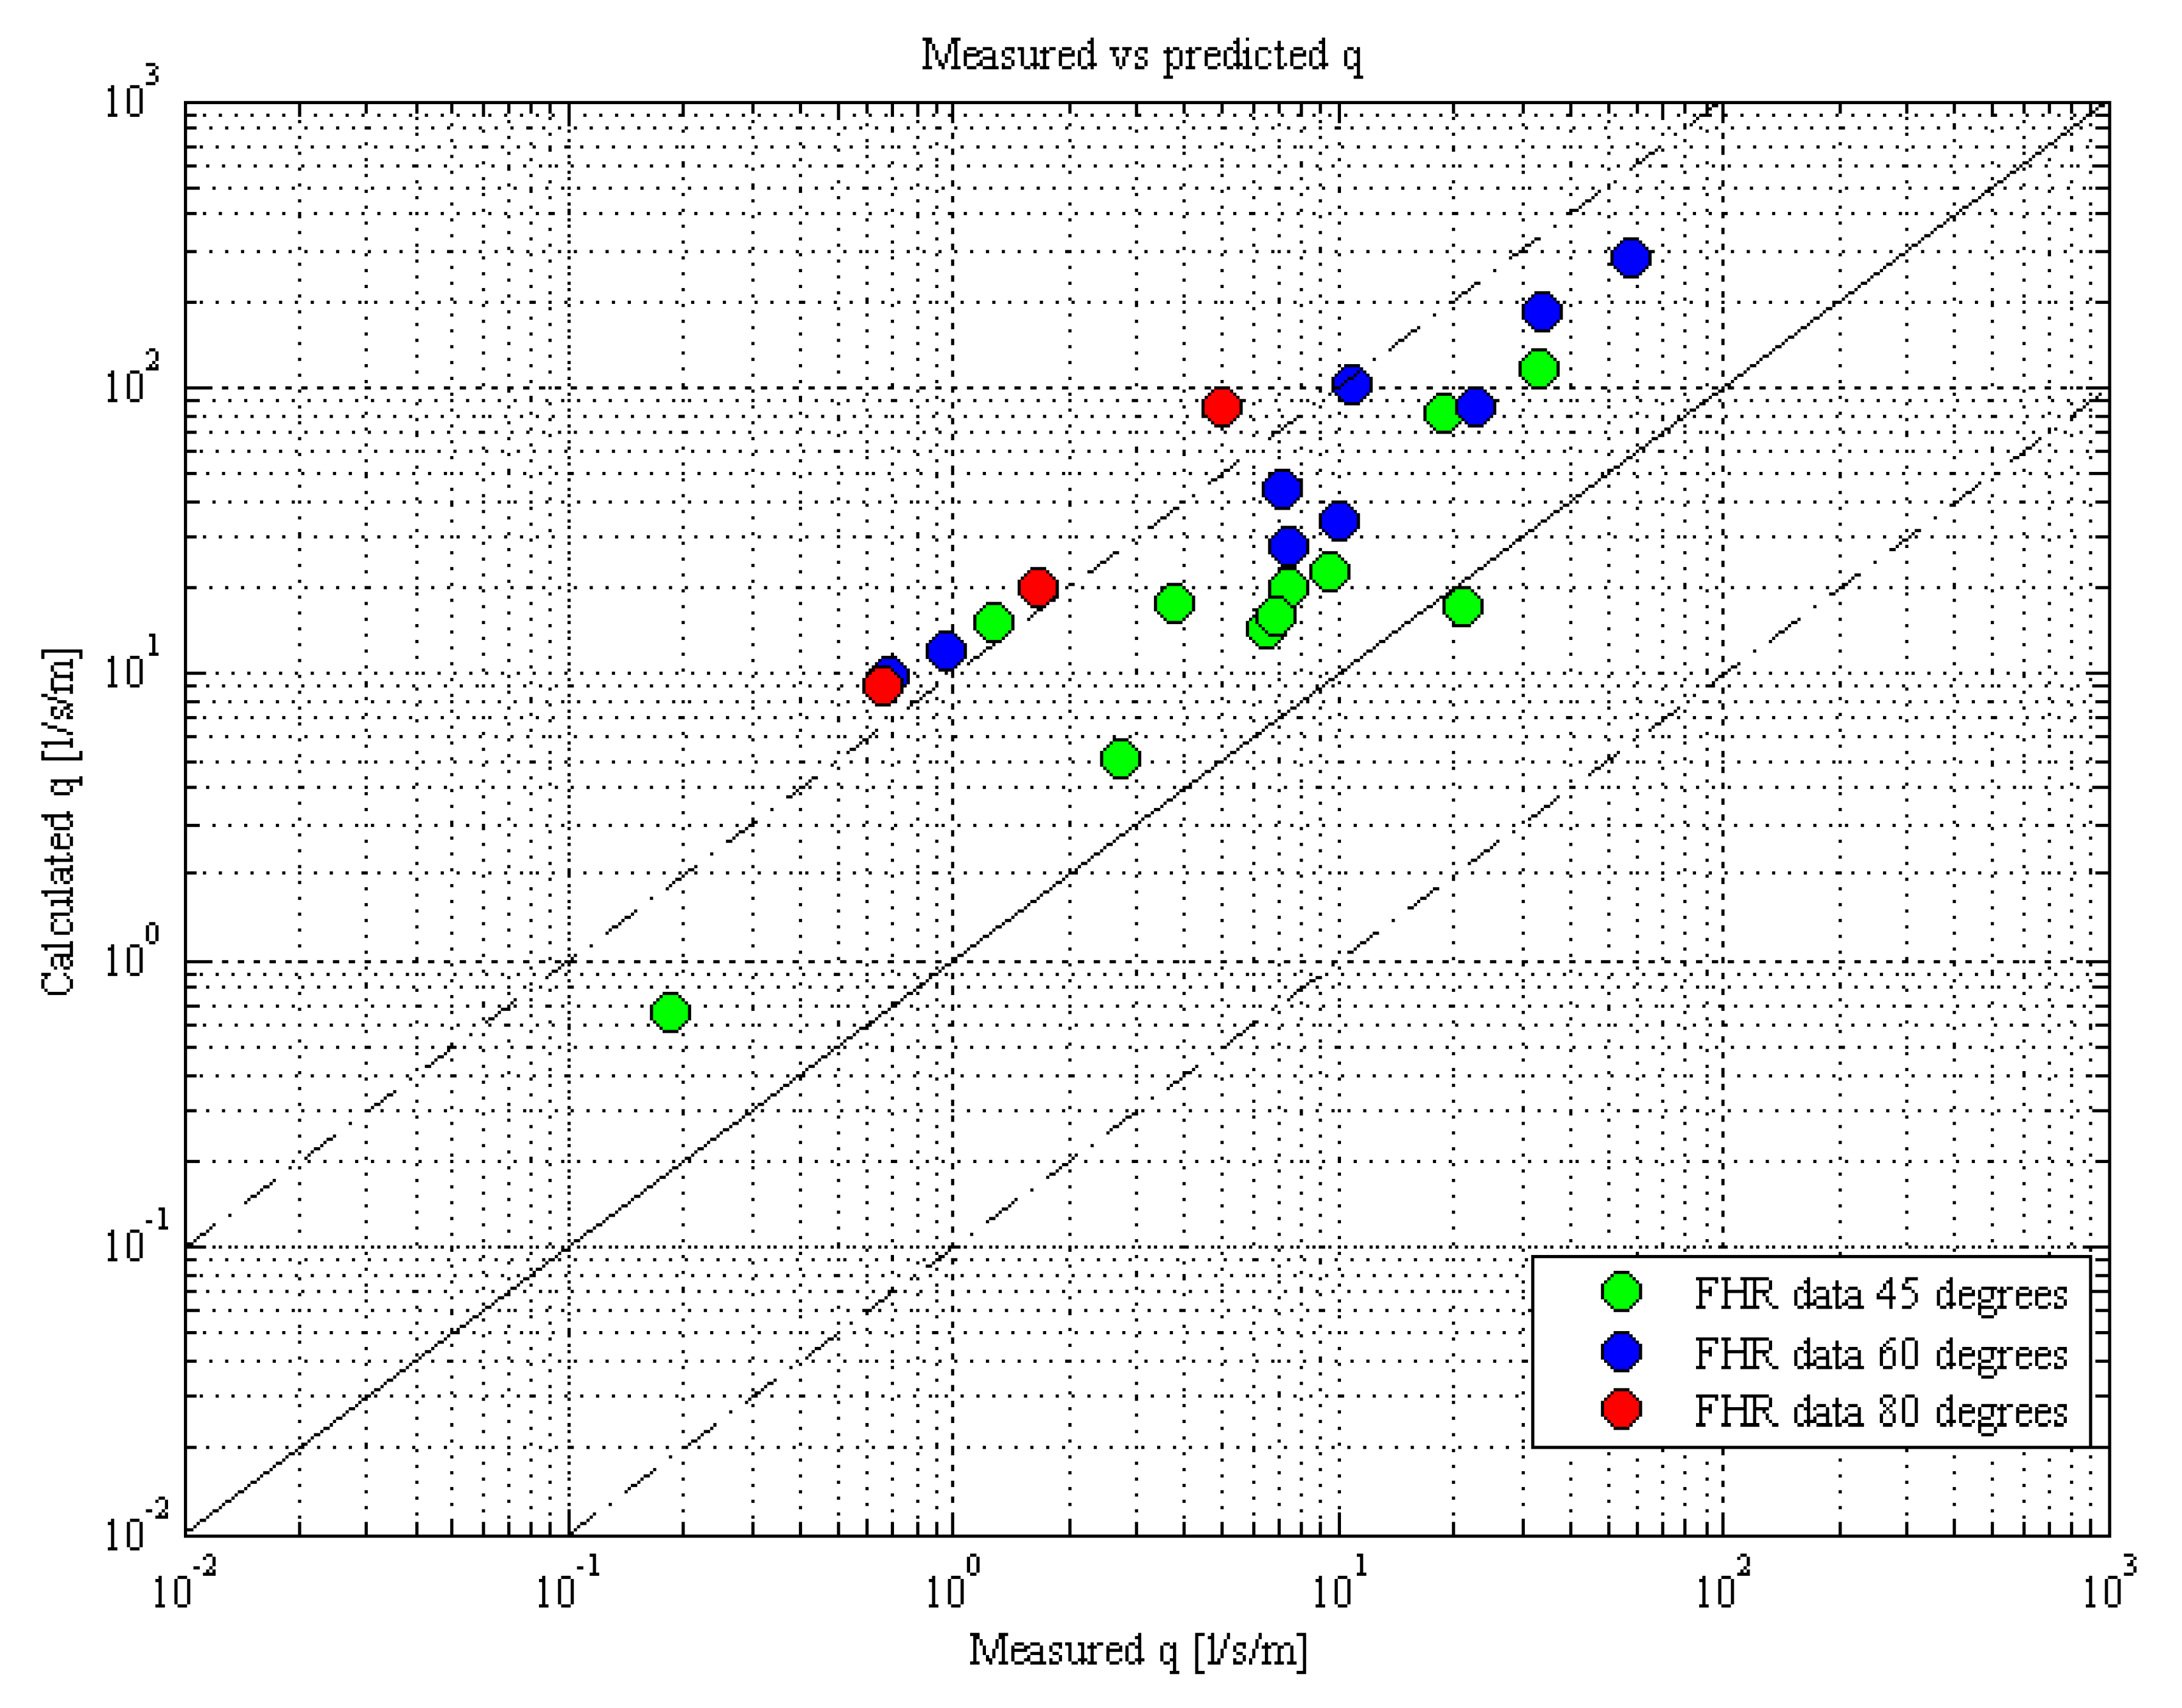
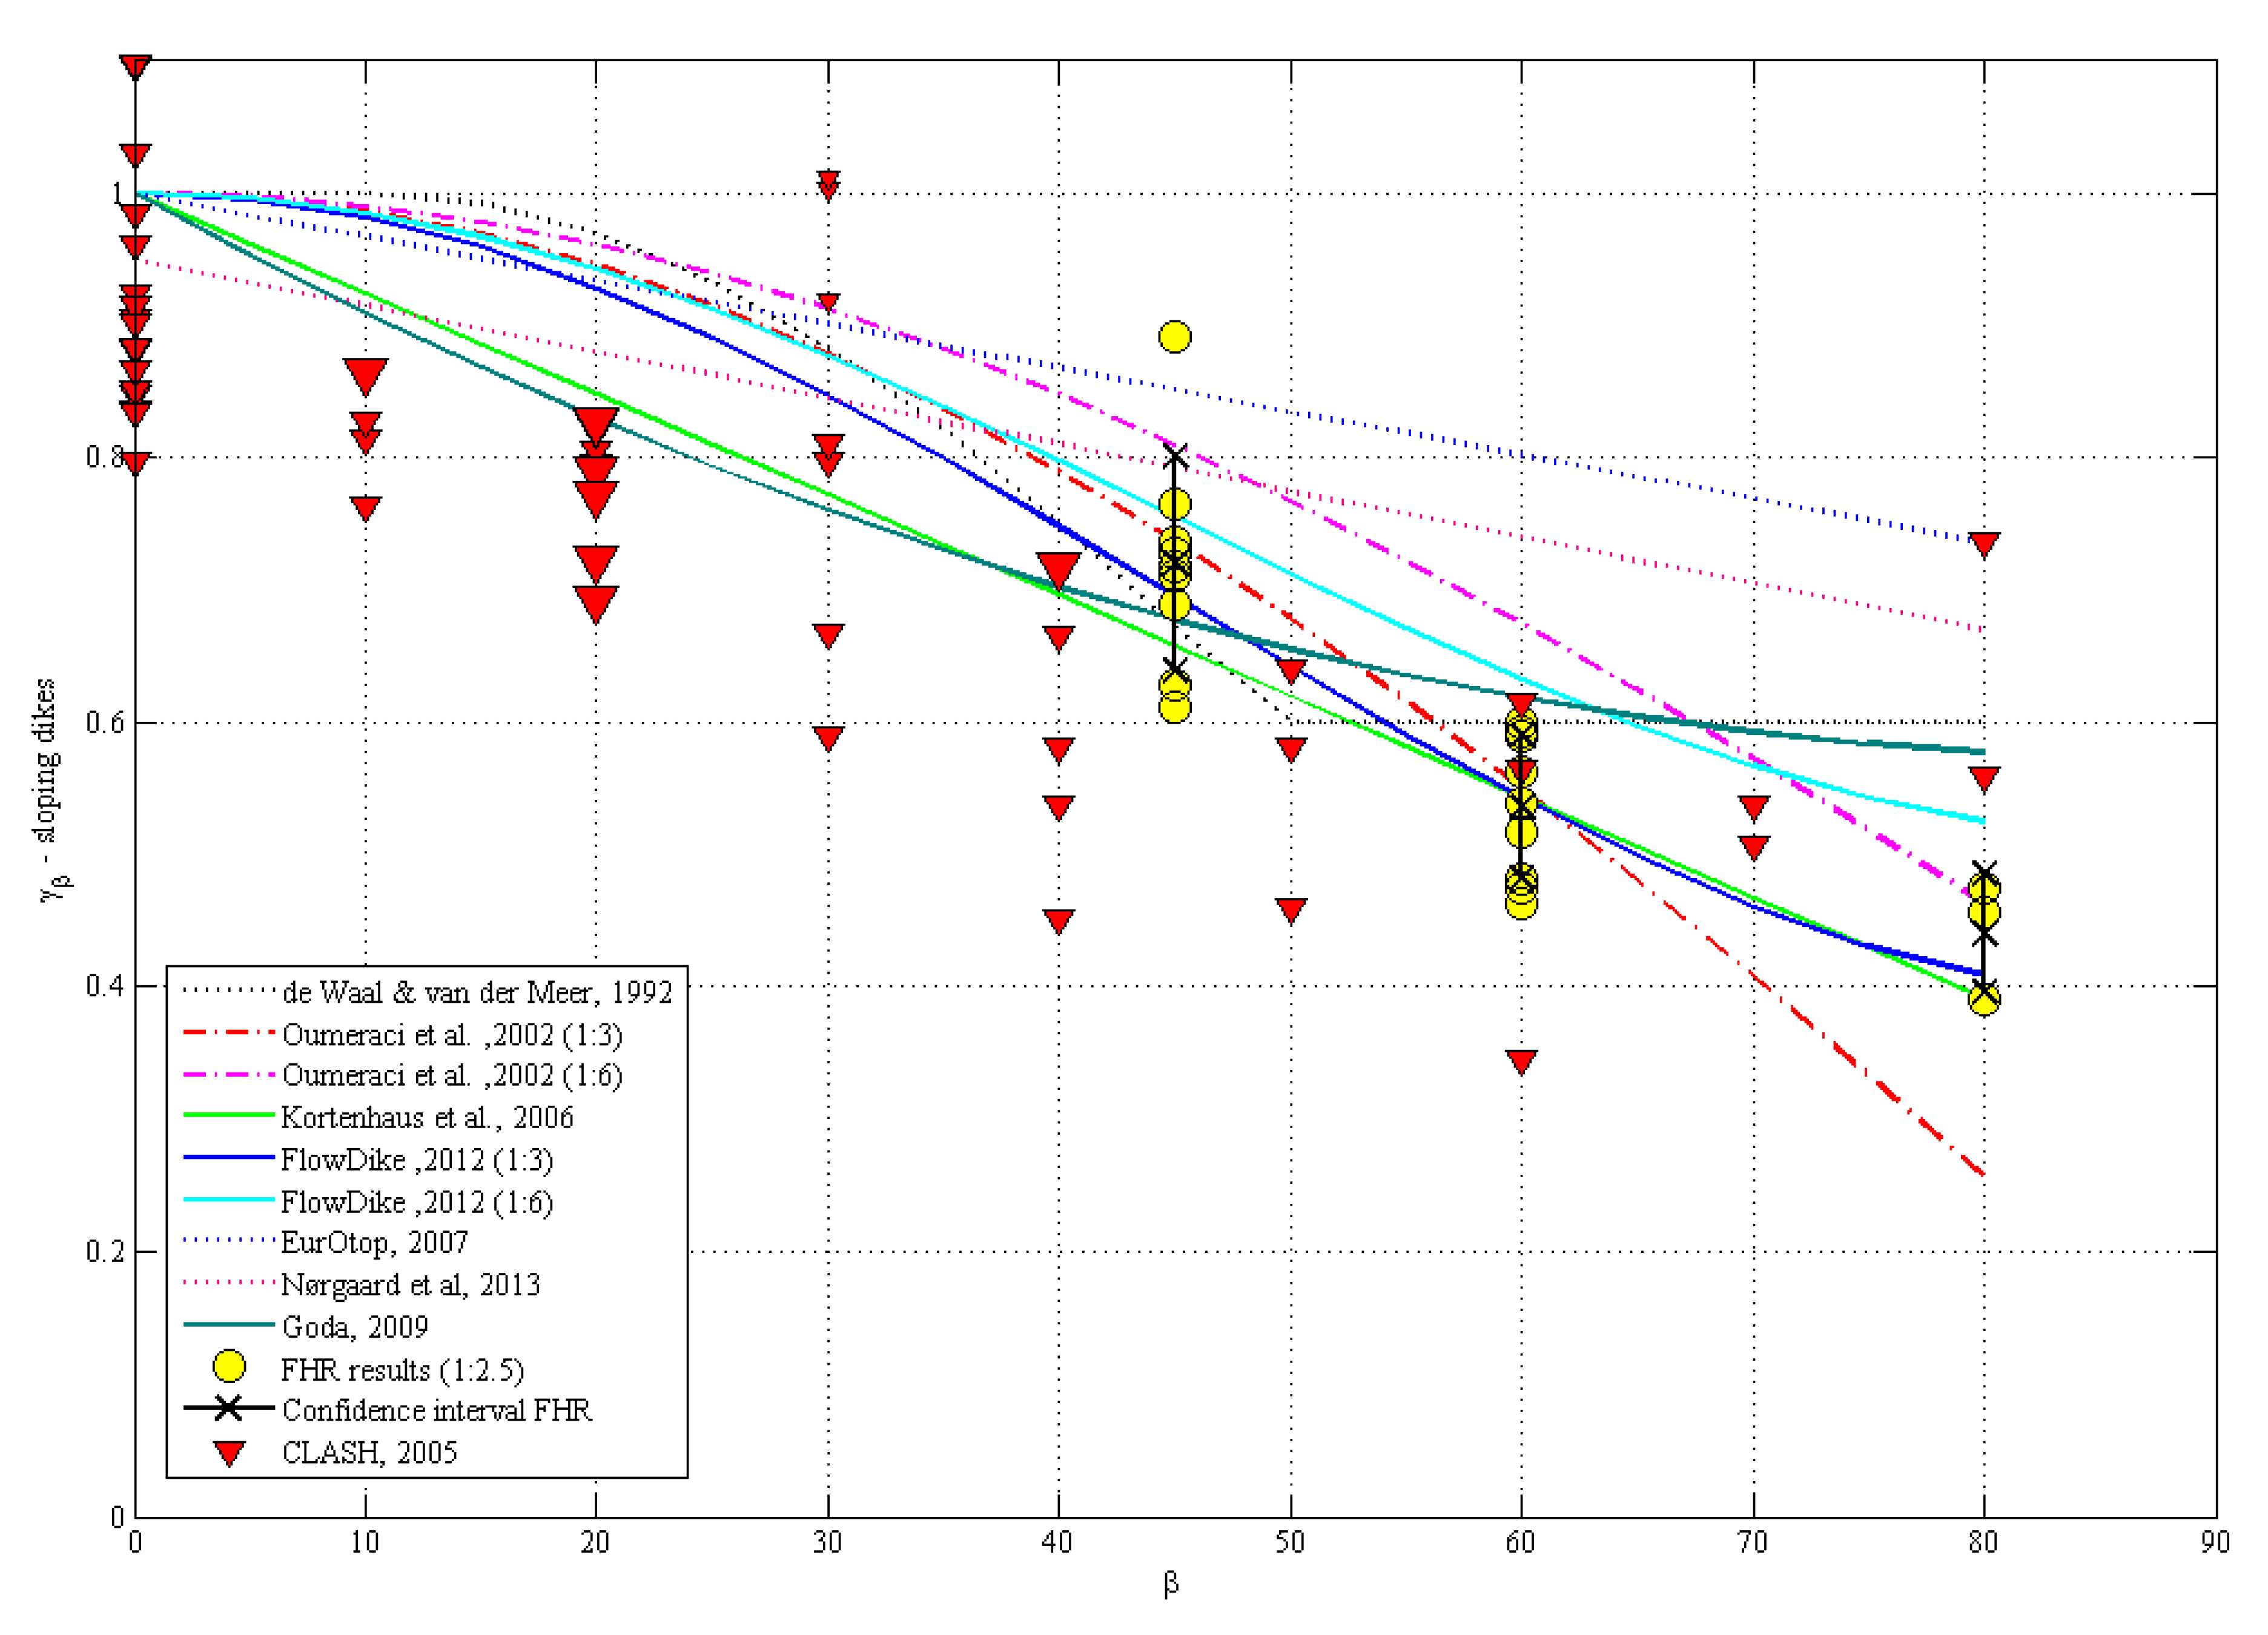
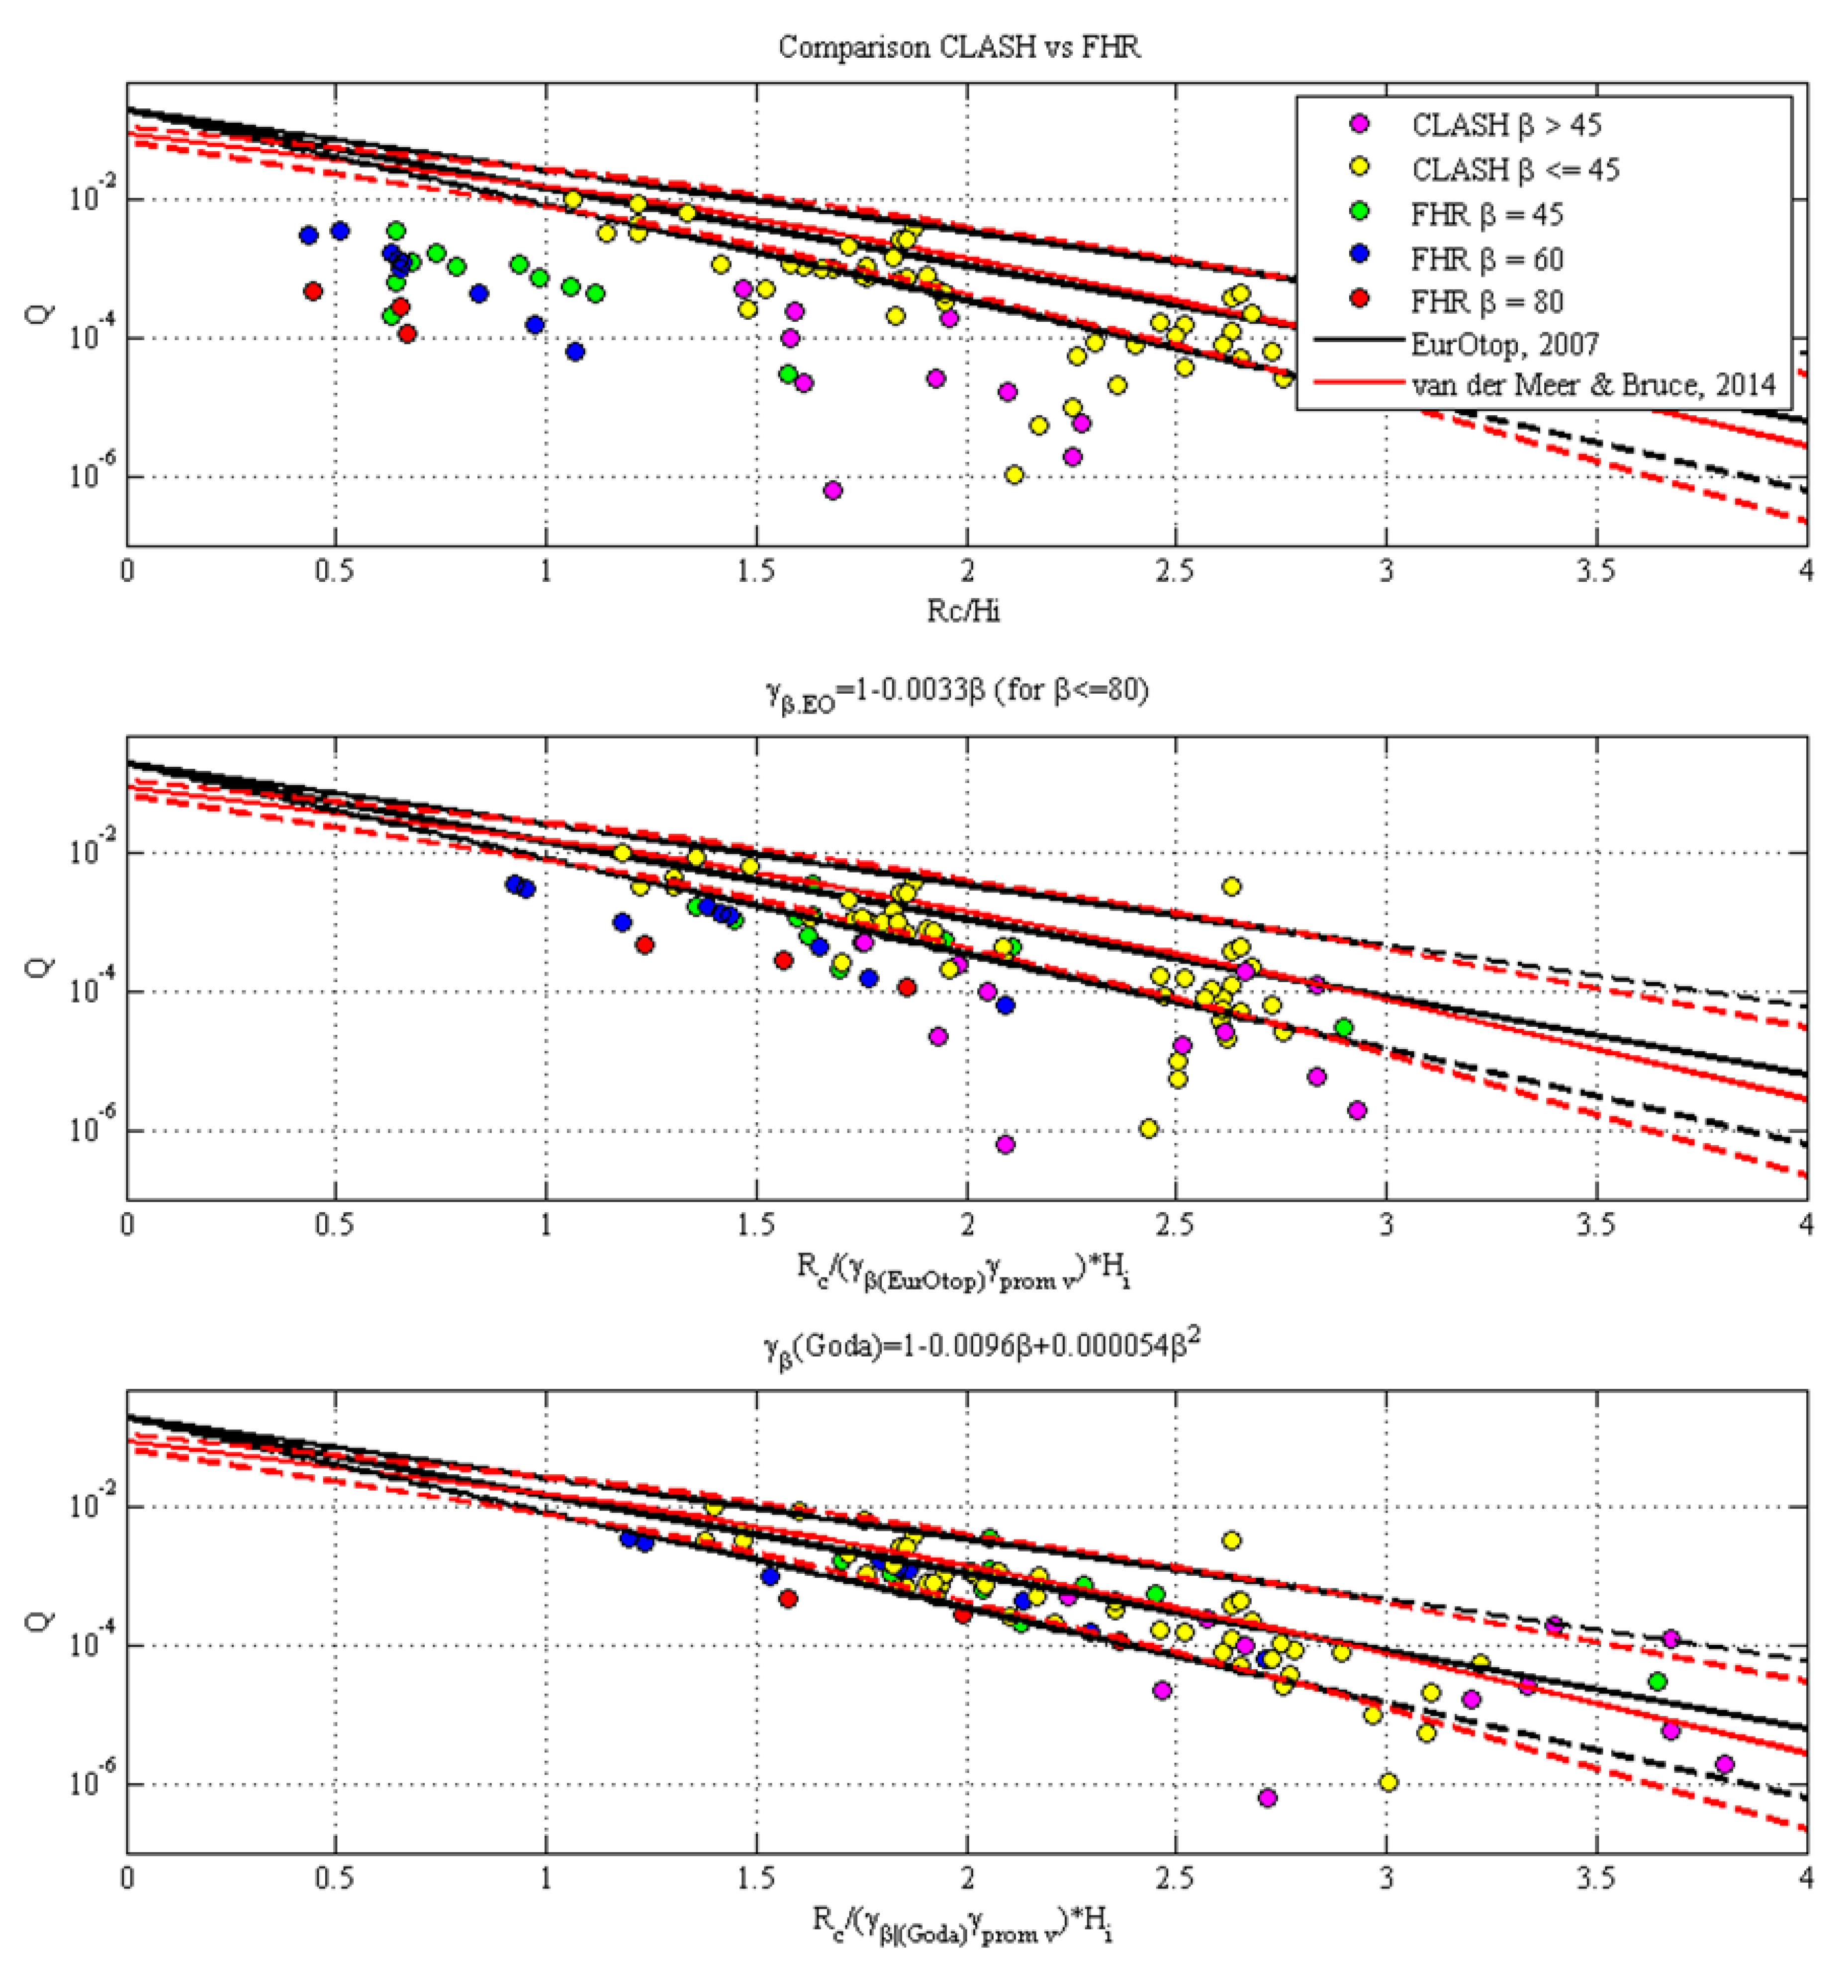
4.1.2. Sloping Dike
- (a)
- the values of Q are plotted against the non-dimensional freeboard Rc/Hi;
- (b)
- (c)
- the values of Q are plotted against the non-dimensional freeboard Rc/Hiγβ(Goda)γprom_v, where γβ(Goda) is the correction coefficient calculated using the Goda [3] formula.
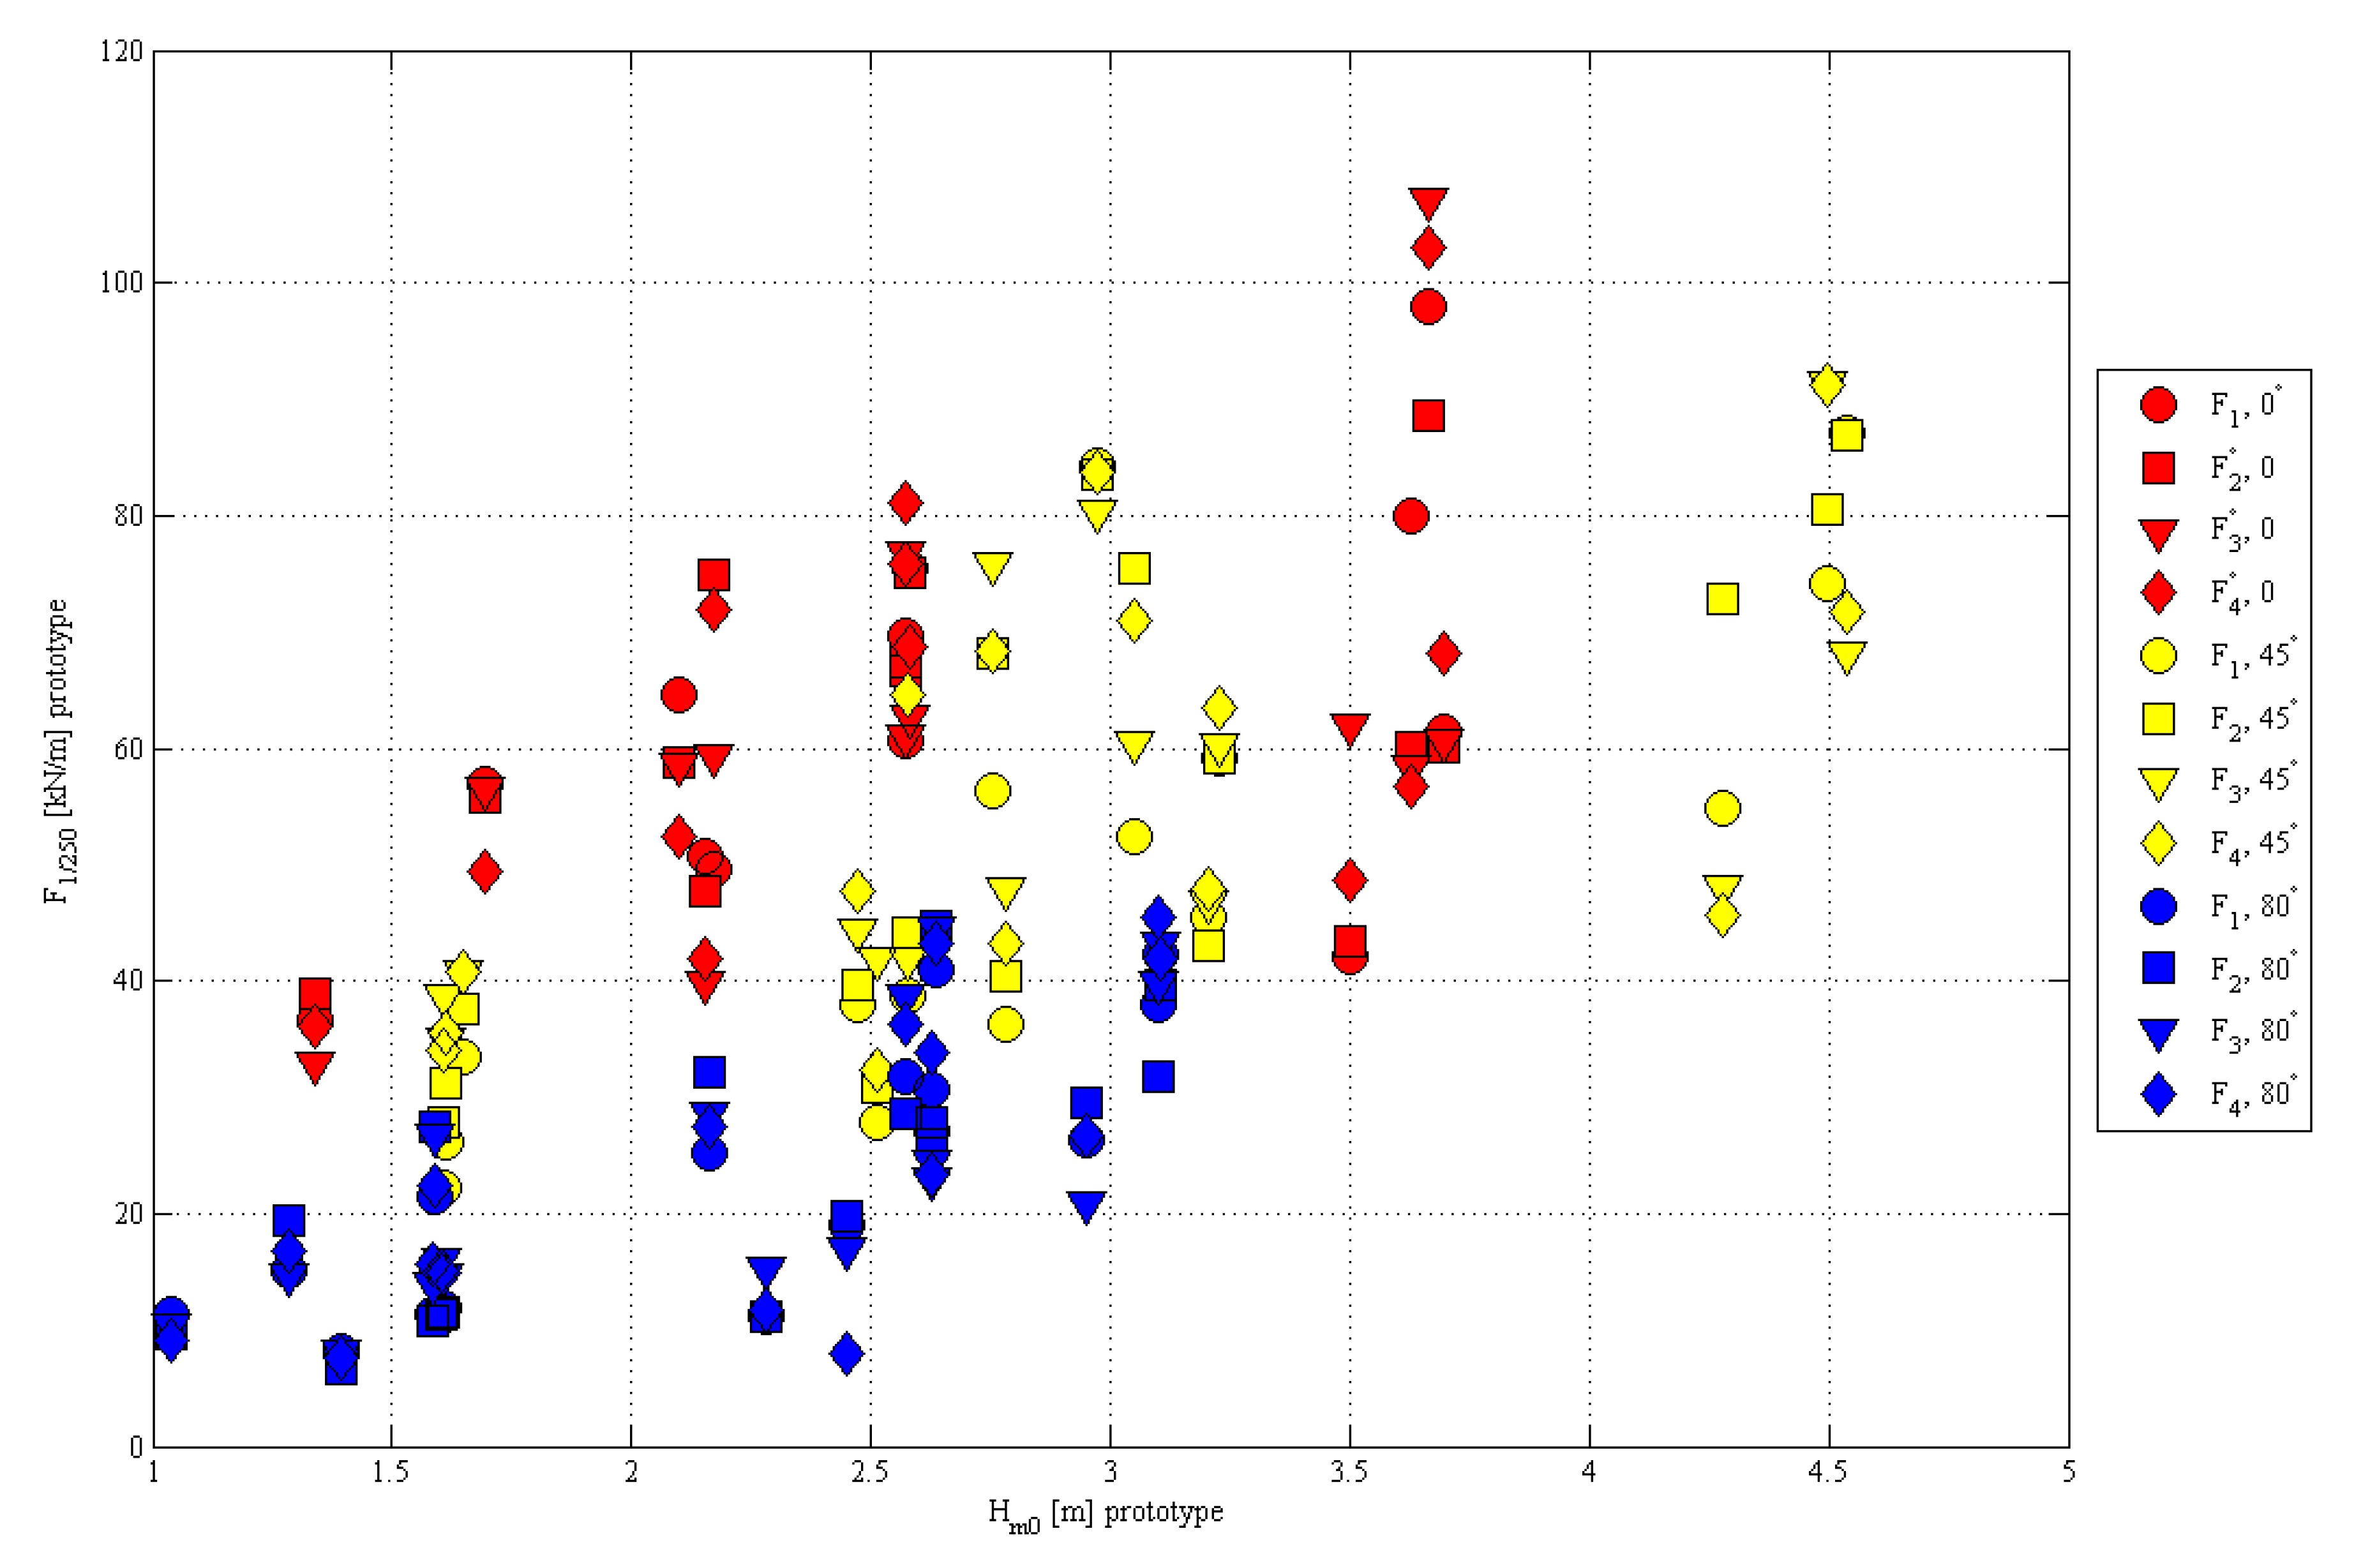
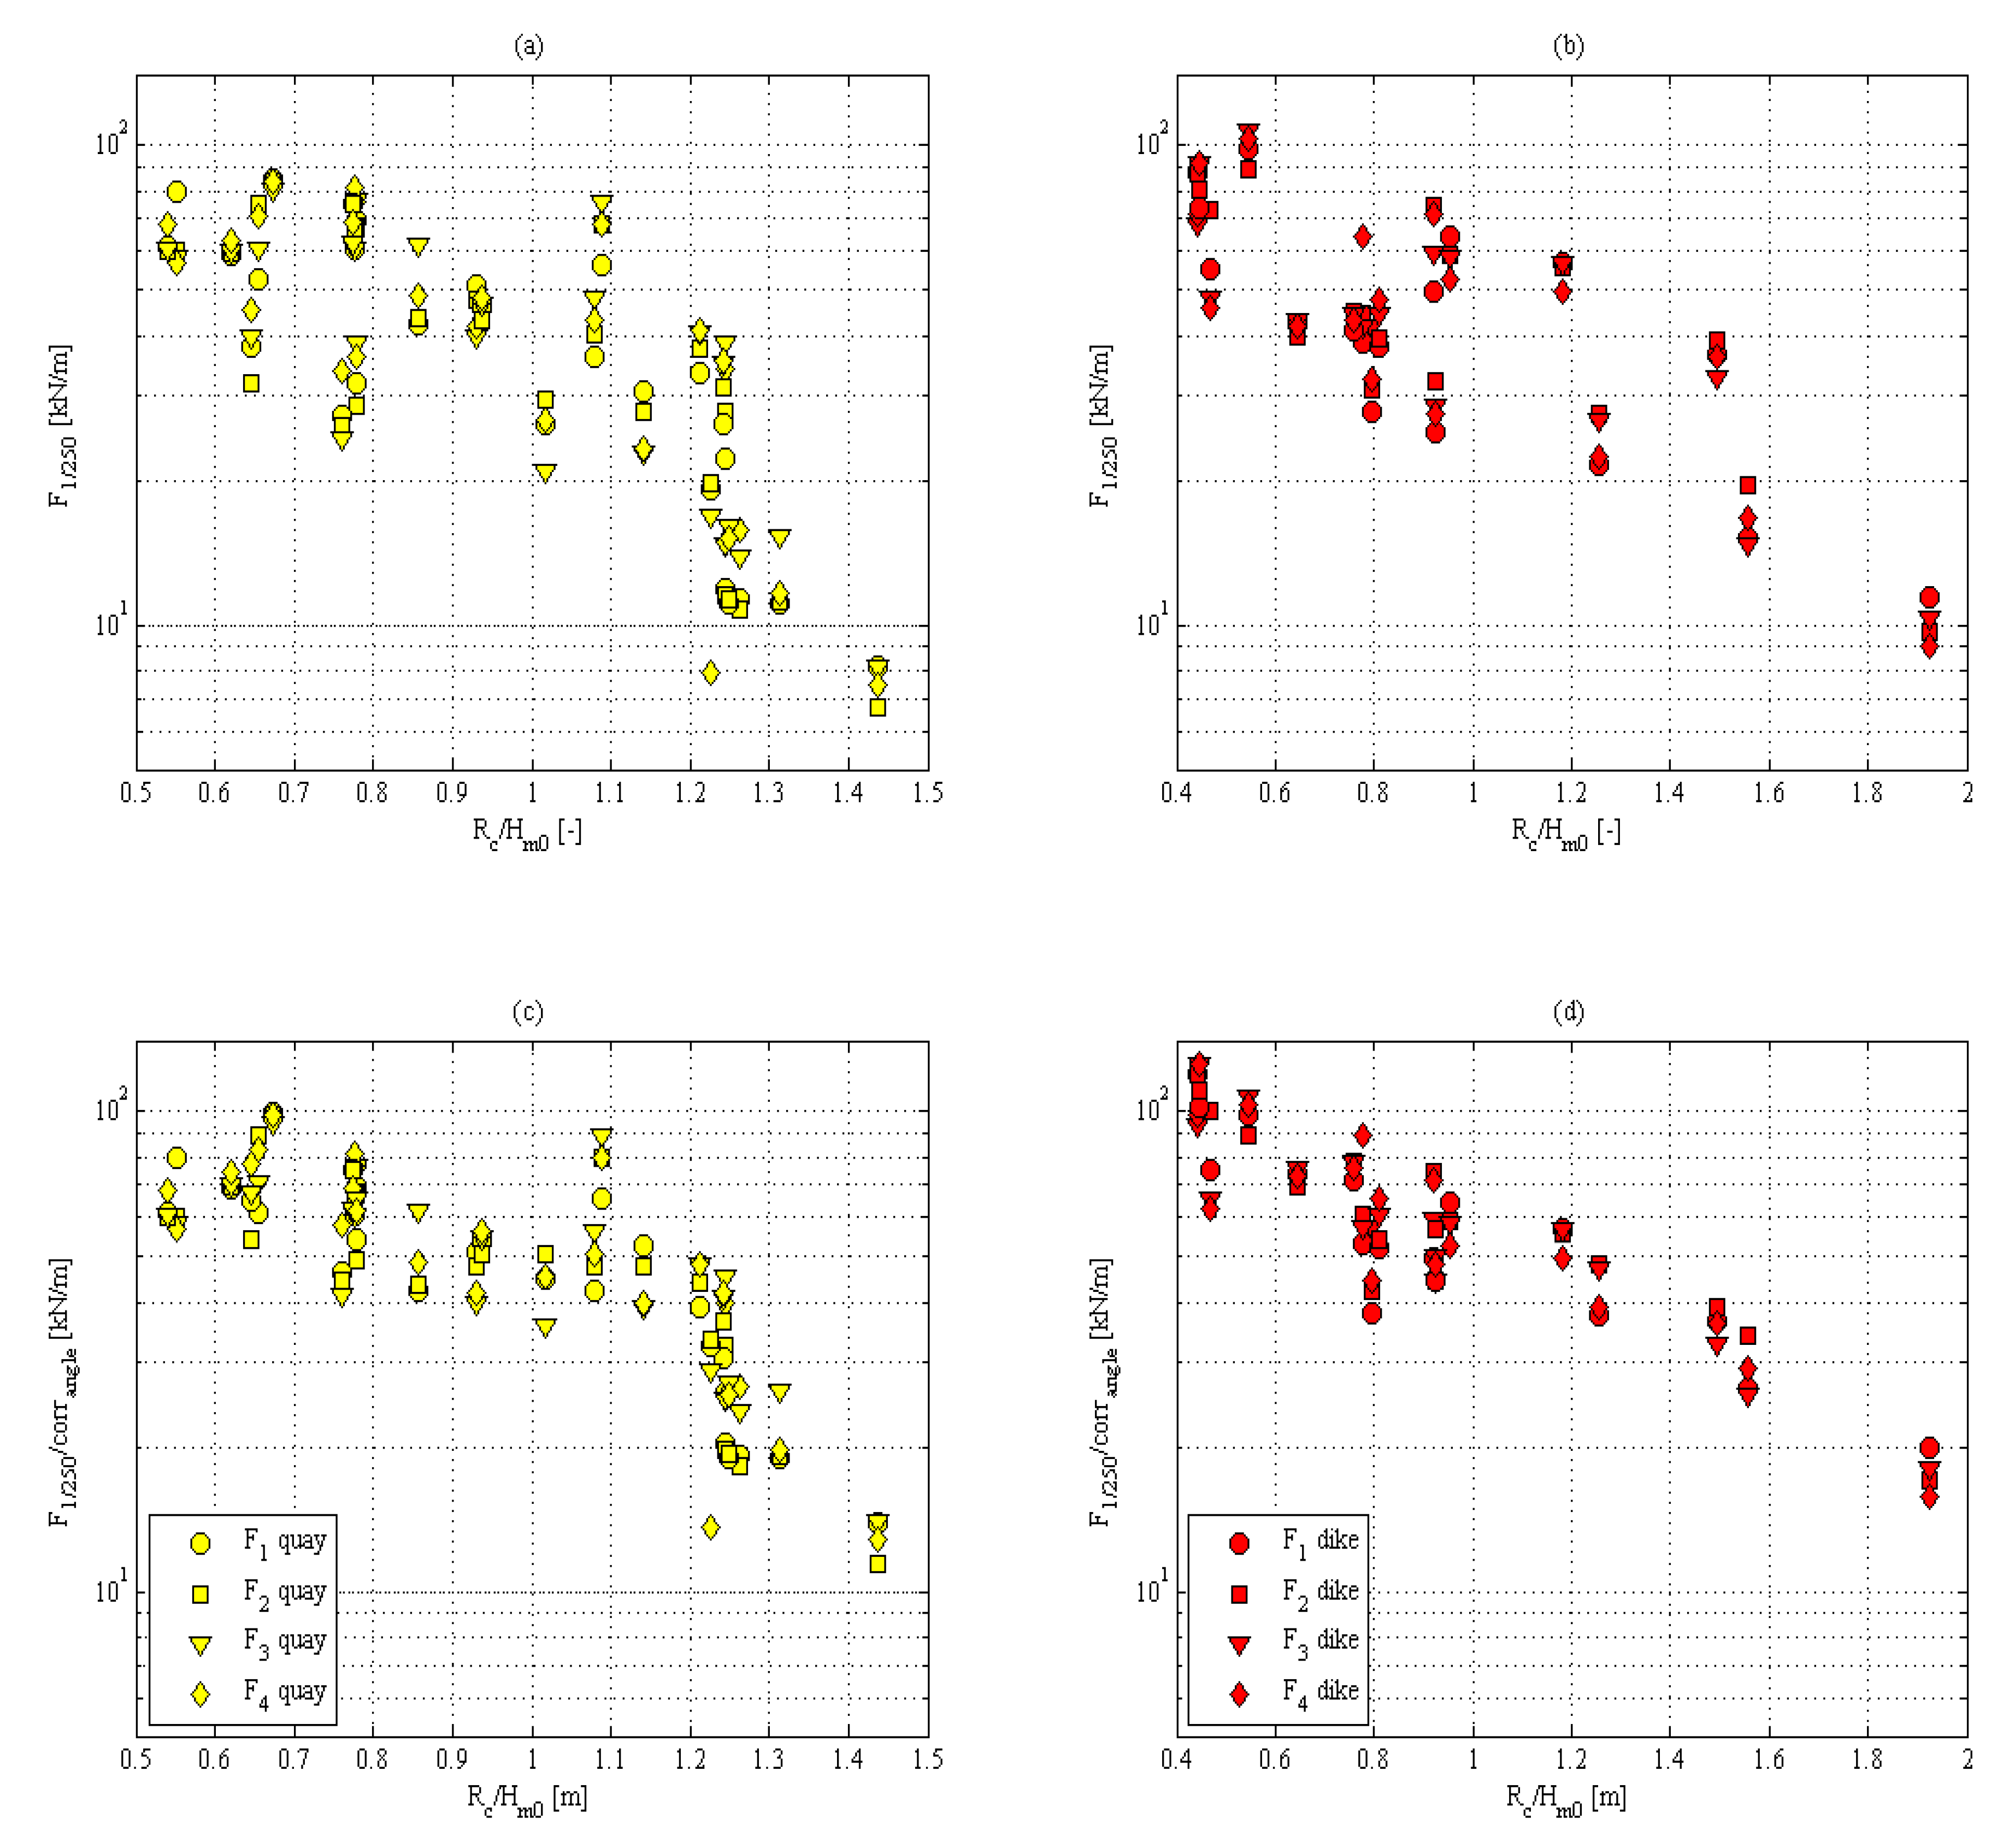
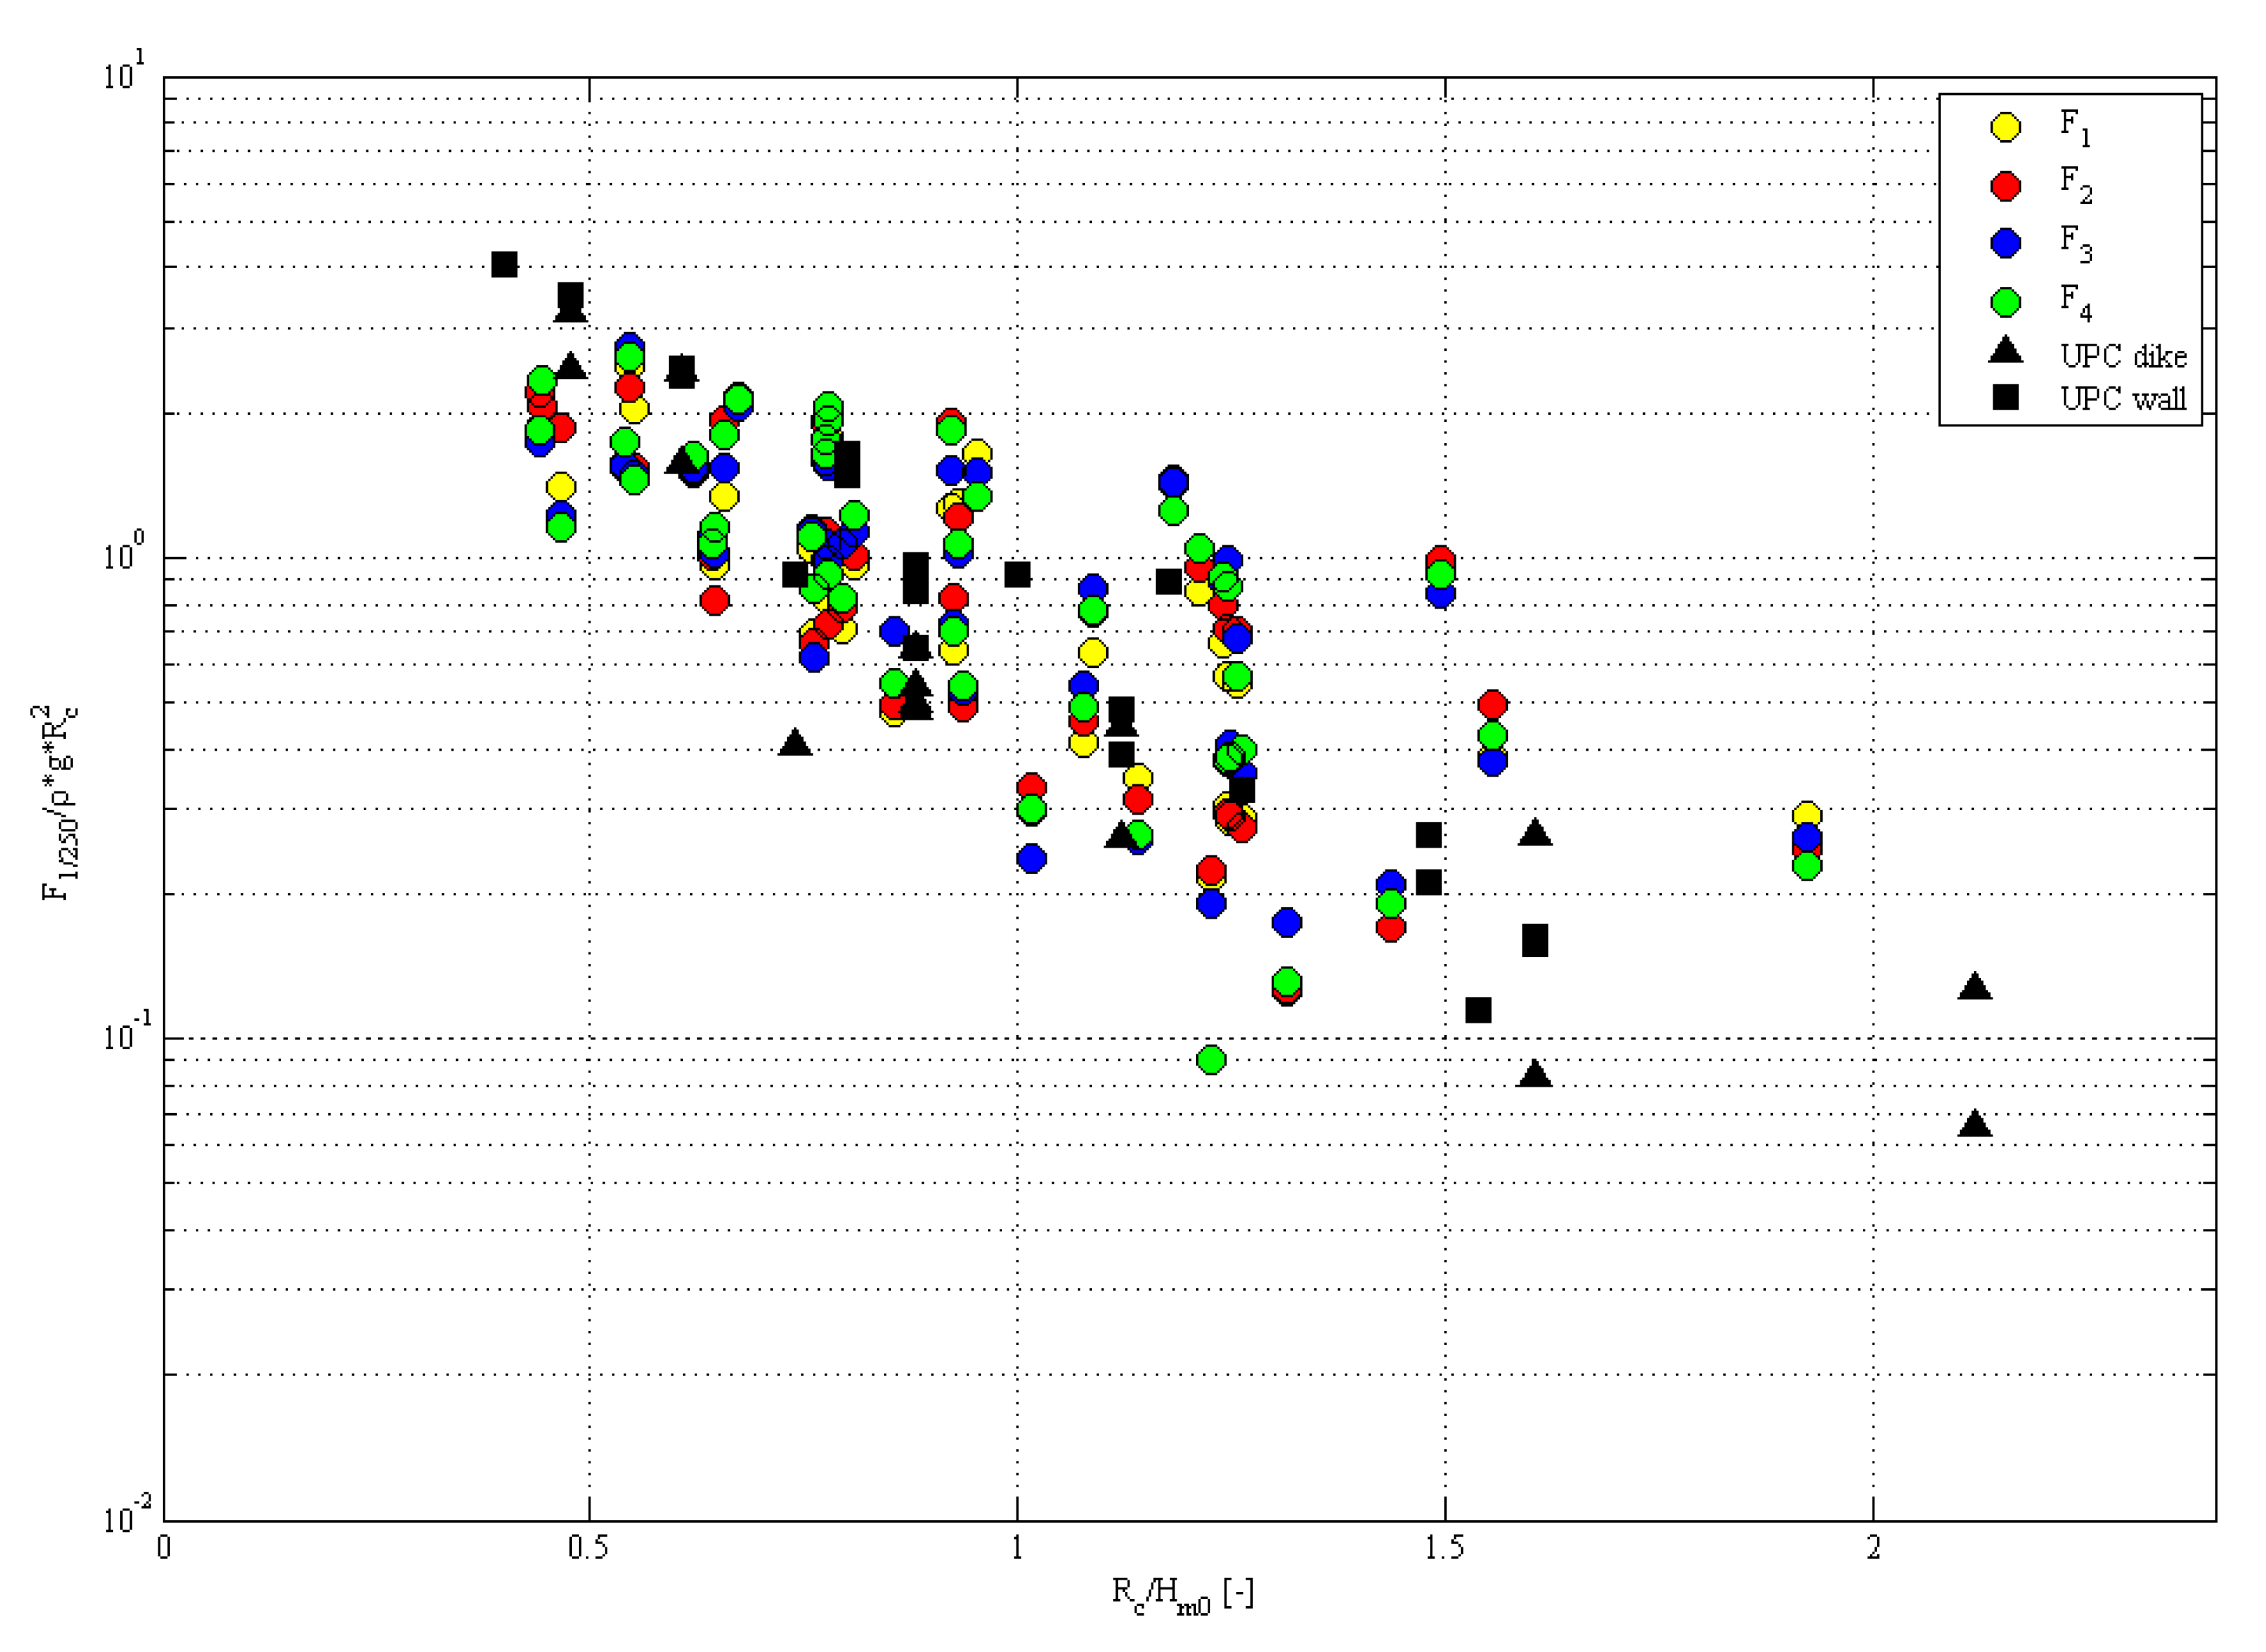
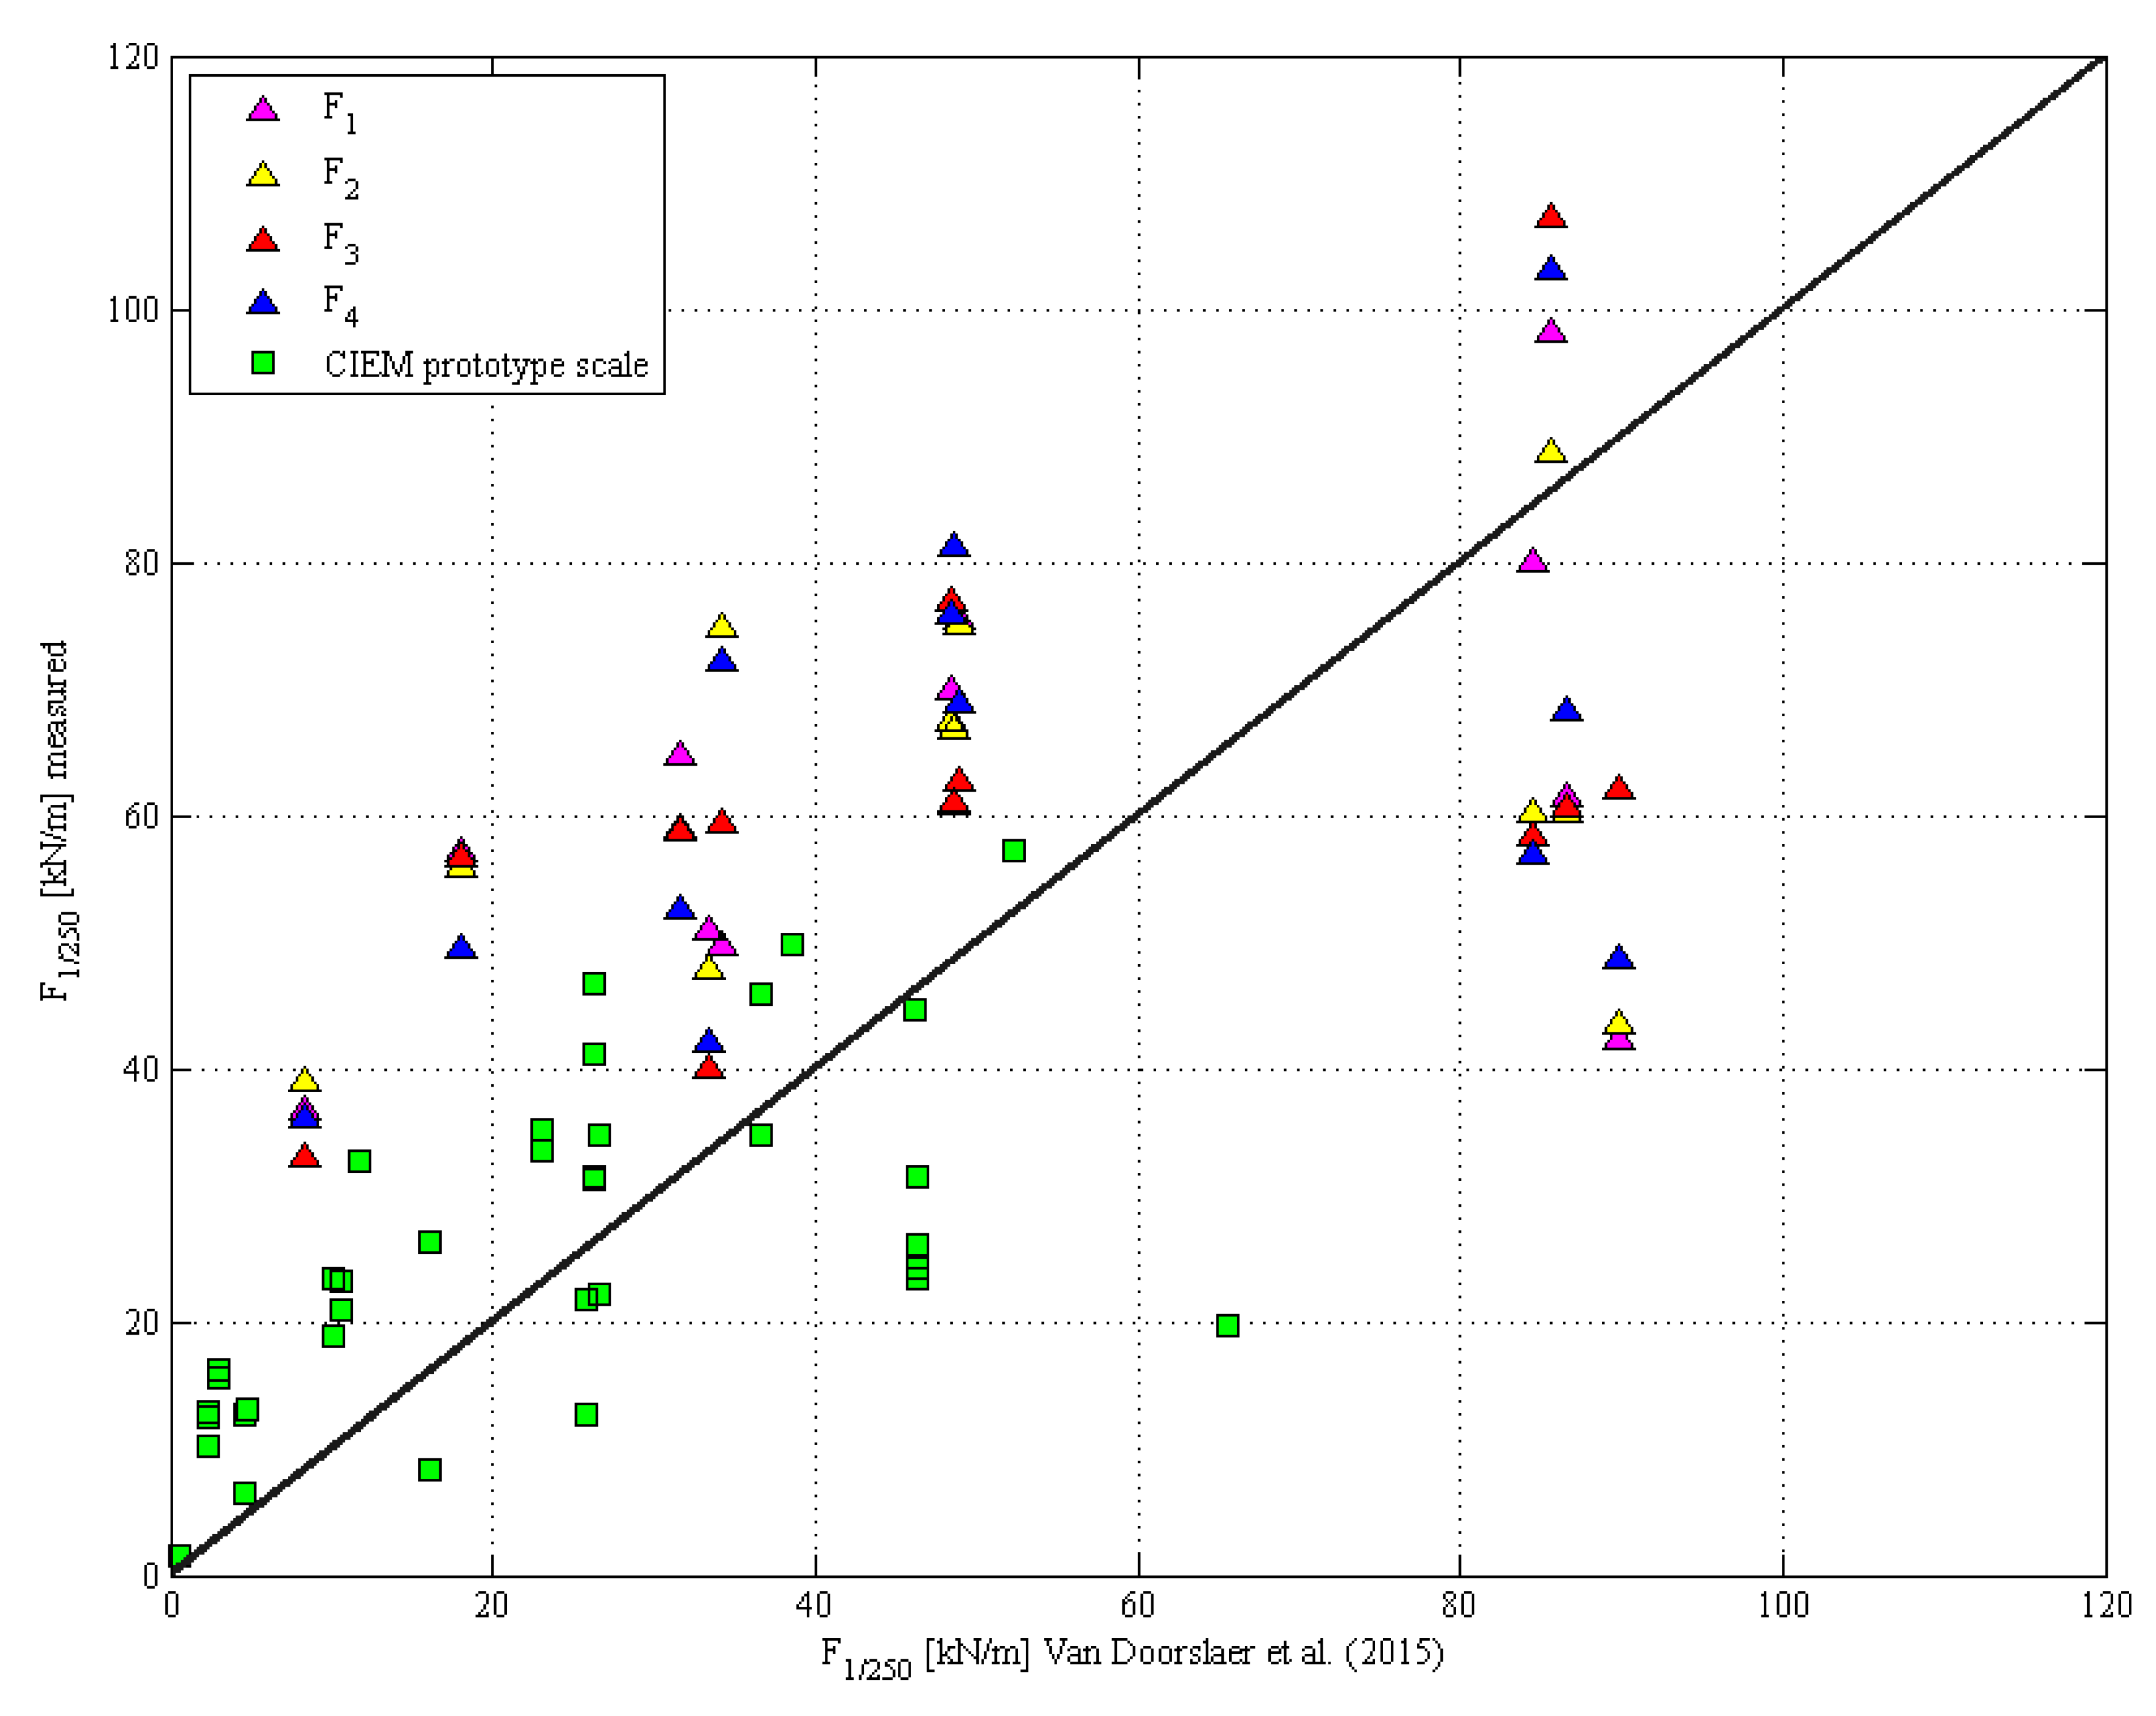
4.2. Force Reduction
- (a)
- measured wave force on the storm wall for the quay wall layout;
- (b)
- measured wave force on the storm wall for the sea dike layout;
- (c)
- measured wave force on the storm wall for the quay wall layout, including the correction with the proposed reduction factor for wave obliqueness; and
- (d)
- measured wave force on the storm wall for the sea dike layout, including the correction with the proposed reduction factor for wave obliqueness.
5. Conclusions
- The EurOtop formula [1] generally overestimates the overtopping discharge for large wave obliqueness.
- The values of the reduction factor γβ calculated for the vertical quay layout are equal to 0.76, 0.75, 0.44, and 0.28, respectively, for 45°, 60°, 70° and 80°.
- The values of the reduction factor γβ calculated for the sloping dike layout are equal to 0.72, 0.54 and 0.44 respectively for 45°, 60° and 80°.
- A rather large scatter is present in the results similar to the results presented in previous studies [3].
- The expression of γβ presented by Goda [3] is finally proposed as a good compromise between accuracy (in comparison with physical model results) and a certain safety in the design of the storm walls.
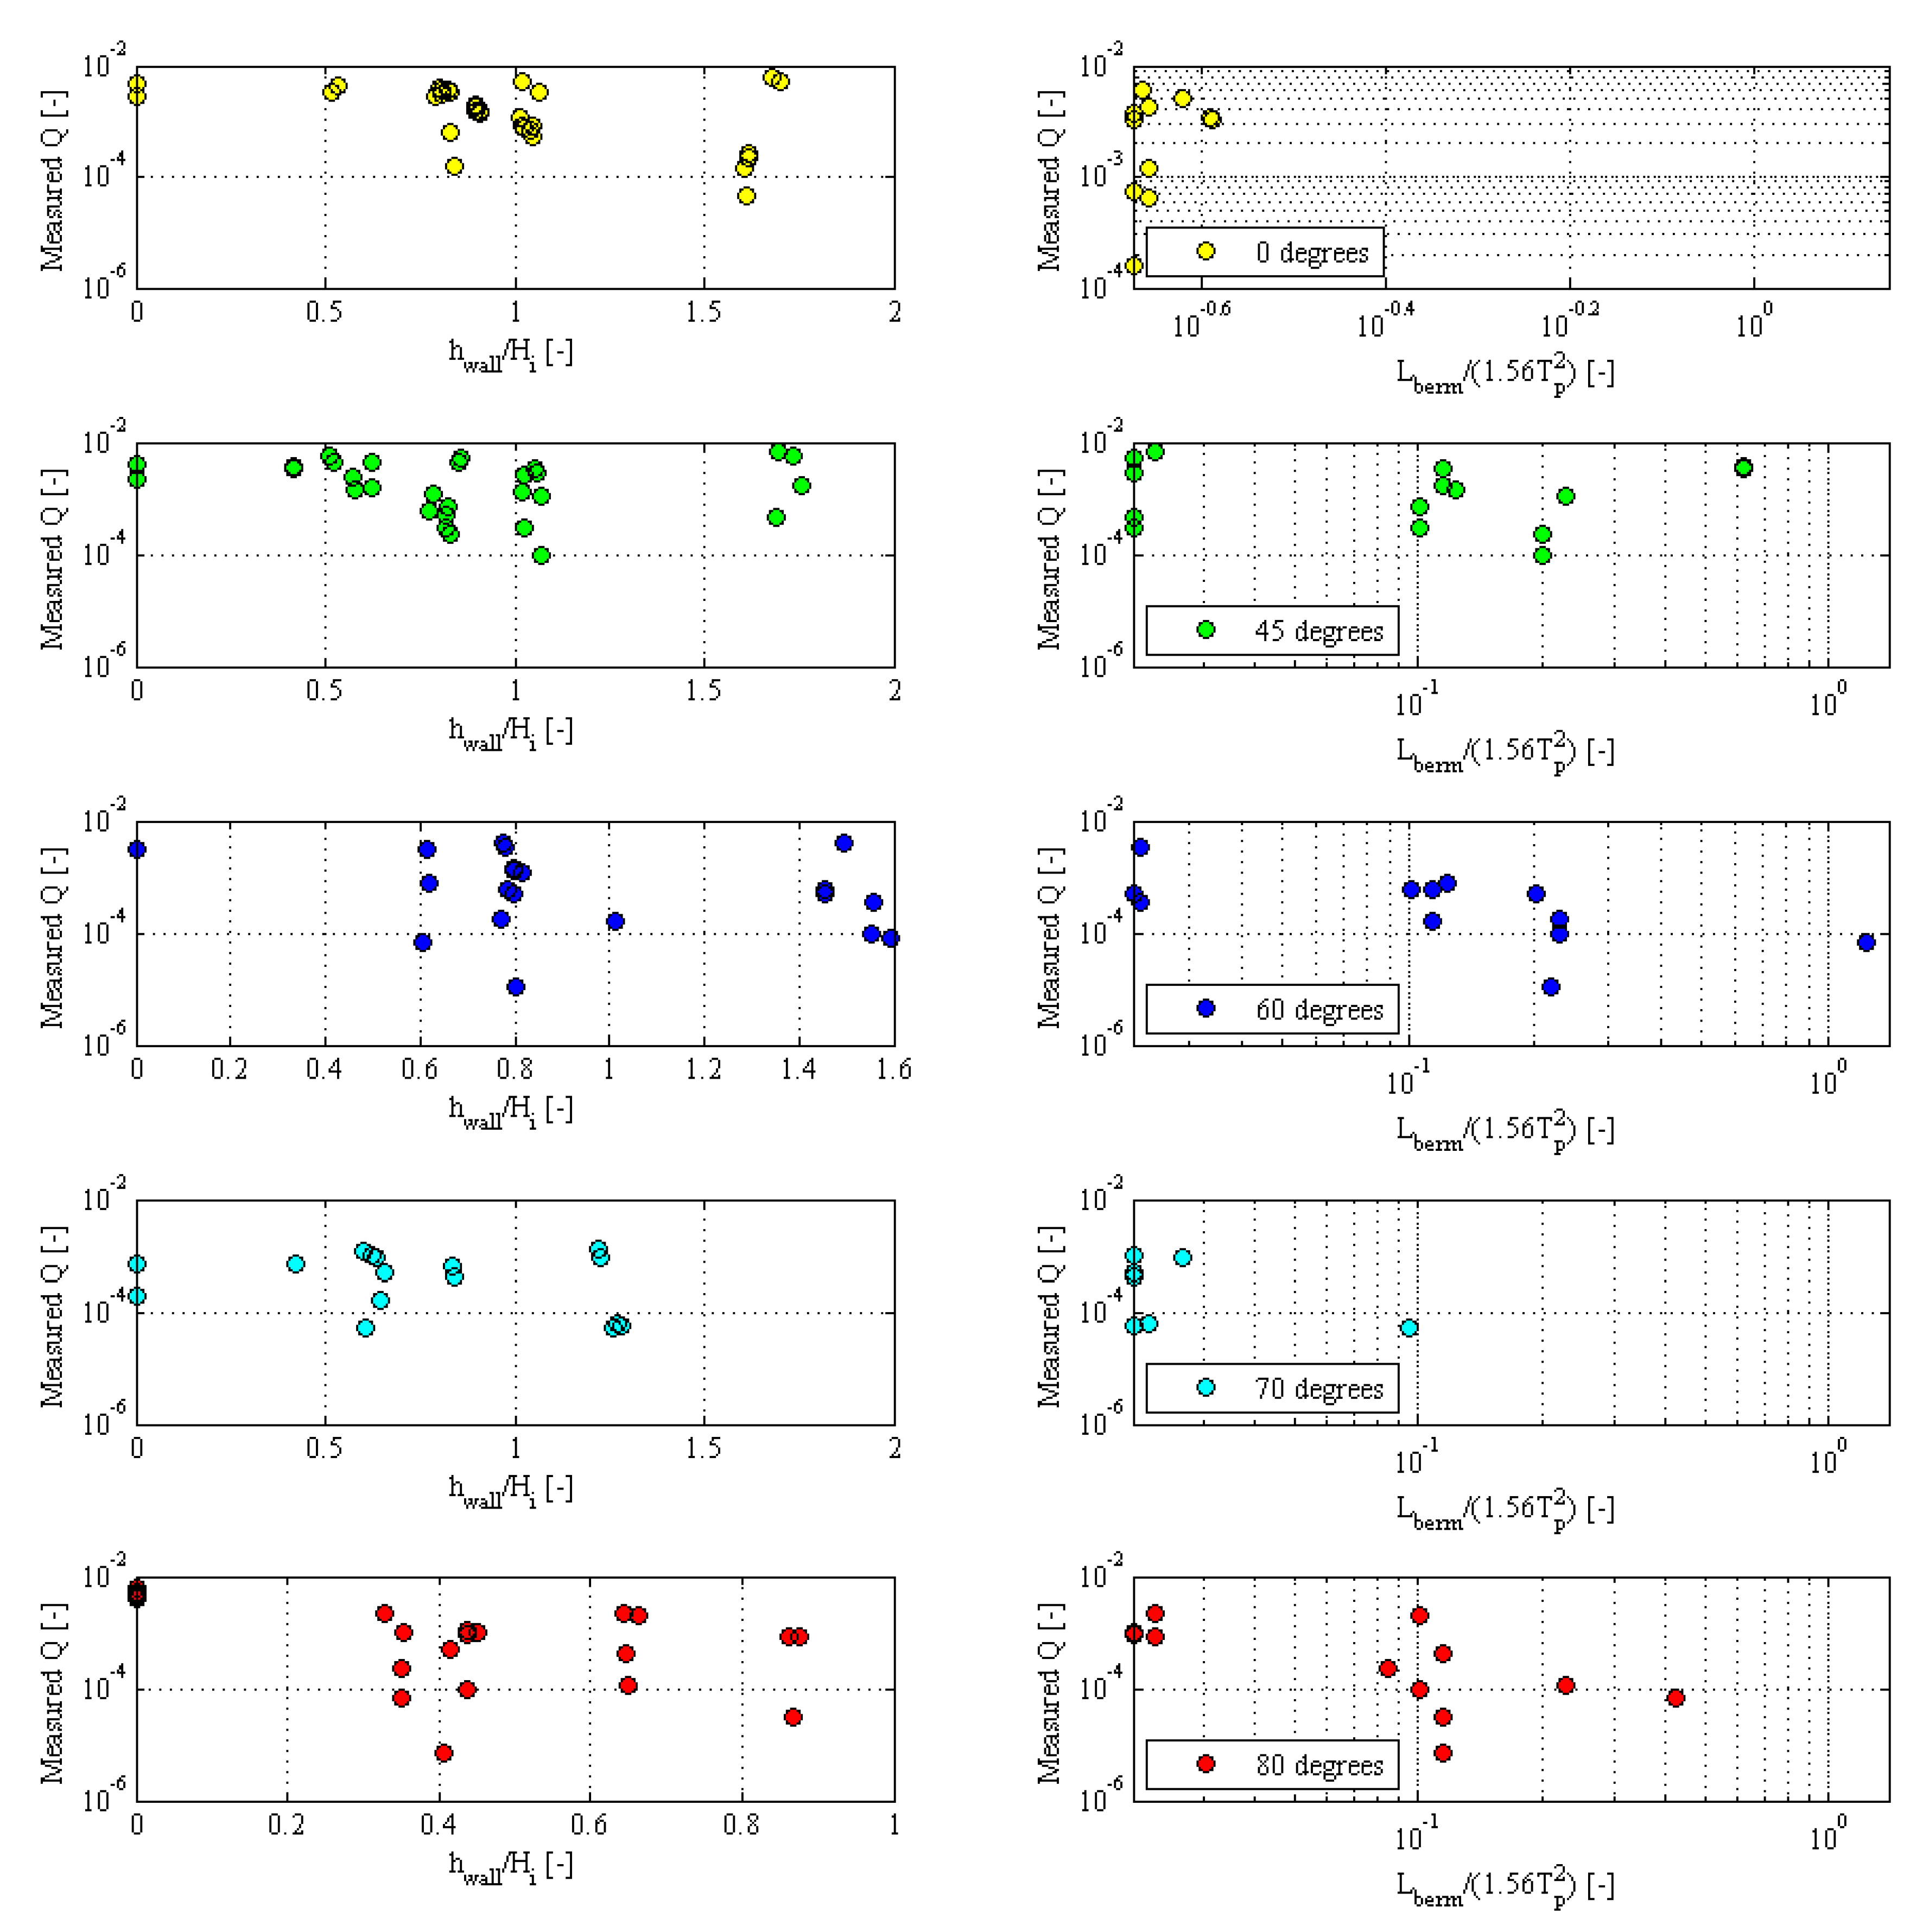
- The high obliqueness combined with long berms on the crest (comparable with the wave length) leads to very low or zero overtopping discharge.
- The berm length (ranging from 0 to 50 m) has a larger influence on the overtopping discharge than the wall height (ranging from 1 to 2 m).
Author Contributions
Funding
Acknowledgments
Conflicts of Interest
References
- Pullen, T.; Allsop, N.W.H.; Kortenhaus, A.; Schuttrumpf, H.; Van der Meer, J.W. (Eds.) European Overtopping Manual for the Assessment of Wave Overtopping (EurOtop); Die Küste, 73. Kuratorium für Forschung im Küsteningenieurwesen: Heide im Holstein, Germany, 2007; 185p, ISBN 978-3-8042-1064-6. Available online: www.overtopping-manual.com (accessed on 29 April 2020).
- Van der Meer, J.; Allsop, W.; Bruce, T.; Rouck, J.; Kortenhaus, A.; Pullen, T.; Schüttrumpf, H.; Troch, P.; Zanuttigh, B. EurOtop: Manual on Wave Overtopping of Sea Defences and Related Structures—An Overtopping Manual Largely Based on European Research, but for Worldwide Application, 2nd ed.; Environment Agency: Bristol, UK, 2018.
- Goda, Y. Derivation of unified wave overtopping formulas for seawalls with smooth, impermeable surfaces based on selected CLASH datasets. Coast. Eng. 2009, 56, 385–399. [Google Scholar] [CrossRef]
- De Waal, J.P.; Van der Meer, J.W. Wave run-up and overtopping on coastal structures. In Proceedings of the 23rd International Conference on Coastal Engineering, Venice, Italy, 4–9 October 1992; pp. 1758–1771. [Google Scholar]
- Kortenhaus, A.; Geeraerts, J.; Hassan, R. Wave Run-Up and Overtopping of Sea Dikes with and without Stilling Wave Tank under 3D Wave Attack (DIKE-3D); Final Report; Technische Universität Braunschweig: Braunschweig, Germany, 2006. [Google Scholar]
- Chen, W.; Van Gent, M.R.A.; Warmink, J.J.; Hulscher, S.J.M.H. The influence of a berm and roughness on the wave overtopping at dikes. Coast. Eng. 2020, 156, 103613. [Google Scholar] [CrossRef]
- Van Gent, M.R.A. Influence of oblique wave attack on wave overtopping at smooth and rough dikes with a berm. Coast. Eng. 2020, 160, 103734. [Google Scholar] [CrossRef]
- Van der Meer, J.W.; Bruce, T. New physical insights and design formulas on wave overtopping at sloping and vertical structures. J. Waterw. Port Coast. Ocean Eng. 2014, 140, 04014025. [Google Scholar] [CrossRef]
- Van Doorslaer, K.; De Rouck, J.; Audenaert, J.; Duquet, V. Crest modifications to reduce wave overtopping of non-breaking waves over a smooth dike slope. Coast. Eng. 2015, 101, 69–88. [Google Scholar] [CrossRef]
- Van Doorslaer, K.; Romano, A.; Bellotti, G.; Altomare, C.; Cáceres, I.; De Rouck, J.; Franco, L.; Van der Meer, J. Force measurements on storm walls due to overtopping waves: A middle-scale model experiment. In Proceedings of the International Conference on Coastal Structures, Boston, MA, USA, 9–11 September 2015. [Google Scholar]
- Verhaeghe, H.; Van der Meer, J.W.; Steendam, G.J. Database on Wave Overtopping at Coastal Structures; CLASH report, Workpackage 2; Ghent University: Ghent, Belgium, 2004. [Google Scholar]
- Hughes, S.A. Physical Models and Laboratory Techniques in Coastal Engineering; World Scientific Publishing: Singapore, 1993; Volume 7, p. 568. [Google Scholar]
- Schüttrumpf, H.; Oumeraci, H. Layer thicknesses and velocities of wave overtopping flow at seadikes. Coast. Eng. 2005, 52, 473–495. [Google Scholar] [CrossRef]
- WaveLab 3 Homepage Aalborg University. 2012. Available online: http://www.hydrosoft.civil.aau.dk/wavelab/ (accessed on 25 March 2020).
- Hashimoto, N.; Kobune, K. Directional spectrum estimation from a Bayesian approach. In Proceedings of the 21st Conference on Coastal Engineering, Costa del Sol-Malaga, Spain, 20–25 June 1987; Volume 1, pp. 62–76. [Google Scholar]
- Lee, J.I.; Lee, Y.T.; Kim, J.T.; Lee, J.K. Stem Waves along a vertical wall: Comparison between Monochromatic Waves and Random Waves. J. Coast. Res. 2009, 991–994. [Google Scholar]
- Mase, H.; Memita, T.; Yuhi, M.; Kitano, T. Stem waves along vertical wall due to random wave incidence. Coast. Eng. 2002, 44, 339–350. [Google Scholar] [CrossRef]
- Franco, C.; Franco, L. Overtopping formulas for caissons breakwaters with nonbreaking 3D waves. J. Waterw. Port Coast. Ocean Eng. 1999, 125, 98–107. [Google Scholar] [CrossRef]
- Vanneste, D.; Verwaest, T.; Mostaert, F. Overslagberekening Loodswezenplein Nieuwpoort; Versie 2.0. WL Adviezen, 15_005; Waterbouwkundig Laboratorium (Flanders Hydraulics Research): Antwerpen, België, 2015. (In Dutch) [Google Scholar]
- Owen, M.W. Design of seawalls allowing for wave overtopping. In Hydraulics Research, Wallingford; Report No. EX 924; HR Wallingford: Wallingford, UK, 1980. [Google Scholar]
- Van der Meer, J.W.; En de Waal, J.P. Invloed van scheve golfinval en richtingspreiding op galfoploop en overslag, “Influence of oblique wave attack and directional spreading on wave run-up and overtopping”. In Report on Model Investigation; H638; Delft Hydraulics: Delft, The Netherlands, 1990. (In Dutch) [Google Scholar]
- Bornschein, A.; Pohl, R.; Wolf, V.; Schüttrumpf, H.; Scheres, B.; Troch, P.; Riha, J.; Spano, M.; Van der Meer, J. Wave run-up and wave overtopping under very oblique wave attack (CORNERDIKE-Project). In Proceedings of the HYDRALAB IV Joint User Meeting, Lisbon, Portugal, 2–4 July 2014. [Google Scholar]
- Goda, Y. New wave pressure formulae for composite breakwater. In Proceedings of the 14th International Conference Coastal Engineering, Copenhagen, Denmark, 24–28 June 1974; pp. 1702–1720. [Google Scholar]
- Dan, S.; Altomare, C.; Spiesschaert, T.; Willems, M.; Verwaest, T.; Mostaert, F. Overtopping Reduction for the Oblique Waves Attack: Report 1. Wave Overtopping Discharge; Version 3.0. FHR Reports, 00_050_1; Flanders Hydraulics Research: Antwerp, Belgium, 2016. [Google Scholar]
- Dan, S.; Altomare, C.; Spiesschaert, T.; Willems, M.; Verwaest, T.; Mostaert, F. Oblique Wave Attack on Storm Walls: Report 2. Force Reduction; Version 3.0. FHR Reports, 00_050_2; Flanders Hydraulics Research: Antwerp, Belgium, 2016. [Google Scholar]


| Seabed Slope | Coefficient A | Coefficient B | ||||
|---|---|---|---|---|---|---|
| tan θ | A0 | b1 | c2 | B0 | b2 | c2 |
| 1/10 | 3.6 | 1.4 | 0.1 | 2.3 | 0.6 | 0.8 |
| 1/20–1/1000 | 3.6 | 1.0 | 0.6 | 2.3 | 0.8 | 0.6 |
| Geometry | a | b |
|---|---|---|
| Dike | 8.31 (0.22) | 2.45 (0.07) |
| Quay | 18.27 (0.23) | 3.99 (0.06) |
| All | 5.96 (0.23) | 2.42 (0.09) |
| Total no. of Tests | Used for Analyses | Vertical Quay | Sloping Dike (1 to 2.5) | |
|---|---|---|---|---|
| 377 | 230 | 191 | 39 | |
| Wave directions | Wave height (Hm0) | Wave period (Tp) | Crest freeboard (Rc) | Storm return wall position |
| 0°, 45°, 60°, 70°, 80° | 0.96 to 3.39 m | 5.1 to 12.6 s | 0 to 2.75 m | 0 to 50 m |
| Total Number of Tests | 44 | |||
|---|---|---|---|---|
| Wave directions | Wave height (Hm0) | Wave period (Tp) | Crest freeboard (Rc) | Storm return wall position |
| 0°, 45°, 80° | 1.04 to 4.54 m | 10.2 to 12.9 s | 0 to 3.0 m | 0 to 25 m |
© 2020 by the authors. Licensee MDPI, Basel, Switzerland. This article is an open access article distributed under the terms and conditions of the Creative Commons Attribution (CC BY) license (http://creativecommons.org/licenses/by/4.0/).
Share and Cite
Dan, S.; Altomare, C.; Suzuki, T.; Spiesschaert, T.; Verwaest, T. Reduction of Wave Overtopping and Force Impact at Harbor Quays Due to Very Oblique Waves. J. Mar. Sci. Eng. 2020, 8, 598. https://doi.org/10.3390/jmse8080598
Dan S, Altomare C, Suzuki T, Spiesschaert T, Verwaest T. Reduction of Wave Overtopping and Force Impact at Harbor Quays Due to Very Oblique Waves. Journal of Marine Science and Engineering. 2020; 8(8):598. https://doi.org/10.3390/jmse8080598
Chicago/Turabian StyleDan, Sebastian, Corrado Altomare, Tomohiro Suzuki, Tim Spiesschaert, and Toon Verwaest. 2020. "Reduction of Wave Overtopping and Force Impact at Harbor Quays Due to Very Oblique Waves" Journal of Marine Science and Engineering 8, no. 8: 598. https://doi.org/10.3390/jmse8080598
APA StyleDan, S., Altomare, C., Suzuki, T., Spiesschaert, T., & Verwaest, T. (2020). Reduction of Wave Overtopping and Force Impact at Harbor Quays Due to Very Oblique Waves. Journal of Marine Science and Engineering, 8(8), 598. https://doi.org/10.3390/jmse8080598