1. Introduction
Wave overtopping assessment is a key procedure within the general design of any coastal defense. The groundwork for the assessment of wave overtopping was laid by [
1], who chose the average discharge as a design value, stating that “there is no such thing as an absolute discharge: because the wave heights and periods exhibit a random distribution about a given mean, the discharge will also vary randomly”. Since [
1], several experimental campaigns have been carried out worldwide, leading to semi-empirical models, which are nowadays largely used for wave overtopping assessment (e.g., [
2,
3,
4]). Nevertheless, during the last few years, the increased storminess caused by climate change has raised concerns among researchers, engineers and decision-makers: is the average overtopping an appropriate design criterion? Or are the biggest waves the ones that cause the major damages and casualties? Allsop et al. [
5] highlighted that tests on the effects of overtopping flows on people indicate that the assessment of mean discharge is not enough to evaluate people’s safety; the authors proposed maximum individual overtopping volumes as more suitable hazard indicators. Limits for individual overtopping volumes together with tolerable mean discharges were proposed in [
5], related to overtopping velocities below 10 m/s. However, the authors suggested that lower volumes may be required for violent overtopping processes with higher velocities. Therefore, it was emphasized but not discussed further that other flow parameters might play an important role and be linked to overtopping hazards, namely overtopping flow velocity and overtopping flow depth. Generally speaking, “the character of overtopping flow hazards depends on geometries of the defence, the hinterland and the form of overtopping” [
5]. Several studies have been gathered and presented in EurOtop [
6], where finally a tolerable limit for maximum individual volumes equal to 600 L/m was suggested, over which a single event cannot be tolerated by people (
Table 1).
Despite many efforts having been done to assess overtopping flow velocities and overtopping flow depths on the seaward side, crest and landward side of coastal defenses [
7,
8,
9,
10], no direct link has been clearly established between tolerable overtopping individual volumes and discharges with tolerable flow velocities and flow depths.
Few studies considered overtopping flow depths and velocities in order to estimate the overtopping hazard for pedestrians [
11,
12]. In some cases, the referred limits were obtained from physical experiments using anthropomorphic dummies, and in other cases [
12], a video analysis of real flooding events was performed. In addition, any formula for overtopping flow depth and velocity does not necessarily refer to the same specific overtopping event, since the 2% exceedance probability of the two quantities is considered. These quantities are proved to not be correlated [
10]. Nevertheless, when looking at the maximum individual overtopping volumes, the aim is to characterize the flow depth and velocity associated to that volume, since it is the one reported as threshold value for safety [
6].
The present work analyses the overtopping discharges, volumes, overtopping flow depth and velocities that can lead to risk scenarios for people. This work focuses on coastal defenses in highly urbanized areas. For this purpose, the case study of Premià de Mar is analyzed, which schematically represents the coastline north of Barcelona, Spain. The main purpose of this study is to discuss the validity of the present safety limits and design criteria for the Catalan coast. To reach this objective, physical model tests were carried out, modelling a layout that resembles the case study for different wave conditions corresponding to events with different return periods. The acquired experimental data were collected, analyzed and compared with the state-of-the-art semi-empirical formulas; the results, finally, were compared with the safety criteria from [
6] and with the stability curves for people combining flow velocities and depths [
12,
13,
14].
2. Overtopping Flow Parameters and People Safety
Wave overtopping can be distinguished between smooth “green” overtopping flows and a highly turbulent “white” overtopping flows. In [
6], “green water” was defined as a wave overtopping which runs up the face of the seawall and over the crest in a (relatively) continuous sheet of water. In contrast, ‘white water’ or spray overtopping tends to occur in cases of significant splashes, due to heavy waves breaking on the seaward face of defense structures which produces non-continuous overtopping and/or significant volumes of spray. The main parameters that are commonly employed to characterize overtopping flows are the mean overtopping discharge,
q, and the individual maximum overtopping volume,
Vmax. Plenty of semi-empirical models have been derived that allow quantifying mean discharge values and depend on the kind of structure and hydraulic boundary conditions. Dikes with gentle slope, namely between 1:7 and 1:2, are studied in [
3,
4,
6,
15,
16]. Steeper slopes up to vertical walls were analyzed in [
17,
18,
19,
20], where the last one includes cases of structures with emergent toe. Goda [
21] proposed a set of unified formulas for smooth impermeable sea dikes where new coefficients were derived as a function of local water depth, foreshore slope and dike slope. The influence of the foreshore slope for very and extremely shallow water conditions [
22] was taken into account in [
15] by means of the equivalent slope concept. Similar to this, [
20] employed an imaginary slope for wave run-up and overtopping calculations. Other authors focused their attention on the characterization of overtopping flow depths and velocities, such as [
9,
10,
23,
24].
Even though the scientific literature available on wave overtopping prediction is very extensive, there are few works dealing with the stability of people under the effect of wave overtopping flows; that is limited to a modest number of studies. In this area of investigation, some studies have tested human subjects in controlled flow conditions which have generated a quantification of the critical flow parameters and mechanisms, possibly leading to a person losing stability and falling in the surrounding flow. The first study with the purpose to analyze the human stability in wave overtopping flows was promoted by the Japanese Port and Harbor Research Institute (PHRI), the results of which were published in [
11]. The authors proposed two models of human instability: “slipping” and “tumbling”. The first one occurs when the flow force against the body (F
f) is bigger than the maximum available bottom friction resistance of the subject (F
r). The second mechanism models the falling process arising when the unbalancing moment produced by the flow around the feet of the subject is bigger than the restoring moment produced by the weight of the person (M
r). Sandoval and Bruce [
12] revisited the model of [
11], accounting for the buoyancy of the subject, as well as its related position respect to the incoming flows. The analysis for each mechanism of instability can be derived as follows:
1. Friction stability (F
f-F
r)
2. Momentum stability (M
r-M
f)
where
u = flow velocity (m/s);
d = flow depth (m);
ρ = density of water (kg/m3);
μ = coefficient of friction between shoe sole and ground (-);
B1 = average diameter of the subject legs (m);
Cd = drag coefficient (-)
d1 = distance from pivot point to the center gravity (m);
mg = subject’s mass (kg)
The moments generated by the flows (Mf) can be calculated as the drag force applied at the half of the depth. On the other hand, the restoring moment (Mr) is a function of the person’s weight and the distance to the pivot point (d1).
More recently, Arrighi et al. [
13,
14] compared the experimental evidence for humans and vehicles with the results of a numerical investigation. The authors identified relative submergence and the Froude number as the most relevant parameters to express the vulnerability of pedestrians. They derived a regression curve for human stability, expressed as follows:
where
HcrP is the critical flow depth,
HP is the height of the subject, while their ratio represents the relative submergence. If
H/HcrP < 1, the person is stable. The Froude number is calculated as
u⁄√(gd).
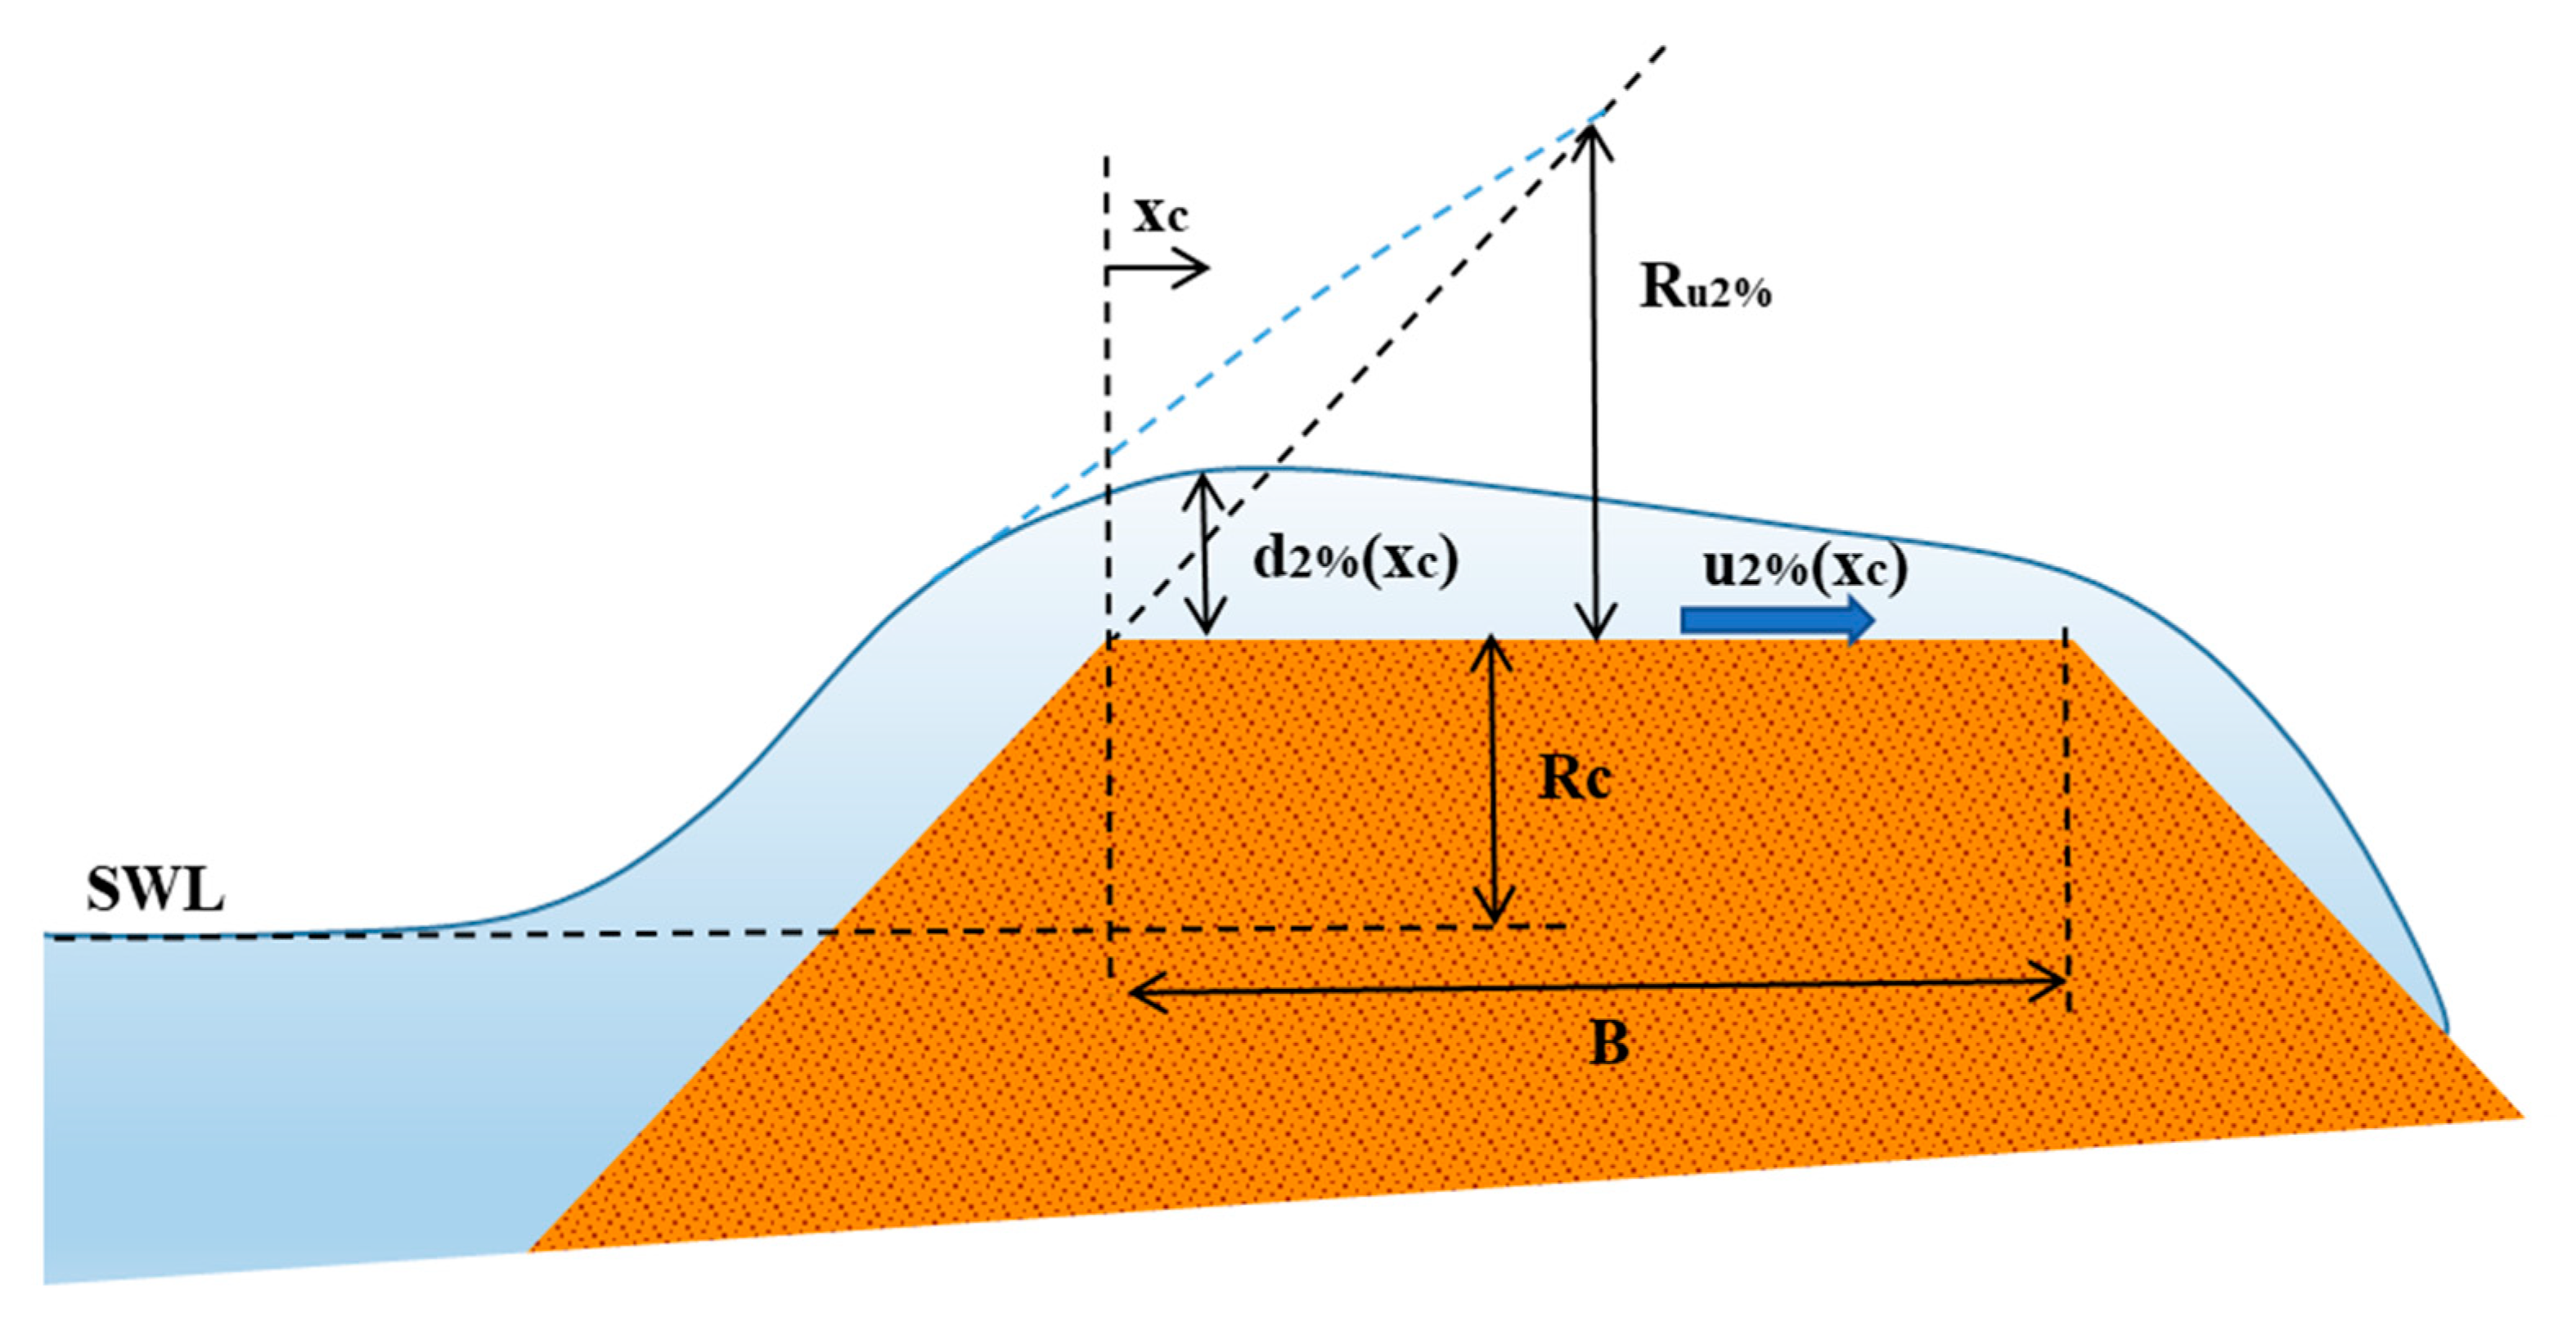
3. Overtopping Flow Velocity and Flow Depth Estimation on the Dike Crest
There is already plenty of literature dealing with the estimation of overtopping flow parameters [
10,
25,
26]. The equations for overtopping flow depth and velocity at the dike crest can be expressed in a general form as follows:
where
d2% is the overtopping flow depth on the dike crest,
u2% is the overtopping flow velocity on the dike crest,
xc is the streamwise coordinate on the dike crest, μ is the bottom friction coefficient,
Ru2% is the wave run-up,
Rc is the crest freeboard respect to the still water level (
Figure 1). The subscript 2% refers to quantities exceeded by 2% of the number of the incident waves. The coefficients
cd2%,
cu2%,
cc,d, and
cc,u are empirical coefficients, and the values can vary according to the literature. For run-up assessment, formulas are here omitted for sake of simplicity. The reader can refer, for example, to [
6].
Instead, Hughes [
24] established empirical relationships between individual overtopping wave volumes and the maximum velocity, maximum flow depth and individual discharge, based on data for 1:3 and 1:6 dike slopes:
In this case,
u and
d refer to the maximum velocity and depth on the dike crest, respectively. The dike slope and the wave period are included in the relationship, but most important there is a direct link with the individual overtopping volume. This was also confirmed by [
27], who derived expressions for overtopping flow parameters analytically based on wave momentum flux, in analogy with [
28].
4. Case of Study
4.1. Site Description and Model Geometry
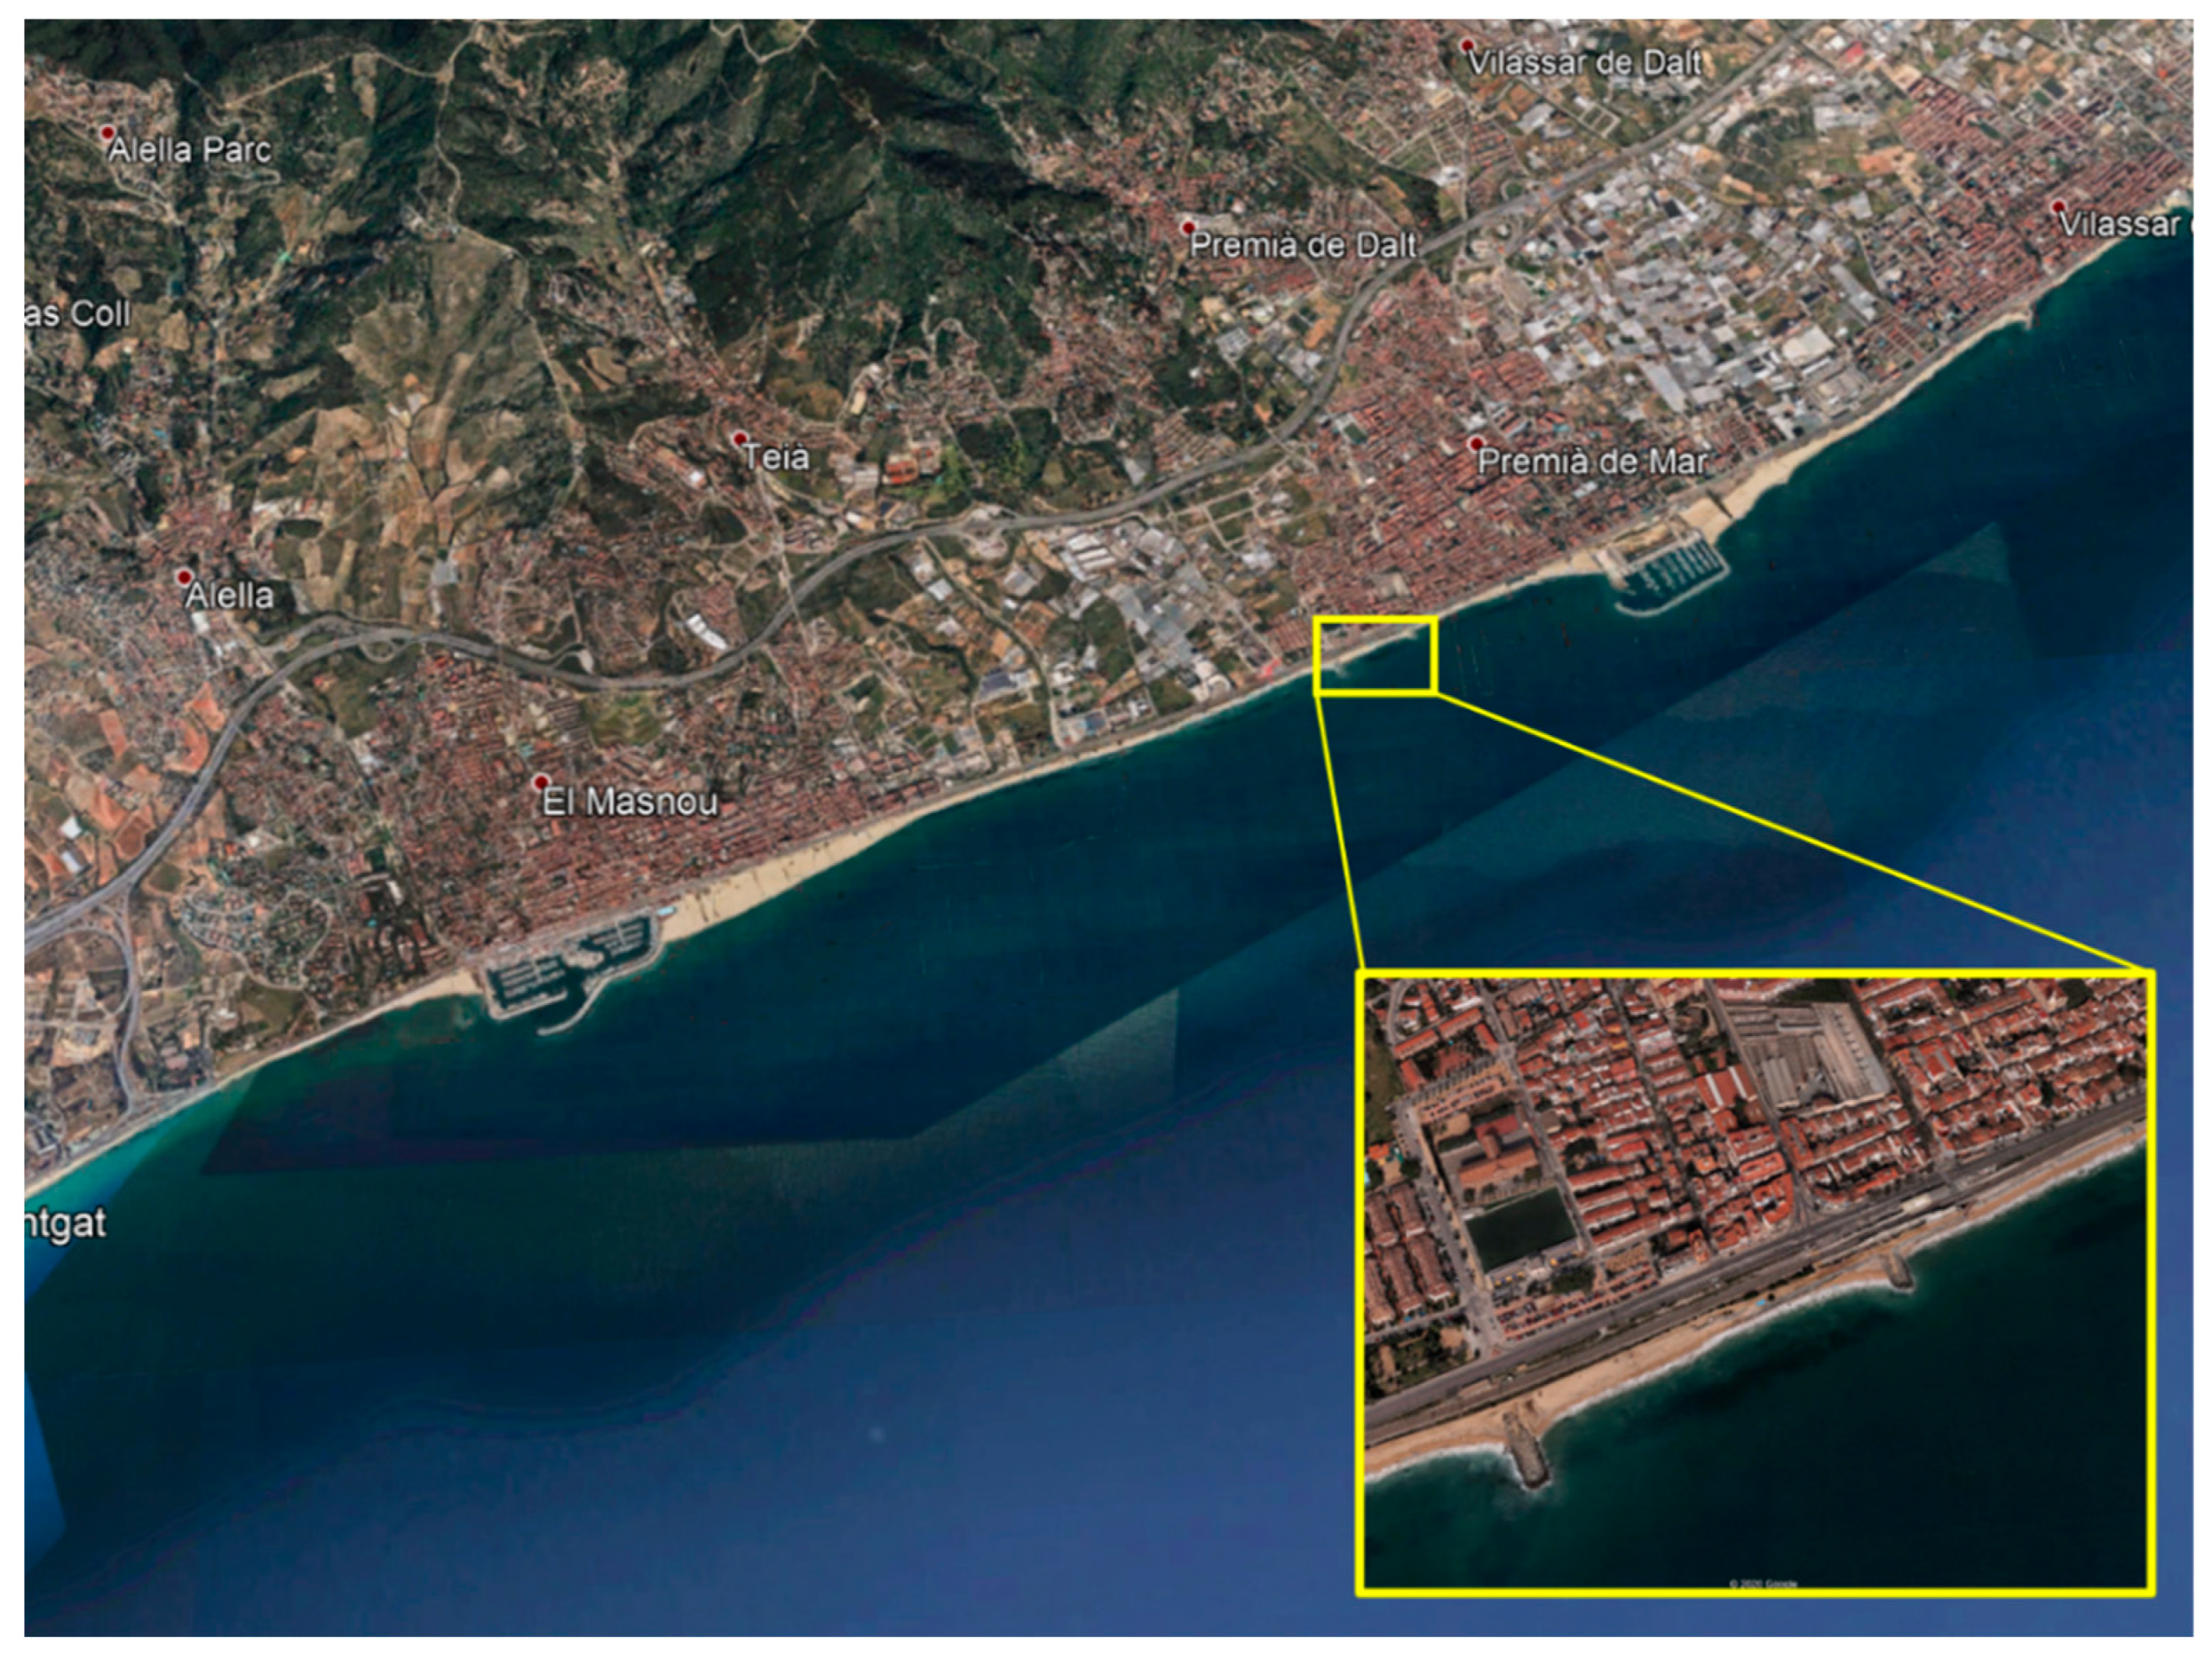
Physical model experiments were carried out in the CIEMito wave flume at the Maritime Engineering Laboratory of Universitat Politècnica de Catalunya—BarcelonaTech (LIM/UPC), in Barcelona, Spain. The geometrical layout used for the experimental campaign resembles the beach and coastal protection in the area of Premià de Mar, municipality in the Comarca of the Maresme in Catalonia, Spain (
Figure 2). This stretch of the coast is characterised by the presence of both railways and a promenade/bike path which are very exposed to possible sea storms, being located at a few meters from the shoreline. A dike made of natural stone with a relatively steep slope (1:1) characterises this coastal area. In the physical model tests, the effects of the rubble mound have been neglected, considering a smooth slope instead. It is in the interest of the present research to analyse those stretches where nourishment was no longer performed (characteristic in the winter season and storm events). Hence, the beach has been eroded, leaving the dike exposed directly to the sea. A water depth at the dike toe is between 0.5 and 1 m and the crest of the dike is 3–4 m above the mean sea level.
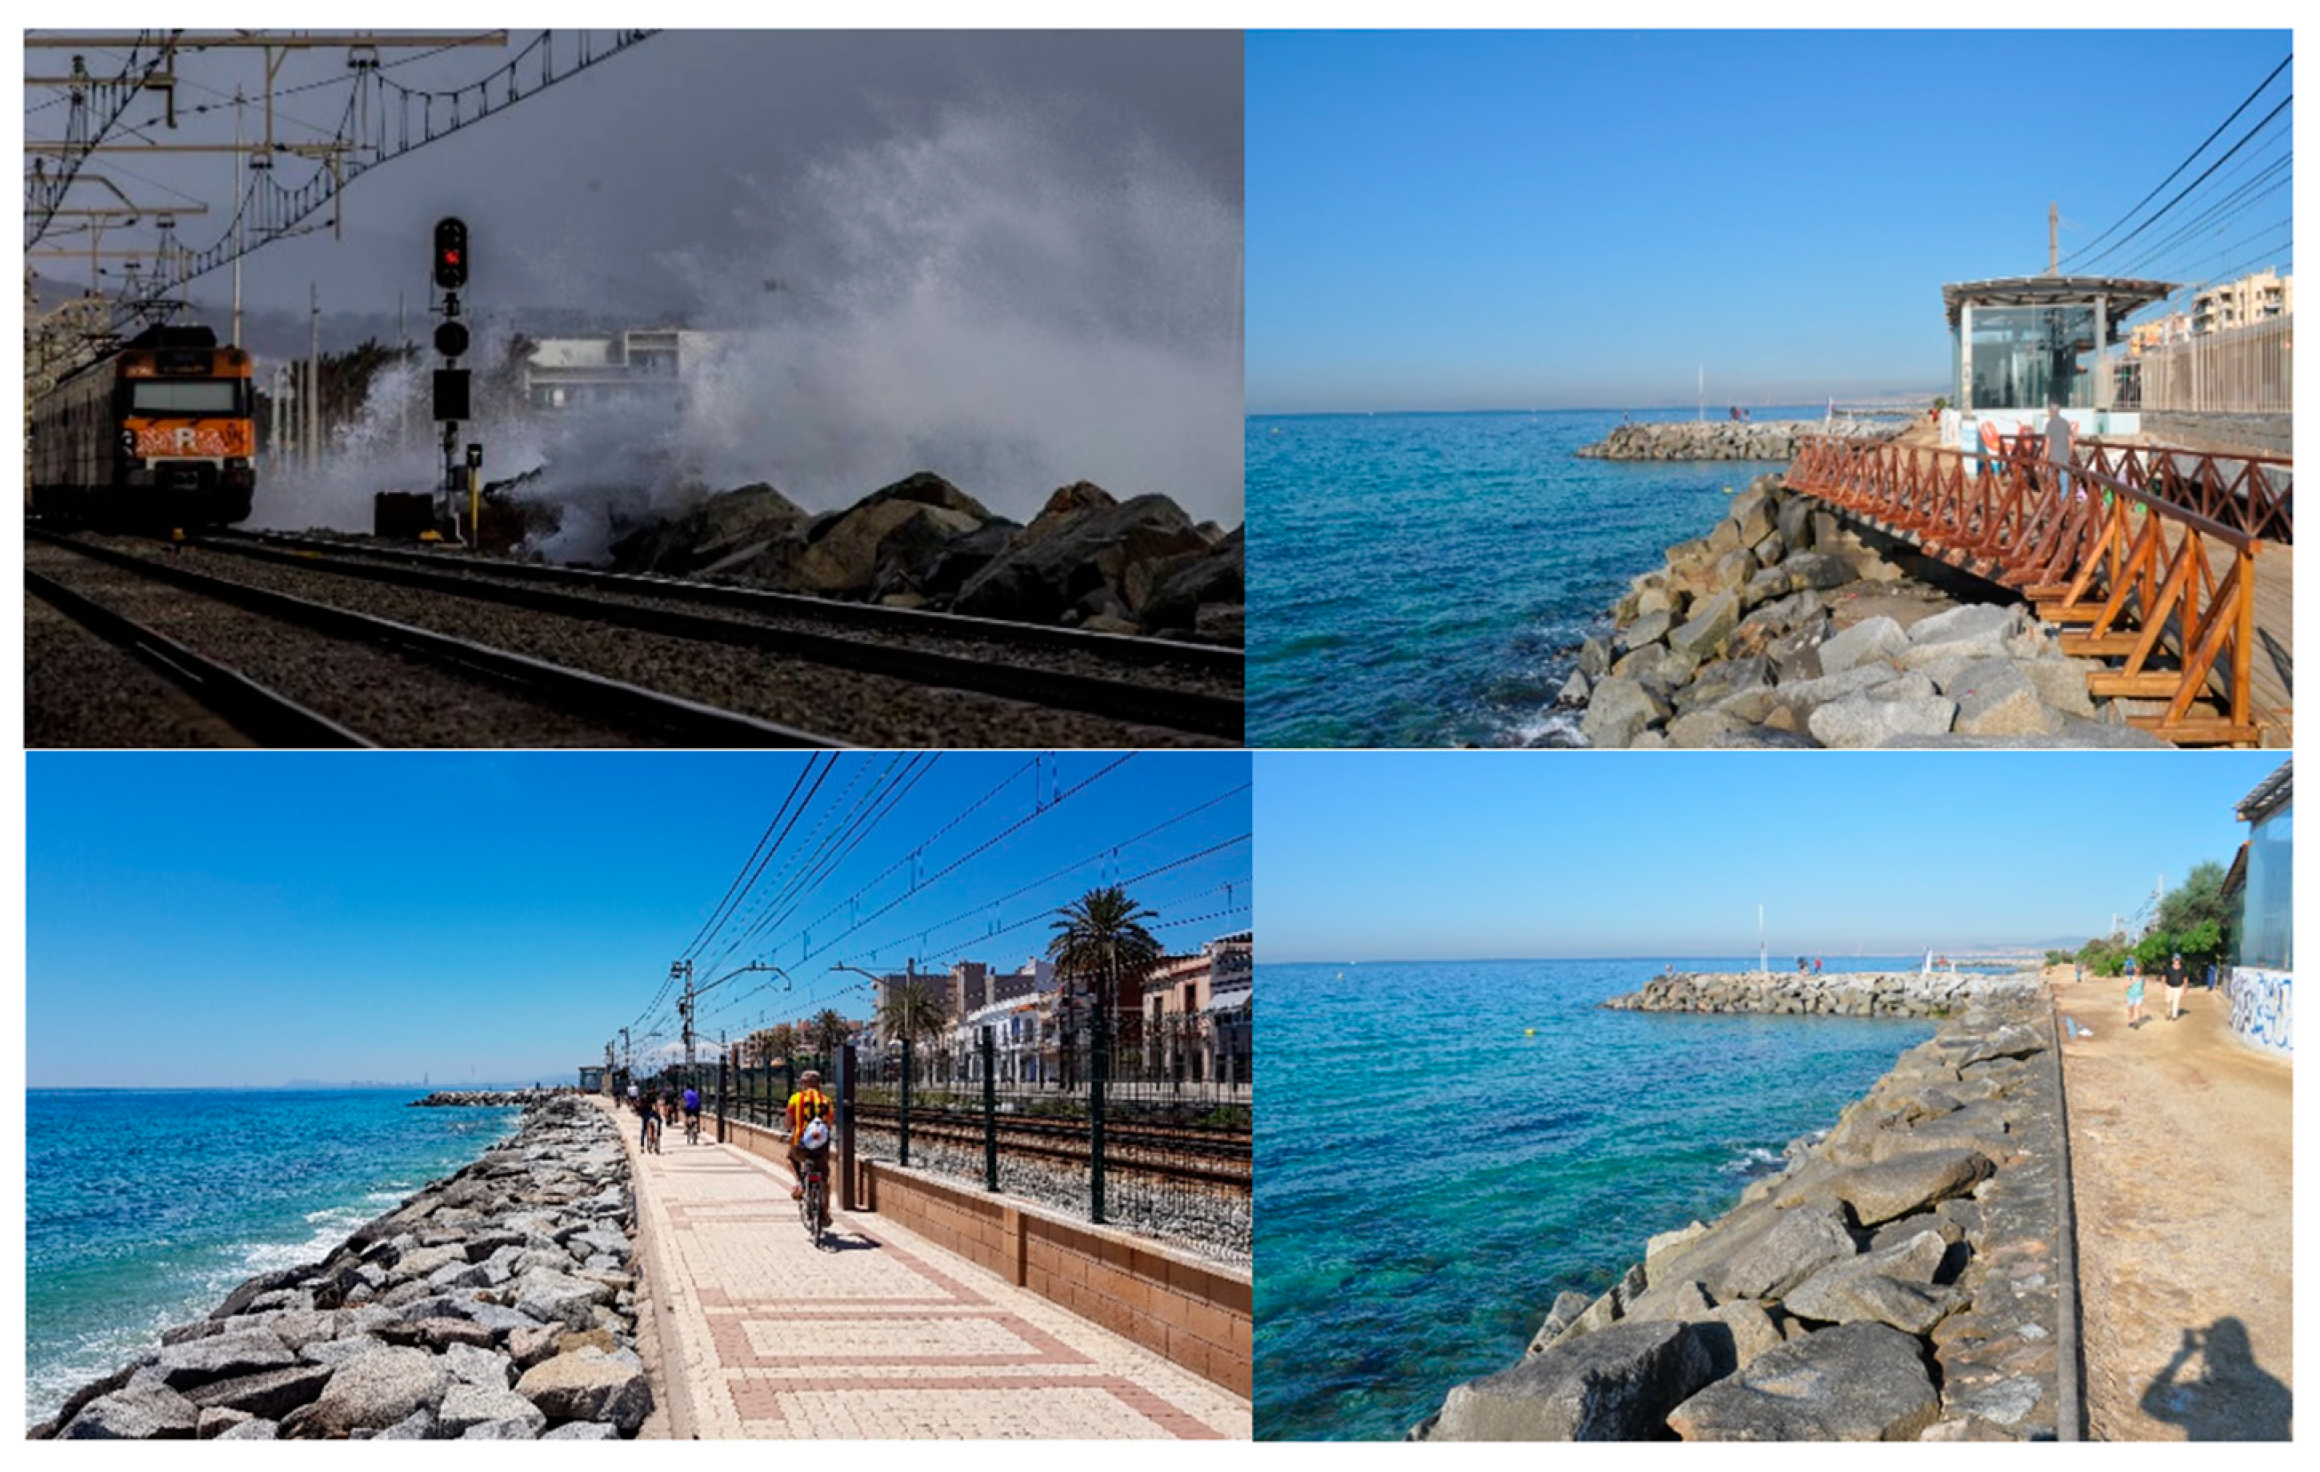
In particular, the area near to the railway station was studied. This area has a long history of flooding. This stretch of the coast, in fact, contains a railway and a bike path, and both are very exposed to possible sea storms, being located at a few meters from the shore (see
Figure 3). Besides risks related to the safeguarding of human life, the analysis of the overtopping rates for this structure is motivated by the occurrence of violent wave climate events that have been recorded in the last decade. These events have consequent damages to infrastructures located just behind the dike and service interruption of the public transport for a line that is strategic for the zone, connecting it directly to the metropolitan area of Barcelona. Additionally, Premià de Mar can be considered as representative of many other domains of the Mediterranean Sea located in urbanized areas.
The repetition of overtopping episodes shows the inability of the coastal defense to contain the transmitted energy within acceptable limits and therefore the urge to assess the safety of the existing coastal structure and eventually adapt its geometry.
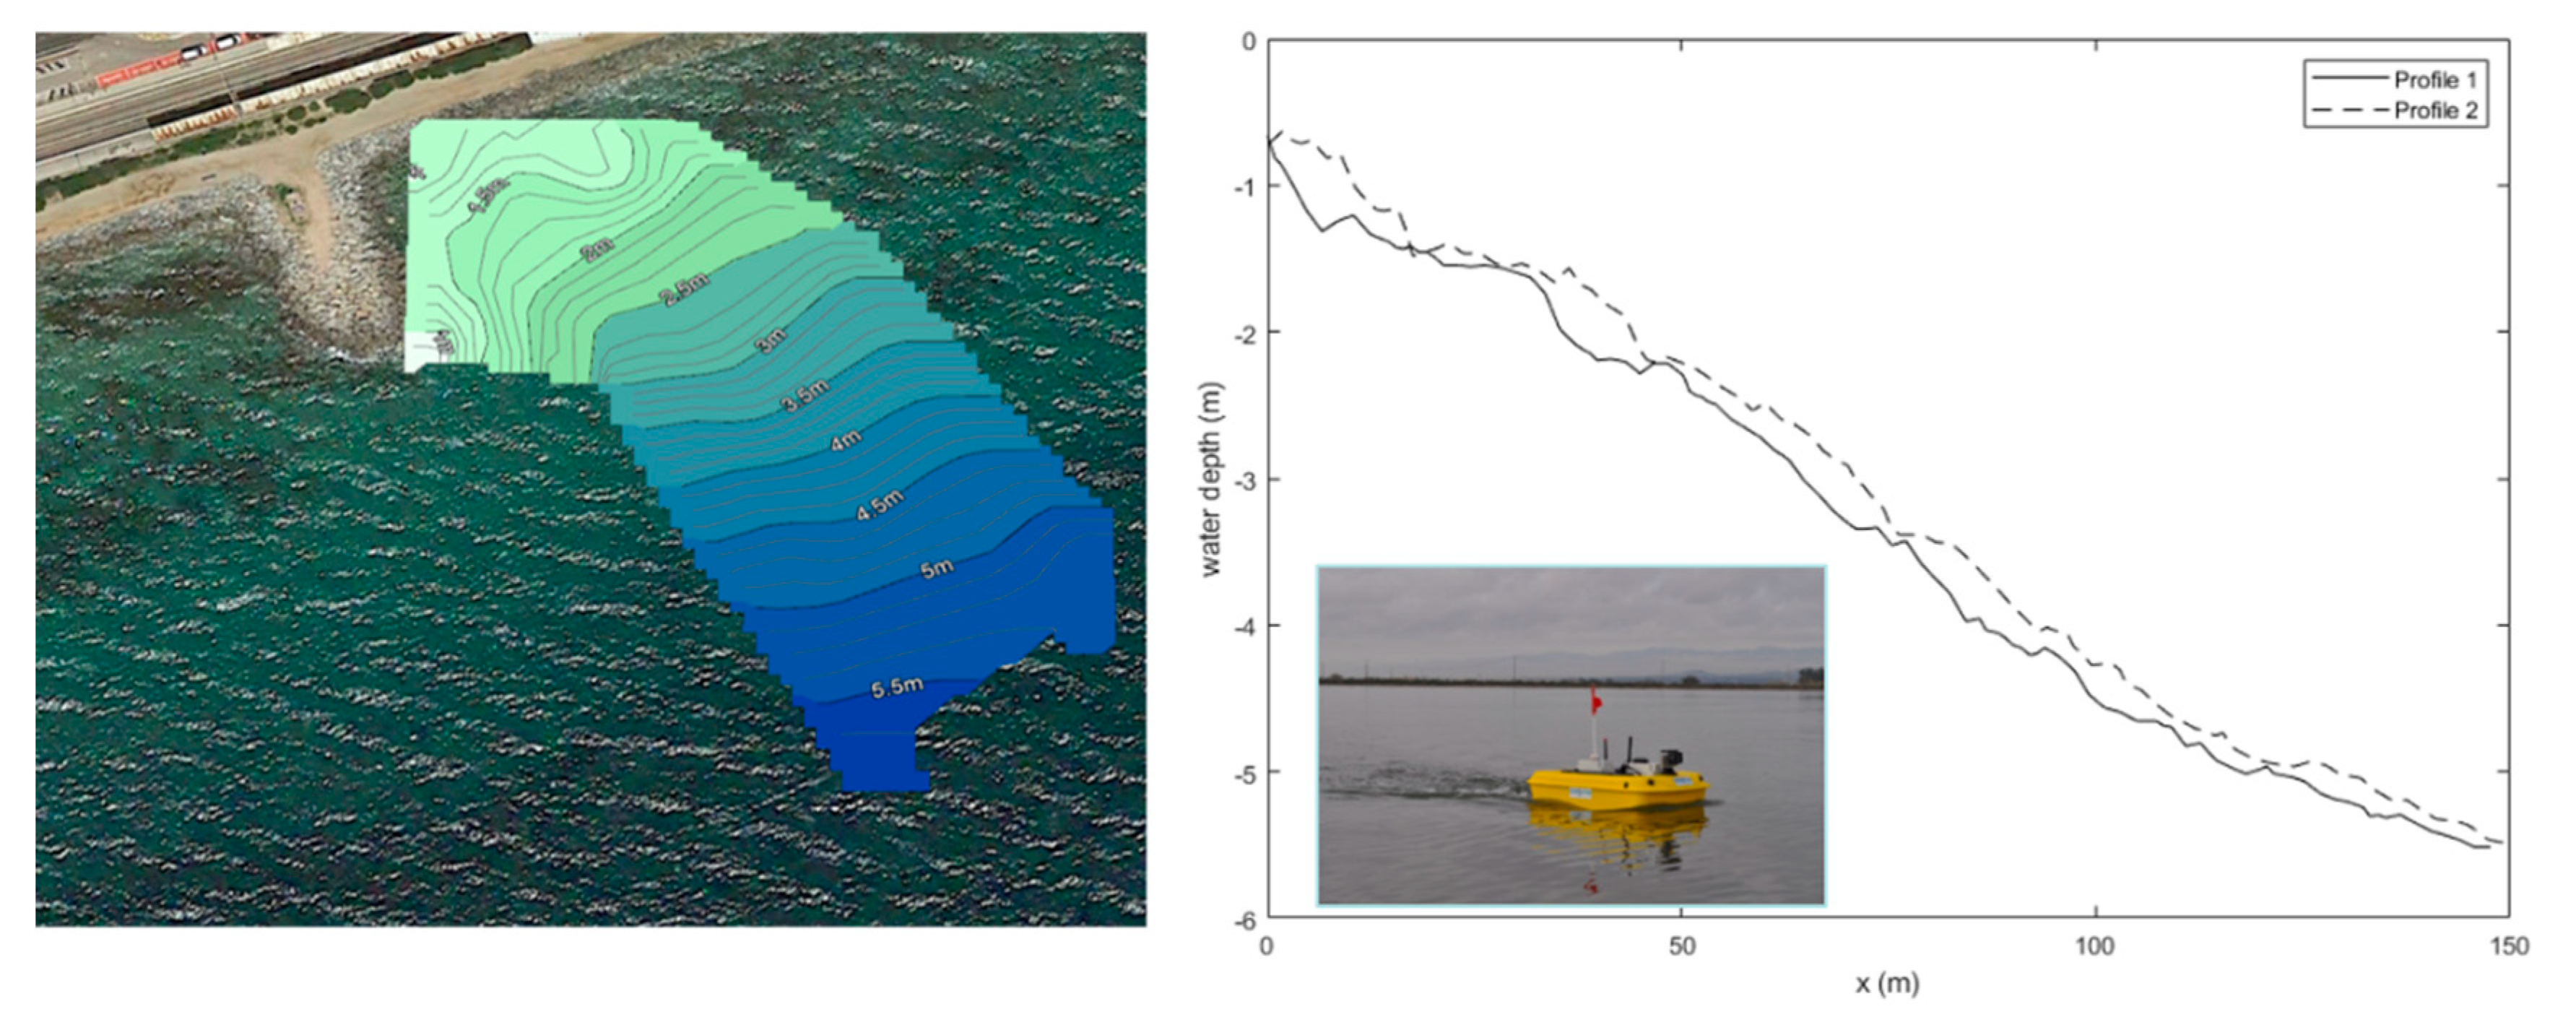
The studied area is mainly composed of low-lying beaches and narrow coarse sand emerged beaches with a relatively gentle slope. It is mainly an urbanized area where several industrial activities are present. The bathymetry data were initially extracted from the EMODnet Digital Terrain Model (DTM). Close to the coastline, these bathymetry data were integrated with more detailed data from a survey carried out by LIM/UPC technicians with a home-built sailing drone (see picture in
Figure 4). The drone was equipped with two motors, an echo sounding of 120 KHz with a working range of water depths varying from 0.15 to 13 m. The drone was controlled remotely.
The local water level employed for the drone measurements was corrected based on the information of the tie gauge installed in Barcelona harbor. Example of bathymetric profiles are depicted in
Figure 4 (right plot), where
x is the distance from the shoreline. An average slope of 1:30 was identified; however, some abrupt bathymetric changes can be noticed in the first 10–20 m, where profile 2 is steeper than profile 1. Hence, to account for local variations of the bathymetry in the studied area, two different foreshore slopes were finally used for the experimental campaign, namely 1:15 and 1:30.
4.2. Experimental Setup and Wave Conditions
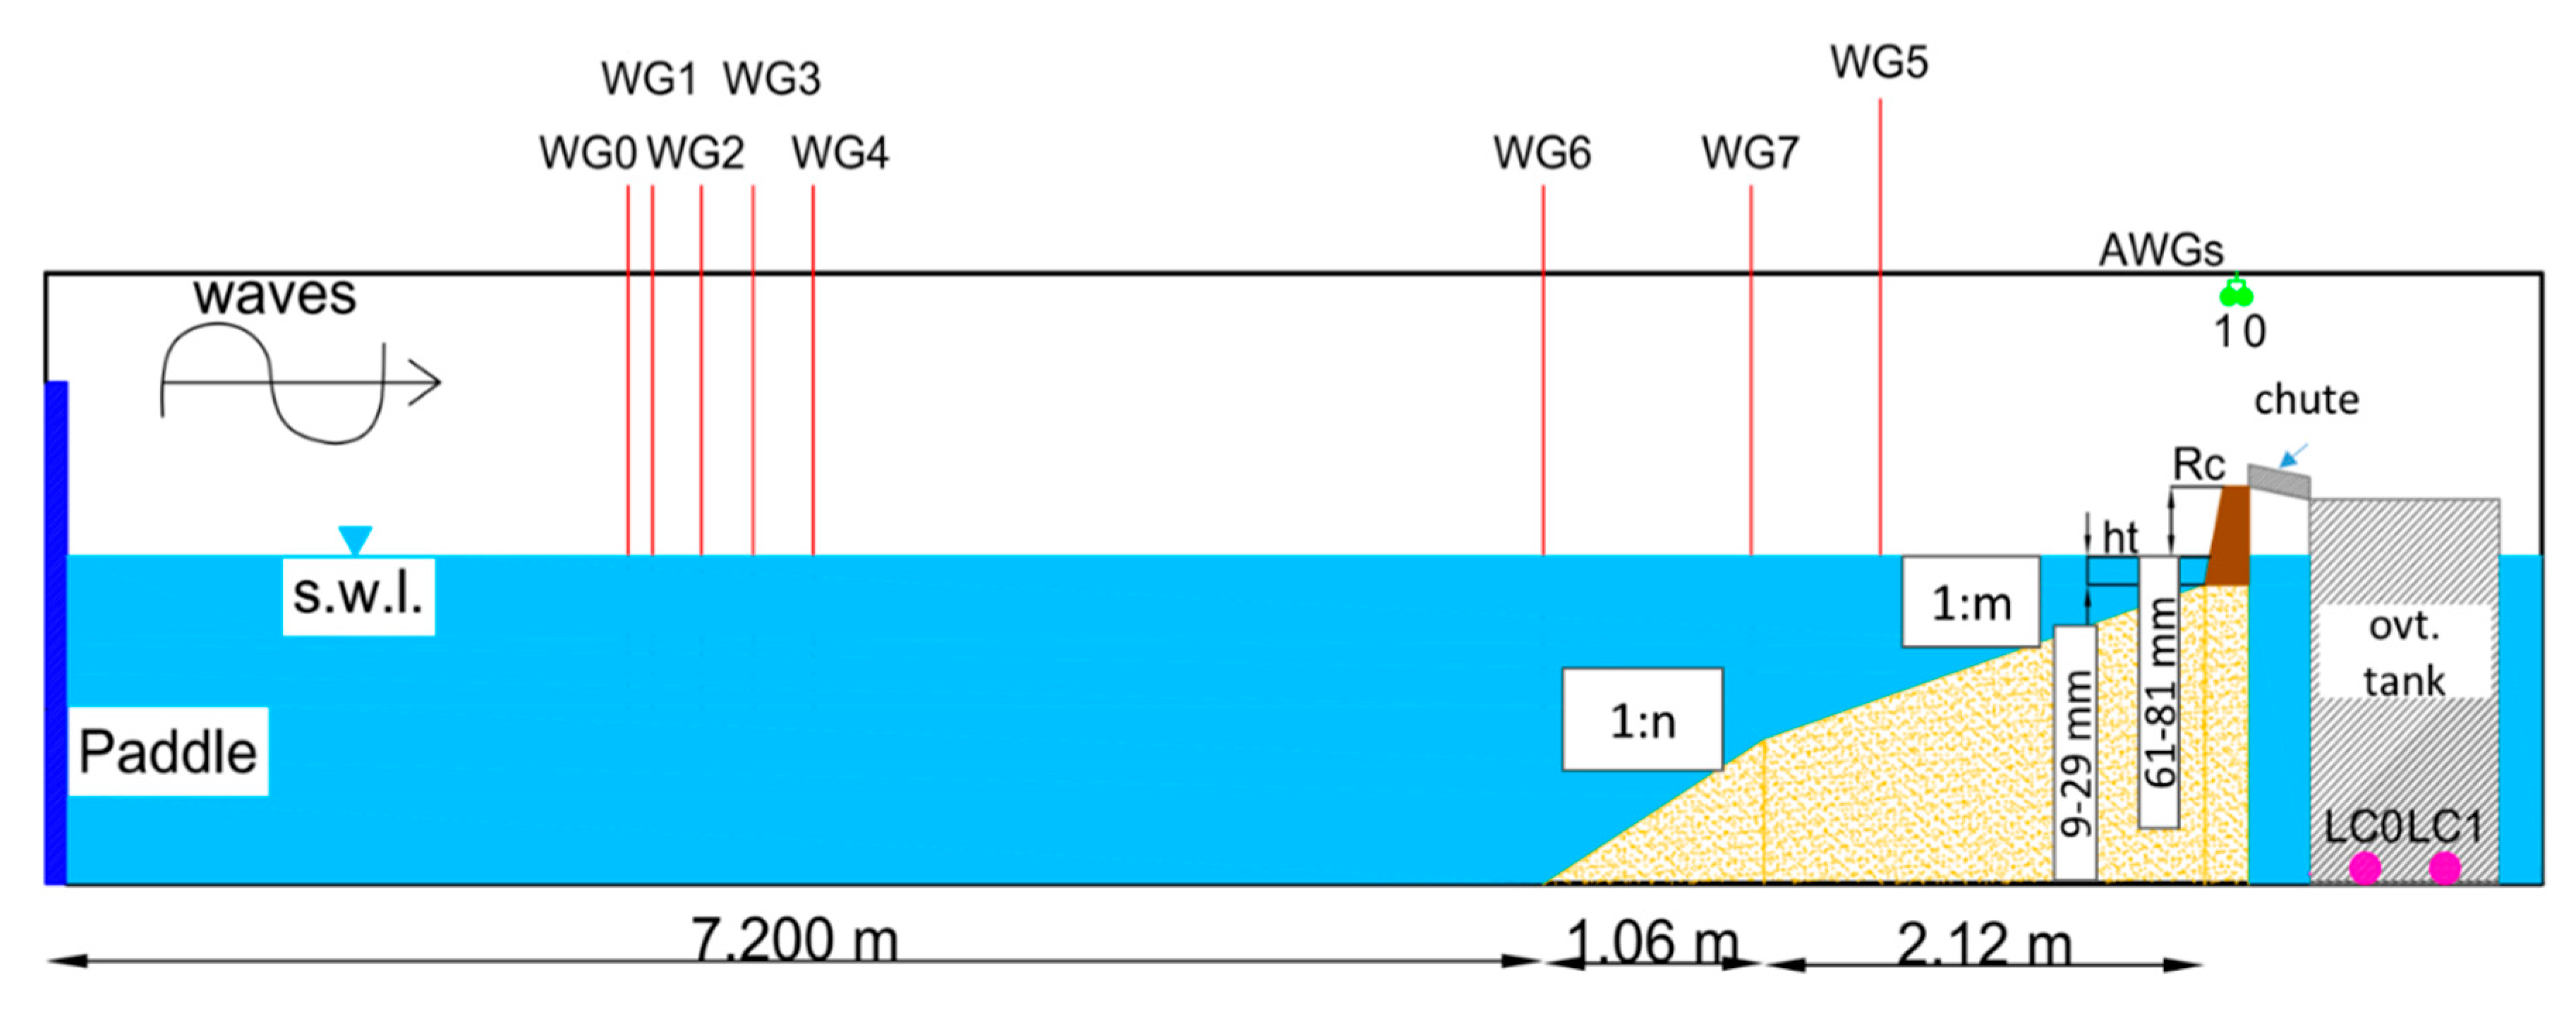
The wave flume is 18 m long, 0.38 m wide and 0.56 m high. The wave generation system is a piston-type board. The support structure consists of square metal sections, and both laterals and bottom walls are made of tempered glass which allows a complete view of the tests and clear video camera recording.
The model (scale is 1:50) was built and operated according to Froude’s similarity law. A sketch of the layout is proposed in
Figure 5, where all dimensions are in model scale. The model consists of a 1:n transition slope followed by a 1:m foreshore slope, where n is equal to 8 for m = 15 and 5 for m = 30, respectively. A 1:1 smooth dike made of polymethyl methacrylate is located at the end of the foreshore. The dike height is 0.09 m. Different widths for the promenade (i.e., crest berm) were modelled, namely 0.12 and 0.24 m, to be representative of the different stretches along the coastline. The freeboard varies between 0.061 and 0.081 m, with toe depths of 0.009–0.029 m (
Table 2).
Irregular wave tests, employing a JONSWAP spectrum with enhancement factor equal to 3.3, were performed. Each test consisted of approximately 1,000 waves. In total, 420 tests were conducted. We consider 243 tests for the present analysis, having excluded those ones with no or inaccurate overtopping flow property measurements. The tested wave conditions were derived from the extreme wave forecast based on data acquired by the buoy of the Puertos del Estado, located outside Barcelona harbour, for return periods of 1, 2, 5 and >10 years. Deep-water wave height ranges between 2.58 and 4.78 m, with peak periods between 7.96 and 13.16 s. These values correspond to those propagated from offshore to a water depth between 14.5 and 15 m, being the up-scaled water depth values at the wave generation location. These conditions correspond to very shallow and extremely shallow water conditions, based on the definition in [
22],
htoe/Hm0,deep being between 0.1 and 0.38, where
htoe is the water depth at the dike toe and
Hm0,deep is the deep-water wave height.
The experimental tests carried out aimed to measure the following parameters: free surface water elevation along the wave flume, η (m); cumulated overtopping volume, Vtot (L/m); mean overtopping discharge, q (L/s/m), obtained as Vtot/Tmm-1,0,deep*Nw,deep, where Tmm-1,0,deep is the spectral wave period close to the wave generation (offshore) and Nw,deep is the number of waves offshore; maximum overtopping volume, Vmax (L/m); flow depth associated to the maximum overtopping volume, d (m); and horizontal velocity associated to the maximum overtopping volume, u (m/s).
4.3. Measurement Setup
Eight resistive sensors were placed along the flume to measure the water surface elevation at different location (WG0-WG8), working at a sample frequency of 80 Hz. The distance of the resistive wave gauges with respect to the mean paddle position is reported in
Table 3.
Overtopping flow depth and overtopping flow velocity were measured by means of redundant systems, composed of two high-speed cameras and two ultrasonic sensors. The results were compared and averaged. Two ultrasonic sensors were place on the dike top to measure flow depths (AWG0, AWG1), with resolution <0.3 mm. AWG 1 is positioned 2.5 cm away from the dike edge for the crest width of 0.12 m and 6 cm for the crest width of 0.24 m. Distance between AGW1 and AWG0 varied between 5.9 cm and 9.2 cm. The position of the two ultrasonic sensors and the vertical distance from the crest were optimized case per case to avoid interference between the sensors and optimize accuracy. The AWG raw signal was acquired with a sampling rate of 100 Hz and filtered in Matlab environment in order to derive overtopping flow depth and velocity on the dike. The velocity was calculated with the indirect methodology:
where the delta values are, respectively, the temporal distance between the two maximum points
and the distance between the two starting points of the event
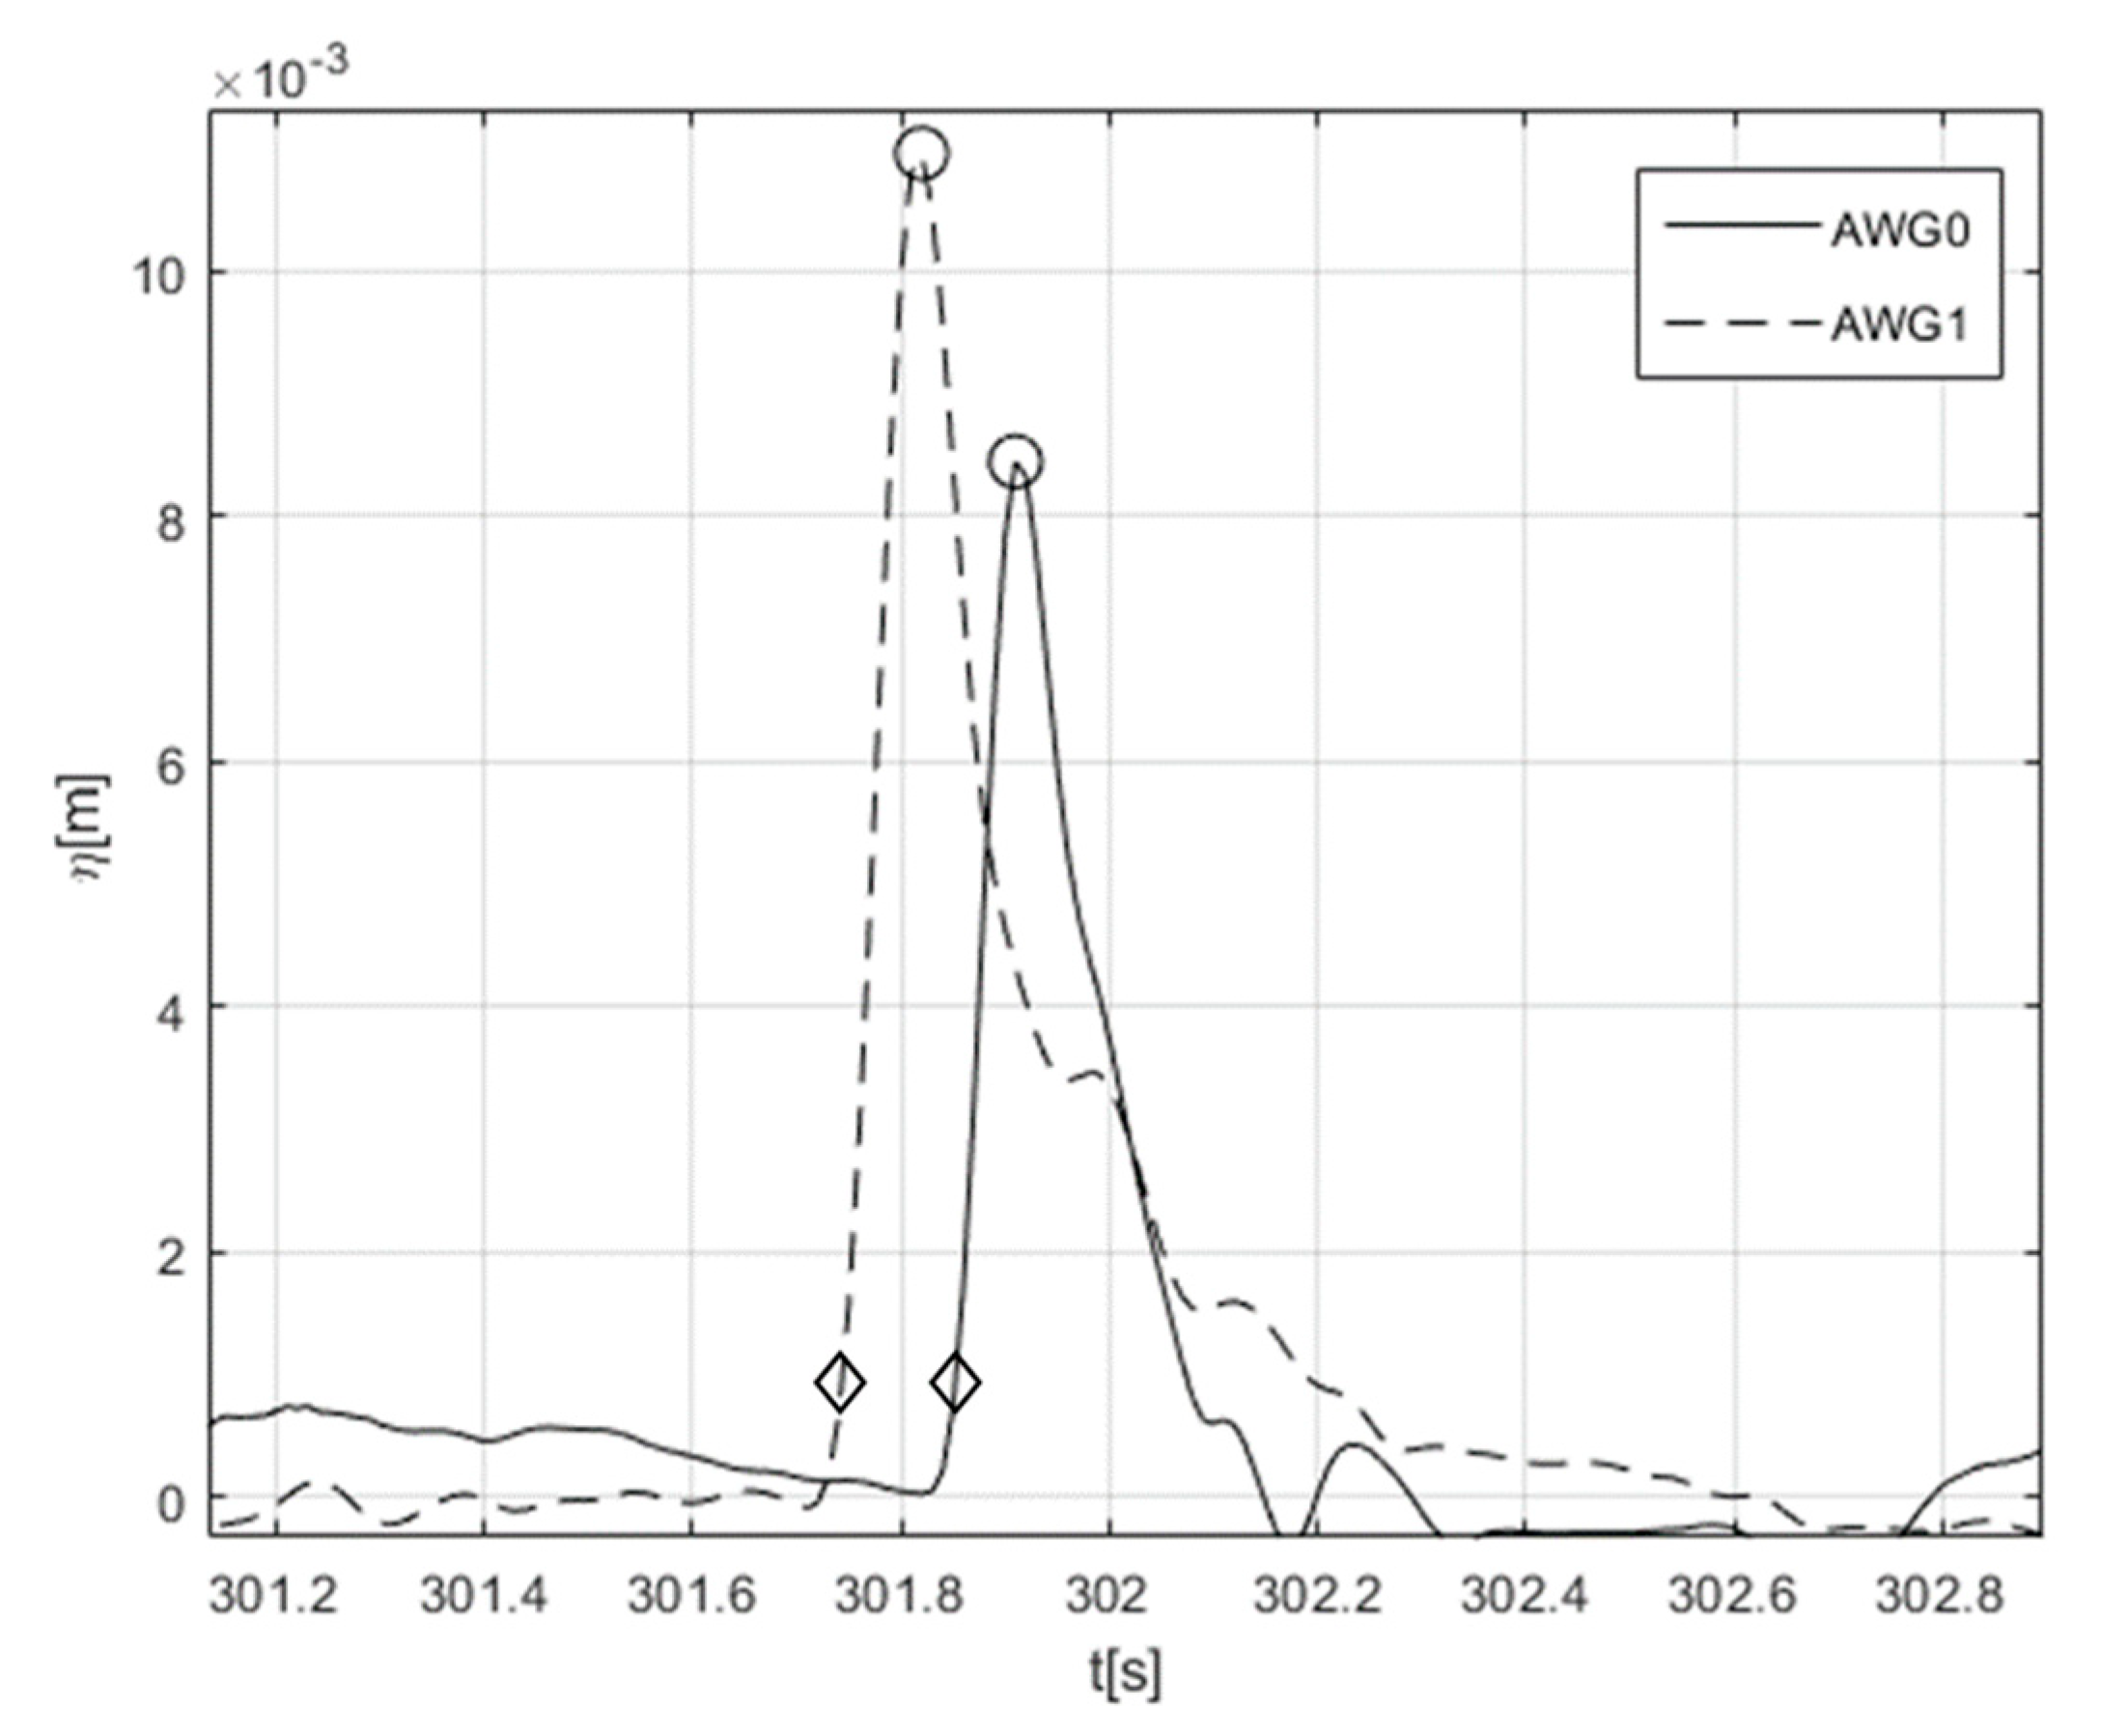
. The latter ones correspond to a threshold value of 1mm, which identifies the tip of the overtopping wave. An example of the time series of flow depth for a maximum overtopping event is depicted in
Figure 6, where the solid line is the acquisition of the sensor at the end of the promenade (AWG0) and the dashed line is the registration of the sensor at the beginning of the promenade (AWG1). The maximum of each signal is marked with a circle. Threshold values are marked with diamond markers. Here, a clarification is required. The overtopping volumes are measured after the dike promenade. Hence, flow depth and velocity associated to maximum event refers to the same location. For flow depth, the signal of AWG0 is used, being the closest sensor to the end of the promenade. However, as described previously, velocity is measured indirectly, and the calculation employs both ultrasonic sensors. The distance between AWG1 and AWG0 is comparable to the promenade width, and therefore the calculated velocity cannot be considered as the instantaneous velocity at the promenade end. Therefore, the layer velocity associated to the maximum volume and corresponding to the maximum flow depth,
dAWG0, has been calculated resolving the following system, considering momentum conservation:
where
uAWGtmax is the average velocity as previously described,
dAWG0 and
dAWG1 are the maximum flow depth values at AWG0 and AWG1 location, respectively, and
uAWG0 and
uAWG1 are the instantaneous velocities associated to
dAWG0 and
dAWG1, respectively. For all analyses reported in the next sections, we will refer to
dAWG0 and
dAWG1 as maximum flow depth
d and overtopping flow velocity
u, respectively, for sake of simplicity.
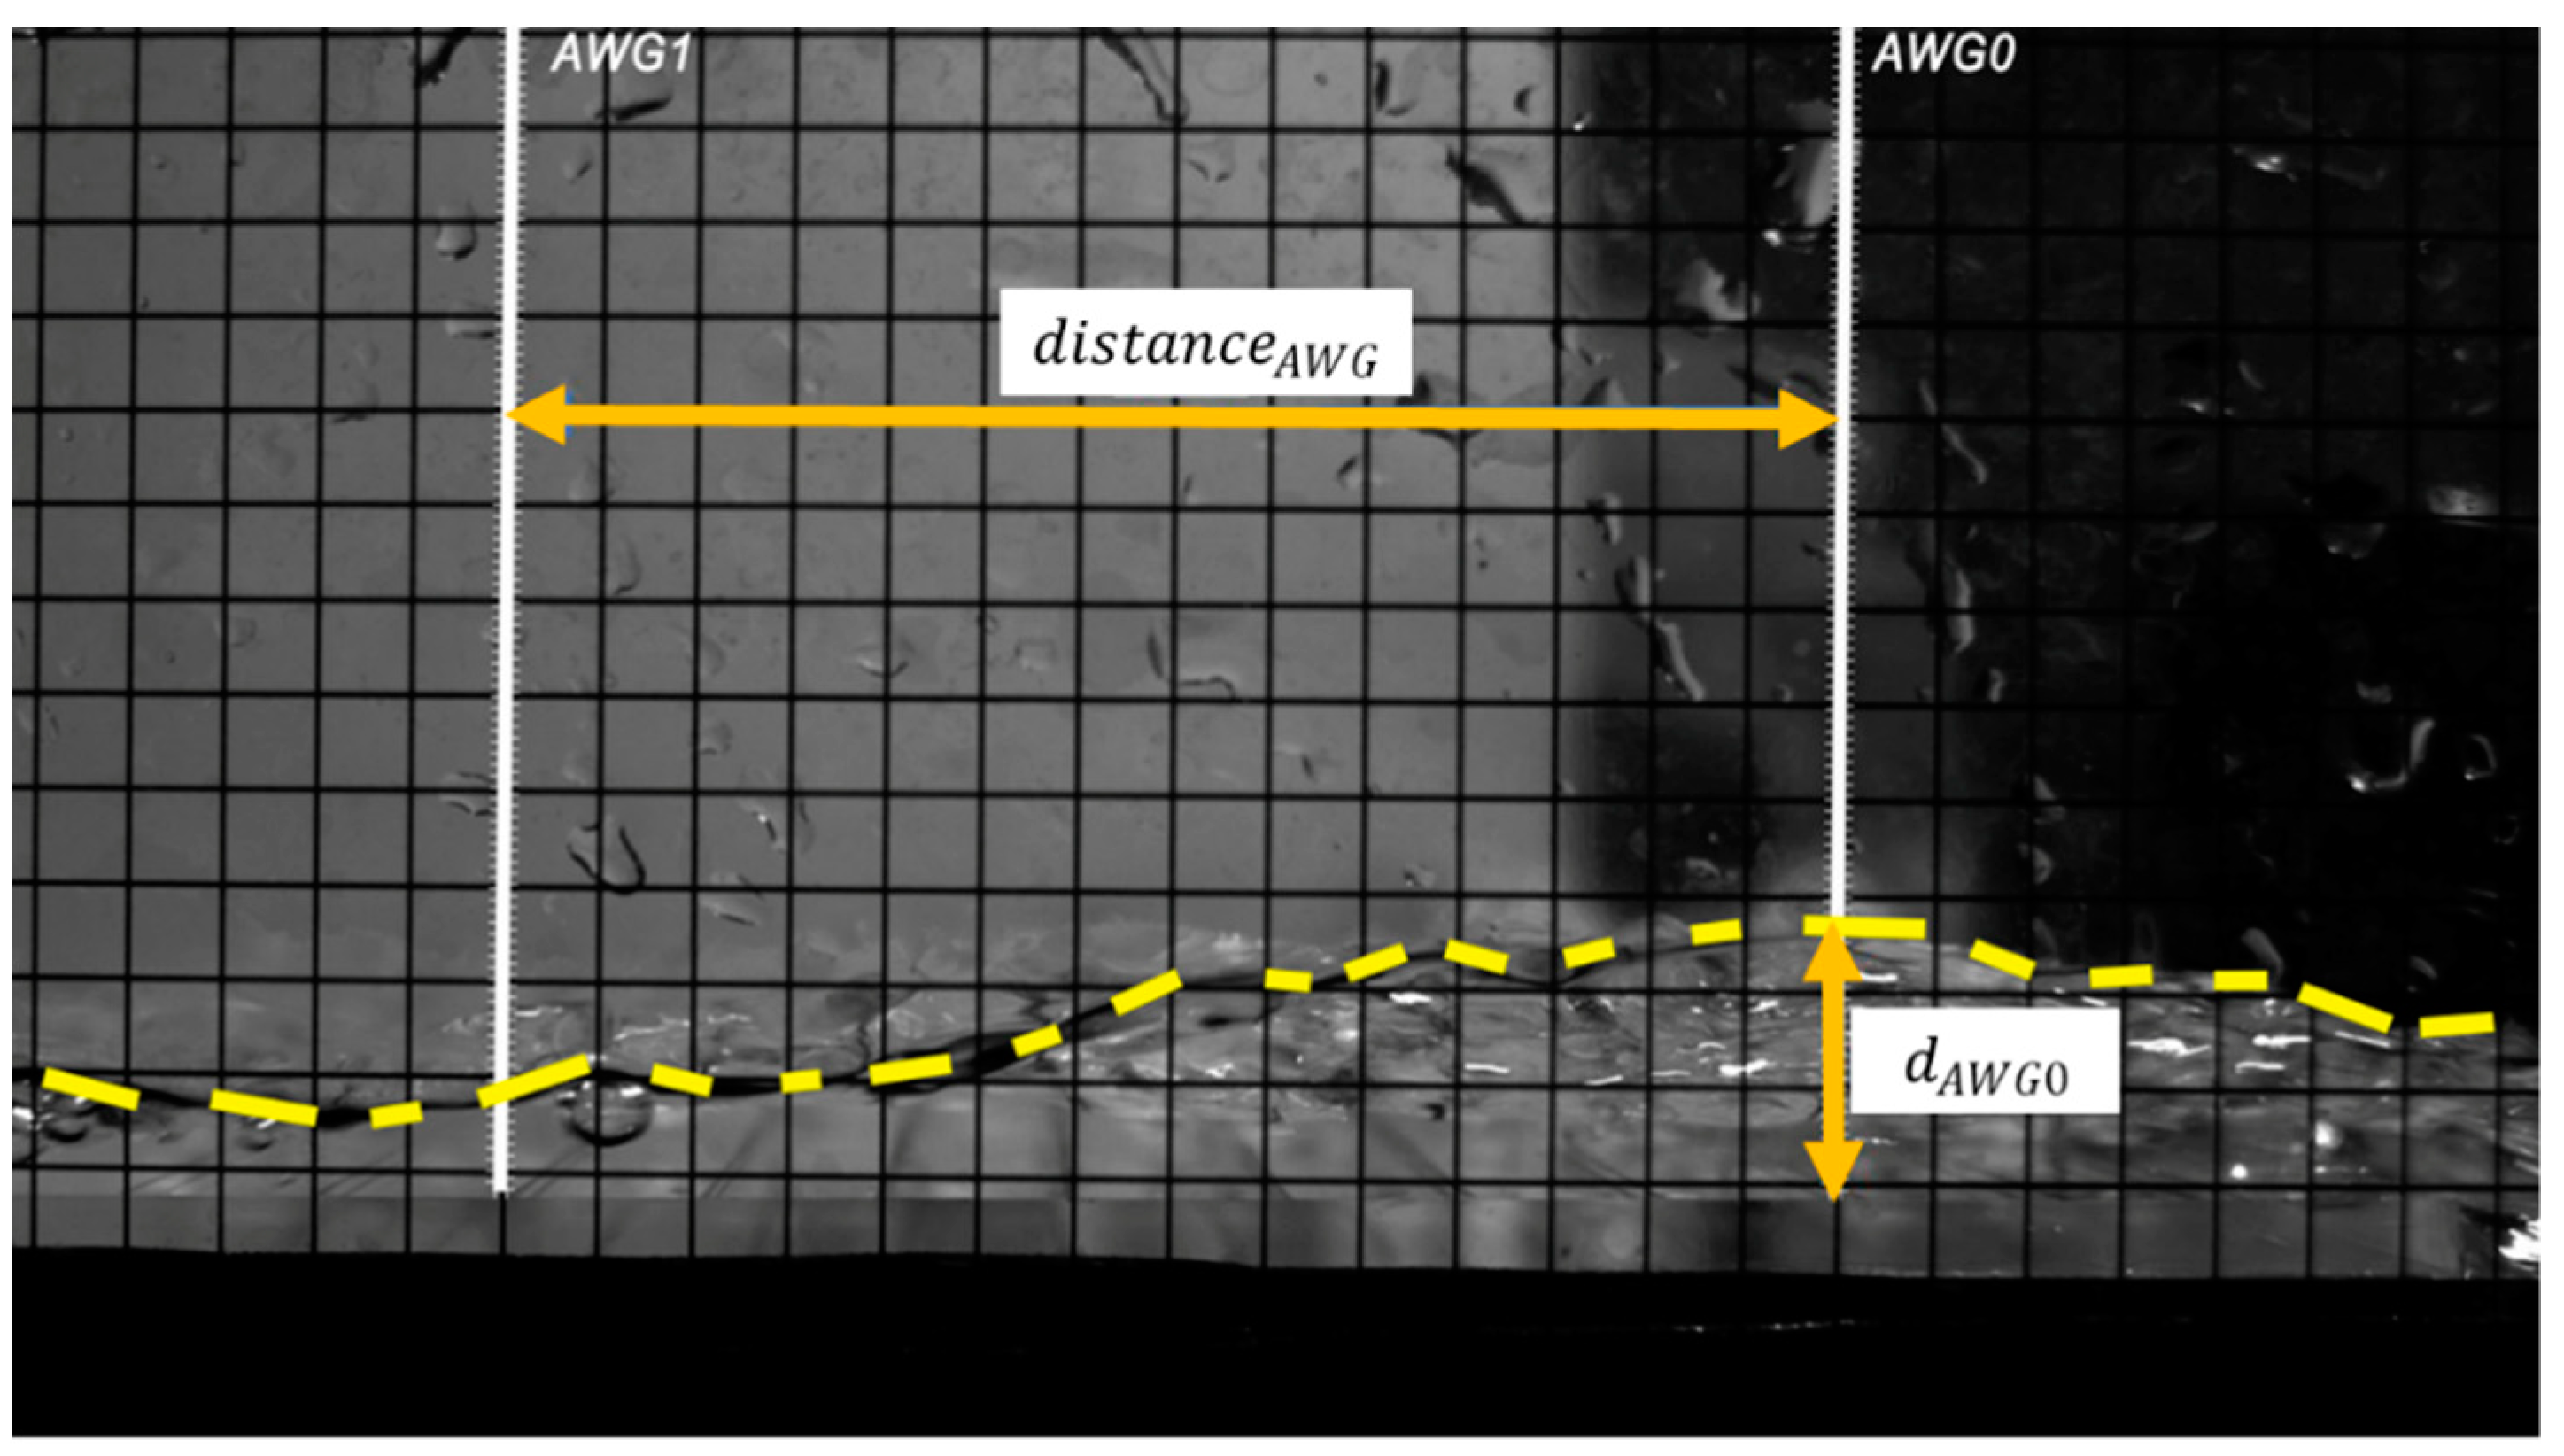
The high-speed cameras were working at 200 fps. They were placed in order to provide the top and lateral view of the overtopping flows on the dike crest. Camera 1 was placed on the top of the structure. The dike promenade was graduated with equally spaced lines (1 cm). Camera 2 was placed in front of the lateral glass wall, on the side of the sea-dike model, where a transparent paper graduated with 0.5 cm squares was placed. From camera 1, only layer velocity could be measured as
s/Δ
t, where
s corresponds to the distance measured on the reference 1cm frame equal to the distance between the two ultrasonic sensors; Δ
t is the time needed for the tip of the overtopping flow to run such a distance. From camera 2, flow velocity and depth were measured: the lateral view allowed us to identify both the tip of the overtopping wave and the height of the overtopping layer (
Figure 7). The results were compared with the ultrasonic sensors.
The same considerations for instantaneous and average velocities were made for the cameras’ measurements.
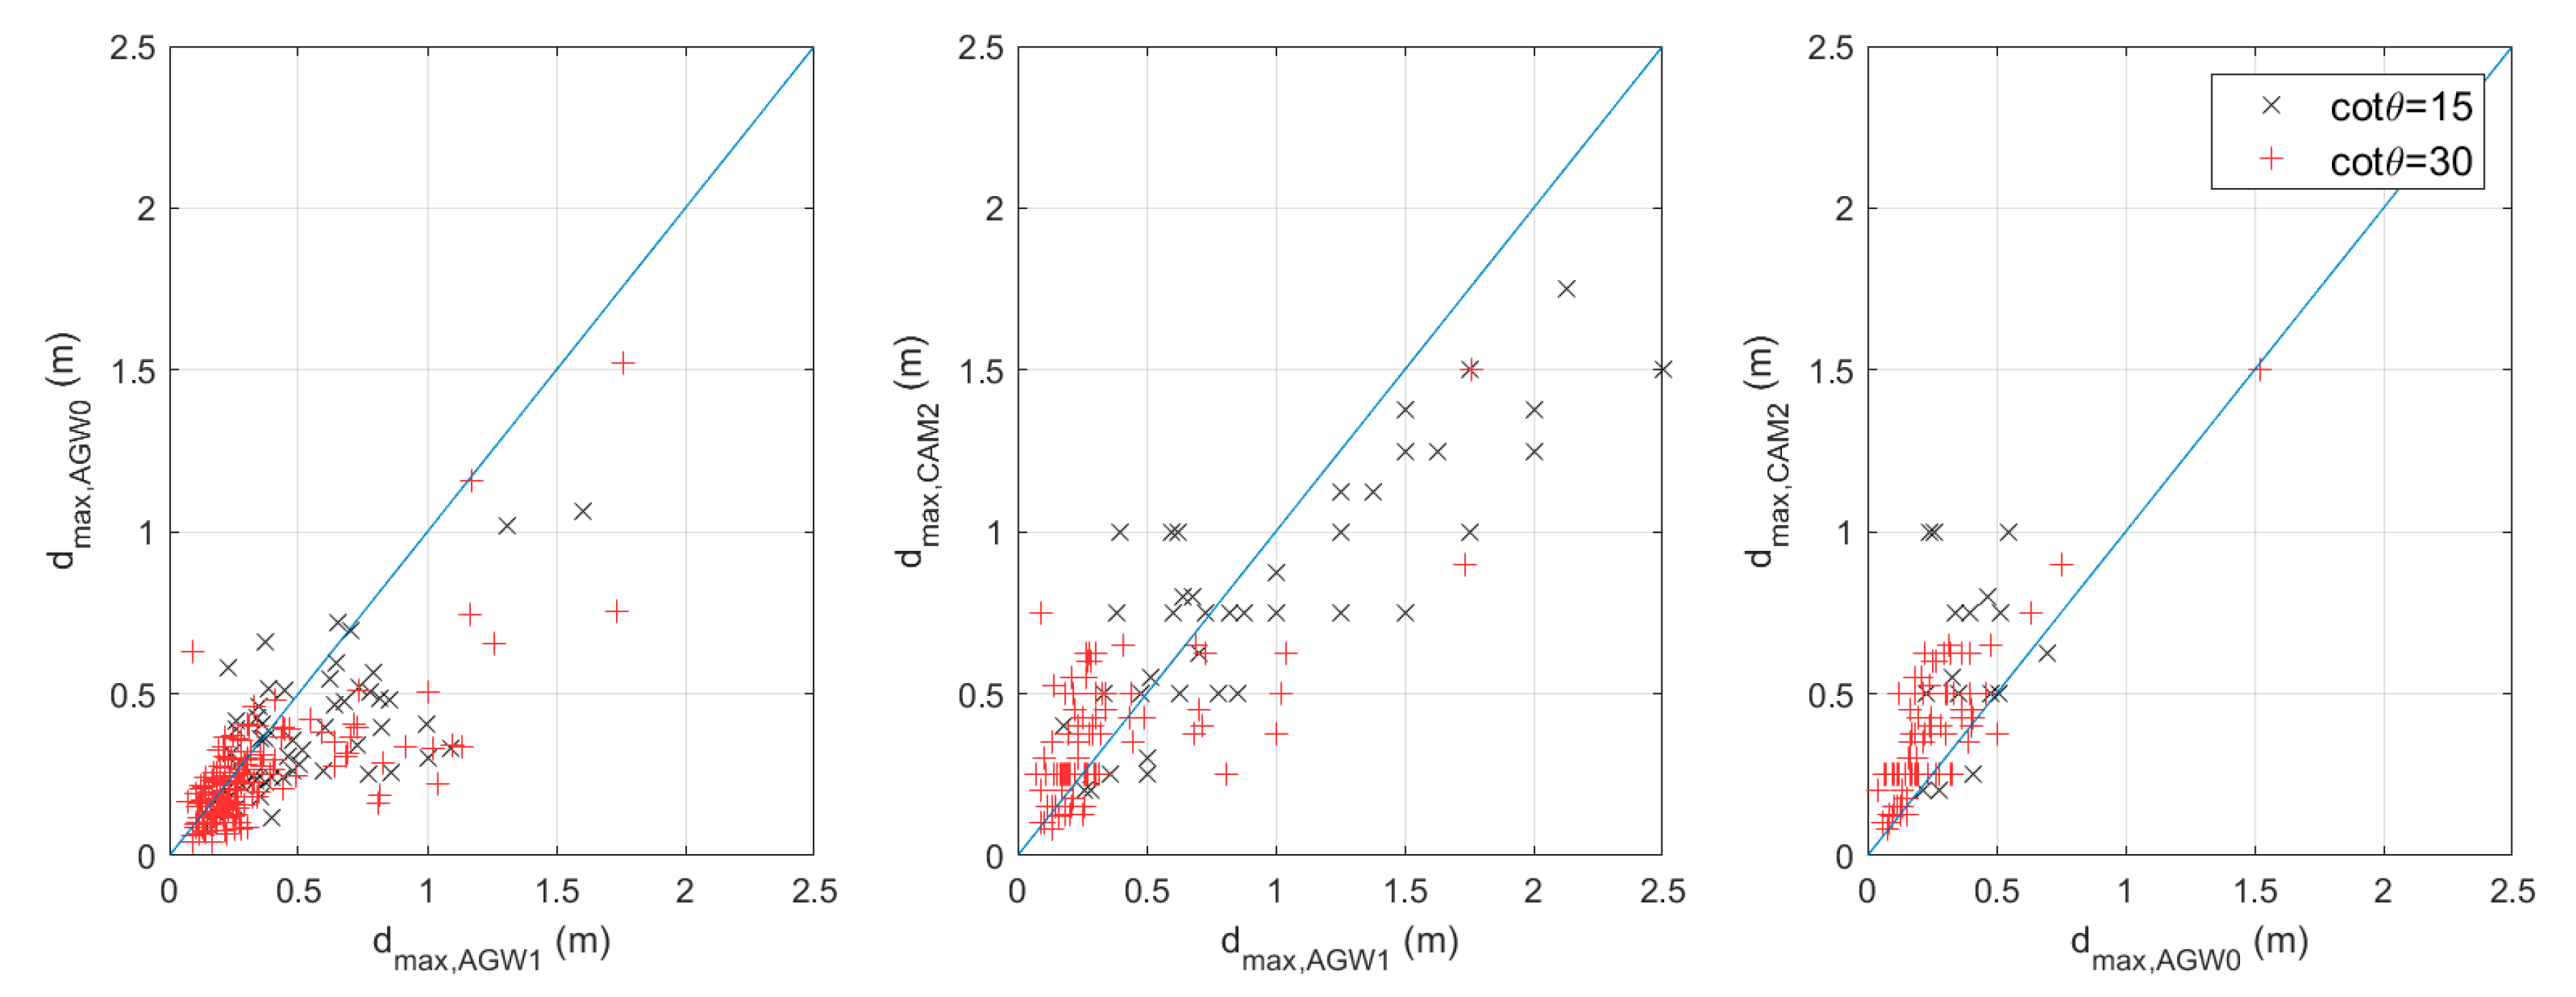
Figure 8 plots the correlation between the measurements of maximum flow depth carried out by means of ultrasonic sensors and high-speed camera (CAM2). Data were divided according to the foreshore slope. A correlation coefficient R
2 between 52% and 73% was calculated.
The individual and mean overtopping volume was collected inside an isolated metallic water box, connected to the edge of the promenade by a 9 cm-wide chute. Two load cells were installed under the overtopping tank located into the box in order to measure the cumulated water weight, with an acquisition frequency of 20 Hz. The volume was obtained by dividing weight by water density.
4.4. Wave Analysis
Classical linear reflection analysis methods are not suitable in shallow water conditions because non-linear effects are dominant [
4], since the generation of low-frequency waves is dominant and affects the value of the mean wave period
Tm-1,0. This wave period is shown to be important for many wave-structure interaction processes, and can be used to assess the response of coastal structures with shallow foreshores [
15,
20]. Hence, the dike was removed, and horizontal bottom followed by absorption material was placed, instead, to measure incident wave conditions at the dike toe, which are required for the analysis. Sensor WG5 was moved to the dike toe location and used for the scope.
A limitation in the experiments is the use of first-order wave generation and the lack of active absorption of long-wave energy. For spurious long waves in the flume, the lack of second-order wave generation is found to be negligible due to the relatively large water depth at the wave generator and low steepness [
29]. The natural frequency of the current flume set-up is around 0.045–0.05 Hz for different test conditions and foreshore slopes, which are found to be outside of the frequency range of the infragravity waves in the flume. Moreover, there is no increasing trend of the observed long-wave energy at the toe of the dike. A passive absorption system was found to be sufficient to reduce the wave reflection, except for the seiching motion. The energy at the seiching frequency band was removed in the analysis of the wave parameters. Despite the energy associated to seiching modes being between 7% and 20% of the total energy at the dike toe, it was decided to neglect it for further analysis. Seiches might have a significant influence on the mean discharge values; however, for individual events, it is very unlikely that the maximum overtopping event occurs when the crest of the seiche is at the dike toe, thus maximizing individual discharge.
An example of typical wave spectrum at the dike toe is depicted in
Figure 9, showing an important shift of the wave energy from the JONSWAP typical spectral shape to low frequencies, generated by the heavy wave breaking and consequent release of long waves.
4.5. Scale Effects
The employed model scale is relatively small and can cause concerns on the possible scale effects that might affect wave overtopping. Heller [
30] provided an overview of limited criteria for flow-structure interaction phenomena and showed typical applied scales for the investigation, which are a good compromise between a reasonable model size and moderate scale effects. However, based on this classification, scale effects are not necessarily negligible and need further investigation. Therefore, the influence of viscous forces and surface tension has been analysed, in accordance with what was reported in [
6]. The Reynolds and Weber numbers for wave overtopping (R
eq and W
eq) were calculated. The results were compared versus the proposed critical limits, namely R
eq > 10
3 and W
eq > 10. In total, 25 cases showed a R
eq < 10
3 and W
eq < 10. Further analysis was carried out to quantify scale effects on those cases following two different methodologies: (1) a correction for the model scale, based on [
6] was calculated; (2) an artificial neural network (ANN) proposed by [
31] was employed, and the predicted overtopping discharges were compared with the measured ones. Both methodologies prove that scale effects can be neglected. The correction calculated with [
6] method ranged between 1 and 2.5. ANN predictions show values in the same order or just smaller than experimental ones. Further details are here omitted for the sake of simplicity.
5. Results
5.1. Relationship between Mean Discharge, Individual Volumes and Overtopping Flow Parameters
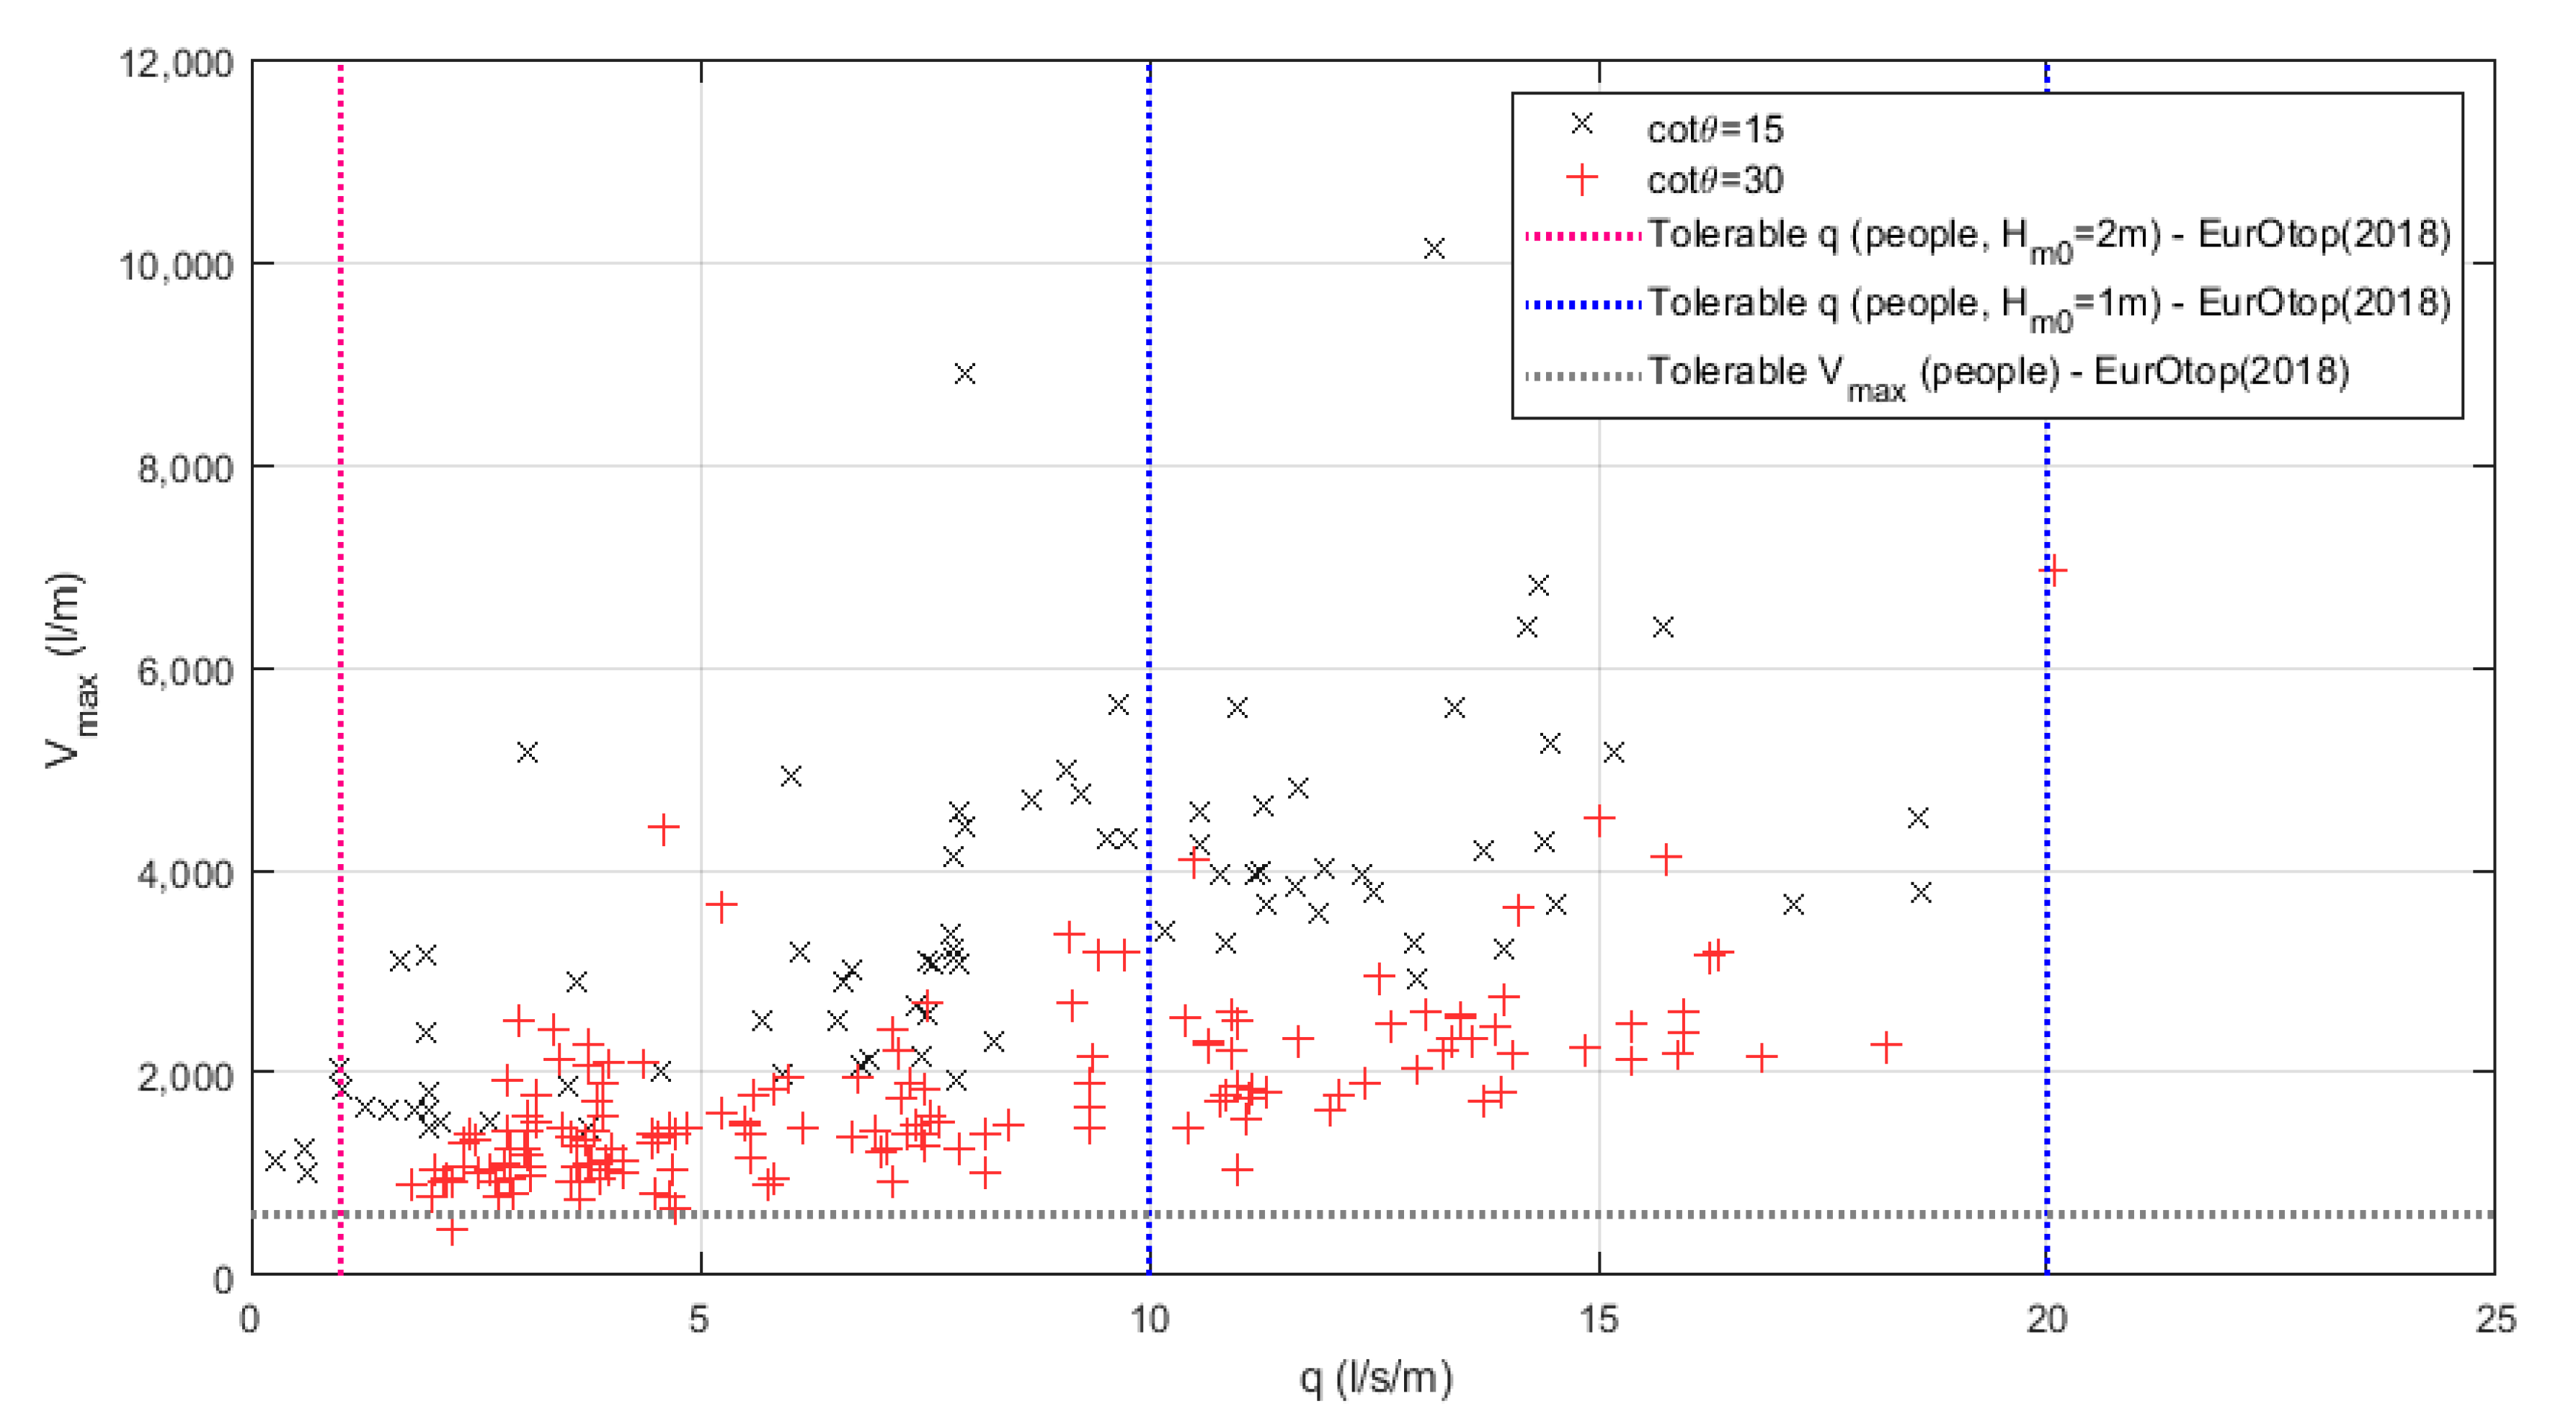
Figure 10 shows the relationship between mean overtopping discharge and maximum individual overtopping volume. Data are divided according to the slope of the foreshore. For the same mean discharge, the maximum individual volume is smaller for the 1:30 foreshore slope than for 1:15 foreshore slope: heavy breaking caused by gentle foreshore and shallow water conditions provoke more energy dissipation and reduce the chance of very big individual overtopping events. The steeper slope is characterized by less but more intense overtopping events; meanwhile, the gentle slope experiences more events, but these are smaller in magnitude. This suggests that overtopping processes on milder slopes are somewhat less violent, in agreement with analysis proposed in Chapter 3 of EurOtop [
6]. The thresholds proposed by EurOtop for people’s safety (
Table 1) are drawn in
Figure 10, both in terms of mean discharge and maximum volume. It is important to note that while tolerable discharge values vary depending on the local wave conditions at the dike toe, for maximum volume the threshold is fixed at 600 L/m with no further considerations. Almost all experimental results show volumes higher than the proposed limit; however, all values of mean discharge are within the limits of 10–20 L/s/m, a value suggested for wave height at the dike toe equal to 1m (same order of results got during the experimental campaign). This inconsistency will be discussed later.
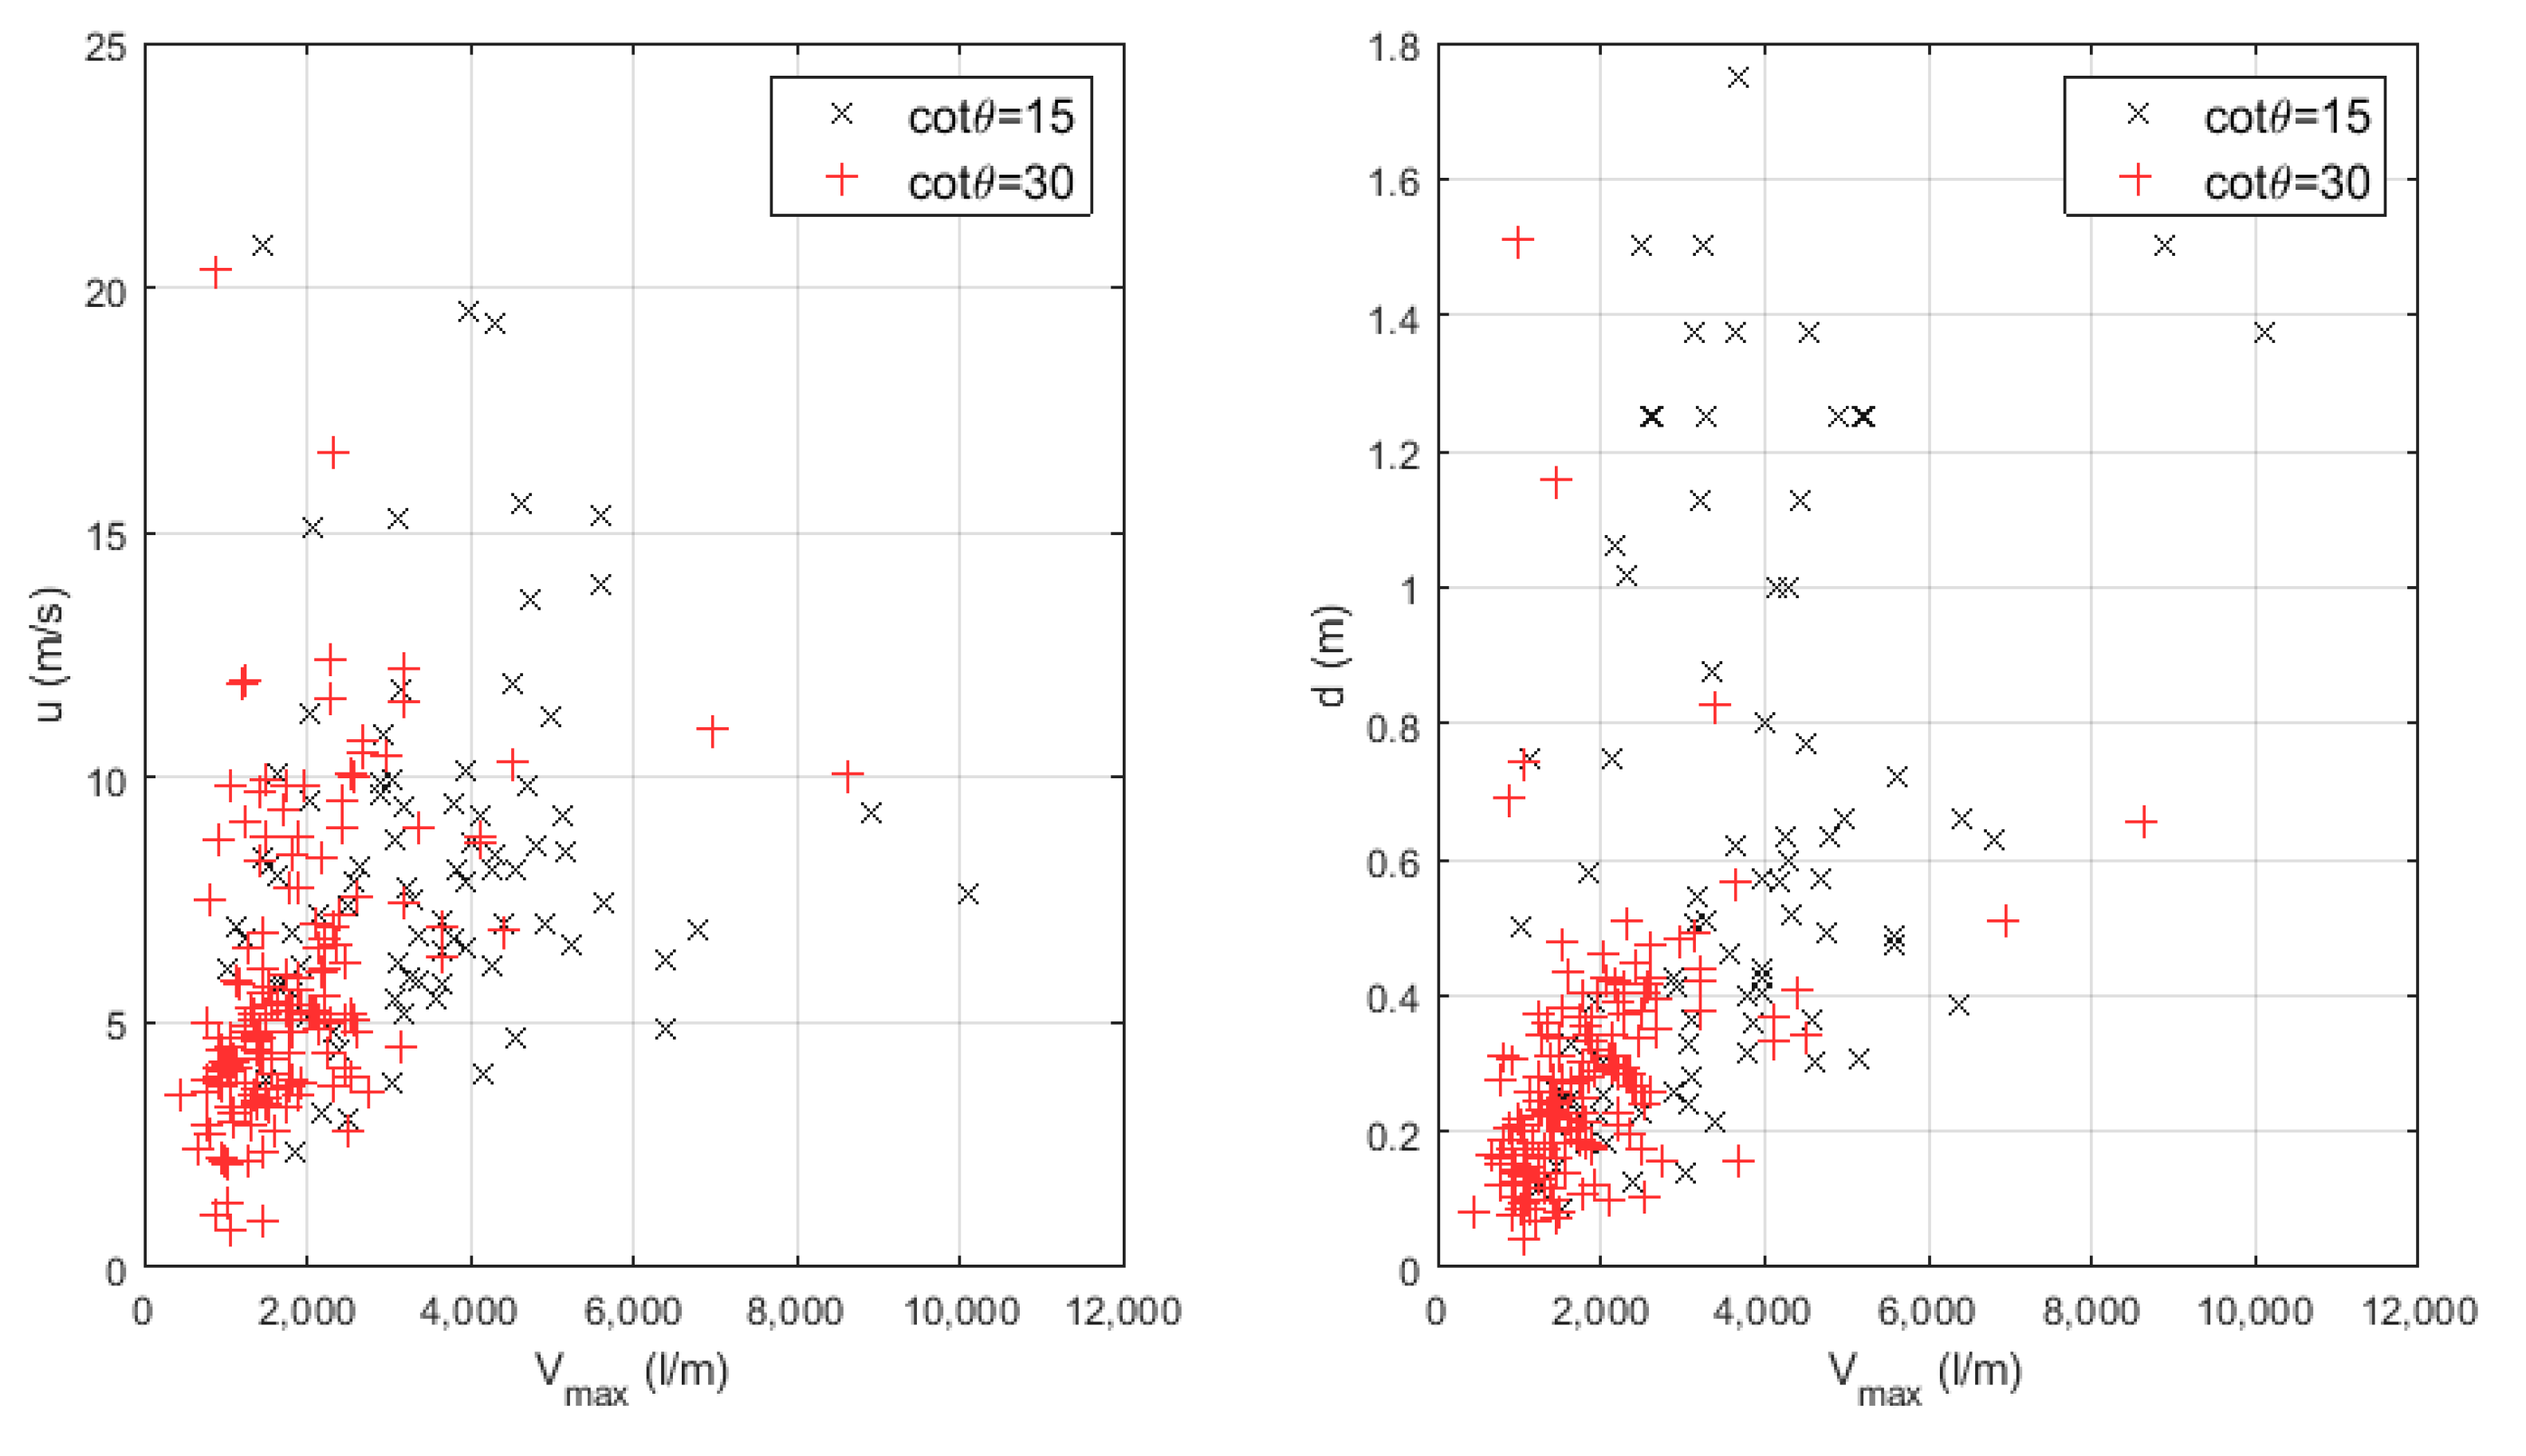
The relationship between
q and
Vmax seems pretty linear, whereas more dispersion can be noticed looking at the overtopping flow depth and velocity behavior versus individual overtopping volume (
Figure 11). This is especially true for the 1:15 foreshore slope, where more intense overtopping events are far more energetic and violent than the ones for 1:30 slopes.
It must be remarked that the measured overtopping flow velocities are not necessarily the highest velocities recorded during the overtopping process, but they are the ones associated to the overtopping event characterized by the maximum individual volume. In agreement with [
24,
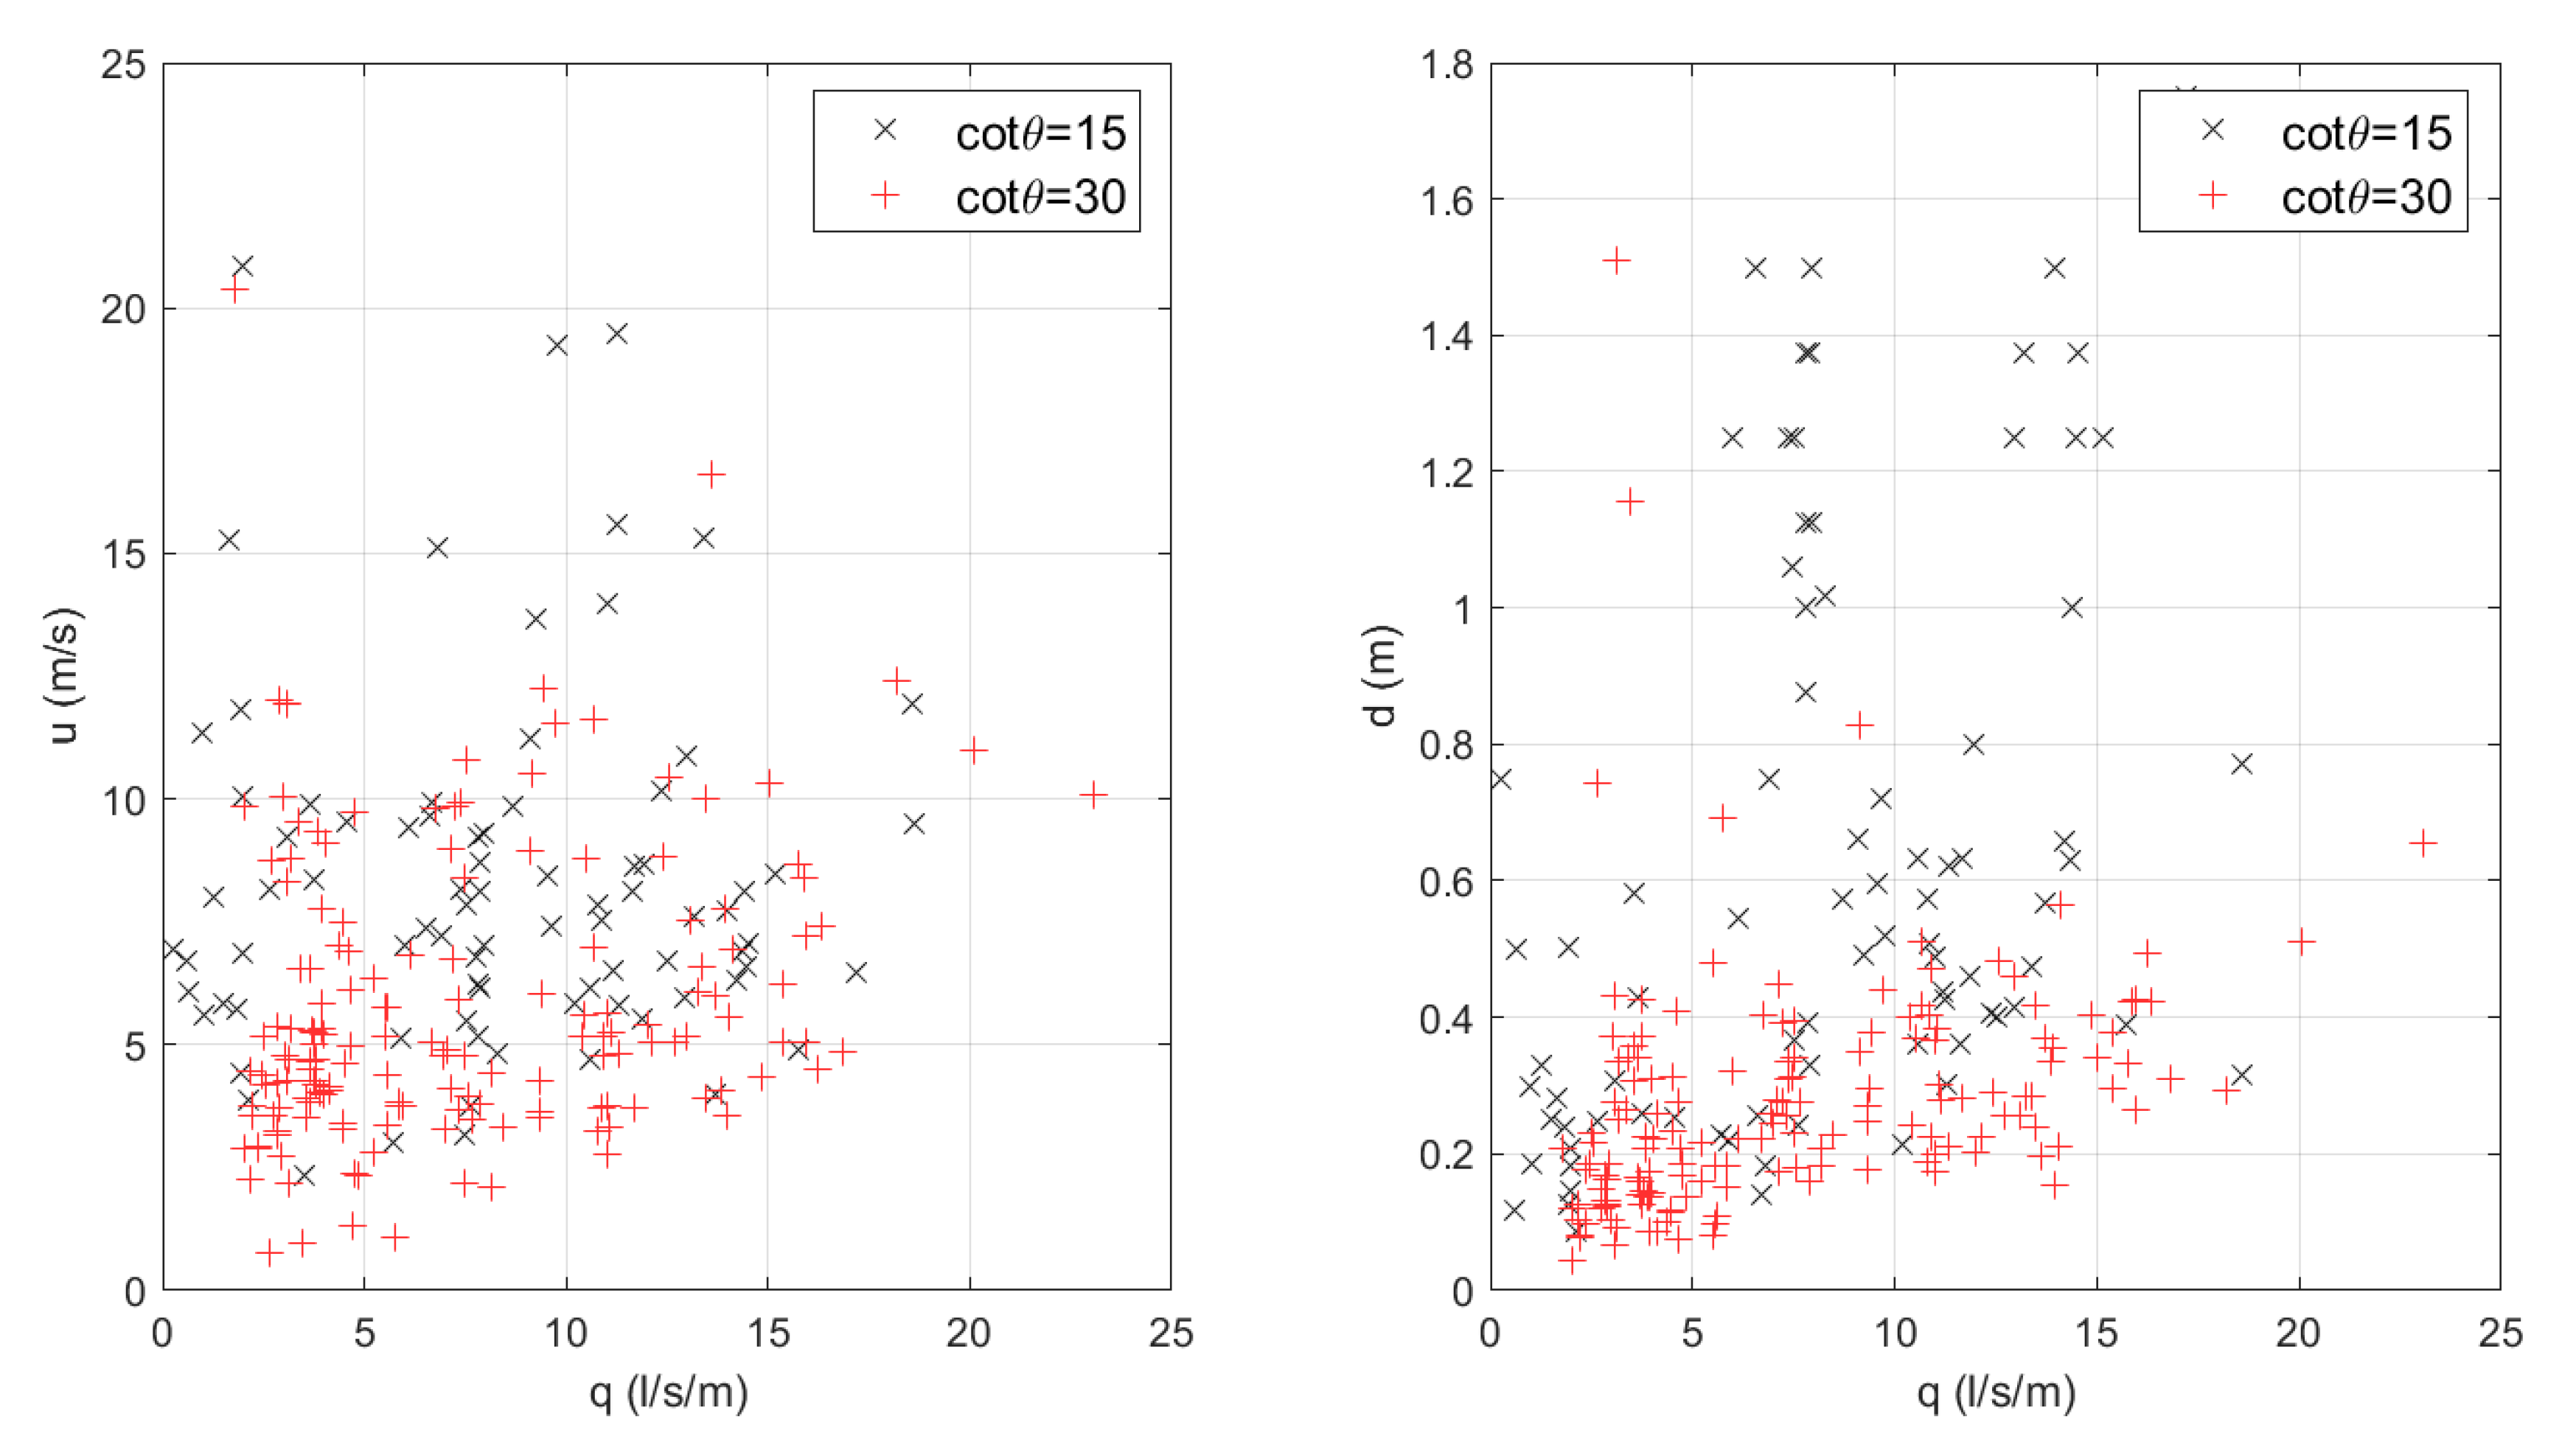
27], a correlation between overtopping flow parameters and individual maximum volumes is noticeable, differently from mean overtopping discharges (
Figure 12), where larger scatters are noticed.
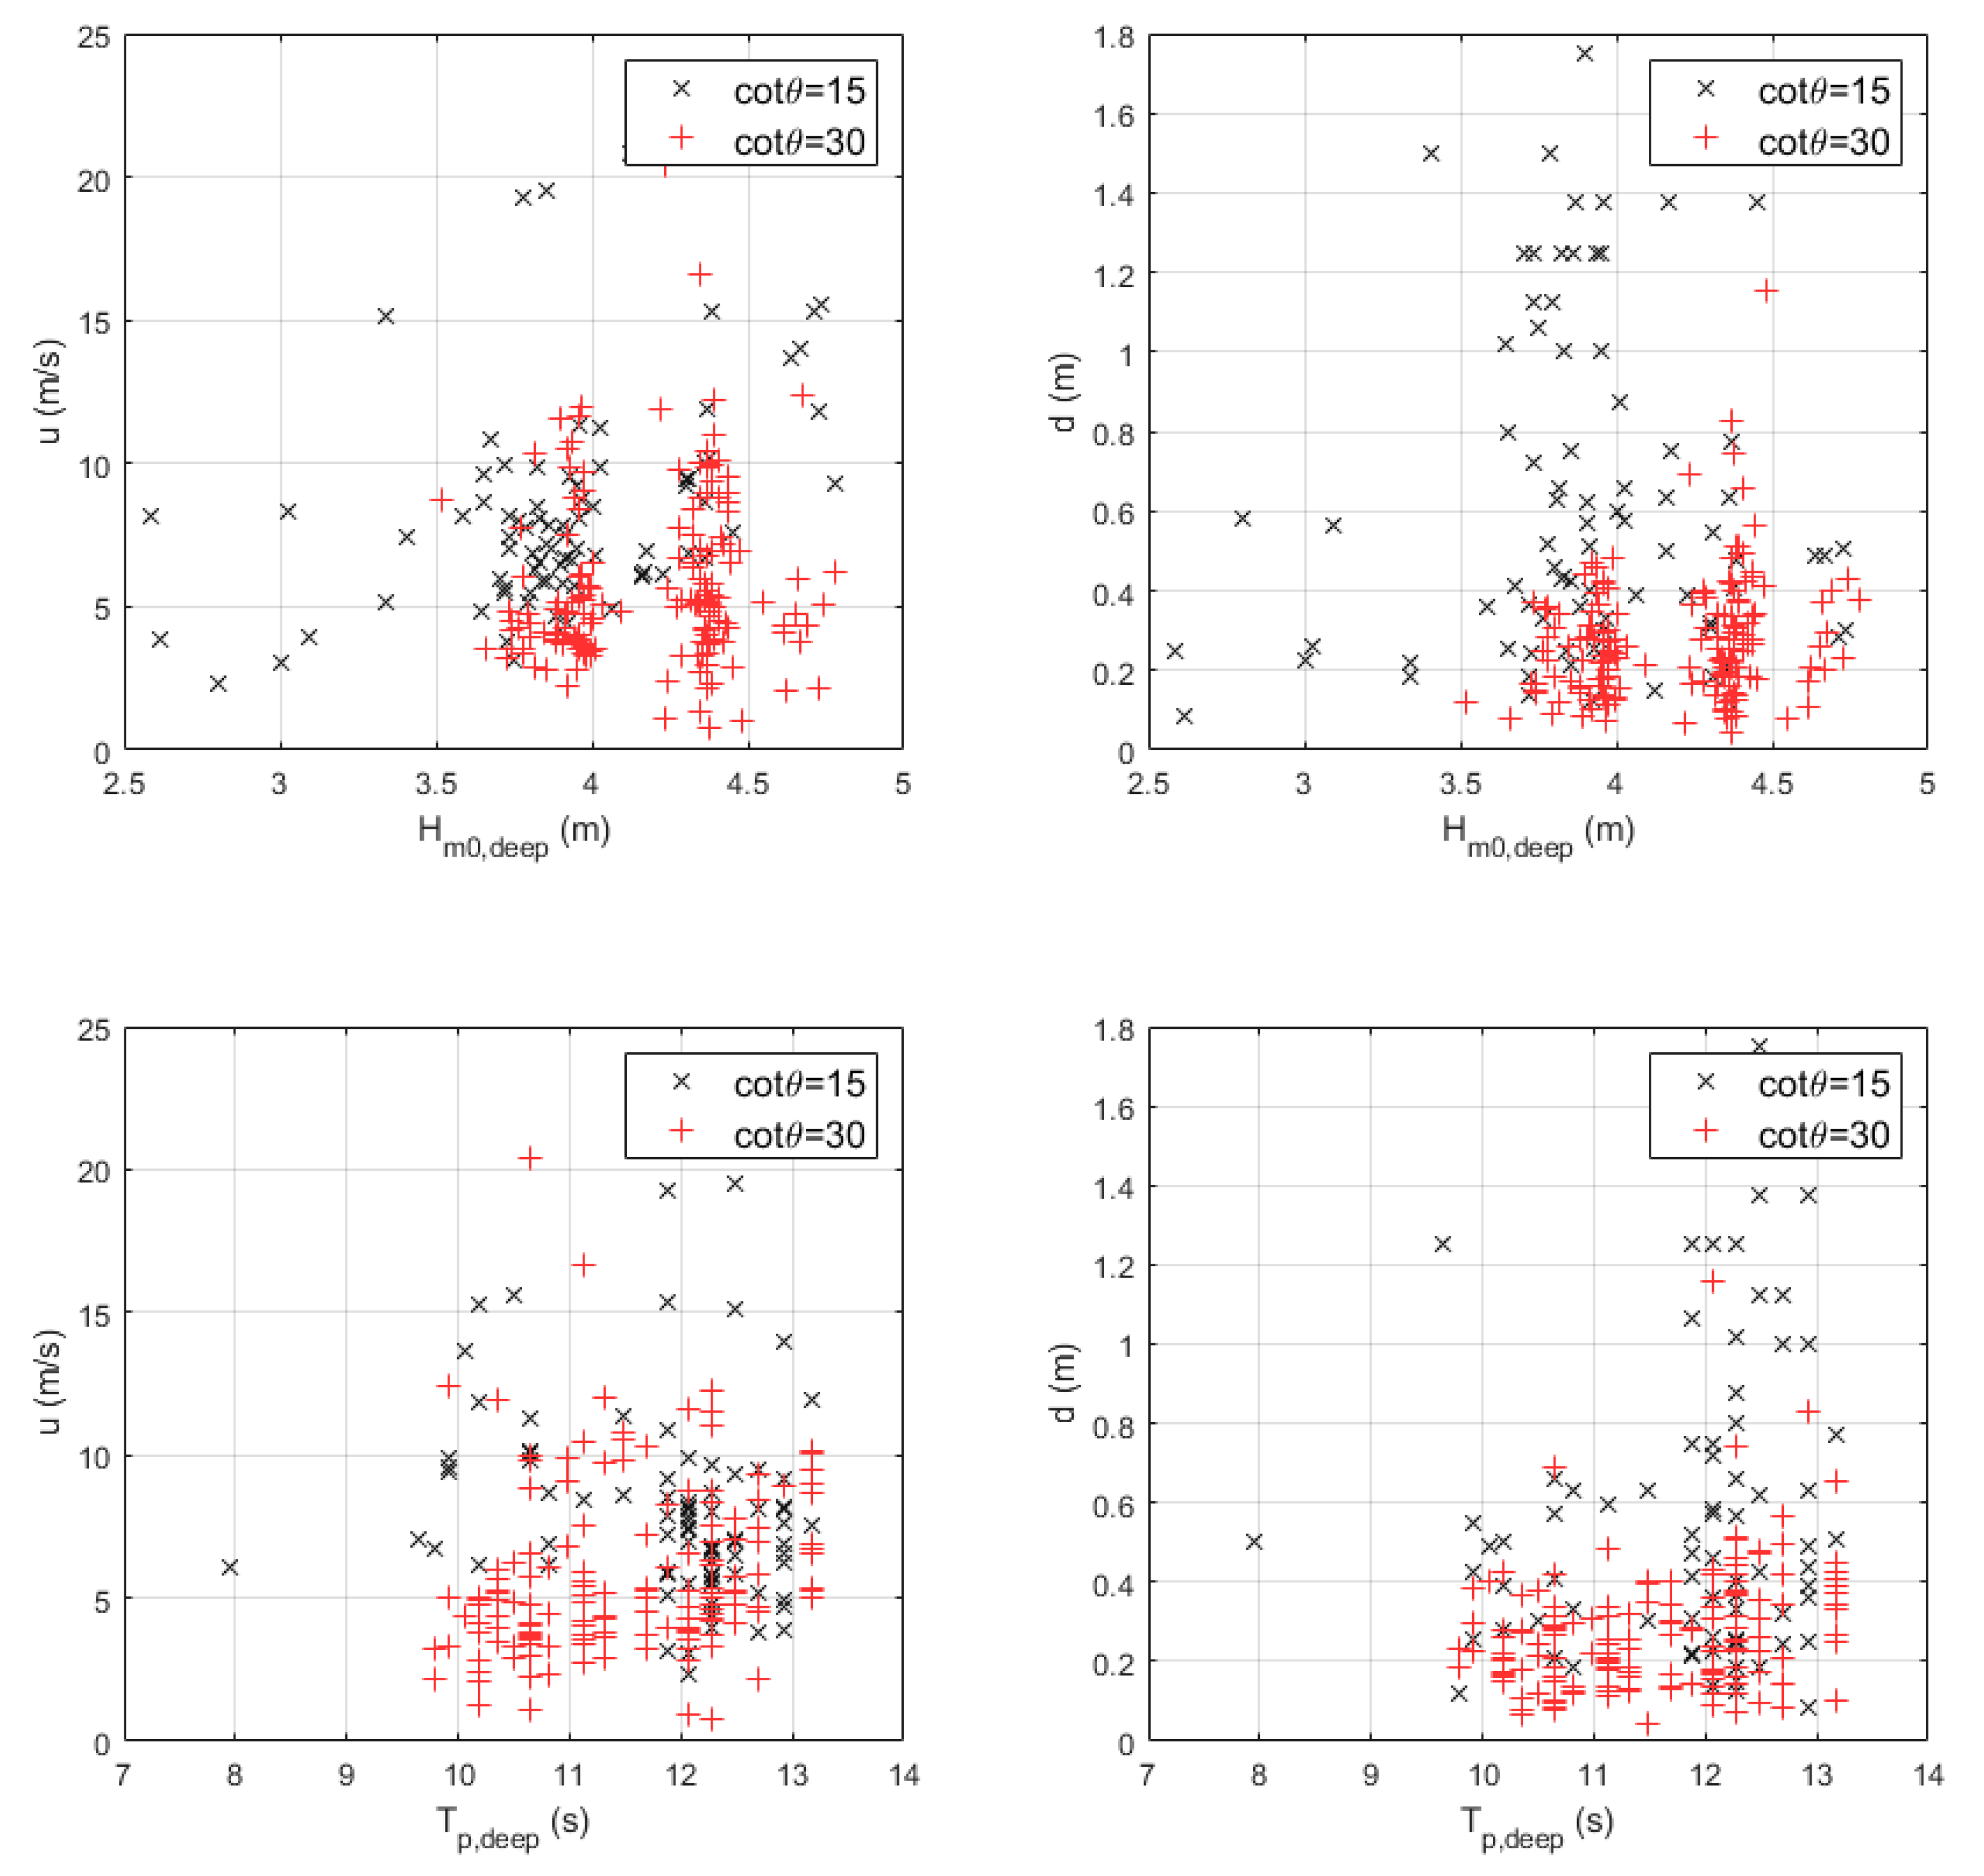
From a practical point of view, it is important to relate the overtopping flows to the sea storm conditions that have generated such flows. The variation of overtopping layer thickness and velocity with deep-wave spectral wave height and peak period is therefore shown in
Figure 13. A relatively large scatter is noticed for steeper foreshore slopes, for which overtopping flow depth increases with the deep-water peak period. Low values of flow depth and velocity correspond to wave heights smaller than 3.6 m and wave periods shorter than 10 s. The presence of a gentle slope reduces both the flow depth and velocity, due to the more intense wave breaking that occurs far from the dike toe and generates bore-type flows running on the dike and finally overtopping. These flows can be described as overtopping green water. For the 1:15 slope, especially for the largest values of water depth at the dike toe, the breaking occurs very close or partly on the same dike slope. The overtopping is characterized by very rapid flows running on the seaward edge of the dike, detaching from the crest initially and then splashing on the promenade. For these flows, very large depths are achieved for deep-water wave heights between 3.6 and 4.5 m and wave periods larger than 11.8 s.
To better understand the possible correlation among variables, a dimensional analysis was carried out. According to Buckingham’s π theorem, if there are n variables in a problem containing k primary dimensions, the equation relating all the variables will have n-m dimensionless groups. In mathematical terms, it is possible to write:
where
Hm0 and
Tm-1,0 are the spectral wave height and period at the dike toe, respectively,
htoe is the water depth at the dike toe,
B is the width of the dike promenade,
g is the gravity acceleration,
q is the average overtopping discharge,
Vmax the maximum individual overtopping volume expressed in L per meter of crest width,
Rc the crest freeboard, and
u and
d are the overtopping flow velocity and depth, respectively. The parameter
tanθeq corresponds to the equivalent slope, calculated starting from the dike and foreshore slope for cases with foreshores in shallow water conditions, as indicated in [
14]. Hence, n = 11 and k = 2, leading to nine dimensionless parameters:
The selection of each dimensionless group is based on the current literature and intends to be physically meaningful. As for example, the wave period and the overtopping flow velocity were divided by the square root of
ghtoe, corresponding to the wave celerity in shallow waters. Identification of dimensionless groups will help to investigate possible relationships between overtopping flow depth and velocity with other variables at stake. The relationship between overtopping flow depth and velocity with individual maximum overtopping volumes, has been investigated in terms of dimensionless groups as shown in
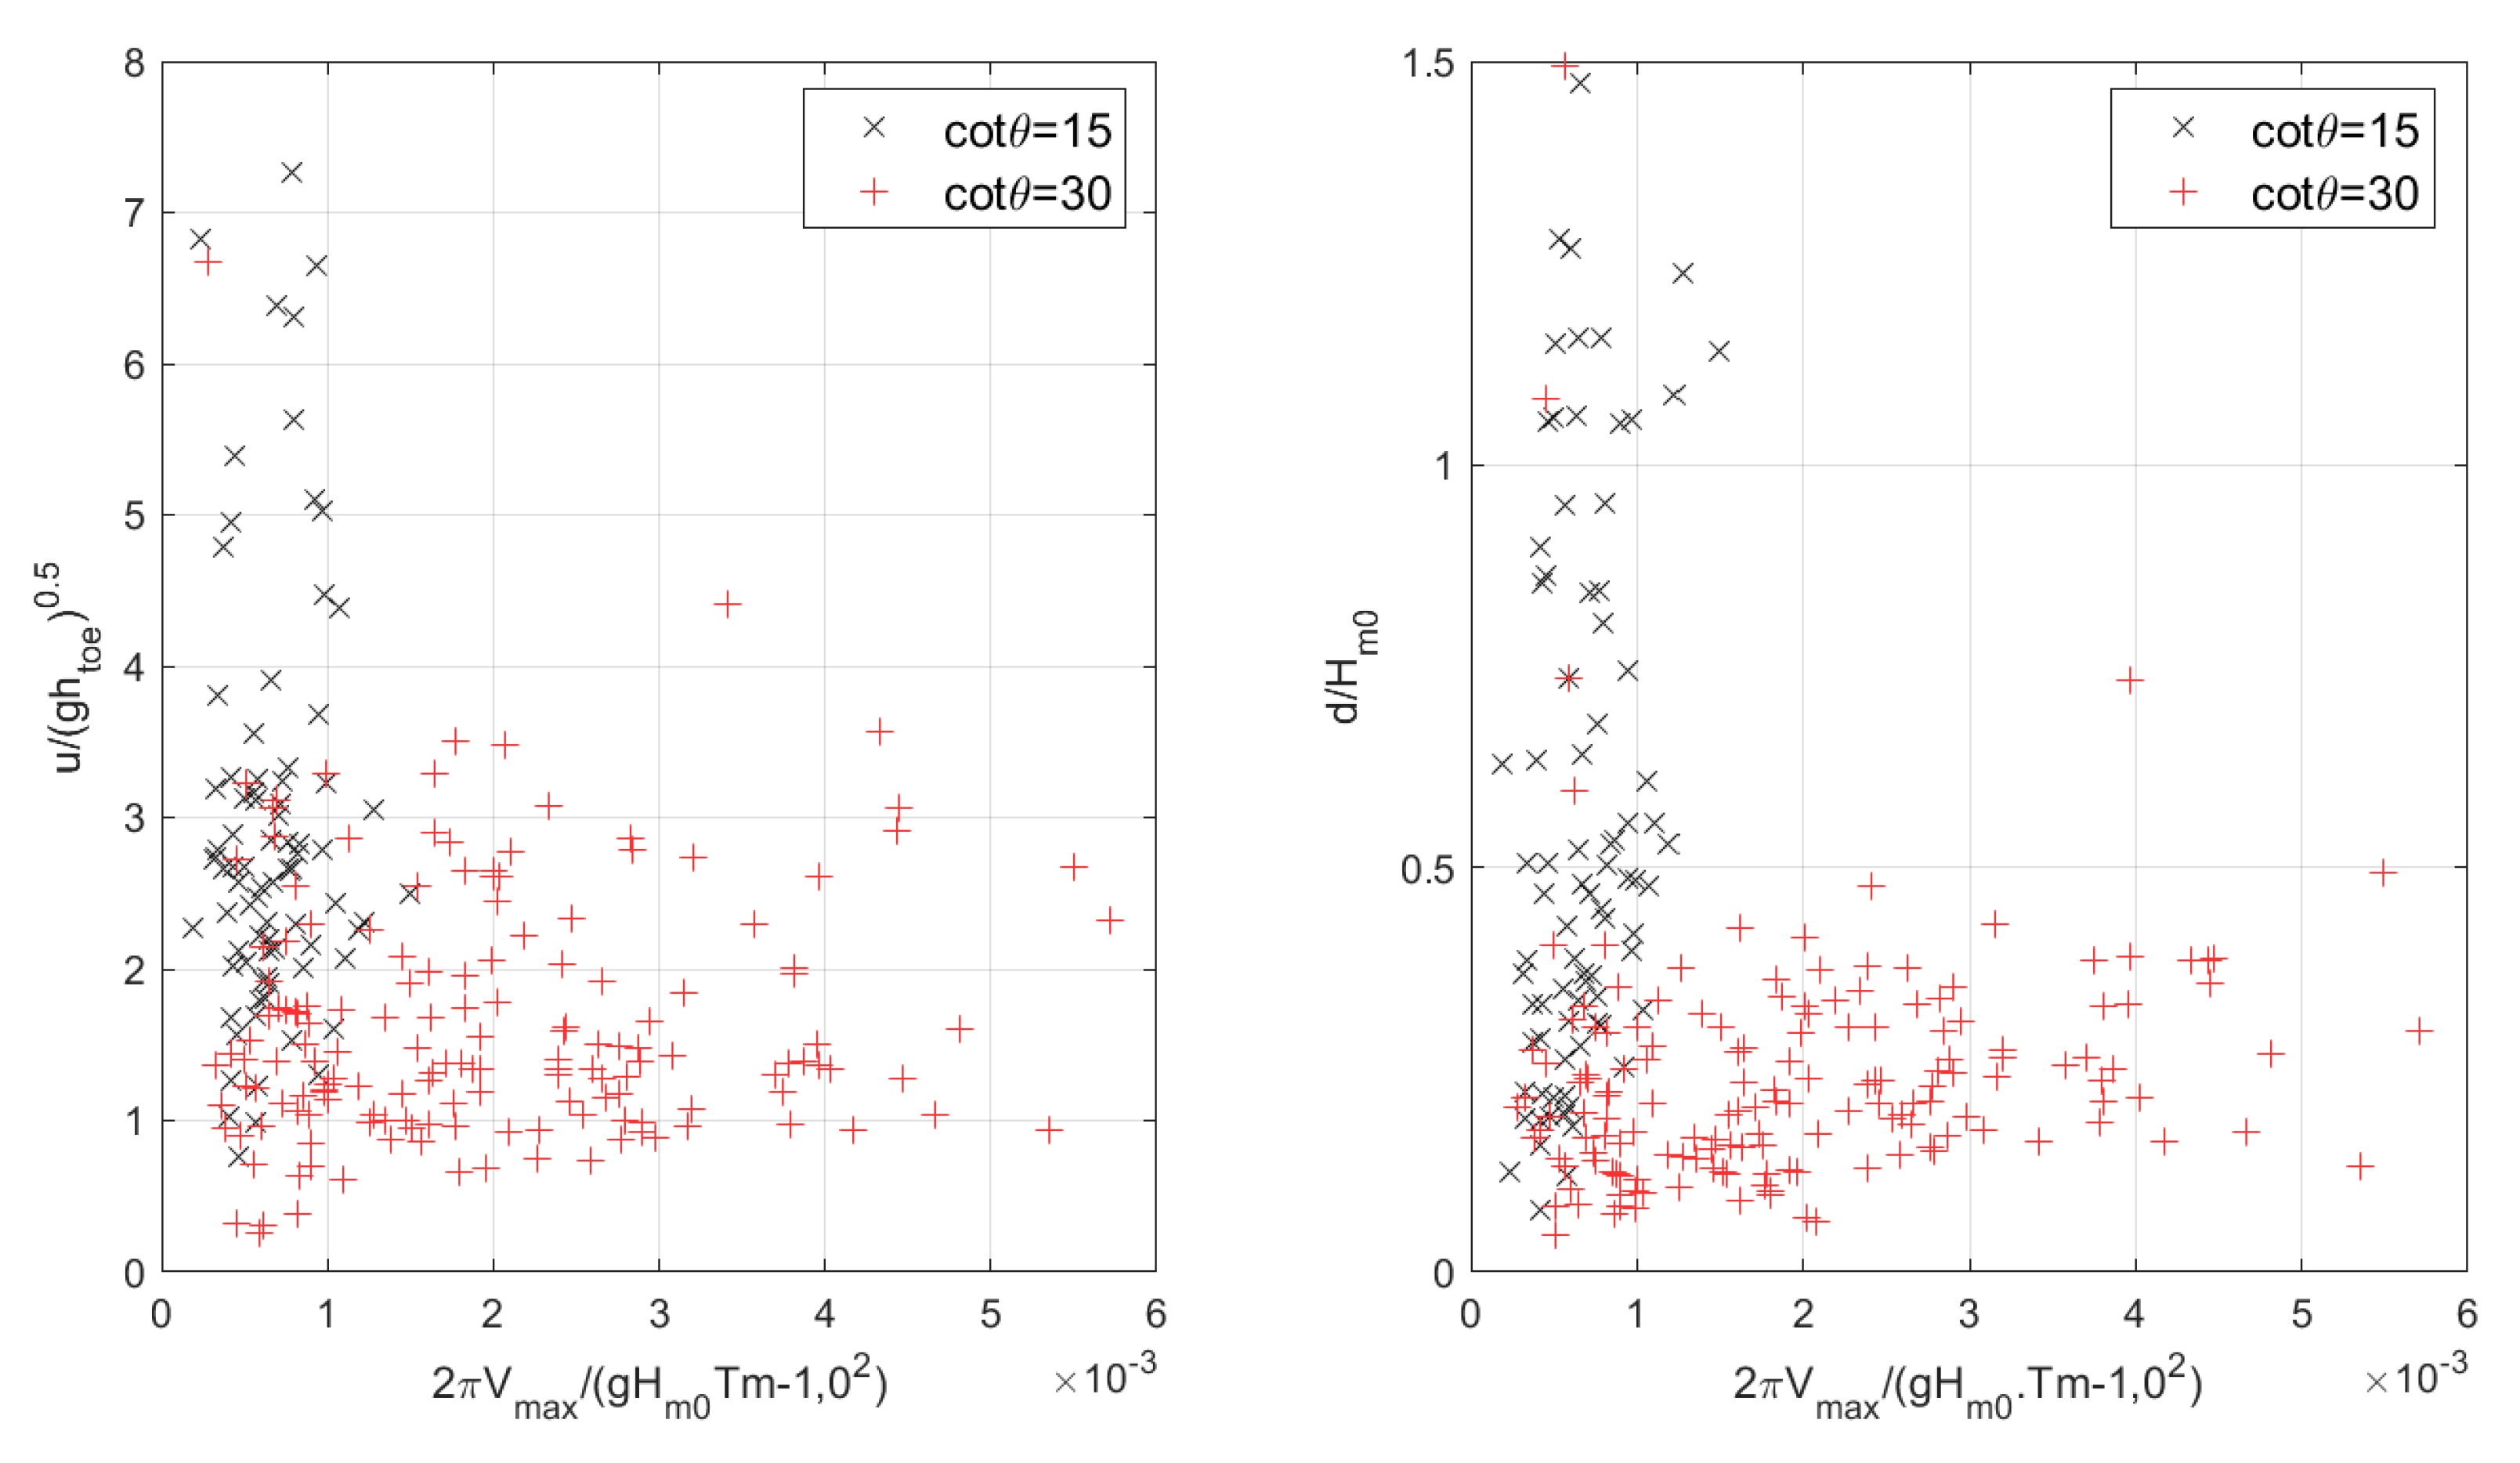
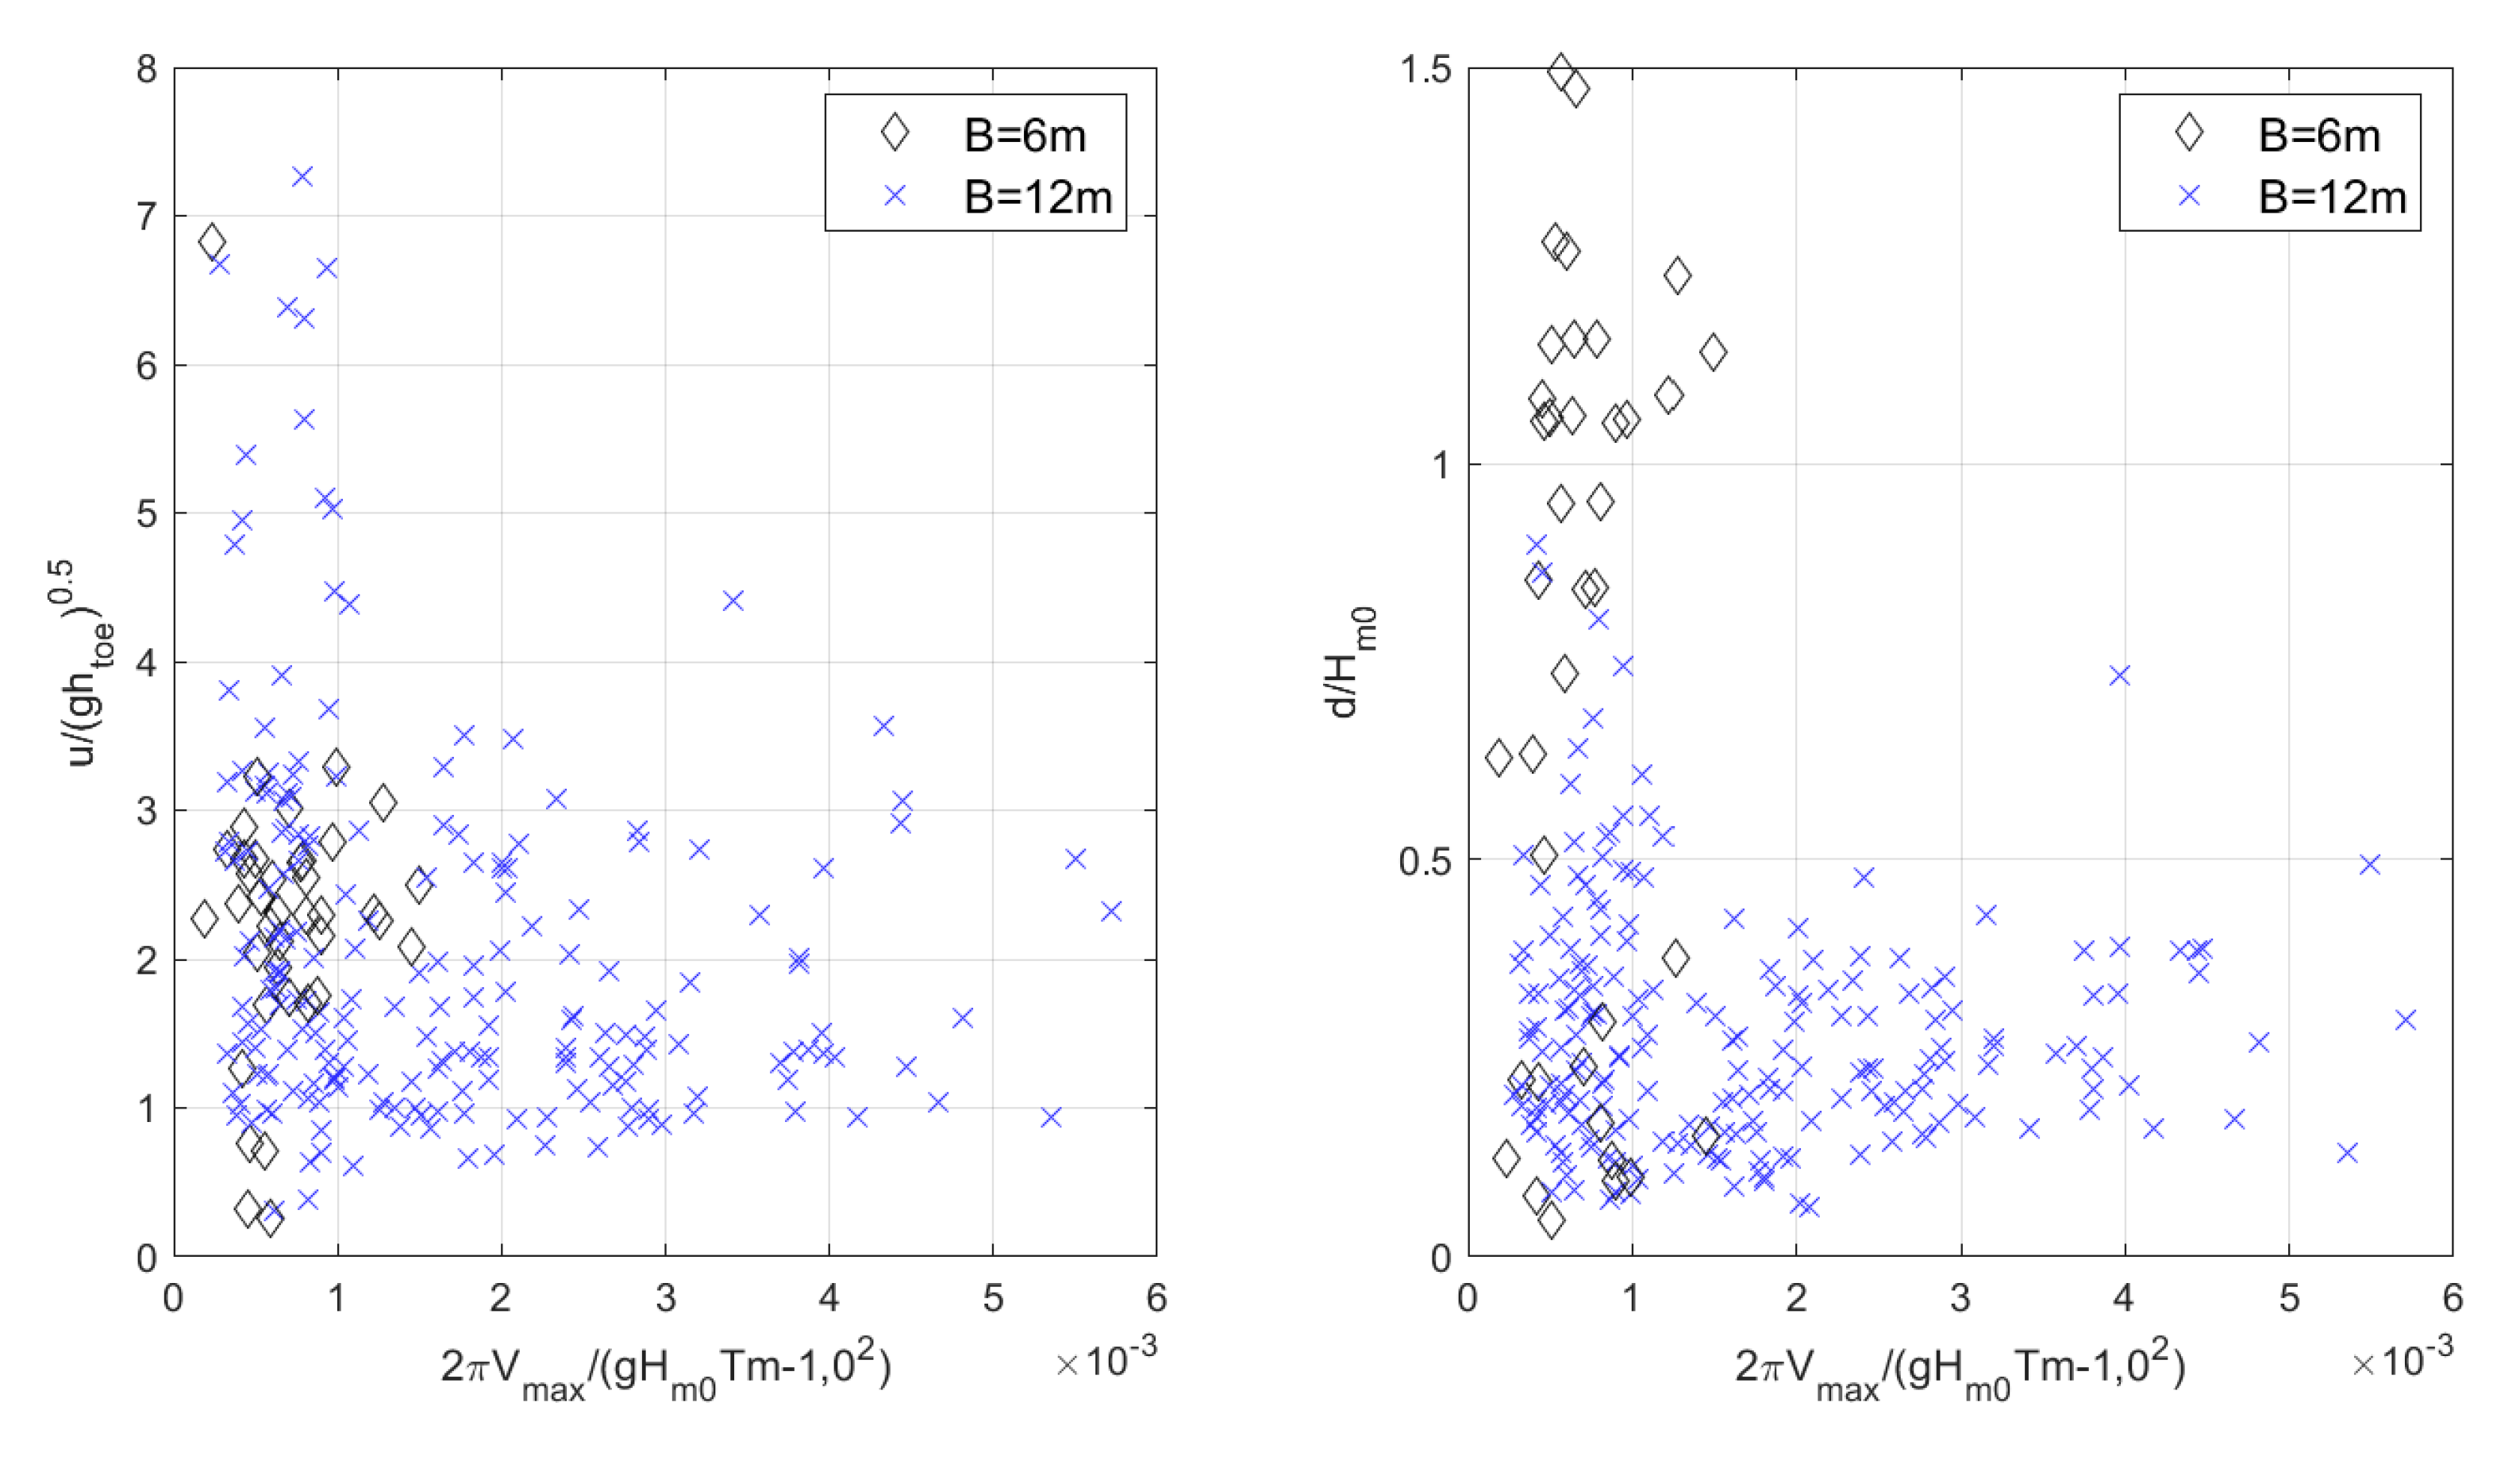
Figure 14. It is possible to distinguish two different trends, one per foreshore slope. Lower values of the dimensionless velocity are shown for a wide range of volumes in case of the 1:30 slope. Opposite to that, a wide variation of velocities is shown within a relatively short range of volumes for the steeper foreshore. A more careful analysis of the results shows that the overtopping flow depth is greatly affected by the promenade width (see
Figure 15), which does not show a clear correlation with overtopping flow velocity.
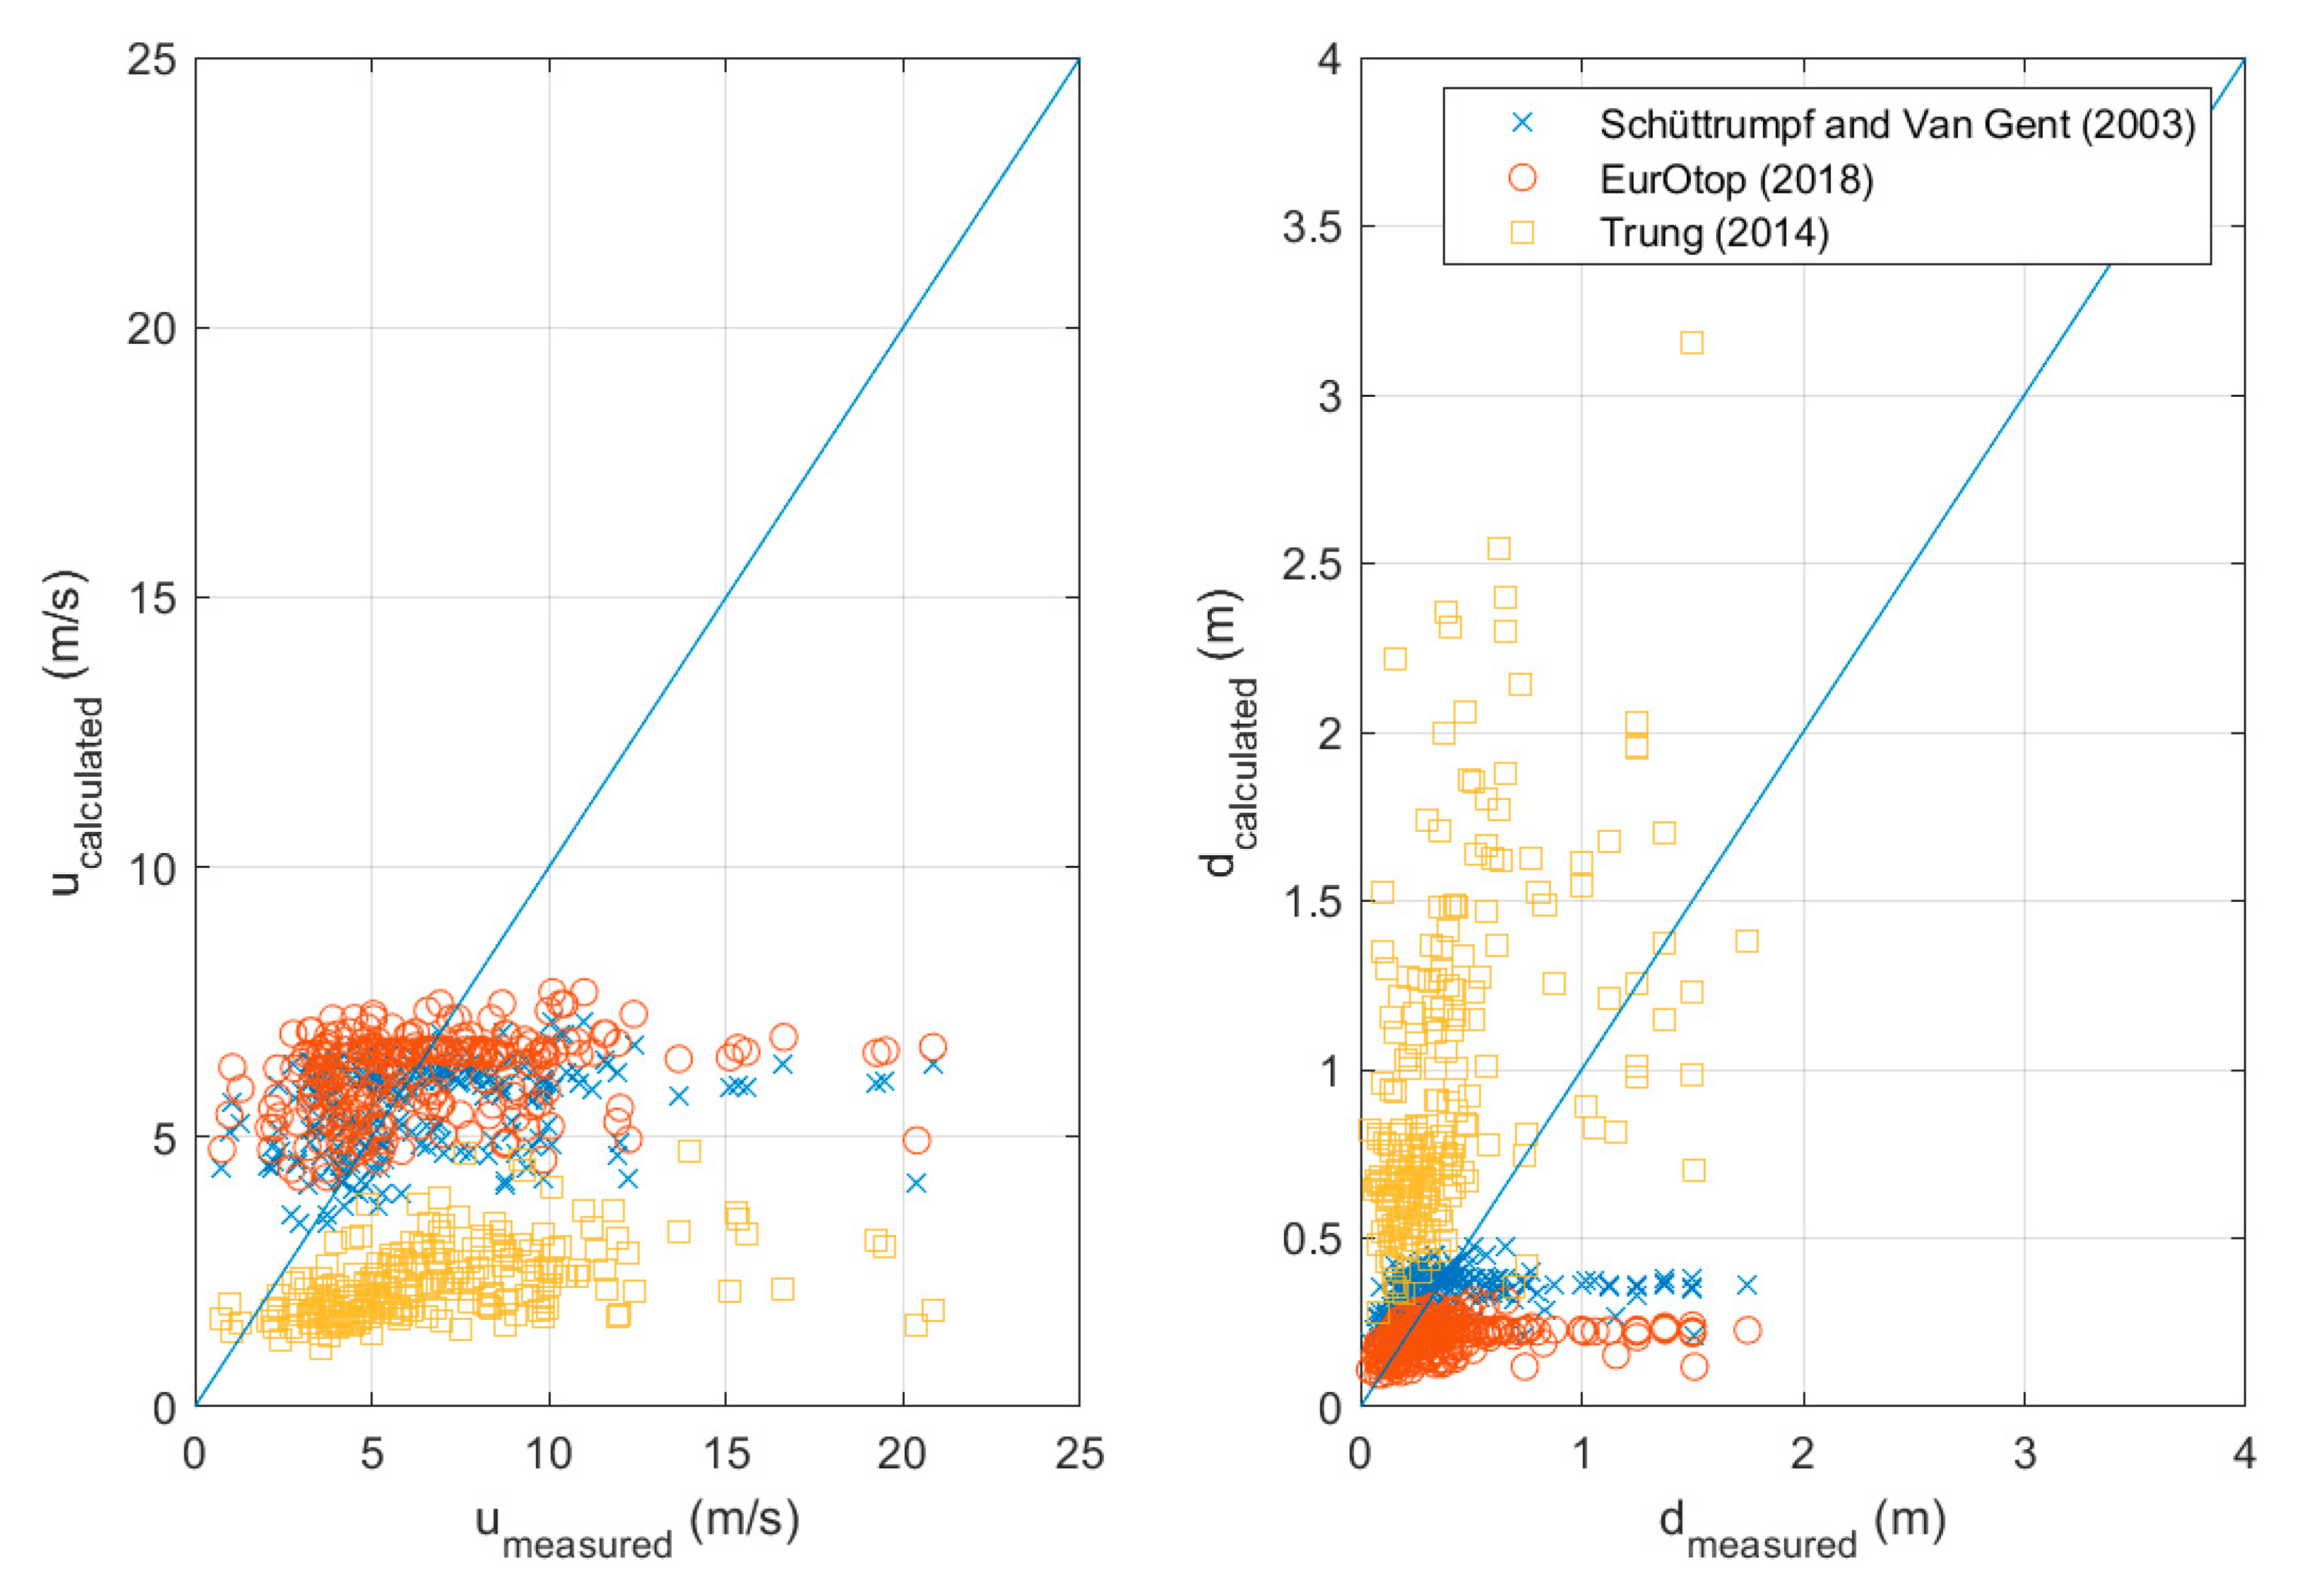
The results for overtopping flow depth and velocity were compared with formulas proposed in [
6,
26,
27,
32], who finally expressed both overtopping flow parameters as a function of wave run-up and crest freeboard. The application of the aforementioned methods requires an estimation of the run-up. Notwithstanding this, wave run-up assessment for very and extremely shallow waters and relative steep dikes cannot avoid inaccuracies, due to the fact that experimental data fall outside the range of application of any known semi-empirical formula to calculate
R2% or
Rmax. The results are depicted in
Figure 16, where it is clear that poor agreement is found between the experimental results and calculated values.
5.2. Overtopping Flow Parameters Expressed in Terms of Individual Maximum Overtopping Volume
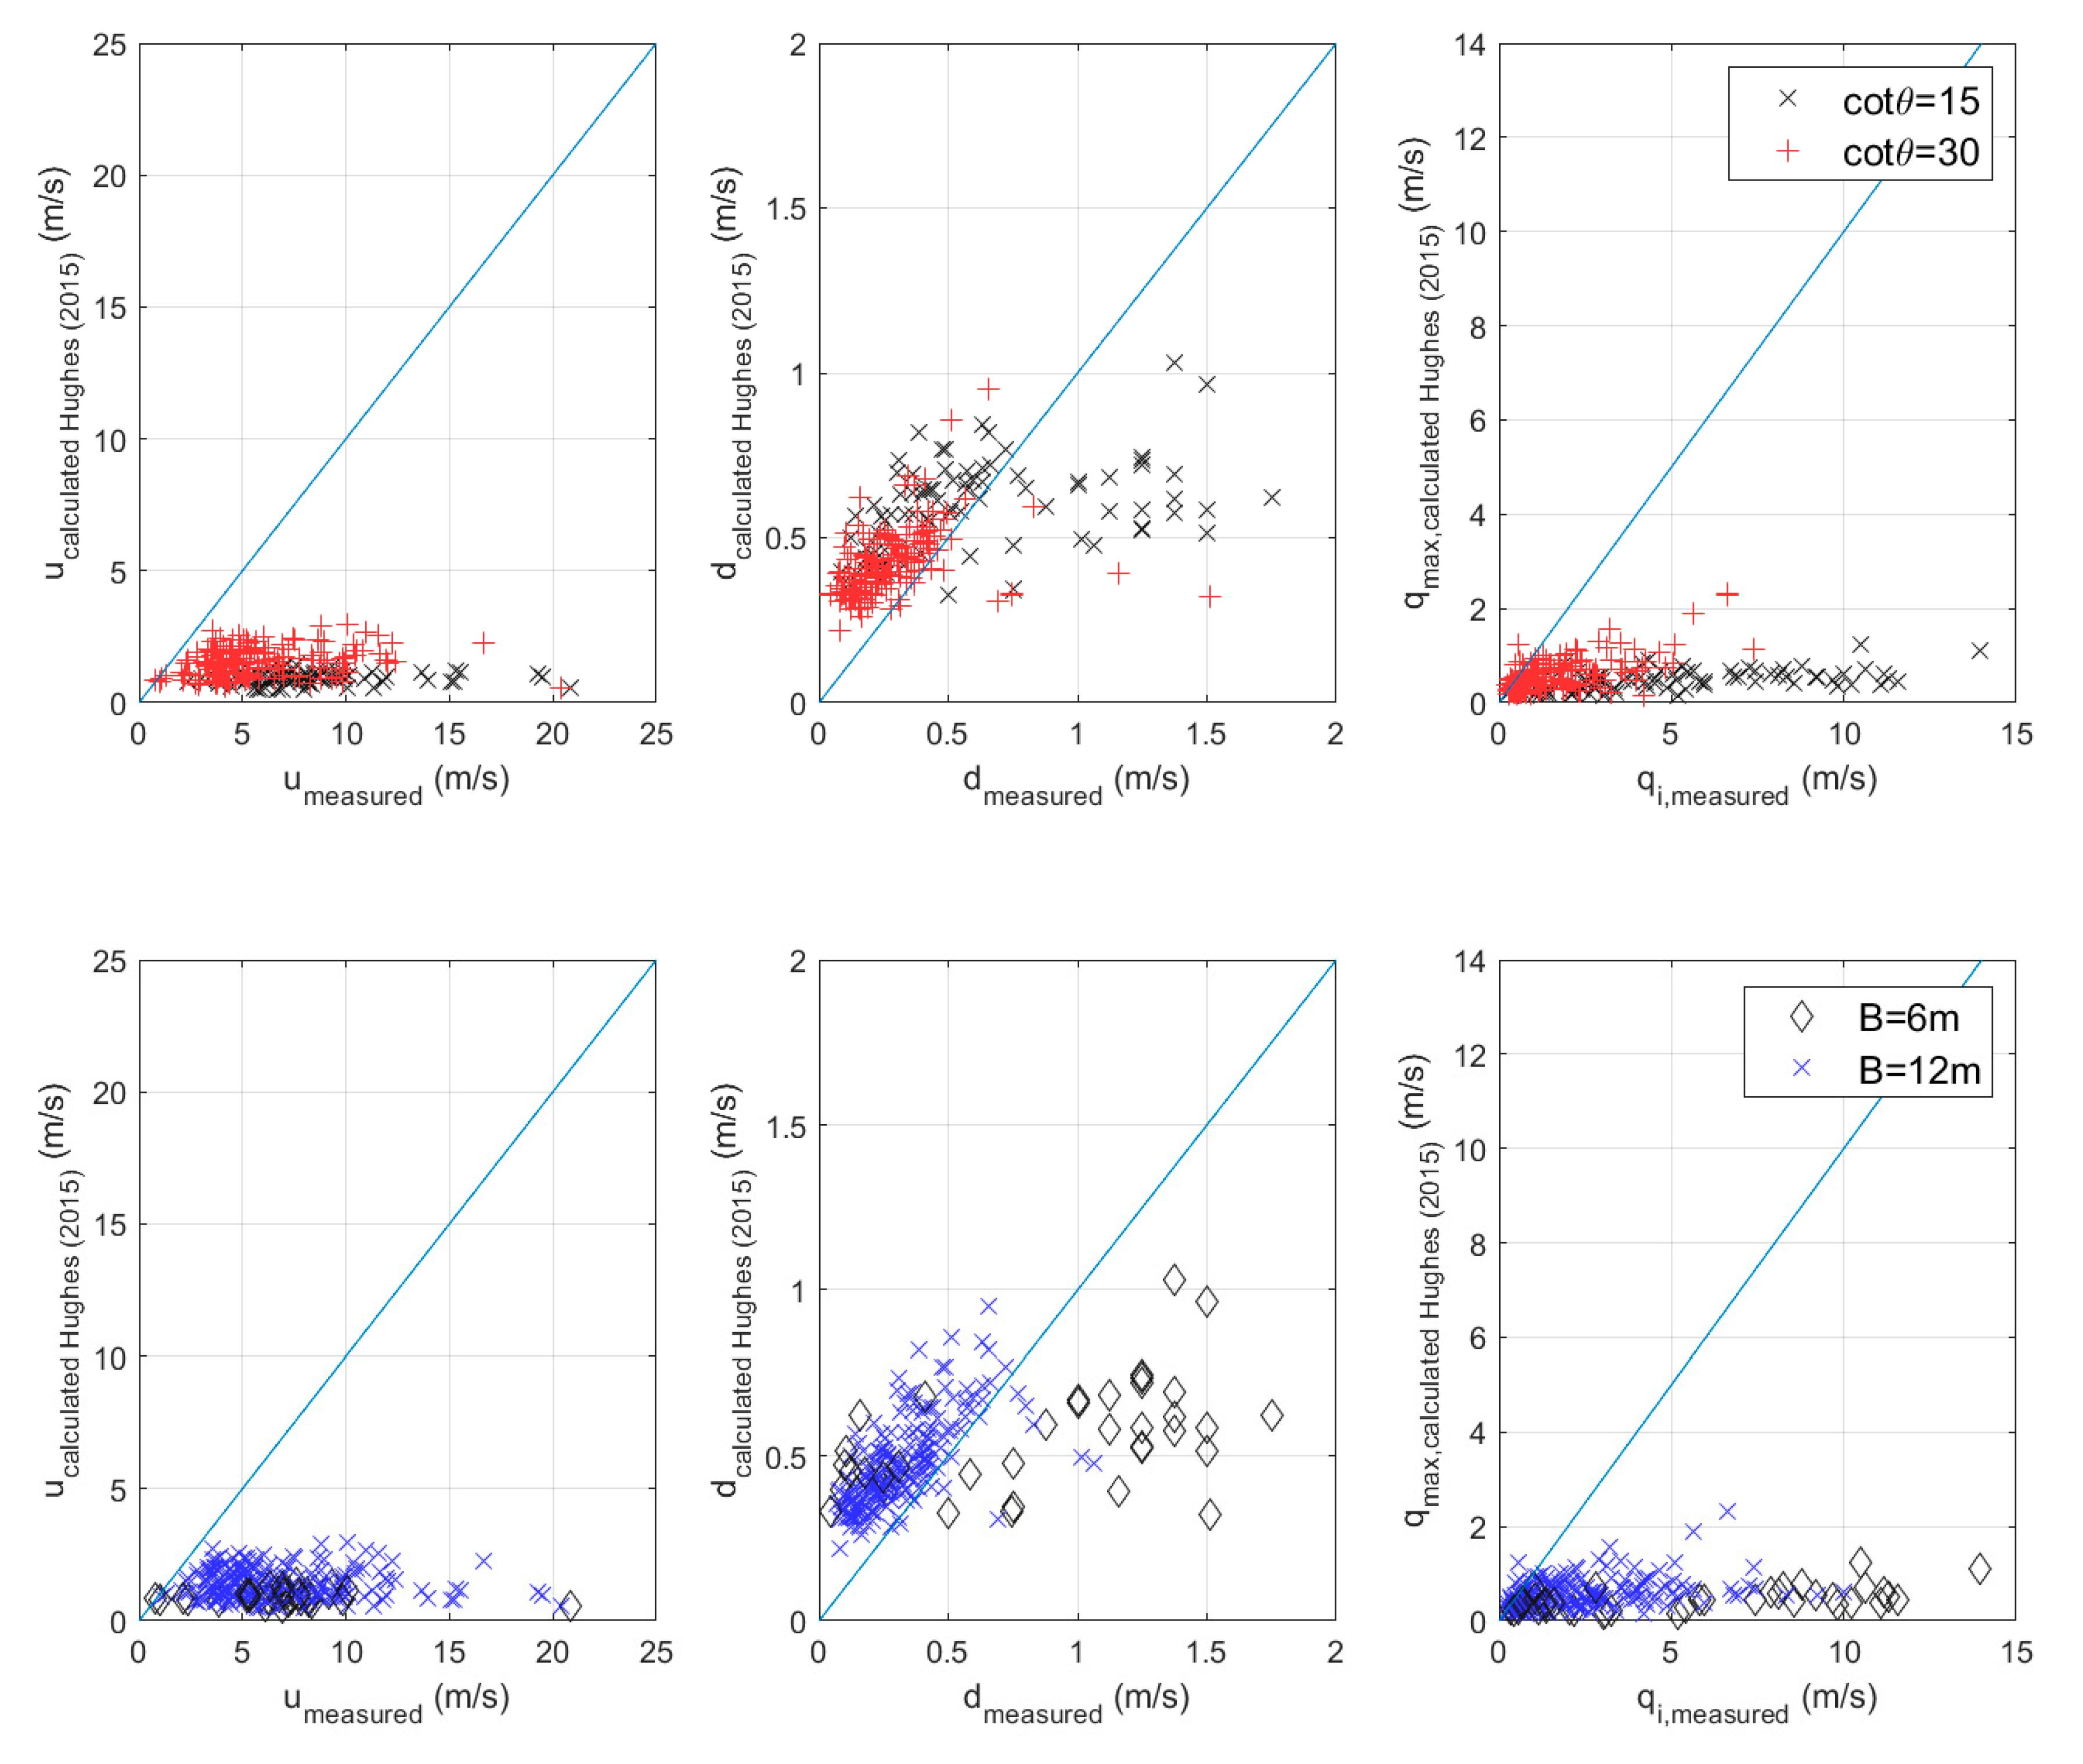
The application of the formulas proposed by Hughes [
24], being a function of the maximum individual overtopping volume, are considered more adequate to be applied to the presented results, without further sources of uncertainty. It must be noticed that [
24] analyzed overtopping flow parameters only at the seaward edge of the dike crest and not along it. The effects of the crest width were therefore neglected. Comparisons are reported in
Figure 17: unlike overtopping flow depth, flow velocities and discharges are considerably under predicted. A possible explanation is the influence of the spectral wave period:
Tm-1,0 can be found at the denominator of Equations (6)–(8); however, the measured wave periods are far larger than the one tested in [
24], as deeply affected by heavy breaking and release and shift of the spectral energy to very low frequency as result of the release of infra-gravity waves for very and extremely shallow water conditions.
Mares-Nasarre et al. [
10] demonstrated that overtopping flow velocity and flow depth are correlated if we look at them in statistical terms; they appear to be independent when related to the same individual overtopping event. Notwithstanding this, we aimed to further investigate possible correlations among dimensionless valuable. For the scope, the evolutionary polynomial regression (EPR) technique by [
33] was employed. EPR implements a multi-modelling approach with multi-objective genetic algorithm. This technique was already successfully applied to coastal engineering problems [
34,
35] to find a simple and easily interpretable mathematical models that express the reflection coefficient variation for irregular waves for a particular low-reflective caisson breakwater. After several iterations, the following expressions have been found for overtopping flow depth, overtopping flow velocity and individual overtopping discharge:
Similar dependence on the individual overtopping volume is found by employing EPR as by [
24,
27]. In addition, a certain influence exists of the location,
xc, where flow parameters are measured, of the surf similarity parameter
ξm-1,0 and dimensionless freeboard
Rc/Hm0. The surf similarity parameter is here calculated by employing the equivalent slope as defined in [
15]. The influence of the freeboard might be explained as follows: for the same volume, a higher freeboard will lead to lower flow depths (run-up is lower). In addition, the surf similarity parameter will be bigger for longer periods (i.e., bigger wavelengths), leading to bigger individual discharges.
Measured overtopping flow parameters are plotted against the calculated ones in
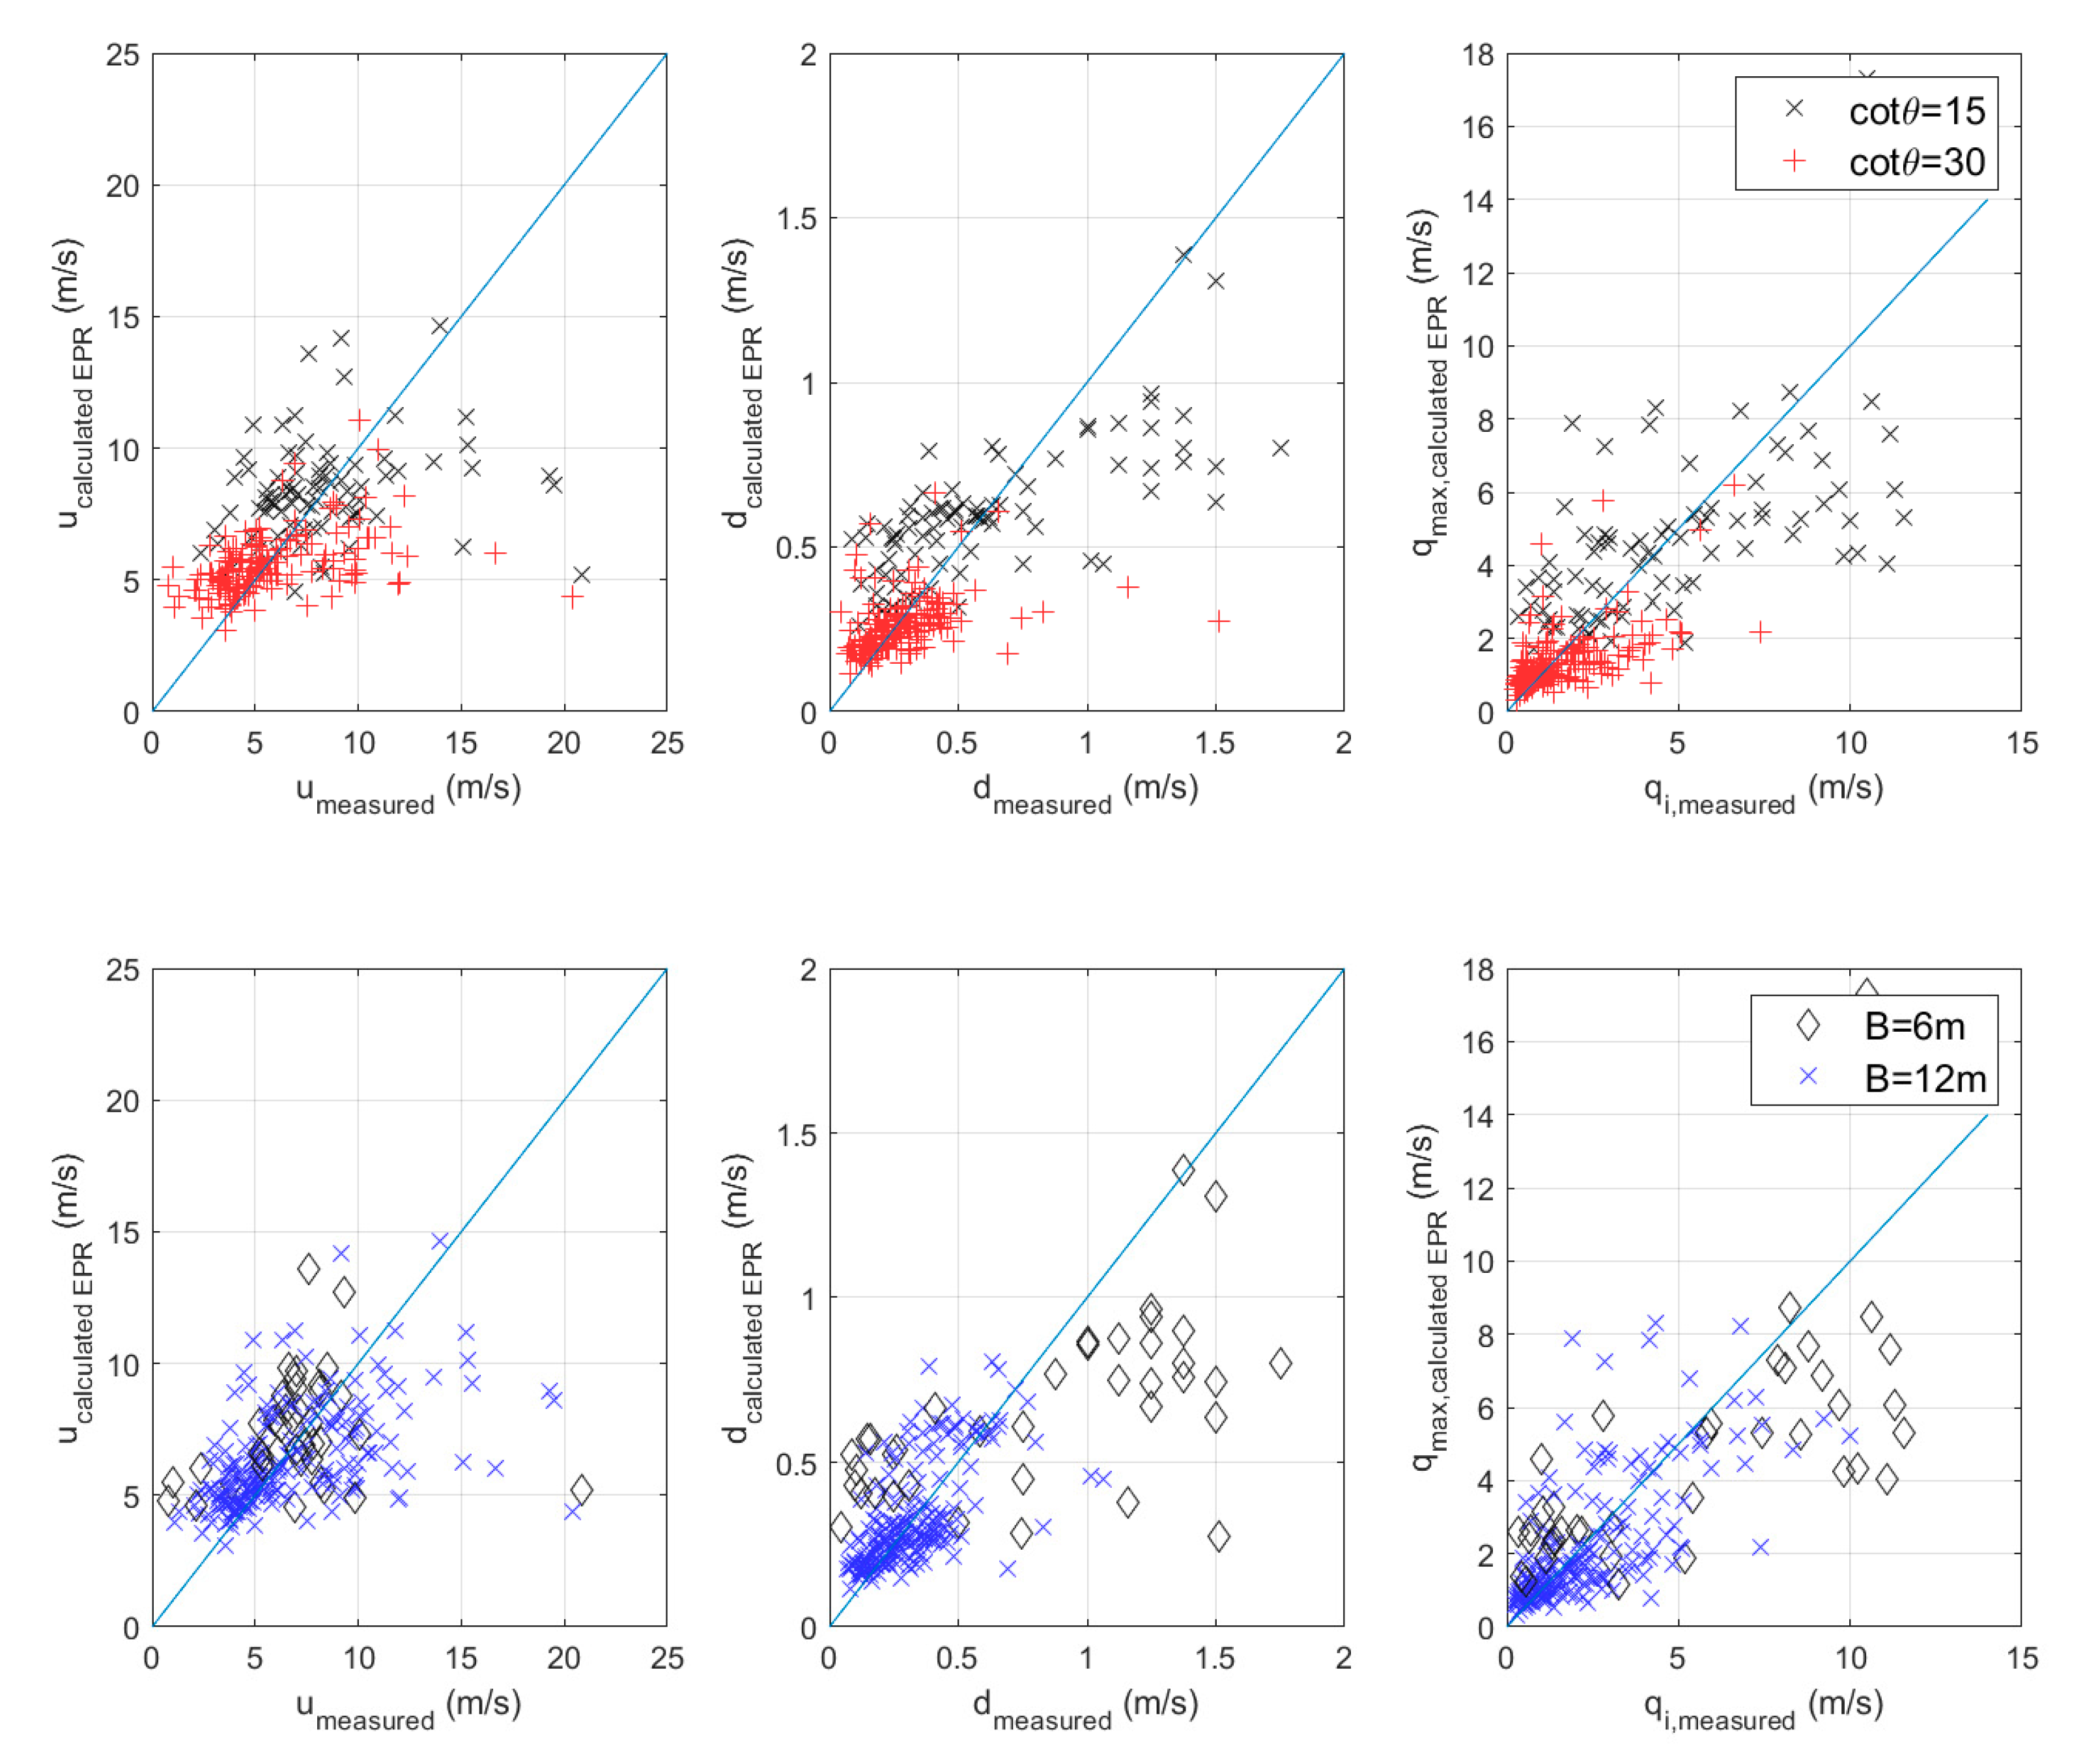
Figure 18. Large scatter is noticed especially for those cases with steeper foreshore slope and narrower crest width: the more violent overtopping events, often characterized by splashes and jets, make it more difficult to measure overtopping flow properties without errors (R
2 is about 50%). In any case, it is important to emphasize here that it is not intended to find new relationships for the overtopping flow parameters to overcome or upgrade the ones already proposed in the literature. The EPR analysis is carried out to provide a general overview of the possible correlations among variables and help to interpret the results. Larger databases are required to optimize any regression for the flow properties on the dike crest, but this is out of scope of the present work.
6. Analysis and Comparison of Safety Criteria and Limits of Wave Overtopping for Design of Sea Dikes
In the previous section, a possible correlation among the aforementioned variables was shown. Overtopping flow velocity and flow depth show a clear dependence on the individual volume, as also confirmed by [
24,
27]. Poor correlation is noticed with the mean overtopping discharge instead. Usually, the only overtopping variables considered during the design of any coastal defense are the mean discharge and the maximum volume. According to [
6], people standing and walking on or behind a coastal defense can be considered safe when the volume and discharges values are within certain limits: a preliminary comparison of the obtained experimental data with the tolerable limits of
Table 1 is shown in
Figure 10. The results indicate that: (1) the measured values of volumes are bigger than the proposed threshold, except for a very few cases; (2) mean overtopping discharge is always within the proposed thresholds.
Considering the limit on individual volume stronger condition than the one on discharge, it can be concluded that the limits presented in [
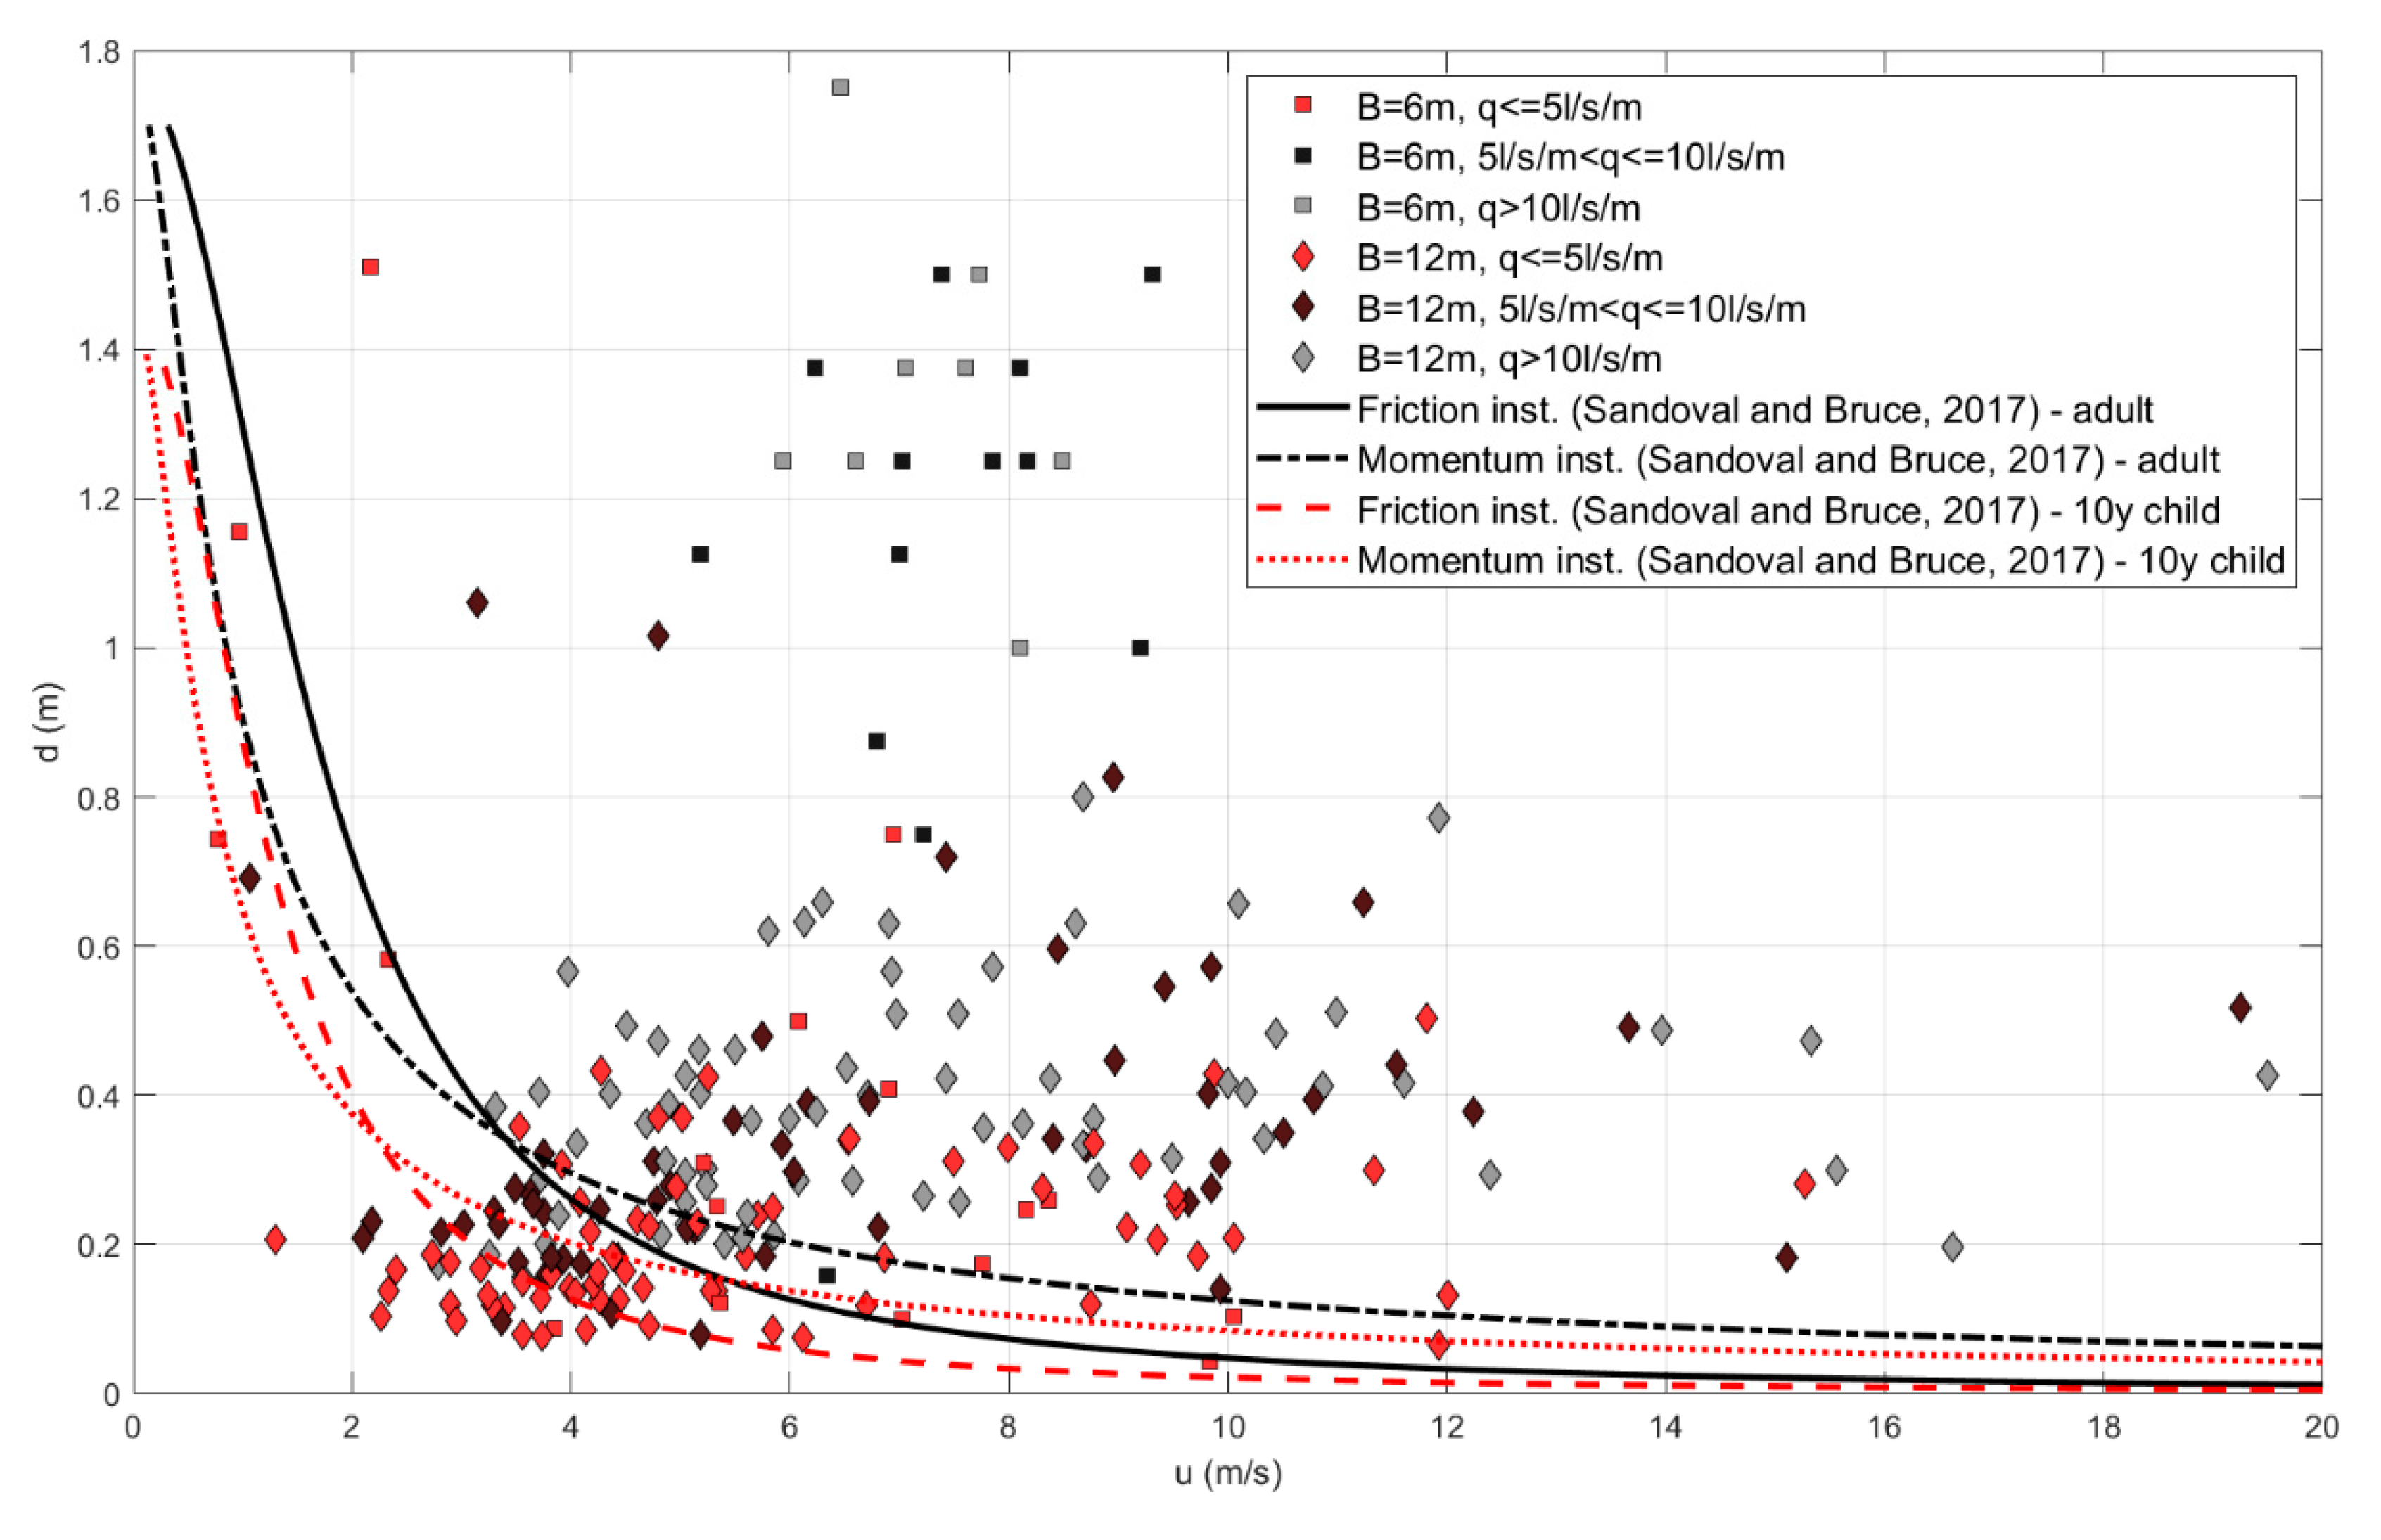
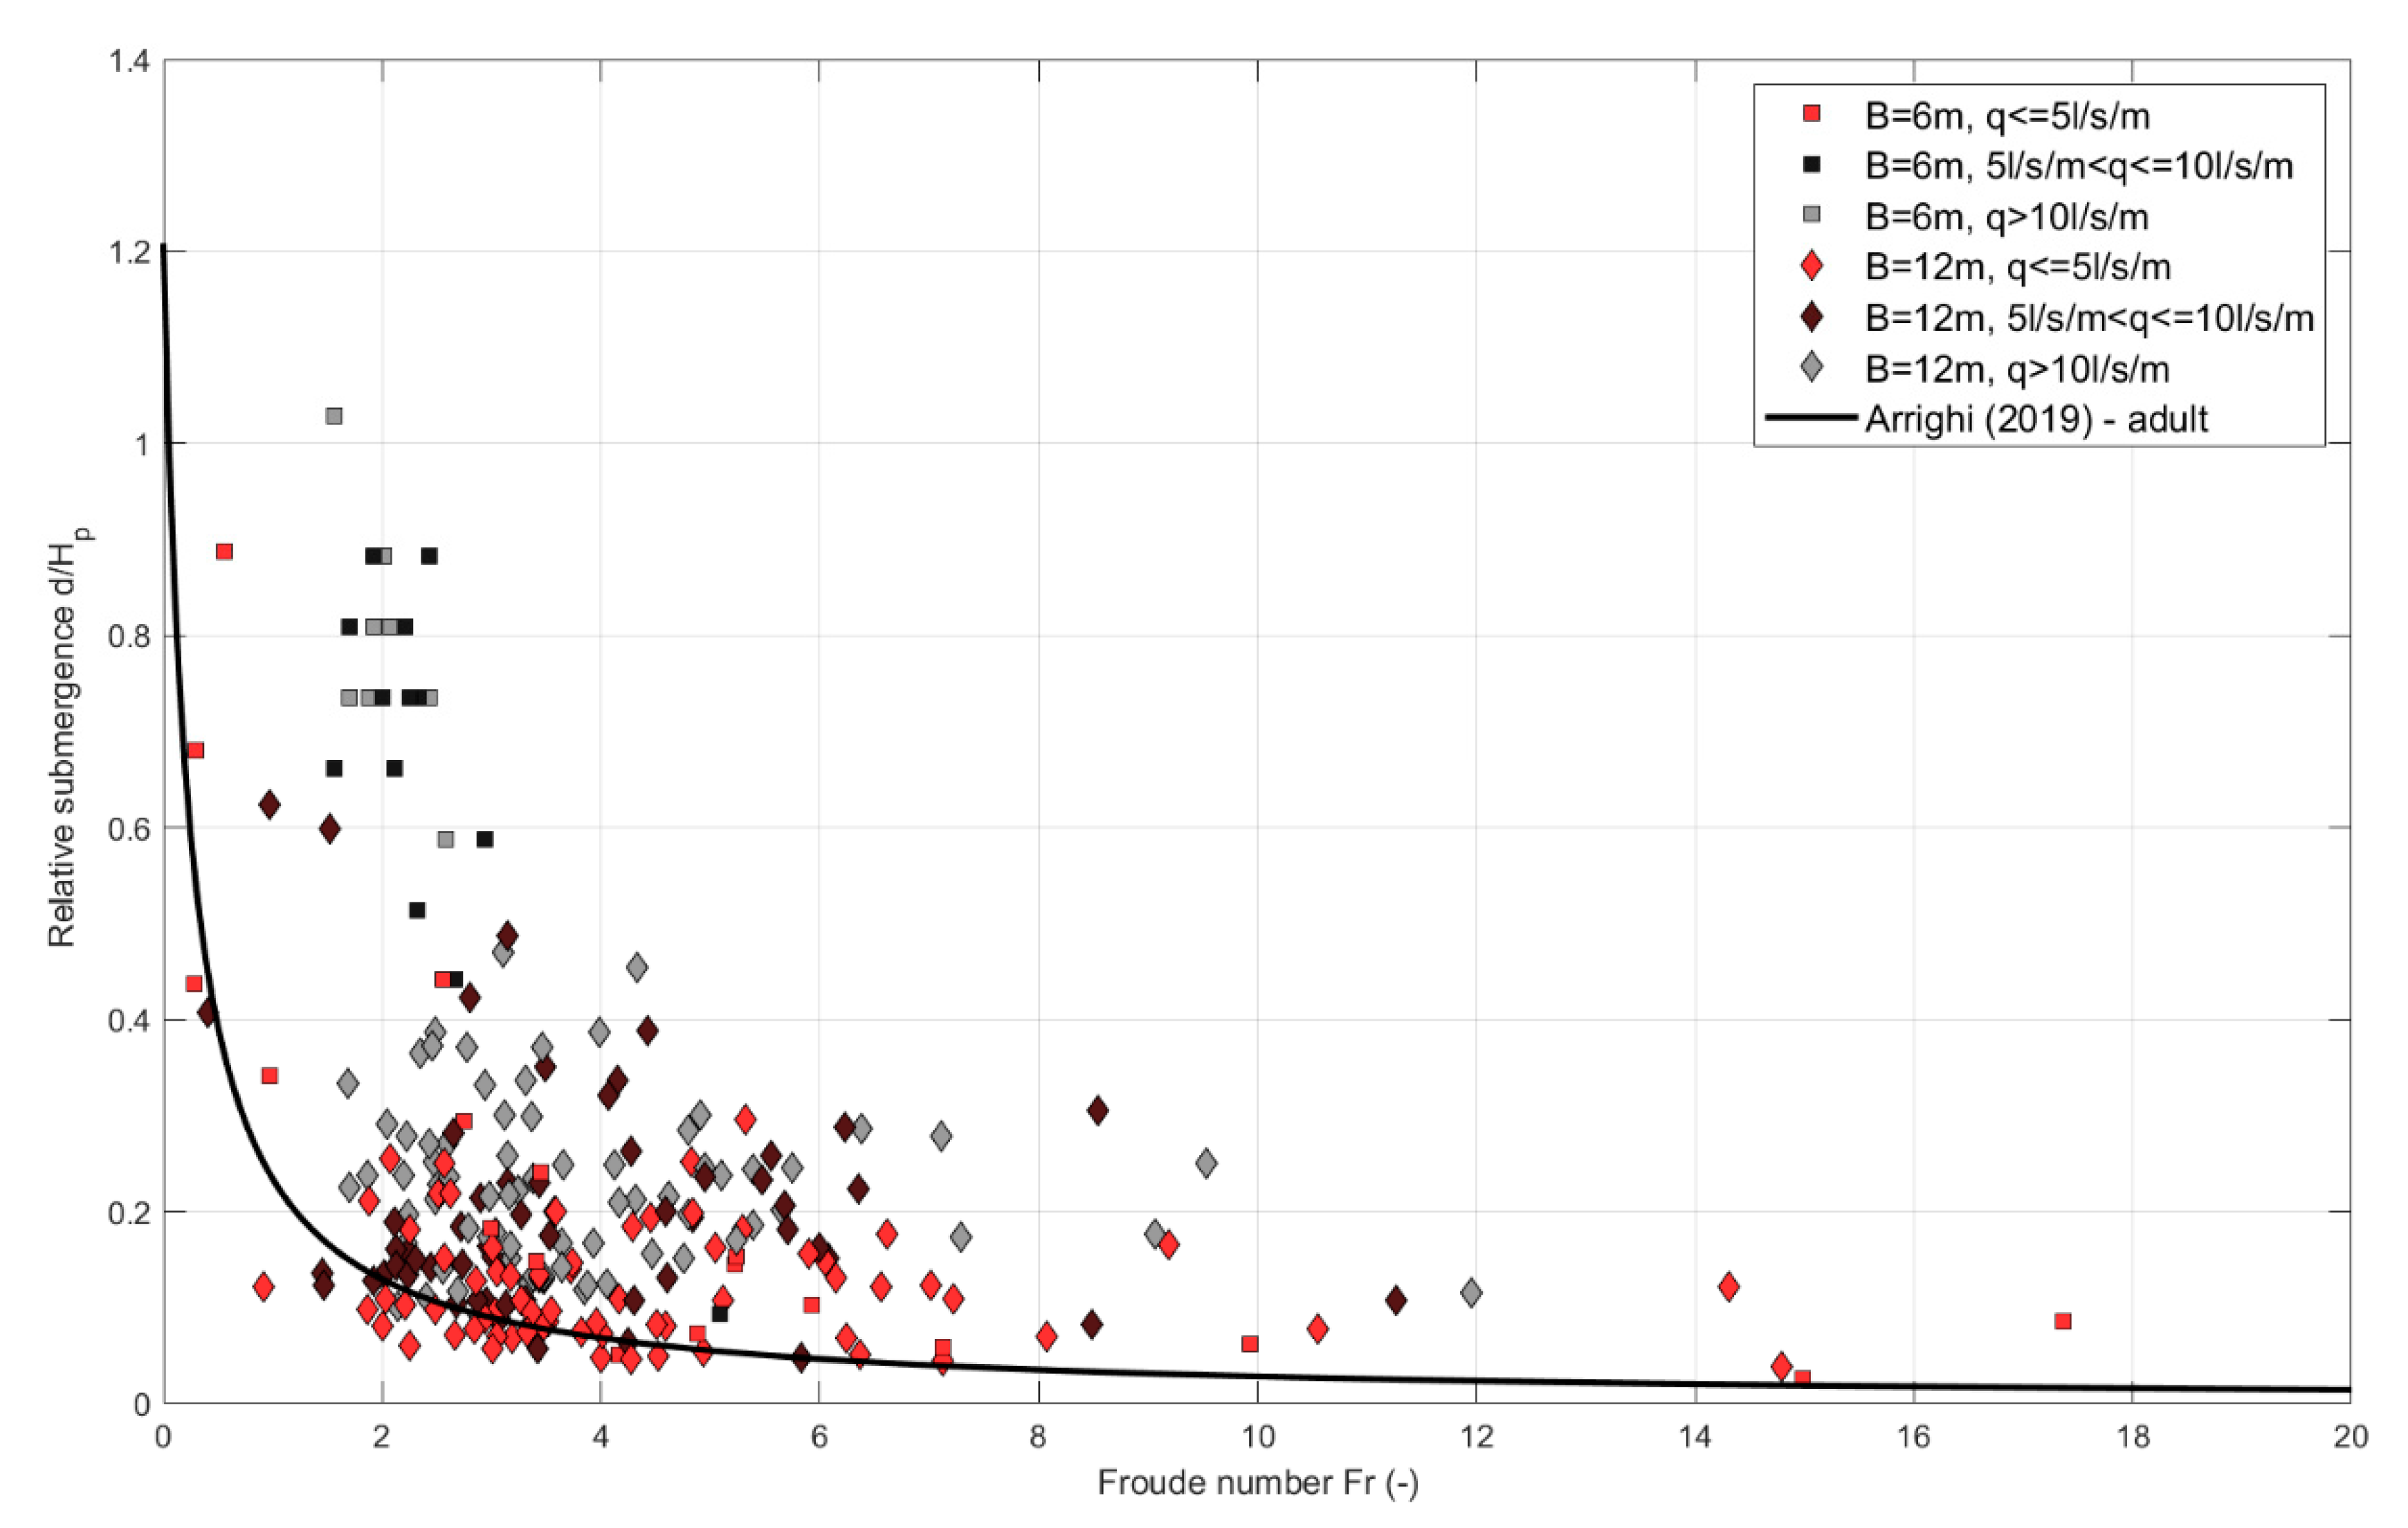
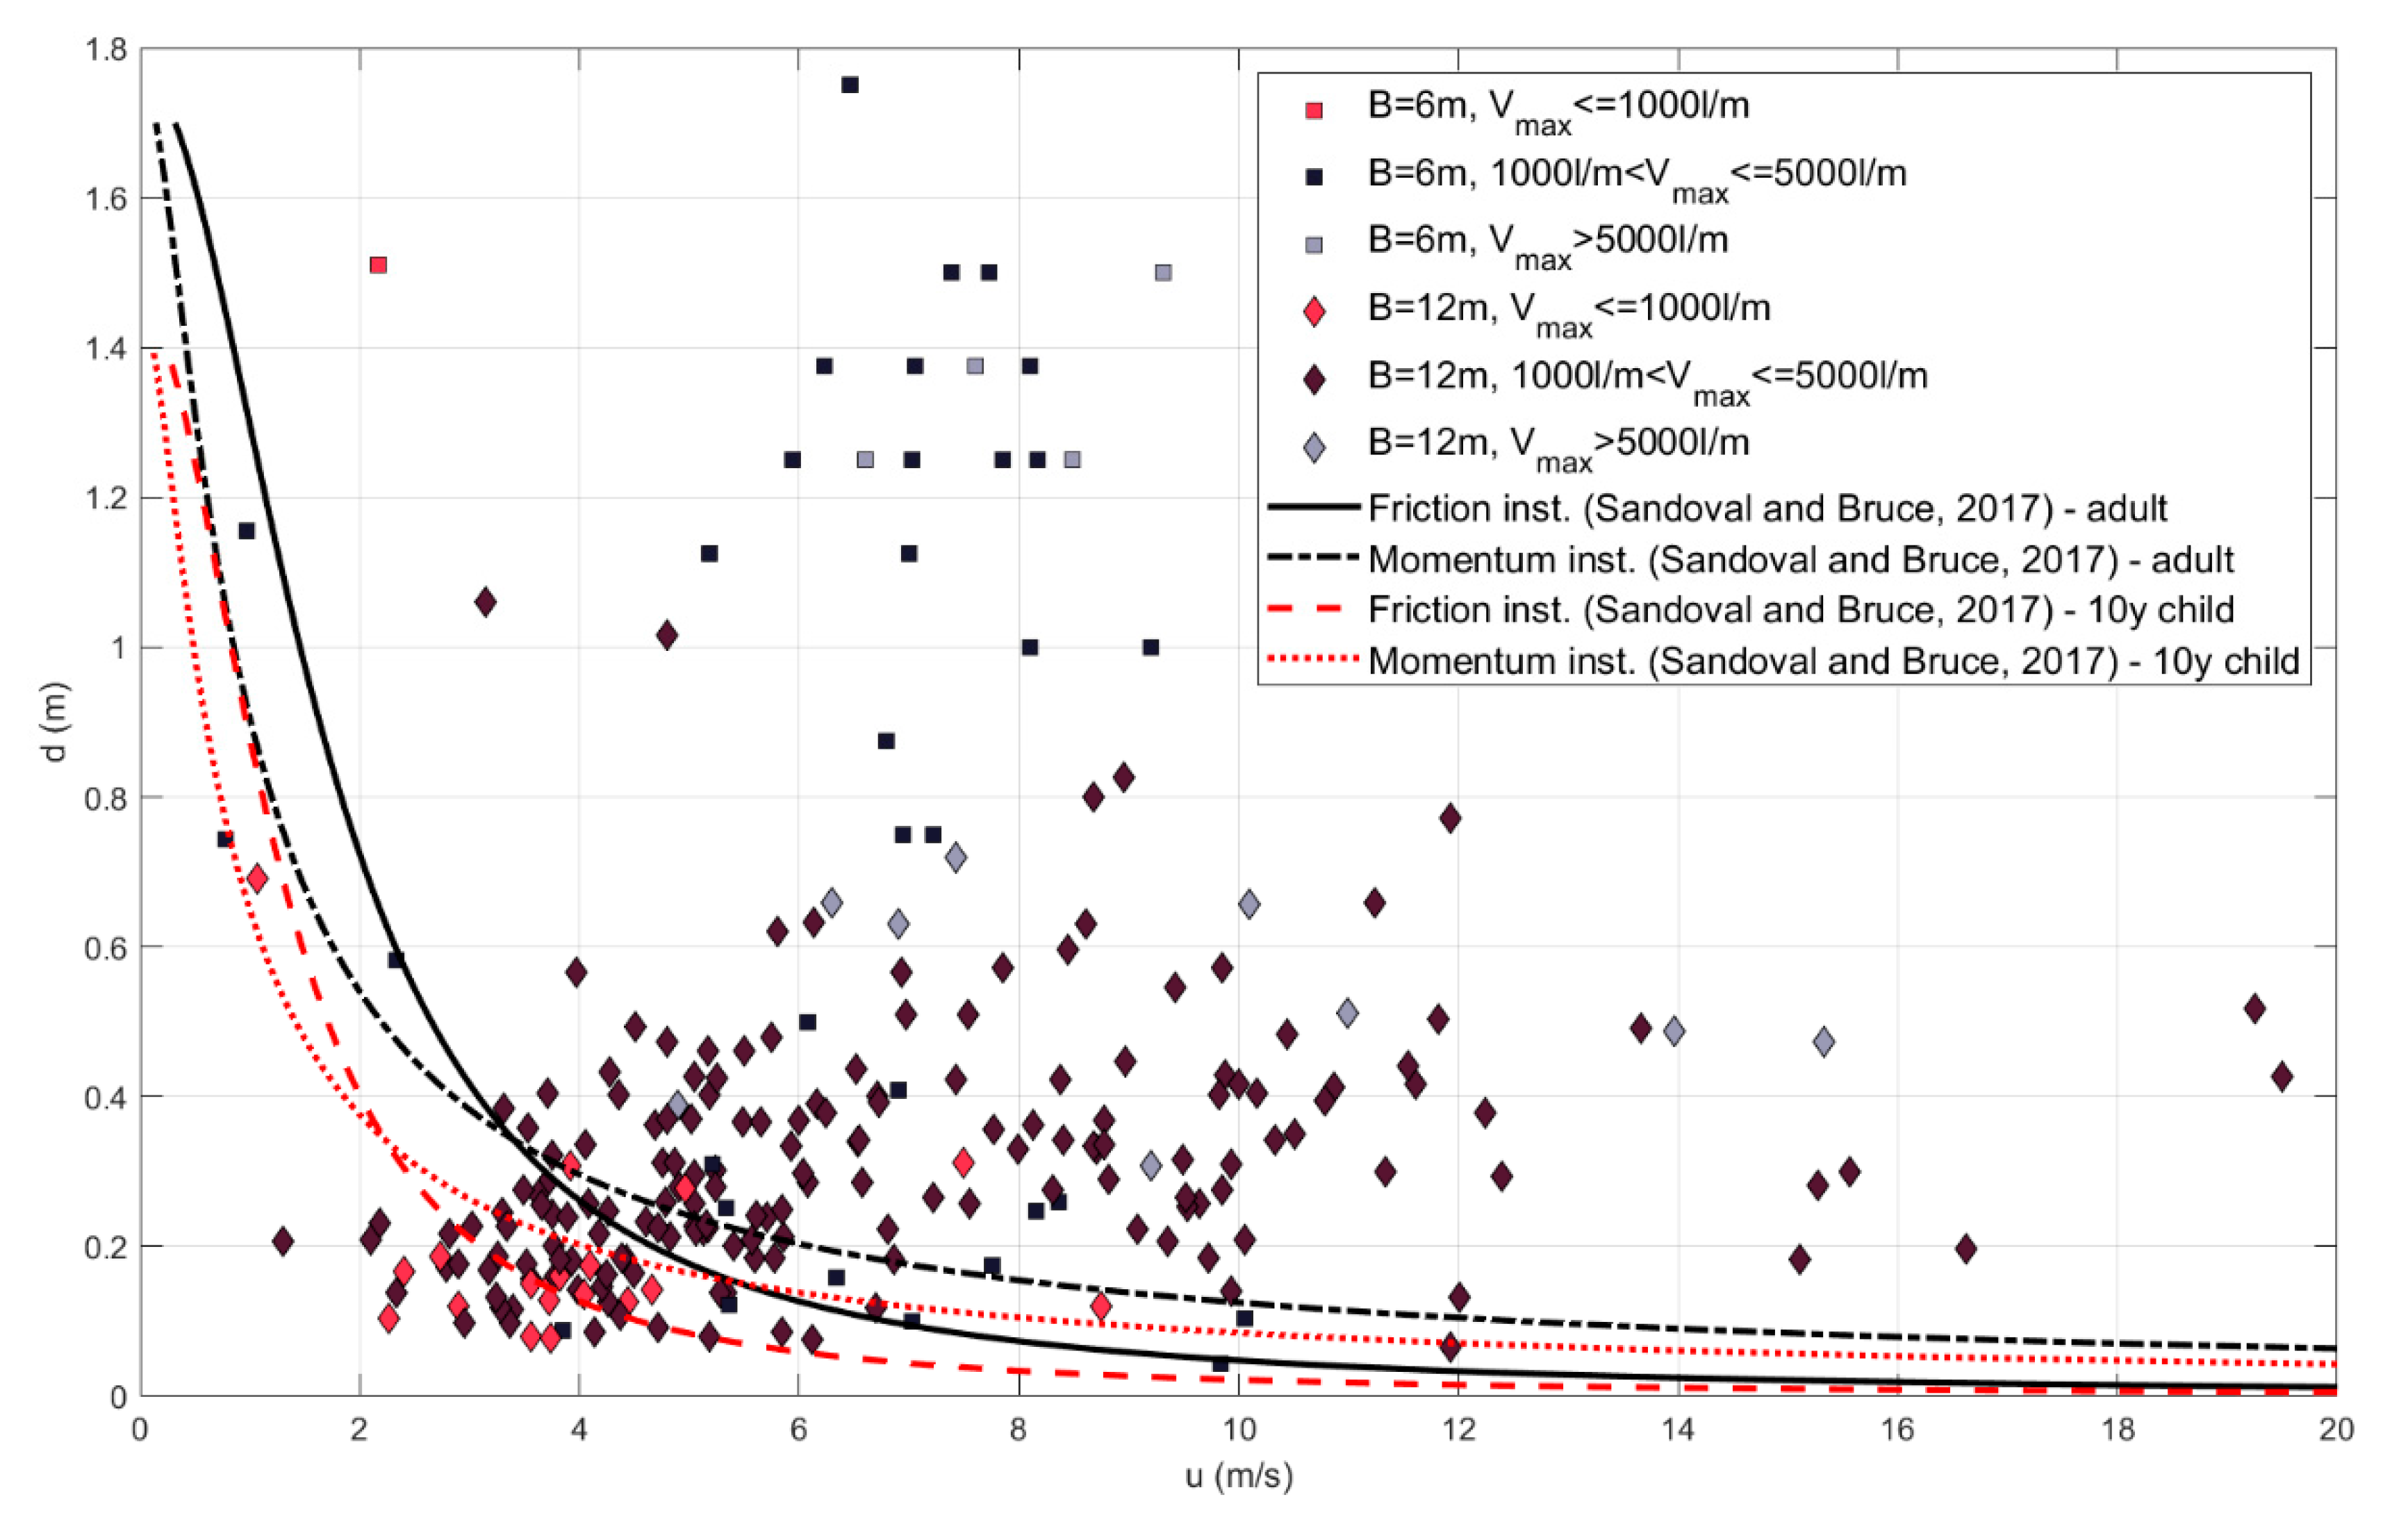
6] are not verified for this particular case. However, a deeper look at overtopping flow properties leads to different conclusions. The safety conditions are evaluated through the stability curves proposed by Sandoval and Bruce [
12] and Arrighi et al. [
14]. The results are plotted in
Figure 19 and
Figure 20, respectively. Data are categorized in terms of crest width and mean overtopping discharges, based on [
6] (q < 5; 5 < q < 15; q > 15 L/s/m). Moreover,
Figure 21 and
Figure 22 show the same comparison but data are gathered in three different groups depending on the maximum individual overtopping volume (V
max < 1,000; 1,000 < V
max < 5000; V
max > 5000 L/m). Stability curves calculated for a male adult person and a 10 year old child are plotted in
Figure 19 and
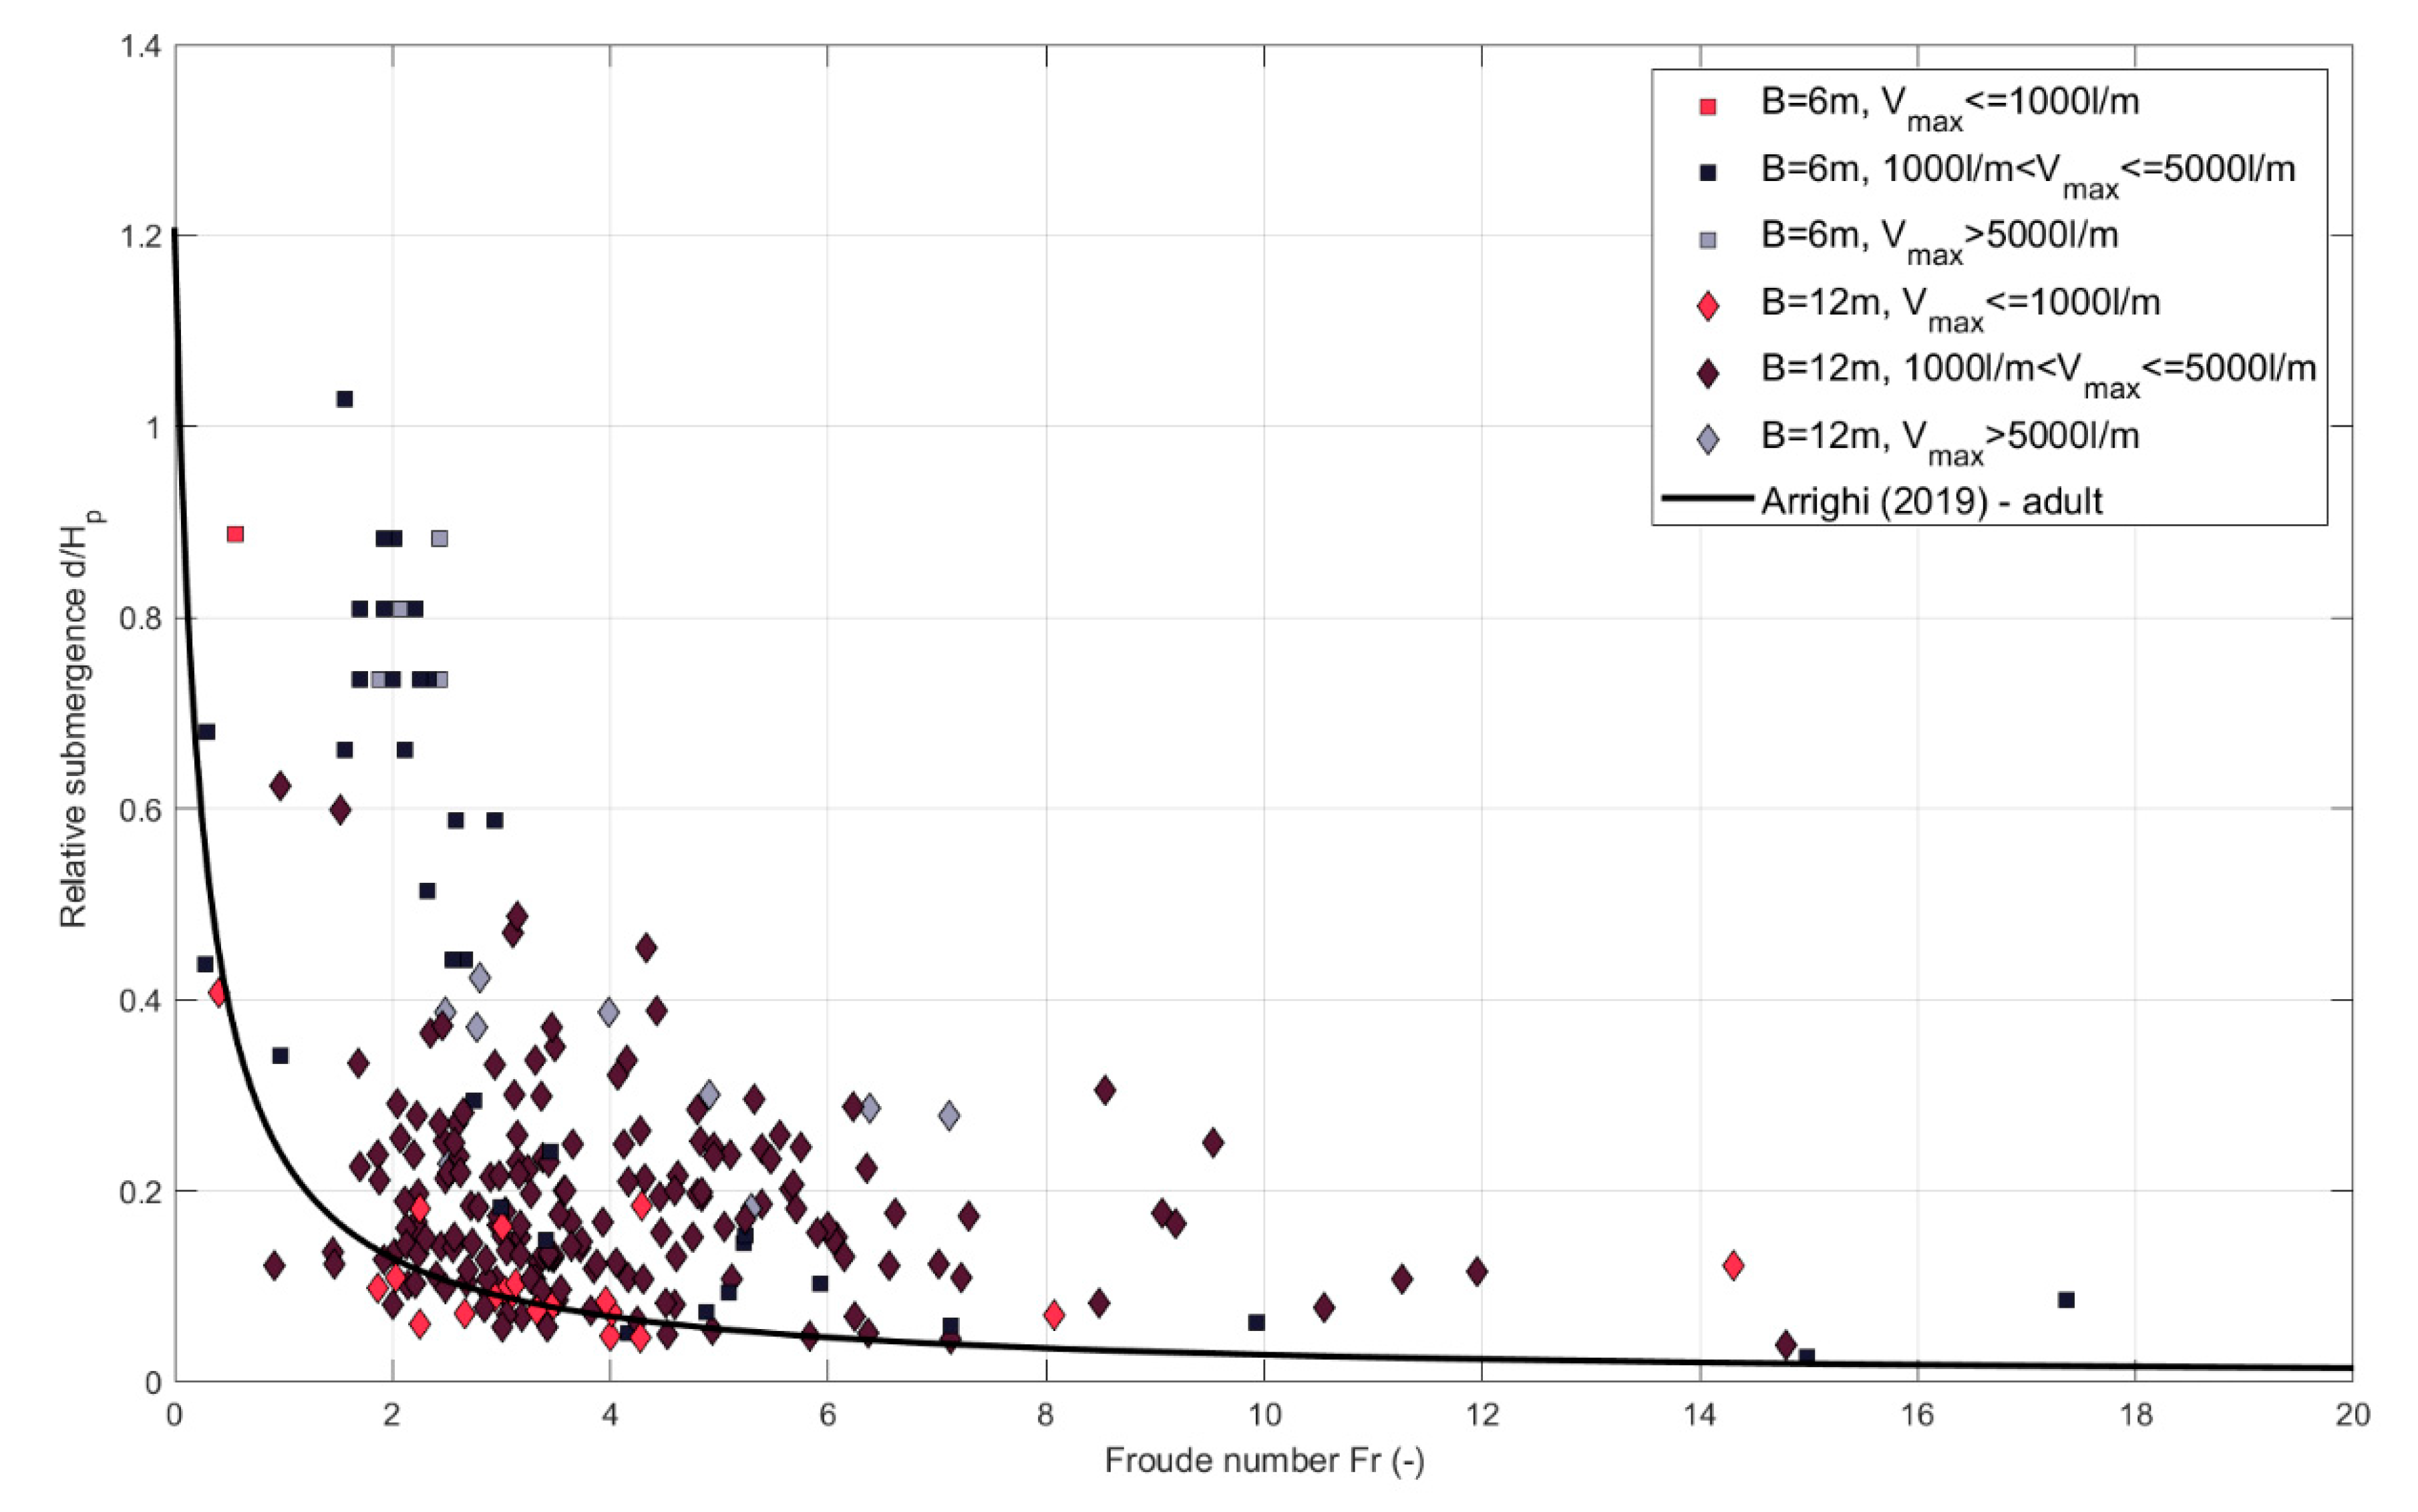
Figure 21, respectively. All data above the safety curves lie in an unsafe region, whereas all data below the lines correspond to safe flow conditions.
Looking at overtopping flow properties, it becomes clear that overtopping safety criteria based on mean discharge and maximum volume are not sufficient and might lead to overpredicting the hazards related to overtopping events. Although almost all cases present individual maximum volumes higher than 600 L/m, at least 20% of them can be considered safe if looking at combination of flow velocity and depth. The influence of the berm width is remarkable: for shorter berms, almost all cases with Vmax > 1,000 L/m fall within the unsafe region (above the curves in the figures), while the same volume can be not so critical for longer berms, for which the results are more scattered. Cases with Vmax > 1,000 L/m that lead to unsafe flows are those with mean discharge q > 5/L/s/m, apart from a few exceptions. In general, very high discharges and volumes, respectively greater than 10 L/s/m and 5000 L/m, lead to unsafe flows for both considered promenade widths.
The results show that the design of costal defenses must fulfil certain conditions that aim to guarantee the safety of people on or behind coastal defenses. These conditions cannot be reduced to the overtopping assessment of mean discharges and maximum volumes. Assessment of overtopping flow velocity and flow depth is required, in order to upgrade the current design criteria. To evaluate the flow velocity and depth associated to the maximum overtopping event is not an easy task and any semi-empirical model that can be derived would be limited to specific hydrodynamic conditions and geometrical layouts. Instead, experimental or, as an alternative, numerical modelling provide a further insight into the processes occurring on the dike crest.
7. Conclusions
In this study, 243 physical model tests of wave overtopping on smooth sea dike in very and extremely shallow water conditions have been carried out in the CIEMito wave flume at LIM/UPC. Two different foreshore slopes have been tested, 1:15 and 1:30, respectively. The dike has a crest or promenade at the end of which the velocity and flow depth are measured. Overtopping volumes are collected right after the promenade. The experimental campaign aimed at modelling sea states that characterize an urbanized stretch of a town along the Catalan coast located a few kilometers north of Barcelona, where a promenade/bike path and a railway running along the coastline are exposed to significant overtopping waves every stormy season.
Overtopping flow properties were measured by means of a redundant system that consists of two ultrasonic sensors and two high-speed cameras. Velocity and depth of the maximum overtopping event characterizing each test were measured. They proved to be dependent on the associated individual volume, crest freeboard and promenade width; however, correlation is weak, especially for the steeper foreshore cases. No clear correlation with mean discharge is found.
Two different methods to evaluate people safety have been used: tolerable limits for mean discharges and volumes, as proposed in [
6] from one side, and the vulnerability of pedestrians expressed as a critical combination of flow velocity and depth [
12,
13,
14]. The outcomes of the two criteria have been compared and discussed.
The results of the experimental campaign are specific for the studied area. It must be considered that all experimental tests have been conducted for the worst-case scenario of smooth dike, where, instead, the actual dike presents a rough and permeable seaward slope. The first evidence emerging from the study is related to the role of the foreshore on the overtopping flows and coastal safety. A gentle foreshore induces intense wave breaking which dissipates part of the incoming wave energy. On gentle foreshores (e.g., 1:30), a bore-type wave develops that will run on the dike and crest with small splashes and relatively small flow depths. When the foreshore is steeper (i.e., 1:15), the waves partly break on the dike (especially for local water depths of 1 m), leading to splashing flows which are very irregular and turbulent that generate, especially for narrow promenades, very high flow depths.
Critical range of deep-water wave height is 3.6–4.5 m with periods larger than 11.8 s. For these conditions, the most dangerous combinations of overtopping flow velocity and thickness is achieved, also related to very large individual overtopping volumes. In the studied area, there are stretches where nourishment is no longer carried out. However, the outcomes of this study show that, especially when a relative narrow promenade is present, a soft protection-like nourishment would be advisable, attaining a higher level of protection by means of more gentle and shallow foreshore slopes.
Besides specific considerations for the studied area, some general conclusions can be drawn:
Concluding, the experimental campaign suggests that further research is needed in terms of design criteria for wave overtopping, if related to people’s safety. The proposed tolerable discharge and volume values from [
6] are still valid, but not sufficient to clearly identify a safe or unsafe scenario. Overtopping flow depth and velocity provide further insight and are advised to be employed, together with [
6]’s criteria, for coastal safety assessment.
Author Contributions
Conceptualization, C.A. and X.G.; methodology, C.A.; validation, C.A., T.S.; formal analysis, C.A., G.V. and A.S.; investigation, C.A., T.S.; resources, X.G.; data curation, C.A.; writing—original draft preparation, C.A.; writing—review and editing, C.A, X.G., T.S., G.V., A.S.; supervision, X.G., G.V.; project administration, C.A.; funding acquisition, X.G. All authors have read and agreed to the published version of the manuscript.
Funding
This research was funded by European Union’s Horizon 2020 research and innovation programme under the Marie Sklodowska-Curie grant agreement No.: 792370.
Acknowledgments
The authors would like to acknowledge the students Mauro Campagnola and Maria Luigia Robustelli, who carried out the experimental campaign under the guidance and supervision of C.A, and the technical/research staff of LIM/UPC, in particular Joaquim Sospedra, Oscar Galego and José M. Alsina for their support and assistance for the model constructions and setup of measurement systems.
Conflicts of Interest
The authors declare no conflict of interest.
Disclaimer
The presented results reflect only the authors’ view and Research Executive Agency (REA) is not responsible for any use that may be made of the information it contains.
References
- Owen, M.W. Design of Seawalls Allowing for Wave Overtopping; Report No. EX 924; Hydraulics Research: Wallingford, UK, 1980. [Google Scholar]
- Bruce, T.; Van Der Meer, J.; Franco, L.; Pearson, J. Overtopping performance of different armour units for rubble mound breakwaters. Coast. Eng. 2009, 56, 166–179. [Google Scholar] [CrossRef]
- Van Der Meer, J.; Bruce, T. New Physical Insights and Design Formulas on Wave Overtopping at Sloping and Vertical Structures. J. Waterw. Port Coast. Ocean Eng. 2014, 140, 04014025. [Google Scholar] [CrossRef]
- Van Gent, M.R.A. Physical Model Investigations on Coastal Structures with Shallow Foreshores: 2D Model Tests with Single and Double-Peaked Wave Energy Spectra; Deltares (WL): Delft, The Netherlands, 1999. [Google Scholar]
- Allsop, N.W.H.; Bruce, T.; Pullen, T.; van der Meer, J. Direct Hazards from Wave Overtopping—The Forgotten Aspect of Coastal Flood Risk Assessment? In Proceedings of the 43rd Defra Flood and Coastal Management Conference, Manchester University, Manchester, UK, 1–3 July 2008; pp. 1–11. [Google Scholar]
- Van der Meer, J.W.; Allsop, N.W.H.; Bruce, T.; De Rouck, J.; Kortenhaus, A.; Pullen, T.; Schüttrumpf, H. EurOtop: Manual on Wave Overtopping of Sea Defences and Related Structures: An Overtopping Manual Largely Based on European Research, but for Worldwide Application. 2018. Available online: www.overtopping-manual.com (accessed on 16 June 2020).
- Cappietti, L.; Simonetti, I.; Esposito, A.; Streicher, M.; Kortenhaus, A.; Scheres, B.; Schuettrumpf, H.; Hirt, M.; Hofland, B.; Chen, X. Large-Scale Experiments of Wave-Overtopping Loads on Walls: Layer Thicknesses and Velocities. In Proceedings of the ASME 2018 37th International Conference on Ocean, Offshore and Arctic Engineering, Madrid, Spain, 17–22 June 2018; Volume 7. [Google Scholar] [CrossRef]
- Schüttrumpf, H.; Oumeraci, H. Scale and Model Effects in Crest Level Design. In Proceedings of the 2nd Coastal Symposium, Höfn, Iceland, 5–8 June 2005; pp. 1–12. [Google Scholar]
- Nørgaard, J.Q.H.; Andersen, T.L.; Burcharth, H.F.; Steendam, G.J. Analysis of overtopping flow on sea dikes in oblique and short-crested waves. Coast. Eng. 2013, 76, 43–54. [Google Scholar] [CrossRef]
- Mares-Nasarre, P.; Argente, G.; Gómez-Martín, M.E.; Medina, J.R. Overtopping layer thickness and overtopping flow velocity on mound breakwaters. Coast. Eng. 2019, 154, 103561. [Google Scholar] [CrossRef]
- Endoh, K.; Takahashi, S. Numerically Modeling Personnel Danger on a Promenade Breakwater Due to Overtopping Waves. Coast. Eng. 1994, 1016–1029. [Google Scholar] [CrossRef]
- Sandoval, C.; Bruce, T. Wave Overtopping Hazard to Pedestrians: Video Evidence from Real Accidents. In Coasts, Marine Structures and Breakwaters 2017; Thomas Telford Ltd.: Liverpool, UK, 2018; pp. 501–512. [Google Scholar]
- Arrighi, C.; Pregnolato, M.; Dawson, R.; Castelli, F. Preparedness against mobility disruption by floods. Sci. Total Environ. 2018, 654, 1010–1022. [Google Scholar] [CrossRef]
- Arrighi, C.; Oumeraci, H.; Castelli, F. Hydrodynamics of pedestrians’ instability in floodwaters. Hydrol. Earth Syst. Sci. 2017, 21, 515–531. [Google Scholar] [CrossRef]
- Altomare, C.; Suzuki, T.; Chen, X.; Verwaest, T.; Kortenhaus, A. Wave overtopping of sea dikes with very shallow foreshores. Coast. Eng. 2016, 116, 236–257. [Google Scholar] [CrossRef]
- Van Doorslaer, K.; De Rouck, J.; Audenaert, S.; Duquet, V. Crest modifications to reduce wave overtopping of non-breaking waves over a smooth dike slope. Coast. Eng. 2015, 101, 69–88. [Google Scholar] [CrossRef]
- Bruce, T.; Van Der Meer, J.; Pullen, T.; Allsop, W.; Kim, Y.C. Wave Overtopping at Vertical and Steep Structures. In Handbook of Coastal and Ocean Engineering; California State University: Long Beach, CA, USA, 2009; pp. 411–439. [Google Scholar]
- Gallach Sanchez, D. Experimental Study of Wave Overtopping Performance of Steep Low-Crested Structures. Ph.D. Thesis, Ghent University, Belgium, The Netherlands, 2018. [Google Scholar]
- Victor, L.; Troch, P. Wave Overtopping at Smooth Impermeable Steep Slopes with Low Crest Freeboards. J. Waterw. Port Coast. Ocean Eng. 2012, 138, 372–385. [Google Scholar] [CrossRef]
- Mase, H.; Tamada, T.; Yasuda, T.; Hedges, T.S.; Reis, M.T. Wave Runup and Overtopping at Seawalls Built on Land and in Very Shallow Water. J. Waterw. Port Coast. Ocean Eng. 2013, 139, 346–357. [Google Scholar] [CrossRef]
- Goda, Y. Derivation of unified wave overtopping formulas for seawalls with smooth, impermeable surfaces based on selected CLASH datasets. Coast. Eng. 2009, 56, 385–399. [Google Scholar] [CrossRef]
- Hofland, B.; Chen, X.; Altomare, C.; Oosterlo, P. Prediction formula for the spectral wave period T m-1,0 on mildly sloping shallow foreshores. Coast. Eng. 2017, 123, 21–28. [Google Scholar] [CrossRef]
- Schüttrumpf, H.; Oumeraci, H. Layer thicknesses and velocities of wave overtopping flow at seadikes. Coast. Eng. 2005, 52, 473–495. [Google Scholar] [CrossRef]
- Hughes, S.A. Hydraulic Parameters of Overtopping Wave Volumes. In Coastal Structures and Solutions to Coastal Disasters; American Society of Civil Engineers: Reston, VA, USA, 2015; p. 15. [Google Scholar]
- Van Bergeijk, V.; Warmink, J.; Van Gent, M.R.; Hulscher, S.J.M.H. An analytical model of wave overtopping flow velocities on dike crests and landward slopes. Coast. Eng. 2019, 149, 28–38. [Google Scholar] [CrossRef]
- Schüttrumpf, H.; Möller, J.; Oumeraci, H.; Smith, J.M. Overtopping Flow Parameters on the Inner Slope of Seadikes. In Coastal Engineering; World Scientific: Cardiff, Wales, 2002; pp. 2116–2127. [Google Scholar] [CrossRef]
- Trung, L.H. Velocity and Water-Layer Thickness of Overtopping Flows on Sea Dikes. In Communications on Hydraulic and Geotechnical Engineering 2014-02; Delft University of Technology: Delft, The Netherlands, 2014; ISSN 0169-6548. [Google Scholar]
- Hughes, S.A. Wave momentum flux parameter: A descriptor for nearshore waves. Coast. Eng. 2004, 51, 1067–1084. [Google Scholar] [CrossRef]
- Hansen, N.-E.O.; Sand, S.E.; Lundgren, H.; Sorensen, T.; Gravesen, H. Correct Reproduction of Group-Induced Long Waves. In Coastal Engineering; ASCE: Sydney, Australia, 1980; pp. 784–800. [Google Scholar]
- Heller, V. Scale effects in physical hydraulic engineering models. J. Hydraul. Res. 2011, 49, 293–306. [Google Scholar] [CrossRef]
- Formentin, S.M.; Zanuttigh, B.; Van Der Meer, J.W.; Van Der Meer, J.W. A Neural Network Tool for Predicting Wave Reflection, Overtopping and Transmission. Coast. Eng. J. 2017, 59, 1750006–1750031. [Google Scholar] [CrossRef]
- Schüttrumpf, H.; Van Gent, M.R. Wave Overtopping at Sea Dikes. In Coastal Structures 2003; American Society of Civil Engineers: Portland, OR, USA, 2003; pp. 431–443. [Google Scholar]
- Giustolisi, O.; Savic, D. A symbolic data-driven technique based on evolutionary polynomial regression. J. Hydroinform. 2006, 8, 207–222. [Google Scholar] [CrossRef]
- Altomare, C.; Gironella, X.; Laucelli, D.B. Evolutionary data-modelling of an innovative low reflective vertical quay. J. Hydroinform. 2012, 15, 763–779. [Google Scholar] [CrossRef]
- Altomare, C.; Gironella, X. An experimental study on scale effects in wave reflection of low-reflective quay walls with internal rubble mound for regular and random waves. Coast. Eng. 2014, 90, 51–63. [Google Scholar] [CrossRef]
Figure 1.
Scheme of overtopping flow on a sea dike.
Figure 1.
Scheme of overtopping flow on a sea dike.
Figure 2.
Territorial framework of the study case (source: Google Maps).
Figure 2.
Territorial framework of the study case (source: Google Maps).
Figure 3.
Photographs representing the current state of the study area.
Figure 3.
Photographs representing the current state of the study area.
Figure 4.
Bathymetry extracted from the LIM/UPC drone survey (left plot) and resulting profiles by merging existing data with the carried-out survey (right plot). A photo of the drone is in the small picture.
Figure 4.
Bathymetry extracted from the LIM/UPC drone survey (left plot) and resulting profiles by merging existing data with the carried-out survey (right plot). A photo of the drone is in the small picture.
Figure 5.
CIEMito wave flume—drawing of the longitudinal section (distorted). Dimensions are in model scale. The value of m is equal to 15 and 30, respectively. Accordingly, n assumes values of 8 and 5, respectively.
Figure 5.
CIEMito wave flume—drawing of the longitudinal section (distorted). Dimensions are in model scale. The value of m is equal to 15 and 30, respectively. Accordingly, n assumes values of 8 and 5, respectively.
Figure 6.
Example of simultaneous time series recorded by ultrasonic sensors.
Figure 6.
Example of simultaneous time series recorded by ultrasonic sensors.
Figure 7.
Lateral view with high-speed camera (CAM2).
Figure 7.
Lateral view with high-speed camera (CAM2).
Figure 8.
Correlation between overtopping flow depths measured with ultrasonic sensors and high-speed cameras.
Figure 8.
Correlation between overtopping flow depths measured with ultrasonic sensors and high-speed cameras.
Figure 9.
Example of wave spectrum for incident wave conditions at the dike toe (values in model scale).
Figure 9.
Example of wave spectrum for incident wave conditions at the dike toe (values in model scale).
Figure 10.
Variation of maximum individual overtopping volume with mean discharge (dimensions in prototype). Limits for safety of pedestrians and assets based on EurOtop (2018) are shown. The two vertical blue lines correspond to tolerable discharges of 10 L/s/m and 20 L/s/m respectively, for Hm0 = 1 m.
Figure 11.
Variation of overtopping flow velocity and depth with maximum individual overtopping volume (dimensions in prototype) for two different foreshore slopes.
Figure 11.
Variation of overtopping flow velocity and depth with maximum individual overtopping volume (dimensions in prototype) for two different foreshore slopes.
Figure 12.
Variation of overtopping layer velocity and depth with average overtopping discharge (dimensions in prototype) for two different foreshore slopes.
Figure 12.
Variation of overtopping layer velocity and depth with average overtopping discharge (dimensions in prototype) for two different foreshore slopes.
Figure 13.
Variation of overtopping layer velocity and depth with deep-water wave characteristics (dimensions in prototype) for two different foreshore slopes.
Figure 13.
Variation of overtopping layer velocity and depth with deep-water wave characteristics (dimensions in prototype) for two different foreshore slopes.
Figure 14.
Variation of dimensionless overtopping layer velocity and depth with dimensionless maximum individual overtopping volume for two different foreshore slopes.
Figure 14.
Variation of dimensionless overtopping layer velocity and depth with dimensionless maximum individual overtopping volume for two different foreshore slopes.
Figure 15.
Variation of dimensionless overtopping layer velocity and depth with dimensionless maximum individual overtopping volume for two different promenade width.
Figure 15.
Variation of dimensionless overtopping layer velocity and depth with dimensionless maximum individual overtopping volume for two different promenade width.
Figure 16.
Estimation of overtopping flow depth and velocity employing existing formulas from Schüttrumpf and Van Gent (2003), Trung (2014) and EurOtop (2018).
Figure 16.
Estimation of overtopping flow depth and velocity employing existing formulas from Schüttrumpf and Van Gent (2003), Trung (2014) and EurOtop (2018).
Figure 17.
Estimation of overtopping flow depth and velocity employing formulas by Hughes (2015).
Figure 17.
Estimation of overtopping flow depth and velocity employing formulas by Hughes (2015).
Figure 18.
EPR results for overtopping flow properties on the dike crest versus measured ones.
Figure 18.
EPR results for overtopping flow properties on the dike crest versus measured ones.
Figure 19.
Flow depth versus velocity, comparison with Sandoval and Bruce (2017) curves, the discharges are divided for different promenades and measured average discharge.
Figure 19.
Flow depth versus velocity, comparison with Sandoval and Bruce (2017) curves, the discharges are divided for different promenades and measured average discharge.
Figure 20.
Froude number versus relative submergence, comparison with Arrighi (2017) curve, the discharges are divided for different promenades and measured average discharge.
Figure 20.
Froude number versus relative submergence, comparison with Arrighi (2017) curve, the discharges are divided for different promenades and measured average discharge.
Figure 21.
Flow depth versus velocity, comparison with Sandoval and Bruce (2017) curves, the discharges are divided for different promenades and maximum volumes.
Figure 21.
Flow depth versus velocity, comparison with Sandoval and Bruce (2017) curves, the discharges are divided for different promenades and maximum volumes.
Figure 22.
Froude number versus relative submergence, comparison with Arrighi (2017) curve, the discharges are divided for different promenades and maximum volumes.
Figure 22.
Froude number versus relative submergence, comparison with Arrighi (2017) curve, the discharges are divided for different promenades and maximum volumes.
Table 1.
Tolerable overtopping limits for people proposed in EurOtop (2018).
Table 1.
Tolerable overtopping limits for people proposed in EurOtop (2018).
| Hazard Type and Reason | Mean Discharge, q (L/s/m) | Maximum Individual Volume Vmax (L/m) |
|---|
| People at structures with possible violent overtopping, mostly vertical structures | No access for any predicted overtopping | No access for any predicted overtopping |
| People at seawall/dike crest. Clear view of the sea. | - | - |
| Hm0 = 3 m | 0.3 | 600 |
| Hm0 = 2 m | 1 | 600 |
| Hm0 = 1 m | 10–20 | 600 |
| Hm0 < 0.5 m | No limit | No limit |
Table 2.
Geometric characteristics of the tested dike layout.
Table 2.
Geometric characteristics of the tested dike layout.
| Scale | htoe (m) | Rc (m) | Promenade Width (m) |
|---|
| Model | 0.009–0.019–0.024–0.029 | 0.81–0.071–0.066–0.061 | 0.12–0.24 |
| Prototype | 0.45–0.905–1.2–1.45 | 4.05–3.55–3.3–3.05 | 6–12 |
Table 3.
Location from paddle of resistive wave gauges (in meters).
Table 3.
Location from paddle of resistive wave gauges (in meters).
| Sensor | WG0 | WG1 | WG2 | WG3 | WG4 | WG6 | WG7 | WG5 |
|---|
| x (m = 15) | 2.8 | 2.96 | 3.15 | 3.40 | 3.69 | 7.20 | 8.20 | 9.20 |
| x (m = 30) | 2.8 | 2.96 | 3.15 | 3.40 | 3.69 | 7.20 | 8.20 | 9.20 |
© 2020 by the authors. Licensee MDPI, Basel, Switzerland. This article is an open access article distributed under the terms and conditions of the Creative Commons Attribution (CC BY) license (http://creativecommons.org/licenses/by/4.0/).

 ,
, 


