New Cost-Effective Technologies Applied to the Study of the Glacier Melting Influence on Physical and Biological Processes in Kongsfjorden Area (Svalbard)


 ,
, 
 ,
,  ,
,  and
and
Abstract
:1. Introduction
2. Materials and Methods
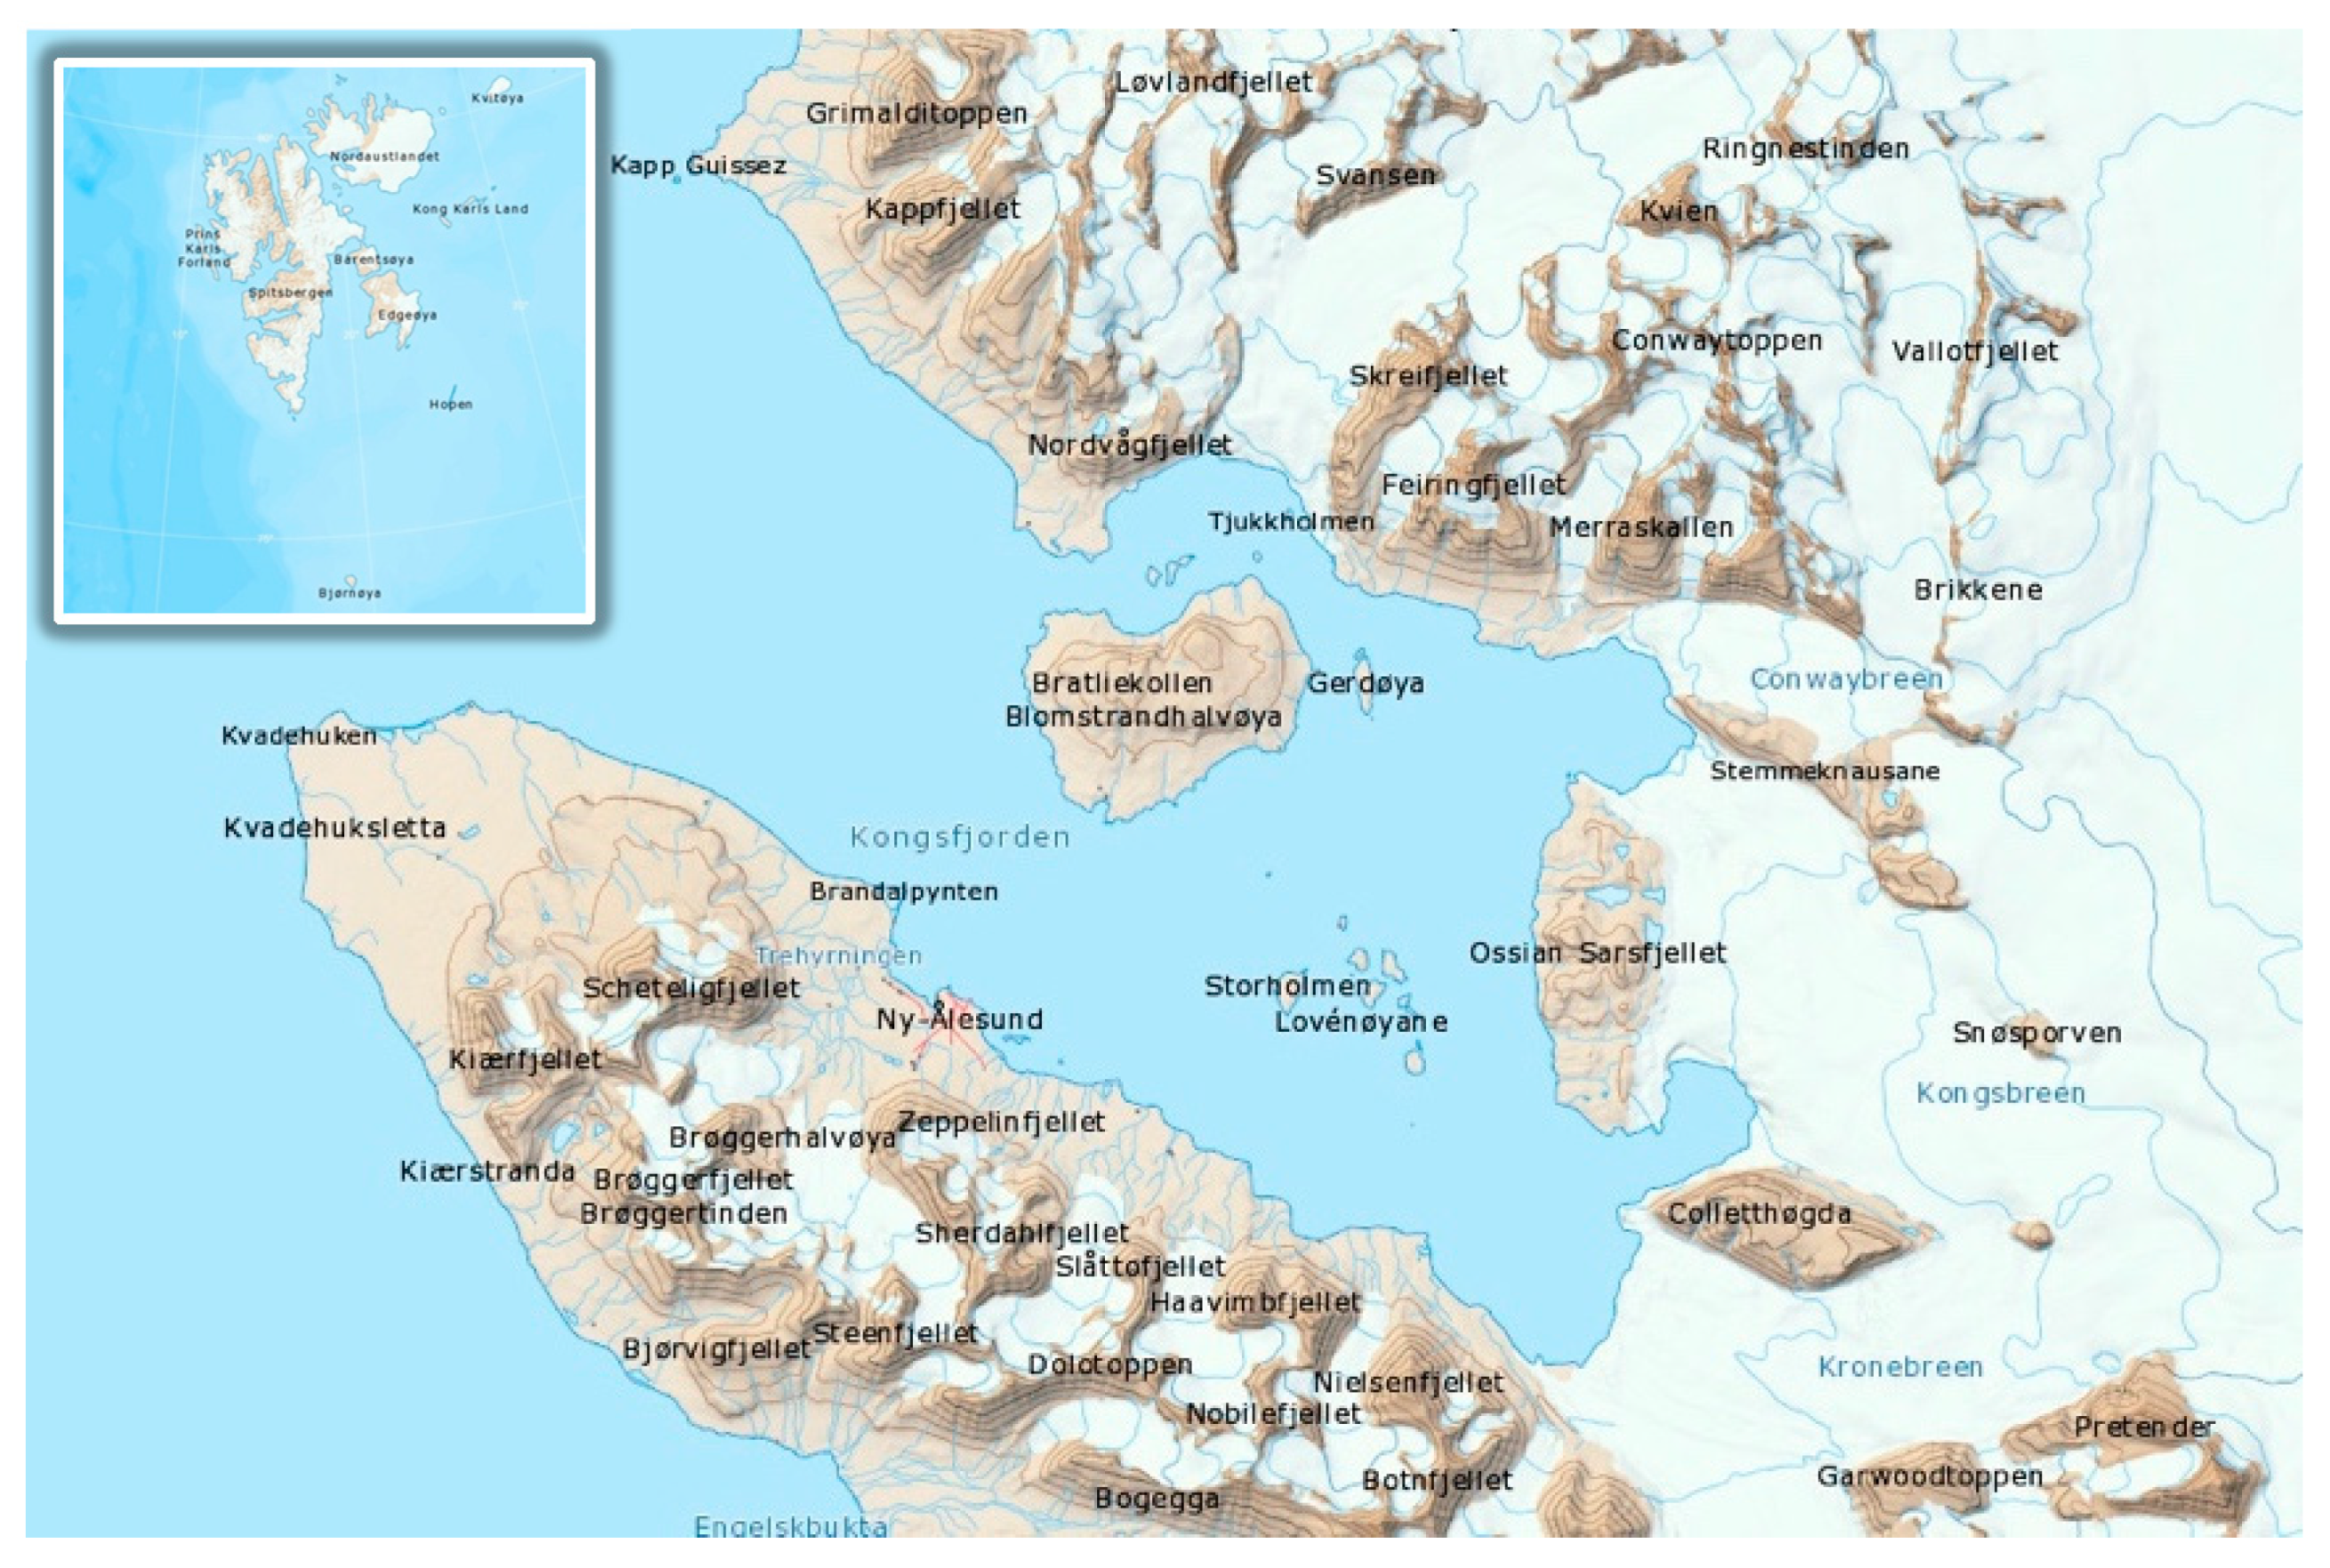
2.1. Study Area
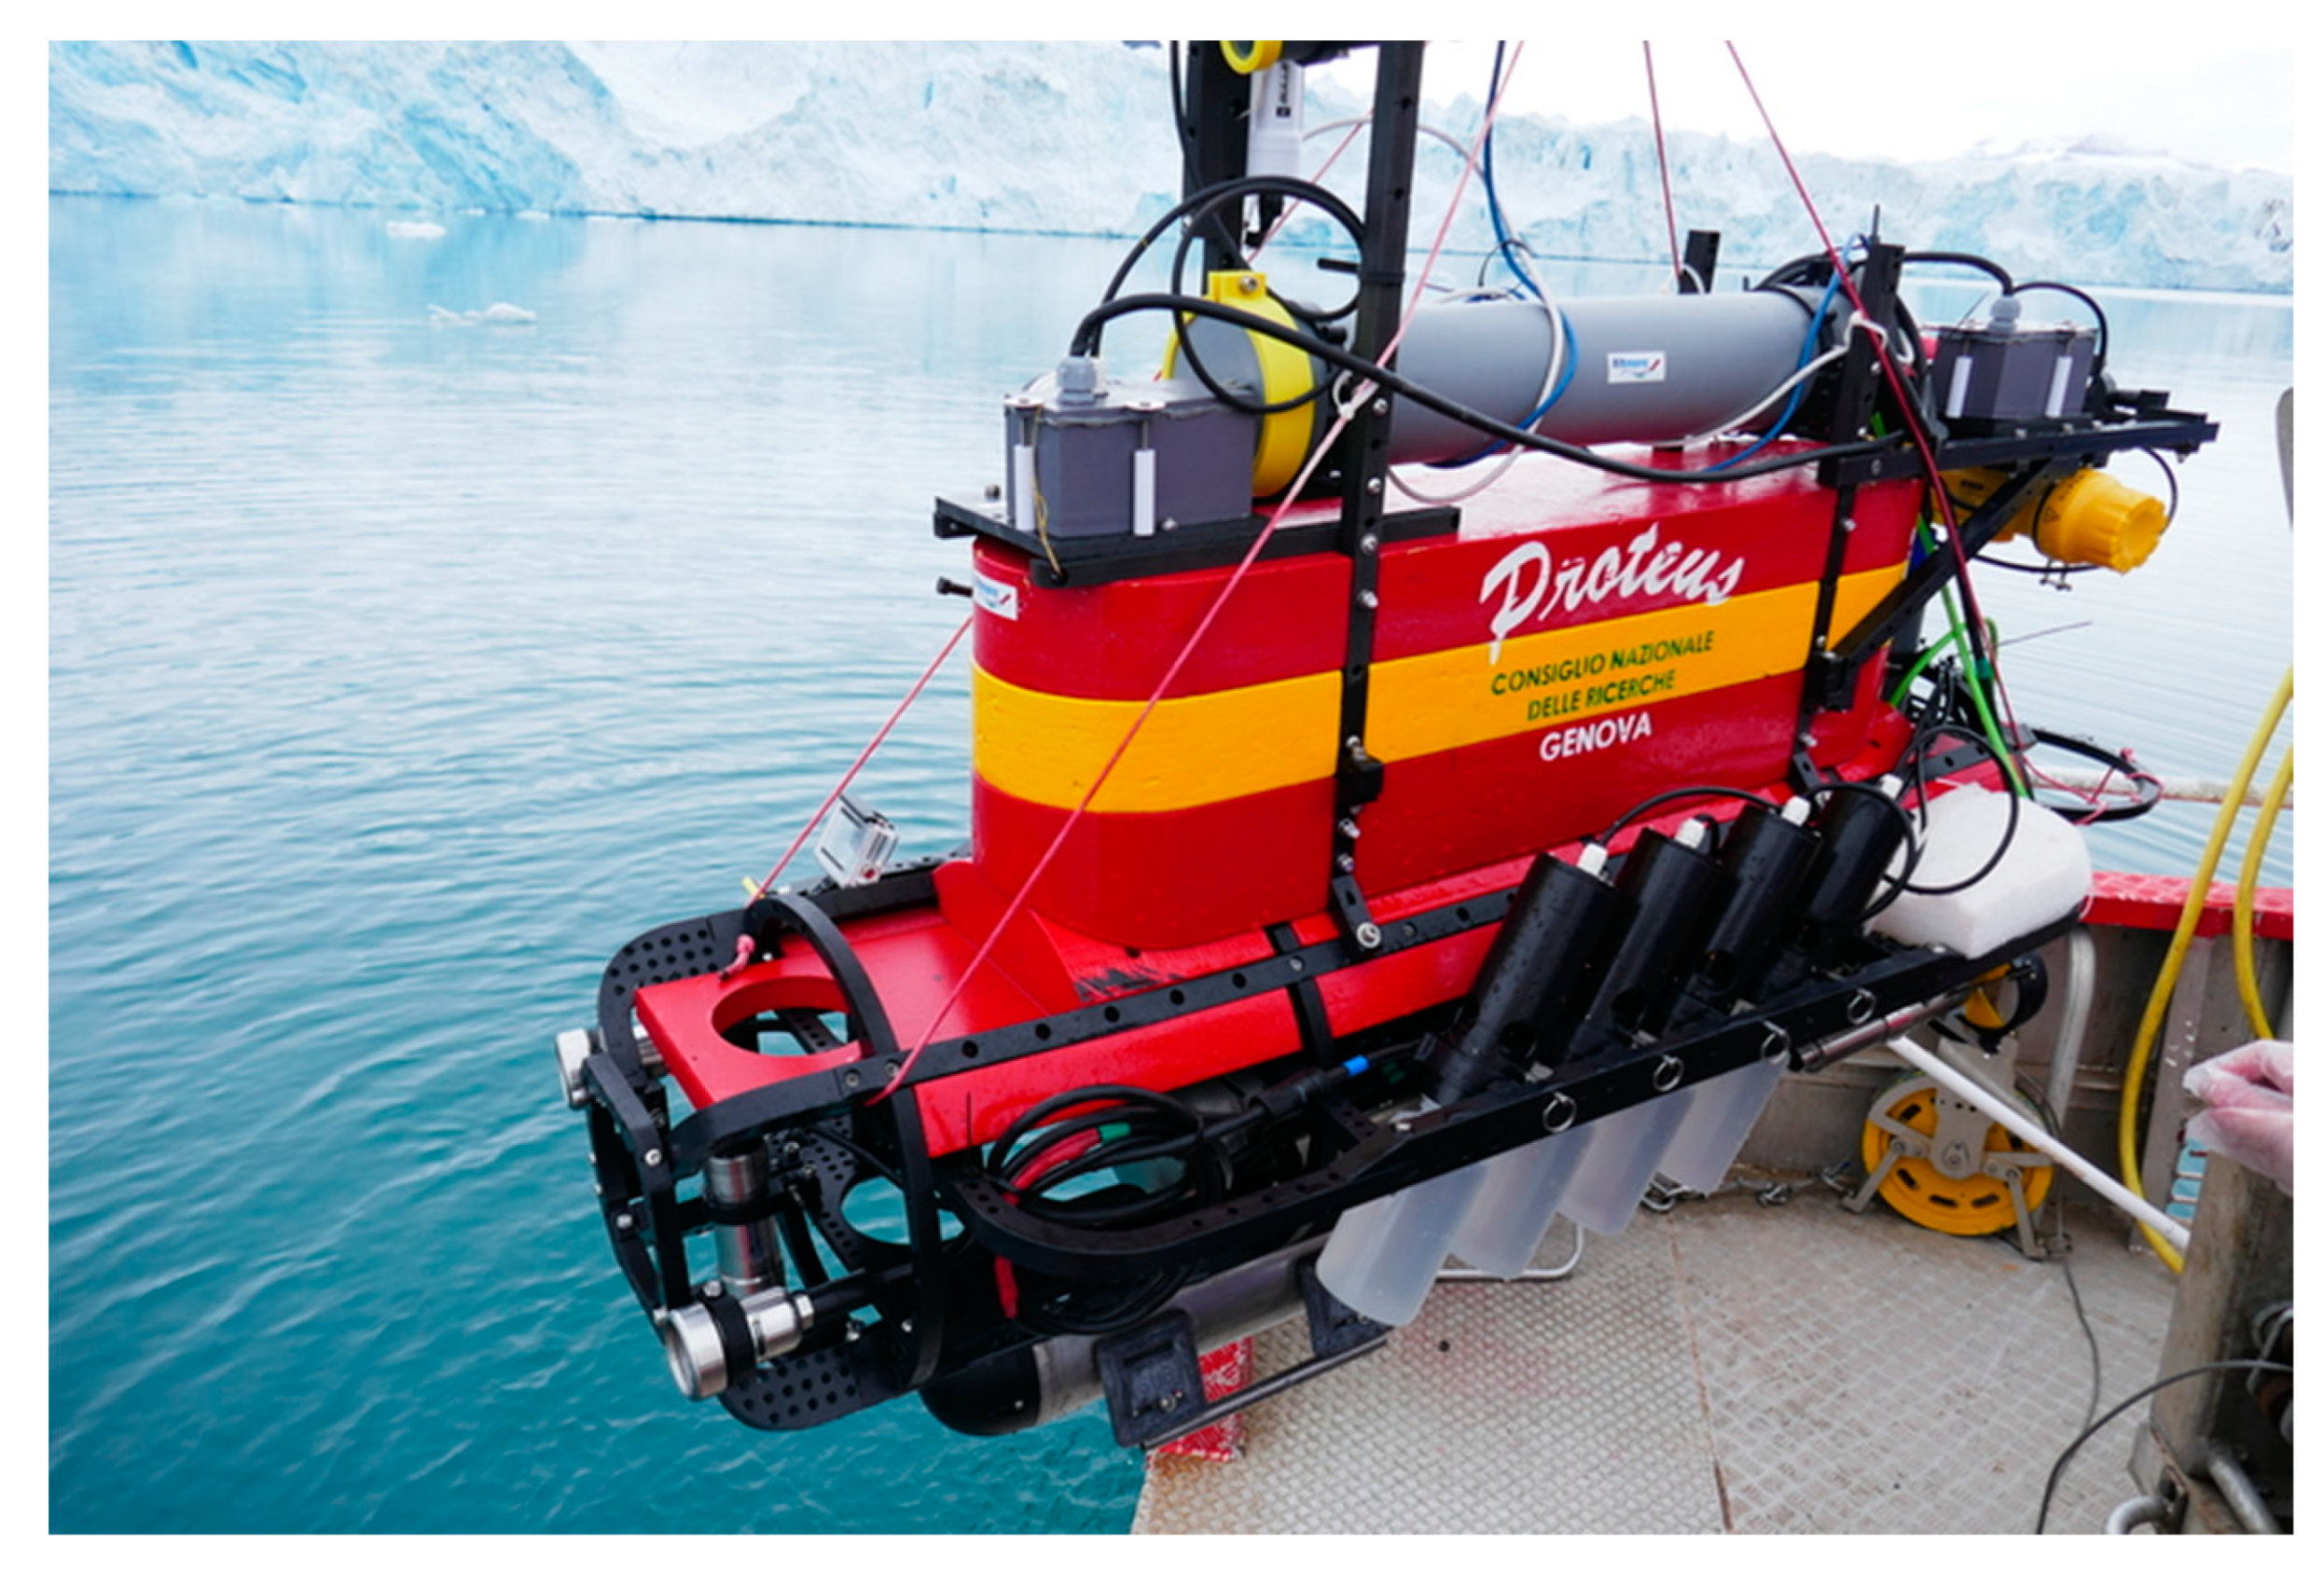
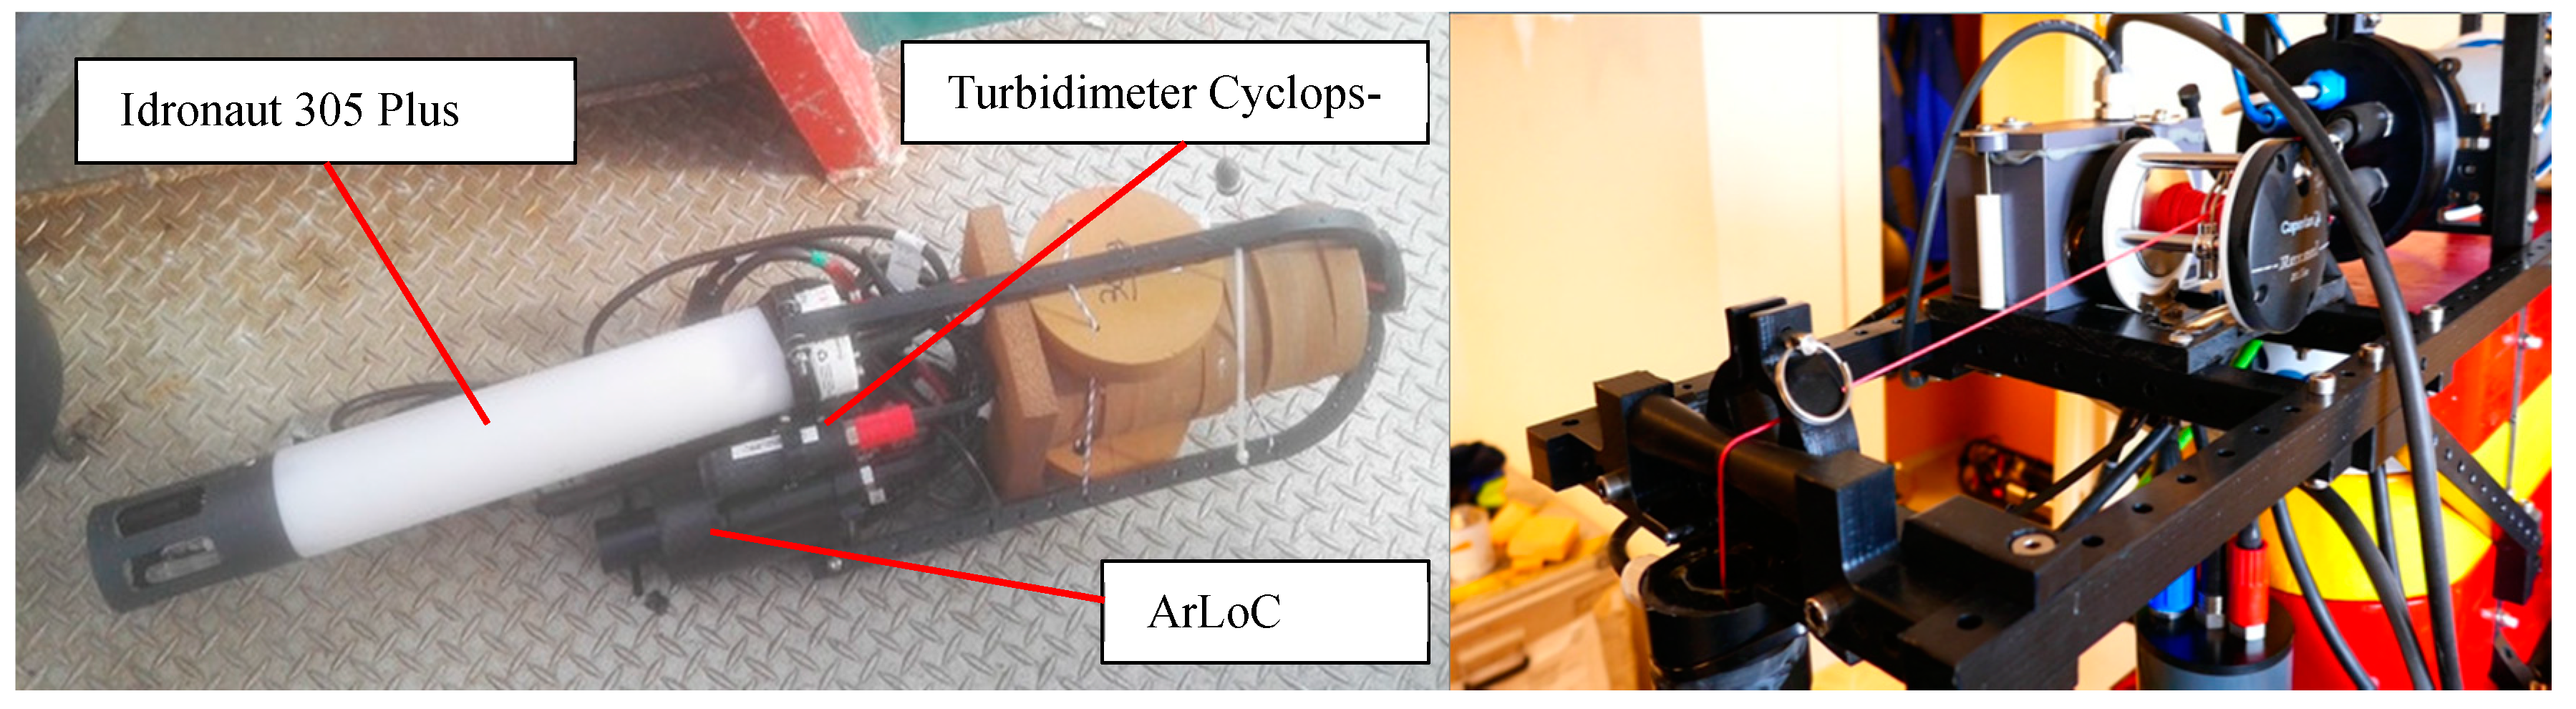
2.2. Survey Strategy
3. Results
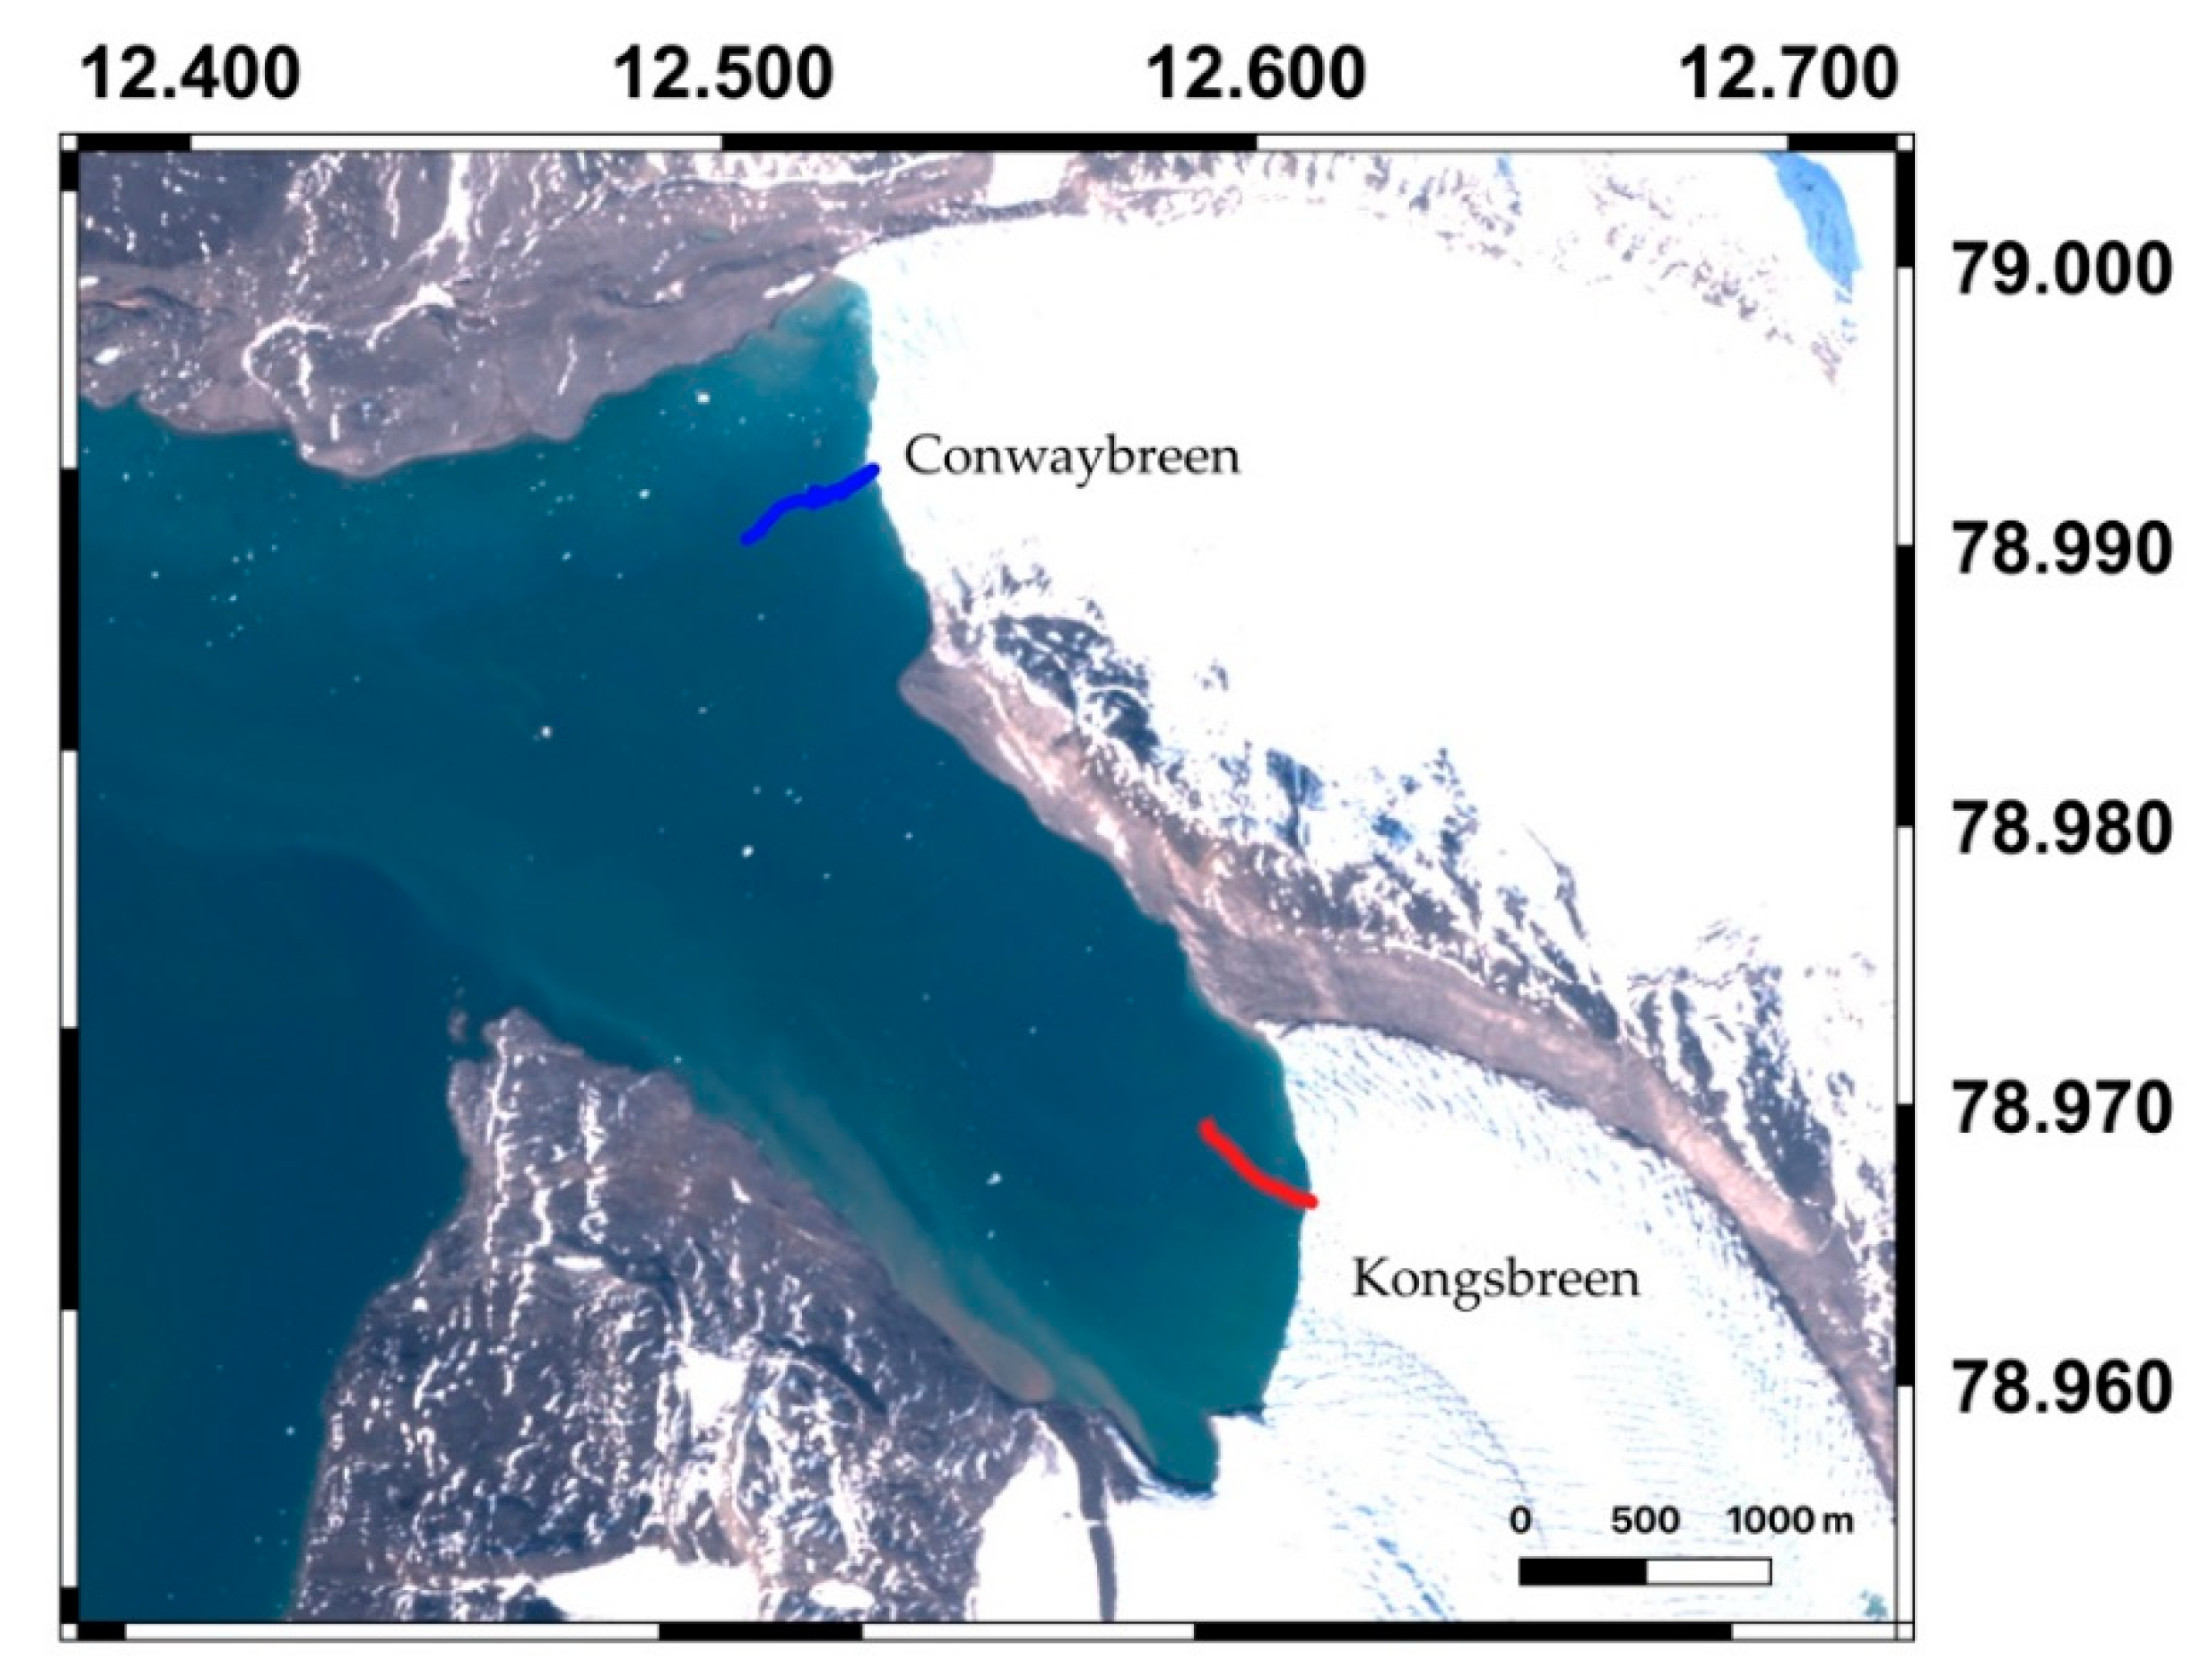
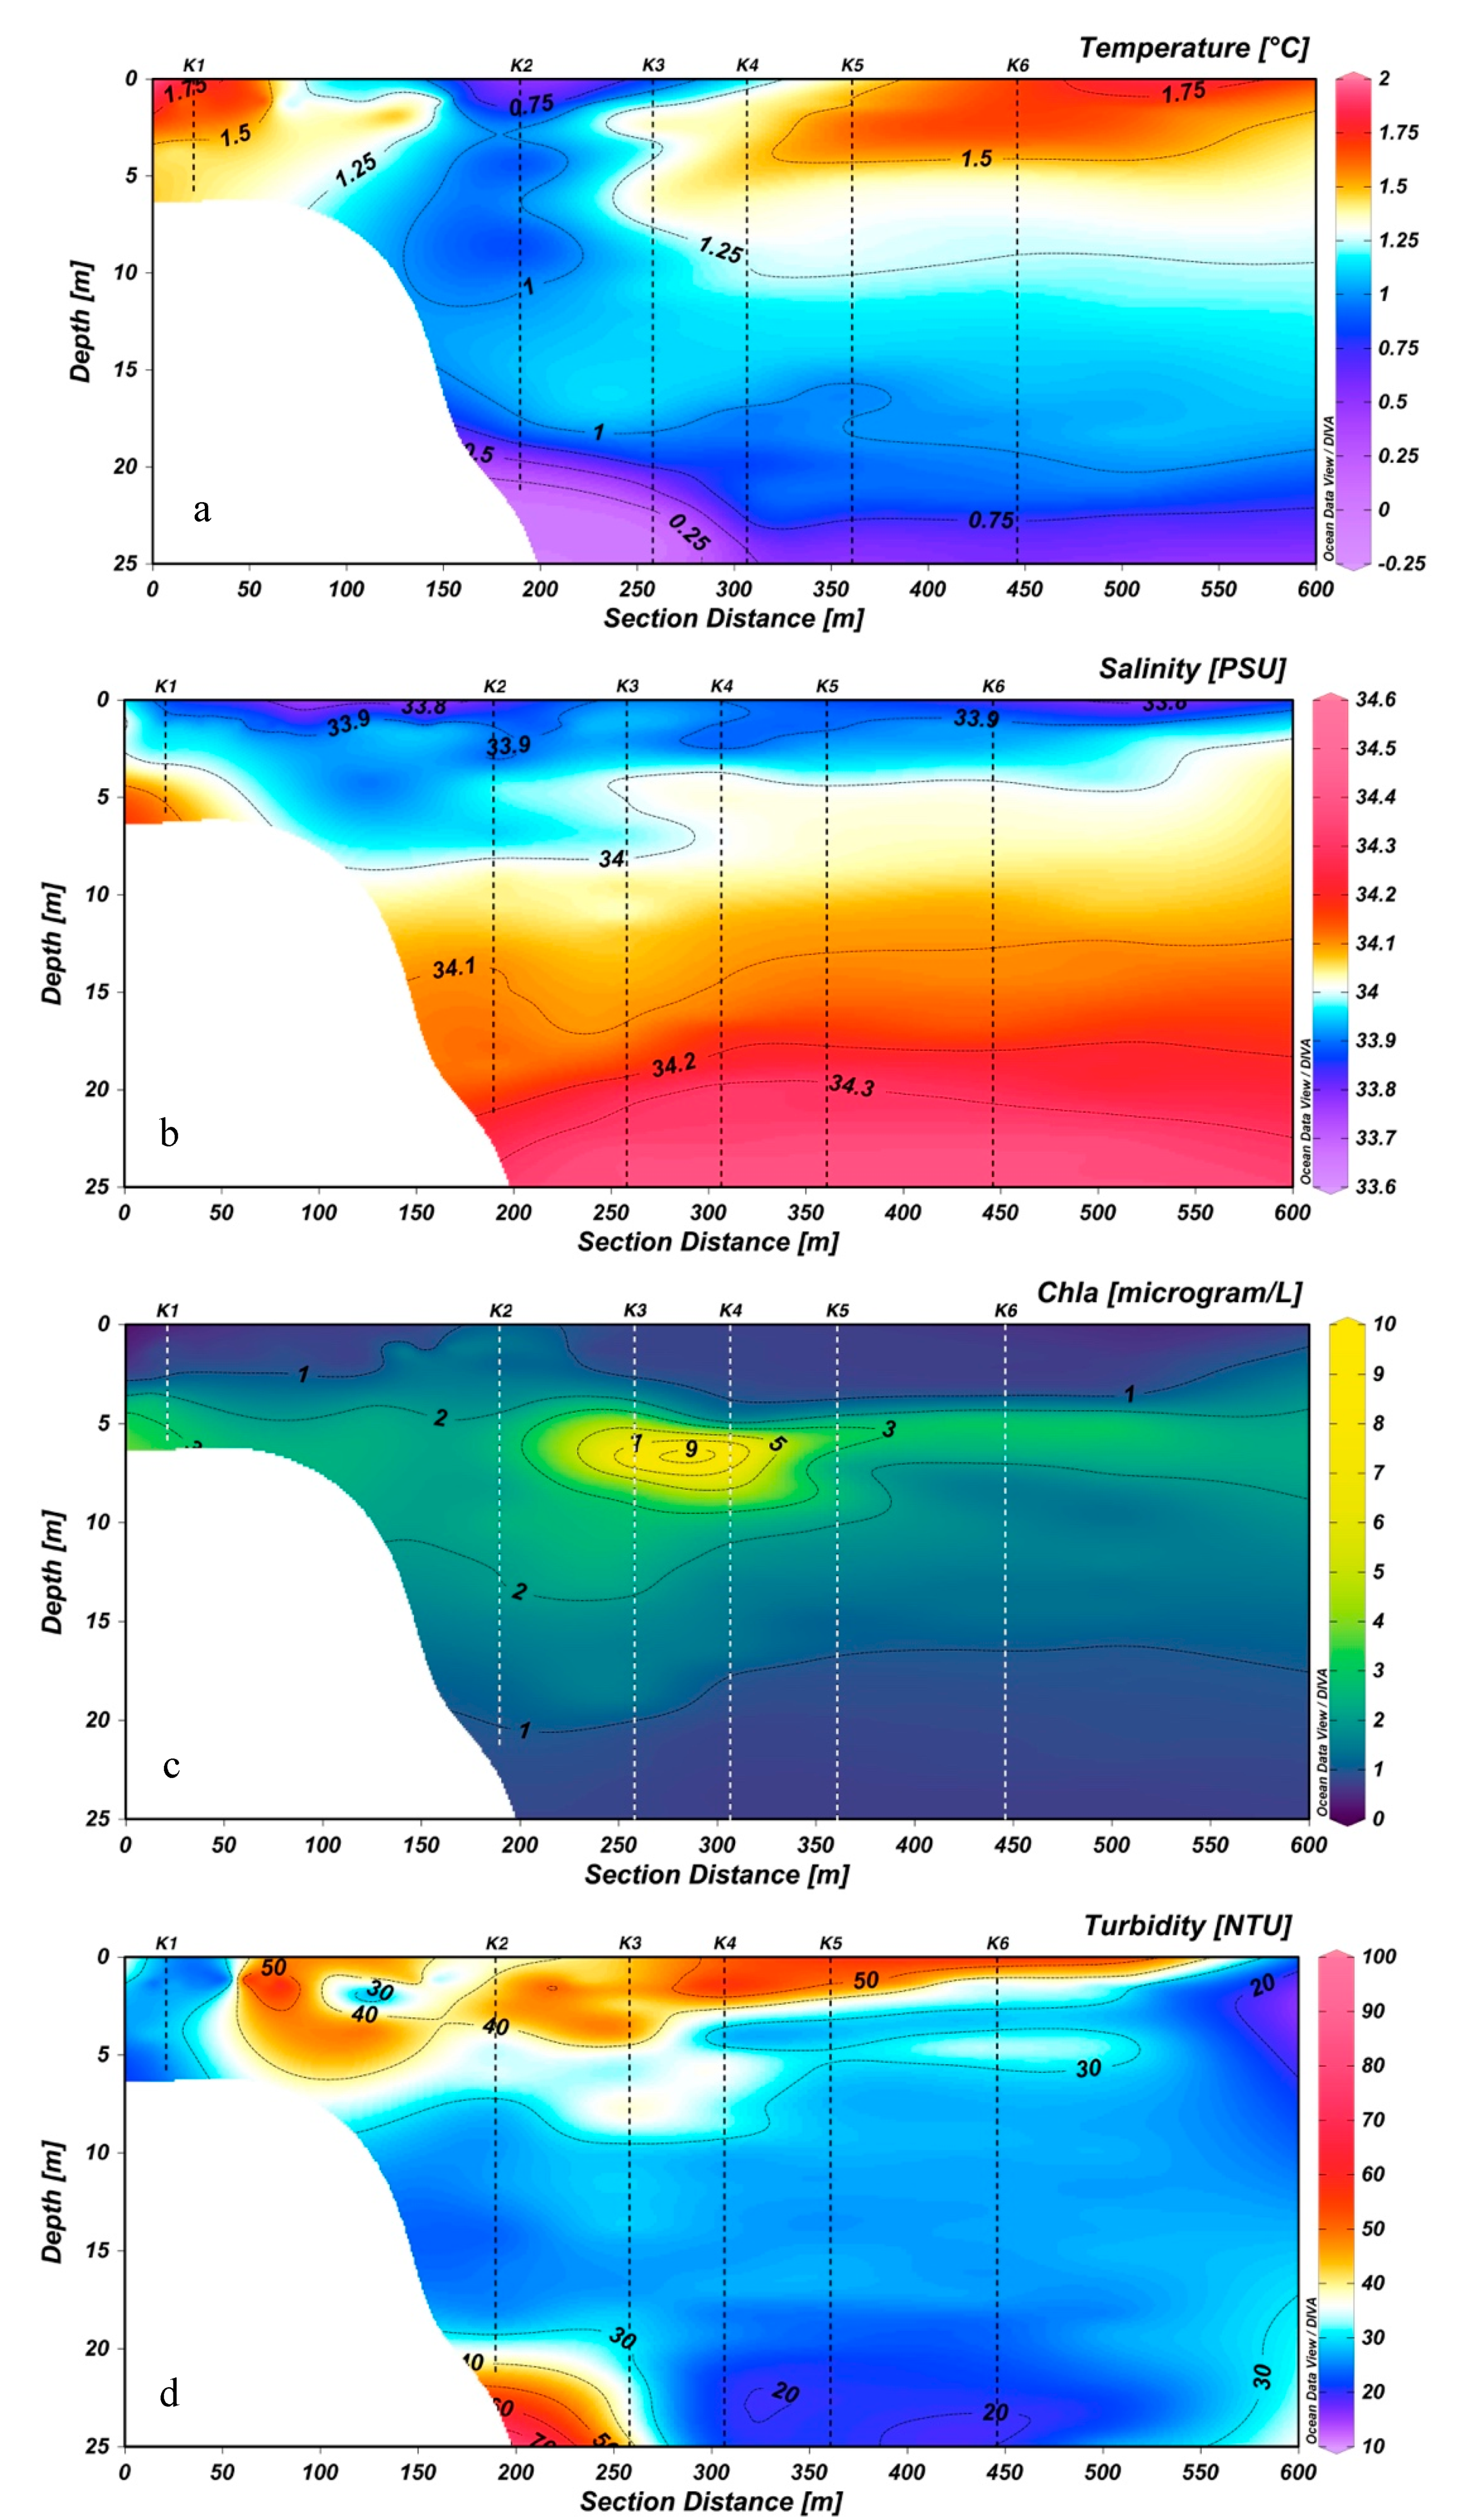
3.1. Kongsbreen
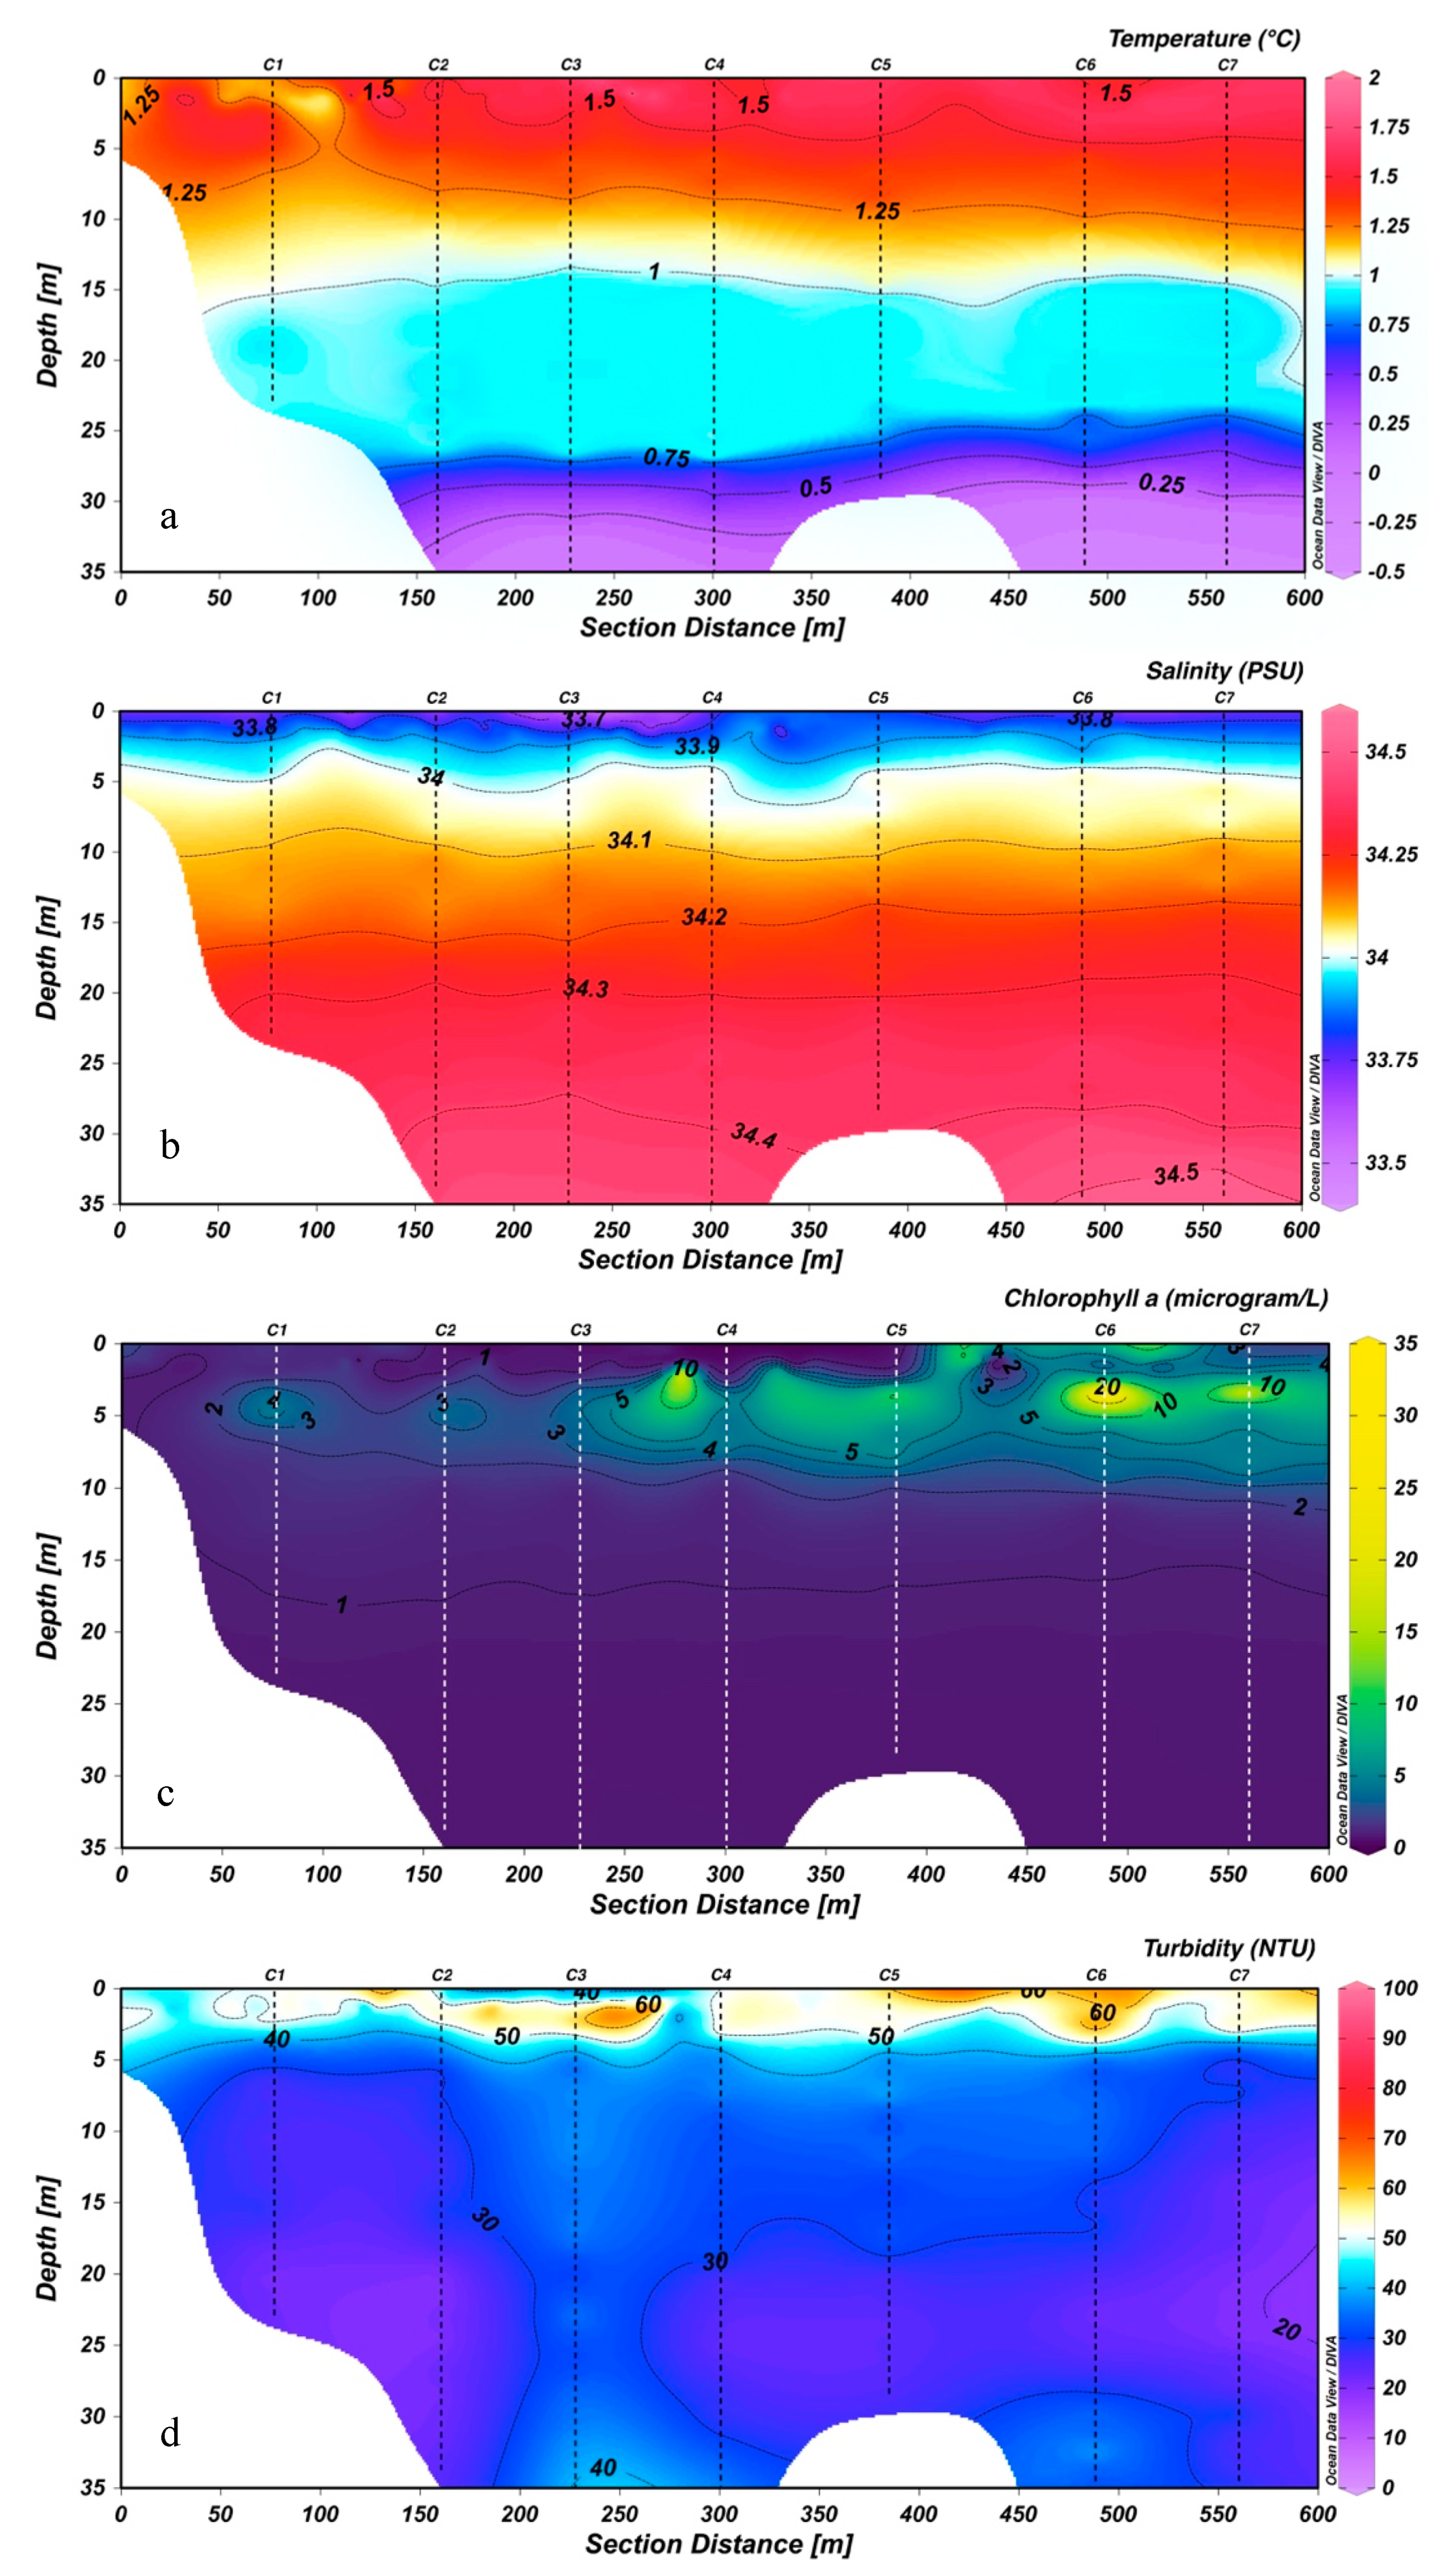
3.2. Conwaybreen
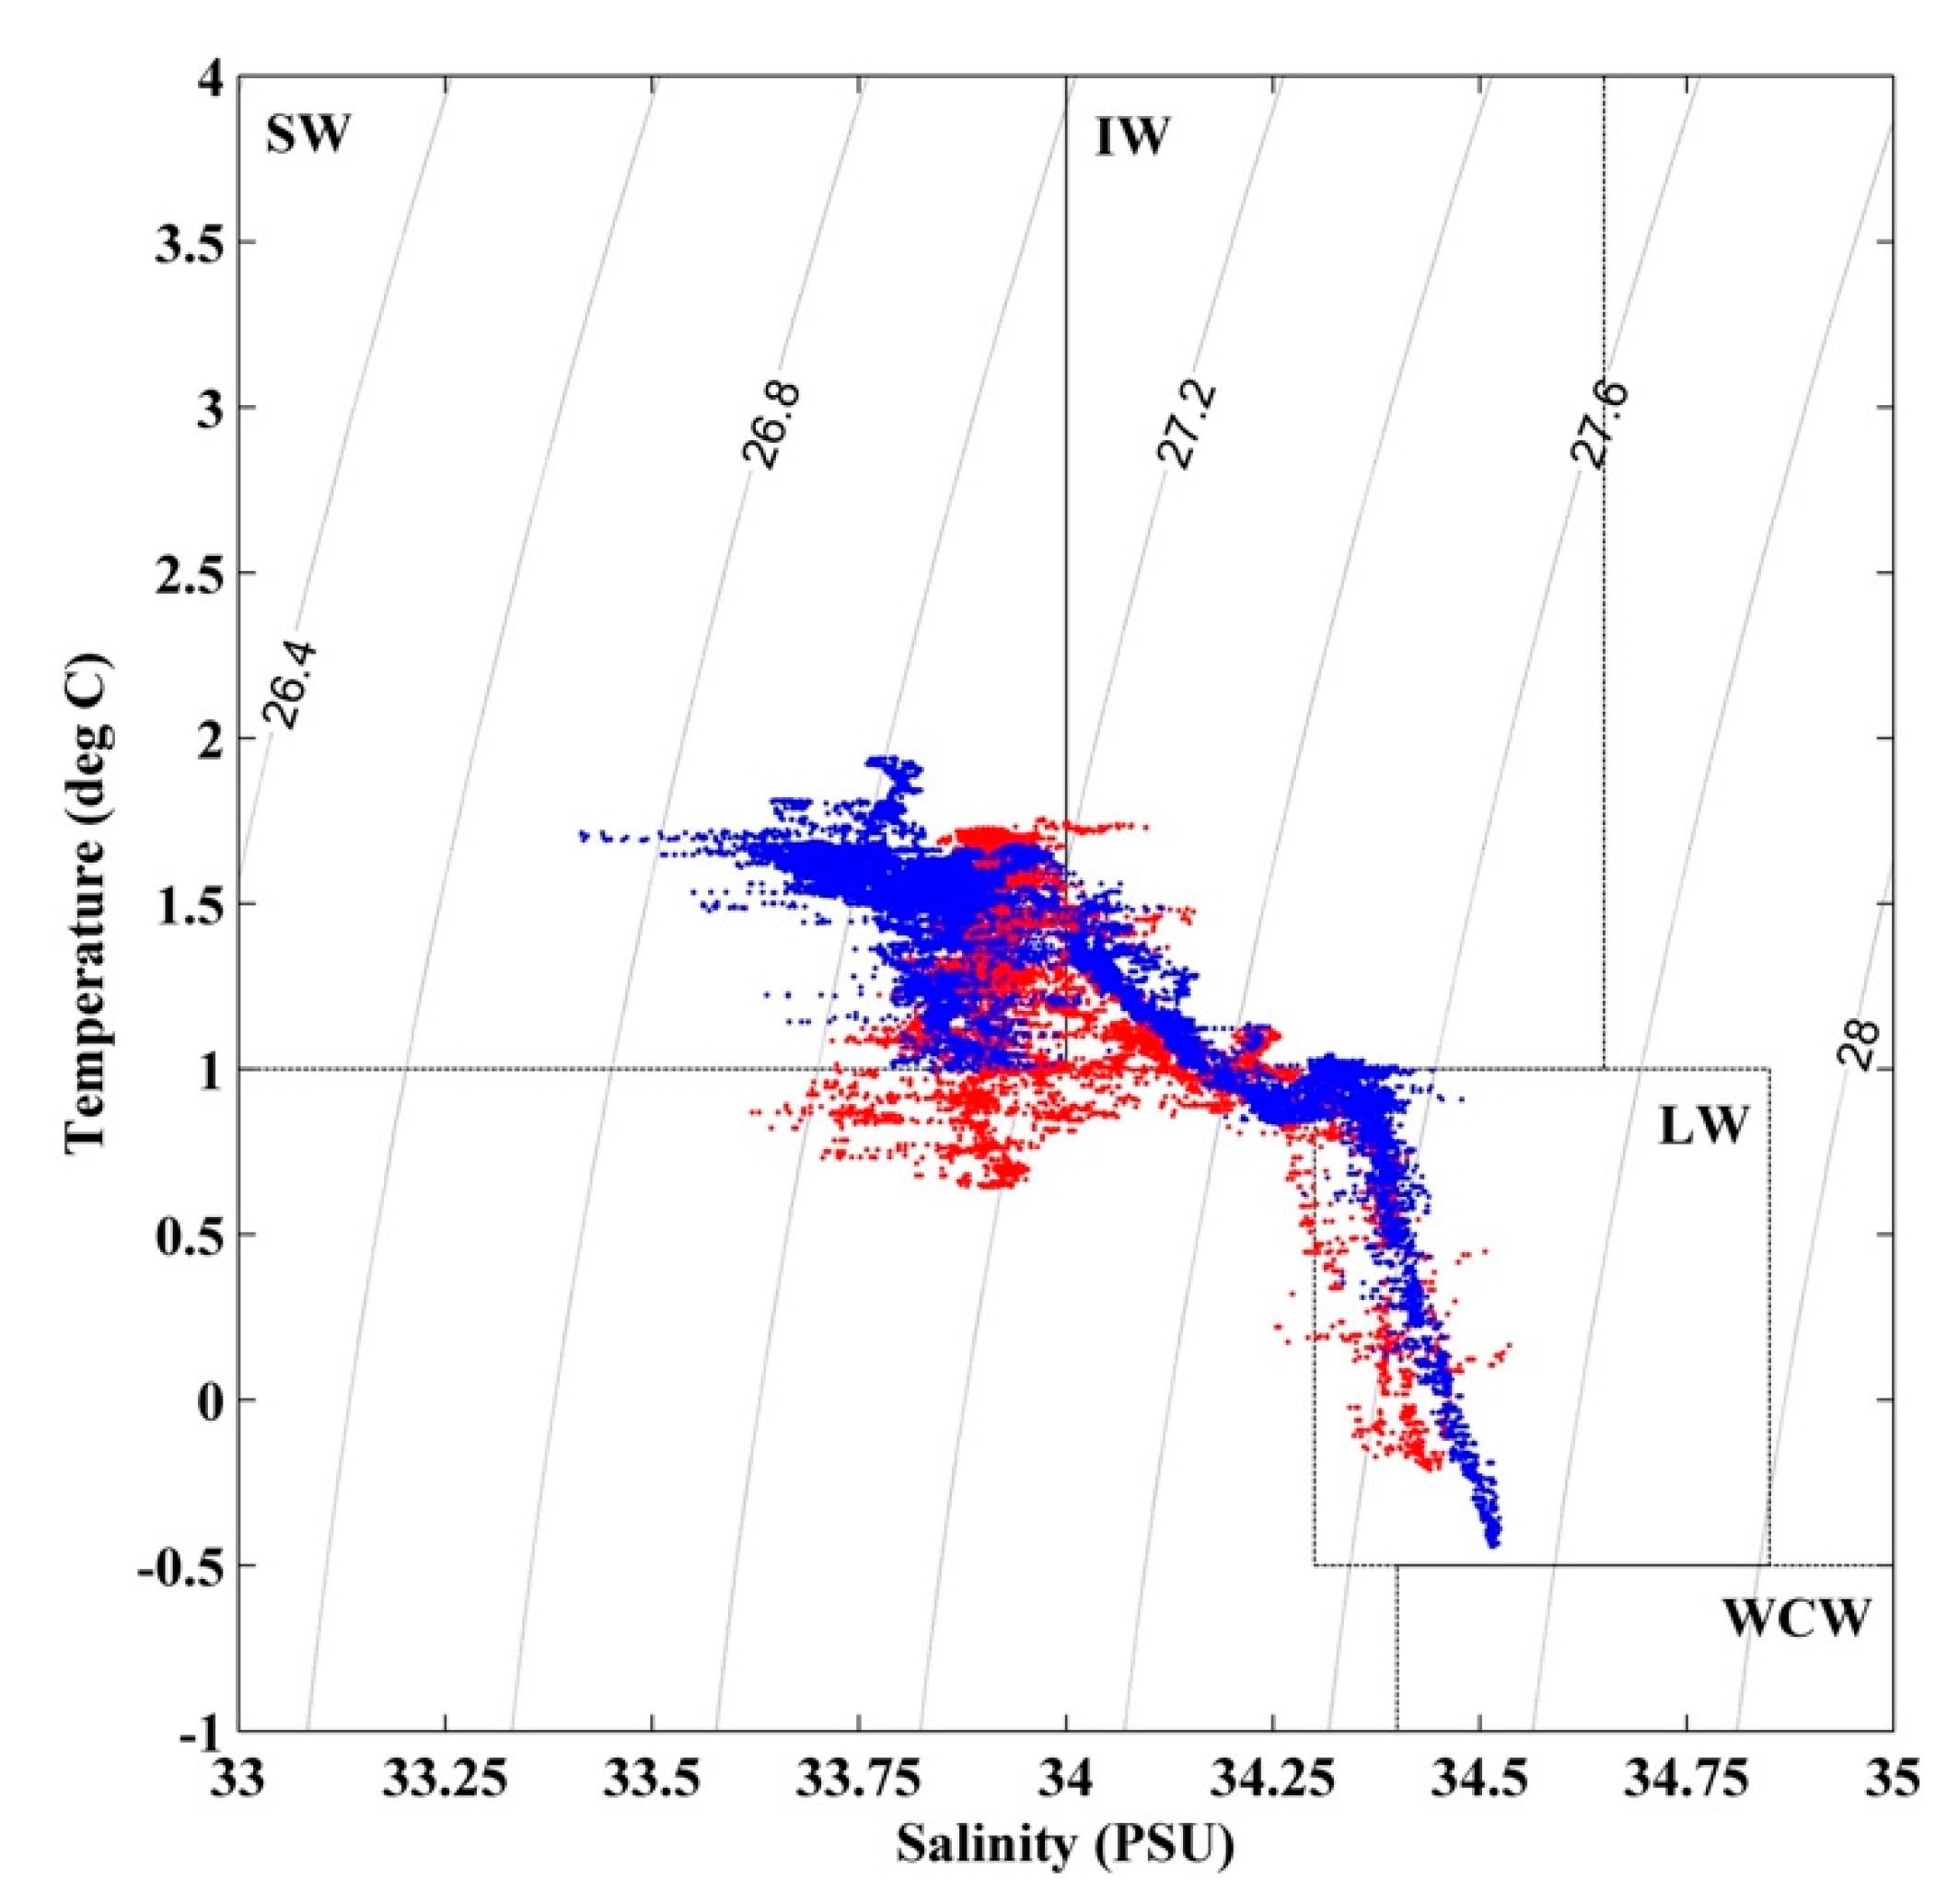
3.3. Water Masses
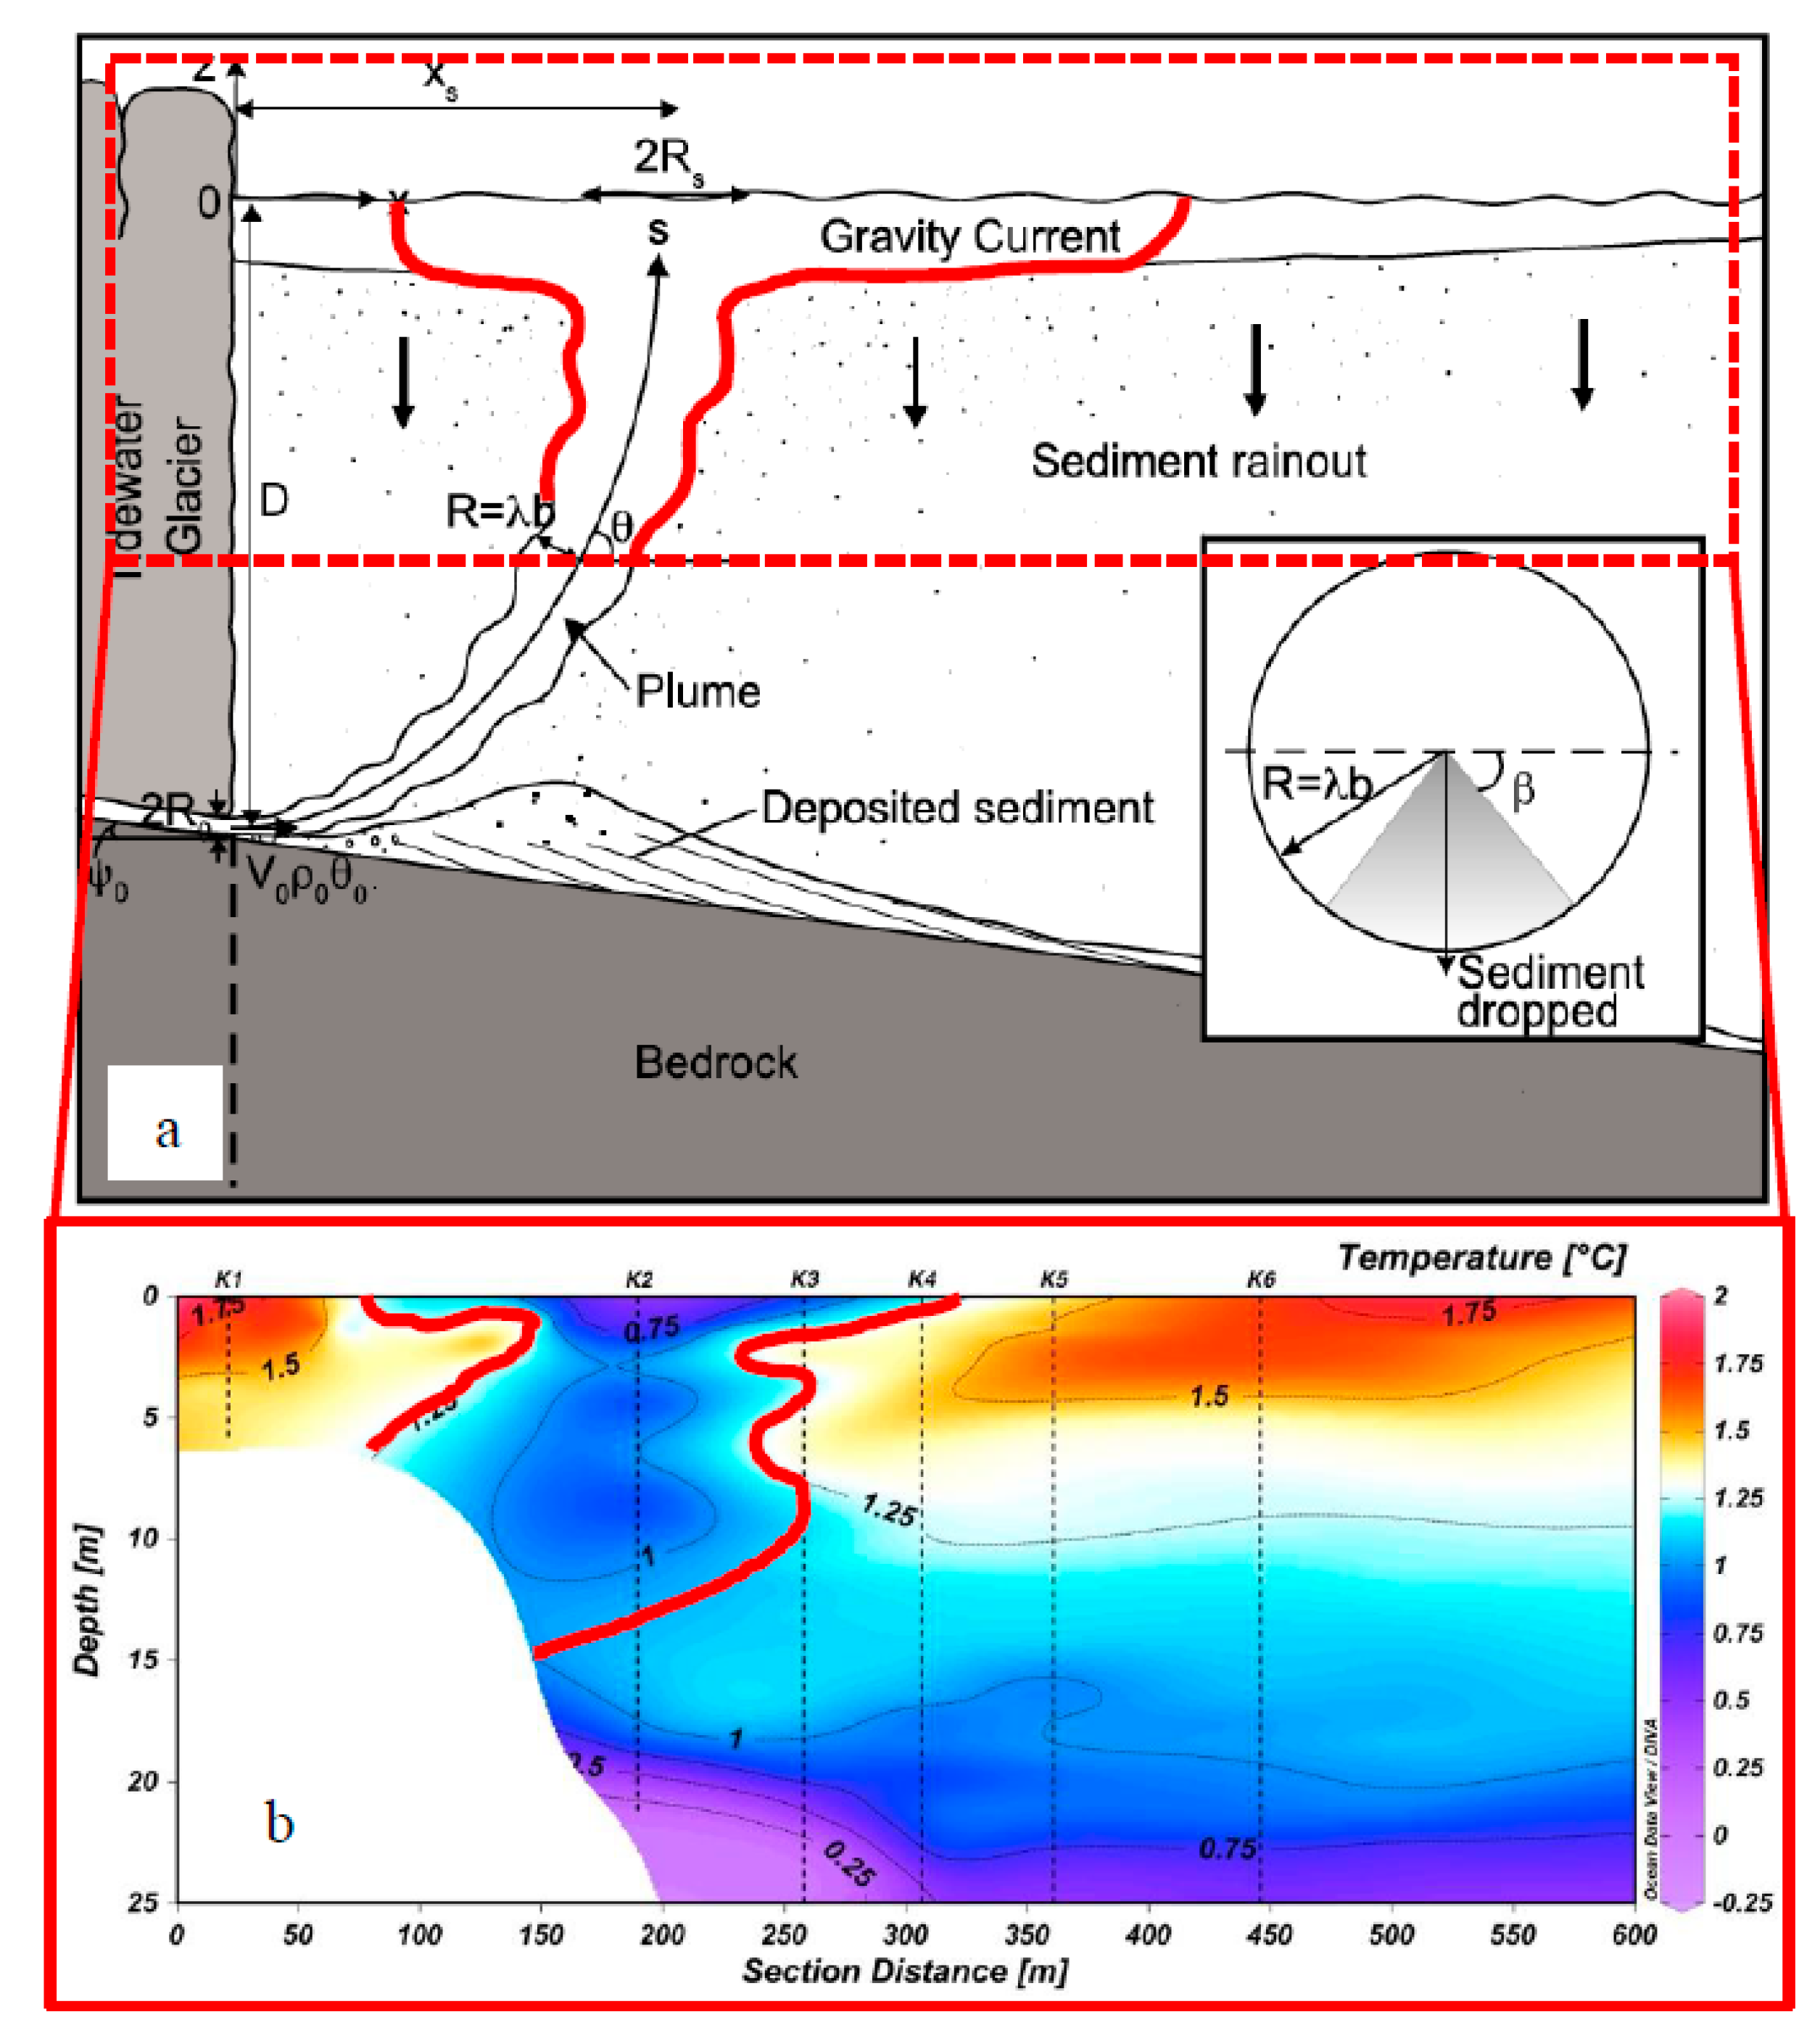
4. Discussions
5. Conclusions
Author Contributions
Funding
Acknowledgments
Conflicts of Interest
References
- Arctic Climate Impact Assessment (ACIA). Impacts of a Warming Arctic: Arctic Climate Impact Assessment. Cambridge University Press: Cambridge, UK, 2004; ISBN 0521617782. [Google Scholar]
- Walsh, J.E.; Overland, J.E.; Groisman, P.Y.; Rudolf, B. Ongoing Climate Change in the Arctic. Ambio 2011, 40, 6–16. [Google Scholar] [CrossRef] [Green Version]
- Intergovernmental Panel on Climate Change (IPCC). Climate Change 2013-The Physical Science Basis. Intergovernmental Panel on Climate Change, Ed.; Cambridge University Press: Cambridge, UK, 2014; ISBN 9781107415324. [Google Scholar]
- Dai, A.; Luo, D.; Song, M.; Liu, J. Arctic amplification is caused by sea-ice loss under increasing CO2. Nat. Commun. 2019, 10, 121. [Google Scholar] [CrossRef] [PubMed] [Green Version]
- Torsvik, T.; Albretsen, J.; Sundfjord, A.; Kohler, J.; Sandvik, A.D.; Skarðhamar, J.; Lindbäck, K.; Everett, A. Impact of tidewater glacier retreat on the fjord system: Modeling present and future circulation in Kongsfjorden, Svalbard. Estuar. Coast. Shelf Sci. 2019, 220, 152–165. [Google Scholar] [CrossRef]
- Husum, K.; Howe, J.A.; Baltzer, A.; Forwick, M.; Jensen, M.; Jernas, P.; Korsun, S.; Miettinen, A.; Mohan, R.; Morigi, C.; et al. The marine sedimentary environments of Kongsfjorden, Svalbard: An archive of polar environmental change. Polar Res. 2019, 38, 1–16. [Google Scholar] [CrossRef]
- Calleja, M.L.; Kerhervé, P.; Bourgeois, S.; Kędra, M.; Leynaert, A.; Devred, E.; Babin, M.; Morata, N. Effects of increase glacier discharge on phytoplankton bloom dynamics and pelagic geochemistry in a high Arctic fjord. Prog. Oceanogr. 2017, 159, 195–210. [Google Scholar] [CrossRef] [Green Version]
- Howe, J.A.; Husum, K.; Inall, M.E.; Coogan, J.; Luckman, A.; Arosio, R.; Abernethy, C.; Verchili, D. Autonomous underwater vehicle (AUV) observations of recent tidewater glacier retreat, western Svalbard. Mar. Geol. 2019, 417, 106009. [Google Scholar] [CrossRef]
- Mankoff, K.D.; Straneo, F.; Cenedese, C.; Das, S.B.; Richards, C.G.; Singh, H. Structure and dynamics of a subglacial discharge plume in a Greenlandic fjord. J. Geophys. Res. Ocean. 2016, 121, 8670–8688. [Google Scholar] [CrossRef]
- Lydersen, C.; Assmy, P.; Falk-Petersen, S.; Kohler, J.; Kovacs, K.M.; Reigstad, M.; Steen, H.; Strøm, H.; Sundfjord, A.; Varpe, Ø.; et al. The importance of tidewater glaciers for marine mammals and seabirds in Svalbard, Norway. J. Mar. Syst. 2014, 129, 452–471. [Google Scholar] [CrossRef]
- Vihma, T.; Uotila, P.; Sandven, S.; Pozdnyakov, D.; Makshtas, A.; Pelyasov, A.; Pirazzini, R.; Danielsen, F.; Chalov, S.; Lappalainen, H.K.; et al. Towards an advanced observation system for the marine Arctic in the framework of the Pan-Eurasian Experiment (PEEX). Atmos. Chem. Phys. 2019, 19, 1941–1970. [Google Scholar] [CrossRef] [Green Version]
- Hop, H.; Pearson, T.; Hegseth, E.N.; Kovacs, K.M.; Wiencke, C.; Kwasniewski, S.; Eiane, K.; Mehlum, F.; Gulliksen, B.; Wlodarska-Kowalczuk, M.; et al. The marine ecosystem of Kongsfjorden, Svalbard. Polar Res. 2002, 21, 167–208. [Google Scholar] [CrossRef]
- Bellingham, J.G.; Rajan, K. Robotics in Remote and Hostile Environments. Science 2007, 318, 1098–1102. [Google Scholar] [CrossRef] [PubMed] [Green Version]
- Trevathan, J.; Johnstone, R.; Chiffings, T.; Atkinson, I.; Bergmann, N.; Read, W.; Theiss, S.; Myers, T.; Stevens, T. SEMAT—The Next Generation of Inexpensive Marine Environmental Monitoring and Measurement Systems. Sensors 2012, 12, 9711–9748. [Google Scholar] [CrossRef] [PubMed] [Green Version]
- Lockridge, G.; Dzwonkowski, B.; Nelson, R.; Powers, S. Development of a Low-Cost Arduino-Based Sonde for Coastal Applications. Sensors 2016, 16, 528. [Google Scholar] [CrossRef] [PubMed] [Green Version]
- Piermattei, V.; Madonia, A.; Bonamano, S.; Martellucci, R.; Bruzzone, G.; Ferretti, R.; Odetti, A.; Azzaro, M.; Zappalà, G.; Marcelli, M. Cost-Effective Technologies to Study the Arctic Ocean Environment †. Sensors 2018, 18, 2257. [Google Scholar] [CrossRef] [PubMed] [Green Version]
- Bruzzone, G.; Odetti, A.; Caccia, M. Remote Data Collection Near Marine Glacier Fronts Unmanned Vehicles for Autonomous Sensing, Sampling in the North Pole. Sea Technol. 2018, 59, 22–26. [Google Scholar]
- Svendsen, H.; Beszczynska-Møller, A.; Hagen, J.O.; Lefauconnier, B.; Tverberg, V.; Gerland, S.; Børre Ørbæk, J.; Bischof, K.; Papucci, C.; Zajaczkowski, M.; et al. The physical environment of Kongsfjorden–Krossfjorden, an Arctic fjord system in Svalbard. Polar Res. 2002, 21, 133–166. [Google Scholar] [CrossRef] [Green Version]
- Schild, K.M.; Renshaw, C.E.; Benn, D.I.; Luckman, A.; Hawley, R.L.; How, P.; Trusel, L.; Cottier, F.R.; Pramanik, A.; Hulton, N.R.J. Glacier Calving Rates Due to Subglacial Discharge, Fjord Circulation, and Free Convection. J. Geophys. Res. Earth Surf. 2018, 123, 2189–2204. [Google Scholar] [CrossRef]
- Kimura, S.; Holland, P.R.; Jenkins, A.; Piggott, M. The Effect of Meltwater Plumes on the Melting of a Vertical Glacier Face. J. Phys. Oceanogr. 2014, 44, 3099–3117. [Google Scholar] [CrossRef] [Green Version]
- Sundfjord, A.; Albretsen, J.; Kasajima, Y.; Skogseth, R.; Kohler, J.; Nuth, C.; Skarðhamar, J.; Cottier, F.; Nilsen, F.; Asplin, L.; et al. Effects of glacier runoff and wind on surface layer dynamics and Atlantic Water exchange in Kongsfjorden, Svalbard; a model study. Estuar. Coast. Shelf Sci. 2017, 187, 260–272. [Google Scholar] [CrossRef]
- Sloughter, T.M.; Banas, N.S.; Sambrotto, R.N. Seasonal variation in light response of polar phytoplankton. J. Mar. Syst. 2019, 191, 64–75. [Google Scholar] [CrossRef]
- Bruzzone, G.; Odetti, A.; Caccia, M.; Ferretti, R. Monitoring of Sea-Ice-Atmosphere Interface in the Proximity of Arctic Tidewater Glaciers: The Contribution of Marine Robotics. Remote Sens. 2020, 12, 1707. [Google Scholar] [CrossRef]
- Marcelli, M.; Piermattei, V.; Madonia, A.; Mainardi, U. Design and Application of New Low-Cost Instruments for Marine Environmental Research. Sensors 2014, 14, 23348–23364. [Google Scholar] [CrossRef] [PubMed] [Green Version]
- Jeffrey, S.W.; Wright, S.W.; Mantoura, R.F.C. Phytoplankton pigments in oceanography: Guidelines to modern methods. Unesco Publishing: Paris, France, 2005. [Google Scholar]
- Cottier, F.; Tverberg, V.; Inall, M.; Svendsen, H.; Nilsen, F.; Griffiths, C. Water mass modification in an Arctic fjord through cross-shelf exchange: The seasonal hydrography of Kongsfjorden, Svalbard. J. Geophys. Res. 2005, 110, C12005. [Google Scholar] [CrossRef] [Green Version]
- Luckman, A.; Benn, D.I.; Cottier, F.; Bevan, S.; Nilsen, F.; Inall, M. Calving rates at tidewater glaciers vary strongly with ocean temperature. Nat. Commun. 2015, 6, 8566. [Google Scholar] [CrossRef] [PubMed] [Green Version]
- Chauché, N.; Hubbard, A.; Gascard, J.-C.; Box, J.E.; Bates, R.; Koppes, M.; Sole, A.; Christoffersen, P.; Patton, H. Ice–ocean interaction and calving front morphology at two west Greenland tidewater outlet glaciers. Cryosphere 2014, 8, 1457–1468. [Google Scholar] [CrossRef] [Green Version]
- Mugford, R.I.; Dowdeswell, J.A. Modeling glacial meltwater plume dynamics and sedimentation in high-latitude fjords. J. Geophys. Res. Earth Surf. 2011, 116. [Google Scholar] [CrossRef]
- Xu, Y.; Rignot, E.; Menemenlis, D.; Koppes, M. Numerical experiments on subaqueous melting of Greenland tidewater glaciers in response to ocean warming and enhanced subglacial discharge. Ann. Glaciol. 2012, 53, 229–234. [Google Scholar] [CrossRef] [Green Version]
- Xu, Y.; Rignot, E.; Fenty, I.; Menemenlis, D.; Flexas, M.M. Subaqueous melting of Store Glacier, west Greenland from three-dimensional, high-resolution numerical modeling and ocean observations. Geophys. Res. Lett. 2013, 40, 4648–4653. [Google Scholar] [CrossRef] [Green Version]
- Meslard, F.; Bourrin, F.; Many, G.; Kerhervé, P. Suspended particle dynamics and fluxes in an Arctic fjord (Kongsfjorden, Svalbard). Estuar. Coast. Shelf Sci. 2018, 204, 212–224. [Google Scholar] [CrossRef]
- Zajaczkowski, M. Sediment supply and fluxes in glacial and outwash fjords, Kongsfjorden and Adventfjorden, Svalbard. Polish Polar Res. 2008, 29, 59–72. [Google Scholar]
- Hawkings, J.R.; Wadham, J.L.; Tranter, M.; Lawson, E.; Sole, A.; Cowton, T.; Tedstone, A.J.; Bartholomew, I.; Nienow, P.; Chandler, D.; et al. The effect of warming climate on nutrient and solute export from the Greenland Ice Sheet. Geochem. Perspect. Lett. 2015, 94–104. [Google Scholar] [CrossRef] [Green Version]
- Hegseth, E.N.; Tverberg, V. Effect of Atlantic water inflow on timing of the phytoplankton spring bloom in a high Arctic fjord (Kongsfjorden, Svalbard). J. Mar. Syst. 2013, 113–114, 94–105. [Google Scholar] [CrossRef]
- van De Poll, W.H.; Maat, D.S.; Fischer, P.; Rozema, P.D.; Daly, O.B.; Koppelle, S.; Visser, R.J.W.; Buma, A.G.J. Atlantic Advection Driven Changes in Glacial Meltwater: Effects on Phytoplankton Chlorophyll-a and Taxonomic Composition in Kongsfjorden, Spitsbergen. Front. Mar. Sci. 2016, 3, 1–11. [Google Scholar] [CrossRef] [Green Version]
- Leu, E.; Falk-Petersen, S.; Kwaśniewski, S.; Wulff, A.; Edvardsen, K.; Hessen, D.O. Fatty acid dynamics during the spring bloom in a High Arctic fjord: Importance of abiotic factors versus community changes. Can. J. Fish. Aquat. Sci. 2006, 63, 2760–2779. [Google Scholar] [CrossRef]
- Kubiszyn, A.M.; Piwosz, K.; Wiktor, J.M.; Wiktor, J.M. The effect of inter-annual Atlantic water inflow variability on the planktonic protist community structure in the West Spitsbergen waters during the summer. J. Plankton Res. 2014, 36, 1190–1203. [Google Scholar] [CrossRef] [Green Version]
- Piquet, A.M.-T.; van de Poll, W.H.; Visser, R.J.W.; Wiencke, C.; Bolhuis, H.; Buma, A.G.J. Springtime phytoplankton dynamics in Arctic Krossfjorden and Kongsfjorden (Spitsbergen) as a function of glacier proximity. Biogeosciences 2014, 11, 2263–2279. [Google Scholar] [CrossRef] [Green Version]


| Water Mass | Abbreviation | Characteristics | ||
|---|---|---|---|---|
| T (°C) | Sal (PSU) | σ (kg/m3) | ||
| Atlantic water | AW | >3 | >34.65 | <27.92 |
| Transformed Atlantic water | TAW | 1 to 3 | >34.65 | <27.92 |
| Arctic water | ArW | −1.5 to 1 | 34.3 to 34.8 | |
| Surface water | SW | >1 | <34 | |
| Intermediate water | IW | >1 | 34 to 34.65 | |
| Local water | LW | −0.5 to 1 | 34.3 to 34.85 | |
| Winter cooled water | WCW | <−0.5 | 34.4 to 35.0 | |
© 2020 by the authors. Licensee MDPI, Basel, Switzerland. This article is an open access article distributed under the terms and conditions of the Creative Commons Attribution (CC BY) license (http://creativecommons.org/licenses/by/4.0/).
Share and Cite
Pasculli, L.; Piermattei, V.; Madonia, A.; Bruzzone, G.; Caccia, M.; Ferretti, R.; Odetti, A.; Marcelli, M. New Cost-Effective Technologies Applied to the Study of the Glacier Melting Influence on Physical and Biological Processes in Kongsfjorden Area (Svalbard). J. Mar. Sci. Eng. 2020, 8, 593. https://doi.org/10.3390/jmse8080593
Pasculli L, Piermattei V, Madonia A, Bruzzone G, Caccia M, Ferretti R, Odetti A, Marcelli M. New Cost-Effective Technologies Applied to the Study of the Glacier Melting Influence on Physical and Biological Processes in Kongsfjorden Area (Svalbard). Journal of Marine Science and Engineering. 2020; 8(8):593. https://doi.org/10.3390/jmse8080593
Chicago/Turabian StylePasculli, Lorenzo, Viviana Piermattei, Alice Madonia, Gabriele Bruzzone, Massimo Caccia, Roberta Ferretti, Angelo Odetti, and Marco Marcelli. 2020. "New Cost-Effective Technologies Applied to the Study of the Glacier Melting Influence on Physical and Biological Processes in Kongsfjorden Area (Svalbard)" Journal of Marine Science and Engineering 8, no. 8: 593. https://doi.org/10.3390/jmse8080593
APA StylePasculli, L., Piermattei, V., Madonia, A., Bruzzone, G., Caccia, M., Ferretti, R., Odetti, A., & Marcelli, M. (2020). New Cost-Effective Technologies Applied to the Study of the Glacier Melting Influence on Physical and Biological Processes in Kongsfjorden Area (Svalbard). Journal of Marine Science and Engineering, 8(8), 593. https://doi.org/10.3390/jmse8080593