Abstract
This paper addresses the sizing and design problem of a permanent magnet electrical machine power take-off system for a two-body wave energy converter, which is designed to support ocean sensing applications with sustained power. The design is based upon ground truth ocean data bi-spectrums (swell and wind waves) from Martha’s Vineyard Coastal Observatory in the year 2015. According to the ground truth ocean data, the paper presents the optimal harvesting power time series of the whole year. The electrical machine and energy storage static modeling are introduced in the paper. The paper uses the ground truth ocean data in March to discuss the model integration of the buoy dynamic model, the power take-off model, and the energy storage model. Electrical machine operation constraints are applied to ensure the designed machine can fulfill the buoy control requirements. The electrical machine and energy storage systems operation status is presented as well. Furthermore, rule-based control strategies are applied to the electrical machine for fulfilling specific design demands, such as improving power generating efficiency and downsizing the electrical machine scale. The corresponding required capacities of the energy storage system are discussed. This paper relates results to the wave data sets (different combinations of significant wave heights and periods of both swell and wind waves). In this way, the power take-off system rule-based control strategy determinations can rely on current ocean wave measurements instead of a large historical ocean wave database.
1. Introduction
Ocean sensing applications require sustained power to measure and collect data during extended periods in remote locations. This calls for the design of energy systems capable of delivering such stringent demands. Typical solutions include wave energy converters (WECs), which rely on wave height to actuate an electromechanical or hydraulic system [1] to generate power. However, this is not a sufficiently resilient choice as lack of waves and wind can result in no power generated, rendering the sensors useless. The literature presents solutions in which the WECs are part of hybrid systems, with either photovoltaic [2], wind [3], batteries, and/or fuel cells [4]. However, most solutions add the energy storage or alternative generation [5] as an afterthought, rather than considering a combined design effort for both the WEC and energy storage systems (ESS).
Direct drive WECs have the merit of simplifying the power take-off (PTO) system configuration by removing unnecessary gearboxes and hydraulic components. They are designed for small or medium scale applications due to the limited PTO dimensions [6]. The permanent magnet linear generator (PMLG) translator can be driven directly by the buoy heave motion. However, slow wave motions and excessive required control force will demand a high force density on the PMLG system [7]. The PMLG design study, which aims to improve the power generation efficiency on WECs, has been discussed in many studies. Magnet layout and field effect design are discussed in [8,9] to improve the PMLG performances in direct drive wave energy conversion. The lighter translator PMLG design for direct drive wave energy conversion is also discussed in [10] to improve the translator dynamics. High power generation demands an increase in PMLG dimensions, including more robust magnet arrays and longer stroke.
The ESS design for WECs considers off-board or on-board solutions. The location of the energy storage is related to its function in combination with the WEC. Usually, on-board ESS is limited in size due to the WEC dimension constraints, and the purpose is to provide short-term power supply for either buoy motion control [11] or to smooth power fluctuation [12]. For direct drive WECs, the storage is mostly electrochemical or mechanical, such as batteries, supercapacitors, flywheels [13], etc. Off-board ESS is normally designed for larger power extraction WEC arrays connected to the grid, where the energy storage can be located offshore on floating platforms or onshore, and the purpose can be short-term for power quality improvement [14] or long-term for energy management [15].
1.1. Demands of Ground Truth Inputs and Reactive Power Control
The ground truth ocean data can reflect real ocean wave power dynamics. However, current researches prefer simplified ocean wave data, such as in [16], which uses supercapacitors to smooth the extracted power. The ocean wave data is simplified to one set of constant significant wave height and wave period instead of ground truth ocean wave data. Similarly, using supercapacitors to smooth WEC power output or to improve the extracted power quality is also studied in [17,18], considering simplified ocean wave data, where the supercapacitors mitigate the wave power fluctuations with certain control strategies. However, not using ground truth ocean data would decrease the variance of the WEC power output, and so would the ESS demand.
Direct drive WEC PMLG damping control strategy has been studied for years [19], where the inverter and the ESS in the electrical drive must fulfill the requirements to achieve the highest extraction efficiency and smooth the output power. However, the extracted power cannot approach the optimal values while using WEC PTO damping control. Comparatively, impedance matching control strategy, such as complex conjugate control [20], will increase the PTO extracted power significantly. Few studies discuss impedance matching control on direct drive WECs since applying the control method to the PMLG will have higher-level demands for the on-board electrical drive.
1.2. The Research Novelty
The procedure to design and size the PTO and ESS system for a WEC system is a challenge. Current research has yielded the buoy shape design [21] and the dynamic control design [22] efforts to harvest the optimal theoretical wave energy. However, the total system optimality does not reflect the actual generated energy in the PTO and ESS electrical drive since the electrical machine limitations and the electrical power losses are neglected. On the other hand, WEC PTO and ESS design research, such as wave to wire modeling [23], will focus on the generator dynamic control strategy and the power management theory instead of presenting the actual PTO and ESS limitations and operational constraints. This paper presents a novel methodology and procedure of integrating the PTO and ESS static model to the WEC buoy dynamic model while considering the electrical machine limitations. This approach can increase the PTO electrical drive design and sizing efficiency, accuracy, and specificity. Considering PTO operation constraints will correct the deviation between the buoy theoretical optimal harvesting power and the actual generated power in the electrical drive. The rule-based control strategy applied to the PTO will increase the electrical drive design flexibility instead of being excessively over-engineered as is a typical case. While considering the PTO limitations and power demands, the ESS sizing algorithm in this paper can downsize the ESS maximumly for different PTO-ESS-load configurations.
The WEC power output in this paper is calculated based upon ground truth ocean data from Martha’s Vineyard Coastal Observatory [24]. The ground truth data is available on their website [25]. A small-scale WEC system with a permanent magnet linear electrical machine (PMLEM) will be discussed. The impedance matching control theory has been applied to WEC buoy control to increase the extracted power maximumly. The configuration of the two-body WEC system and PTO power extraction equations are presented in Section 2. The static modeling of the PMLEM and the electrical drive configuration is introduced in Section 3. By integrating the buoy dynamic model and the electrical drive static model, the PTO and ESS behaviors are presented in Section 4 by showing voltage and current flow time series. Rule-based control strategies and constraints are introduced in Section 5. The PTO and ESS behaviors and demands are also presented in this section while considering implementing different rule-based control strategies.
2. Martha’s Vineyard Ground Truth Ocean Wave Data and Power Calculation
2.1. Martha’s Vineyard Data Case
Many studies have shown the modeling effort of wave energy resources characterization and assessment. In [26], the Simulating WAves Nearshore numerical model is introduced and validated for wave energy estimation in the U.S. east coast region from the Gulf of Maine to South Florida. Another research [27] evaluates different spectral wave models and applies extreme wave heights correction to present the extreme wave condition better. In this paper, the ground truth ocean wave data is measured and collected by the Woods Hole Oceanographic Institution, on their Martha’s Vineyard Coastal Observatory near the south beach in Edgartown, Massachusetts, U.S. The observatory infrastructure includes an air-sea interaction tower, located 3 km south of Martha’s Vineyard, and a 12-m underwater node, located 1.5 km offshore [28]. The ocean wave measurements are recorded and updated as one dataset every 20 mins on the website. One dataset includes significant wave height (Hs) and significant wave period (T) of swell and wind waves. This paper selects and uses the wave data of the year 2015. There are 25,116 samples recorded from 3:20 a.m. 1 January to 12:00 p.m. 31 December 2015. In this paper, only when both Hs and T of both swell and wind waves are available, the dataset is considered as a usable one. According to this standard, there were a total of 24,950 usable samples in 2015. All these usable datasets are assumed to be time continuous. In this way, the input time series of the whole year 2015 can be generated, as shown in Figure 1.
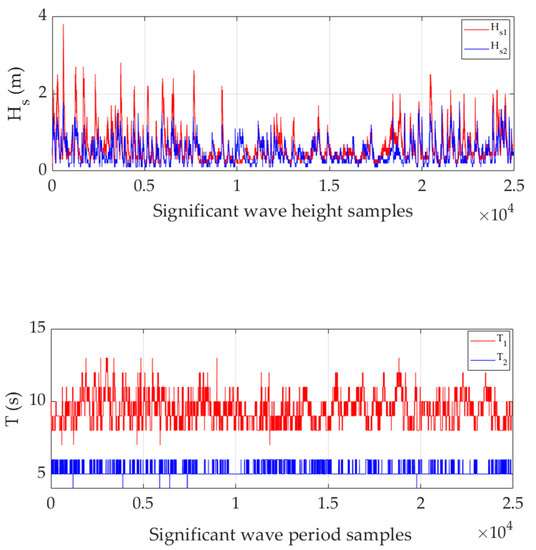
Figure 1.
2015 ground truth ocean wave data input time series with 20-min time step, swell (Hs1, T1) and wind waves (Hs2, T2).
2.2. Power Calculation
The WEC model in this paper is a two-body oscillating system shown in Figure 2. The upper (1st) body is the buoy, the lower (2nd) body has two discs, which are submerged and moored in the water. The distance between the two bodies is 2 m. The permanent magnet linear electrical machine (PMLEM) connects both bodies rigidly, and is driven by their relative motions.

Figure 2.
Two-body wave energy converter configuration.
The equation of motion [29] of the two bodies can be expressed as:
where and are the mass of the 1st body and 2nd body, m∞,ij is the frequency-dependent added mass on ith body, which is caused by the motion of jth body at infinity frequency. , , , , , are correspondingly the displacement, velocity, and acceleration of the 1st and 2nd body. B1 and B2 are the damping coefficients for the 1st and 2nd body, which consist of viscous damping and velocity constraint damping. The velocity constraint damping is an extra damping that can be adjusted and applied to the system to guarantee that the two bodies will never have a contact (relative displacement is not greater than 2 meters). Rij is the frequency-dependent radiation damping on ith body caused by jth body. m∞, ij and Rij are both obtained by boundary element method solver WAMIT [30]. K1 is the hydro-static coefficient for the 1st body. K2 is the mooring stiffness for the 2nd body and are the control forces, which are provided by the PTO actuator. Fe1 and Fe2 are the excitation forces on the 1st and 2nd body.
Figure 3 presents the power-calculation solution flow chart. The input Hs1,2 (significant wave heights) and T1,2 (significant wave periods) in the blue block are the ground truth swell and wind waves datasets from Martha’s Vineyard Coastal Observatory. The bimodal spectrum can be generated by a standard 2-parameter equation as:
where S(ωi) is the power density at the frequency ωi, ωi is one of the selected frequencies in the frequency vector input in Figure 3 flow chart (blue portion), The whole spectrum should include all the frequencies in the frequency vector. Hsj and Tj are corresponding to the significant wave height and period inputs of the swell and wind waves. The Wave-by-wave prediction method has been applied and it has been explained in [24]. According to Section 2.1, the Hs1,2 and T1,2 datasets update every 20 min, so that a 20-min long wave record will be generated. The excitation coefficient, radiation damping coefficient, frequency-dependent added mass and hydra static restoring coefficient in the orange block can be obtained by the boundary element method solver WAMIT based upon the buoy design parameters. More details about coefficients calculation are introduced in the WAMIT manual [30]. The optimal control parameter Kd and Kp can be obtained by the complex conjugate control method [20] based upon the impedance matching control theory. According to this method, for regular wave record (only one frequency ⍵i), the equation of the buoy linear motion can be expressed in time domain as:
where M, C, K, and Fei correspondingly represent the total force from inertia portion, damping portion, stiffness portion and excitation force of the two-body system, z is the displacement of connected PMLEM translator, ui is the control force and it can be expressed as:
where Kpi and Kdi are the optimal control parameters for the regular wave record with one frequency. Thus, the translator motion equation is:
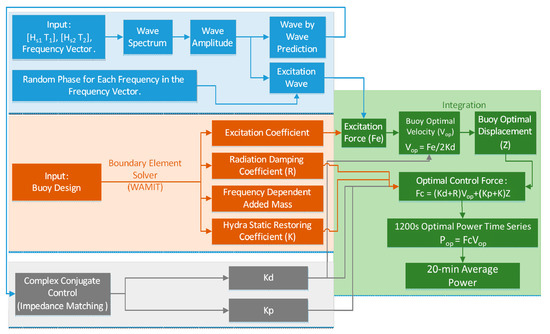
Figure 3.
Power generation code flow chart.
To have the optimal extraction power for regular wave record, the velocityneeds to be in phase with the excitation force, so the optimal control gains can be determined by:
For irregular wave record with more frequencies (⍵1-n), the control gains can be determined by:
The total optimal control gains (Kp and Kd) of irregular wave record with multiple frequencies can be determined by the sum of the optimal control gains (Kpi and Kdi) of each included regular wave frequency.
The wave excitation force time series (Fe in green box Figure 3) is a 1200 s time series according to the generated wave record. It is calculated by the excitation wave (blue box Figure 3) and the excitation coefficient (orange box Figure 3). The time step of Fe time series is 0.57 s based upon the frequency vector input in Figure 3. The optimal buoy velocity (Vop) time series is determined by Equation [20]:
Integrate Vop time series to have the optimal buoy displacement z time series, and the required control force (Fc in green box Figure 3) is calculated by:
where Kd + R represents the system optimal damping and Kp + K represents the system optimal stiffness, R and K are both determined by boundary element solver WAMIT [30] in the orange box of Figure 3. Vop and Fc time series are both 1200 s time series with 0.57 s time steps. The optimal extraction power (Pop) of the buoy is the product of Fc and Vop. Average the 1200 s optimal power time series of Pop to have one 20-min average optimal power sample.
2.3. Optimal 20-min Mean Power Time Series of Available Wave Power in 2015
The simulation models in this paper are all generated by Matlab 2019 (Natick, MA, USA). Figure 4 presents the 20-min average optimal power time series of 2015. The different colors represent months from January to December. The x-axis is the layout of all the 20-min average power samples according to the time sequence. The annual average power is 1.77 kW, with the total energy amounting to 14.71 MWh. However, the variance of the 20-min average optimal power is significant throughout the year, especially in January, February, March, April, and October. The maximum power sample happens in January, where it is higher than 15 kW, and the lowest power is 0.025 kW in March. The maximum power samples in June, July, August, and September are relatively lower than other months. In May, November, and December, the maximum power samples are intermediate.
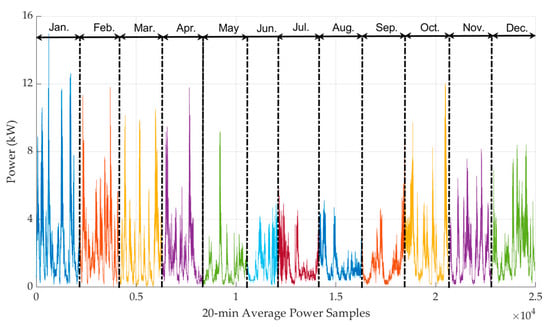
Figure 4.
Optimal 20-min average power time series in 2015.
2.4. Sensor Supporting and Insurfficient Average Power Samples
The sensor application is one kind of phytoplankton remote sensing applications for phytoplankton measurement. The sensor requires a 0.04–0.06 kW power demand. However, adding losses and safety factors, a load of 0.12 kW is considered for each sensor. Based on the 2015 power time series (Figure 4), the required 0.12 kW for one sensor is not met by the optimal extraction power throughout the year. Table 1 shows all the 20-min samples that are insufficient to supply one 0.12 kW sensor. The date and time in Table 1 are the actual time when the periods happened in 2015. The index presents the sequence of the sample in the power time series (Figure 4). In Table 1, there are 19 samples lower than 0.12 kW in 2015, which is 0.08% of the total usable samples. Some of these 19 samples are highly separated in different days and months. However, sample 5492 to sample 5557, which includes 53% of the 19 samples, happened in March. The insufficient power samples (lower than 0.12 kW) will demand ESS support to fulfill the buoy control requirements and the sensor load power requirement. The variance between the high-power and low-power samples can also become a challenge for the PTO and ESS design, especially when the power time series is in small time steps (0.57 s) instead of 20-min. There will be 52,519,750 samples for the whole year if presenting the time series with 0.57 s step time, which are too many for this paper. Thus, ground truth ocean wave inputs in March will be selected for discussing the following electrical machine and energy storage system modeling and integration. The selection is based upon the power variance level in Figure 4 and the insufficient power sample number in Table 1.

Table 1.
20-min power samples lower than 0.12 kW.
3. Static Modeling of Power Take-Off and Energy Storage System
The power take-off (PTO) and energy storage system (ESS) design configuration is shown in Figure 5. In this section, the PTO and ESS model will be integrated to the buoy dynamic model (Section 2). The inputs from the buoy dynamic model are the optimal buoy speed and required control force time series with 0.57 s time step. It has been assumed that the PMLEM translator will follow the optimal buoy speed trajectory when the control force requirements are fulfilled. The PMLEM modeling can be converted into permanent magnet rotational electrical machine modeling by applying equivalent radius (req Figure 5), which relates to the electrical machine permanent magnet design parameter, pole pitch. Thus, the control force requirements input will become torque demands input and the optimal velocity input will become optimal rotational rotor speed input in this section. Under these assumptions, the PMLEM dynamic modeling in dq frame is expressed as:
where the vdq is the inverter voltage, Rs is the stator resistance, Ldq is the inductance in dq frame, idq is the stator current, is the rotor electrical rotational speed and is the magnet field flux. The dynamic terms () in the equation can be neglected in the static model.
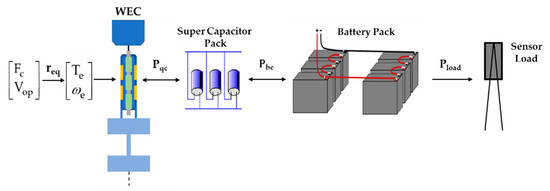
Figure 5.
Power take-off and energy storage system electrical drive configuration.
The d-axes current is controlled to be zero [31]. Then the control required torque and iq can be expressed as the following equation:
where Te is the electrical torque of the machine and np is the pole pair number.
According to Equations (10) and (11), Equation (12) is a power extracting constraint for the inputs, while the PMLEM operates as a generator:
where ωe and Te are the optimal rotational speed and torque demand input time series. The constraint is required since the designed PMLEM may not be able to fulfill the control requirements for all the inputs, although it has been assumed to be in the static modeling. If the control requirements cannot be fulfilled by the PMLEM as a generator, it will be operated as a motor even when there is available wave energy for extracting. Table 2 shows three different operation modes of the PMLEM.

Table 2.
Electrical machine operation modes while considering power extracting constraint.
Based upon Table 2, in operation mode 1, the PMLEM must provide power as a motor for the buoy to fulfill the control requirements. In mode 2, there is available wave power to extract and the inputs (ωe and Te) do not violate the Equation (12) constraint, so the electrical machine can extract wave power as a generator. In mode 3, there is available wave power to extract; however, Equation (12) constraint is violated, which means the designed PMLEM cannot fulfill the control requirements by the inputs. Thus, the PMLEM will work as a motor and provide the exact same amount of the required torque for the buoy control.
The outputs from the PMLEM model are required current (iq) and voltage (vq and vd) time series. id has been controlled to a constant 0. Therefore, the generated power on d-axis is 0. The controllers and actuators in the electrical drive in Figure 5 are all assumed to be ideal. The voltage and current demands will always be fulfilled by these actuators. The actuators behaviors and losses will not be discussed in this paper. Under these assumptions, the inputs to the following ESS components are also feedforward and static. Based upon the configuration in Figure 5, the supercapacitor pack will have rapid responses to fulfill the PMLEM control requirements. It can either store or provide energy to support the PMLEM operating as a generator or a motor. The PMLEM will be controlled to have the exact required iq to fulfill the buoy control force requirement, and the required current between the PMLEM and the supercapacitor pack can be determined by iq since the all the components on the bus have been assumed ideal.
The energy storage module includes a supercapacitor pack and a battery pack, as shown in Figure 5. The supercapacitor pack has been assumed ideal in this static modeling, except for internal resistance. The battery cell in the battery pack is modeled based upon the battery equivalent circuit model. The equivalent circuit is shown in Figure 6.
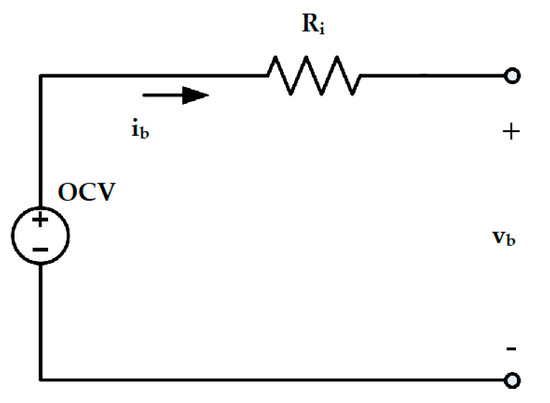
Figure 6.
Battery cell equivalent circuit.
In static modeling, the battery equivalent circuit has been simplified to a constant OCV with a resistor in series. The inductance and capacitance behaviors are neglected in static modeling. Therefore, the modeling equation can be expressed as:
where ib is the battery internal current and vb is the battery voltage. The battery pack aims to store the harvested energy and support the supercapacitor pack and the load sensor in the meantime. The load sensor connects to the battery pack and requires a constant power supply. One of the ocean sensor applications requires a constant 0.12 kW power supply with a 120 V DC.
4. PTO and ESS Static Modeling Parameters and Results
The design parameters are shown in Table 3. The design parameters were chosen based upon the wave power level and buoy control requirements

Table 3.
Power take-off and energy storage system components design parameters.
Based upon the buoy dynamic model in Section 2, the optimal velocity (Vop) and the required control force (Fc) are both time series with 0.57 s time step. For one set of 20-min ocean wave data (Hs and T of swell and wind waves), there are 2015 samples in the time series. The inputs (Vop and Fc) of 2015 March to the PMLEM are shown in Figure 7. The buoy-required control force in Figure 7 is over 50 kN, and the buoy velocity is below 4 m/s. The strong magnets with large field flux of the PMLEM design can help to fulfill these requirements. The optimal power output (Pop) from the buoy dynamic model is the product of the Vop and Fc time series according to the flow chart in Figure 3. The positive Pop is the optimal harvesting power from the waves to the PTO and the negative Pop is the required power from the PTO for the buoy complex conjugate control.
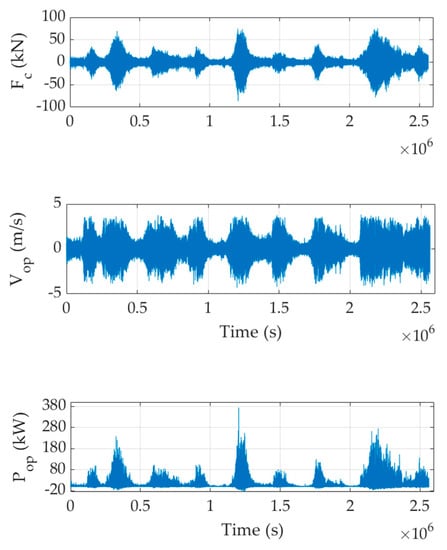
Figure 7.
Buoy-required control force and optimal velocity inputs in March.
The electrical machine outputs in dq frame are shown in Figure 8. The vq can reach over 3000 V according to the figure. The high voltage inverter is required to convert the current from the AC to DC. To lower the vq, the PMLEM demands increased field flux, pole pair number, or lower req, but it will cause an increased current flow in the bus. Positive Pqc happens when the PMLEM is in motor mode and providing power for the buoy control. Negative Pqc means the PMLEM is extracting power from the waves. The maximum extracting power can be higher than 350 kW and the maximum reverse power is smaller than 20 kW. The values are very close to Pop but in the opposite power flow direction.
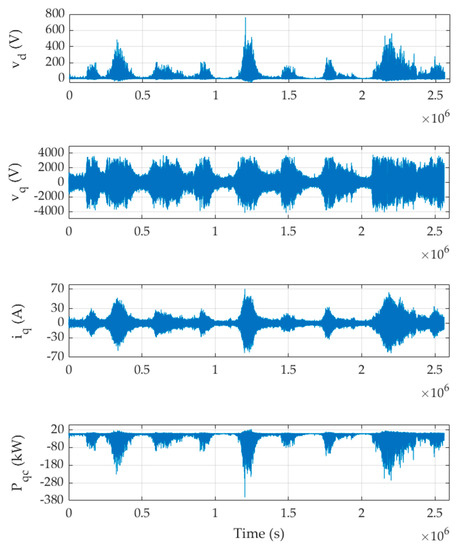
Figure 8.
Electrical machine outputs in March.
The supercapacitor pack and the battery pack are the energy storage system for the WEC design in this paper. The operation status is shown in Figure 9. The iqc is the current from the capacitor to the PMLEM. Positive current discharges the capacitor and negative charges it. The capacitor needs to provide the demanded current for the buoy complex conjugate control. The ib is the battery current, the positive current discharges and the negative charges. The battery pack will support the sensor load and store all the energy from the capacitor. Furthermore, the battery can also charge the capacitor back to the desired SOC level. In this design, the battery current in Figure 9 is the sum of the current to the capacitor and the current to the load sensor. The max charging current for the battery pack can reach 200 A. According to Figure 9, the stored energy amounts to 1168 kWh in the whole month if the battery pack pre-charged level is 0. The required capacity for the battery pack is excessive to store all the extracted energy. The designed PTO can harvest much more energy than one of the applications demanded.
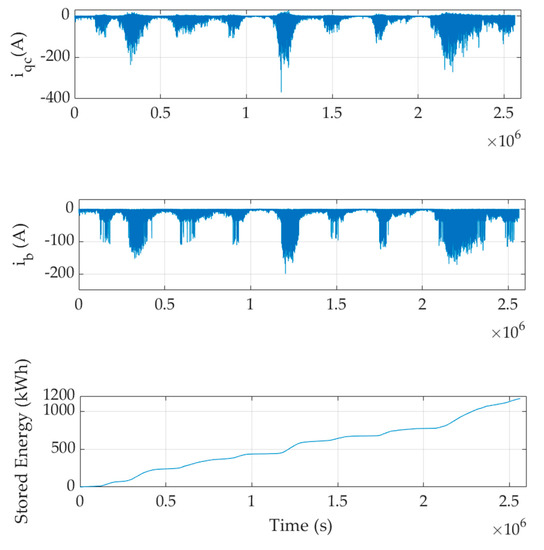
Figure 9.
Energy storage module behaviors in March.
5. Power Take-Off and Energy Storage System Rule-Based Control
Rule-based control can ensure that the PTO and ESS designs are more specific for the required demands. Based upon the results in Section 4, there is much excess energy stored in the battery pack while supporting one load sensor. The rule-based control strategy can be applied to downsize the PTO and ESS systems scale and increase the design feasibility.
5.1. Electrical Machine Generating Efficiency Constraint
The PMLEM working efficiency varies significantly during the whole month. According to Table 2, the PMLEM does not need to fulfill any efficiency constraint while working in motor mode, since the buoy may still require a large control force when the oscillation speed is almost 0. However, if the generating efficiency is too low, the extremely small extracting voltage and current requirements will be difficult to be fulfilled by the following components in the electrical drive. Concerning this, a generating efficiency constraint can be applied to filter out low generating efficiency inputs (Fe, Vop) and fulfill the control requirements by operating the PMLEM in motor mode. Based upon the static modeling, the electrical machine generating efficiency is:
where ωm is the equivalent mechanical rotational speed (converted from Vop by applying req) of the generator rotor, and is a scale factor when calculating power in dq frame. Based upon the former sections, the inputs to the PMLEM model are Te and ⍵e time series, which are converted from the buoy dynamic model outputs Fe and Vop time series. Thus, the electrical machine generating efficiency constraint can be applied by the following equation:
where ηb is the efficiency boundary to filter the inputs.
Figure 10a shows all the generating points of March on a generating efficiency contour map of the designed PMLEM (Table 3). The lowest efficiency is almost 0. There are no data points on the negative efficiency portion (dark blue area) owing to the generating constraints (Equation (12)). The maximum generating efficiency of the month can be above 99%. The efficiency boundary is set to 70% in Figure 10b. After filtering, the generation time is 82.23% of the month, which was 82.89% before filtering (29,688 inputs have been filtered out). The slight decrease in generating time can barely change the charging/discharging behavior of the supercapacitor pack and the battery pack. The stored energy in the battery pack decreases to 1167 kWh from 1168 kWh.
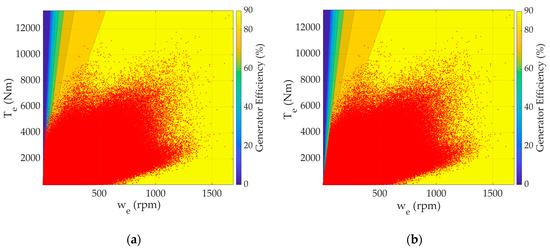
Figure 10.
March generating efficiency contour map. (a) Generating points without any efficiency constraint. (b) Generating points with 70% efficiency constraint.
5.2. Required Control Force Limitation for Downsized Electrical Machine
The buoy control force demands based upon complex conjugate control must be fulfilled by the PTO. The buoy design in this paper can extract more wave energy than one sensor load demand but requires a large control force (over 50 kN according to Figure 7). If the electrical machine can fulfill the large control force requirement, the WEC system can operate without any breaks. In this case, the designed electrical machine can be downsized to fulfill the specific ocean sensor power demand instead of generating much excess energy stored in the battery. The downsized electrical machine will only work when small wave oscillations engage, and it will be locked down and enter a safe mode when aggressive waves come to prevent the PTO components from being crashed by aggressive waves. The required control force output and optimal extracting power output from the buoy dynamic model will be 0 while the WEC is in safe mode. According to the Martha’s Vineyard Observatory ocean wave data, one set of bi-spectrum wave data can present the wave status in a 20-min long period. Thus, if the maximum required control force of one bi-spectrum is greater than the PTO limitation, the WEC will be locked down for 20 min.
Hs and T required control force matrixes are shown in Figure 11. The color bar shows the average extraction power of 20 min. The average extraction power increases with PTO maximum control force limitations (MCFL) increase. When the MCFL is 10 kN, only small waves can be captured by the buoy, so the average extraction power is low. If the MCFL is increased to 50 kN, the average extraction power can reach over 3000 W. However, the increased MCFL does not have a simple linear correlation with the increased average extraction power.
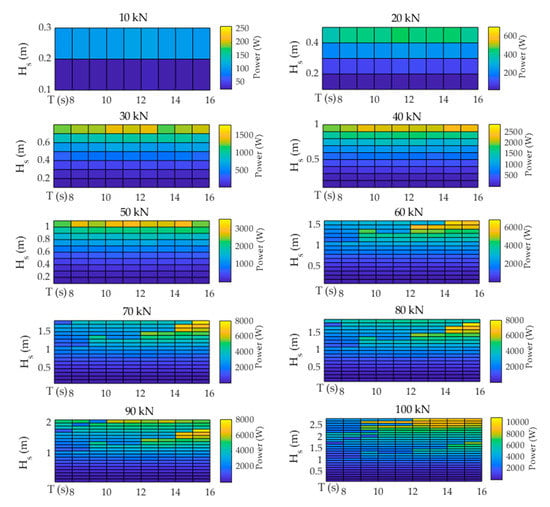
Figure 11.
MCFL matrix.
The matrix in Figure 11 is for a single spectrum. The maximum required control force threshold of the bi-spectrum can be determined by the sum of the maximum required control force of the swell spectrum and the wind waves spectrum. Therefore, the maximum bi-spectrum MCFL PTO constraint can be expressed as:
where MCFLbi is MCFL of the bi-spectrum, MCFHs1T1 and MCFHs2T2 are the maximum required control force of one set of swell and wind waves inputs. The MCFLbi can represent the theoretical maximum required control force of the bi-spectrum, but the actual required control force can be smaller than this value due to phase differences at the same frequency between the two spectrums. However, it is more common to use power to size electrical machines instead of the max torque the machine can provide. Thus, the maximum power limitation (MPL) constraint for the PMLEM can be expressed as:
where MPLbiG,M is the MPL constraint for the bi-spectrum when the PMLEM is in generator or motor mode; ωeG(t) and TeG(t) are the rotational speed and torque time series inputs to the PMLEM according to the bi-spectrum while the PMLEM is in generator mode; vqM(t) and iqM(t) are the voltage and current time series in dq frame when the PMLEM is in motor mode. The max power of the inputs to the PMLEM must not be greater than the MPLbiG,M; if it does, the inputs time series cannot be accepted by the downsized PMLEM and the WEC system will be locked down for 20 min.
5.3. Results with Constraints Applied on the Electrical Machine
The MPLbi of the PMLEM has been set to 30 kW. The constrained inputs (Fc and Vop) are shown in Figure 12. According to Figure 12, the continuous 0 values (gaps) are seen in the time series when the WEC is locked down. The required control force (Fc) and the optimal buoy velocity (Vop) will be 0 in the lockdown periods, so will the optimal extracting power (Pop). It has been assumed that the WEC buoy will go back following the optimal velocity trajectory without any delay after releasing the lockdown. The maximum required control force is less than 25 kN, which means that only small waves can be captured by the buoy based upon the Figure 11 matrix. The maximum Vop decreases to about 2 m/s from 4 m/s compared to Figure 7. The maximum Pop is always smaller than 30 kW.
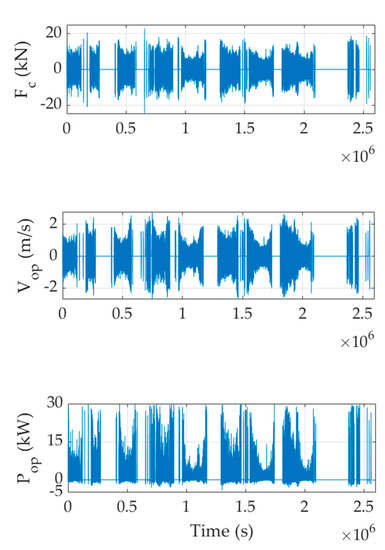
Figure 12.
Constrained buoy dynamic inputs in March.
The downsized PMLEM has different parameter setups. The field flux φf has been decreased down to 10 Wb from 25 Wb. Small permanent magnets can still fulfill the input requirements. Because the parameters have been modified, the generating efficiency contour map of the PMLEM is changed as well. While considering the same generating efficiency constraint (70%), the updated generating efficiency contour map is shown in Figure 13.
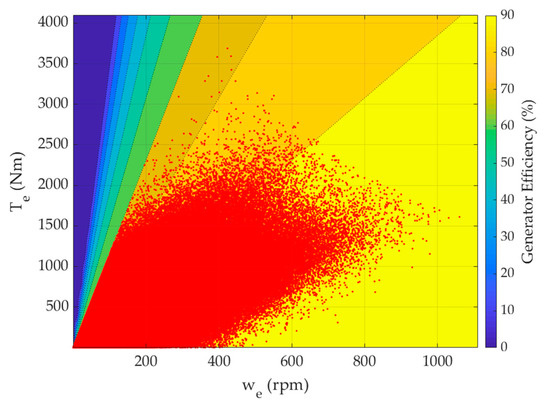
Figure 13.
Constrained March generating contour map.
The slope of the high-efficiency boundary (90%) in Figure 13 decreases significantly (comparing to Figure 10) because of the decreased magnet field flux. While applying the MPL and generating efficiency constraints, the generating time only takes a 20.64% of the whole month. The PMLEM outputs are shown in Figure 14.
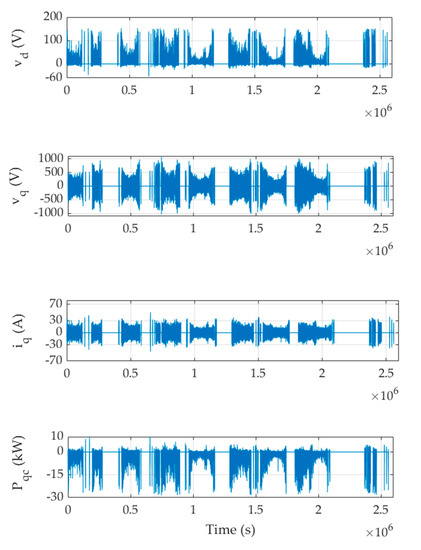
Figure 14.
Constrained electrical machine outputs in March.
In Figure 14, the PMLEM output vq decreases to lower than 1000 V from 3500 V, vd decreases to 150 V from 780 V. The decreased voltage will increase the design feasibility for the following components in the electrical drive. The current iq is on the same level comparing to Figure 8. There are no samples in the Pqc time series having power higher than 30 kW since the inputs have been constrained to 30 kW. With the updated parameters, the capacitor pack fully charged OCV can also be decreased to 300 V (comparing to Table 2) and the pre-charged level can be decreased to 270 V. The energy storage system behaviors are shown in Figure 15.
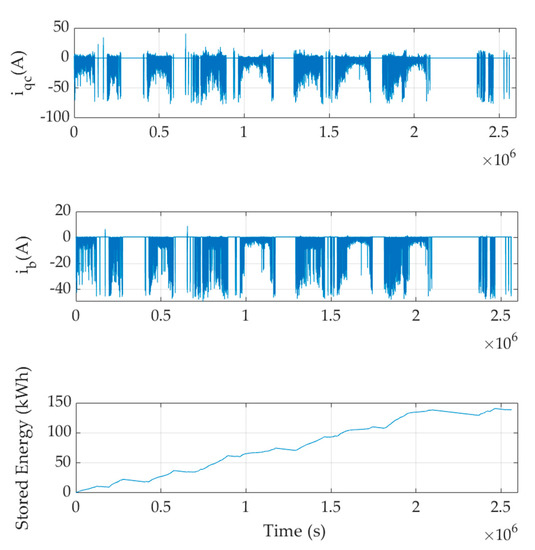
Figure 15.
Energy storage module behaviors in March.
According to the graph in Figure 15, the current flows (iqc and ib) decrease significantly comparing to Figure 9. The current ib is slightly higher than 0 when the WEC is shut down since the battery pack needs to keep discharging to supply the load sensor. The required battery pack capacity can be decreased to 140 kWh from 1168 kWh in Section 4. According to the input required control force in Figure 12, the max control force is smaller than 25 kN. The 20-min average extracting power will be smaller than 0.4 kW based upon the MCFL matrix in Figure 11. Moreover, the generating constraints have filtered generating inputs down to about 20%. Thus, the average generating power of the whole month will be even lower.
With this downsized PTO, the extremely high voltage (over 3500 V DC) and current fluctuations requirements can be eliminated. The sensor load power demand can still be fulfilled with the small PTO. The amount of stored energy in the battery pack is still large. Supporting multiple sensor loads can be considered to size the PTO and the battery pack in the most efficient way. The problem of the required battery capacity will be discussed in the next section.
5.4. Battery Pack Sizing for Multiple Sensor Loads with PTO Power Limitations
Supporting multiple sensor loads will be considered in this section since the amount of the stored energy in the battery pack is large when the PMLEM is in aggressive waves. The design parameters of all the other PTO and ESS components will remain the same as in Section 5.3 except for the PTO power limitations and the battery pack capacity. The flow chart in Figure 16 presents the battery pack sizing algorithm.
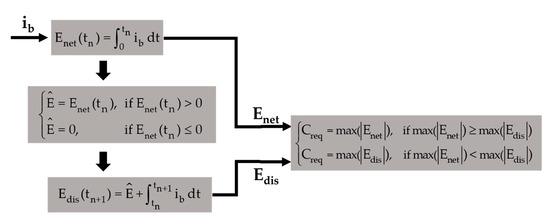
Figure 16.
Battery pack sizing algorithm flow chart.
In Figure 16, the inputs are the battery current (ib). Integrate ib from time 0 to time tn to obtain the total extracted net energy at tn. Enet is the net energy at different times. The Enet is used to determine the maximum value of the extracted energy to be stored in the battery pack. Edis is used to determine the maximum value of the discharged energy while the wave power is not sufficient. If Enet(tn) is positive, it means the wave power is not sufficient (positive ib means discharging) and the value of Enet(tn) is the energy that the battery pack needs to provide by time tn. A positive Enet(tn) value will be integrated to the following Edis(tn+1) calculation. If Enet(tn) is negative (negative ib means charging), it means the wave power is sufficient at time tn, a negative Enet(tn) value will be fixed to 0 for the following Edis(tn+1) calculation. At the end, the greater one of the maximum absolute values of the Enet and Edis is the required capacity of the battery pack.
Based upon different MPL setups and sensor load numbers, while using the sizing algorithm in Figure 16, the required capacity (Creq) of the battery pack module can be obtained, as shown in Table 4. According to Table 4, the required capacity numbers that have been bolded are acceptable as WEC on-board battery pack design considering the space constraints. When the MPL is small (10 kW, first row in Table 4), the Creq increases, as does the sensor load number. It means the wave power is not sufficient and the discharged energy (Edis) determines Creq values. Increasing the load number will consume more energy, so the maximum absolute value of Edis increases. When the MPL is greater (such as 100 kW), the wave power will be sufficient and the stored energy (Enet) will determine Creq values. Thus, Creq decreases with an increasing sensor load number since more loads consume more stored energy. The design of 50 kW MPL and 6 sensor loads is a promising combination according to Table 4 since it is at the boundary of sufficient and insufficient wave power design, so the extracted wave power can be utilized maximumly. For greater MPLs, such as 250 kW, the PTO can support more sensor loads (about 89 kWh per load per month) than it shows in Table 4. While increasing the sensor load number, the boundary will be noticed as well. The PTO and ESS sizing will be more specific and efficient while considering the sizing strategies in this section.

Table 4.
Battery pack sizing for different PTO MPLs and loads in March.
6. Discussion and Conclusions
The PTO and ESS design cannot be isolated from the buoy dynamic behaviors and control strategy requirements. The optimal extracting power from the buoy can be achieved only when the control requirements can be fulfilled perfectly well by the PTO. This paper discusses the integration methodology between the buoy dynamic model and the WEC PTO electrical drive model. High demand control inputs will give stringent design requirements to the PTO and ESS components. According to the results in Section 4, the required control force can be higher than 90 kN while the translator speed is around 4 m/s. The PMLEM design will be very limited by this stringent demand. Furthermore, the converted high power from the slow buoy motion will result in current fluctuations in the bus, while it will influence the electrical drive design and ESS design significantly. Instead of capturing all the optimal wave power, the PTO and ESS should be designed to fulfill the demand of selected applications and purposes. The operation constraints and rule-based control strategies introduced in Section 5 can improve the PTO and ESS design efficiency. In this paper, the sensor load power demand can be fulfilled by a small-scale PMLEM instead of a larger one extracting excess energy. The high voltage bus can be decreased to 1000 V from 3500 V. The definitions of MCFL and MPL are also introduced in Section 5.2. The Hs-T-MCFL matrix in Figure 11 can help future PTO and ESS sizing since it relates the MCFL and the average power to the ground truth Hs and T. Such as the 30 kW PMLEM in this paper, the MCFL would be lower 25 kN according to Figure 12. If the sum of the required control forces of the bi-spectrum is greater than 25 kN, then the waves can be too aggressive for the PMLEM. In this way, for a specific ocean area with a certain WEC buoy design, the PTO and ESS can be designed and sized for the future without relying on a large amount of historical ocean data. The static modeling of the direct drive WEC PTO electrical drive is enough to determine the dominant parameters set-up for the PTO and ESS design. To further improve the PTO and ESS design reliability and specificity, the dynamic behaviors of actual electrical drive components can be integrated. An optimization strategy can also be applied to determine the optimal rule-based control boundaries in the future.
Author Contributions
Conceptualization, X.Z., O.A. and W.W.; Methodology, X.Z., O.A. and W.W.; Software, X.Z. and O.A.; Validation, X.Z., O.A. and W.W.; Formal analysis, X.Z.; Investigation, X.Z. and W.W.; Resources, X.Z., O.A. and W.W.; Data curation, X.Z. and W.W.; Writing—original draft preparation, X.Z.; Writing—review and editing, X.Z. and W.W.; Visualization, X.Z. and W.W.; Supervision, O.A. and W.W.; Project administration, W.W.; All authors have read and agreed to the published version of the manuscript.
Funding
This research received no external funding.
Conflicts of Interest
The authors declare no conflict of interest. The funders had no role in the design of the study; in the collection, analyses, or interpretation of data; in the writing of the manuscript, or in the decision to publish the results.
References
- Prakash, S.; Mamun, K.; Islam, F.; Mudliar, R.; Pauu, C.; Kolivuso, M.; Cadralala, S. Wave Energy Converter: A Review of Wave Energy Conversion Technology. In Proceedings of the 2016 3rd Asia-Pacific World Congress on Computer Science and Engineering (APWC on CSE), Nadi, Fiji, 5–6 December 2016. [Google Scholar]
- Foteinis, S.; Tsoutsos, T. Strategies to improve sustainability and offset the initial high capital expenditure of wave energy converters (WECs). Renew. Sustain. Energy Rev. 2017, 70, 775–785. [Google Scholar] [CrossRef]
- Moschos, E.; Manou, G.; Dimitriadis, P.; Afentoulis, V.; Koutsoyiannis, D.; Tsoukala, V.K. Harnessing wind and wave resources for a Hybrid Renewable Energy System in remote islands: A combined stochastic and deterministic approach. Energy Procedia 2017, 125, 415–424. [Google Scholar] [CrossRef]
- Zhou, Z.; Benbouzid, M.; Charpentier, J.F.; Scuiller, F.; Tang, T. A review of energy storage technologies for marine current energy systems. Renew. Sustain. Energy Rev. 2013, 18, 390–400. [Google Scholar] [CrossRef]
- Wang, L.; Lee, D.-J.; Lee, W.-J.; Chen, Z. Analysis of a novel autonomous marine hybrid power generation/energy storage system with a high-voltage direct current link. J. Power Sources 2008, 185, 1284–1292. [Google Scholar] [CrossRef]
- Faiad, A.A.; Gowaid, I.A. Linear generator technologies for wave energy conversion applications: A review. In Proceedings of the 2018 53rd International Universities Power Engineering Conference (UPEC), Glasgow, UK, 4–7 September 2018. [Google Scholar]
- Memon, A.H.; Ibrahim, T.B.; Nallagowden, P. Design optimization of linear permanent magnet generator for wave energy conversion. In Proceedings of the 2015 IEEE Conference on Energy Conversion (CENCON), Johor Bahru, Malaysia, 19–20 October 2015. [Google Scholar]
- Zhang, J.; Yu, H.; Chen, Q.; Hu, M.; Huang, L.; Liu, Q. Design and Experimental Analysis of AC Linear Generator with Halbach PM Arrays for Direct-Drive Wave Energy Conversion. IEEE Trans. Appl. Supercond. 2014, 24, 1–4. [Google Scholar] [CrossRef]
- Huang, L.; Chen, M.; Wang, L.; Yue, F.; Guo, R.; Fu, X. Analysis of a Hybrid Field-Modulated Linear Generator for Wave Energy Conversion. IEEE Trans. Appl. Supercond. 2018, 28, 1–5. [Google Scholar] [CrossRef]
- Farrok, O.; Islam, M.R.; Sheikh, M.R.I.; Guo, Y.G.; Zhu, J.G. Design and Analysis of a Novel Lightweight Translator Permanent Magnet Linear Generator for Oceanic Wave Energy Conversion. IEEE Trans. Magn. 2017, 53, 1–4. [Google Scholar] [CrossRef]
- Wang, L.; Isberg, J.; Tedeschi, E. Review of control strategies for wave energy conversion systems and their validation: The wave-to-wire approach. Renew. Sustain. Energy Rev. 2018, 81, 366–379. [Google Scholar] [CrossRef]
- Murray, D.B.; Hayes, J.G.; Egan, M.G.; Osullivan, D.L. Supercapacitor testing for power smoothing in a variable speed offshore Wave Energy Converter. In Proceedings of the 26th Annual IEEE Asia-Pacific Economic Cooperation (APEC), Fort Worth, TX, USA, 6–11 March 2011. [Google Scholar]
- Guney, M.S.; Tepe, Y. Classification and assessment of energy storage systems. Renew. Sustain. Energy Rev. 2017, 75, 1187–1197. [Google Scholar] [CrossRef]
- Ekström, R.; Leijon, M. Control of offshore marine substation for grid-connection of a wave power farm. Int. J. Mar. Energy 2014, 5, 24–37. [Google Scholar] [CrossRef]
- Rohit, A.K.; Devi, K.P.; Rangnekar, S. An overview of energy storage and its importance in Indian renewable energy sector. J. Energy Storage 2017, 13, 10–23. [Google Scholar] [CrossRef]
- Aubry, J.; Bydlowski, P.; Multon, B.; Ahmed, H.B.; Borgarino, B. Energy storage system sizing for smoothing power generation of direct wave energy converters. In Proceedings of the the International Conference on Ocean Energy (ICOE), Bilbao, Spain, 6–8 October 2010; ISBN 978-84-693-5467-4. [Google Scholar]
- Sjolte, J.; Tjensvoll, G.; Molinas, M. All-electric Wave Energy Converter array with energy storage and reactive power compensation for improved power quality. In Proceedings of the 2012 IEEE Energy Conversion Congress and Exposition (ECCE), Raleigh, NC, USA, 15–20 September 2012. [Google Scholar]
- Garcia-Rosa, P.B.; Cunha, J.P.V.S.; Lizarralde, F.; Estefen, S.F.; Machado, I.R.; Watanabe, E.H. Wave-to-Wire Model and Energy Storage Analysis of an Ocean Wave Energy Hyperbaric Converter. IEEE J. Ocean. Eng. 2014, 39, 386–397. [Google Scholar] [CrossRef]
- Prudell, J.H.; Schacher, A.; Rhinefrank, K. Direct drive ocean wave energy electric plant design methodology. In Proceedings of the 2012 Oceans, Hampton Roads, VA, USA, 14–19 October 2012. [Google Scholar]
- Song, J.; Abdelkhalik, O.; Robinett, R.; Bacelli, G.; Wilson, D.; Korde, U. Multi-resonant feedback control of heave wave energy converters. Ocean Eng. 2016, 127, 269–278. [Google Scholar] [CrossRef]
- Brown, A.; Thomson, J.; Rusch, C. Hydrodynamic Coefficients of Heave Plates, with Application to Wave Energy Conversion. J. Ocean. Eng. 2018, 43, 983–996. [Google Scholar] [CrossRef]
- Wilson, D.G.; Robinett, R.D.; Bacelli, G.; Abdelkhalik, O.; Weaver, W.W.; Coe, R. Nonlinear WEC Optimized Geometric Buoy Design for Efficient Reactive Power Requirements. In Proceedings of the OCEANS 2019 MTS/IEEE SEATTLE, Seattle, WA, USA, 27–31 October 2019. [Google Scholar] [CrossRef]
- Hillis, A.J.; Plummer, A.R.; Zeng, X.; Chapman, J. Simulation of a power electronic conversion system with short-term energy storage for actively controlled wave energy converters. In Proceedings of the 2019 Offshore Energy and Storage Summit (OSES), Brest, France, 10–12 July 2019. [Google Scholar] [CrossRef]
- Korde, U.A.; Song, J.; Robinett, R.D.; Abdelkhalik, O.O. Hydrodynamic Considerations in Near-Optimal Control of a Small Wave Energy Converter for Ocean Measurement Applications. Mar. Technol. Soc. J. 2017, 51, 44–57. [Google Scholar] [CrossRef]
- Woods Hole Oceanographic Institution. MVCO. Available online: https://mvco.whoi.edu/data-history (accessed on 4 May 2020).
- Allahdadi, M.N.; Gunawan, B.; Lai, J.; He, R.; Neary, V.S. Development and validation of a regional-scale high-resolution unstructured model for wave energy resource characterization along the US East Coast. Renew. Energy 2019, 136, 500–511. [Google Scholar] [CrossRef]
- Neary, V.S.; Ahn, S.; Seng, B.E.; Allahdadi, M.N.; Wang, T.; Yang, Z.; He, R. Characterization of Extreme Wave Conditions for Wave Energy Converter Design and Project Risk Assessment. J. Mar. Sci. Eng. 2020, 8, 289. [Google Scholar] [CrossRef]
- Woods Hole Oceanographic Institution. MVCO. Available online: https://mvco.whoi.edu/infrastructure (accessed on 4 July 2020).
- Abdelkhalik, O.; Zou, S.; Robinett, R.D.; Bacelli, G.; Wilson, D.G.; Coe, R.; Korde, U. Multiresonant Feedback Control of a Three-Degree-of-Freedom Wave Energy Converter. IEEE Trans. Sustain. Energy 2017, 8, 1518–1527. [Google Scholar] [CrossRef]
- Lee, C.-H. WAMIT Theory Manual; Massachusetts Institute of Technology, Department of Ocean Engineering: Cambridge, MA, USA, 1995. [Google Scholar]
- Eriksson, S. Design of Permanent-Magnet Linear Generators with Constant-Torque-Angle Control for Wave Power. Energies 2019, 12, 1312. [Google Scholar] [CrossRef]
© 2020 by the authors. Licensee MDPI, Basel, Switzerland. This article is an open access article distributed under the terms and conditions of the Creative Commons Attribution (CC BY) license (http://creativecommons.org/licenses/by/4.0/).