Abstract
The berthing of an ultra large ship is always a difficult issue and becomes yet more complex when vessels must be handled in restricted manoeuvring areas of limited depth, exposed to a forceful crosswind, or manoeuvring in a strong current, or all three. The final approaching manoeuvre and precise positioning is particularly demanding at container terminals where many STS cranes are located along the quay, seriously limiting margin for error in the process of mooring a ship, especially when the cranes are located nearby a bridge wing or at the very edge of the pier. In order to avoid collisions, the final manoeuvre (side-push) must be fully controlled; the ship’s orientation must be parallel with the quay while maintaining the minimum lateral approaching velocity without significantly shifting the vessel longitudinally. The mooring of a Ro-Ro vessel is occasionally even more challenging: a precise docking manoeuvre is normally executed without any towing assistance. In this paper low cost laser-based berthing and docking systems developed for the ports of Koper and Swinousce are presented and several berthing manoeuvres are analysed and compared with the most commonly used GNSS-based navigational aid system portable pilot units (PPU).
1. Introduction
Every port represents its own set of challenges to provide safe navigable waterways along with properly designed harbour approach channels [1]; adequate basin area available for manoeuvring and wharf approaching [2]; and guaranteeing completely safe berthing for particular ships for the duration of their stay [3]. Adverse weather can render even a well-designed mooring facility unsafe, but as long as the ship can safely leave the port or is carefully monitored while moored, such a port may still be considered safe. Ordinary good navigation and seamanship will not render a port unsafe [4]. This paper focuses on near shore vessel positioning required for safe berthing or docking, as well as monitoring vessels moored alongside. In berthing and unberthing situational awareness in the surrounding area is essential for the pilots and masters in order to take appropriate actions especially at the final manoeuvring stage where the speed of approach, distance, and angle of attack must be precisely determined. At the end, every vessel meets the berthing wharf, transferring a significant amount of energy, mostly depending on the ship’s speed and its displacement tonnage [5]. It is obvious that the approaching speed must be controlled to avoid damaging the ship’s hull, fenders, and other elements of berthing infrastructure.
According to the British Standard [6], risk reduction measures can consist of equipment installed on board the ship or at the berth. Such equipment could be either installed at shore with display units visible from the ship’s bridge, or Portable Pilot Units (PPU) used on board the ship [7]. Various levels of awareness can be obtained from a PPU, which is currently used in many ports. It is a computer-based system that a pilot brings onboard a vessel to use as a decision-support tool for navigation, docking procedures or lock entry [8]. The unit is interfaced with either vessel positioning and heading sensors, or it may have its own advanced sensors providing centimetre position accuracy (less than 2 cm RMS when L1/L2 RTK GNSS service is available) and heading precision up to 0.01 deg. An advanced system is commonly used at LNG terminals and when other sensitive operations like the handling of very large vessels, narrow passages, side-by-side mooring and locking are involved in the process. PPU systems are definitely useful and highly recommended for pilots when handling vessels in the “ballistic” manoeuvring phase and during the final “side-pushing” or “positioning” phase when the elements of global satellite-aided positioning system (GNSS) are not obstructed and when the pilot has enough time to properly set-up the advanced PPU system; i.e., fill in receiving antenna positions (in body fixed coordinate system) and identifying the ships gyro heading offset, if possible.
At some locations, such as the port of Koper, the approaching and berthing pilotage phase is extremely short, so there often is not enough time to set-up an advanced PPU system (pilots sometimes execute more than 10 manoeuvres in their 12 h shift). Even so the GNSS satellite signal may be obstructed or redirected in certain navigational areas, thus consequently ordinary PPU based on ship’s Automatic Identification System (AIS) does not always provide reliable data. Precise vessel position, transversal speed, and vessel-approaching angle are of great importance for safely berthing large container vessels particularly when inadequate fenders await and ship-to-shore (STS) cranes are near. The greatest pressure currently on ports is “Scale Enlargement,” a euphemism for the incessantly increasing size of vessels along with the extreme pressure put on ports to accommodate this phenomenon. The rapid increase in ship sizes forces ports into a state of virtually constant adjustment. Container vessels are the best example of ships that grow faster than ports [9,10]. As early as 2004 an article warned of berthing challenges that would arise with ever bigger container ships; two particular challenges would be that they become more difficult to handle, and, worse, it would be difficult, at times impossible, to see the side of the quay once up close [11].
In recent years the cargo throughput in the port of Koper has averaged an annual growth of 8% with container growth as much as 16% yearly without an increase in the number of vessel calls. Management of this throughput was made possible by dredging activities and pier extension, allowing for the reception of larger vessels. Figure 1a depicts the evolution of the size of container ships calling at Koper in the last decade. The size doubles whether expressing deadweight tonnage (DWT) or Gross Tonnage (GT). When one of the larger vessels is alongside even minor yawing or list can cause contact with STS cranes, with catastrophic results. The extremely small gap between ship and crane is evident from Figure 1b.
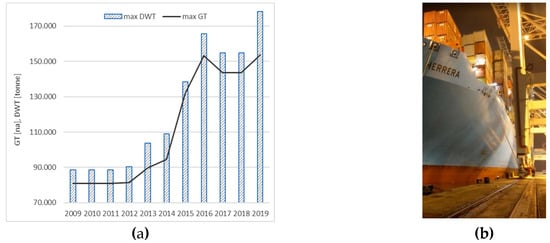
Figure 1.
Evolution of the size of container ships calling at Koper (a) and ship-to-shore (STS) crane close proximity (b).
The largest cranes, necessary for the largest vessels, must be fitted on the extant rails, which were designed, originally, to provide a safe distance between the vessels and cranes. This is not speculative, as one can see from the disastrous events of Figure 2 and Table 1, all occurring in 2019. Each of these collisions had a major impact on the port, aside from the already significant cost of replacing the damaged cranes. The port, at least near the incident, closes, the replacement can take up to a year, and of course operators may find an alternative port in the meantime.

Figure 2.
Container ship/crane collisions (a) with bow; (b) stern and (c) ships’ bridge wing.

Table 1.
Container ship/crane accidents in 2019.
During the last decade, the development of ship sizes of Ro-Ro/Ro-Pax vessels and the scale enlargement of product tankers have also been problematic. As the vessel sizes and amount of traffics increases, safe and efficient berthing becomes more challenging worldwide. Among the many incidents in recent years, in the port of Koper in 2017 a Ro-Ro vessel, having moored then broken away, crashed into the bulk terminal, knocking over a crane, seriously damaging the pier (100 meters had to be replaced).
The worst of this type of accident occurred just as this paper was being finalized (on 6 April 2020 in Busan port). Due to an uncontrollable high-speed, the container ship "Milano Bridge" collided with an entire strip of container cranes on the dock. Only one of the six gantry cranes remained functional after the accident. As possible causes, the investigators cited not only speed, but also a shorter reaction time after turning, insufficient power from tugs due to the high forward speed and lack of effect of the bow thrusters. The crew had not taken into account the fact that the ship was empty and was sailing with a partially submerged rudder, nor had they sufficiently considered the local weather conditions and, on top of all that, the pilot panicked as the ship approached the dock. Given the extraordinary cost of the cranes, the economic impact requires no elaboration.
2. Berthing Aid System, Development and Some Applications
2.1. An Historic Overview
The need for berthing support systems first emerged in the oil and gas industry. With increasing size and complexity of tankers, the owners had to pay more attention to potential risk factors when planning to handle larger ships, preventing possible damage to both jetties and ships, and, of course, preventing environmental pollution (along with insurance and demurrage). In the early 1970s the first mooring load monitoring system was developed in Norway, based on strain-gauged load measuring pins installed into the quick release hooks to measure the tension in the mooring line [12]. The first real docking and monitoring system integrated with sonar-based speed of approach measurement, environmental and meteorological sensors, was designed in 1990 [12]. At almost the same time developments in the measurement of speed of approach were tending to favour radar-based applications-ultrasonic systems had a problem with surrounding water and fouling of the ships’ hull. The radar also had some difficulties [11], not being a focused sensing device, backscattering data must be filtered and any changes in surroundings like a moved or moving crane would require additional filtering, a software upgrade. Finally, with the development of eye-safe lasers more accurate and reliable berthing and docking measurements in all weather conditions were made possible. Comparison of ultrasound, radar and laser diode ranging systems using a dedicated scale is presented in Table 2, considering: range, power, dependability of weather, beam size, method of measurement, refresh rate, price and lifetime. Ultrasound can be eliminated, and both radar and laser ranging solutions are capable of being used in berthing and docking systems. A laser-based ranging system is not subject to weather; the most significant problem theoretically is reflectivity of the measured object (the vessel in this case). With radar a microwave is reflected by the flat surfaces and the method of measurement used here−frequency modulated continuous wave (FMCW)–provides a very reliable solution with the same antenna for received and transmitted signals. The pulse system used in the lasers is resistant to external interferences and usually is coded. The FMCW method used in radars is very rugged and not affected by interference. Because of the range factor, radar is not used to their full potential; lasers have better flexibility. Another consideration is that radar is approximately 5 times more expensive than laser.

Table 2.
Comparison of methods.
Another advancement is the integration of the ranging system with others, like positioning, environmental, and PPU. Among others a non-commercial alternative has been provided by a laser measurement system integrated with a high precision positioning pilot navigation docking system (PNDS), which was proposed for the docking of LNG vessels [13]. A low-cost integrated laser ranging and berthing system integrated with meteorological and oceanographical data (MetOcean) was developed for the safe passage through the narrow winding channel and the final berthing of large vessels calling at the container terminal in the port of Koper [14] (the precise descriptions apply to the methods used at the port of Koper; others may, for instance, place the LiDARs in different strategic locations). Installing ranging devices on moving STS cranes is more complicated compared to jetty installation, where sensors are at fixed positions. When a container vessel is berthing, STS cranes are tied down to the wharf structure (wharf anchorage) at s known position, so the exact LiDAR positions are always known. LiDARs and processing units are located on the STS (ship to shore) crane, just above the wheels or about at 2 m height (Figure 3). For the sake of accuracy, while the vessel is approaching, the STS crane (one with LDS units) shall be located wherever the vessel’s outline is parallel. The parallel body of the vessel hull can be found at the middle part and can be as much as 60% of the vessel length. The equipment used for measurements is a combination of different sensors and modules that are remotely controlled by pilots through specific user interfaces.
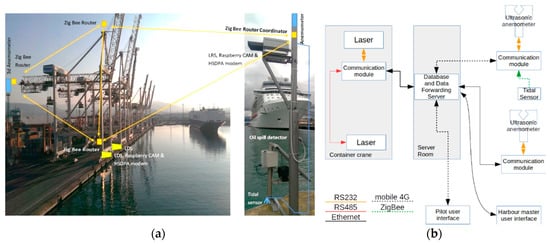
Figure 3.
Laser ranging and berthing system (a) port of Koper installation, (b) communication protocol.
The list of equipment is shown in Table 3. In order to extend laser diode lifetimes, devices are powered on demand. The laser distance meters in the docking system provide 2 cm accuracy for distances up to 300 m, while the ranging sensor provides 1.5 cm accuracy up to 400 m. All anemometers are able to measure wind velocities in three directions between 0 and 65 m/s, which is sufficient in the area of interest. Measurement can be provided at a sample rate of 20 Hz. The resolution of the ultrasonic tidal sensor is 1 cm.

Table 3.
Comparison of methods.
2.2. Some Applications
The berthing aid or docking system measures the precise distance from which lateral speed and orientation of an approaching vessel is calculated in real time. Even though this system can monitor vessel movement only when it is allied with the jetty (i.e., when both laser beams are reflected from the parallel part of vessel hull called parallel body), it still provides invaluable information to the captain or pilot when berthing a ship. Additionally, such a system can be used as a vessel drift warning system, identifying uncontrolled vessel movements caused by passing vessels that cause ship-to-ship interaction, or when a ship is moved by strong winds or currents. Furthermore, the entire docking operation is thus recorded, and the data can be used to evaluate potential incidents.
In order to measure the longitudinal position of an approaching vessel, the laser system must be integrated with the vessel’s AIS system, providing GNSS data and the ships’ heading information. When precise front-end docking is required (Ro-Ro), a differential GNSS system which provides centimetre accuracy can be used along with 3D laser scanning devices.
Data gained from the berthing aid system are additionally applied for the development of new port design recommendations and standards; i.e., researchers have been investigating different methods of fender design. Sakakibara and Kubo [15] used a docking sonar system and found actual berthing conditions that were not in line with those used for design purposes. They have presented a measurement of pressure on pneumatic fenders; Metzger et al. [16] conducted a similar study based on using ultrasonic distance sensors calculating vessel kinematics and analysing pressure on fenders. Yamse et al. [17] analysed more than 2500 instances of berthing velocities in various conditions (14 terminals in 6 countries) and found that their results did not fit the Brolsma curve [18] used as a standard for designing fenders based on vessel velocity, displacement tonnage, and navigational conditions. One of the most important discoveries [17] is that winds blowing under 10 m/s do not contribute to the increase in berthing velocity. At winds under 10 m/s the berthing velocity depends solely on the ship and its port assistance. They found that there is no need to divide ports and berthing velocities into five groups; Rather they have grouped berthing velocities in types A and B, based on operator experience and environmental conditions (Table 4). Ueda [19] statistically analysed laser-based measured berthing velocities-obtained at different container terminals located in Japan and elsewhere in East Asia. Large vessel berthing impact was analysed by Hein [20] where vessel kinematics was measured with radar-based systems, while Roubus et al. [21] and Kirbiš et al. [22] used a laser-based system. Berthing velocities are relatively low in the port of Koper, as fairly indicated in the study. Berthing velocities are significantly lower even for group A, where excellent operators are handling vessels in temperate MetOcean conditions.

Table 4.
Berthing velocities.
In the scope of unmanned navigation, which is still solving a variety of technical problems, largely to do with automation [23], the laser ranging and berthing system is one of the core subsystems of autonomous surface vessels required for collision avoidance [24,25].
4. Advanced Integrated LiDAR Based Docking System Specifically for Ro-Pax
4.1. Layout
To extend the capabilities of a positioning system based on laser distance measurements, an extended system based on laser scanners has been proposed. A test version of such a system has been implemented at a terminal ferry in the port of Świnoujście, Poland. It consists of two 3D LiDAR sensors located in such a way that bow/stern and the sides of the ship can be scanned at any time during the berthing/unberthing manoeuvre. LiDARs specification is given in Table 8 and the full architecture of the system is presented in Figure 8 and consists of laser scanners, two CCTV cameras, server, AIS receiver, anemometer, power system and data network.

Table 8.
LiDARs specification (outdoor use).
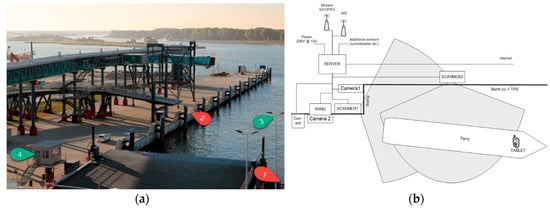
Figure 8.
Ferry post no 1 in Świnoujście port and the location of the system devices: 1, 2—laser scanners, 3—anemometer and camera, 4—camera, AIS receiver, server (a), photo taken by C.Aszkiełowicz. System diagram (b).
The data from the system are provided by on-board tablets which communicate with a server hosted application via LTE internet connection. Such an approach makes it simple to update and extend the application remotely, without the need to access the end users’ devices. The application provides information about the ship’s outline in relation to the berth, together with minimum distances: ship’s side, berth and ship’s bow/stern ramp. It also provides wind data, calculated velocities (longitudinal and transversals) and calculated heading.
4.2. Positioning, Velocity Determination and Ship Orientation Algorithm
Since it is impossible to establish the exact geometry of the hull and the actual draft of a ship using only two LiDARs, the system has been adapted for two specific ferries that use the berth on a daily basis. For each ship a family of outline shapes has been prepared, taking into consideration expected changes in draft. The positioning algorithm, after reading data points from both LiDARs, performs the following operations (Figure 9a):
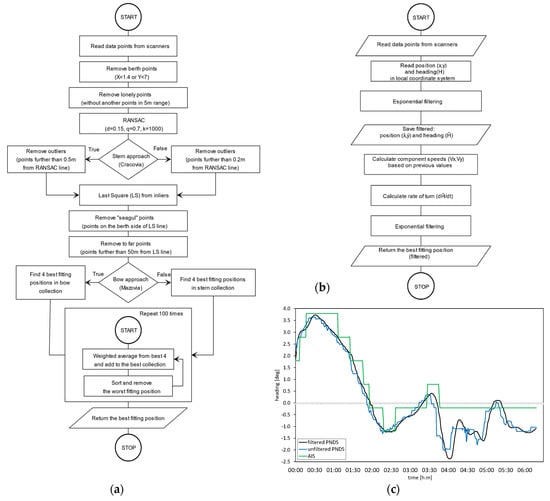
Figure 9.
Algorithm for ship’s position estimation (a); estimation and smoothing algorithm for course and velocities (b) with processed ship’s true heading (c).
- 1)
- Removes points identified as berth points (based on (x,y) coordinates)
- 2)
- Removes isolated points, i.e., points that do not have any neighbouring points in a 5 m radius
- 3)
- Approximates ship’s side-line using the RANSAC algorithm
- 4)
- Removes outliers
- 5)
- Estimates ship’s side using the Least Square Method (LMS)
- 6)
- Removes false points, e.g., points from seagulls flying low, inside the scanner’s range
- 7)
- Finds the best estimation for ship’s stern/bow
- 8)
- Returns best fit of ship’s position.
The position of the ship’s stern/bow is estimated by minimizing the sum of squares of distances between points and the ship’s outline. This operation is repeated no less than 100 times (until the result does not improve by more than 0.00001). In Figure 10, the ship’s sideline is illustrated, along with the points that were used to determine it. The points that are detected by the individual LiDAR are drawn in corresponding colours, in red and blue.
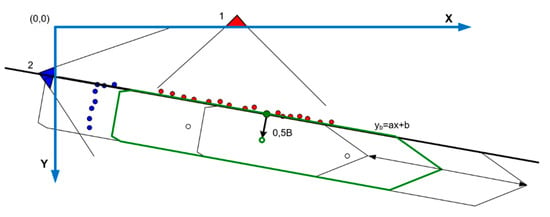
Figure 10.
Estimation of ship’s position from LIDARs measurements.
The RANSAC algorithm is used specifically to estimate the best line that fits points acquired by both LiDARs by minimizing a monotonically increasing function of the absolute values of the signed error for each point:
The exact implementation of the RANSAC algorithm, based on [30], performs the following steps:
- 1)
- Selects two points randomly.
- 2)
- Solves in regard to the line parameters.
- 3)
- Determines how many points from the set of all points fit with a tolerance of 0.15 m.
- 4)
- If less than 70 percent of all points exceeds the assumed tolerance, repeats steps 1–3 but not more than 1000 times.
- 5)
- Otherwise, terminate the algorithm.
After the RANSAC algorithm is terminated a set of points located not more than 0.2/0.5 m (depending on the given ship) is selected. This set is used to re-estimate the line using the Least Square Method. The ship’s state obtained from RANSAC is base position and course vector (xi, yi, Ki); it is transformed in every time step into velocities (vx, vy, ω). In this case the filtering and tracking itself is performed by algorithm based on a very simple and robust exponential smoothing by Holt method with Pegels’ multiplicative trend and additional damping (Figure 9b) [31]. The applied algorithm allows the estimation of the location of the ship’s gravity centre and course in the next time step (xi+1, yi+1, Ki+1), the ship’s velocities in 3 degrees of freedom (vx, vy, ω), and the future (predicted) ship parameters given up to 3 min (ship tendency). The smoothing is done in separate steps for all three parameters (vx, vy, ω) according to the following formula:
where:
—smoothing coefficient,
—dampening coefficient,
—estimated parameter.
The values of smoothing coefficients ) have been estimated based on the real time simulation trials for Ro-Pax ferries where minimum values of mean square errors were found for all estimated values.
4.3. Verification of the System’s Performance
During the stage of system development, the verification of system performance and algorithm accuracy was based on the comparison between the position calculated by the system and the position reported by the AIS system. A system of cameras was utilized as well to visually evaluate the stages of the manoeuvre and ship’s dynamics. All comparisons were made using the developer version of the application. The first stage of the verification was based on a comparison between the position reported by the AIS system (GNSS position) and the position calculated by the PNDS algorithm. Due to the number of AIS messages, equal to around 6 messages per minute, only positions at the time of a new message were compared.
The point for which the AIS position is reported was evaluated statistically by measuring and analysing the position of the ferry when it was moored. For both ships it was evaluated as the point located on the longitudinal symmetry axis, 153 m from the aft perpendiculars for the Cracovia ferry and 140 m from the aft perpendicular for the Mazovia ferry. The observed position deviation for the estimated AIS points is equal to 0.82 ± 0.40 m. An example of values reported by the AIS and calculated by PNDS system are shown by Figure 11 (Ais R-heading, in relation to the north, Scan R- heading in relation to the berth; check both green and blue frames). Taking into consideration the lack of detailed information about the location of CCRP on both ships, delays during transmission, and the reception of AIS messages and the general accuracy of the GNSS system, the observed position accuracy may be acknowledged as very high and in accordance with PNDS system assumptions.
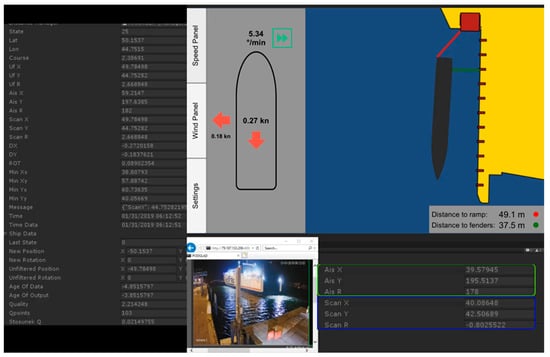
Figure 11.
Test application prepared for the purpose of verification of pilot navigation docking system (PNDS) system and comparison of position reported AIS and calculated by PNDS system (green and blue frames).
4.4. Verification of the System Under Real Conditions
The PNDS system was installed on two ferries. In both cases a tablet docking station was installed in accordance with the recommendations and requirements of the captains. Each captain was fully informed about the functionality and restrictions of the system and was trained to use it. Two developers took part in a first voyage after the installation to check the performance of the system and answer any question the captains might have. Because of differences in cargo operations the ferries approach their berth in different ways.
The Mazovia ferry moves to the southern part of the berth, enters the turning circle located next to the Basen Bałtycki, rotates and approaches the berth moving north, parallel to the berth. The general average approach is shown in Figure 12a. The Cracovia ferry reduces velocity to 0–1 knot and using thrusters approaches parallel to the berth. At the last stage, the ship corrects location along the berth (Figure 12b).
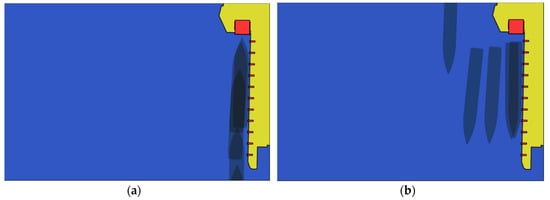
Figure 12.
Mazovia ferry longitudinal approach (a), Cracovia ferry in transversal approach (b).
Longitudinal speed, lateral speed, and angular speed are calculated directly form changes of position and rotation of the ship’s outline in time. The application of kinematic equations and an exponential filter gives the basis for an assumption that the accuracy of speed indication directly depends on how often and how accurate the system calculates course and position. Independently from the above assumption, a set of comparisons during manoeuvres was conducted.
All comparisons included recording speed values from on board equipment (like log and gyrocompass) and values from the PNDS system. Because the PNDS system can calculate the speed only when the ship is in range of both laser scanners, the time when the comparison could be made was only a few minutes during each manoeuvre. In 72% of randomly chosen moments linear velocities shown by on-board equipment did not differ by a more than 15%. In the case of angular speed, the average difference was ± 1.5 degree/min. It was noted during those test that the on board equipment that is used during manoeuvres displays longitudinal and lateral speeds with an accuracy of 0.1 knots (Figure 13a), while the PNDS systems displays those values with an accuracy of 0.01 knots (Figure 13b). Thus, the PNDS system provides more accurate data.
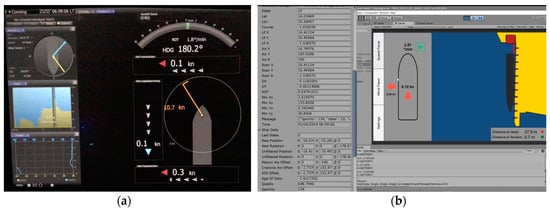
Figure 13.
Comparison of speed and tendency of the Cracovia ferry during berth approaching: data available through ship’s conning station (a), and PNDS (b).
Values of distances calculated by the system were verified with the use of a standard, handheld laser distance meter when the ships were moored. Due to the opened bow door on the Mazovia ferry it was not possible to measure an exact distance between the ramp and the ship’s outline (Figure 14a). For the Cracovia ferry the calculated distance from the ramp to the stern differed by a margin of 15 cm when compared to manual measurements. Such a difference is acceptable as per system assumptions. Figure 14b,c shows ship’s side measurements.
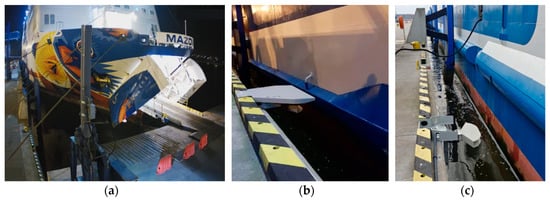
Figure 14.
Location of the m/f Mazovia bow in relation to the ramp during cargo operations on Ferry post no 1 (a). Location of the m/f Mazovia side in relation to the berth. Laser scanner, shore fender and ship’s bumper are visible. The system reports correct distance between the ship and fenders (b). Location of the m/f Cracovia side in relations to the berth. Laser scanner, shore fender and ship’s bumper are visible. The system reports incorrect distance between the ship and fenders (c).
Regarding the distance between the berth and sides of the ferries, the maximum observed difference was over 90 centimetres. Two main factors responsible for such a difference were identified:
(1) Documentation of both ferries does not represent the accurate shape of the external hull-just the general layout and the shape of a theoretical outline at deck levels. This data was used to create hypothetical ship outlines that are used for the system during calculations.
(2) On both ferries the external hull has an extruded bumper throughout its length. This bumper is the point of direct contact between the ship and the fender. Without the information about current ship’s draft and the shape of the external hull it is not possible to evaluate whether the laser scanner measures the distance to the side of ship or to the bumper.
This can lead to a situation where the ship is in contact with the fender, but the laser scanner measures the distance to the ship’s side, so the system reports the distance of around 0.5 m. Because of this, the system does not report exact distances between 0 and 0.5 m Instead it shows that the distance is less than 0.5 m.
5. Conclusions
Experts in maritime commerce rightly lament the dangerous speed of growth of vessels, particularly in the container business. However, in one instance a great deal of expense and an increasing threat has been solved at an extremely low cost. The laser-based berthing and docking system is the safest means of ensuring the integrity of the berthing and docking process (the system installed at the port of Koper has been operating without failure or degradation for five years at the moment of this writing). PPU is perhaps good enough when obstructions like cranes do not exist, but where they do, their accuracy is not sufficiently reliable. Where PPU appears good enough, a laser-based system is an inexpensive means of even safer berthing and if nothing else should be made available for purposes of redundancy. A novel way of fusing GNSS positioning data with LIDAR measurements has been proposed. The benefit of such a system is the combination of ship GNSS longitudinal position with its lesser accuracy with the high-precision lateral positioning, thus minimizing the risk of collision.
The loss of a crane, which we have been using as our worst case scenario, is catastrophic for a port even without death and injury—the expense is immense, and the time to repair the area of a fallen crane and the replacement of it is considerable. There have been numerous ship-to-crane collisions resulting in damage measured in millions of Euros, and a lidar-based system is significantly less than 1 percent of likely damage in the case of a single accident. The only limitation in regard to the system is the impossibility of spreading the lasers far enough apart at, for instance, container terminals to be absolutely certain of the orientation of the ship to the quay.
For the needs of Ro-Ros, which require the most precise docking, an advanced integrated docking system was developed based on 3D scanners combined with the PPU system, finally providing a working solution to the problem of the need for clear outlines of vessels both laterally and longitudinally as they approach the pier.
Author Contributions
Conceptualization, M.P., L.G.; methodology, L.G., M.P., B.L.; data collection: B.L., M.P., L.G., V.L.; software, M.B. (Milan Batista), B.L., B.M., M.B. (Mateusz Bilewski); validation, M.P., B.L., P.V., F.D. All authors have read and agreed to the published version of the manuscript.
Funding
This research received no external funding.
Acknowledgments
The authors acknowledge the Port of Koper, the Slovenian Maritime Administration, marine pilot Matjaž Felicjan, and Blaž Kirbiš.
Conflicts of Interest
The authors declare no conflict of interest.
List of Acronyms
| AIS | Automatic Identification System |
| AIVDO/AIVDM | NMEA AIS sentence format, where; AI–Mobile AIS station; VDO–AIS VHF Data-link Own-vessel report; VDM-AIS VHF Data-link Message |
| C/S | Container Ship |
| CCRP | Consistent Common Reference Point |
| CCTV | Closed-Circuit Television Camera |
| DWT | Deadweight Tonnage |
| ECDIS | Electronic Chart Display and Information System |
| FMCW | Frequency Modulated Continuous Wave |
| GMDSS | Global Maritime Distress and Safety System |
| GNSS | Global Navigation Satellite System |
| GT | Gross Tonnage |
| HEHDT/HEROT | Vendor specific messages where; HDT–True Heading Data; ROT–Rate of Turn |
| IMO | International Maritime Organization |
| LDS | Laser Docking Sensor or System |
| LiDAR | Light Detection and Ranging |
| LMS | Least Square Method |
| LNG | Liquefied Natural Gas |
| LTE | Long-Term Evolution |
| MetOcean | Meteorology and Oceanography |
| NMEA | National Marine Electronics Association; tandard for data interchange in marine navigation systems |
| NTP | Network Time Protocol |
| PNDS | Pilot Navigation and Docking System |
| PPU/PN | Portable Pilot Unit/Pilot Navigation Sistem |
| RADAR | Radio Detecting And Ranging |
| RAIM | Receiver autonomous integrity monitoring |
| RANSAC | Random sample consensus |
| Ro-Pax | Roll-On-Roll-Off-Passenger-ship/ferry |
| Ro-Ro | Roll-On/Roll-Off |
| ROT | Rete of Turn |
| RTK | Real-Time Kinematic |
| SNR | Signal-to-Noise Ratio |
| SOG | Speed Over Ground |
| STS | Ship to Shore |
| TEU | Twenty-Foot Equivalent Units |
| UTM | Universal Transverse Mercator |
| VDR | Voyage Data Recorder |
References
- PIANC. Harbour ApproacH Channels Design Guidelines, PIANC Report n 121; The World association for Waterborne Transport infrastructure: Brussles, Belgium, 2014. [Google Scholar]
- ROM 3.1-99. Recommendations for Maritime Works, Design of the Maritime Configuration of Ports, Approach Channels and Harbour Basins; Puertos del Estado: Madrid, Spain, 2007. [Google Scholar]
- Kharchanka, A. The Meaning of a Good Safe Port and Berth in a Modern Shipping World. Ph.D. Thesis, University of Groningen, Groningen, The Netherlands, 2014. Available online: https://www.rug.nl/research/portal/files/32037387/Complete_thesis.pdf (accessed on 7 January 2020).
- Rabeaux, J. Safe Ports and Berths in a Nutshell, Defence Guides DCG-SPB-GBR-19-V1, West of England Insurance Services. 2016. Available online: https://www.westpandi.com/getattachment/bda5d2f7-8283-43e1-abbb-9727e7c7a0cb/safe_ports_and_berths_4pp_v2_lr.pdf (accessed on 20 April 2020).
- Carbonari, S.; Gara, F.; Antolloni, G.; Gara, F.; Lorenzoni, C.; Mancinelli, A. A performance-based approach for the design of coupled dolphin-fender berthing structures. Marine Struct. 2019, 64, 78–91. [Google Scholar] [CrossRef]
- BS 6349-4:2014. Maritime Works—Part 4: Code of Practice for Design of Fendering and Mooring Systems; BSI Standards Limited: London, UK, 2014. [Google Scholar]
- Selwyn, P. Better docking for both pilots and terminals. J. Ports Termin. 2015, 66, 1–2. [Google Scholar]
- APA. Portable Pilots’ Units: A Best Practices Summary, American Pilots’ Association. 2016. Available online: http://www.americanpilots.org/PPUBestPracticesAPA_%2027Oct2016.pdf (accessed on 7 January 2020).
- Perkovic, M.; Brcko, T.; Luin, B.; Vidmar, P. Ship Handling Challenges When Vessels are Outgrowing Ports. In Proceedings of the IMLA-INSLC 19 Proceedings, South African Maritime Training Academy, Western Cape, South Africa, 5–7 September 2016. [Google Scholar]
- Merk, O. Container Ship Size and Port Relocation, Discussion Paper; International Transport Forum: Paris, France, 2018. [Google Scholar]
- Integrating the Laser—Docking Made Easier with Advanced Systems Engineering. Available online: https://www.motorship.com/news101/industry-news/integrating-the-laser-docking-made-easier-with-advanced-systems-engineering (accessed on 20 April 2020).
- Thomas, S. An integrated approach to vessel berthing. J. Ports Termin. 2012, 27, 1–2. [Google Scholar]
- Gucma, L.; Bak, A.; Jankowski, S.; Zalewski, P.; Perkovic, M. Laser docking system integrated with Pilot Navigation Support System, background to high precision, fast and reliable vessel docking. In Proceedings of the 17th Saint Petersburg International Conference on Integrated Navigation Systems, St. Petersburg, Russia, 31 May–2 June 2010. [Google Scholar]
- Perkovic, M.; Gucma, M.; Luin, B.; Gucma, L.; Brcko, T. Accommodating larger container vessels using an integrated laser system for approach and berthing. Micropocess Microsist 2017, 52, 106–116. [Google Scholar] [CrossRef]
- Sakakibara, S.; Kubo, M. Ship berthing and mooring monitoring system by pneumatic-type fenders. Ocean Eng. 2007, 34, 1174–1181. [Google Scholar] [CrossRef]
- Metzger, A.T.; Hutchinson, J.; Kwiatkowski, J. Measurement of marine vessel berthing parameters. Mar. Struct. 2014, 39, 350–372. [Google Scholar] [CrossRef]
- Yamse, S.; Ueda, S.; Okada, T.; Arai, A.; Shimizu, K. Chracteristics of Measured Berthing Velocity and the Application for Fender Design of Berthing Ship. In Proceedings of the 33rd PIANC World Congress, San Francisco, CA, USA, 1–5 June 2014. [Google Scholar]
- Rankine, B. Berthing Velocities and Brolsma’s Curves. Project Report; Marine Consulting Engineers: London, UK, 2010. [Google Scholar]
- Ueda, S. Observation of Berthing Velocity (Japan and East Asia) and Statistical Analysis (Overall ports). In Proceedings of the 33rd PIANC World Congress, San Francisco, CA, USA, 1–5 June 2014. [Google Scholar]
- Hein, C. Berthing velocity of large container ships. In Proceedings of the 33rd PIANC World Congress, San Francisco, CA, USA, 1–5 June 2014. [Google Scholar]
- Roubos, A.; Groenewegen, L.; Peters, D.J. Berthing velocity of large seagoing vessels in the port of Rotterdam. Mar. Struct. 2017, 51, 202–219. [Google Scholar] [CrossRef]
- Kirbiš, B.; Perkovič, M.; Luin, B. Port of Koper Fighting the Growth of the Ships and Trying to Accommodate Large Container Vessels Using Laser-Ranging System. Available online: https://www.researchgate.net/publication/327816531_Port_of_Koper_Fighting_The_Growth_of_Ships_and_Trying_to_Accommodate_Large_Container_Vessels_Using_a_Laser-Ranging_System (accessed on 11 May 2020).
- Autonomous Shipping Concepts. 2020. Available online: https://www.norclub.no/blog/autonomous-shipping-concepts/ (accessed on 7 January 2020).
- Van Cappelle, L.E.; Chen, L.; Negenborn, R.R. Survey on Short-Term Technology Developments and Readiness Levels for Autonomous Shipping. In Computational Logistics; Cerulli, R., Raiconi, A., Voß, S., Eds.; Springer: Berlin/Heidelberg, Germany, 2018. [Google Scholar]
- Spange, J. Autonomous Docking for Marine Vessels Using a Lidar and Proximity Sensors. Ph.D. Thesis, Norwegian University of Science and Technology, Trondheim, Norway, 2016. [Google Scholar]
- Rumora, I.; Sikirica, N.; Filjar, R. An Experimental Identification of Multipath Effect in GPS Positioning Error. TransNav Int. J. Mar. Navig. Saf. Sea Transp. 2018, 12, 29–32. [Google Scholar] [CrossRef]
- Pirsiavash, A.; Broumandan, A.; Lachapelle, G.; O’Keefe, K. GNSS Code Multipath Mitigation by Cascading Measurement Monitoring Techniques. Sensors 2018, 18, 32. [Google Scholar] [CrossRef] [PubMed]
- Mekik, Ç. An investigation on multipath errors in real time kinematic GPS method. Sci. Res. Essays 2010, 5, 2186–2200. [Google Scholar]
- Hofmann-Wellenhof, B.; Lichtenegger, H.; Wasle, E. GNSS—Global Navigation Satellite System; Springer: Berlin/Heidelberg, Germany, 2008. [Google Scholar]
- Zhang, X.; Xu, W.; Dong, C.; Dolan, J.M. Efficient L-shape fitting for vehicle detection using laser scanners. In Proceedings of the IEEE Intelligent Vehicles Symposium (IV), Los Angeles, CA, USA, 11–14 June 2017. [Google Scholar]
- Taylor, J.W. Exponential Smoothing with a Damped Multiplicative Trend. Int. J. Forecast. 2003, 19, 715–725. [Google Scholar] [CrossRef]
© 2020 by the authors. Licensee MDPI, Basel, Switzerland. This article is an open access article distributed under the terms and conditions of the Creative Commons Attribution (CC BY) license (http://creativecommons.org/licenses/by/4.0/).


