Article

Granulometric Analysis of Shallow Vents Sediments at Banderas Bay (Mexico)

by
María Carolina Rodríguez-Uribe
1,*,
Francisco Javier Núñez-Cornú
2,
Rosa María Chávez-Dagostino
3 and
Elizabeth Trejo-Gómez
2
1
Department of Exact Sciences, Centro Universitario de la Costa, Universidad de Guadalajara, Puerto Vallarta, Jalisco 48280, Mexico
2
Centro de Sismología y Volcanología de Occidente (SisVOc), Centro Universitario de la Costa, Universidad de Guadalajara, Puerto Vallarta, Jalisco 48280, Mexico
3
Department of Biological Sciences, Centro Universitario de la Costa, Universidad de Guadalajara, Puerto Vallarta, Jalisco 48280, Mexico
*
Author to whom correspondence should be addressed.
J. Mar. Sci. Eng. 2020, 8(5), 342; https://doi.org/10.3390/jmse8050342
Submission received: 7 April 2020 / Revised: 30 April 2020 / Accepted: 8 May 2020 / Published: 12 May 2020
(This article belongs to the Section Geological Oceanography)

Abstract

:
Ocean hydrothermal activity is well known from deep-sea studies; however, few studies have been reported at shallow depth. A shallow submarine hydrothermal system at Punta Mita described in 2000 was studied to determine the grain size classification of the marine sediments of this hydrothermal system. Three sites with hydrothermal activity were included. Each one was divided into three areas: with hydrothermal activity, intermediate, and out of hydrothermal activity. In each area, two sediment cores were randomly collected by scuba diving (number of sediment cores = 18). All sediment samples were subjected to a previous treatment, to eliminate salts and organic matter. The grain sizes were sieved and then classified following the Udden–Wentworth scale. A principal coordinate analysis was performed to determine if there was any association of the statistical moments with the areas and sites of study. The textural composition of the sediments in the hydrothermal influence areas is sand, where the very fine sand is the dominant grain size, which was confirmed with the mean moment. The sediments are characteristic of the tidal areas, except for those sediments in the areas with hydrothermal activity.

1. Introduction

The hydrothermal activity in the shallow submarine hydrothermal system at Punta Mita (SSHSPM), located in Las Coronas fissure [1] in Banderas Bay, can be appreciated from the sea surface, due to the presence of gas bubbles rising from the seabed and bursting in contact with the surface. It is located in continental margins affected by tectonic extension processes with a high geothermal gradient [2], and it is not related to volcanic activity, as with most shallow submarine hydrothermal systems on the planet [3]. Hydrothermal activity takes place on basaltic rock fissures partially covered by uncemented sediments, and the discharges consist of gas and water, which reach temperatures of up to 85 °C [2]. According to Canet and Prol-Ledesma [2], this hydrothermal activity affects an area greater than 1 km2 at a depth of approximately 10 m. The oceanic environment of SSHSPM is influenced by four main currents: the California current, reflux from the Gulf of California, the north equatorial current, and the coastal current from Costa Rica [4]. Moreover, the bottom is subject to the action of waves, storms, and bottom currents [5]. The aforementioned prevents well-formed and large mounds on the vents, and only mounds with little vertical development are formed [5]. Canet and Prol-Ledesma [2] identified a mound up to 0.75 m high, but also reported that the currents and waves to which the seabed of SSHSPM is continually subjected have a high erosive power.
Since 2000, the scientific interest in SSHSPM arisen, which focused on the geochemistry of liquids and gases discharged by these shallow vents [6]. Prol-Ledesma et al. [7] reported geological aspects of the area surrounding SSHSPM and de la Vega-Márquez and Prol-Ledesma [8] reported the main lineaments in which this hydrothermal activity takes place. SSHSPM was proposed as a potential source of geothermal energy [2], which could be used by tourist resorts built in front of the beaches of the states of Jalisco and Nayarit, in Banderas Bay. Despite the above, little has been studied and published regarding SSHSPM.
Recently, Rodríguez-Uribe et al. [9] reported for the first time the presence of the amphioxus Branchiostoma californiense in the marine sediments within the influence area of SSHSPM. While Prol-Ledesma et al. [10] descriptively reported that small concentrations of macrofauna were observed in sediment samples collected in SSHSPM, nematodes and amphipods were the most abundant. They also concluded that these organisms are characteristic of those found in the sediments of the shallow-water vents in the Aegean Sea [11]. In their review, Tarasov et al. [3] highlighted that benthic meiofauna in shallow-water vents is better known than in deep-sea vents. All this led us to wonder about the distribution of grain size in the marine sediments in the active vents of SSHSPM and its influence area, since there is no scientific study that reports the granulometric classification of the sediments of this hydrothermal system. Related to this, Melwani and Kim [12] studied the distribution of the benthic infauna that inhabits the sediments of two shallow submarine hydrothermal systems, one in Bahia Concepcion (12 m depth), Mexico, and the other in White Point (8 m depth), California, USA. They included a granulometric analysis to characterize the grain sizes of the sediments in their study areas, and to determine the relationship between the benthic infauna concerned the grain size. Knowing the characteristics of marine sediments can help to understand the interactions between the marine environment and sedimentary deposits [13].
Blott and Pye [14] emphasized that grain size is the most fundamental property of sediment particles, since it affects its drag, transport, and deposition; similarly, an adequate granulometric analysis provides information on its origin, transport history and deposition conditions [15,16,17]. Whereas Sánchez et al. [18] emphasized that the granulometric tendencies of the sediments have been widely used to infer the possible trajectories of the clastic material in diverse coastal environments. This research aimed to determine the grain size classification of the marine sediments in SSHSPM and in its influence area, in order to leave a preliminary frame of reference for future studies related to the sediments of this hydrothermal system.

2. Materials and Methods

SSHSPM is located 300 m from the beaches of Punta Pantoque in Banderas Bay, Mexico (Figure 1). Three sites with hydrothermal venting were selected: Site 1 (S1) (20°44′54.7″ N, 105°28′40.6″ W), Site 2 (S2) (20°44′54.8″ N, 105°28′40.4″ W) and Site 3 (S3) (20°44′54.9″ N, 105°28′38.4’′ W). The three sites were at 9 m depth.
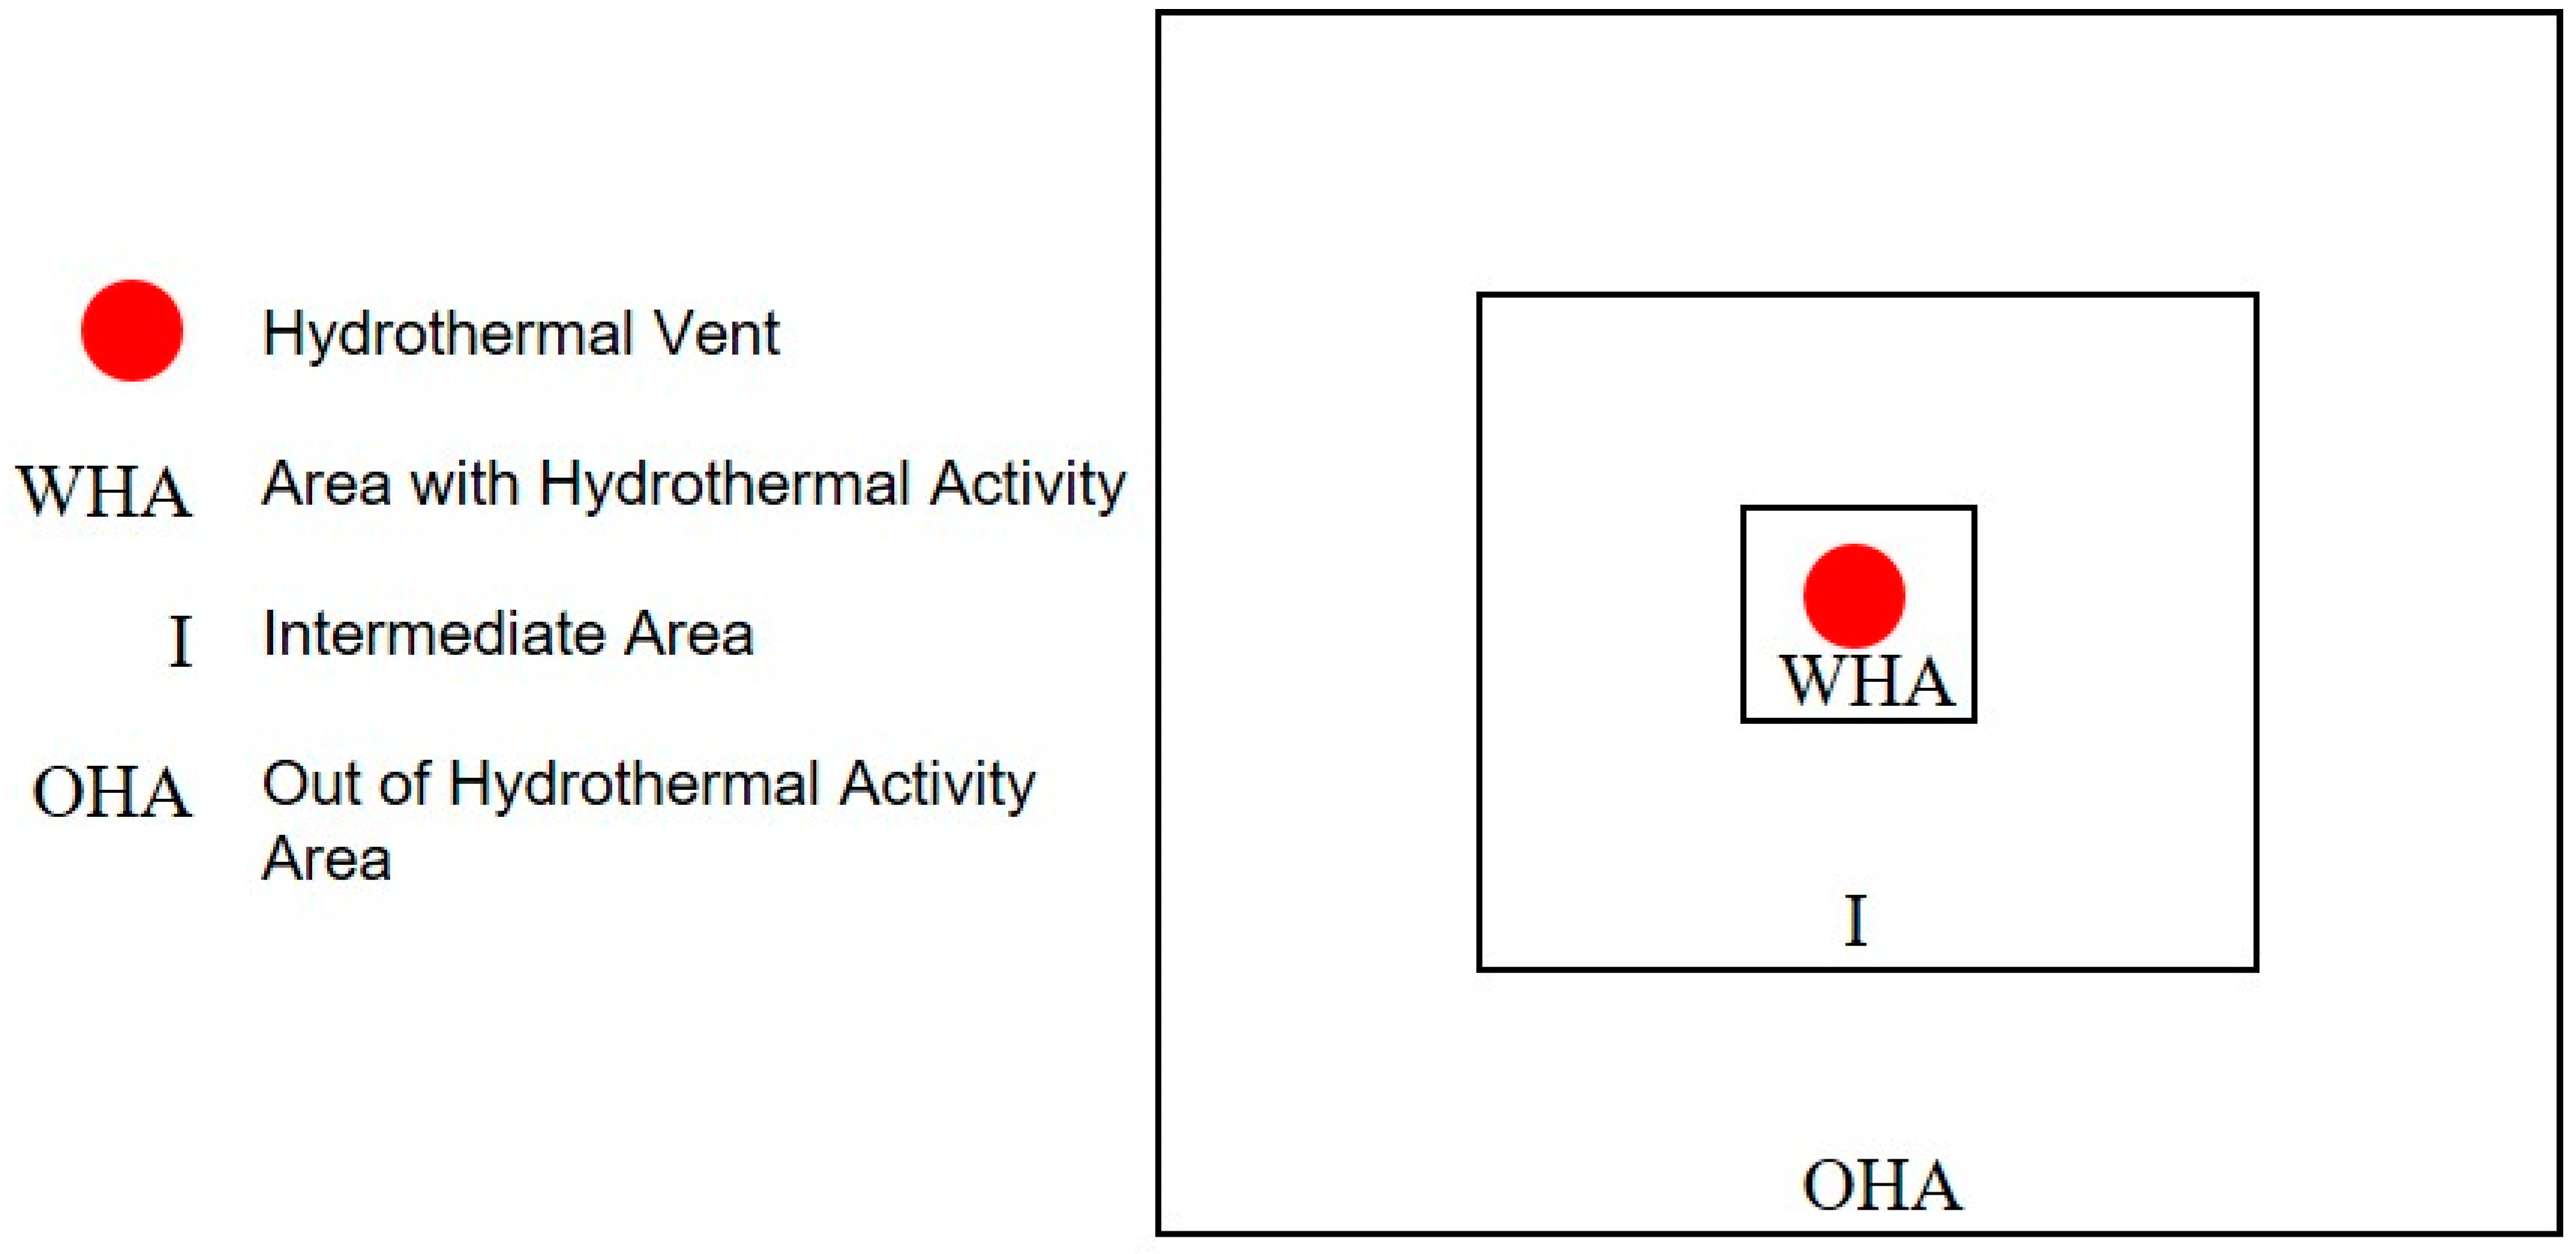
Each study site was stratified into square areas, taking a hydrothermal vent as the center, with a total of three areas per site. They were identified as: area with hydrothermal activity (WHA), intermediate area (I), and out of hydrothermal activity area (OHA), with areas of 0.16, 9, and 36 m2, respectively (Figure 2). In each area, two surface sediment cores were collected by SCUBA diving (number of sediment cores=18), using PVC plastic cores with 10 cm length and 10 cm diameter. A PVC quadrant was used to delimit the areas at each study site. In each area, the diver collected two sediment cores, randomly, but ensuring that there was sufficient distance between one sample and the other, within the same area. The diver took the sediment sample with one hand, inserting the plastic core the first 5 cm, and with the other hand, placed the cap. The sediments cores were collected on 13 December 2017, which is the first time that marine sediment samples have been collected in SSHSPM to make a granulometric analysis.
The granulometric analysis of each area in each study site was performed in duplicate, using the method of sieves [19]. Eight ALCON™ brass sieves were used. These were arranged in decreasing order, based on the mesh size, and at the bottom a collector. The mesh sizes of the eight sieves were 3.200, 2.000, 0.850, 0.600, 0.425, 0.300, 0.250, 0.150, and 0.075 mm. The grain size was classified according to the Udden–Wentworth scale [20,21]. Sediment samples received prior treatment [19] to eliminate salts and organic matter.
The structural parameters that describe the grain size distribution were calculated using the method of moments [14,22,23]. This statistical method consists of four moments (mean ( x ¯ ø ) , standard deviation ( σ ø ) , skewness S k ø , and kurtosis ( K ø ) ) determined by the formulas shown in Table 1. Acoording to Blott and Pye [14], x ¯ ø determines the average grain size; σ ø indicates how similar are the sizes of all the particles that make up the sample; S k ø measures the tendency of the particles towards a certain size; and K ø measures the concentration of the grains in relation to the average.
To look for some association of the structural moments with the areas and sites of study, a principal coordinate analysis was performed (PCO) [24] using PRIMER®+PERMANOVA version 6 software [25].

3. Results

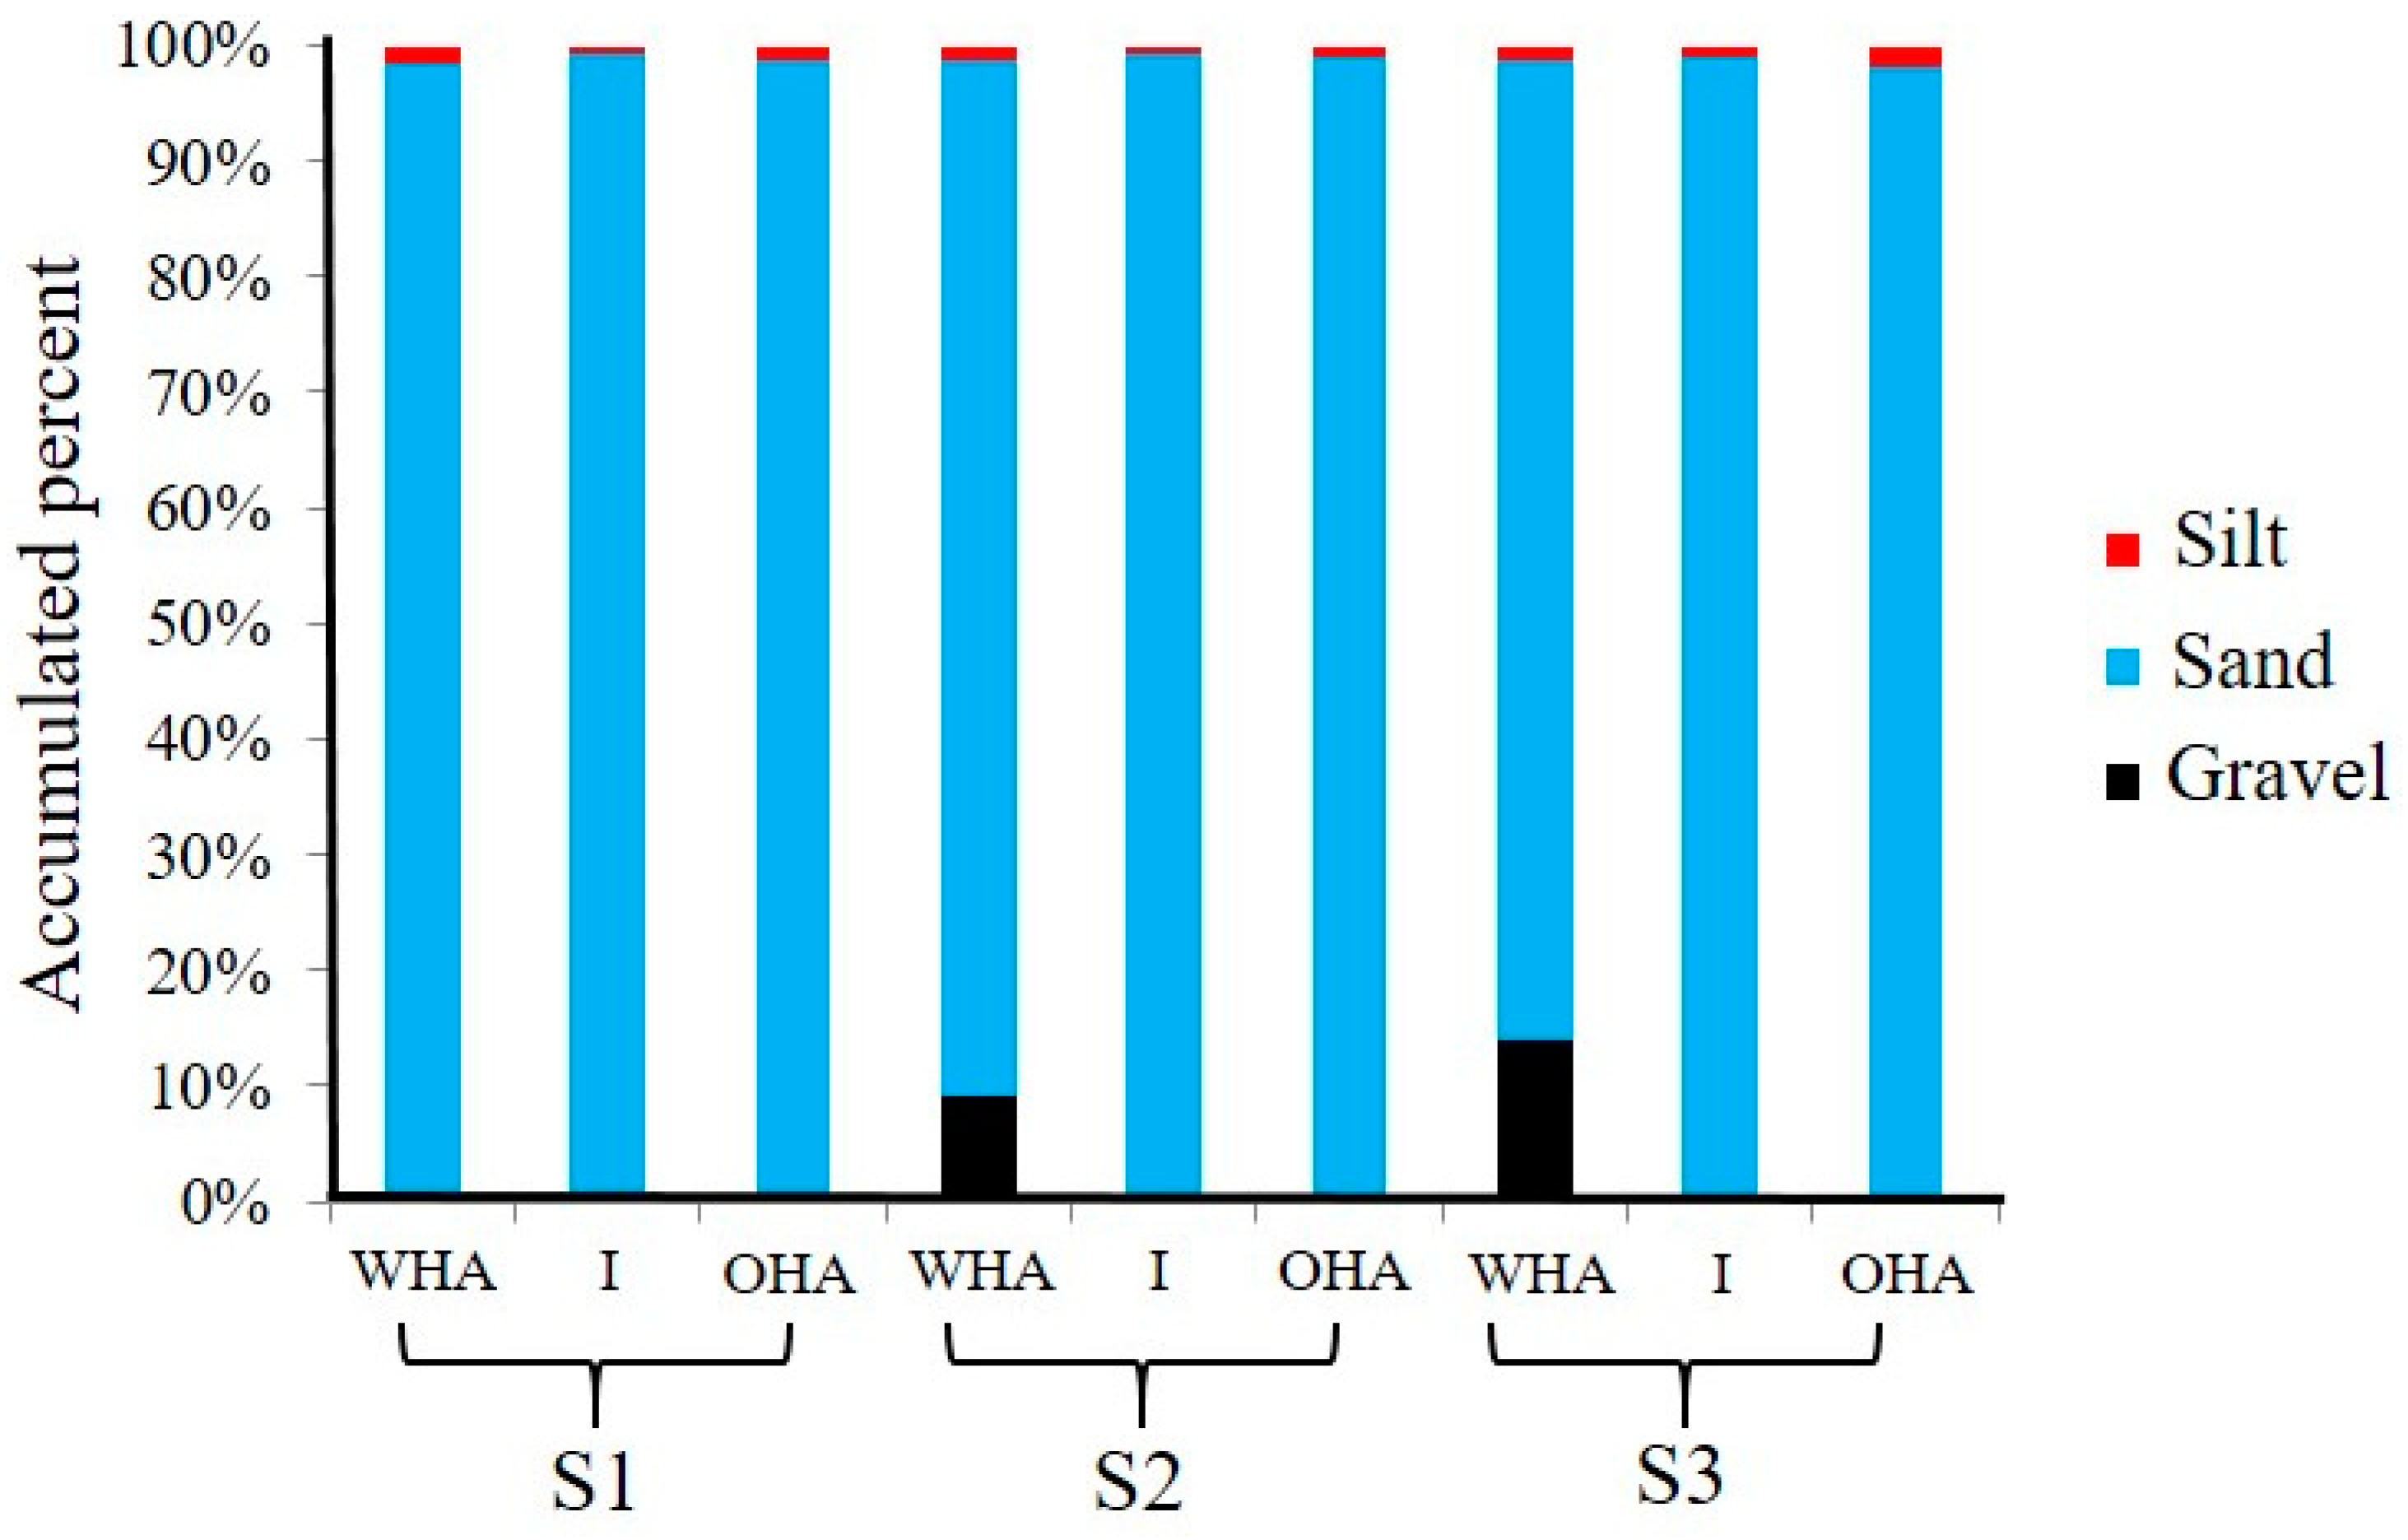
The results of the grain size show the sediments were homogeneous (Figure 3) with a textural composition of sands. The dominant grain size was very fine sand, in the three areas of the three study sites (number of total areas=9).
Table 2 shows the grain sizes of each area at each study site, in percent. Table 3 shows the structural moments of each area at each study site.
In general, the mean, x ¯ ø , indicates a very fine sand grain size in all samples. The standard deviation, σ ø , of most samples was moderately well sorted, while the WHA areas of S2 and S3 were poorly sorted. The skewness, S k ø , was systematically negative. The kurtosis, K ø , indicates a leptokurtic to very leptokurtic distribution, except for the WHA areas of S2 and S3, which resulted platykurtic and very platykurtic, respectively. These results are presented as histograms in Figure 4.
Granulometric results of the WHA areas of S2 and S3 were very different from the rest, as shown in Figure 4 as well as in the dispersion diagram of Figure 5, since they presented very fine gravels and coarse and very coarse sands. The grain size of these sediments was poorly homogeneous with coarse skewed and platykurtic and very platykurtic graphs (see Figure 4).
The PCO in Figure 6 shows an explained variation of 99.2%, in the first two axes. The first axis (PCO1) explains 93% of this variation and the second axis (PCO2) explains 6.2%. The explained variation in this PCO suggests the analogy between the structural moments and the study sites. Most areas of the three study sites were grouped towards large values of means and kurtosis, and low values of skewness and standard deviation. However, the WHA areas of S2 and S3 showed an inverse relationship, i.e. smaller means and kurtosis, but larger skewness and standard deviation, separating from the rest, as shown in Figure 4, Figure 5 and Figure 6.
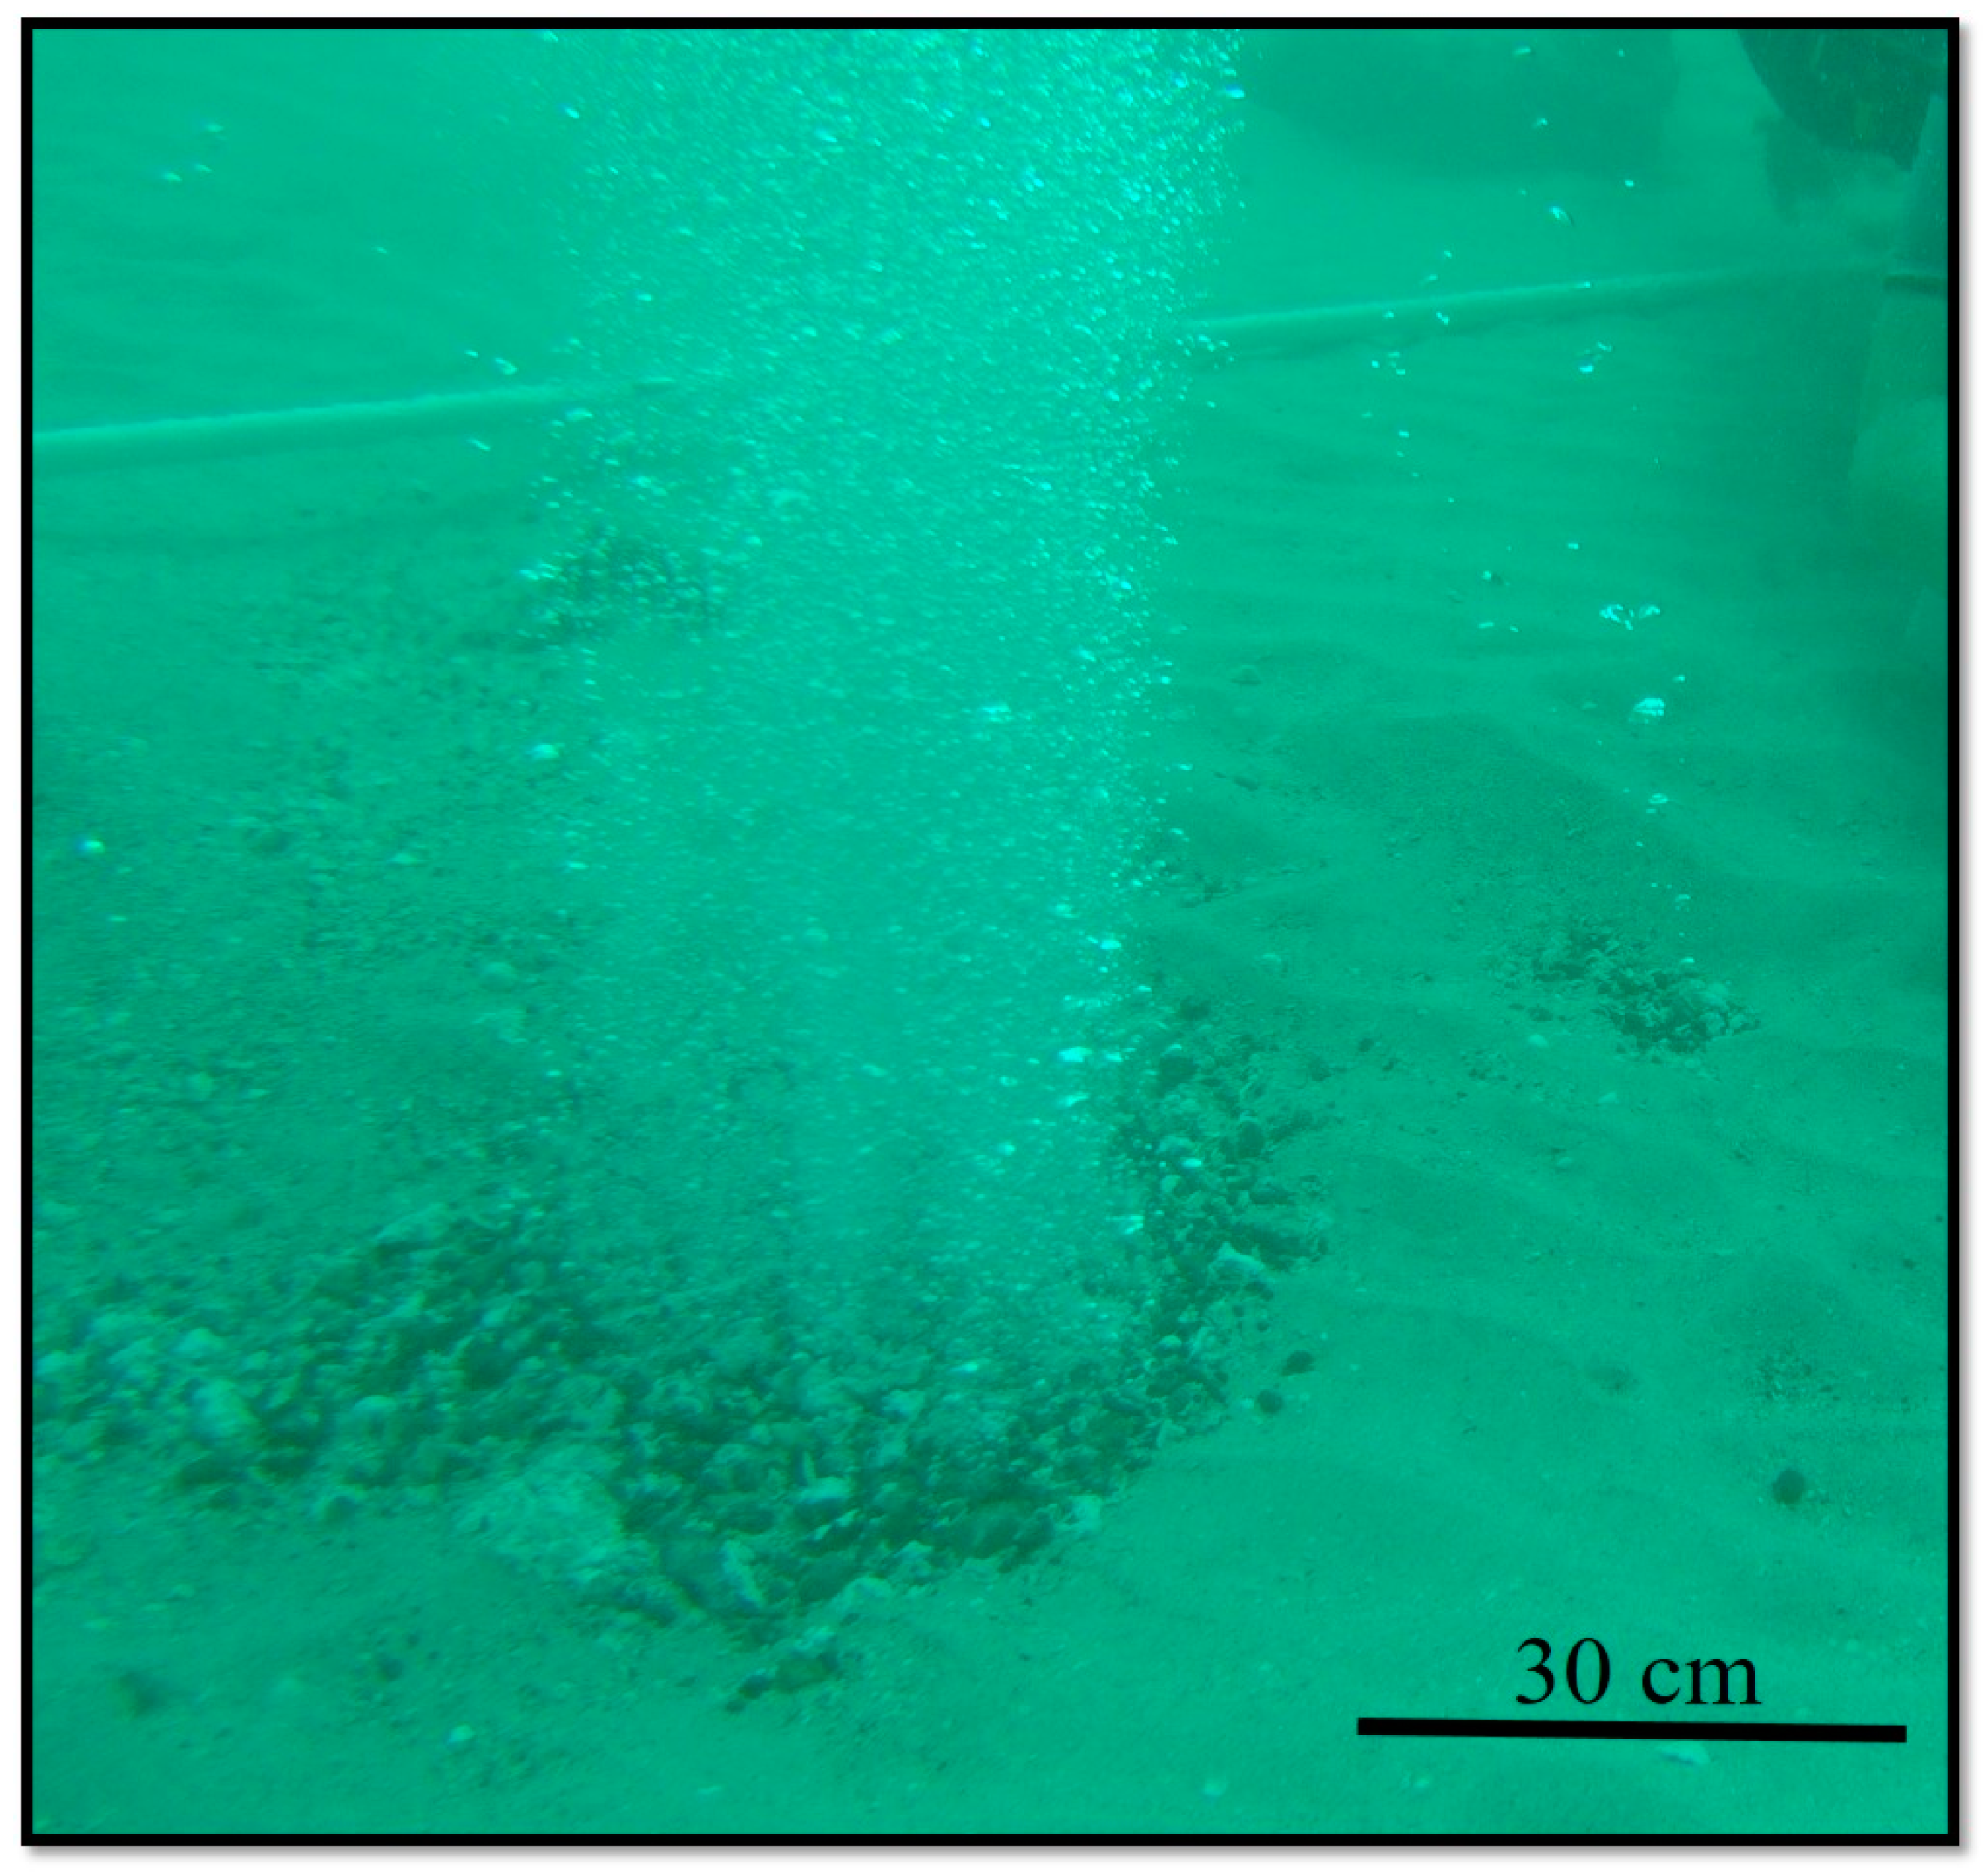
Figure 7 shows a photograph taken of the WHA area of S2, where altered basalt by hydrothermal activity is observed. This was reflected in the granulometric analysis with very fine gravel and very coarse and coarse sand (Table 2). The WHA area of S3 presented similar characteristics.

4. Discussion

The marine sediments in the influence area of SSHSPM are composed of very fine sands with moderate sorting. The mounds that form in the active hydrothermal vents are a combination of very fine gravel (mainly from degraded basalt by hydrothermal activity) and sands, which range from very fine to very coarse, with poor sorting. Besides, we observed these mounds accumulate fragments of marine debris, such as sea urchin spines, shells, and corals, among others, which were not included in the analysis. Melwani and Kim [12] reported the grain size of two shallow submarine hydrothermal vent areas: Bahía Concepción (12 m), Mexico, and White Point (8 m), USA. In the area of Bahía Concepción, they divided their study sites into three zones, vent, transition, and outside, whereas White Point was stratified into two zones, vent and outside. They did not find significant differences in grain size between the zones of each shallow hydrothermal vent area. In both shallow hydrothermal vent areas, the grain size was fine to medium sands with moderate sorting. In the two hydrothermal systems studied by Melwani and Kim [12], as in the influence area of SSHSPM studied by us, the grain size was sand, which, according to Fuentes-Hernández [26], is the appropriate grain size in tidal environments. However, our results indicate that the grain size in the sediments of the active vent areas present a combination of very fine sands to very fine gravels, as well as the accumulation of marine debris.
SSHSPM is low depth (10 m), which limits the shape, size, and existence of the mounds in the vents. During the year, several waves are presented in the study zone. Moreover, Canet et al. [5] reported that the sea bottom is brought under the action of waves, storms, and background currents, which condition the transport and deposition of the sediments both in mounds of these hydrothermal vents and in sea bottom adjacent to them.
Núñez-Cornú et al. [1] pointed out that the sediments that they observed on the sea bottom around various vents of SSHSPM were at first sight sands, mainly, since they did not do a granulometric study. They emphasized that their observations were made in September 1997, and they returned in January 1998, after passage of Hurricane Paulina. They observed drastic changes, such as the destruction of prominent mounds in some vents and the removal of surface sediments from the sea bottom, which partially unveiled basaltic structure that lies beneath the sediments. What was observed by Núñez-Cornú et al. [1] coincides with what we observed when returning to the study site, six months later, since some mounds were modified, some smaller but others larger, and new mounds had formed. We also observed that the mounds had marine debris and fragments of altered basalt, while the surrounding area was mostly composed of sand. This confirmed that the sediments in the influence area of SSHSPM are sands. According to our results, it would be very fine sands, while the mounds present, in addition to sands, very fine gravels due to the alteration of the basalt by hydrothermal discharges. The findings of this study possibly represent a dynamical equilibrium condition in the system between particle transport, erosion, and deposition, as proposed by Baux et al. [27], but that relation should be studied in greater detail.
We inferred that the marine sediments in the hydrothermal activity areas come from recurring explosive events, during the hydrothermal discharges. As shown in Figure 4, the kurtosis of the WHA areas was platykurtic to very platykurtic. Fuentes-Hernández [26] reported that this type of graphs reveals a process of forced sedimentation that shows a sudden deposition of material, and that leads to poor and very poor sorting.
As shown in Table 3 and Figure 5, we observed that the sediment samples with high mean values showed lower standard deviation values. This inverse relationship between the mean and standard deviation was also reported by Griffiths [28] and means that, at increasingly fine grain sizes, the samples have better sorting.

5. Conclusions

The marine sediments in the influence areas of SSHSPM are characteristics of those marine sediments in tidal areas where sediment accumulation occurs freely. These sediments are fine, sandy texture, and well sorted. The marine sediments of the areas with hydrothermal activity present grains ranging from very fine sand to very fine gravel, in addition to marine debris. The hydrothermal activity gives rise to the formation of mounds, whose sediments are composed of very fine gravels (mainly remains of altered basalt by the hydrothermal discharges) and very coarse to very fine sands, being these poorly sorted sediments. Waves, bottom currents, and meteorological phenomena condition the existence of these mounds. The results presented here are intended to be used as a preliminary reference framework for future studies related to the marine sediments of SSHSPM. Further research is recommended to determine the timing and distribution patterns of the sediments in this shallow hydrothermal system.

Author Contributions

Conceptualization, M.C.R.-U., R.M.C.-D., and F.J.N.-C.; Methodology, M.C.R.-U. and R.M.C.-D.; Investigation, M.C.R.-U. and R.M.C.-D.; Funding Acquisition, F.J.N.-C.; Writing—Original draft preparation, M.C.R.-U.; Writing—Review and editing, M.C.R.-U., R.M.C.-D., and E.T.-G.; and supervision, F.J.N-C. and R.M.C.-D. All authors have read and agreed to the published version of the manuscript.

Funding

This research was funded by Centro Mexicano de Innovación en Energía-Geotérmica (CeMIE-Geo). P24. Passive and magnetotelluric seismic exploration in the geothermal fields of La Caldera of La Primavera and Ceboruco Volcano, SENER-CONACyT 201301-207032.

Acknowledgments

We thank Natalia Balzaretti Merino for the coordination of diving activities, sampling, and the photography and video work (see Figure 7). We also thank geophysical graduate students of the Centro de Sismología y Volcanología de Occidente for their technical support, to Amilcar L. Cupul Magaña for the advice in the samples process, and to Juan Alejandro Ochoa Chávez for his comments, reviews, and recommendations in the draft preparation.

Conflicts of Interest

The authors declare no conflict of interest.

References

  1. Núñez-Cornú, F.J.; Prol-Ledesma, R.M.; Cupul-Magaña, A.; Suárez-Plascencia, C. Near shore submarine hydrothermal activity in Bahia Banderas, western Mexico. Geofis. Int. 2000, 39, 171–178. [Google Scholar]
  2. Canet, C.; Prol-Ledesma, R.M. Procesos de mineralización en manantiales hidrotermales submarinos someros. Ejemplos en México. Boletín la Soc. Geológica Mex. 2006, 58, 83–102. [Google Scholar] [CrossRef]
  3. Tarasov, V.G.; Gebruk, A.V.; Mironov, A.N.; Moskalev, L.I. Deep-sea and shallow-water hydrothermal vent communities: Two different phenomena? Chem. Geol. 2005, 224, 5–39. [Google Scholar] [CrossRef]
  4. Prol-Ledesma, R.M.; Canet, C.; Villanueva-Estrada, R.E.; Ortega-Osorio, A. Morphology of pyrite in particulate matter from shallow submarine hydrothermal vents. Am. Mineral. 2010, 95, 1500–1507. [Google Scholar] [CrossRef]
  5. Canet, C.; Prol-Ledesma, R.M.; Melgarejo, J.C. El sistema hidrotermal de Punta Mita (México): Un ejemplo de depósito exhalativo submarino actual. Cad. Lab. Xeolóxico Laxe 2000, 25, 325–327. [Google Scholar]
  6. Rodríguez-Uribe, M.C.; Núñez-Cornú, F.J.; Chávez-Dagostino, R.M. Contribuciones al estudio de los sistemas hidrotermales subamrinos someros en México. Biblio3W. Rev. Bibliográfica Geogr. y Ciencias Soc. 2018, 23, 1–23. [Google Scholar]
  7. Prol-Ledesma, R.M.; Canet, C.; Tolson, G.; García-Palomo, A.; Miller, R.; Rubio, M.A.; Torres-de León, R.; Huicochea-Alejo, J.S. Basaltic Volcanism and Submarine Hydrothermal Activity in Punta Mita, Nayarit, Mexico. In Proceedings of the Geologic transects across Cordilleran Mexico, Guidebook for the field trips of the 99th Geological Society of America Cordilleran Section Annual Meeting, Puerto Vallarta, Jalisco, Mexico, 30–31 March 2003; pp. 169–182. [Google Scholar]
  8. de la Vega-Márquez, T.F.; Prol-Ledesma, R.M. Imágenes landsat TM y modelo digital de elevación para la identificación de lineamientos y mapeo litológico en punta mita (México). Bol. la Soc. Geol. Mex. 2011, 63, 109–118. [Google Scholar] [CrossRef]
  9. Rodríguez-Uribe, M.C.; Chávez-Dagostino, R.M.; Del Moral-Flores, L.F.; Bravo-Olivas, M.L. First record of amphioxus branchiostoma californiense (Amphioxiformes: Branchiostomatidae) adjacent to a shallow submarine hydrothermal system at Banderas bay (Mexico). Diversity 2019, 11, 227. [Google Scholar] [CrossRef] [Green Version]
  10. Canet, C.; Prol-Ledesma, R.M.; Melgarejo, J.C.; Reyes, A. Methane-related carbonates formed at submarine hydrothermal springs: A new setting for microbially-derived carbonates? Mar. Geol. 2003, 199, 245–261. [Google Scholar] [CrossRef]
  11. Thiermann, F.; Akoumianaki, I.; Hughes, J.A.; Giere, O. Benthic fauna of a shallow-water gaseohydrothermal vent area in the Aegean Sea (Milos, Greece). Mar. Biol. 1997, 128, 149–159. [Google Scholar] [CrossRef]
  12. Melwani, A.R.; Kim, S.L. Benthic infaunal distributions in shallow hydrothermal vent sediments. Acta Oecologica 2008, 33, 162–175. [Google Scholar] [CrossRef]
  13. Cupul-Magaña, L.A.; Mösso-Aranda, C.; Sierra, J.P.; Martí, E.; Ferman-Almada, J.L.; Rodilla, M.; González del Río, J.; Sánchez-Arcilla, A. Caracterización y patrones de distribución de los sedimentos superficiales en Bahía Cullera, España. Ciencias Mar. 2006, 32, 617–629. [Google Scholar]
  14. Blott, S.J.; Pye, K. Gradistat: A grain size distribution and statistics package for the analysis of unconsolidated sediments. Earth Surf. Process. Landforms 2001, 26, 1237–1248. [Google Scholar] [CrossRef]
  15. Folk, R.L.; Ward, W.C. Brazos River Bar: A study in the significance of grain size parameters. J. Sediment. Petrol. 1957, 27, 3–26. [Google Scholar] [CrossRef]
  16. Friedman, G.M. Differences in size distributions of populations of particles among sands of various origins: Addendum to IAS Presidential Address. Sedimentology 1979, 26, 859–862. [Google Scholar] [CrossRef]
  17. Bui, E.N.; Mazzullo, J.M.; Wilding, L.P. Using quartz grain size and shape analysis to distinguish between aeolian and fluvial deposits in the Dallol Bosso of Niger (West Africa). Earth Surf. Process. Landforms 1989, 14, 157–166. [Google Scholar] [CrossRef]
  18. Sánchez, A.; Choumiline, E.; Estela lópez-Ortiz, B.; Aguíñiga, S.; Sánchez-Vargas, L.; Romero-Guadarrama, A.; Rodríguez-Meza, D. Patrón de transporte de sedimento en bahía magdalena, baja california sur, méxico, inferido del análisis de tendencias granulométricas. Lat. Am. J. Aquat. Res. 2010, 38, 167–177. [Google Scholar] [CrossRef]
  19. Lewis, D.L. Practical Sedimentology, 1st ed.; Hutchinson Ross Publishing: Stroudsburg, PA, USA, 1984; ISBN 0879334436. [Google Scholar]
  20. Udden, J.A. Bulletin of the Geological Society of America. Mechanical Composition Composition of Clastic Sediments. Geol. Soc. Am. Bull. 1914, 25, 655–744. [Google Scholar] [CrossRef]
  21. Wentworth, C.K. A Scale of Grade and Class Terms for Clastic Sediments. J. Geol. 1922, 30, 377–392. [Google Scholar] [CrossRef]
  22. Krumbein, W.C. Size Frequency Distributions of Sediments and the Normal Phi Curve. SEPM J. Sediment. Res. 1938, 8, 84–90. [Google Scholar] [CrossRef]
  23. Friedman, G.M.; Johnson, K.G. Exercises in Sedimentology; John Wiley & Sons: New York, NY, USA, 1982; ISBN 0471874531. [Google Scholar]
  24. Gower, J.C. Some Distance Properties of Latent Root and Vector Methods Used in Multivariate Analysis. Biometrika 1966, 53, 325. [Google Scholar] [CrossRef]
  25. Anderson, M.; Gorley, R.N.; Clarke, K.R. PERMANOVA + for PRIMER User Manual; PRIMER-E Ltd: Plymouth, UK, 2008; Volume 1. [Google Scholar]
  26. Fuentes-Hernández, M. Algunas Características Sedimentológicas Del Puerto Pesquero Internacional De Güiria Y Sus Alrededores, Estado Sucre, Venezuela. SABER. Rev. Multidiscip. del Cons. Investig. la Univ. Oriente 2006, 18, 197–206. [Google Scholar]
  27. Baux, N.; Murat, A.; Faivre, Q.; Lesourd, S.; Poizot, E.; Méar, Y.; Brasselet, S.; Dauvin, J.C. Sediment dynamic equilibrium, a key for assessing a coastal anthropogenic disturbance using geochemical tracers: Application to the eastern part of the Bay of Seine. Cont. Shelf Res. 2019, 175, 87–98. [Google Scholar] [CrossRef]
  28. Griffiths, J.C. Scientific Method in Analysis of Sediments; McGraw Hill: New York, NY, USA, 1967. [Google Scholar]
Figure 1. Study zone: location of the shallow hydrothermal vents at Punta Mita. The red oval indicates the study sites.
Jmse 08 00342 g001
Figure 2. Diagram of the three areas in which each study site was stratified. WHA, area with hydrothermal activity; I, intermediate area; OHA, out of hydrothermal activity area. The red circle indicates the hydrothermal vent.
Jmse 08 00342 g002
Figure 3. Textural composition of the sediments in the Shallow Submarine Hydrothermal System at Punta Mita. The x-axis indicates the area of each study site, and the y-axis indicates the cumulative percent of each grain size. S1, Site 1; S2, Site 2; S3, Site 3; WHA, area with hydrothermal activity; I, intermediate area; OHA, out of hydrothermal activity area.
Jmse 08 00342 g003
Figure 4. Histograms of the three areas at each study site. The x-axis represents the grain size in phi ( ø ) units, while the y-axis represents the percent of sediments retained in each class. The red dotted line represents the frequency polygon. The rows indicate the study sites and the columns the areas. S1, Site 1; S2, Site 2; S3, Site 3; WHA, area with hydrothermal activity; I, intermediate area; OHA, out of hydrothermal activity area
Jmse 08 00342 g004
Figure 5. Dispersion diagram that relates moments x ¯ ø and σ ø (mean and standard deviation). The black oval encloses the two areas that separate from the rest. S1, Site 1; S2, Site 2; S3, Site 3.
Jmse 08 00342 g005
Figure 6. Graph of the principal coordinate analysis. Green triangles indicate the area with hydrothermal activity (WHA), blue triangles the intermediate area (I), and turquoise squares, the out of hydrothermal activity area (OHA). The x-axis explains 93% of the total variation and the y-axis explains 6.2%. S1, Site 1; S2, Site 2; S3, Site 3.
Jmse 08 00342 g006
Figure 7. Photograph of the active hydrothermal vent of the area with hydrothermal activity (WHA) at Site 2 (S2).
Jmse 08 00342 g007
Table 1. Statistical formulae of the logarithmic method of moments [14]. x ¯ ø = mean; σ ø = standard deviation; S k ø = skewness, K ø = kurtosis; f = the frequency in percent; and m ø = the mid-point of each class interval in phi ( ø ) units.
Statistical MomentFormulae
Mean ( x ¯ ø ) x ¯ ø =   f m ø 100
Standard deviation ( σ ø ) σ ø = (   f ( m ø x ¯ ø ) 2 100 )
Skewness ( S k ø ) S k ø =   f ( m ø x ¯ ø ) 3 100 σ ø 3
Kurtosis ( K ø ) K ø =   f ( m ø x ¯ ø ) 4 100 σ ø 4
Table 2. Grain size of sediments collected on 13 December, 2017, classified according to the Udden–Wentworth [20,21], of each area in each study site. The average cumulative weight in percent in each class and the standard error are shown. WHA, area with hydrothermal activity; I, intermediate area; OHA, out of hydrothermal activity area.
SiteAreaGravelSandSilt
Very fine
[−2,−1] phi
Very Coarse
[−1,0] phi
Coarse
[0,1] phi
Medium
[1,2] phi
Fine
[2,3] phi
Very Fine
[3,4] phi
Very Coarse
>4 phi
S1WHA0 ± 00.38 ± 0.0092.26 ± 0.0132.79 ± 0.06122.76 ± 0.870.66 ± 0.1641.15 ± 0.45
I0 ± 00.18 ± 0.050.97 ± 0.031.8 ± 0.1524.24 ± 1.0872.02 ± 0.940.8 ± 0.01
OHA0 ± 00.11 ± 0.011.26 ± 0.011.56 ± 0.0218.9 ± 1.476.86 ± 1.31.3 ± 0.13
S2WHA9 ± 0.137.66 ± 0.6214.79 ± 1.044.45 ± 0.1720.24 ± 0.5142.77 ± 1.21.28 ± 0.01
I0 ± 00.03 ± 0.010.17 ± 0.000.71 ± 0.0223.82 ± 2.3174.61 ± 2.230.67 ± 0.04
OHA0 ± 00.11 ± 0.110.37 ± 0.011.39 ± 0.0127.87 ± 0.7469.32 ± 0.600.94 ± 0.03
S3WHA14 ± 1.2113.52 ± 2.8920.93 ± 0.945.68 ± 0.4211.08 ± 1.1533.44 ± 1.491.36 ± 0.10
I0 ± 00.00 ± 0.000.11 ± 0.010.27 ± 0.0317.40 ± 0.5881.18 ± 0.621.04 ± 0.08
OHA0 ± 00.01 ± 0.010.15 ± 0.030.33 ± 0.0115.88 ± 0.8481.79 ± 0.621.83 ± 0.17
Table 3. Average values of the statistical moments of each area in each study site with its standard error, of the sediments collected on 13 December, 2017. WHA, area with hydrothermal activity; I, intermediate area; OHA, out of hydrothermal activity area.
SiteAreaStatistical Moments
Mean   ( x ¯ ø ) Standard   Deviation   ( σ ø ) Skewness   ( S k ø ) Kurtosis   ( K ø )
S1WHA3.14 ± 0.0010.69 ± 0.000−2.25 ± 0.0178.91 ± 0.09
I3.19 ± 0.0090.58 ± 0.004−2.15 ± 0.0059.29 ± 0.24
OHA3.24 ± 0.0150.57 ± 0.005−2.55 ± 0.12811.18 ± 0.781
S2WHA2.02 ± 0.0481.72 ± 0.006−0.81 ± 0.0692.25 ± 0.116
I3.24 ± 0.0220.47 ± 0.009−1.64 ± 0.2096.15 ± 1.124
OHA3.18 ± 0.0030.53 ± 0.010−1.63 ± 0.2406.81 ± 1.804
S3WHA1.41 ± 0.1281.88 ± 0.031−0.17 ± 0.1141.55 ± 0.075
I3.32 ± 0.0040.41 ± 0.003−1.93 ± 0.0896.65 ± 0.519
OHA3.34 ± 0.0080.41 ± 0.001−2.16 ± 0.1898.78 ± 1.673