Ship Wakes and Their Potential Impacts on Salt Marshes in Jamaica Bay, New York


Abstract
1. Introduction
2. Data and Methods
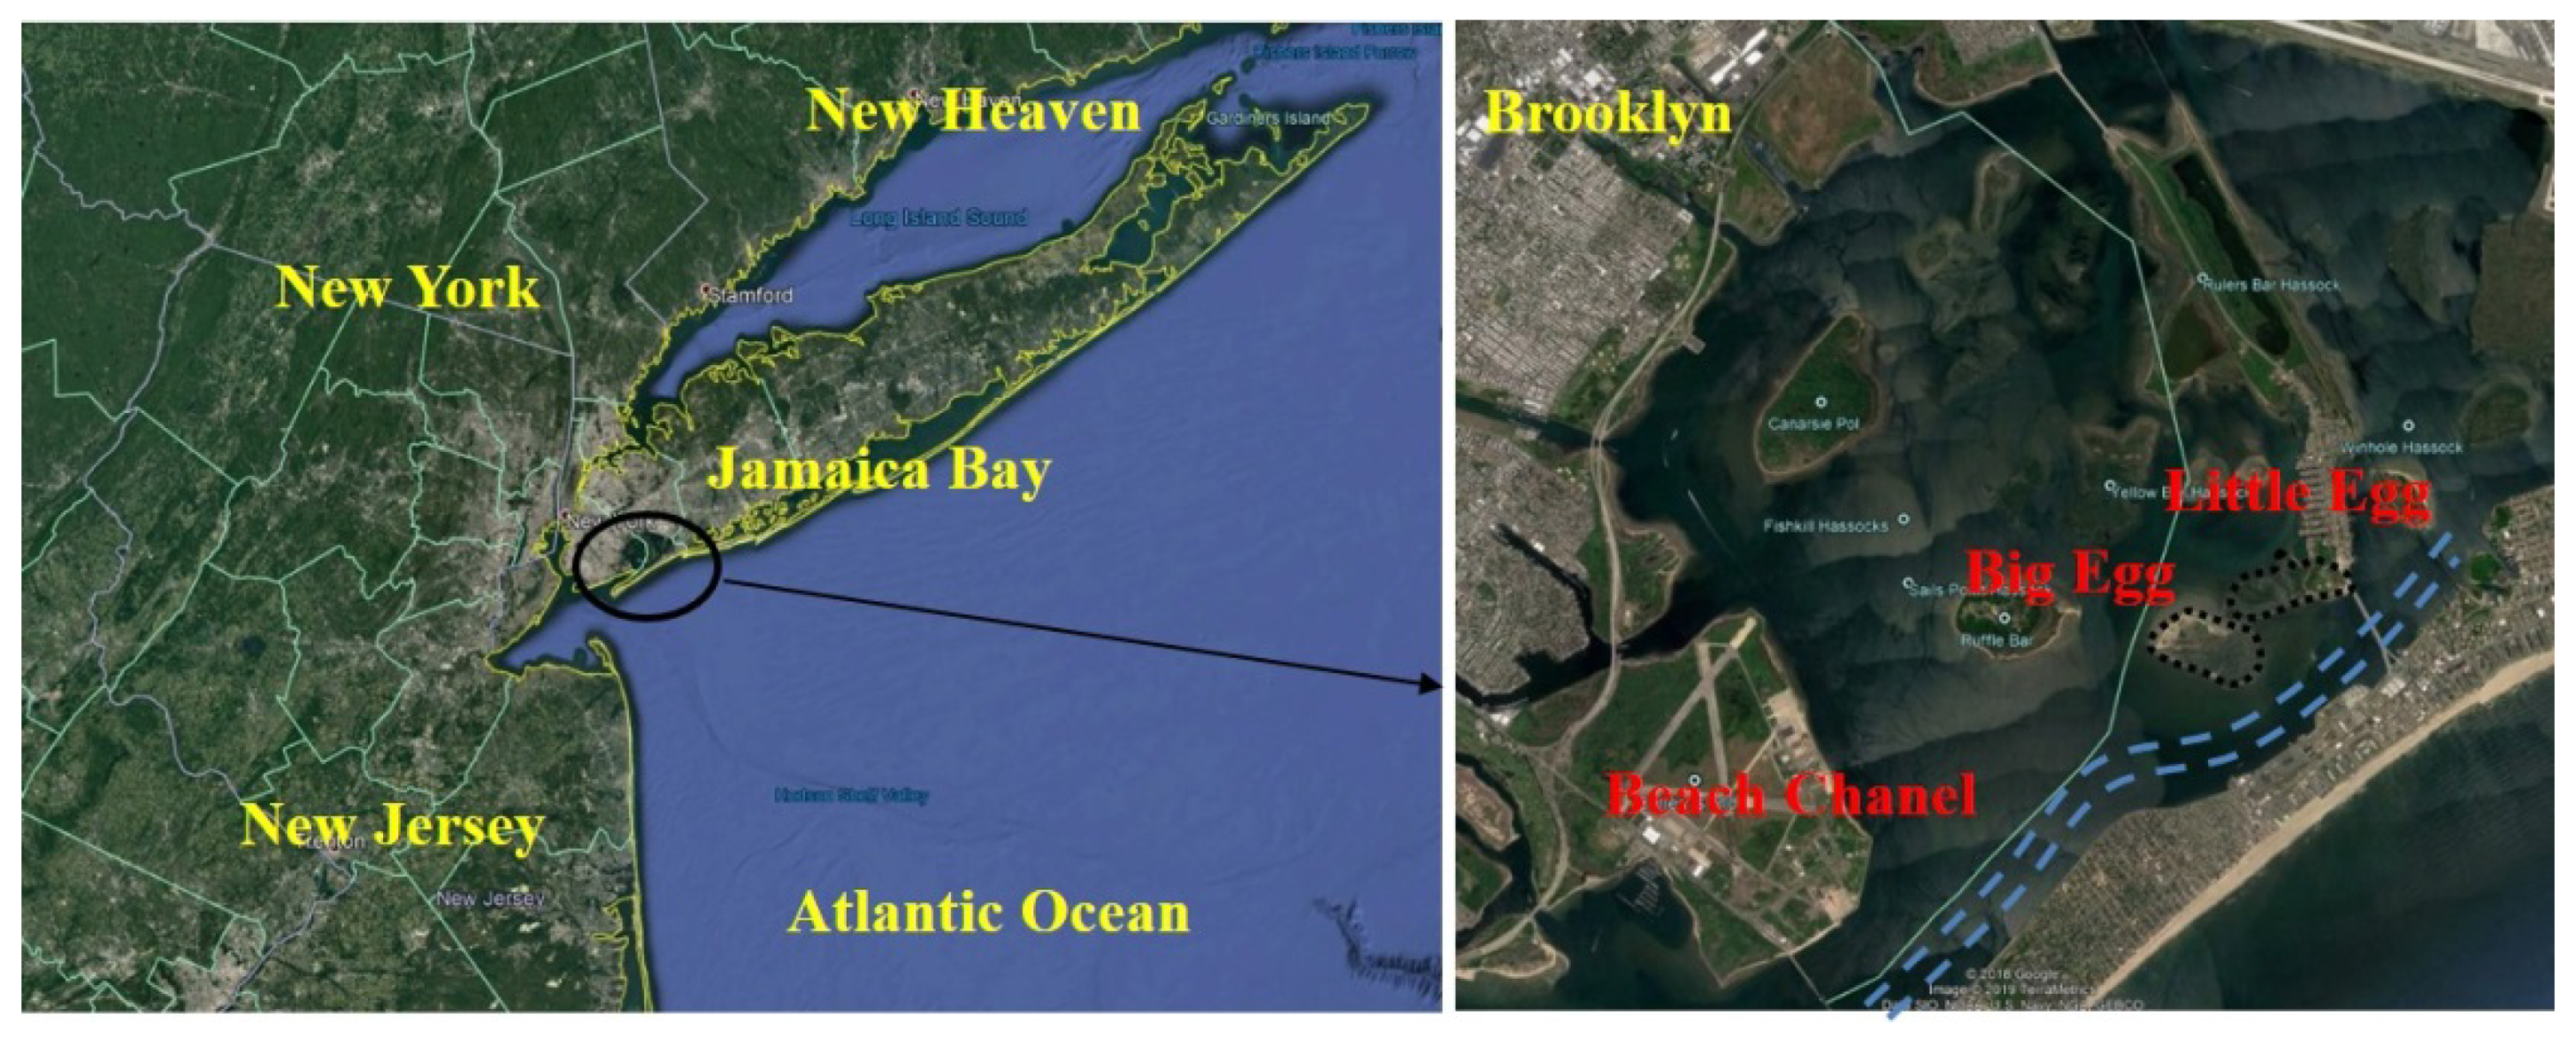
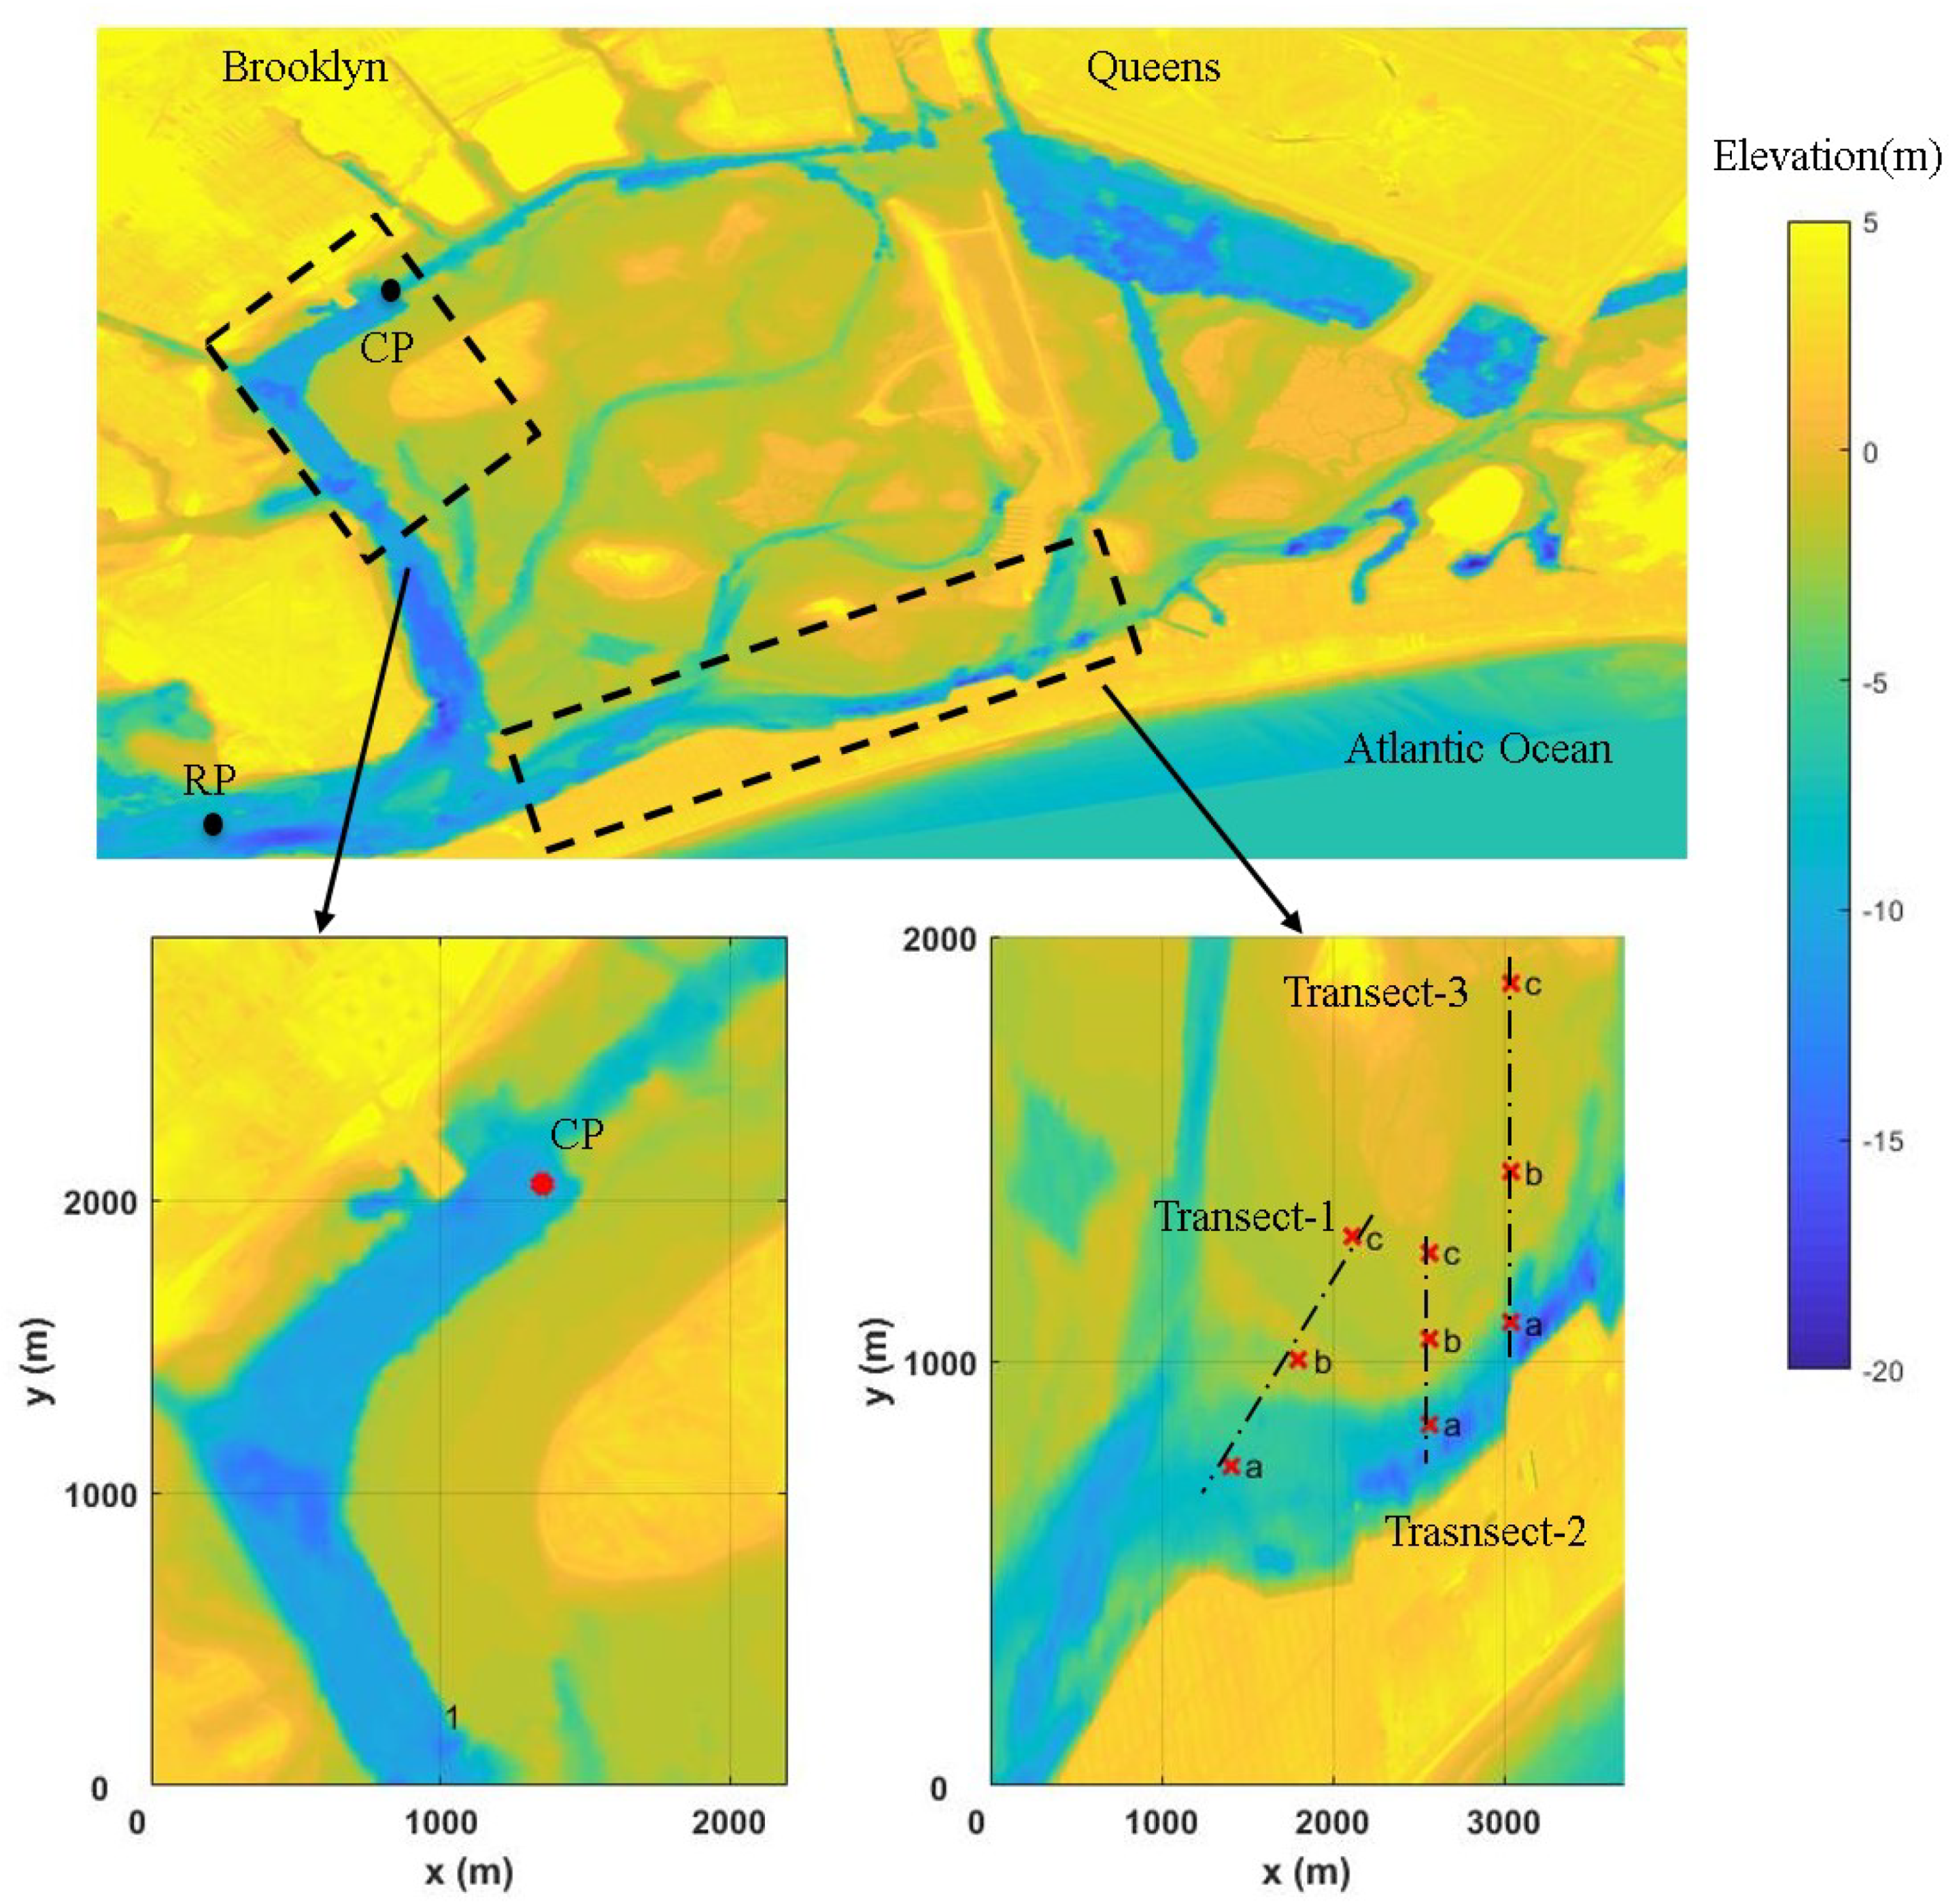
2.1. Study Area
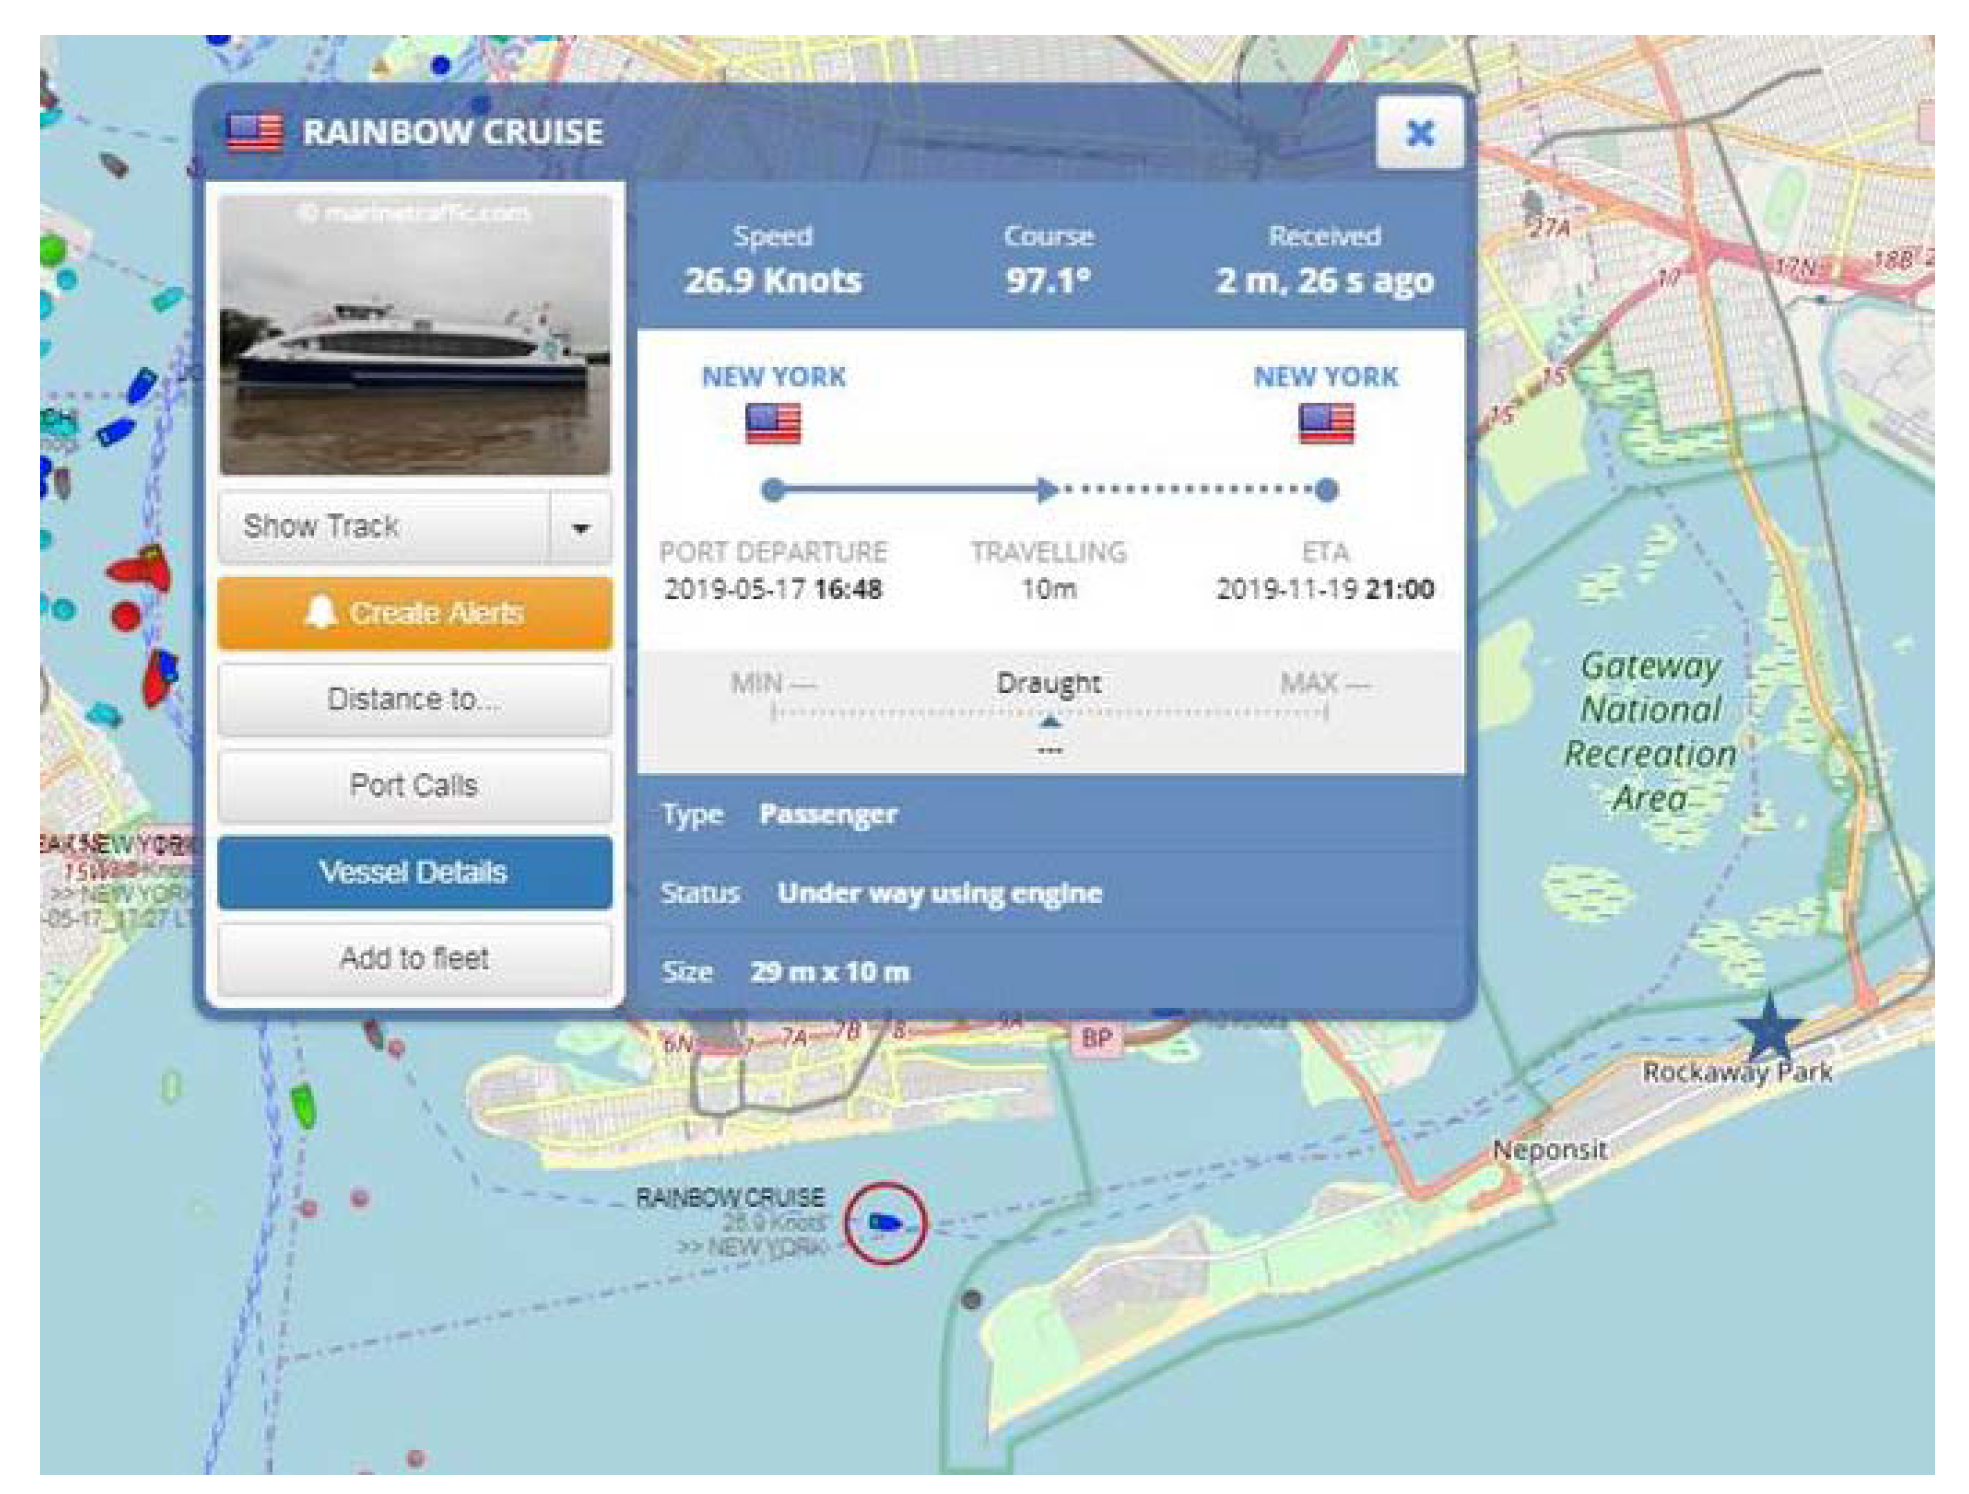
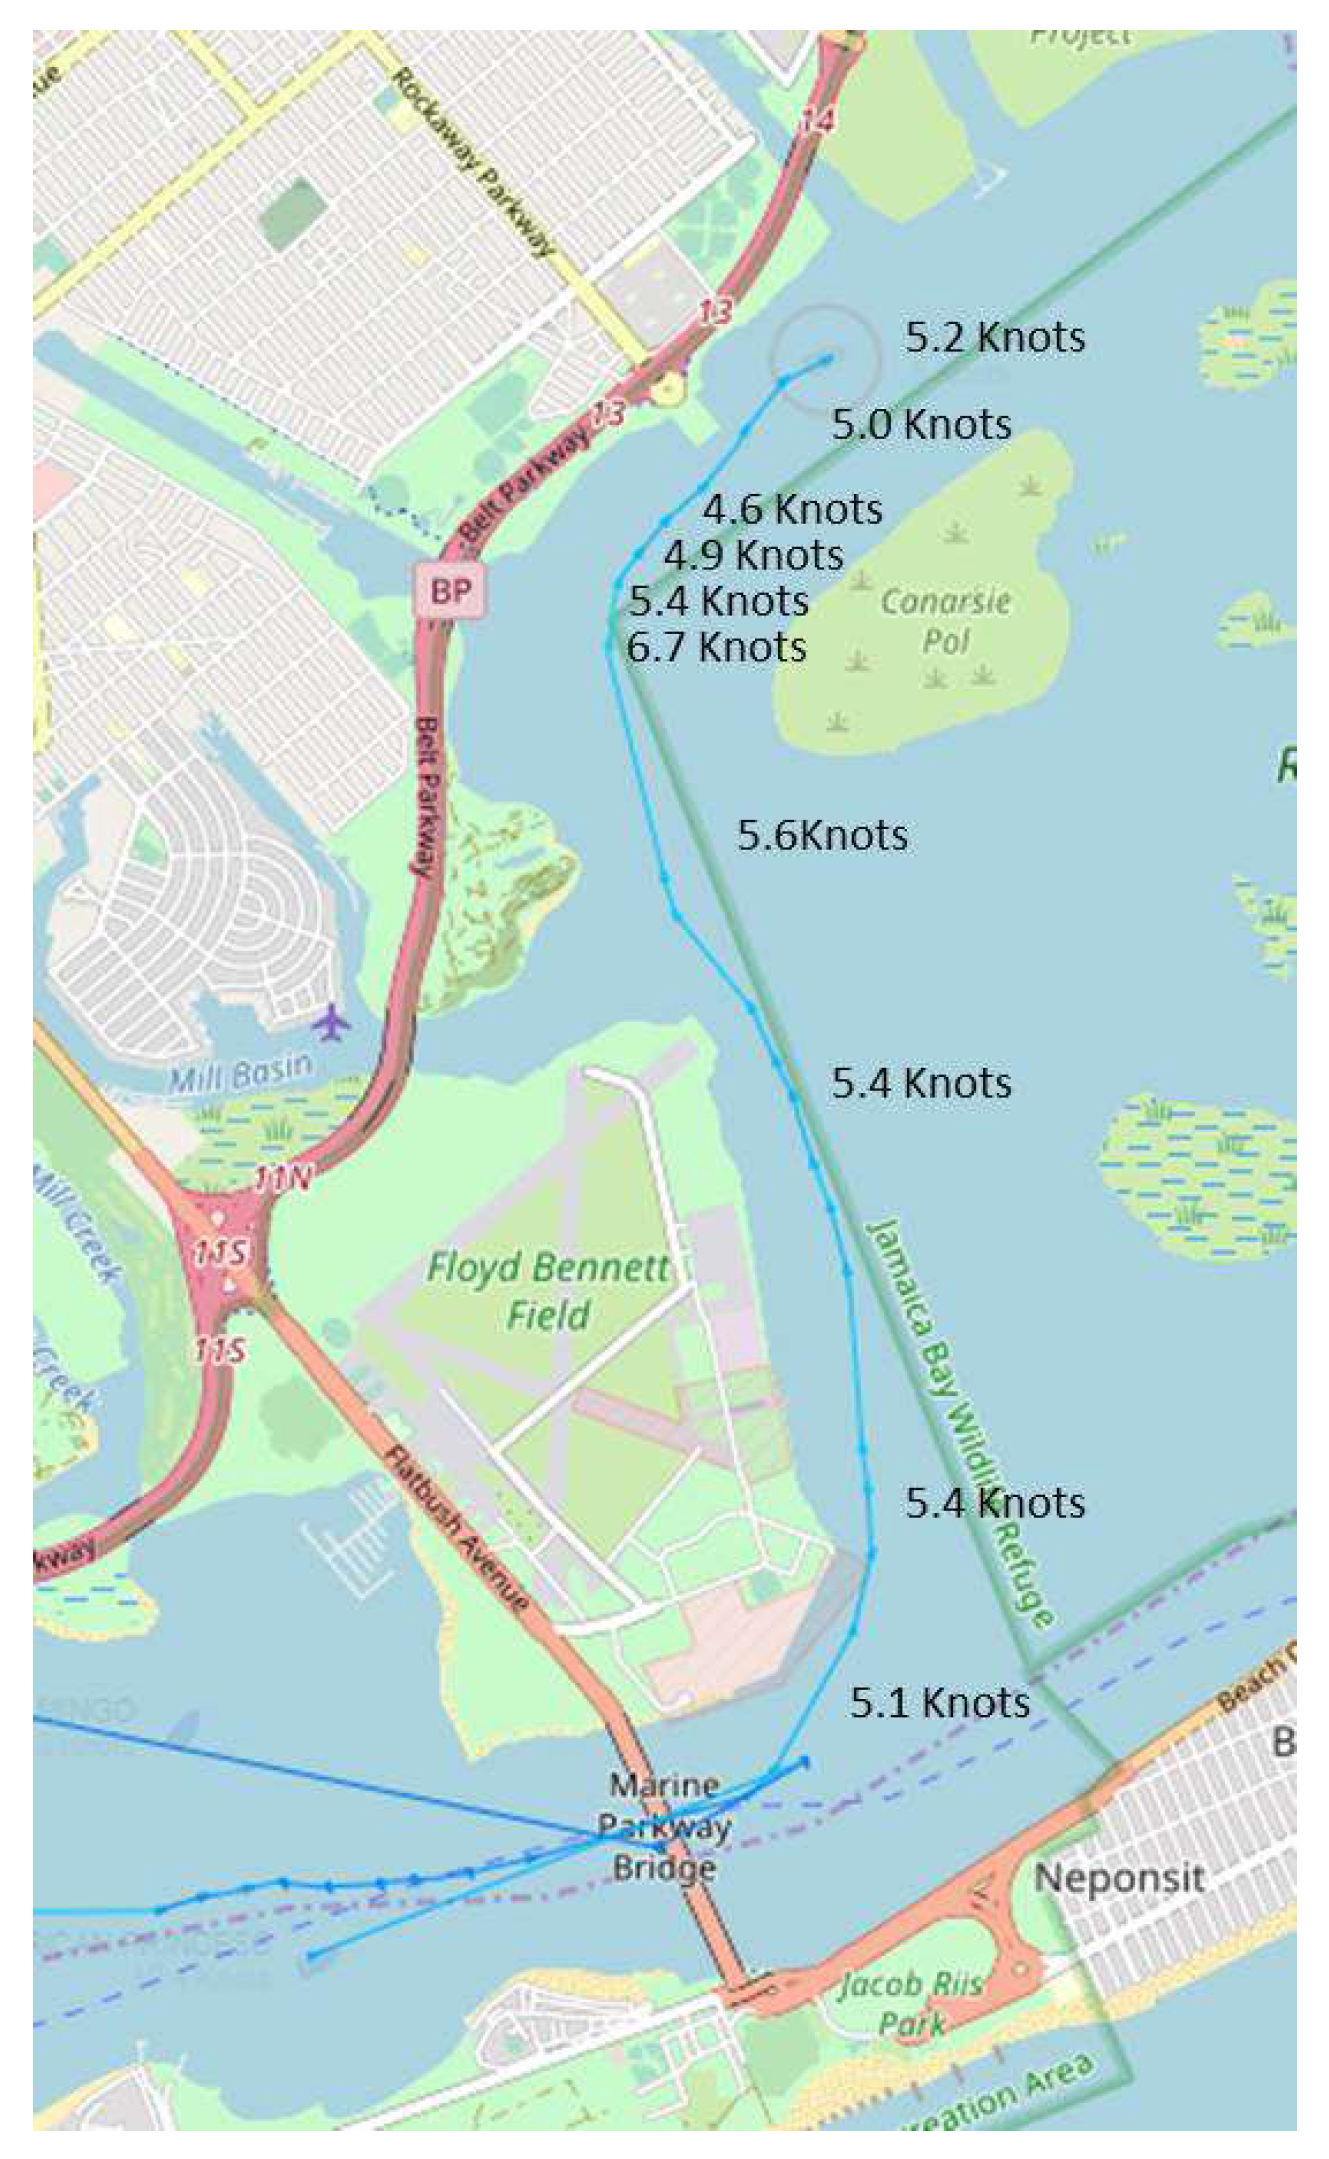
2.2. Wake Measurements
2.3. Ship Wake Analysis Approach
2.4. Numerical Model
3. Results and Discussion
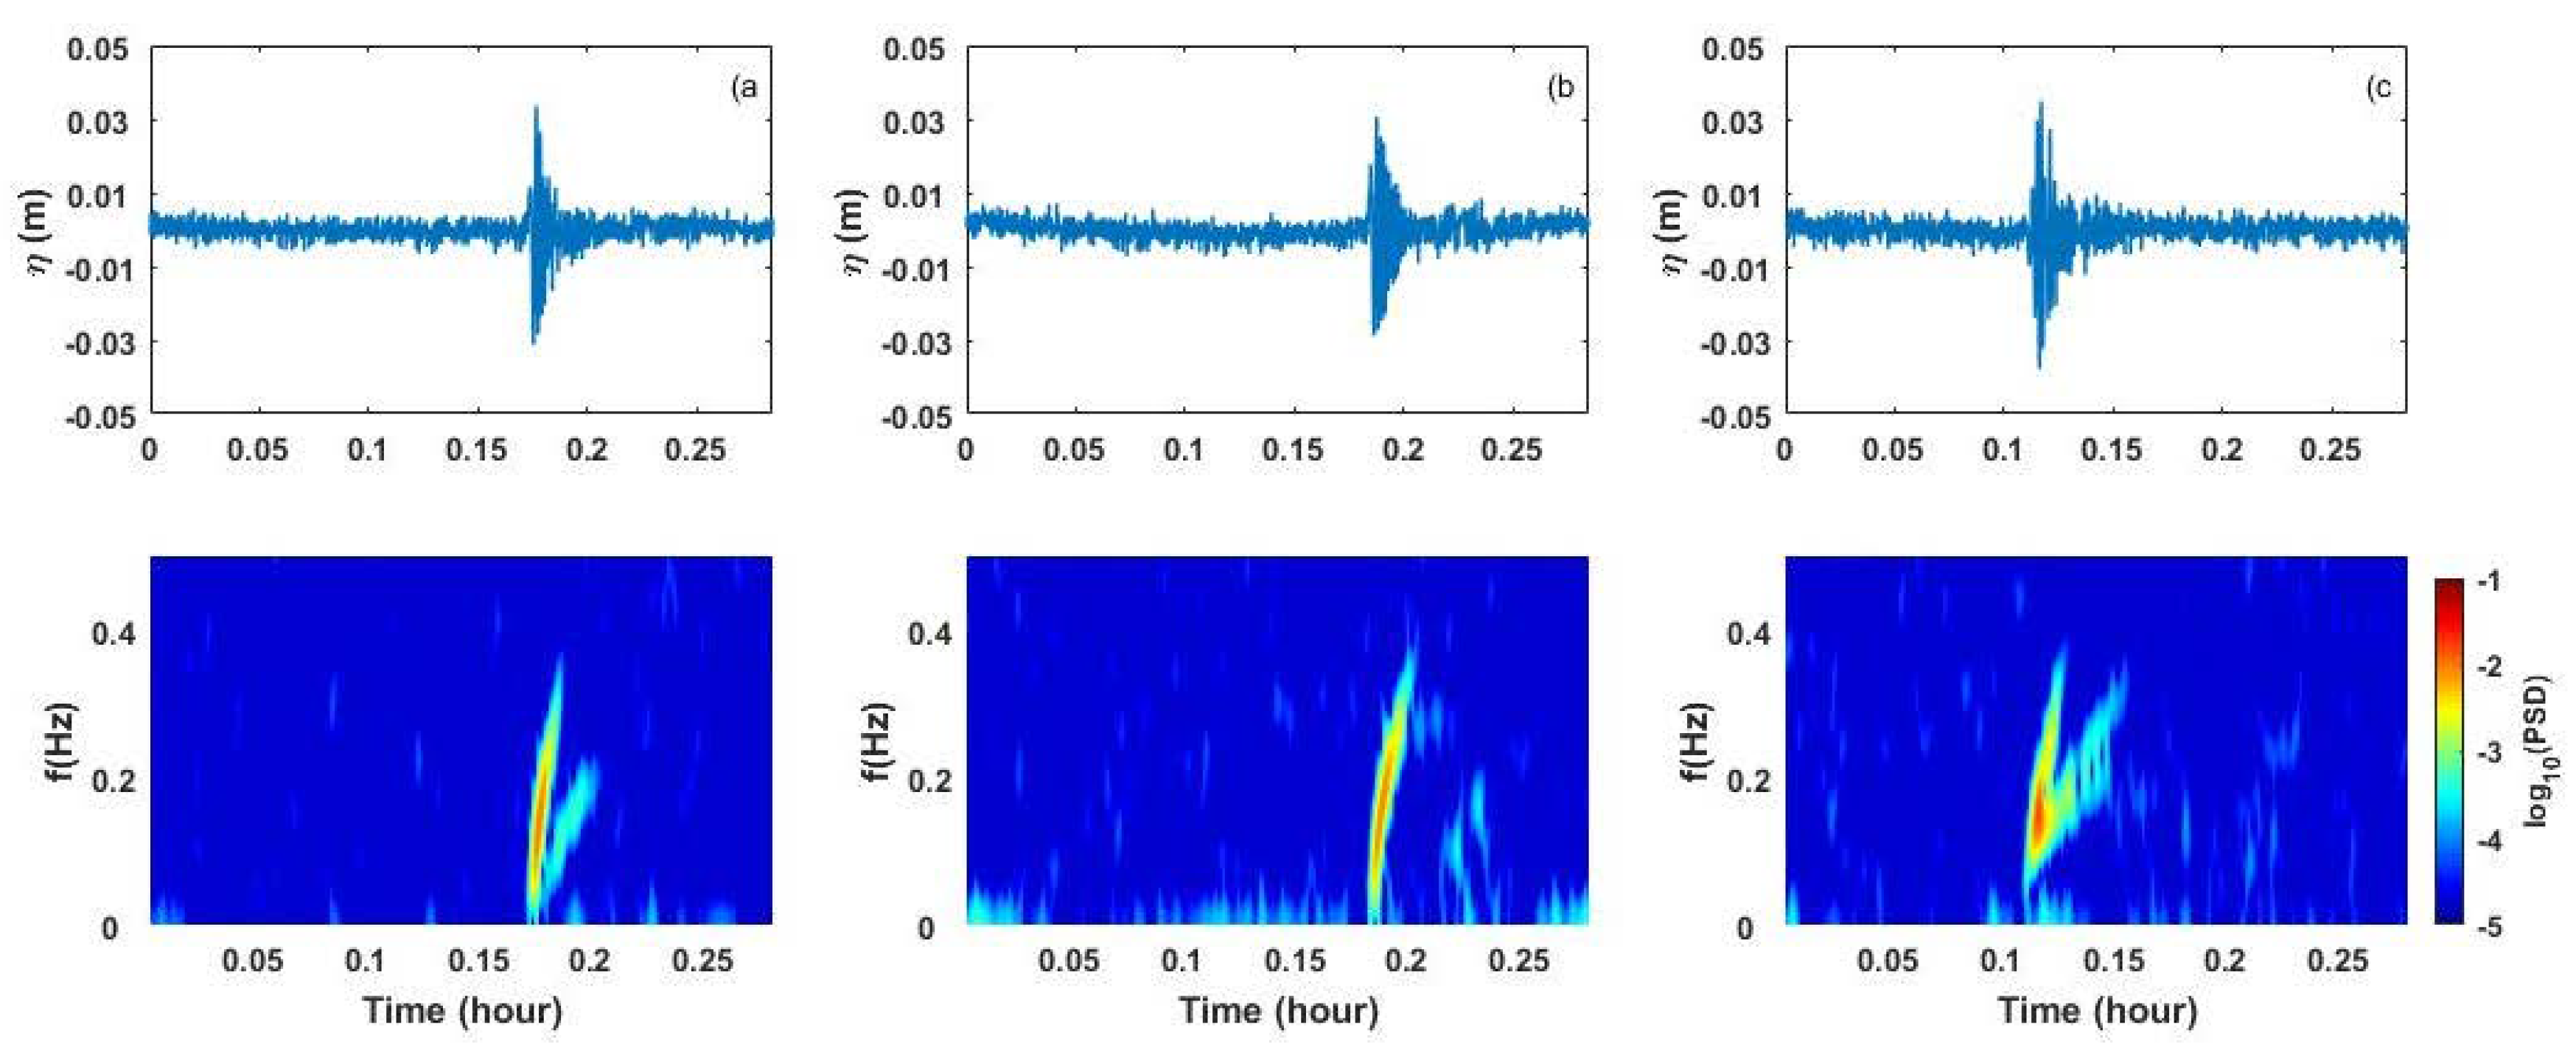
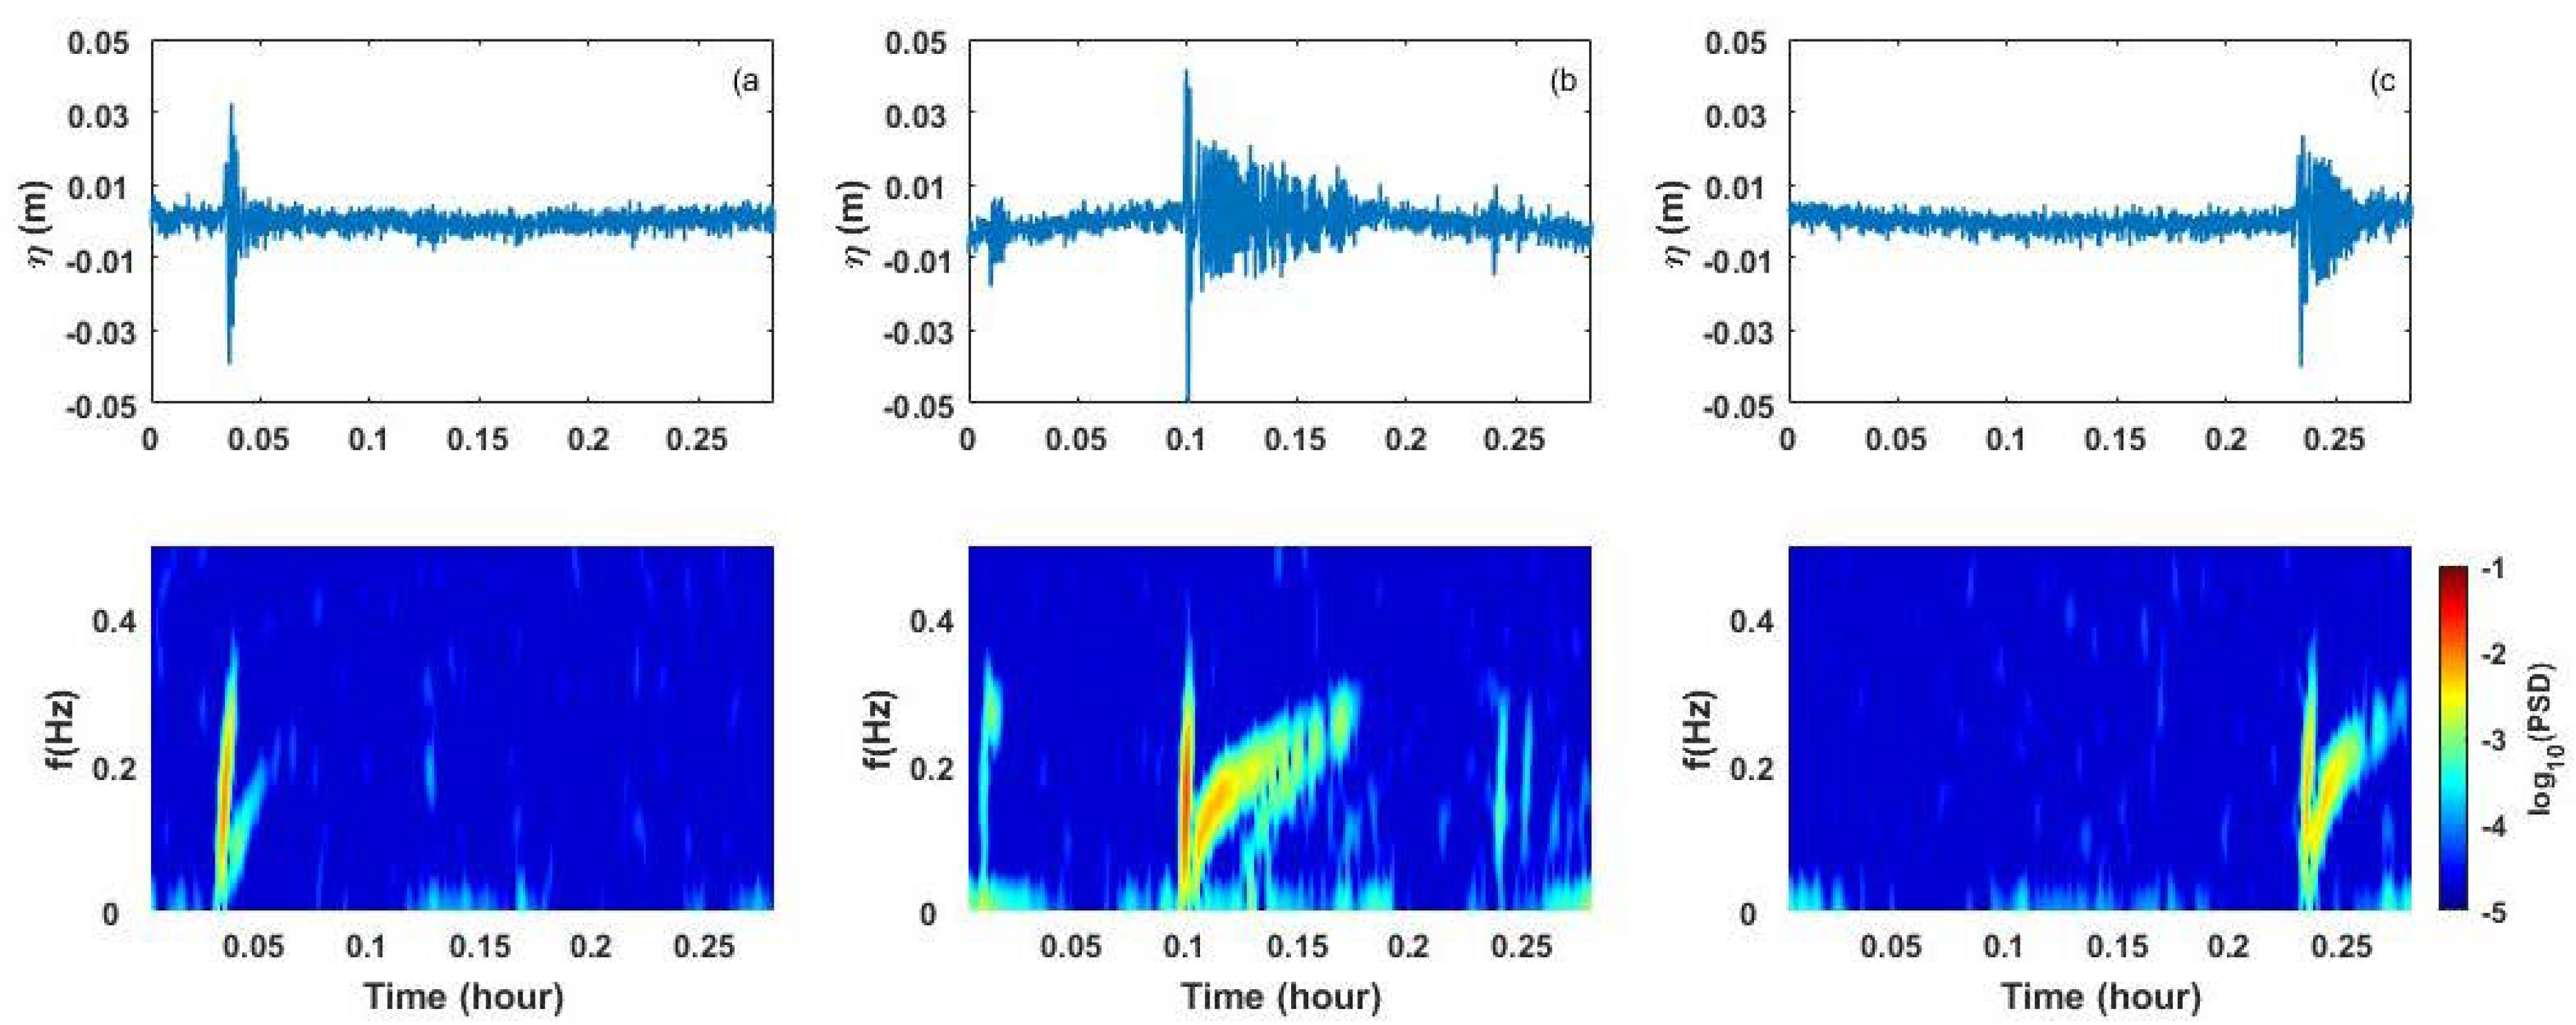
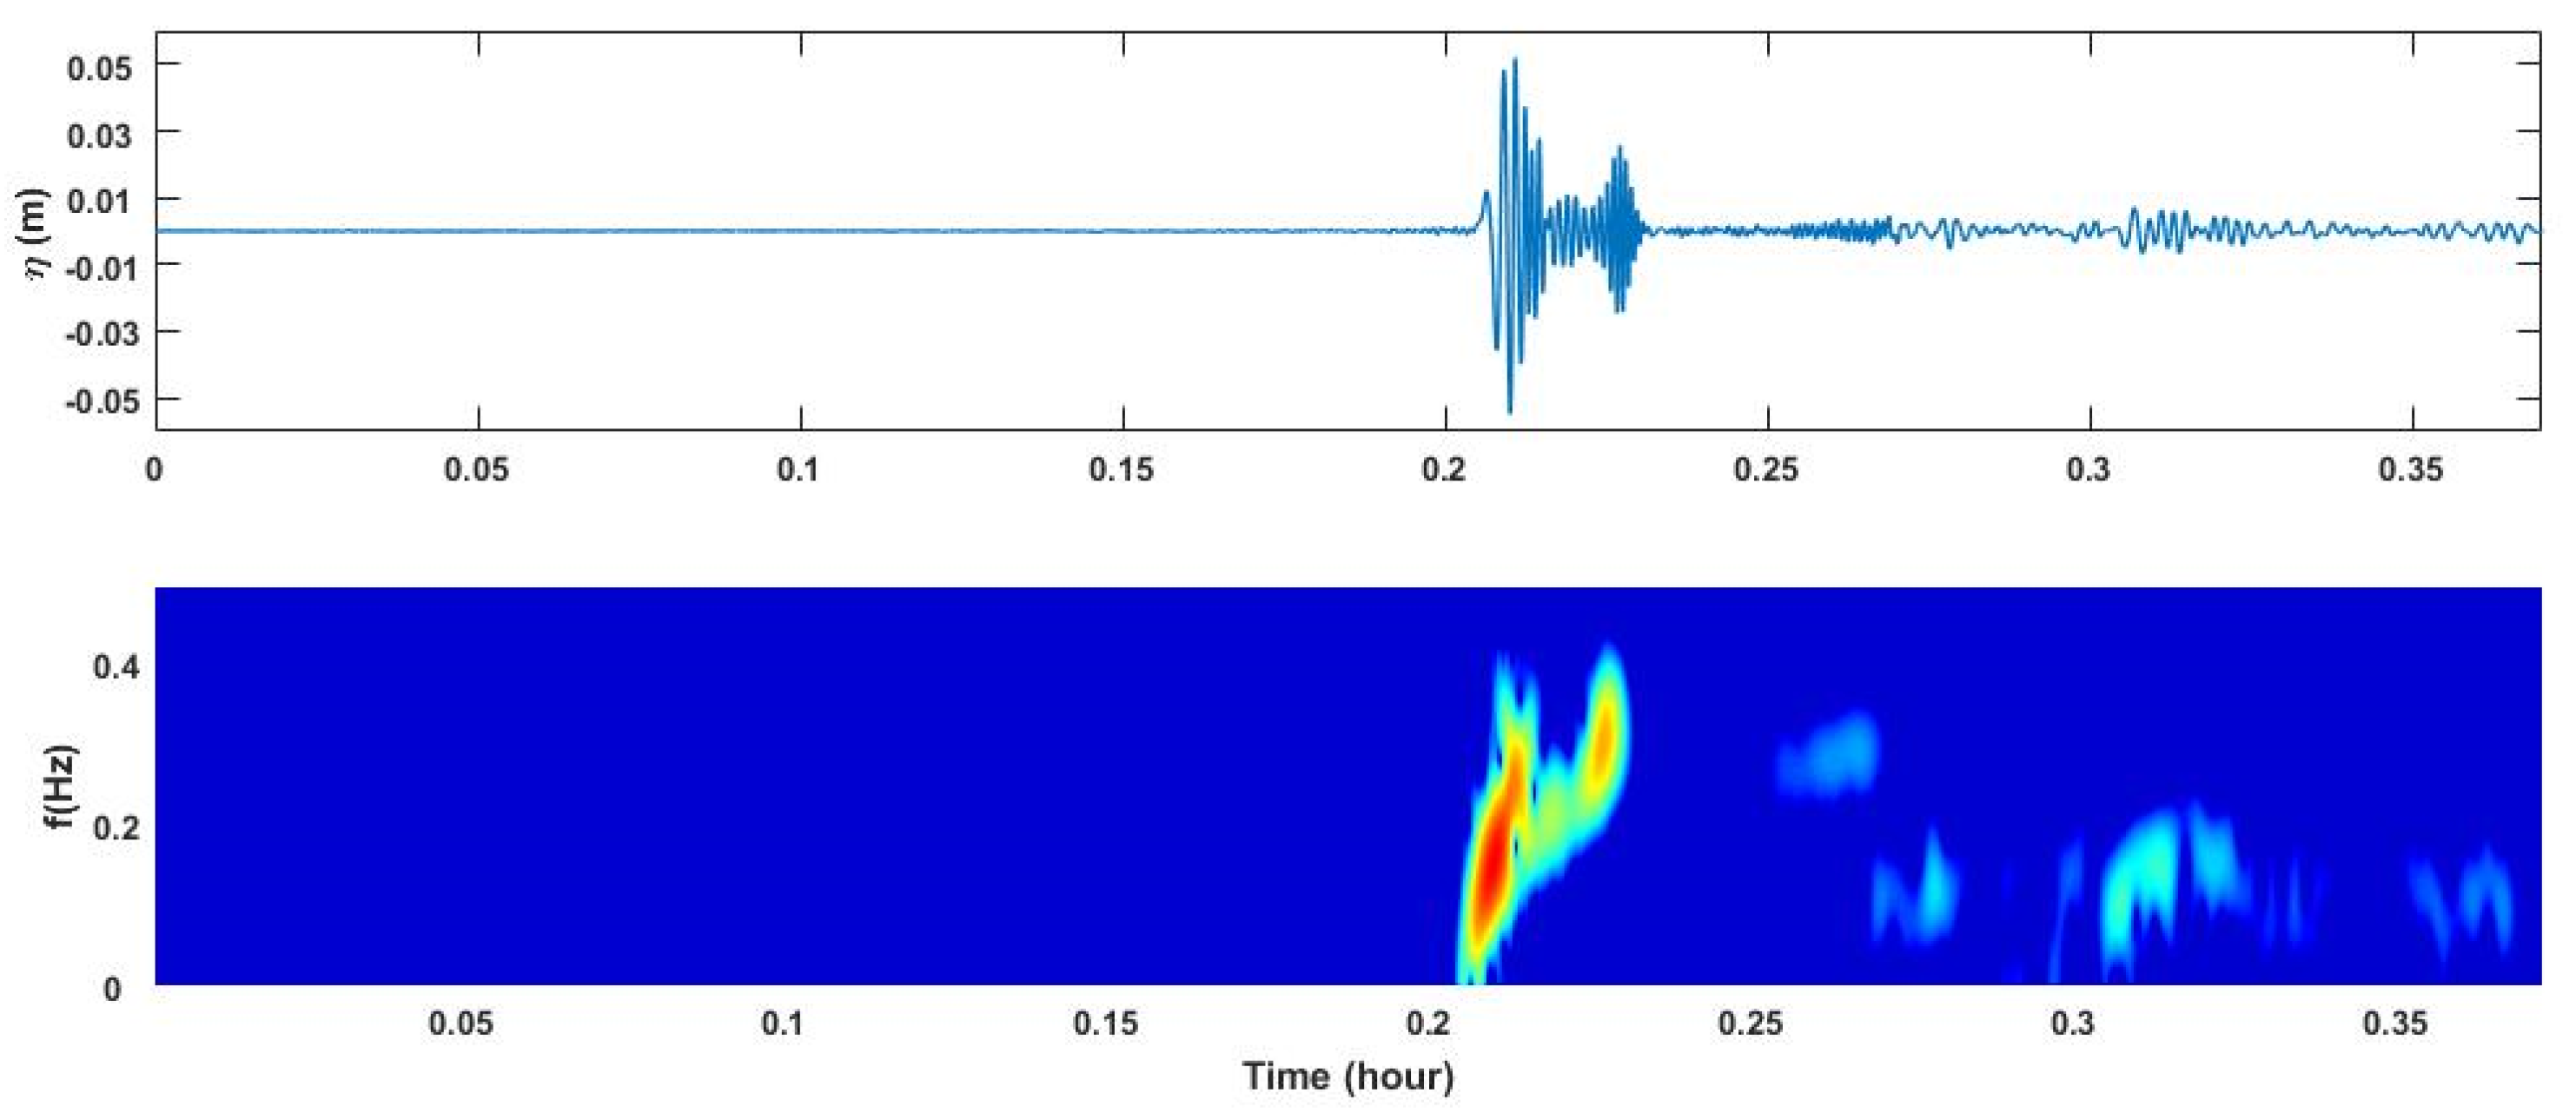
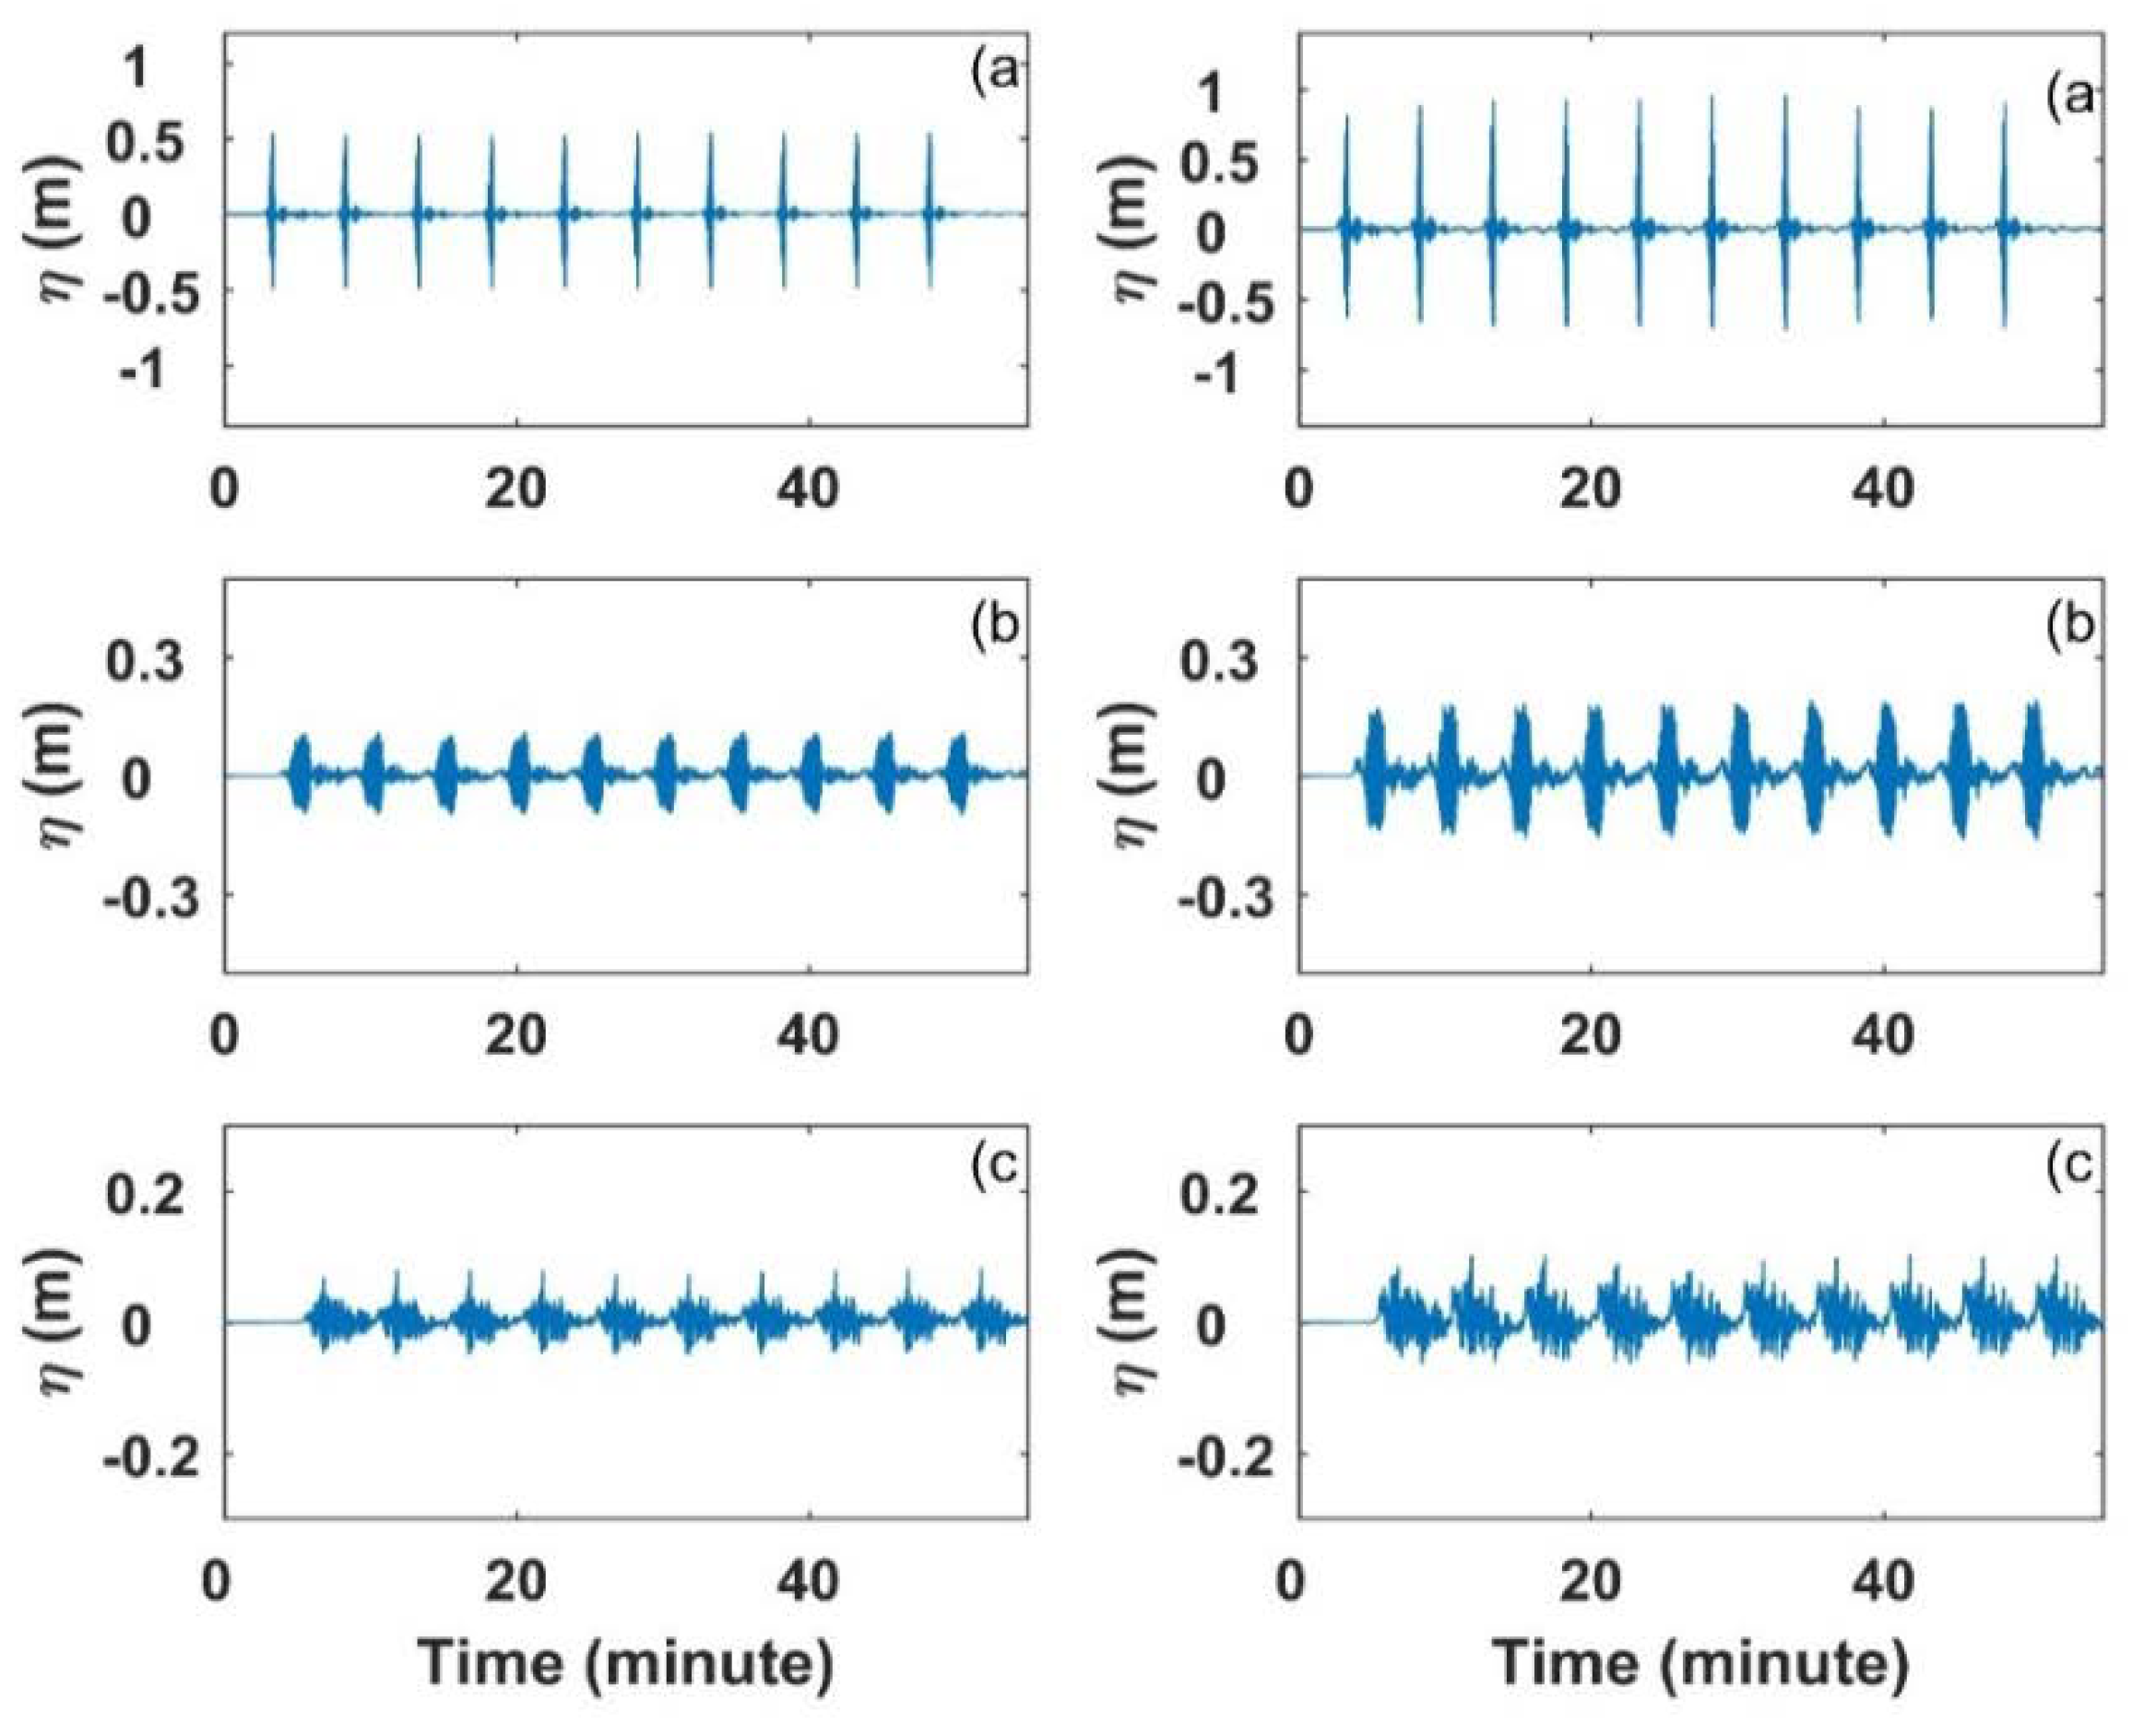
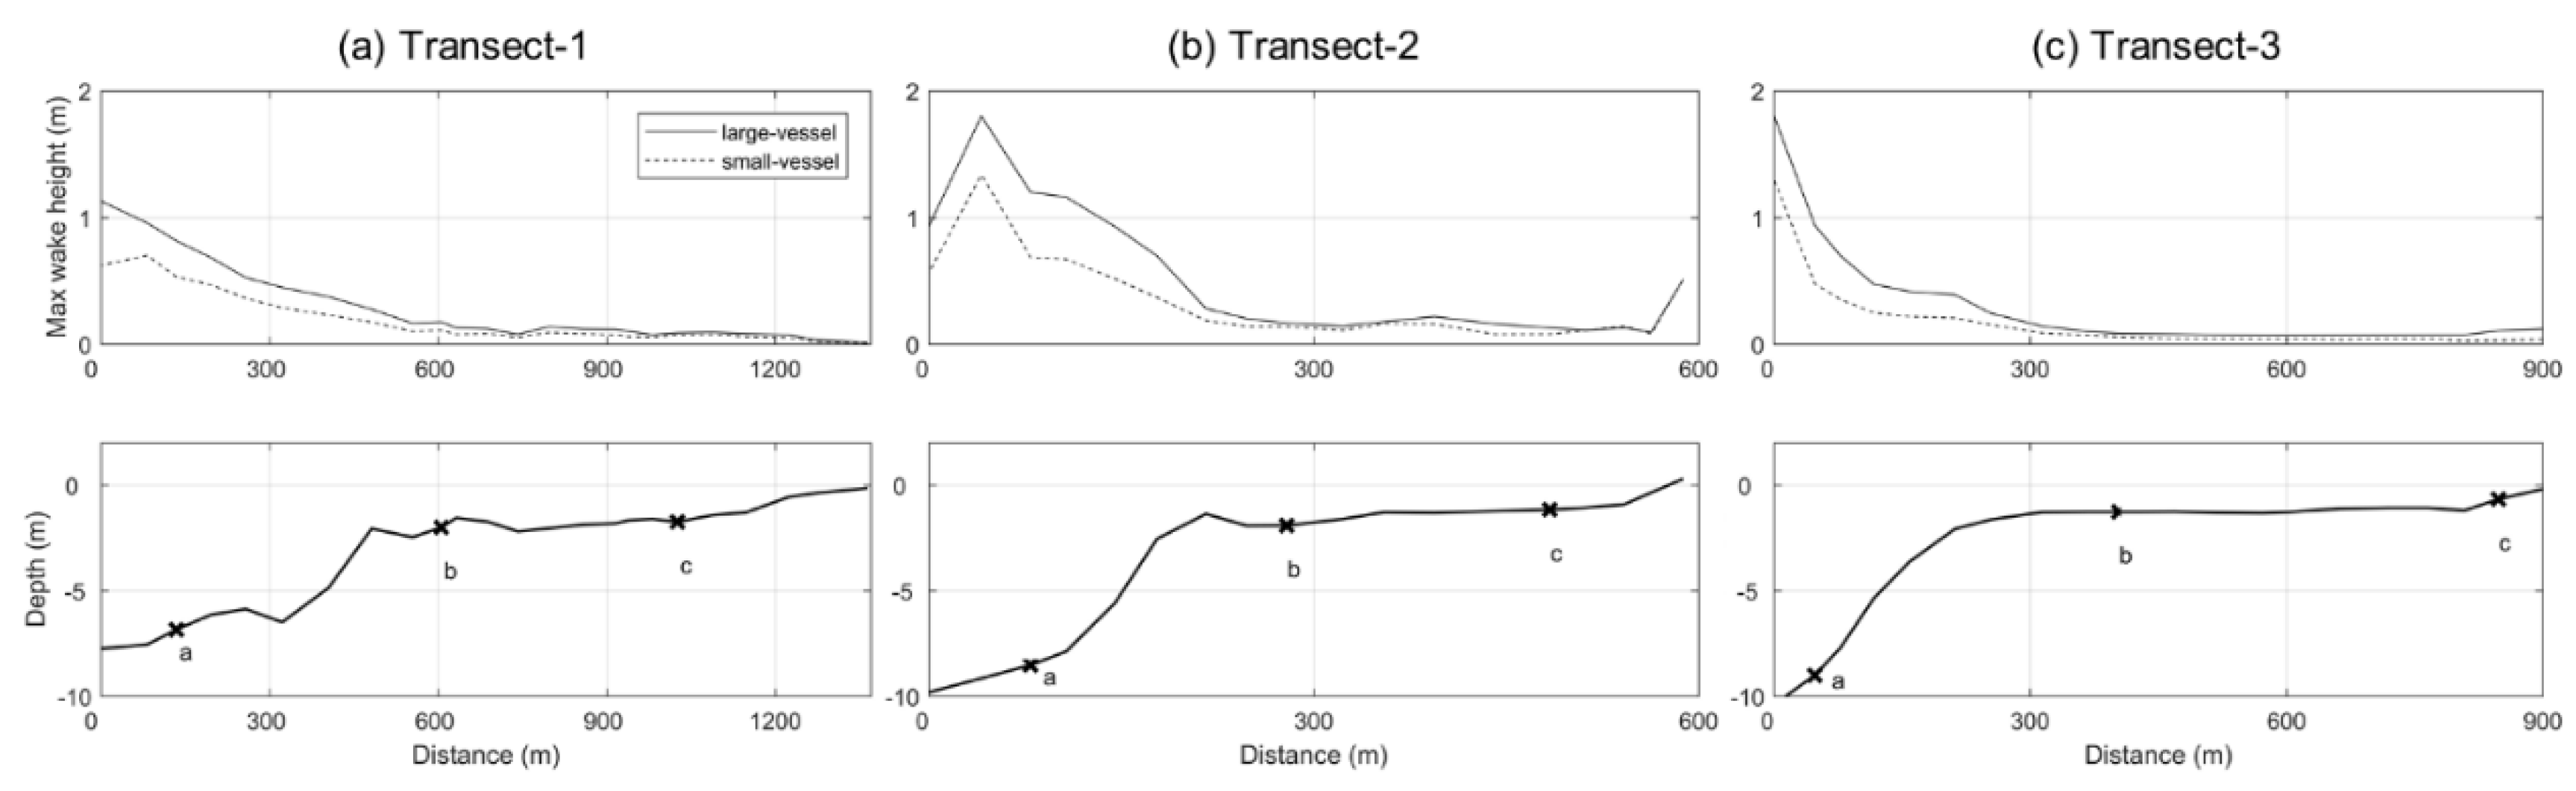
3.1. Characteristics of Measured Ship Wakes
3.2. Model Evaluation
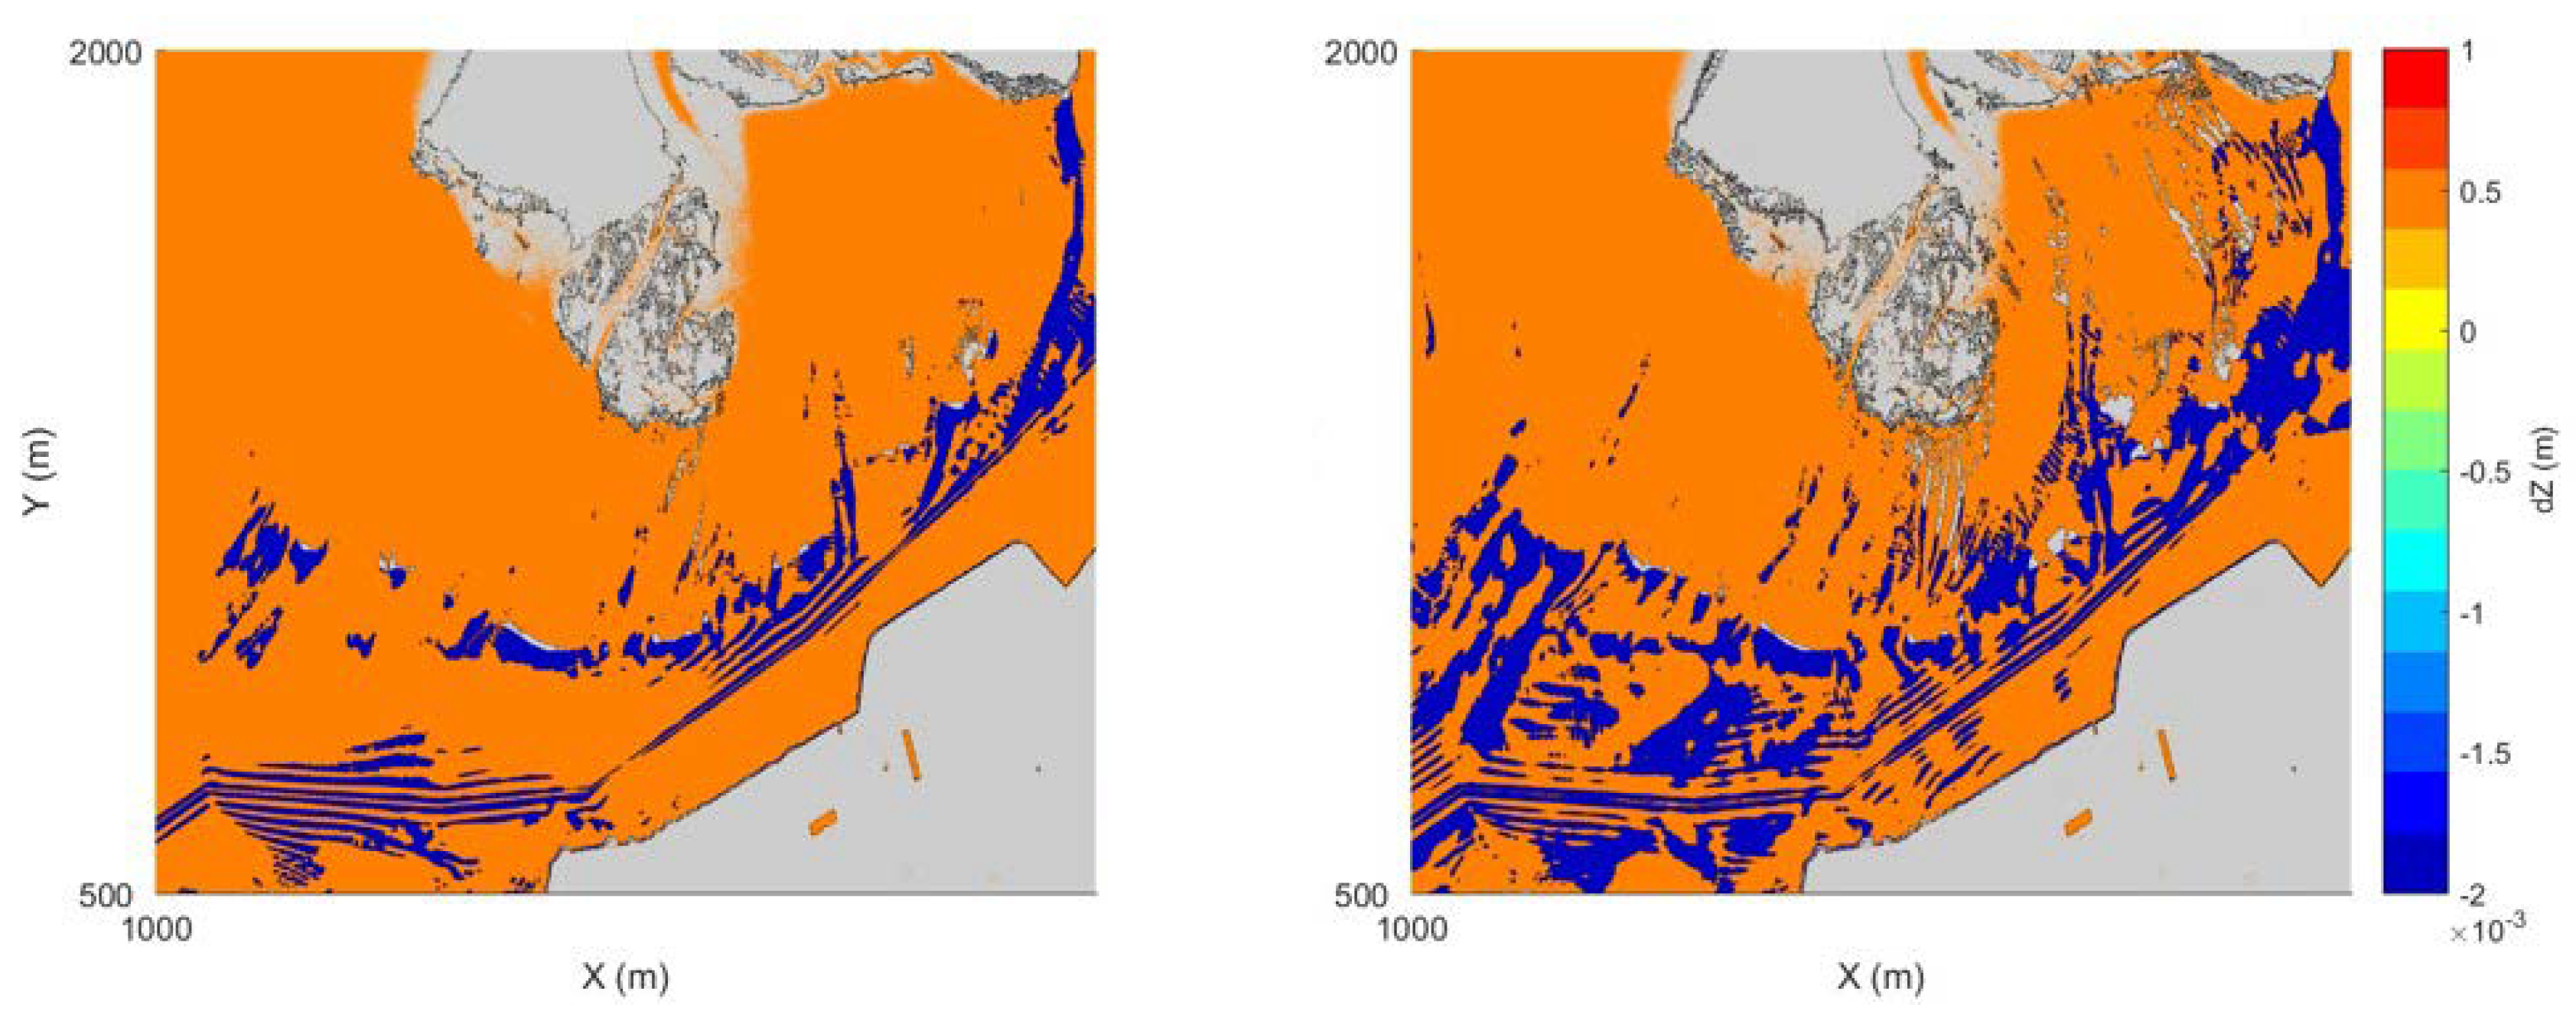
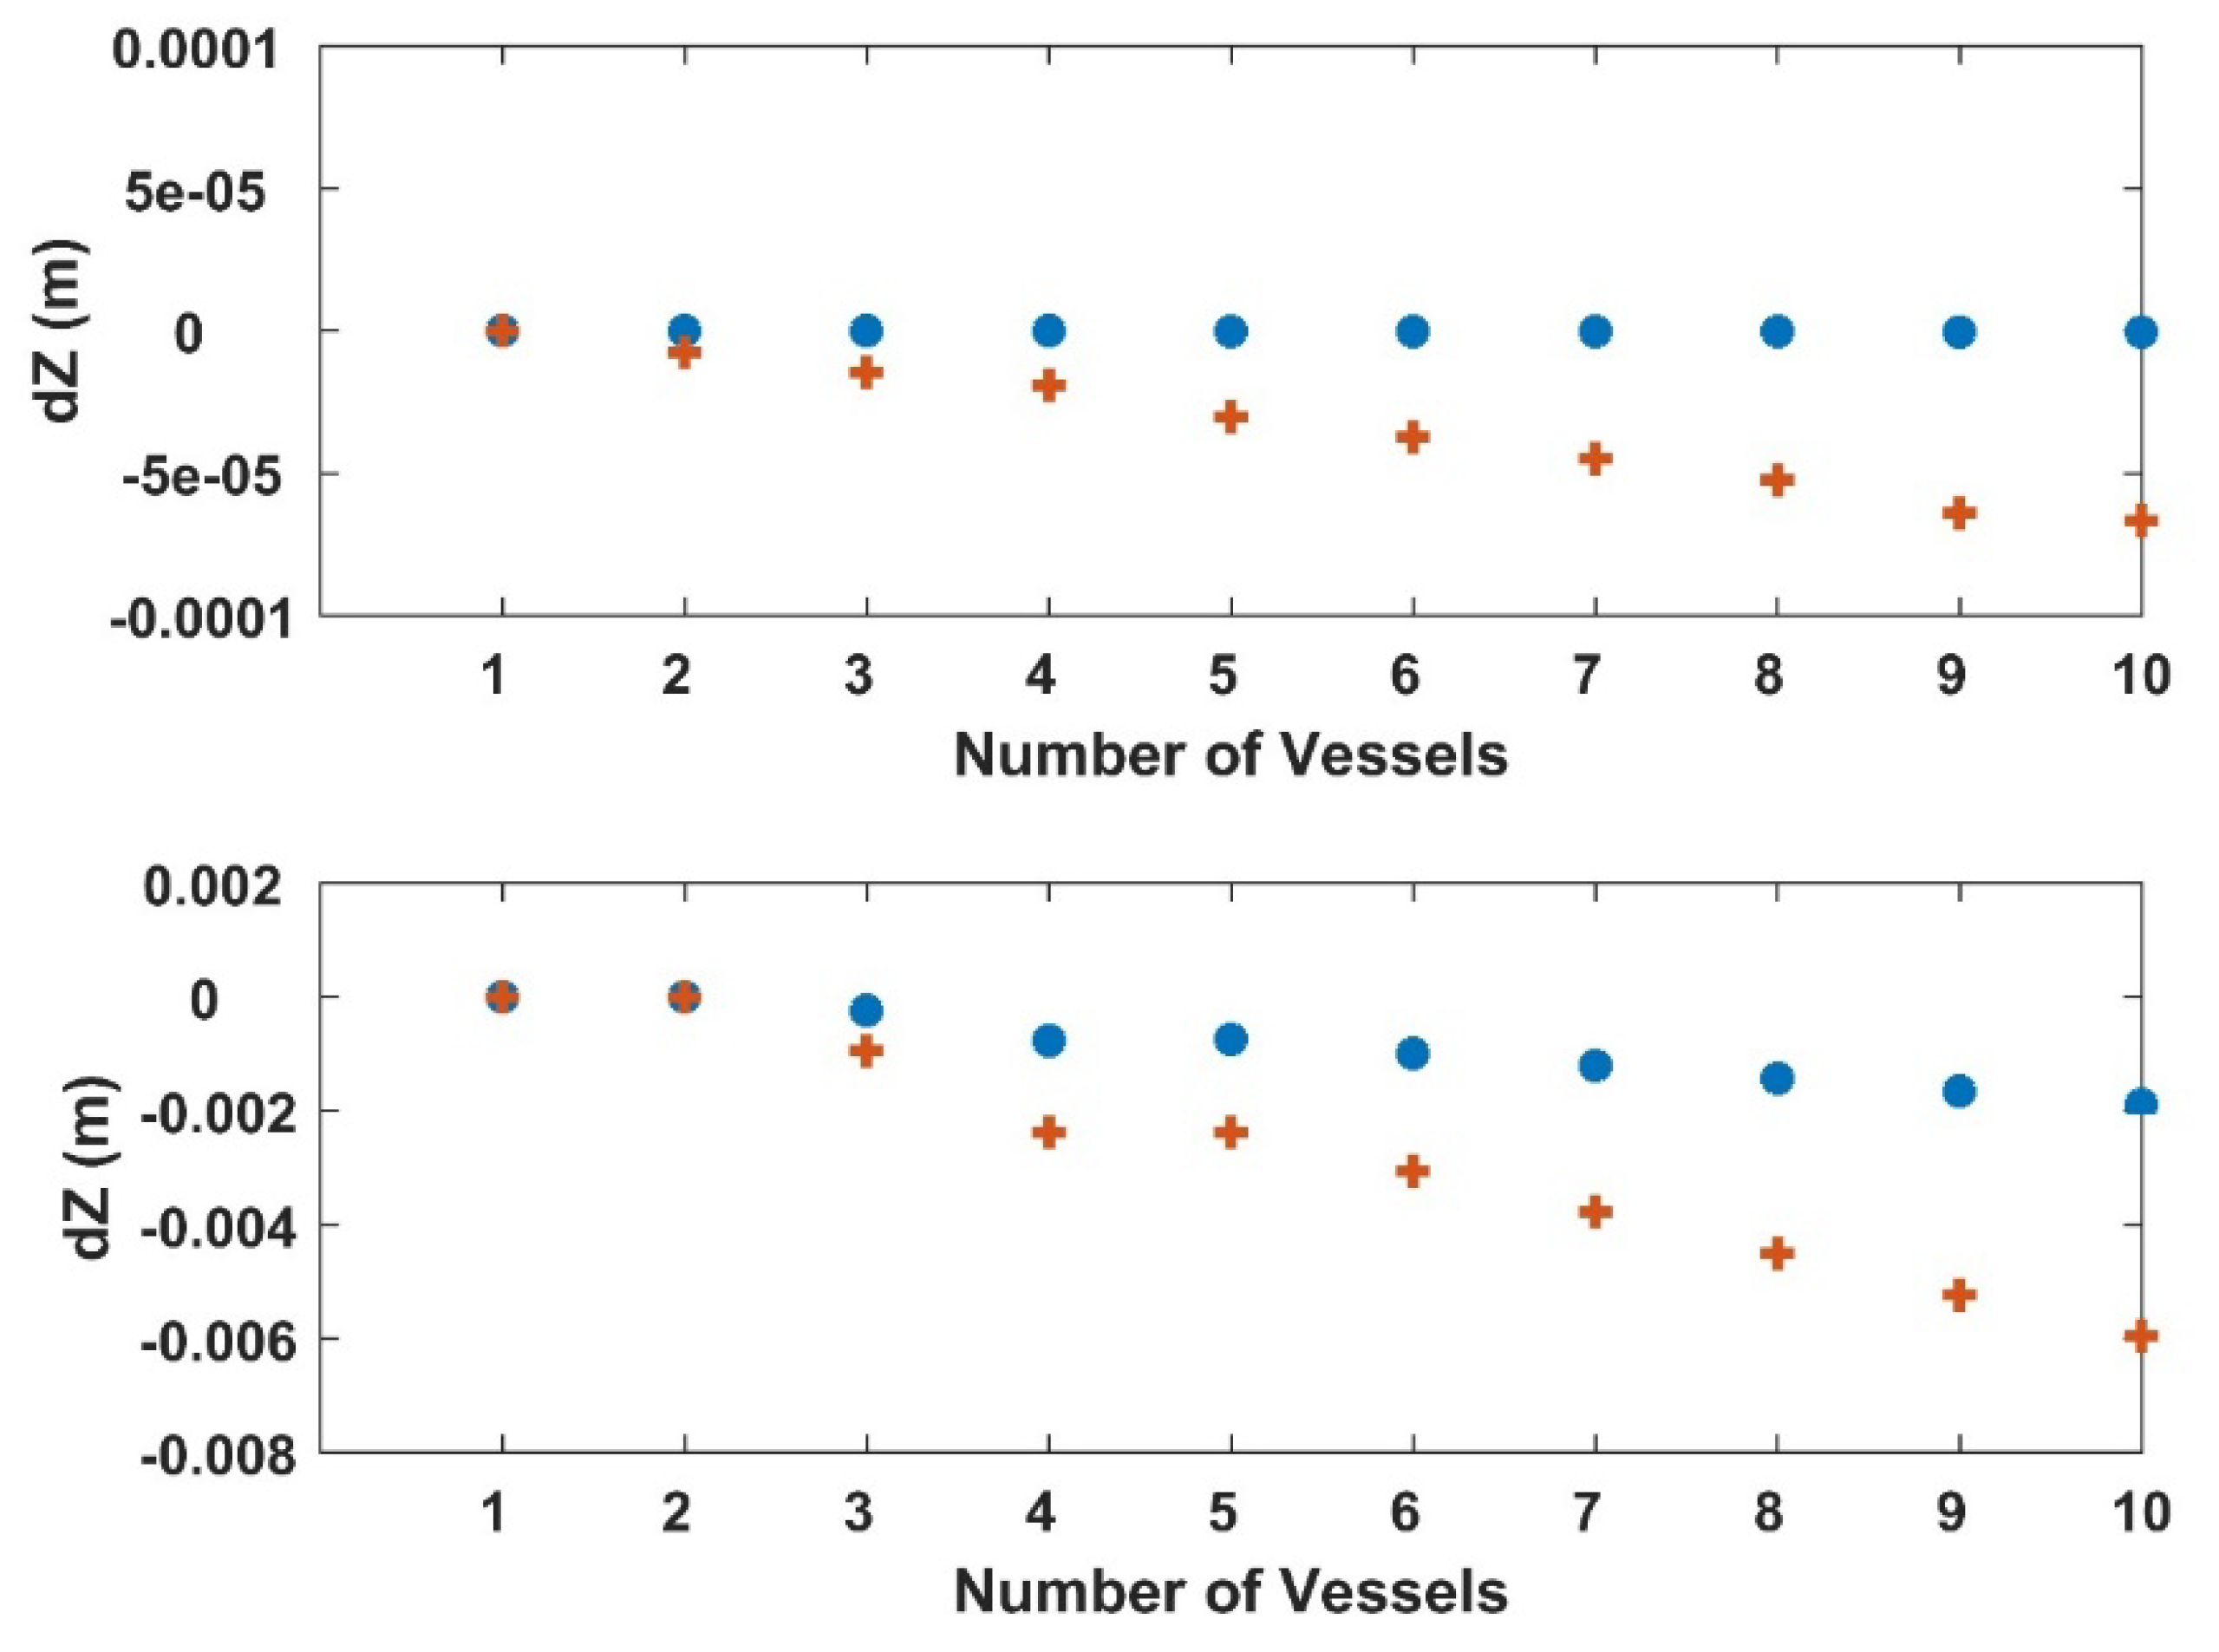
3.3. Numerical Experiments
4. Conclusions
Author Contributions
Funding
Acknowledgments
Conflicts of Interest
Appendix A


References
- Hartig, E.K.; Gornitz, V.; Kolker, A.; Mushacke, F.; Fallon, D. Anthropogenic and climate-change impacts on salt marshes of Jamaica Bay, New York City. Wetlands 2002, 22, 71–89. [Google Scholar]
- Deegan, L.A.; Johnson, D.S.; Warren, R.S.; Peterson, B.J.; Fleeger, J.W.; Fagherazzi, S.; Wollheim, W.M. Coastal eutrophication as a driver of salt marsh loss. Nature 2012, 490, 388–392. [Google Scholar] [CrossRef] [PubMed]
- Weston, N.B. Declining sediments and rising seas: An unfortunate convergence for tidal wetlands. Estuar. Coasts 2014, 37, 1–23. [Google Scholar] [CrossRef]
- Kirwan, M.L.; Megonigal, J.P. Tidal wetland stability in the face of human impacts and sea level rise. Nature 2013, 504, 53–60. [Google Scholar] [CrossRef] [PubMed]
- Ganju, N.K.; Kirwan, M.L.; Dickhudt, P.J.; Guntenspergen, G.R.; Cahoon, D.R.; Kroeger, K.D. Sediment transport-based metrics of wetland stability. Geophysics. Res. Lett. 2015, 42, 7992–8000. [Google Scholar] [CrossRef]
- Alizad, K.; Hagen, S.C.; Morris, J.T.; Medeiros, S.C.; Bilskie, M.V.; Weishampel, J.F. Coastal wetland response to sea-level rise in a fluvial estuarine system. Earth’s Future 2016, 4, 483–497. [Google Scholar] [CrossRef]
- Alizad, K.; Hagen, S.C.; Medeiros, S.C.; Bilskie, M.V.; Morris, J.T.; Balthis, L.; Buckel, C.A. Dynamic responses and implications to coastal wetlands and the surrounding regions under sea level rise. PLoS ONE 2018, 13, e0205176 . [Google Scholar] [CrossRef]
- Smith, J.M.; Bryant, M.A.; Wamsley, T.V. Wetland buffers: Numerical modeling of wave dissipation by vegetation. Earth Surf. Process. Landf. 2016, 41, 847–854. [Google Scholar] [CrossRef]
- Marsooli, R.; Orton, P.M.; Mellor, G. Modeling wave attenuation by salt marshes in Jamaica Bay, New York, using a new rapid wave model. J. Geophys. Res. Ocean. 2017, 122, 5689–5707. [Google Scholar] [CrossRef]
- New York City Department of Environmental Protection. Jamaica Bay Watershed Protection Plan, Volume I; New York City Department of Environmental Protection: New York, NY, USA, 2007.
- Campbell, A.; Peteet, D. Saltmarsh Change Analysis of Jamaica Bay with Satellite Imagery; Webinar Presentation at Research of Jamaica Bay Webinar Series; Science and Resilience Institute: Jamaica Bay, NY, USA, 2018. [Google Scholar]
- Campbell, A.; Peteet, D. Sediment History Reconstruction in Understanding the Ecosystem of Jamaica Bay; Webinar Presentation at Research of Jamaica Bay Webinar Series; Science and Resilience Institute: Jamaica Bay, NY, USA, 2018. [Google Scholar]
- Psuty, N. Geomorphological Restoration and Resilience in Jamaica Bay, Gateway; Webinar Presentation at Research of Jamaica Bay Webinar Series; Science and Resilience Institute: Jamaica Bay, NY, USA, 2018. [Google Scholar]
- Ganju, N.K.; Chant, B. Sediment Transport and Budgets; Webinar Presentation at Research of Jamaica Bay Webinar Series; Science and Resilience Institute: Jamaica Bay, NY, USA, 2018. [Google Scholar]
- Wang, H.C.; Chen, Q.; Hu, K.; Snedden, G.A.; Hartig, E.K.; Couvillion, B.R.; Johnson, C.L.; Orton, P.M. Numerical Modeling of the Effects of Hurricane Sandy and Potential Future Hurricanes on Spatial Patterns of Salt Marsh Morphology in Jamaica Bay, New York City; U.S. Geological Survey: Reston, VA, USA, 2017.
- Peteet, D.M.; Nichols, J.; Kenna, T.; Chang, C.; Browne, J.; Reza, M.; Kovari, S.; Liberman, L.; Stern-Protz, S. Sediment starvation destroys New York City marshes’ resistance to sea level rise. Proc. Natl. Acad. Sci. USA 2018, 115, 10281–10286. [Google Scholar] [CrossRef]
- Anderson, F.E. The Effect of Boat Waves on the Sedimentary Processes of a New England Tidal Flat; Department of Earth Sciences, University of New Hampshire Technical Report 1: Durham, NH, USA, 1974. [Google Scholar]
- Bauer, B.O.; Lorang, M.S.; Sherman, D.J. Estimating boat-wake–induced levee erosion using sediment suspension measurements. J. Waterw. Port Coast. Ocean Eng. 2002, 128, 152–162. [Google Scholar] [CrossRef]
- Castillo, J.M.; Luque, C.J.; Castellanos, E.M.; Figueroa, M.E. Causes and consequences of salt-marsh erosion in an Atlantic estuary in SW Spain. J. Coast. Conserv. 2000, 6, 89–96. [Google Scholar] [CrossRef]
- Johnson, J.W. Ship waves in navigation channels. In Proceeding of the 6th Coastal Engineering Conference; ASCE: Gainesville, FL, USA, 1957; pp. 666–690. [Google Scholar]
- Johnson, J.W. Ship waves at recreational beaches. Shore Beach 1969, 37, 11–15. [Google Scholar]
- Kos, S.; Bielby, S. Fast ferries decision: Seeing sense in its wake. N. Z. Law J. 1995, 202, 363–368. [Google Scholar]
- Nanson, G.C.; von Krusentierna, A.; Bryant, E.A.; Renilson, M.R. Experimental measurements of river-bank erosion caused by boat generated waves on the Gordon River, Tasmania. Regul. Rivers Res. Manag. 1994, 9, 1–14. [Google Scholar] [CrossRef]
- Osborne, P.D.; Boak, E.H. Sediment suspension and morphological responses under vessel-generated wave groups: Torpedo Bay, Auckland, New Zealand. J. Coast. Res. 1999, 15, 388–398. [Google Scholar]
- Pardy, B. Fast ferries: New equilibrium versus ecological sustainability. N. Z. Law J. 1995, 6, 202–204. [Google Scholar]
- Parnell, K.E.; McDonald, S.C.; Burke, A.E. Shoreline effects of vessel wakes, Marlborough Sounds, New Zealand. J. Coast. Res. SI 2007, 50, 502–506. [Google Scholar]
- Cox, R.; Wadsworth, R.A.; Thomson, A.G. Long-term changes in salt marsh extent affected by channel deepening in a modified estuary. Cont. Shelf Res. 2003, 23, 1833–1846. [Google Scholar] [CrossRef]
- Sorensen, R.M. Ship-generated waves. In Advances in Hydroscience; Elsevier: Amsterdam, The Netherlands, 1973; Volume 9, pp. 49–83. [Google Scholar]
- Glamore, W.C. A Decision Support Tool for Assessing the Impact of Boat Wake Waves on Inland Waterways. In Proceedings of the International Conference on Coastal and Port Engineering in Developing Countries, Dubai, UAE, 24–28 February 2008; p. 20. Available online: http://pianc.org (accessed on 24 February 2008).
- Zabawa, C.; Ostrom, C. The Role of Boat Wakes in Shoreline Erosion in Anne Arundel County, Maryland; Final Report to the Coastal Resources Division; Maryland Department of Natural Resources: Annapolis, MD, USA, 1980.
- FitzGerald, D.; Allen, J.; Rosen, P.S. Boat Wake Impacts and Their Role in Shore Erosion Processes, Boston Harbor Islands National Recreation Areas; Natural Resource Report NPS/NERO/NRR-2011/403; National Park Service: Fort Collins, CO, USA, 2011.
- Hofmann, H.; Lorke, A.; Peeters, F. Wind and ship-induced resuspension in the littoral zone of a large lake. Water Resour. Res. 2011, 47, 1–12. [Google Scholar] [CrossRef]
- Schwimmer, R.A. Rates and processes of marsh shoreline erosion in Rehoboth Bay, Delaware, U.S.A. J. Coast. Res. 2001, 17, 672–683. [Google Scholar]
- Houser, C. Relative importance of vessel-generated and wind waves to salt marsh erosion in a restricted fetch environment. J. Coast. Res. 2010, 26, 230–240. [Google Scholar] [CrossRef]
- Didenkulova, I.; Sheremet, A.; Torsvik, T.; Soomere, T. haracteristic properties of different vessel wake signals. J. Coast. Res. 2013, 65, 213–218. [Google Scholar] [CrossRef]
- Pethiyagoda, R.; Moroney, T.J.; Macfarlane, G.J.; Binns, J.R.; McCue, S.W. Time-frequency analysis of ship wave patterns in shallow water: Modelling and experiments. Ocean Eng. 2018, 158, 123–131. [Google Scholar] [CrossRef]
- Waldman, J. Research Opportunities in the Natural and Social Sciences at the Jamaica Bay Unit of Gateway National Recreation Area; Report Prepared for National Park Service, Jamaica Bay Institute: Brooklyn, NY, USA, 2008.
- Marsooli, R.; Orton, P.M.; Fitzpatricl, J.; Smith, H. Residence Time of a Highly Urbanized Estuary: Jamaica Bay, New York. J. Mar. Sci. Eng. 2018, 6, 44. [Google Scholar] [CrossRef]
- NYCDEP. Category 2, Restoration Ecology: Objectives, Current Programs, and Potential Management Strategies; New York City Department of Environmental Protection: New York, NY, USA, 2007; Volume 2, chapter 4.
- GNRA; National Park Service, US Department of Interior; Jamaica Watershed Protection Plan Advisory Committee. An Update on the Disappearing Salt Marshes of Jamaica Bay; National Park Service: New York, NY, USA, 2007.
- Kelvin, W. On the waves produced by a single impulse in water of any depth. Proc. R. Soc. Lond. 1887, 42, 80–83. [Google Scholar]
- Rabaud, M.; Moisy, F. Ship wakes: Kelvin or Mach angle? Phys. Rev. Lett. 2013, 110, 214503. [Google Scholar] [CrossRef]
- Darmon, A.; Benzaquen, M.; Raphaël, E. Kelvin wake pattern at large Froude numbers. J. Fluid Mech. 2014, 738, R3. [Google Scholar] [CrossRef]
- Torsvik, T.; Soomere, T.; Didenkulova, I.; Sheremet, A. Identification of ship wake structures by a time–Frequency method. J. Fluid Mech. 2015, 765, 229–251. [Google Scholar] [CrossRef]
- Torsvik, T.; Herrmann, H.; Didenkulova, I.; Rodin, A. Analysis of ship wake transformation in the coastal zone using time–frequency methods. Proc. Est. Acad. Sci. 2015, 64, 379–388. [Google Scholar] [CrossRef]
- Shi, F.; Kirby, J.T.; Tehranirad, B.; Harris, J.C. FUNWAVE-TVD, Documentation and Users’ Manual; Research Report, CACR-1103; University of Delaware: Newark, DE, USA, 2011. [Google Scholar]
- Chen, Q. Fully nonlinear Boussinesq-type equations for waves and currents over porous beds. J. Eng. Mech. 2006, 132, 220–230. [Google Scholar] [CrossRef]
- Kennedy, A.B.; Kirby, J.T.; Chen, Q.; Dalrymple, R.A. Boussinesq-type equations with improved nonlinear performance. Wave Motion 2001, 33, 225–243. [Google Scholar] [CrossRef]
- Shi, F.; Malej, M.; Smith, J.M.; Kirby, J.T. Breaking of Ship Bores in a Boussinesq-type Ship-Wake Model. Coast. Eng. 2018, 132, 1–12. [Google Scholar] [CrossRef]
- Ertekin, R.C.; Webster, W.C.; Wehausen, J.V. Waves Caused by a Moving Disturbance in a Shallow Channel of Finite Width. J. Fluid Mech. 1986, 169, 275–292. [Google Scholar] [CrossRef]
- Wu, T.Y. Generation of Upstream Advancing Solitons by Moving Disturbances. J. Fluid Mech. 1987, 184, 75–99. [Google Scholar] [CrossRef]
- Torsvik, T. Long Wave Models with Application to High Speed Vessels in Shallow Water. Ph.D. Thesis, University of Bergen, Bergen, Norway, 2006. [Google Scholar]
- Malej, M.; Shi, F.; Smith, J.M. Modeling Ship-Wake-Induced Sediment Transport and Morphological Changes—Sediment Module in FUNWAVE-TVD; ERDC/CHL CHETN-VII-20; U.S. Army Engineer Research and Development Center: Vicksburg, MS, USA, 2019. [Google Scholar]
- Rijn, L.C. Sediment Pick-Up Functions. J. Hydraul. Eng. 1984, 110, 1494–1502. [Google Scholar] [CrossRef]
- Cao, Z. Equilibrium Near-Bed Concentration of Suspended Sediment. J. Hydraul. Eng. 1999, 125, 1270–1278. [Google Scholar] [CrossRef]
- Renfro, A.; Cochran, J.K.; Hirschberg, D.J.; Goodbred, S.L. Natural Radionuclides (234Th, 7Be and 210Pb) as Indicators of Sediment Dynamics in Jamaica Bay, New York; Natural Resource Technical Report NPS/NERO/NRTR-2010/324; U.S. Department of the Interior National Park Service: Fort Collins, CO, USA, 2010.
- Meyer-Peter, E.; Müller, R. Formulas for Bed-Load Transport. In Proceedings of the 2nd meeting of the International Association for Hydraulic Structure Research, Stockholm, Sweden, 7 June 1948; The International Association for Hydro-Environment Engineering and Research (IAHR): Delft, The Netherlands; pp. 39–64. [Google Scholar]
- Hu, K.; Chen, Q.; Wang, H.; Harting, E.K.; Orton, P. Numerical modeling of salt marsh morphological change induced by Hurricane Sandy. J. Coast. Eng. 2017, 132, 63–81. [Google Scholar] [CrossRef]
- Karambas, T.V. Prediction of sediment transport in the swash-zone by using a nonlinear wave model. Cont. Shelf Res. 2006, 26, 599–609. [Google Scholar] [CrossRef]
- Othman, I.K.; Baldock, T.E.; Callaghan, D.P. Measurement and modelling of the influence of grain size and pressure gradient on swash uprush sediment transport. Coast. Eng. 2014, 83, 1–14. [Google Scholar] [CrossRef]
- Elder, J.W. The dispersion of marked fluid in turbulent shear flow. J. Fluid Mech. 1959, 5, 544–560. [Google Scholar] [CrossRef]
- Splinter, K.D.; Holman, R.A.; Plant, N.G. A behavior-oriented dynamic model for sandbar migration and 2DH evolution. J. Geophys. Res. 2011, 116, C01020. [Google Scholar] [CrossRef]
- Tehranirad, B.; Kirby, J.T.; Shi, F. Does Morphological Adjustment during Tsunami Inundation Increase Levels of Hazard? Research Report No. CACR-16-02; Center of Applied Coastal Research, Department of Civil and Environmental Engineering, University of Delaware: Newark, DE, USA, 2016. [Google Scholar]
- Kobayashi, N.; Lawrence, A.R. Cross-Shore Sediment Transport under Breaking Solitary Waves. J. Geophys. Res. 2004, 109, C03047. [Google Scholar] [CrossRef]
- Pintado-Patino, J.C. Procesos Dinamicos en la Zona de Swash Un Estudio Integral. Ph.D. Thesis, Univesidad Nacional Autonoma de Mexico, Mexico City, Mexico, 2017. [Google Scholar]
- Marine Traffic. Available online: www.marinetraffic.com (accessed on 6 July 2019).


| Experiment | Vessel Size (m) (Length × Width) | Average Sailing Speed (Knot) | Number of Vessels |
|---|---|---|---|
| 1 | 23 × 8 | 5 | 1 |
| 2 | 23 × 8 | 15 | 1 |
| 3 | 23 × 8 | 5 | 10 |
| 4 | 23 × 8 | 15 | 10 |
| 5 | 15 × 5 | 5 | 1 |
| 6 | 15 × 5 | 15 | 1 |
| 7 | 15 × 5 | 5 | 10 |
| 8 | 15 × 5 | 15 | 10 |
© 2020 by the authors. Licensee MDPI, Basel, Switzerland. This article is an open access article distributed under the terms and conditions of the Creative Commons Attribution (CC BY) license (http://creativecommons.org/licenses/by/4.0/).
Share and Cite
El Safty, H.; Marsooli, R. Ship Wakes and Their Potential Impacts on Salt Marshes in Jamaica Bay, New York. J. Mar. Sci. Eng. 2020, 8, 325. https://doi.org/10.3390/jmse8050325
El Safty H, Marsooli R. Ship Wakes and Their Potential Impacts on Salt Marshes in Jamaica Bay, New York. Journal of Marine Science and Engineering. 2020; 8(5):325. https://doi.org/10.3390/jmse8050325
Chicago/Turabian StyleEl Safty, Hoda, and Reza Marsooli. 2020. "Ship Wakes and Their Potential Impacts on Salt Marshes in Jamaica Bay, New York" Journal of Marine Science and Engineering 8, no. 5: 325. https://doi.org/10.3390/jmse8050325
APA StyleEl Safty, H., & Marsooli, R. (2020). Ship Wakes and Their Potential Impacts on Salt Marshes in Jamaica Bay, New York. Journal of Marine Science and Engineering, 8(5), 325. https://doi.org/10.3390/jmse8050325