Article

A UAV-Based Dye-Tracking Technique to Measure Surface Velocities over Tidal Channels and Salt Marshes

1
Department of Civil and Coastal Engineering, University of Florida, Gainesville, FL 32611, USA
2
Department of Civil and Environmental Engineering, University of Parma, 43121 Parma, Italy
*
Author to whom correspondence should be addressed.
J. Mar. Sci. Eng. 2020, 8(5), 364; https://doi.org/10.3390/jmse8050364
Submission received: 16 April 2020 / Revised: 17 May 2020 / Accepted: 19 May 2020 / Published: 21 May 2020
(This article belongs to the Special Issue Advances in Coastal Hydrodynamics and Wetland Modeling)

Abstract

:
An accurate description of hydrodynamic processes in coastal wetlands is needed to improve their management and conservation. As a consequence, higher knowledge of the connected morphological and ecologic processes is achievable. However, it is very costly to collect spatially distributed values of flow velocities over tidal channels and intertidal areas by means of in situ sensors. Also, when deploying sensors, humans perturb the ecosystem, which takes time to recover. In this study, a new low-cost unmanned aerial vehicle (UAV)-based method to measure surface velocities is proposed and validated. The study area is a salt marsh system on the southeast coast of Little Sapelo Island, Georgia, USA. Two unmanned aerial vehicles were used in the survey. A first UAV released a fluorescent dye tracer on marshes and tidal creeks, while a second one tracked its movement by collecting RGB images. Flow direction and magnitude were calculated from the images using a newly developed algorithm. A comparison with velocities measured with an acoustic Doppler current profiler confirmed the effectiveness of the method. Our results indicate that the calculated flow field is affected by vegetation, marsh morphology, and marsh width. In particular, a non-negligible velocity component perpendicular to the creek axes is detected both in ebb and in flood. Our technique proves to be an effective, non-intrusive, low-cost way to survey the two-dimensional hydrodynamics on salt marsh environments at a km scale. Collected data would be beneficial for calibrating and validating numerical models with accurate water flux information.

1. Introduction

Salt marshes are a crucial environment for ecological, anthropologic, and economic reasons. They buffer shorelines from storms, sequester carbon, improve water quality, and provide habitat for commercial fisheries [1,2,3]. Salt marshes are transitional landforms placed between terrestrial and aquatic systems, and they are regularly flooded when the tidal level is higher than the marsh elevation [4]. Hydrodynamic forcings promote the growth of tidal creeks, which develop a complex tidal network. The morphological evolution of creeks and marshes is strongly non-linear and is tightly coupled with ecological processes. Marshes are populated by various species of non-woody halophytes [5]. Plant distribution depends on marsh topography, hydroperiod, distance from the creeks, and availability of nutrients [5,6]. Vegetation plays an essential role in marsh conservation: it mitigates the effect of meteorological forcing, such as hurricanes and storms, regulates the rate of organic and inorganic deposition, modulates hydrodynamic processes in the marshes, such as flood events [7,8,9], and reduces nitrogen concentration in water [10]. The water exchange between the creeks and the marshes dictates the fate of organic and inorganic sediments, as well as nutrients.
Several models have been proposed to simulate marsh evolution [9]. In particular, they focus on: simulating sediment fluxes on the marsh platform [11,12], modeling marsh boundary evolution [13,14], describing salt marsh channel initiation and development [15], and coupling vegetation and sedimentary processes in the marshes [14]. Models have also been developed to study the effect of sea-level rise (SLR) on salt marsh resilience [14,16,17,18]. Meager variations in salt marsh elevation modify the tidal prism, i.e., the volume of water exchanged with the tidal channels, thus leading to strong variations in the hydrodynamics. Although numerical models exist to solve for these processes, there is a lack of spatially distributed velocity data to understand how water exchanges occur between the different regions of a marsh system.
In recent decades, unmanned aerial vehicle (UAV)-based remote sensing methods have become a valid and low-cost alternative to in situ measurements and airborne technologies [19]. UAV models with a gimbal-mounted camera are now rather inexpensive and able to record high-resolution (4K) images and videos.
In situ observations of water flow velocities are usually performed using intrusive sensors, such as current meters and acoustic profilers, whose reliability has been extensively verified [20,21,22,23,24] Alternative non-intrusive technologies, such as radars [25,26] and coherent microwave systems [27], have also been used. However, the primary deficiency of these methods is the high cost in terms of instruments and survey setup. With current meters and acoustic profilers, a large amount of workforce and instruments are required to retrieve high-resolution hydrodynamic data even in a small area. On the contrary, UAV technologies allow for collecting high-resolution data over large areas, at minimal cost. Moreover, UAV-based surveys are increasingly popular since they are non-intrusive procedures that allow data collection over non-accessible or protected areas. For these reasons, UAVs have been used in the past few years for high-resolution mapping [28], agricultural [29] and shoreline surveys [27,30], estimation of vegetation biomass [31,32], and tracking of hazardous agents dispersed in water bodies [33].
UAVs have also been recently employed for measuring surface velocities by using image-based techniques, such as particle image velocimetry [34], or particle tracking velocimetry [35,36]. Several types of tracer have been used for measuring surface flow in riverine and coastal environments, such as yellow tennis balls [36], pumpkins [37] and ice dices [38], tracked by using either aerial images or fixed-camera images. UAV-based surveys are now preferred since fixed-camera images limit the extension of the area in which velocities are measured. Due to their limited dimension, solid tracers are difficult to detect at 50–100 m altitude. This makes large-scale field application to natural environments difficult or even impossible. While GPS drifters [39] do not need to be visually tracked, they have low accuracy (~1 m) and large draft (~40 cm). In addition, they are not suitable for surveying small tidal channels or shallow vegetated marshes. Solid tracers are also difficult to recover after the survey, mainly when conducted in wide areas. When not retrieved, they could become a potential danger for boats, people and animals. Moreover, if non-biodegradable, they would be a source of pollution. On the contrary, biodegradable and non-harmful chemical products, like fluorescent dyes [36,40] are less sensitive to the problems experienced by solid tracers. Moreover, fluorescent tracers have several advantages, since they require less equipment, workforce, and preparation costs. They are also more flexible in the survey planning and execution [40]. To meet unexpected requirements, survey plans can be easily expanded or altered in situ, due to the minimal preparation needed to perform the survey.
In this research, we describe a new method to measure surface flow velocity by tracking dye released over tidal channels and flooded salt marshes in Sapelo Island, Georgia, USA. To our knowledge, no work describes a technique to capture the surface velocity field at the km scale over a marsh, including its small creeks (~50–100 cm width). In particular, no study has investigated the possibility of tracking single droplets of dye released from UAVs. Our method combines the use of fluorescent dye tracer, released by a first UAV, with a new image processing algorithm, based on high-resolution images collected using a second UAV. The results have been validated using velocity data acquired by an upward-looking acoustic Doppler current profiler (ADCP) deployed at the bottom of a creek.
The algorithm proposed in this work provides spatially distributed velocities over a tidal cycle. These data can be used to calibrate and validate hydrodynamic models of marsh systems. By computing a more accurate flow field, models can better describe ecological and morphological processes, which strongly rely on the correct computation of nutrient and sediment fluxes into and out of the marsh. This in turn improves the ability of models to predict the response of salt marshes to sea level rise.
The rest of the paper is organized as follows. Section 2 provides an overview of the study site, a summary of the instruments used in the survey, and a description of the dye tracking procedure. Section 3 presents the results, with particular emphasis on the calculated velocity variation over a tidal cycle. In Section 4, we discuss the results of the proposed technique, underlying applications, as well as its advantages and limitations. Finally, in Section 5, conclusions are drawn.

2. Materials and Methods

2.1. Study Area

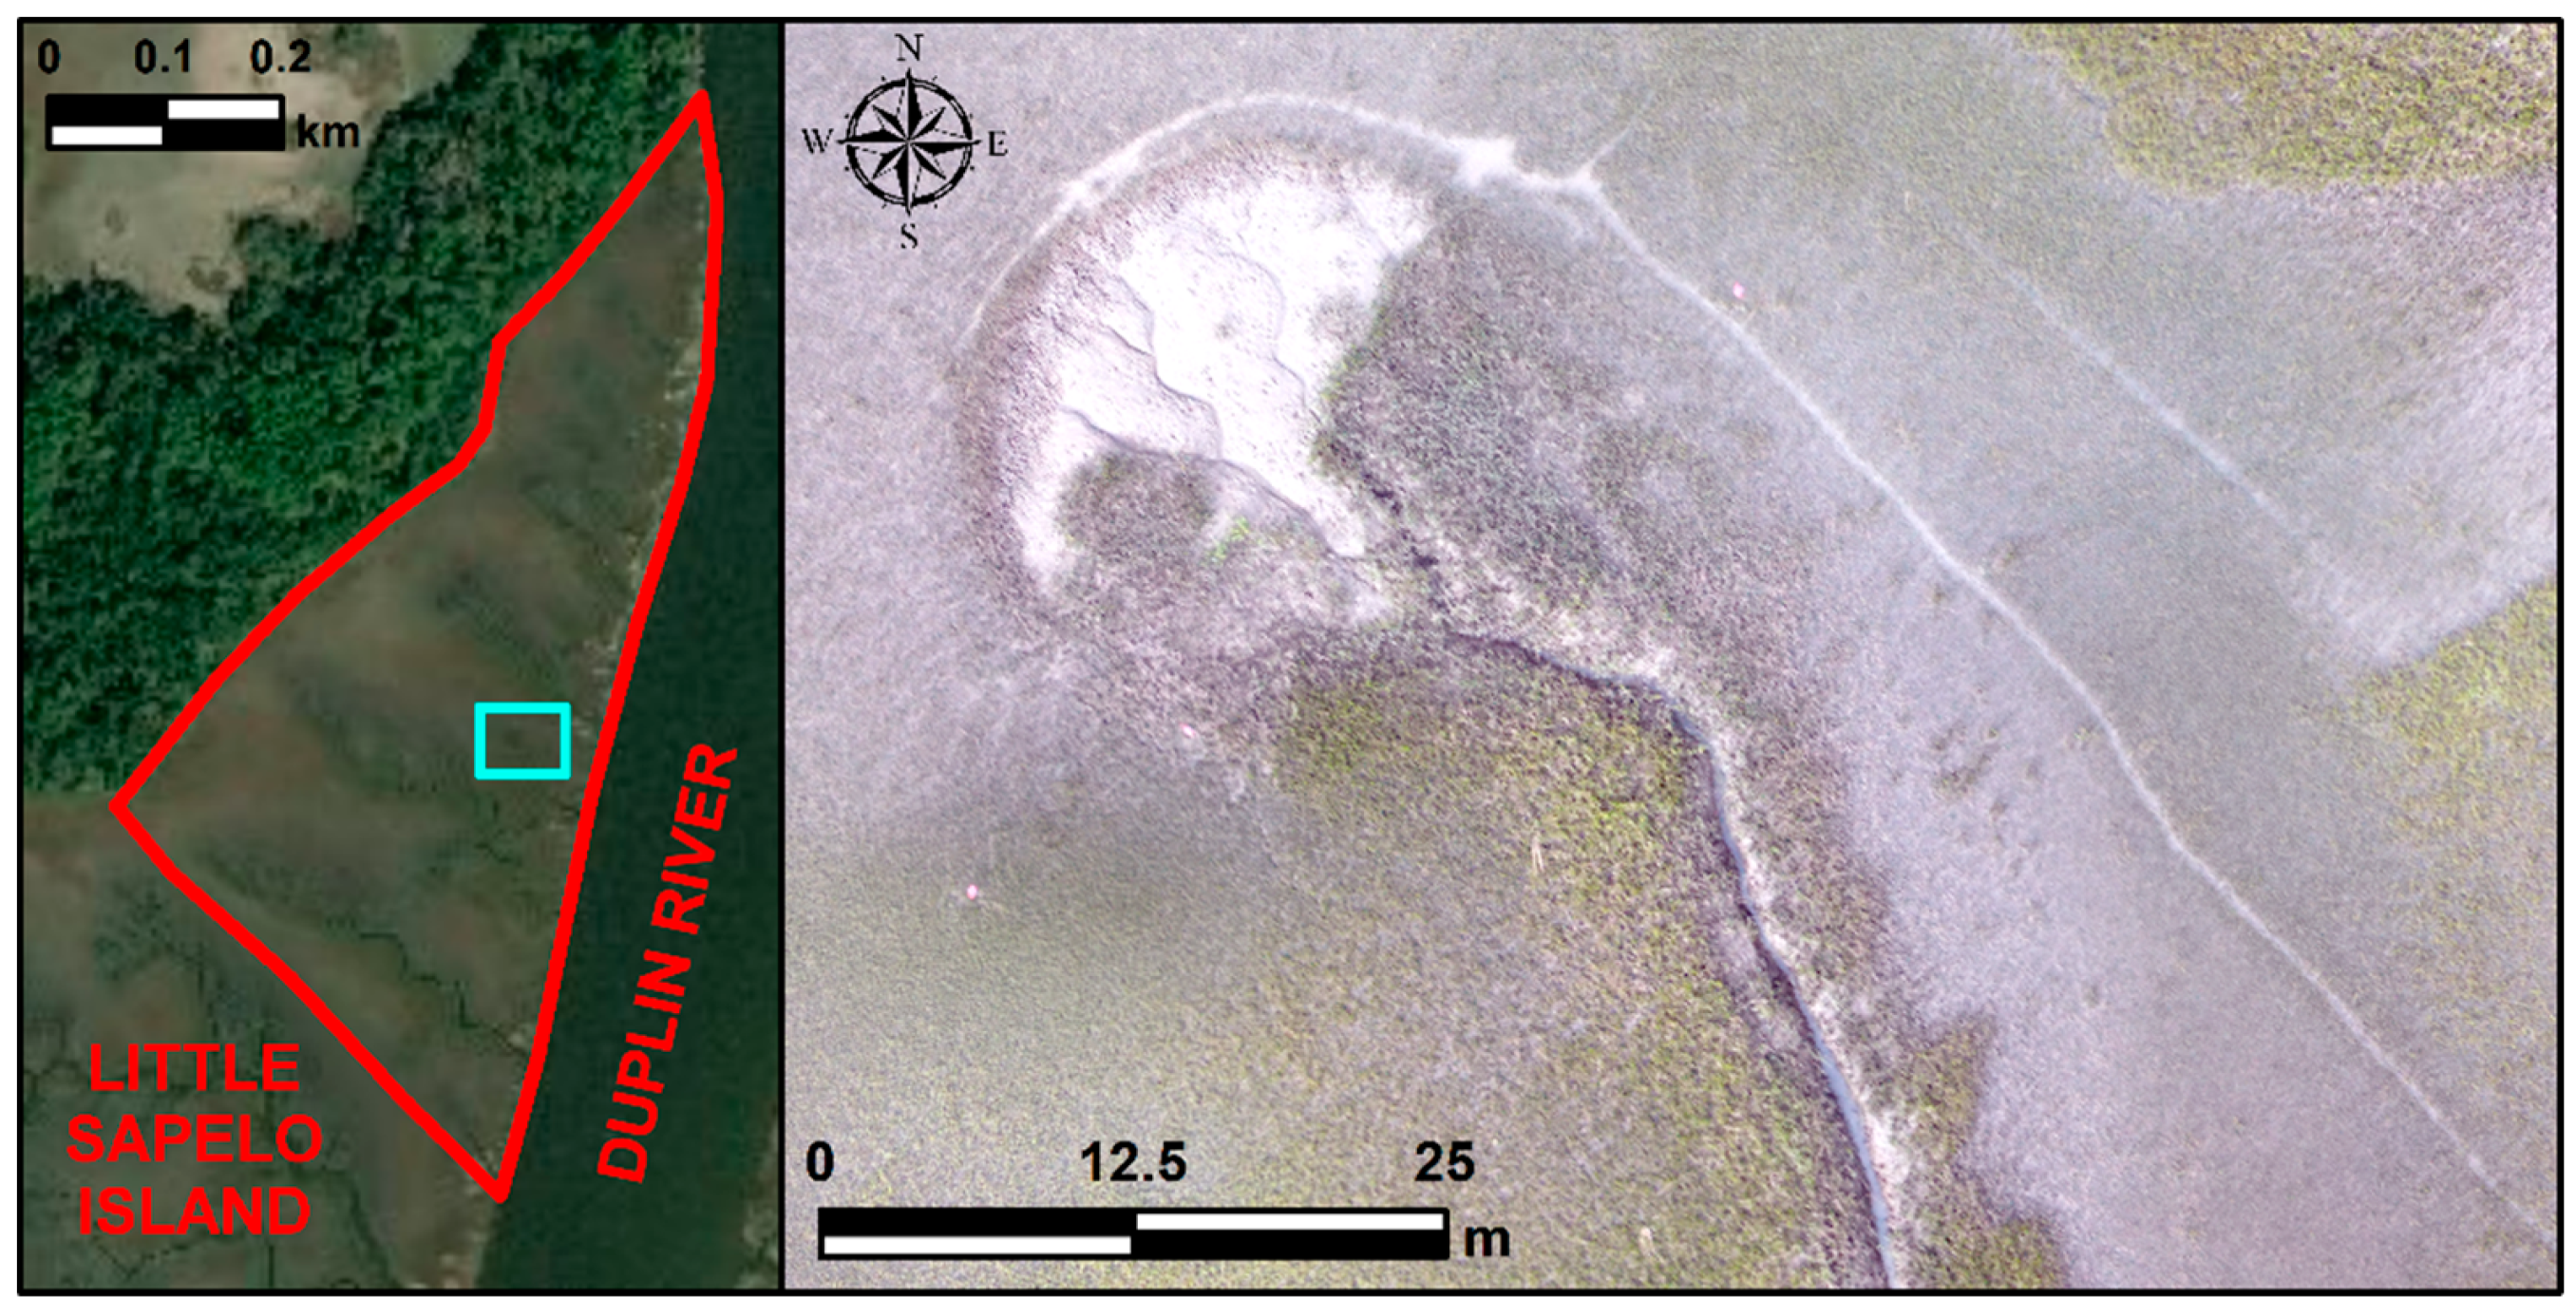
The study site consists of a 0.26 km2 portion of an estuarine salt marsh located in Little Sapelo Island, Georgia, USA, within the Georgia Coastal Ecosystem Long Term Ecological Research (GCELTER) domain and the Sapelo Island National Estuarine Research Reserve (SINERR). A 13 km long tidal channel, the Duplin River, flanks the marsh at its eastern boundary (Figure 1). The marsh system is crossed by 11 oyster-paved creeks, of different lengths and cross-sectional geometries, which run almost perpendicularly to the Duplin. The average elevation of the marsh does not exceed 0.80 m above the mean sea level (MSL) [41]. The marsh is periodically flooded by tides, characterized by a semi-diurnal oscillation with a mean high water (MHW) level of 1.009 m above MSL (NOAA tide gauge “Daymark #185, Rockdedundy River Entrance, GA” #8675761). During spring tides, the water level can reach 1.5–1.7 m, submerging the salt marsh with a water layer of almost 1 m. Cordgrass species populate the environment. Their height and density depend on marsh topography and availability of nutrient sources, which in turn depend on the distance from tidal creeks. Spartina alterniflora is the predominant macrophyte in this area [42,43]. Its stems range from 20 cm to 2 m in height. While short S. alterniflora occupies the higher marsh platform with stem heights of 0.20–0.60 m, tall Spartina fills the lower marsh and creek banks with heights up to 2 m [41]. At the north-western boundary, where ground elevation is high, impeding the flooding [44], cordgrass fields are substituted by a dense freshwater forest, higher than 20 m above the ground level (Figure 1).

2.2. Field Measurements

Field measurements (Flowchart in Figure 2, top box) were carried out on the 28th and the 29th of October 2019, in conjunction with spring tide. This period was chosen because of (i) a high tidal range, with an expected maximum water level of 1.68 m above MSL, and (ii) a low predicted wind speed, as confirmed by the measured values in Figure 3B. The large tidal range ensures a complete submersion of the salt marsh with an average 0.88 m thick water layer at high tide, and large flow velocity owing to the large tidal prism.
The UAVs used in this study consist of two DJI Phantom 4 Pro (Figure 4C–top), a low-cost (~$1500) and lightweight drone. The first drone was used to release the dye on tidal channels and marshes. A second drone collected a series of RGB images, from which we computed flow velocities by tracking the trajectories of the dye tracer. The drones carried a 20-megapixel camera mounted on a gimbal that stabilizes the camera along the three-axes. The camera has a field of view (FOV) of 84°, and a focal length of 8.8 mm/24 mm (35 mm format equivalent). An ND16 (neutral density) filter was applied to the camera to reduce the effects that sunlight reflections have on water surface and dye detection.
At low tide, both marsh and creeks dry out. Creeks begin to fill up and empty when the water level at their mouth is around the MSL. The surveys were performed separately in the marsh and in the channels to maximize the number of velocity points collected in the tortuous narrow channels. In the following, we use the term “channels” to indicate both the small tidal channels (creeks) cutting through the marsh, and the main tidal channel (Duplin River). Flight details for each day are described in Table 1 and include the starting time and surveyed area. The starting times are indicated by the dots in Figure 3, along with the tidal water level and wind speed. The average interval between two consecutive flights was set around 1 h, dictated by: (i) their variable duration from 10 to 12 min; (ii) the time spent to reach the first waypoint of the planned flight and to return at the landing point, and (iii) the time needed to swap the batteries, put in a new one, and to check the operability of the UAVs.

2.2.1. Dye Release and Image Collections

To survey surface water velocities in channels and marshes, we used a non-toxic and biodegradable tracing dye (Cole-Parmer, fluorescent yellow/green dye tracer). The dye was released in highly-concentrated drops from a Phantom 4 Pro UAV (Figure 2, data collection/field measurements). The release was performed by using an intravenous (IV) bag filled with the dye solution and attached at the side of the UAV (Figure 4C–top). The position and weight of the bag did not interfere with flight procedures and security. Higher solution concentrations decreased the rate at which single drops were released from the IV-bag. We created solutions with a concentration of dye as high as possible to maximize the visual impact of the dye cloud, but we limited the concentration just below the value for which clogging of the IV-bag discharge line would occur. By trial and error, we found that 10 ppm was the ideal concentration. Besides dye concentration, the UAV velocity also determines the spacing between the released dye clouds on the water surface. Therefore, the rate of drop release was controlled by a flow regulator placed at the end of the discharge line of the bag. A constant release rate of 1 drop every 7 m was obtained with a flow rate of 250 mL/h and a drone speed of 27km/h. A 7-m distance between clouds ensured that there was no overlapping between them due to dispersion, thus facilitating our tracking algorithm.
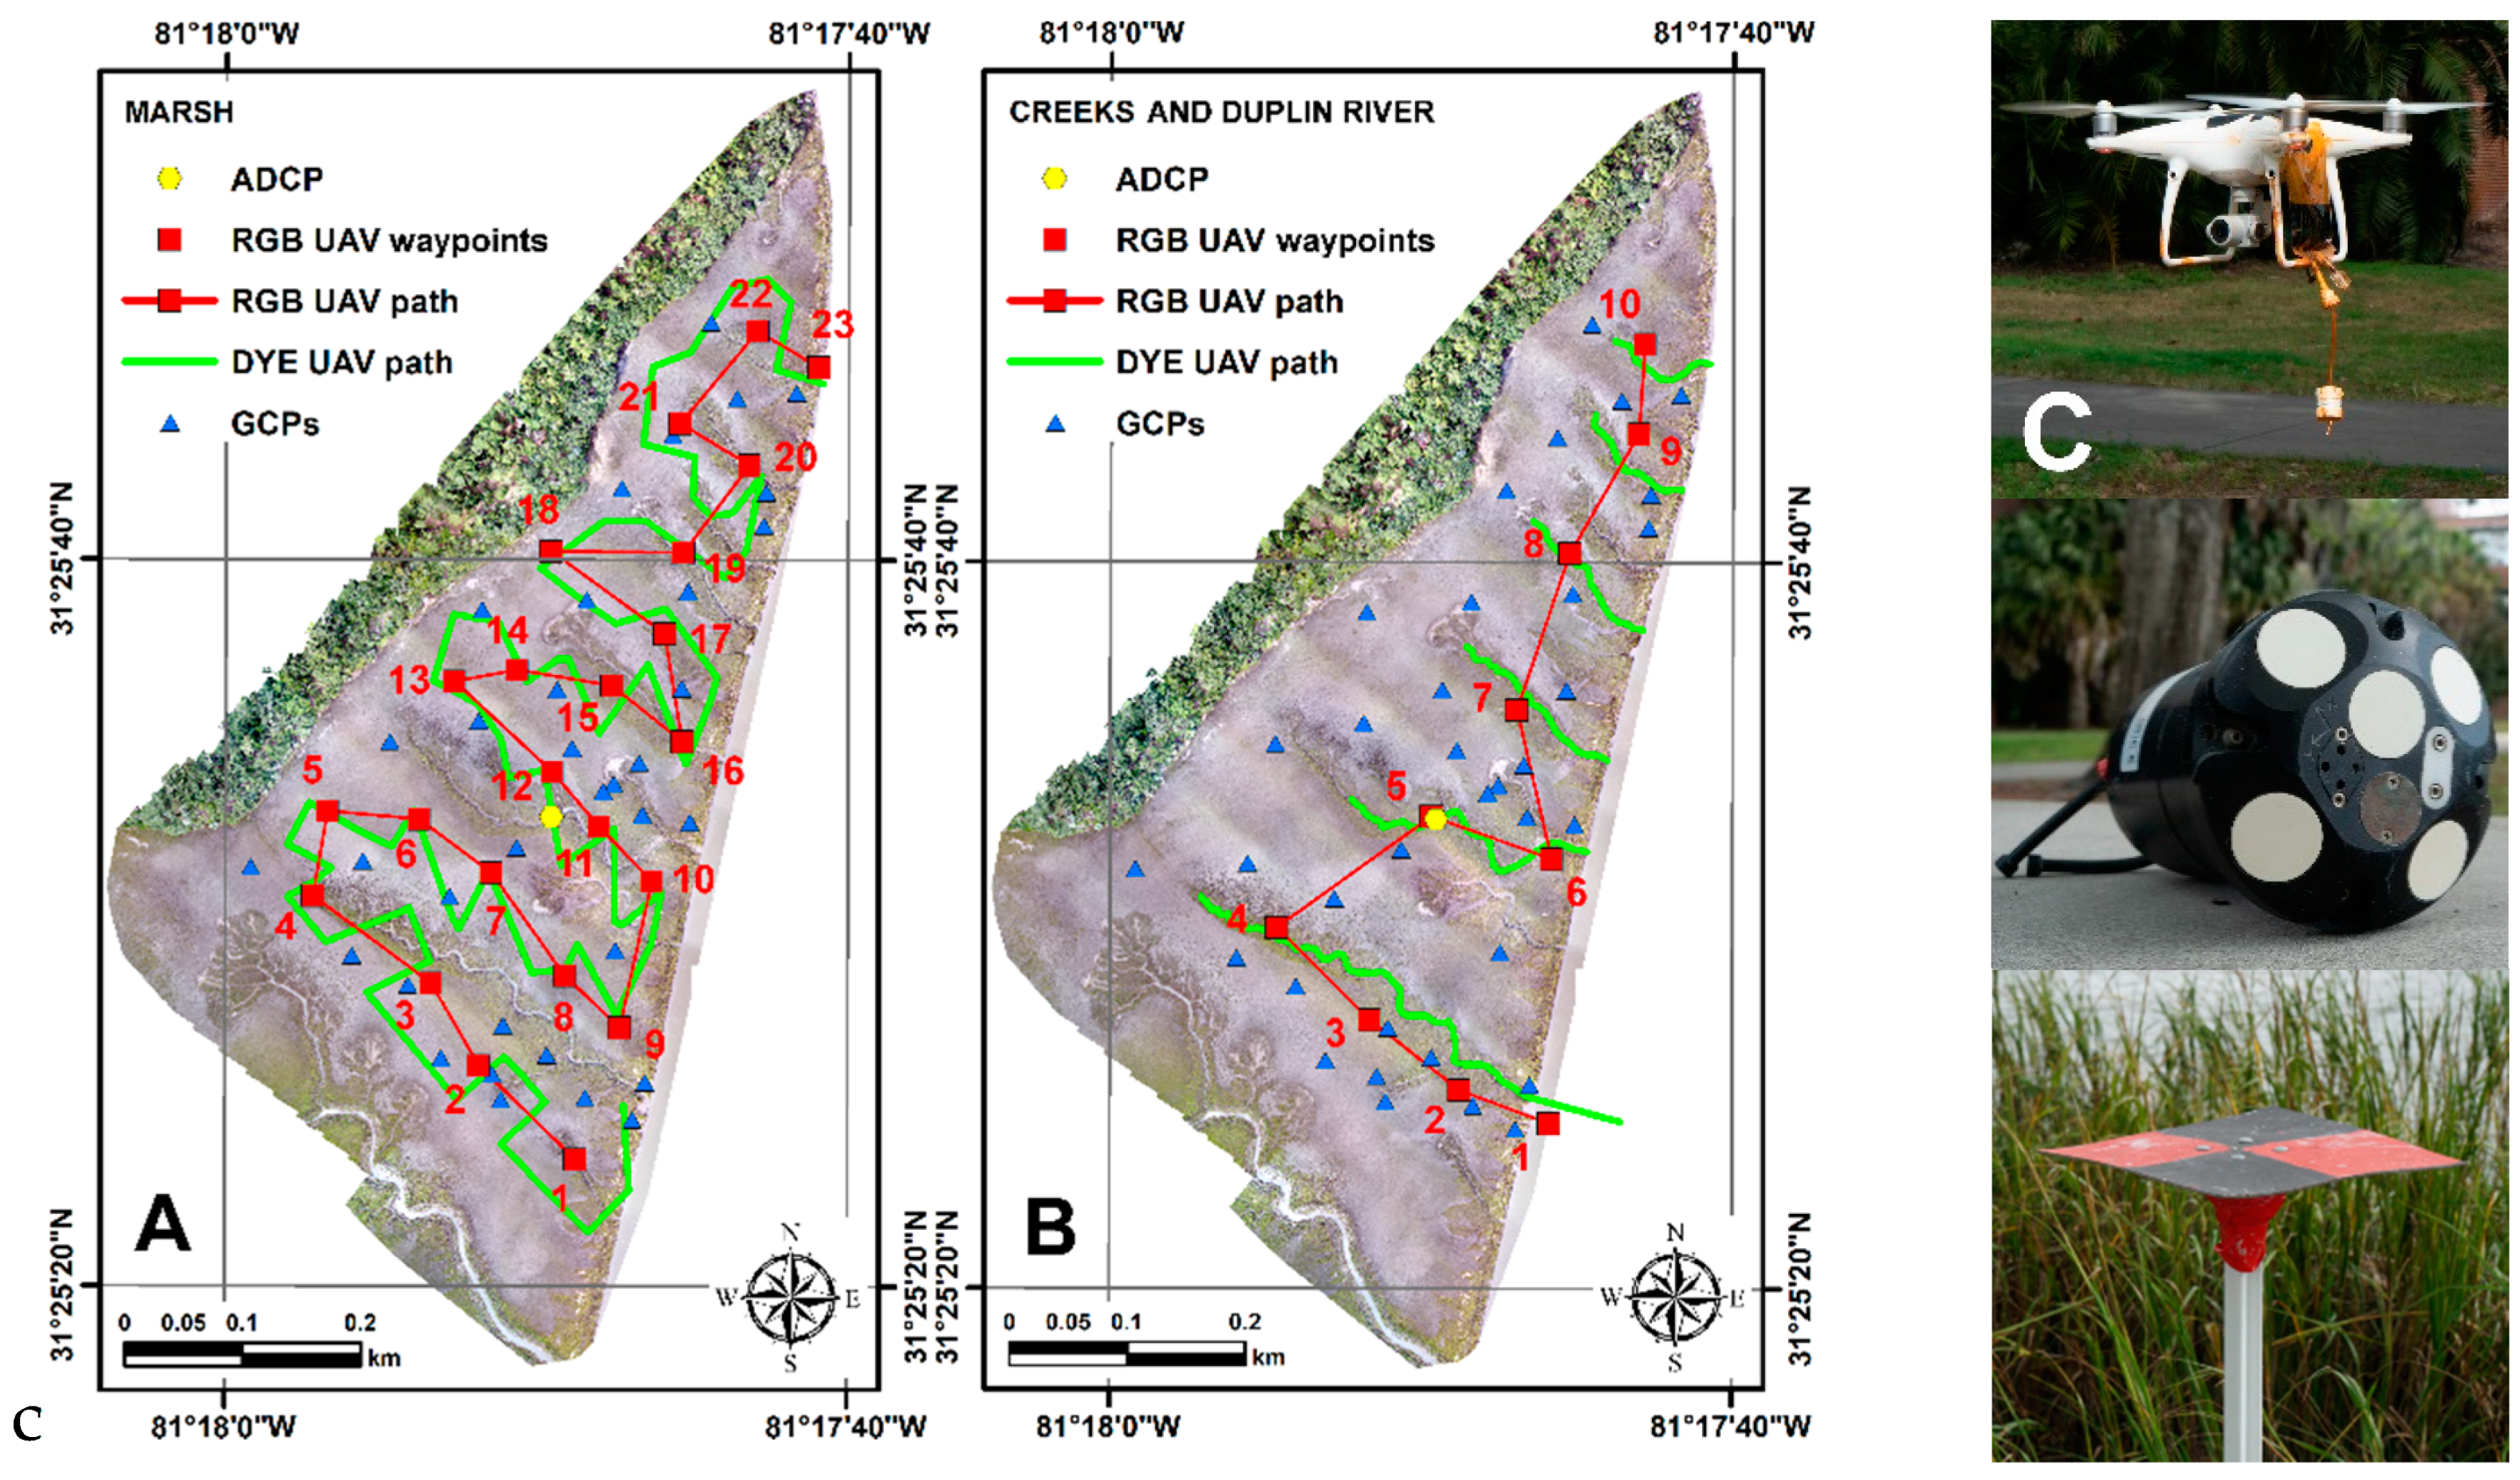
Dye release from the UAV was operated following the flight path in Figure 4A,B, respectively for the channels and the marsh. In the salt marsh, the dye was released by the UAV from an altitude of 10 m following a planned flight path, preset in the Litchi app. The cruising speed was set to 27 km/h. Due to the limited precision of the UAV GPS (~1–10 m), it was challenging to use a preset flight path to follow the tortuous creeks and release the dye within the narrow cross-section. For this reason, a manual flight was preferred to an automated one. A qualified pilot in command flew the drone over the creeks (Figure 4B) by using the drone first-person view with the camera at nadir. The flight altitude was reduced to 7.5 m, which allows releasing the dye in the narrow creek. The cruising speed was set to 6 km/h. Flight characteristics are summarized in Table 2.
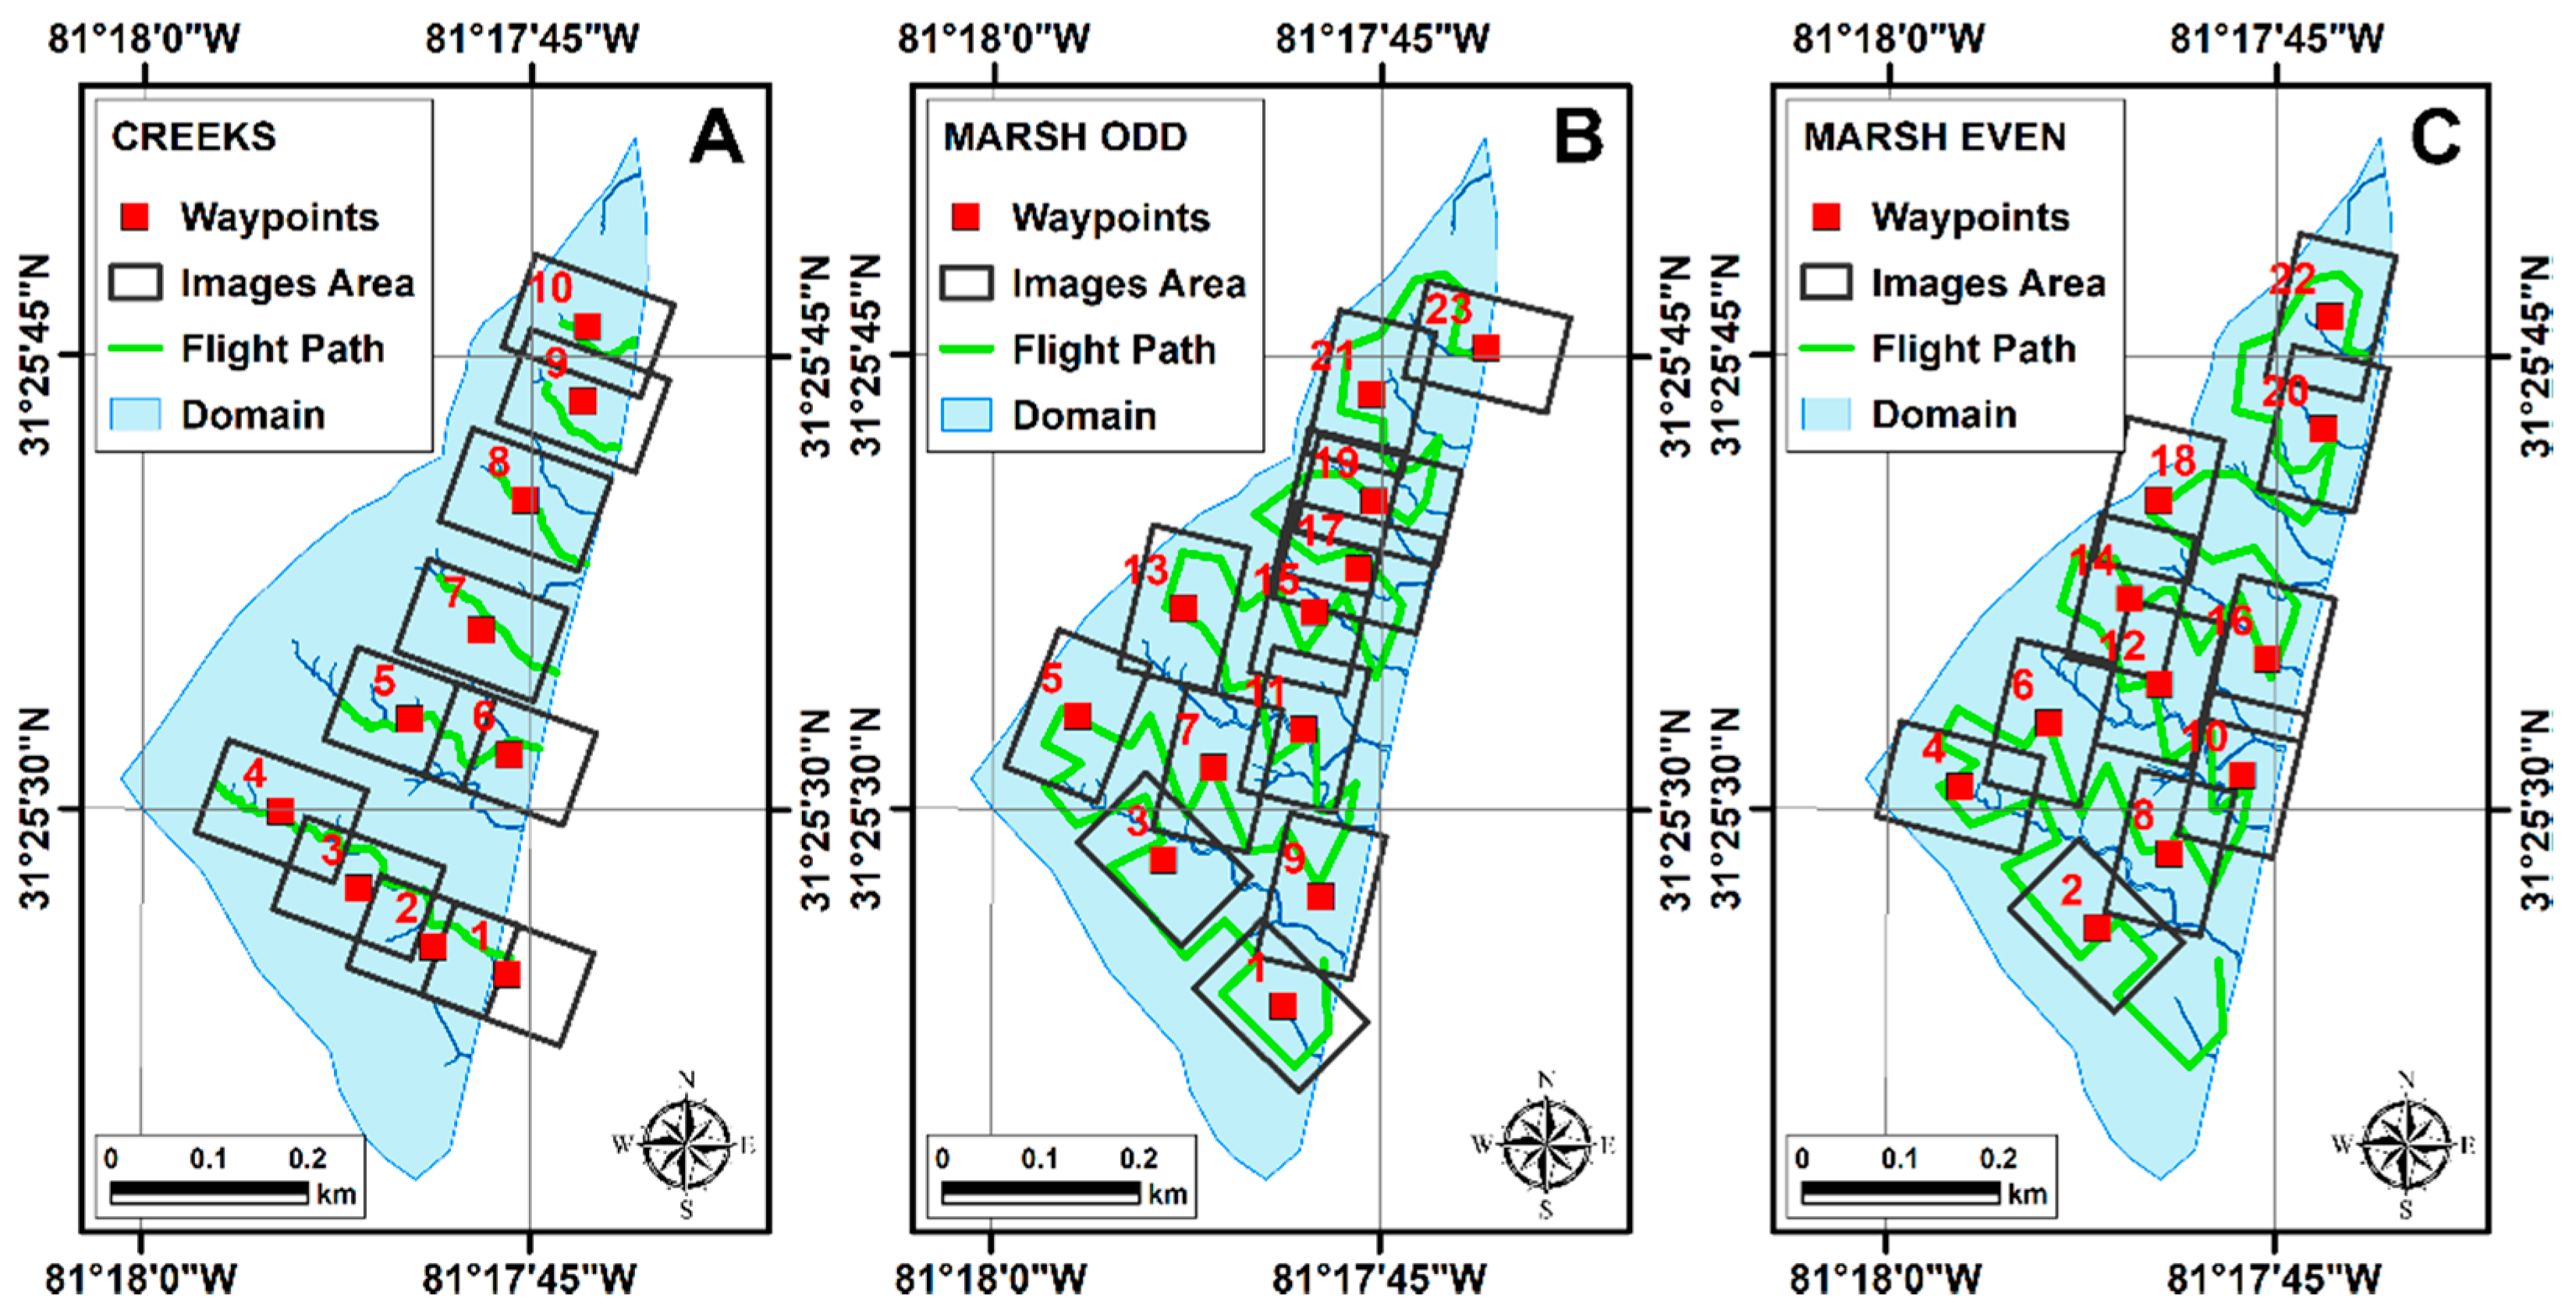
The motion of the dye was tracked using a series of RGB images collected by a second DJI Phantom 4 Pro drone (Figure 2, data collection/field measurements) flying at 105 m of altitude (Table 3). The two UAVs flew across the salt marsh, following two different flight paths in a synchronized mission. While the first UAV released the dye, the second UAV stood at each waypoint of its path (red squares in Figure 4A,B). An RGB image was taken every 2 s with the camera at nadir. The image footprints are shown in Figure 5. We alternated two missions, a “marsh mission” and a “creeks+main channel” mission (Table 2). The synchronized flight procedure was performed as follows:
(1)
The two drones started their mission and reached the first waypoint of their flight path;
(2)
Once the high-altitude drone reached its first waypoint, it started the collection of images. The low altitude drone entered the area surveyed by the high-altitude drone and released the dye over the water surface;
(3)
When the low-altitude UAV exited the area covered by the image, the high altitude UAV moved to the following waypoint.
The procedure continues until the last waypoint is reached. The RGB images were collected with a 3:2 aspect ratio, at the largest resolution (5472 × 3648 pixels). Each image has a footprint of about 175 m × 115 m, and each pixel has a dimension of 3 cm × 3 cm.

2.2.2. Ground Control Point Deployment

We positioned thirty-five ground control points (GCPs) over the marsh (Figure 2, data collection/field measurements; Figure 4A,B). At least three GCPs were visible in each image. Their geographic coordinate and vertical elevation were collected with an (Real-time kinematic) RTK-GPS (Trimble R6 GNSS ±2 cm vertical and ±1cm horizontal accuracy) (Figure 2, data collection/field measurements), thus allowing us to georectify the aerial images. The GCPs were made of a wooden 30 × 30 cm2 square target placed on a 2-m-tall steel T-post (Figure 4C–bottom). The wooden target was painted in red and black to be easily identifiable in the aerial images. GCPs were deployed at high tide from a rowing boat, thus avoiding trampling over the vegetation. The poles were inserted in the ground for half of their length, leaving the target at 1 m above the ground level. This way, the GCPs were never submerged, and they were visible even where high vegetation was present.

2.2.3. ADCP Deployment

To validate our UAV-based procedure to compute flow velocities, an upward-looking ADCP was positioned at the bottom of a tidal creek (Figure 2, data collection/field measurements; yellow dots in Figure 4A,B) at an elevation of −0.19 with respect to MSL. We used a Nortek Signature1000 (Figure 4C–middle). We recorded the vertical velocity profile with a 0.2-m bin resolution. The signature was inserted in the bed, with the beams flush with the bed surface. Therefore, the center of the first bin was located at 0.2m from the bottom, owing to a 0.1-m blanking distance. The acquisition range for the average sampling was 120seconds every 10minutes, with a sampling frequency of 4Hz. The acquisition range for the burst sampling was 10seconds every 10minutes, with a sampling frequency of 4Hz. The instrument was deployed on the 26th of October and retrieved on the 30th of October.

2.3. Data Analysis

In the following, we describe how the collected data were processed to obtain surface water velocities. The main steps were:
(1)
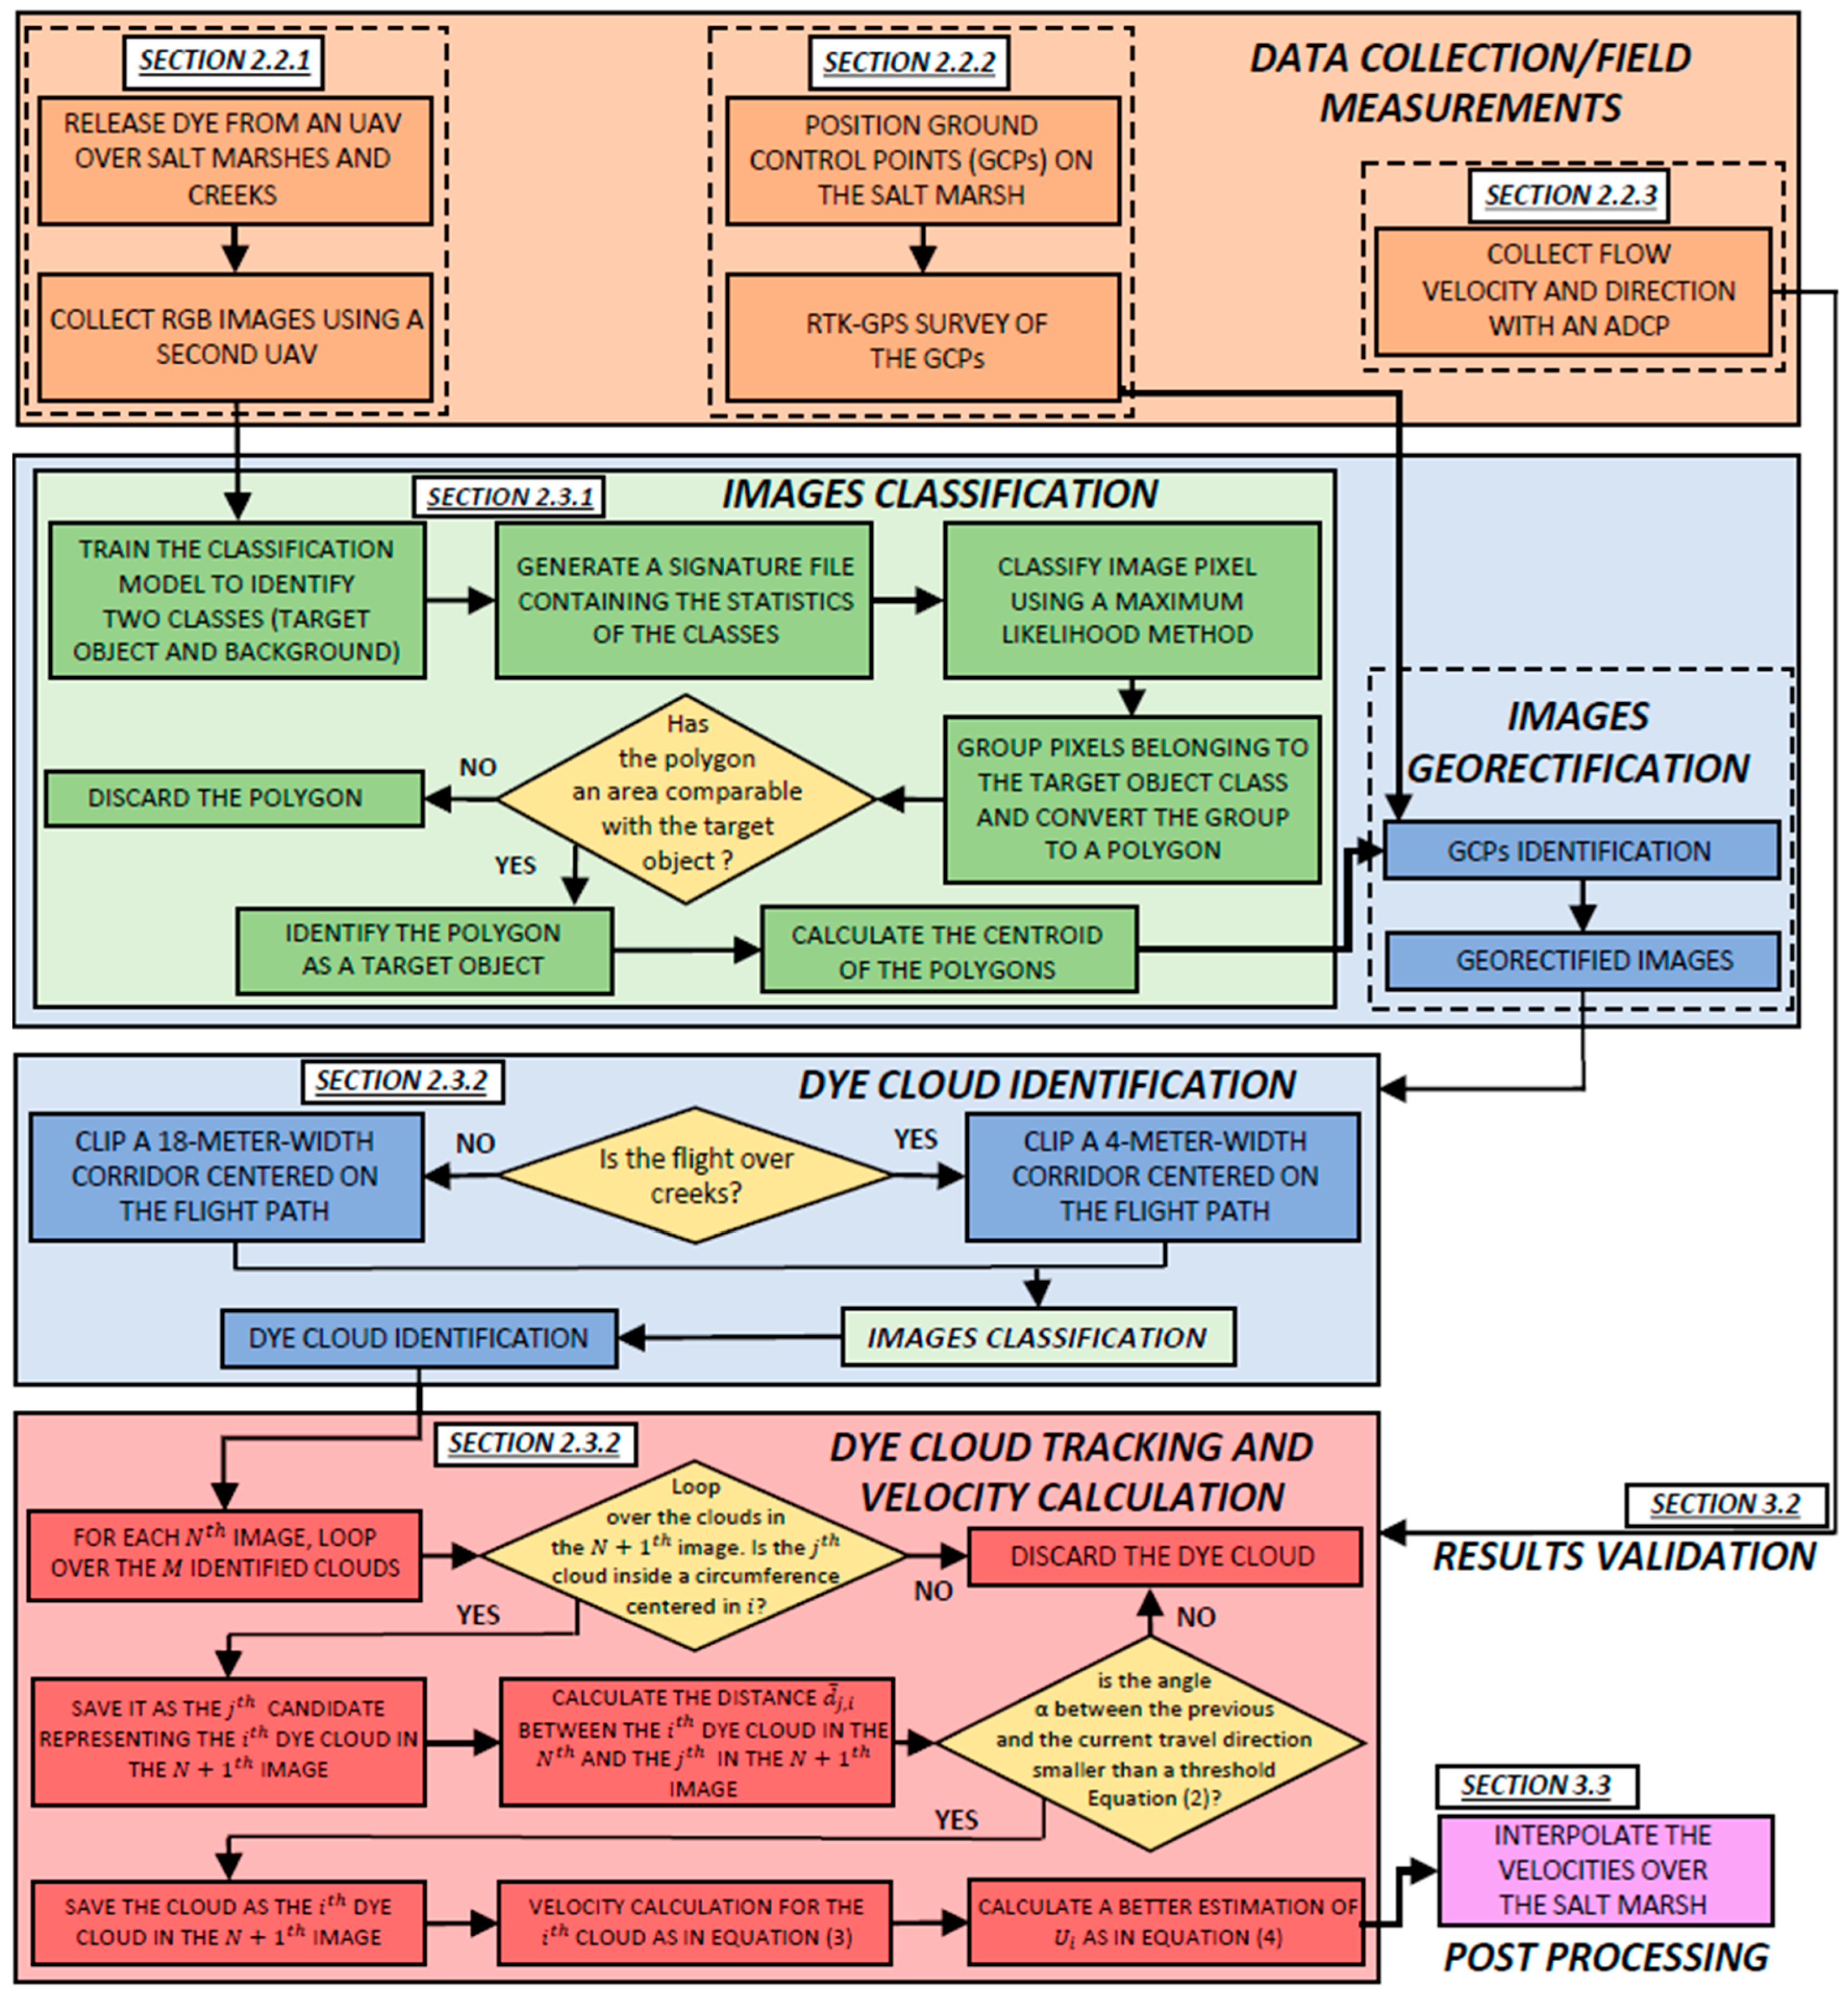
By using the GCP coordinates, aerial images were georectified and referenced to the WGS84 UTM 17N geodetic system (Figure 2, images georectification).
(2)
We implemented a supervised classification algorithm that identifies dye clouds in the images, tracks their movement between images, and outputs velocity directions and magnitudes (Figure 2, dye cloud identification).

2.3.1. Images Georectification

Raw images collected by the UAV are not referenced to a coordinate system. The images were georectified by detecting GCPs on the raster image and linking them to their known geographic locations (Figure 2, images georectification). Owing to the large number of aerial images collected (~1800), we developed an algorithm to automatically produce outputs of georectified RGB photos referenced to the WGS84 UTM 17N geodetic system. The tools used for the georectification procedure are briefly described in Table 4. We used ArcPy, a Python package that analyzes, converts, and manages geographic data. The first step of the georectification procedure consists of detecting the GCPs in the collected images. Image pixels were classified using a maximum likelihood method (MLclassify), which detects the GCPs by means of a supervised classification procedure (Figure 2, images classification). This procedure: (i) trains the model with 10 to 20 samples of each of the two known classes, GCPs versus image background, per image; (ii) creates a signature file which contains the statistics of pixel colors (RGB mean values and covariance matrix); and (iii) runs the maximum likelihood classification procedure to identify which pixels belong to each of the two classes. The final result of this classification is a binary matrix, indicating which class each pixel belongs to. The likelihood of detecting false-positive GCP pixels was reduced by clipping a 10-m radius area surrounding the RTK-GPS location of the target. The maximum likelihood classification tool calculates the probability of every pixel to belong to a specific class. The basic assumptions of the classification procedure are that the statistics for each class in each band are normally distributed. The tool considers both the variance and covariance of the class signatures when assigning each cell to one of the classes represented in the signature file. If the distribution of a class sample is normal, a class is characterized by the mean vector and the covariance matrix. Given these two statistical parameters for each cell, the statistical probability is computed for each class, and the membership of the cells to the class is determined.
The second step of the georectification consisted of assigning the coordinates to the center of the identified GCPs. To this purpose, the classified raster was first converted to a set of polygons by using the function RasterToPolygon_conversion (Table 4). Each polygon contained the ensemble of pixels belonging to the GCPs class. Since the area of each GCP was about 30 × 30 cm2, only the groups containing more than 45 pixels (an equivalent area of 20 × 20 cm2) were used in the description of the polygons, allowing the correct recognition of the GCPs in the image area. The centroids of these polygons were then computed (function AddGeometryAttributes_management, Table 4). The geographic coordinates of the GCPs, surveyed using an RTK-GPS station, were assigned to the centroid, and the georectification was performed (function WarpFromFile, Table 4).

2.3.2. Velocity Calculation from Identified Dye Clouds

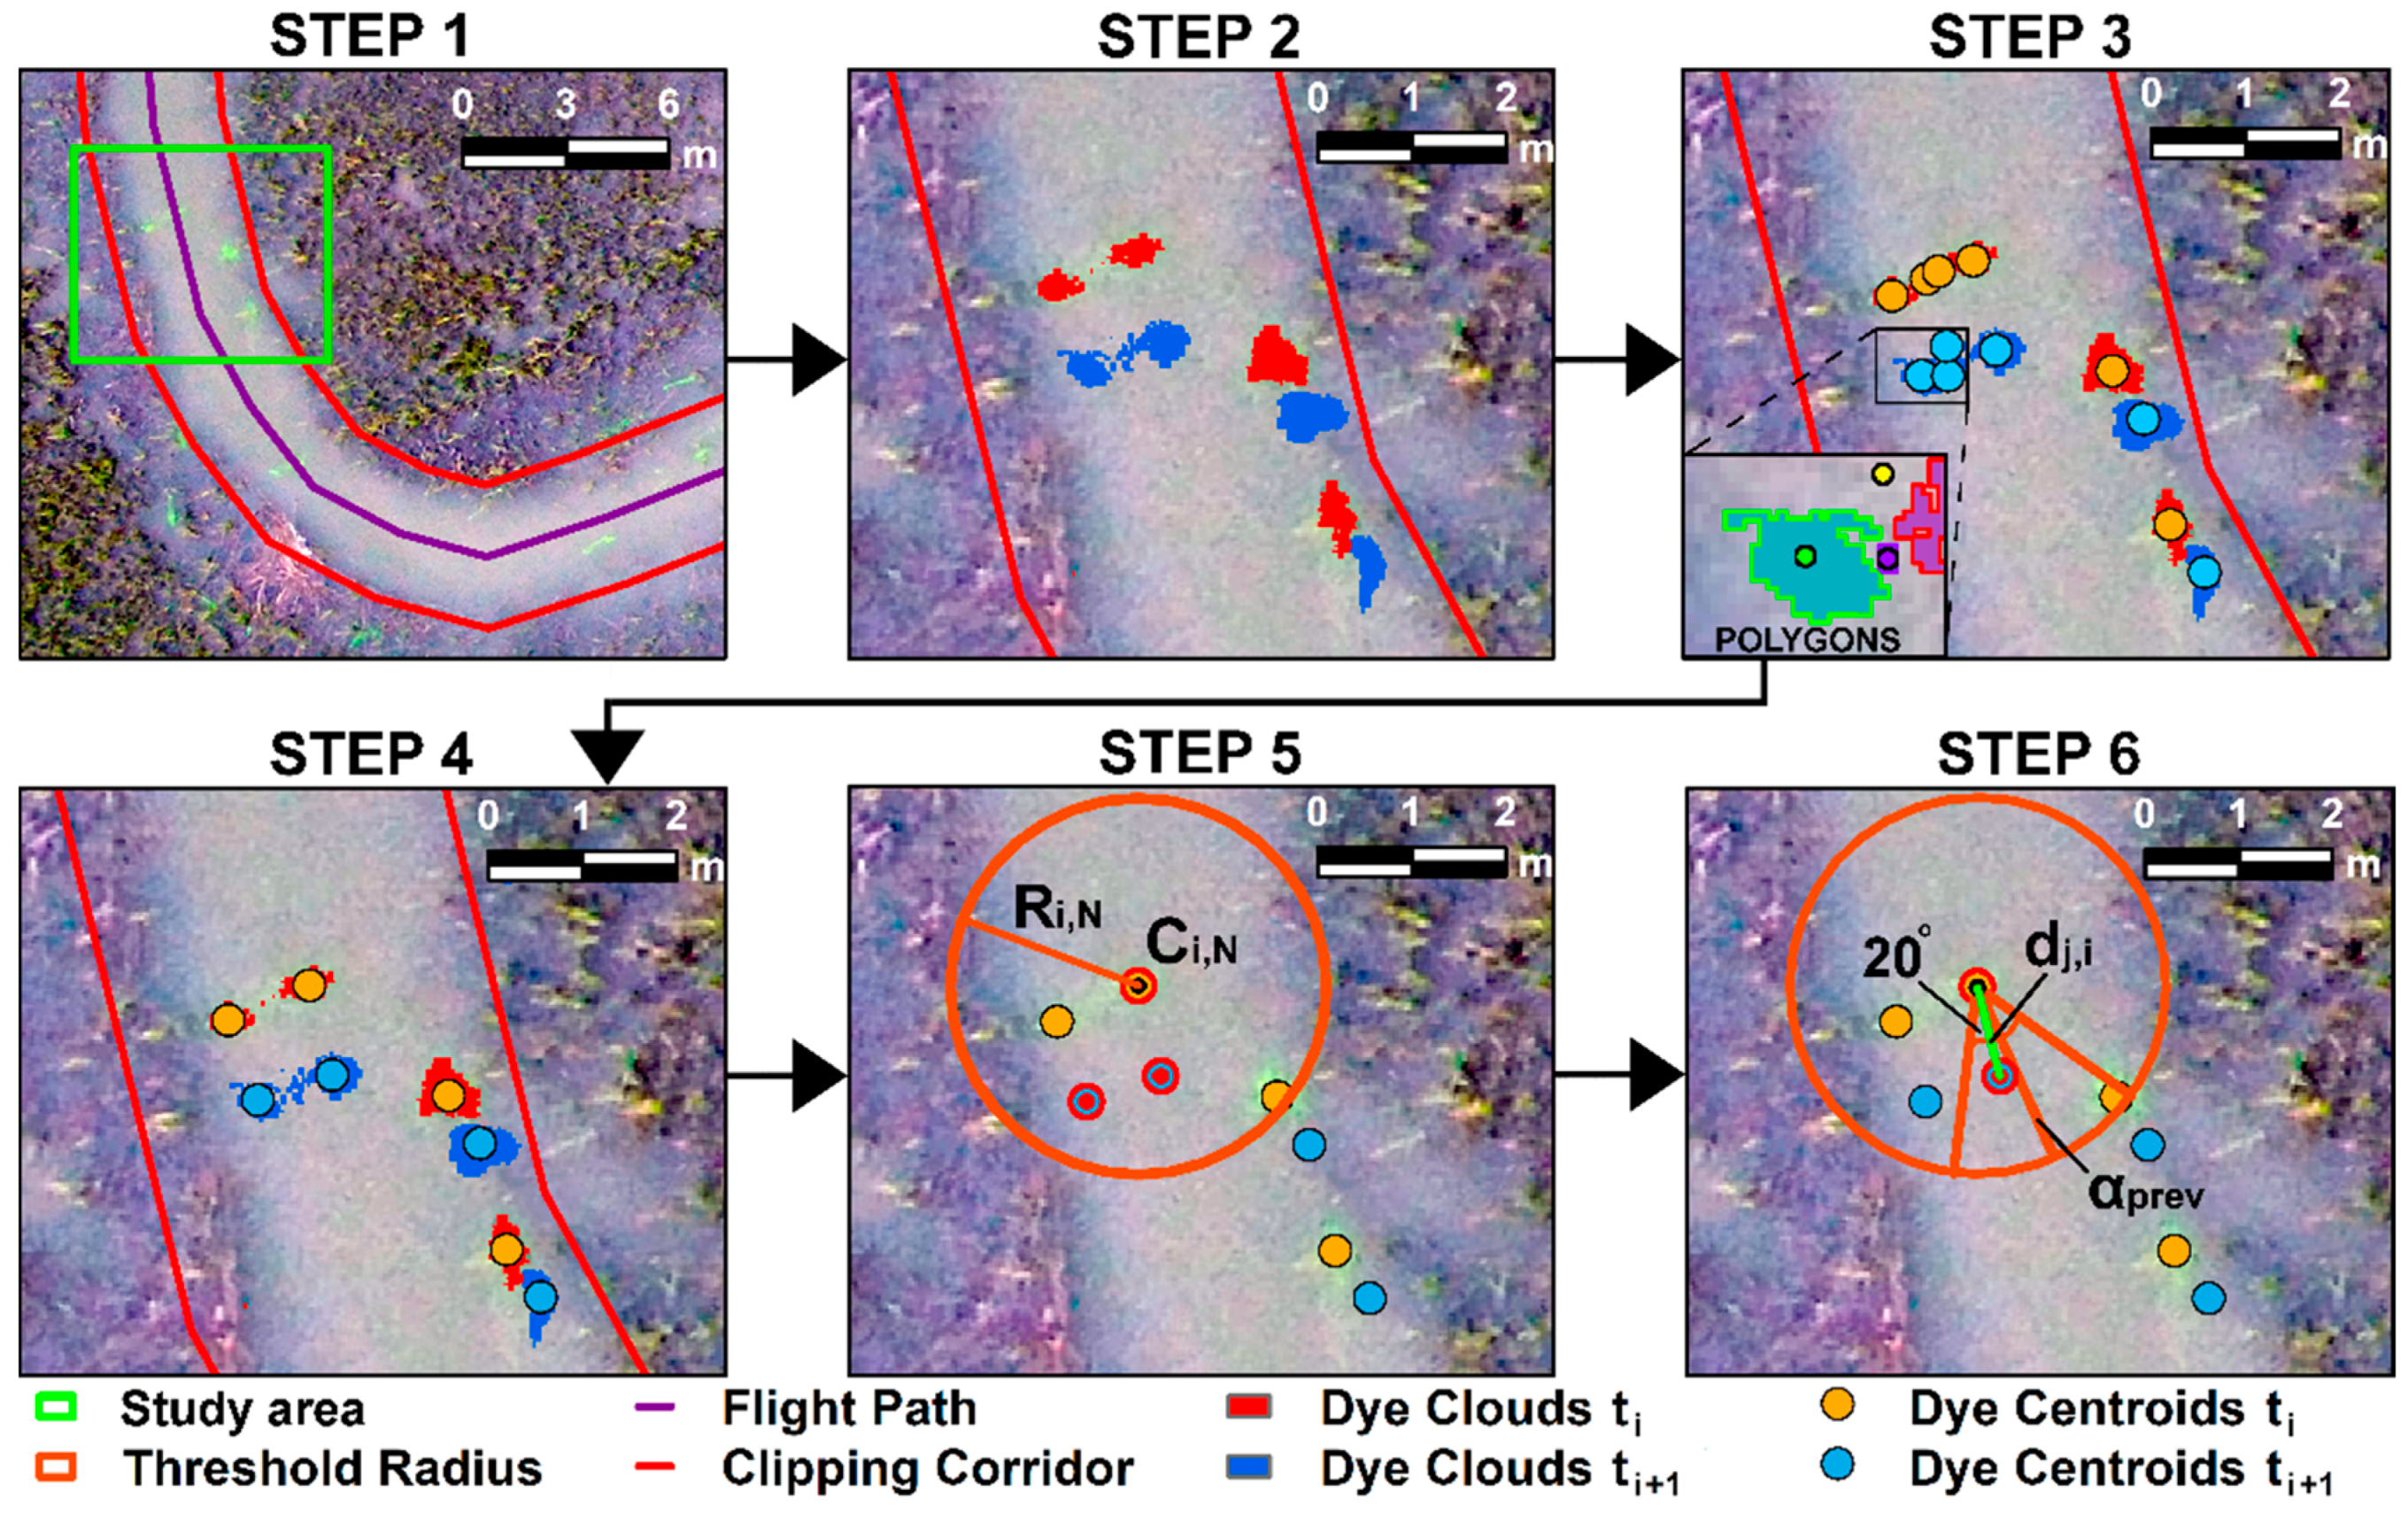
Dye clouds were identified on the georectified images by using the same supervised classification procedure described to detect the GCPs (Figure 2, images classification; Figure 2, dye cloud identification). A preliminary comparison between the RGB color distribution in dye pixels and the surrounding water showed that, in some cases, the presence of a dense and greenish underwater vegetation, with the sun rays hitting at a certain angle, could yield false positives in the classification. This would only occur on the marshes and not on the non-vegetated creeks. We therefore enhanced the performance of the algorithm by applying some filtering techniques. In the marsh, we estimated a value of 9 m for the maximum distance a dye cloud could travel while the drone is hovering at each waypoint. This value was obtained by using a reasonable maximum value of water velocity on the marshes (0.3 m/s), and by knowing that the maximum time the drone was spending at each waypoint was 30 s. The marsh flight path followed by the drone dispersing the dye (Figure 4A,B) was offset by 9 m to create an 18-m corridor which was clipped from the original image and used for dye detection. For the creeks, a 4-m corridor was clipped, which was the largest creek width in the domain. Once the position of the dye clouds is determined, the velocity vector was computed as the barycenter displacement vector between two rectified images divided by the acquisition time interval Δt. The latter is constant and equal to two seconds. In order to compute the displacement, the same dye cloud had to be identified in two successive images. To avoid possible ambiguities in cloud identification, a two-step procedure (STEP 5 and 6) was used. The procedure is reported in Figure 2, in the “dye cloud tracking and velocity calculation” step. Figure 6 shows the steps of the procedure, which were:
(1)
The corridor was identified and clipped by the image (Figure 6, STEP 1);
(2)
Dye clouds were identified in the clipped image by using the maximum likelihood classification algorithm, which created a classification matrix (Figure 5, STEP 2);
(3)
The detected clouds were converted from raster to polygons and the area and the centroid coordinates were computed for each polygon (Figure 6, STEP 3);
(4)
Since after visual inspection we noted that the characteristic size of dye clouds in the images was in the range 0.01 m to 0.30 m, we applied another filter and removed all polygons enclosing an area smaller than 0.01 m2 or larger than 1 m2 (Figure 6, STEP 4);
(5)
Given the ith dye cloud in the Nth image, and indicated with Ci,N the cloud center, we considered as possible candidates in the (N+1)th image only the clouds having their barycenter inside a circle of radius Ri,N and centered in Ci,N (Figure 6, STEP 5). The radius represents the farthest location the center of the ith cloud can travel to, over the acquisition time interval. The radius is computed as:
R i , N = U max / Δ t
where U max is an estimate of the maximum surface flow velocity. We took U max = 1 m/s, since the max velocity measured by the ADCP was 0.9 m/s;
(1)
Sometimes, multiple candidates were detected with the previous steps. To select the correct cloud, we computed for each jth candidate the angle α j , i of the displacement vector d j , i connecting the ith barycenter in the Nth image with the jth barycenter in the (N+1)th image (Figure 6, STEP 6). α j , i was measured in degrees from the East (counterclockwise). We selected the closest cloud for which | α j , i α prev | was minimum, as long as it satisfied the condition:
20 ° < α j , i α prev < 20 °
where α prev is the orientation of the previous velocity vector for the same ith cloud, i.e., computed between the (N-1)th image and the Nth image. We indicated with d ¯ j , i the selected direction. This selected the dye cloud most aligned with the previous velocity direction, since the variation in direction between images is low. For the first two images collected in each waypoint, a velocity vector was not computed yet. Therefore, we used as a first value for α prev the direction orthogonal to the Duplin, oriented in ebb or flood based on the tidal phase.
Velocities are then simply computed for the ith cloud as:
U i = d ¯ j , i / Δ t
(2)
A better estimate of Ui for N=2:Nmax-1 is computed using central differencing:
U i = ( d ¯ j , i N + d ¯ j , i N 1 ) / ( 2 Δ t )
Therefore, note that STEP 6 plays an essential role in the creeks, where the dye clouds are closer to each other, owing to the lower drone speed. On the marshes, the drone flies faster, the dye clouds are spaced farther apart, and STEP 6 was never needed since STEP 5 always unambiguously detected a unique dye cloud. The algorithm outputs are the temporal and spatial distribution of the surface water velocities calculated for the detected dye clouds.

3. Results

3.1. Survey Success Rate

Table 5 and Table 6 list, respectively for channels and marshes, the waypoints and flights for which at least a velocity vector was computed. In some cases, no velocity was obtained, and this was due to any or a combination of the following reasons: (i) wrong tuning of the IV flow regulator; (ii) loosening of the IV-bag attachment, which caused vibrations and hampered dye release; (iii) use of low ND filters during sunny hours, when there was a strong reflection of sun rays on the water surface; (iv) early return to the home point of the drones after low battery notification. The largest number of velocity vectors was obtained on the 29th for the channels and 28th for the marshes (Table 5 and Table 6).

3.2. Validation of Our Algorithm with ADCP Velocities

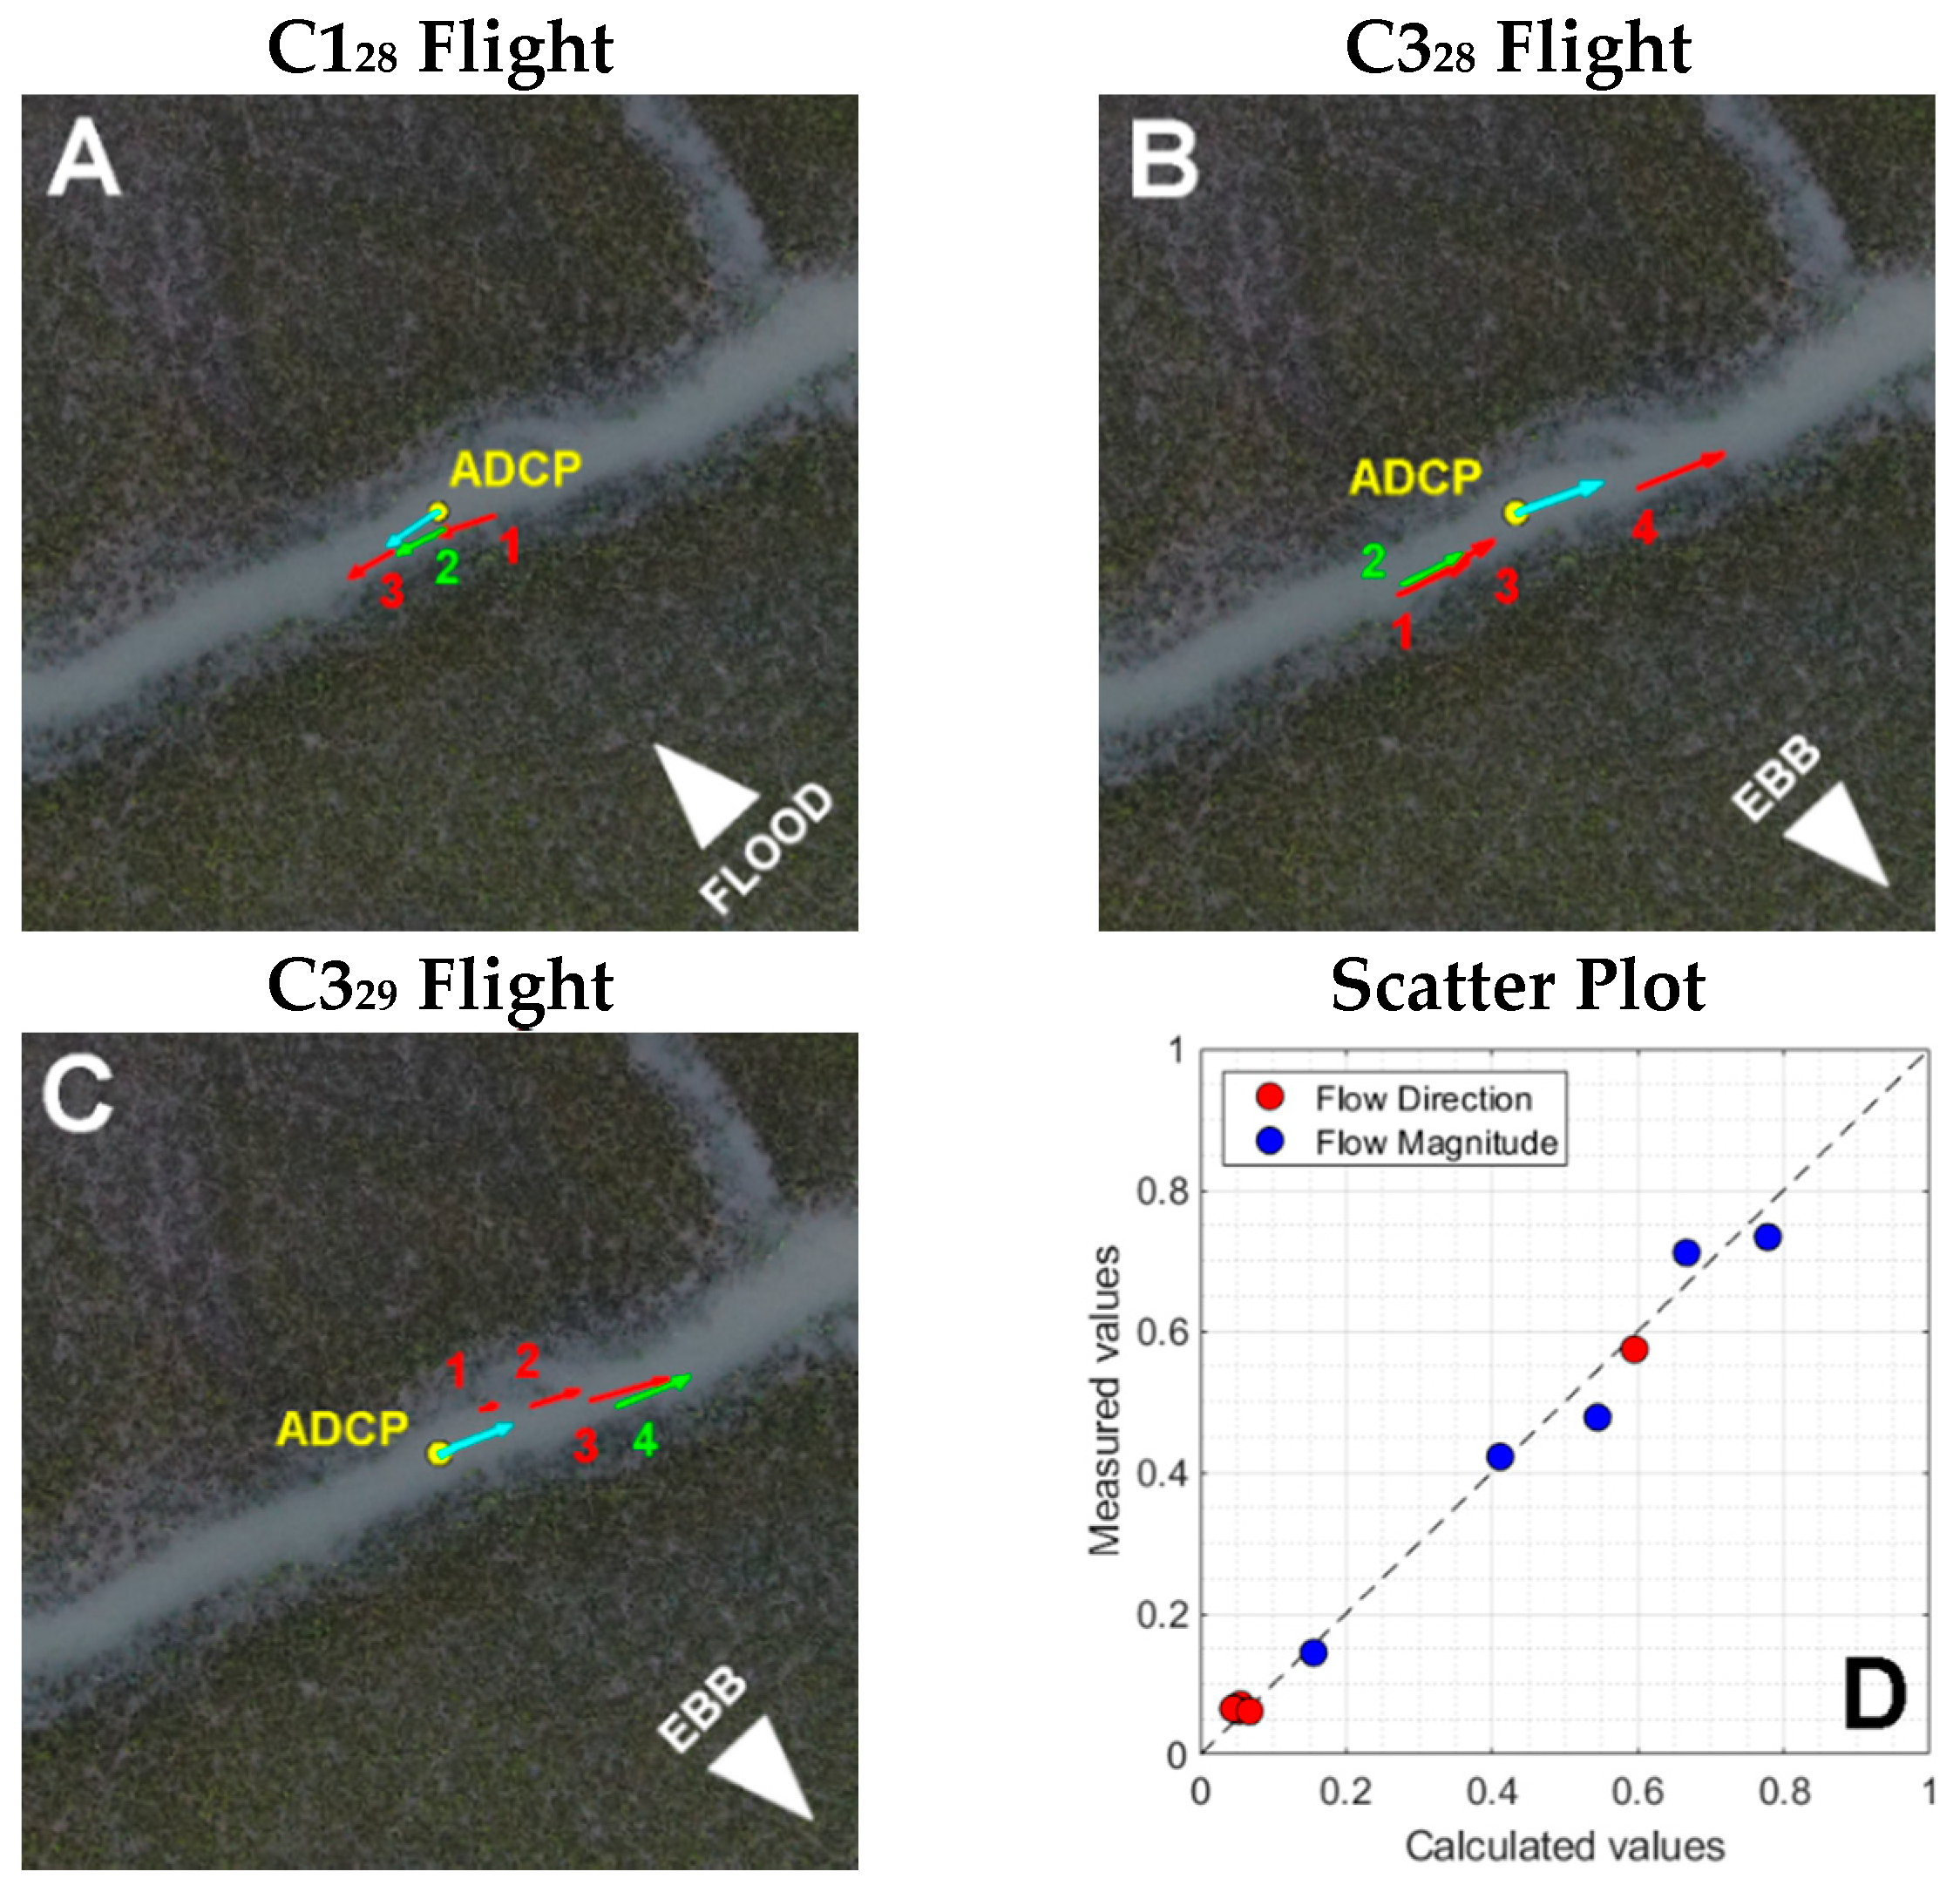
Surface velocities computed with our tracking algorithm (“dye velocities”) were compared with the velocities measured using an upward-looking ADCP (“ADCP velocities”) (Figure 2, results validation). The images captured at the creek waypoint5 and at the marsh waypoint 12 contain the ADCP location (Figure 4A,B, yellow dot). For the creek waypoint5, dye velocities were calculated for the first and last flight on October 28th and for the last flight on October 29th. For the marsh waypoint 12, dye velocities were calculated for the last flight on October 28th and 29th (Table 5). For each flight, dye and ADCP velocities, both magnitude and direction, are listed in Table 7. Only the velocities calculated for the creek waypoint 5 are shown, as an example, in Figure 7. Figure 7D shows that the agreement between dye and ADCP velocities is better for the flow magnitude than for the direction. Note that, due to the limited precision of the onboard GPS, it was difficult to release the dye exactly where the ADCP was located. Therefore, in our comparison, dye and the ADCP velocities are not in the exact locations (Figure 7). Nonetheless, we have a good agreement between the velocities, which validates the proposed method. The relative error in the velocity magnitude does not exceed 13.9%. The calculated mean relative error (MRE) is 7.31%, and the mean absolute error (MAE) is 0.032 m/s. For the direction, the error does not exceed 7.5°, and the MAE is 5.22°.

3.3. Velocity Vectors

Each of the 12 flights performed during the two days of fieldwork took about 12 min, and owing to the slow time variation of the tidal flow field, we assume that the flow is stationary over the duration of each flight. Therefore, hereinafter the velocity vectors are plotted on the same aerial view for each flight, and we consider the central time of the flight as the time at which the flow field was surveyed.
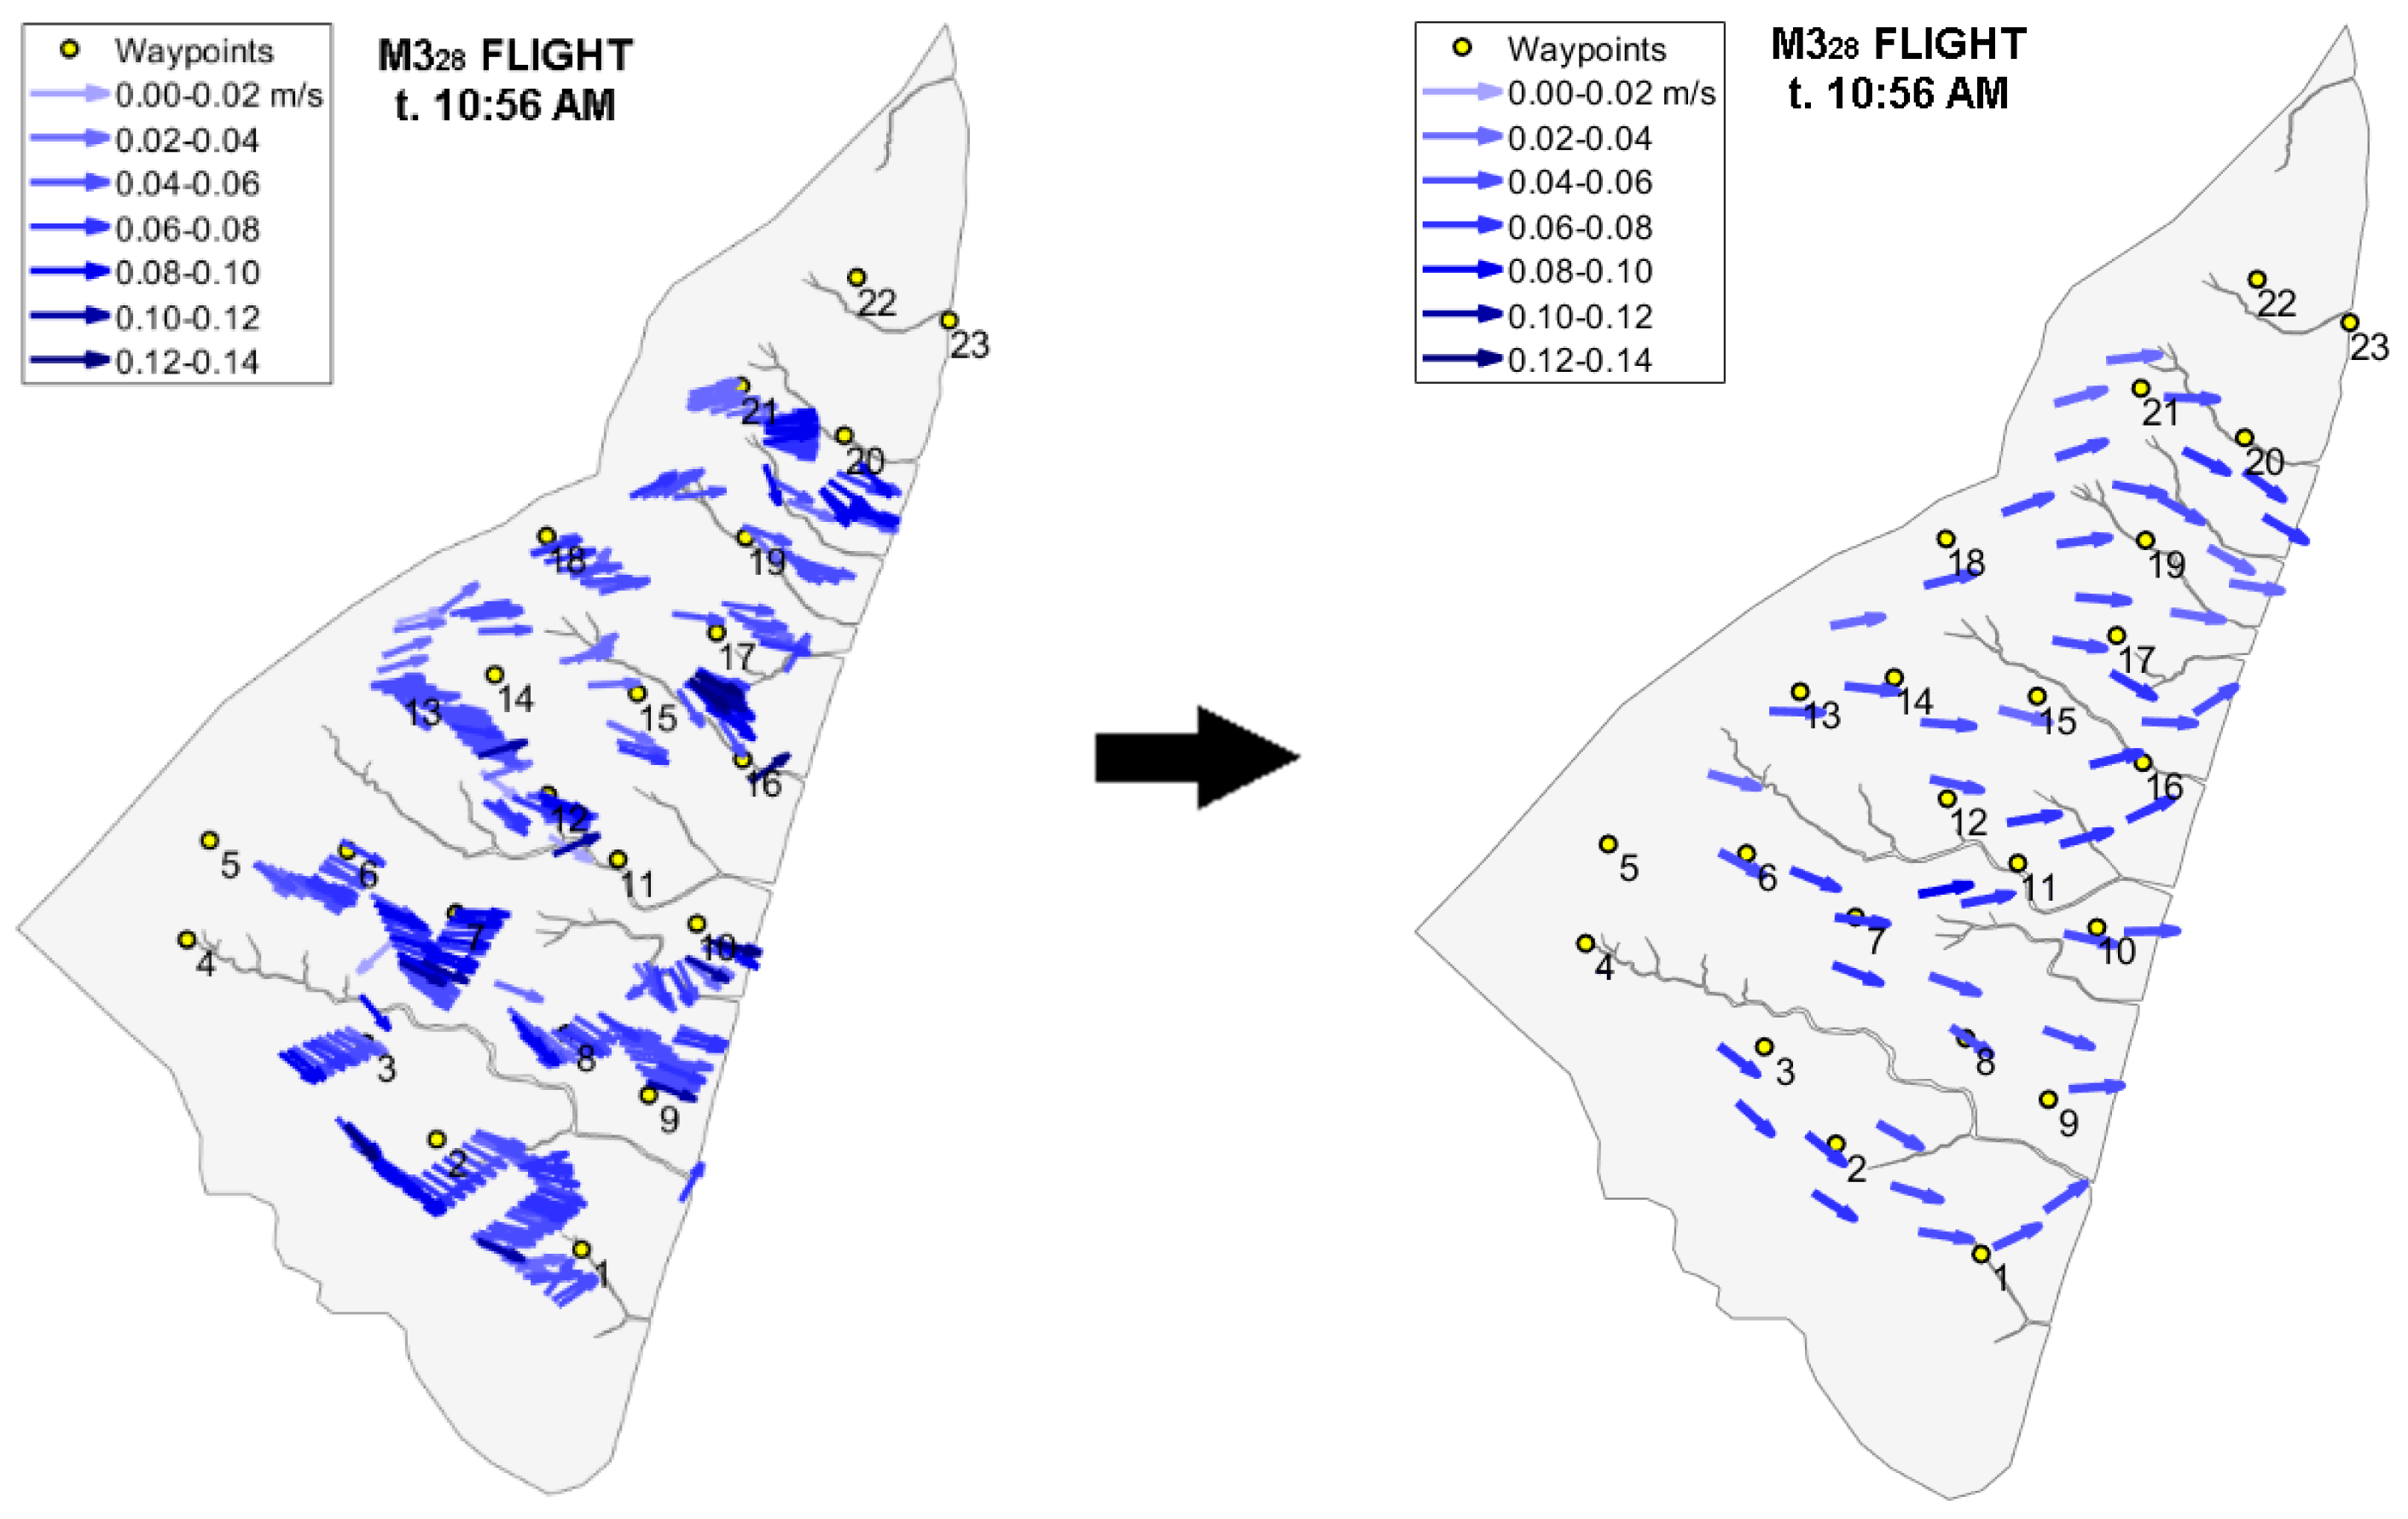
For each flight surveying the marshes (M28 and M29), the surface velocity field over the marsh was calculated interpolating the surface velocities obtained as output of the image detection algorithm (Figure 2, post processing; visual description in Figure 8). Our algorithm produces several scattered velocities which can overlap, and for better visualization purposes we interpolate them on a uniform triangulation of ~60 m, a resolution that is high enough to describe spatial gradients in velocities. The steps of the procedure are the following:
(1)
Once the lateral boundary of the creeks was identified, we estimated a 5-m lateral area where the influence of the channels on the surface water velocity is not negligible.
(2)
Velocities calculated for the flights surveying the marsh, using the dye detection algorithm, were filtered. We observed that the influence of the creeks on the surface velocity magnitude and direction became negligible after 5 m from their borders. Therefore, the velocities calculated in the 5-m area adjacent to the creeks were excluded from the interpolation procedure;
(3)
Velocities calculated using the image detection algorithm where interpolated first to uniform grid with cell size equal to 5 m, by using the MATLAB function Meshgrid. Meshgrid linearly interpolates scattered data using a Delaunay triangulation of the data.
(4)
The marsh platform was divided using a triangular grid, with a ~60-m resolution, excluding the creeks and the 5-m adjacent area; velocities in the triangular grid are linearly interpolated from the nodes of the uniform grid, obtaining the average surface velocity field over the marsh (Figure 8).

3.3.1. Computed Flow Field over the Channels and the Marsh

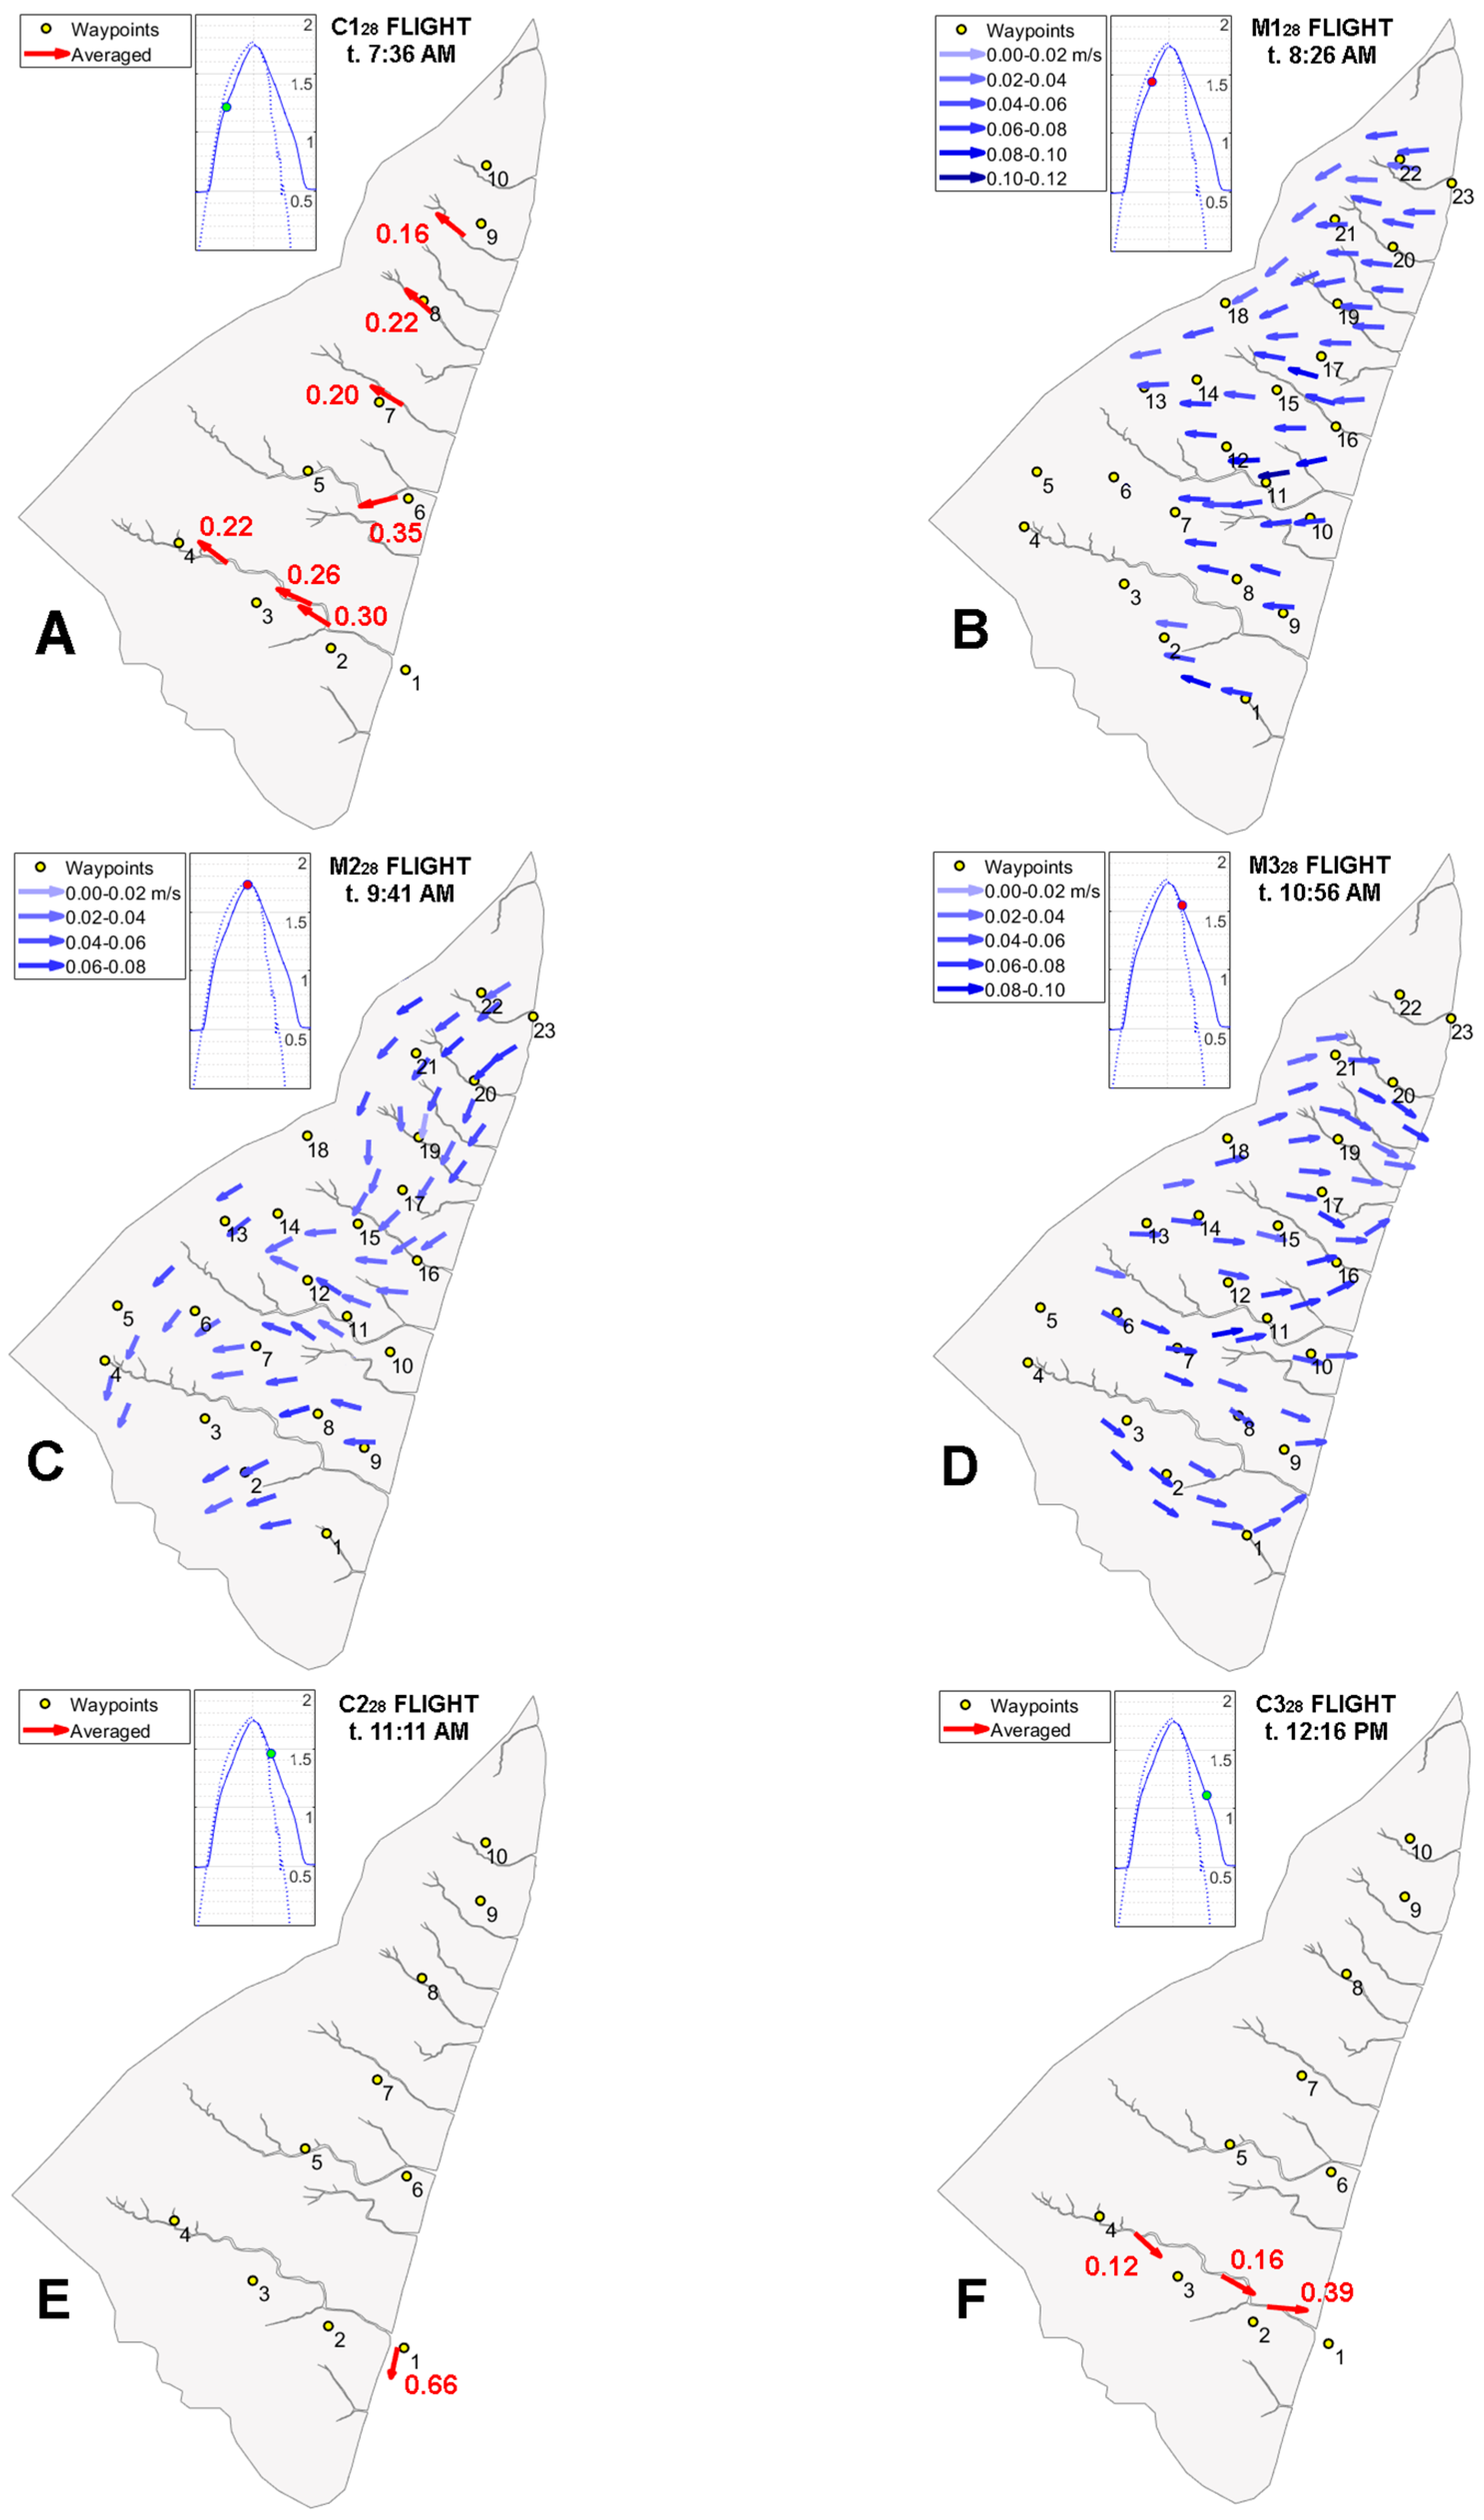
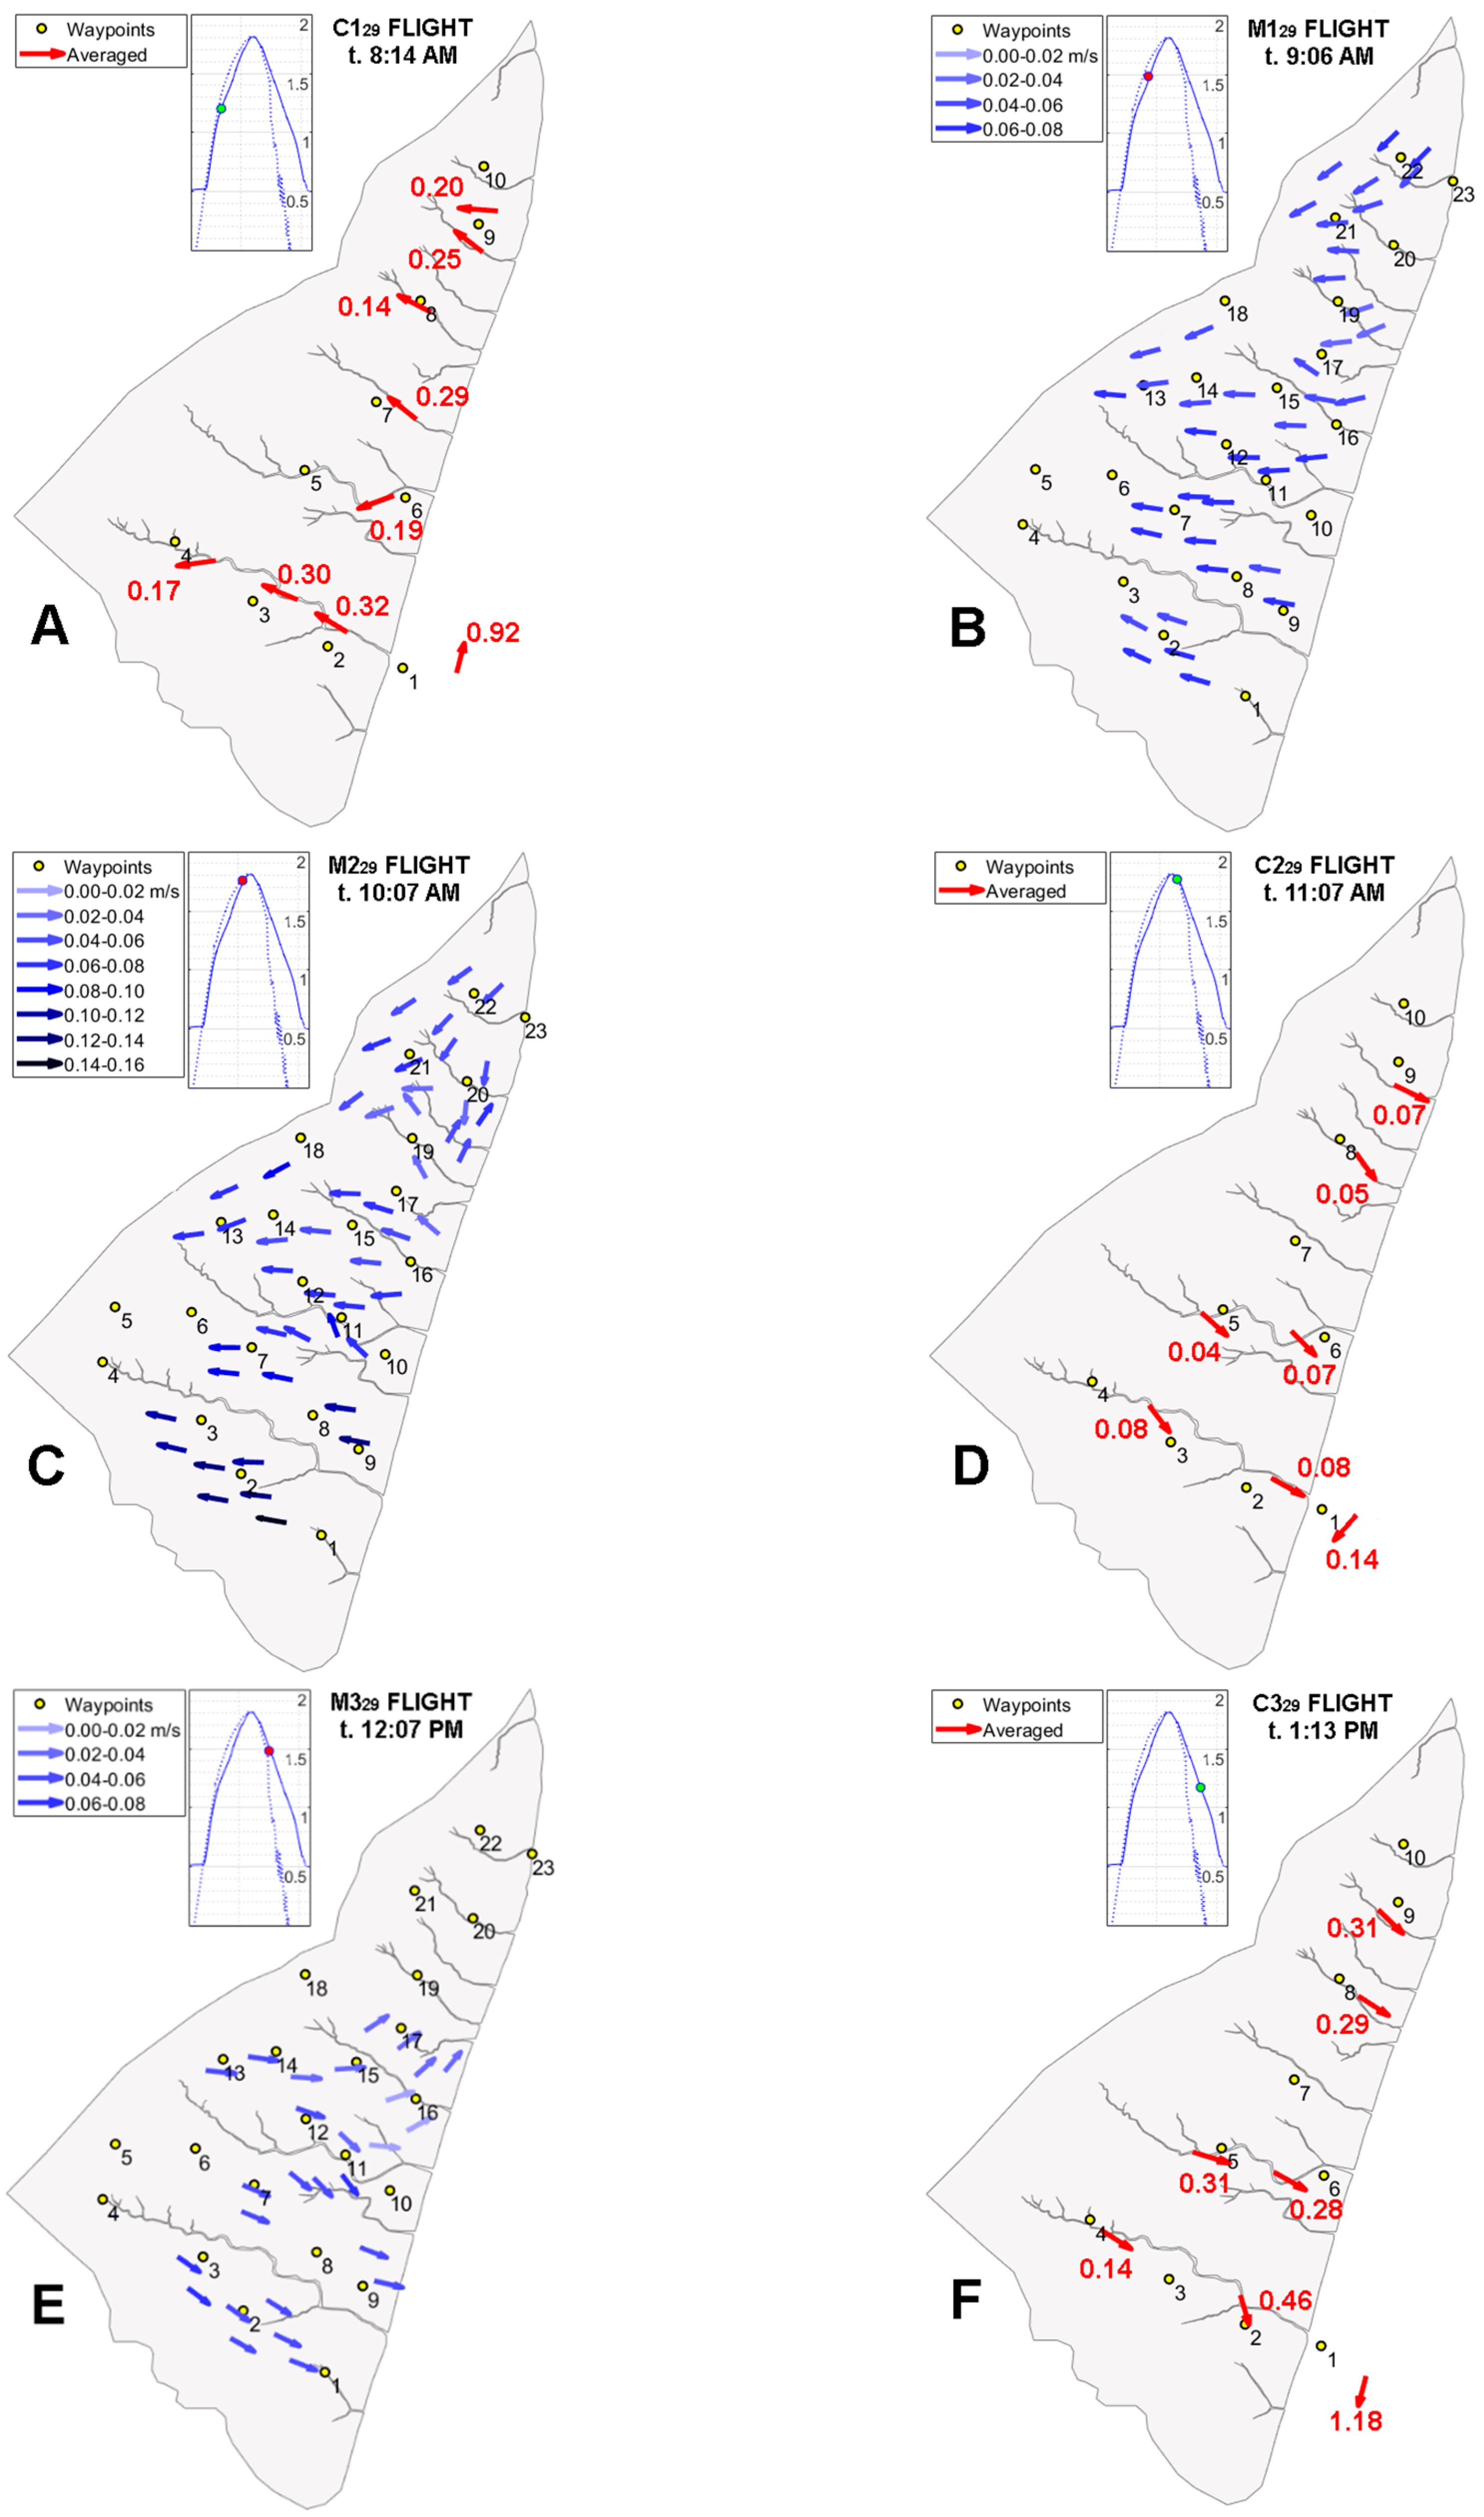
The velocities obtained during the 12 flights, summarized in Table 1, are shown in Figure 9 and Figure 10, respectively, for the 28th and the 29th of October. The figures describing the marsh surveys show the velocities interpolated over the marsh, as described in the previous section. For clarity, the figures describing the creeks surveys show the average velocities for each waypoint, computed as the average of all the instantaneous velocities obtained by the drone hovering over that waypoint. The average velocity is assigned to the center of mass of the instantaneous velocity locations. For the creeks, the average velocities provide an estimate of the cross-sectional average velocities, since the dye clouds are dropped and travel over the entire cross-section of the creek. For every flight, the initial time of the flight is indicated. The insets show where this instant is located with respect to the water level measured by the ADCP.
At the beginning of the flood phase, when the water level is lower than the marsh elevation, fluxes coming from the main channel enter the creeks (Figure 9A and Figure 10A). The average velocities are around 0.15-0.3m/s, with smaller velocities located in the more landward locations (Figure 9A and Figure 10A). Once the water level exceeds the average elevation of the marsh platform, the creeks flood the marsh. Marsh flooding starts at the head of the creeks, where bed elevation is lower [41], and spilling progressively occurred over the entire length of the creek as the water level reaches the elevation of the lateral levees. In the same way, water flowing in the Duplin enters the marsh by overtopping the bank and progressively floods the marsh, with velocities almost perpendicular to the marsh border. This can be seen in Figure 9B and Figure 10B, at the waypoints placed at the eastern boundary (1, 9, 10, 16, 17, 19, 20, 22 and 23) and in the middle of the marsh (2, 3, 7, 8, 11, 12 and 15). Our results indicate that the velocity over the marshes is lower than those in the creeks, due to the lower depths and the presence of vegetation.
Figure 9B and Figure 10B show that the fluxes entering the salt marsh from the main channel and the tidal creeks, bend southward close to the freshwater forest, i.e., the western boundary of the marsh platform. We hypothesize that the shape of the salt marsh determines the southward bending of the flow field. In particular, the northern area of the marsh has a smaller width (<150m) than the southern end (~400m). Therefore, the water reaches the marsh earlier in the northern part. Therefore, a north to south positive gradient of water level forms, water moves southward, and it joins water coming from the creeks and the main channel. This effect is visible in Figure 9B and Figure 10B, at the waypoints located in the northern part of the marsh (19, 20, 21, 22 and 23) and at the western boundary of the marsh (13, 14 and 18), where water fluxes run more parallel to the marsh edge. In some cases, as for waypoint 21 (both M128 and M129 flights) and 22 (M128 flight), this effect is less evident. At those points, in Figure 9C and Figure 10C, the average velocities were calculated, including also dye clouds released inside the creeks, where the water preferentially flows along their axes.
Figure 9C and Figure 10C show the flow field at the end of the flood phase. The calculated velocities are very similar to the ones observed during the M1 flights. On the 28th of October (Figure 9C), major changes were noticed in the velocity directions in the northern and central marsh (waypoints 15 to 23), which become more parallel to the border with the forest. On the 29th of October, minor changes were observed in the velocity directions (Figure 10C). A large difference can be noticed in the velocity magnitude in the southern marsh. The velocity increases at the end of the flood phase due to the higher depths and reduced effect of vegetation.
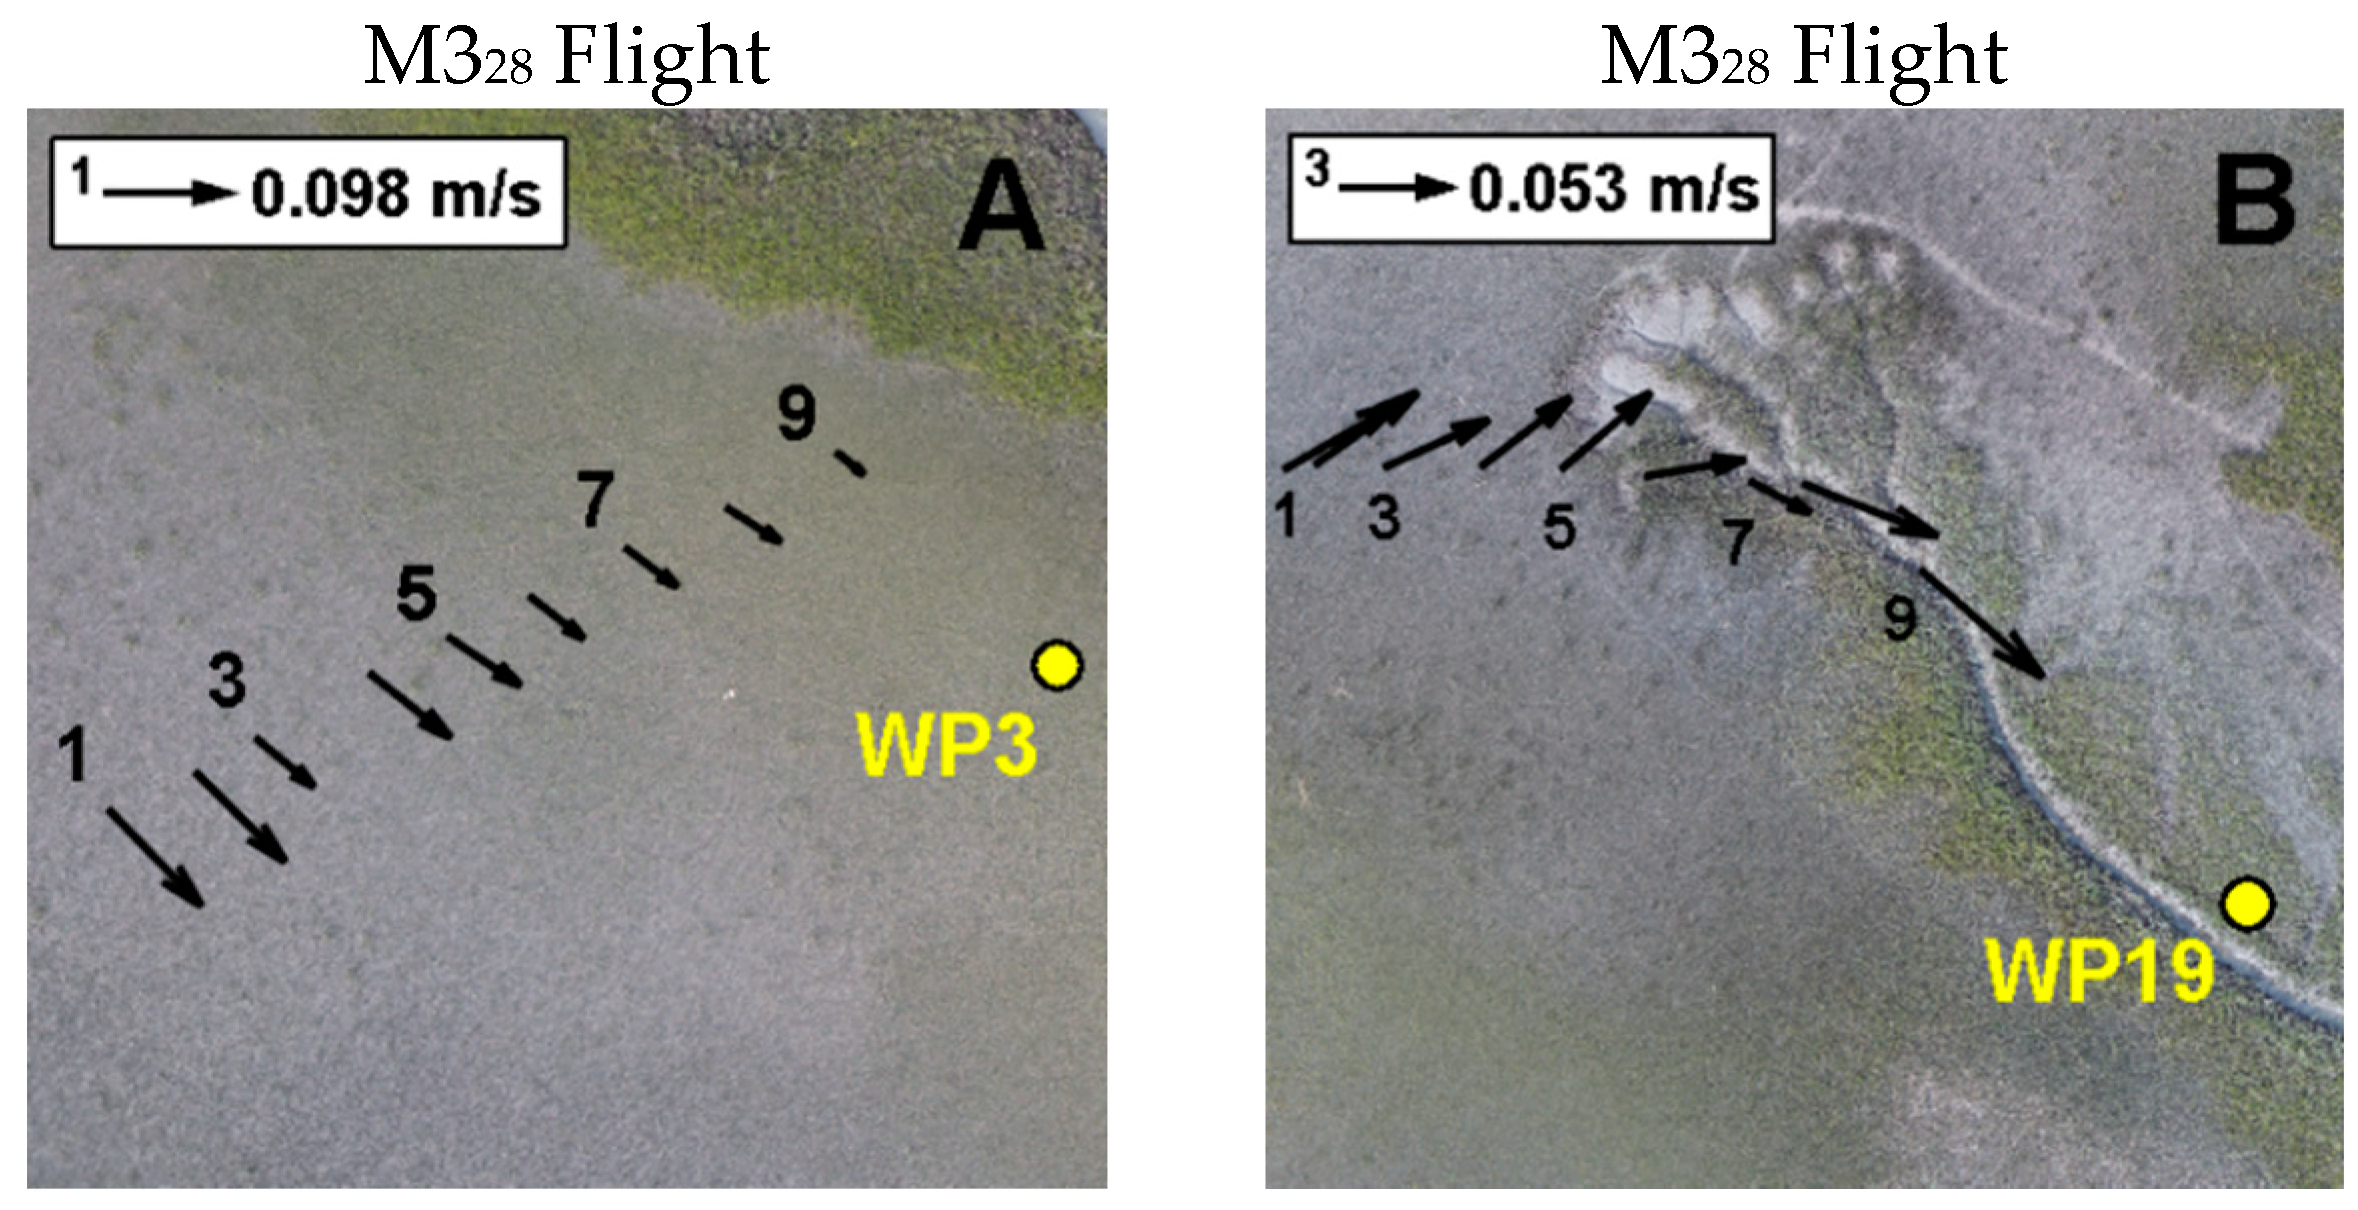
Figure 9D and Figure 10D show that, at the beginning of the ebb tide, there is an inversion in the flux directions over the entire domain. The maximum velocities over the marsh are located farther away from the creek (Figure 9D). Recent field surveys indicate that bed elevations are highest on the creek levees, and vegetation is tallest [41]. As a consequence, friction increases thus possibly decreasing flow speed close to the levees. Accordingly, our surveyed non-interpolated velocities, shown in Figure 11A, indicate a clear reduction in velocities from the middle of the marsh toward the levees. Also, our high-resolution surveys resolve how the creek channelizes the water fluxes from the marsh platform (Figure 11B). Figure 10D shows that in the creeks, the lowest velocities are computed toward the creek head (waypoint 5–0.04 m/s), and progressively increase toward the mouth (waypoint 6–0.07 m/s). The average velocities in ebb are much smaller than the ones computed in flood (C129 flight), since C229 is closer to high water slack. No velocities were calculated with the C228 flight (Figure 9E).
Figure 9D and Figure 10E show that in ebb water leaves the marsh: (i) close to the forest, in a direction almost parallel to the marsh-forest border; (ii) over the creeks, which channelize the fluxes coming from the marsh platform, and (iii) by spilling over the southeastern boundary with the Duplin. The fluxes over the marsh have similar magnitude in ebb and flood (Figure 9B–D and Figure 10B,C,E).
Finally, Figure 9F and Figure 10F show that, when the water level is lower than the average elevation of the marsh, water drains the marsh through the tidal creeks. The velocities are larger than in the flood phase, and this could be attributed to: (i) the higher water level gradients in time (close to the inflection point of the tidal signal); (ii) the creek is draining a last thin layer of water fluxes from the marsh, and no water drains directly from the marsh to the Duplin.
The velocity magnitude and direction calculated using the dye cloud released in the Duplin River are shown in Figure 9E and Figure 10A,D,F, at the at waypoint 1. For the survey described in Figure 9A,F dye was not released in the main channel. In all the surveys, the calculated directions are along the axis of the Duplin. The inversion of the fluxes between the flood and ebb phases is visible when comparing Figure 10A,F.
Note that the values calculated in flood (Figure 10A) and in ebb (Figure 10F) are approximately at the same temporal distance from the inflection points of the water level signal (insets in Figure 10A,F). A higher velocity was measured in ebb, suggesting that the tidal current in the Duplin might be ebb dominant [45]. Our ebb and flood velocities differ by about 0.25m/s, which means the ebb velocity is 27% higher than the flood velocity, consistent with the 30% increase measured in [45].

4. Discussion

In our research, we successfully tested a new non-intrusive low-cost method to collect affordable hydrodynamic data on a vegetated salt marsh. The proposed method allows for calculating snapshots of surface velocities at one-hour intervals, over a relatively large area. Each snapshot is collected over a 10-min period. The method couples a UAV-based approach to release and survey dye clouds on the water surface, with a newly developed image detection algorithm, used to track dye movements. Although UAV-based methods to track surface tracers have been developed in several studies [36,38,39,46] in riverine and coastal environments, km-scale surface flow fields have never been computed in shallow salt marsh environments over a tidal cycle. Also, in this work, instead of using solid tracers, we propose tracking small dye clouds formed by the release of single dye drops. A comparison with an ADCP indicated that our method is capable of computing water surface velocities correctly. Our results show that the marsh is flooded and drained in three ways: (i) through the tidal creeks; (ii) through the southern marsh, where water flows perpendicularly to the marsh border with the main channel; and (iii) parallel to the forest border on the west side of the domain. To our knowledge, the latter mechanism has never been documented in the literature. This was likely due to the different lengths of the creeks. Water drains and floods in the shorter channels, thus creating a gradient in water surface orthogonally to the creek axes in the most landward region. These gradients in the surface velocity direction were observed in conjunction with the lower measured wind speed (Figure 3B). Note that wind is blowing from the north on the 28th and from the north-east on the 29th, maintaining in both cases a fairly constant direction both during ebb and flood tide (Figure 3C). Also, the tall forest on the north-western boundary of the domain most likely shades the adjacent part of the salt marsh from the wind. In that region, the surface velocities bend toward the forest border during the ebb tide for both days, in a direction opposite to the wind. Therefore, we can safely state that the variation in surface velocity direction close to the forest is not driven by the wind. Finally, ebb dominance in the main channel of the Duplin River [45] was confirmed, with higher velocities measured in both the creeks and the main channel in ebb relative to the flood phase. We want to underline that, although the method was based on RGB images, its application to other images formats is possible with minimal changes to the algorithm.
The overall low cost of the method makes it a valid alternative to expensive, standard surveying technologies. The main expense of our procedure is for the UAVs, and it does not exceed USD 3500. An additional average hourly cost of about USD 60 must be considered for two pilots. If only a single day survey has to be performed, drones could be rented, and two UAV pilots hired, for an average hourly total cost of USD 100–150. Small additional charges in the order of $65 were spent for the tracer ($30), the UAV bag with discharge regulator ($15) and the mission planner software (Litchi app, $20). The installation of the bag used to release the dye on our UAV was simple and was done with adhesive tape and a safety pin.
Knowledge of tidal hydrodynamics is not needed to perform the flights if the mission is planned beforehand and loaded in the mission planner app. However, mission planning requires experience in both hydrodynamics and drone piloting. In order to optimize the flight and maximize data collection, the planner needs to understand local tidal dynamics, such as the relation between velocities and water level gradients, and drone specifications, such as battery duration, controller range, maximum speed, and GPS precision.
The procedure, tested in an estuarine environment, can be easily transferred to riverine and coastal surveys. In riverine environments, the method can be applied to measure velocity magnitude and direction, total discharge, as well as the local flow field in river bends, junctions, and flow constrictions. Moreover, during extreme river floods, flying drones would reduce the risks of damaging sensors deployed in the river section. However, since drones cannot fly in harsh weather conditions, the ability of surveying river floods is limited to those situations in which precipitation and strong winds occur upstream. The procedure could also be applied to coastal environments. In coastal regions, the tracking of surface velocities from UAVs has been recently proposed by using foam motion [47] and changes in water brightness [48]. Also, dye has been used to track the speed of a longshore current [49,50]. Small clouds of dye, with diameters much smaller than the wave length, could be used to infer wave orbital velocities outside of the breaking zone. However, within the breaking zone, small clouds would likely disperse too rapidly due to high turbulence.
In all environments, images must be georectified. This requires (i) deploying GCPs, at least three over the image footprint, and (ii) surveying their location with an RTK-GPS system. If large areas have to be surveyed, a long time is needed to deploy GCPs. The use of GCPs can be avoided by using a UAV with an integrated RTK-GPS system, such as the Phantom 4 Pro RTK, available for USD ~8000.
Velocity databases in estuarine regions are limited due to the high cost of the sensors. When measured velocities are not available, numerical models are usually calibrated using measured water levels, and the accuracy of modeled velocities is not verified. Uncalibrated velocities are then used to compute sediment transport as well as consequent morphodynamic changes, as well as pollutant transport. Our method provides velocities over a tidal cycle and relatively large areas, and consists of an invaluable database to train and test numerical hydrodynamic, ecologic and morphodynamic models, and to improve the predictive capability of transport and ecological processes. The latter is an essential step to predict the morphological trajectories of salt estuarine systems [14,51,52].
Finally, when deploying sensors, humans perturb a delicate ecosystem, which often takes several months to recover. Our surveys were carried out on a salt marsh, which is part of a National Estuarine Research Reserve. The proposed procedure is non-intrusive. On the contrary, deployment of an array of velocity sensors on the marsh would require extensive trampling, which would damage the vegetation. Figure 12 shows an example of an unvegetated pathway created at Little Sapelo Island during a sensor deployment.
Note that the advantage of our method with respect to stationary cameras is that it is not intrusive. From our experience, we would need hundreds of cameras on 3-m tall posts to survey the study area. A taller sturdier platform would likely sink into the muddy substrate. Either way, installing cameras over a marsh would carry a large cost, and would cause severe damage to the salt marsh platform due to the extensive trampling.

4.1. Operational and Analysis Limits

Here we list some limitations of our algorithm, and how some of them could be circumvented. In particular:
(1)
Image classification for dye detection is a challenging process, affected by illumination conditions and tracer visibility. The presence of dense and greenish vegetation could interfere with the ability of our algorithm to detect the dye, especially on sunny days due to sun reflection. This is more evident for low submergence levels. We were able to reduce sun reflection by applying an ND filter to the camera. Also, by using a large number of samples to train the classification algorithm, we reduced the uncertainties in the classification procedure.
(2)
Since dye is passively transported by the flow, water velocities were computed from the movement of the dye cloud barycenter. This is consistent with the advection-diffusion theory of a passive solute dispersed in a uniform flow field [53]. However, 2D spatial gradients in the velocity field can be caused by gradients in vegetation and bed elevation [54]. A non-uniform velocity would disperse the cloud asymmetrically. This way, the location of the cloud center of mass could differ from its geometric barycenter, computed from the union of the pixels classified as dye, and this would affect the calculation of the flow velocity. We were able to reduce the error by taking images every 2 s. Over this time, the cloud traveled for a short distance, over which spatial gradients in velocity are negligible.
(3)
Due to the low accuracy of the onboard GPS system (~1–10 m), the creek tortuosity, and the narrow creek width, we were not able the use the auto-pilot to follow the axis of the creek and release dye drops. With the autopilot, few or no drops fell into the creek. As a solution, the drone was manually operated.
(4)
The minimum number of GCPs required to georectify the images is three. GCPs must be homogeneously distributed over the image. However, in our initial tests, we noticed that the GCPs we placed close to the edge were not present in the actual collected image. Due to the low precision of the drone navigation system, the actual location where the drone will hover could be off by several meters. After some trial and error, we determined that the GCPs should be placed at least 10 m from the edge of the estimated footprint of the image to ensure that they will be captured by the camera.
(5)
The optimal altitude at which the drone flies is determined by a tradeoff between ground resolution and size of the field of view. On the one hand, a higher altitude reduces the number of GCPs which need to be deployed and images to be analyzed. On the other hand, a higher altitude reduces the pixel size and the ability to detect the shape and barycenter of dye clouds. We determined a value of 105 m for the optimal altitude for our surveys.
(6)
Finally, the method does not apply to nighttime for multiple reasons. While our fluorescent dye could be detected in the RGB pictures, the GCPs would not, unless a fluorescent paint was used. However, flight regulations prohibit flying a UAV from 30 min after the sunset to 30 min before the sunrise.

5. Conclusions

In this study, we proposed and tested a new non-intrusive and low-cost UAV-based method to determine surface flow velocity by tracking the movement of fluorescent dye clouds. The procedure was performed using a couple of low-cost UAVs. The first drone released the dye in the channels and in the marsh platform, following a preset flight. The second drone tracked the movement of the dye clouds by collecting RGB images. Flow magnitude and direction were determined from the images using a newly developed algorithm. Images were georectified using the known coordinates of ground control points. Pixels were classified with a maximum likelihood classifier, which distinguishes the dye clouds from the marsh background. Polygons enclosing the dye pixels were extracted, and their centroids and areas were calculated. By repeating this procedure for all the collected images, a temporal sequence of the estimate of the barycenter coordinates for each dye cloud was obtained. By knowing the acquisition interval of the images, the velocities of the dye clouds were calculated. These velocities were in good agreement with the ones measured by an ADCP. The results suggested that the marsh is flooded and drained in three ways: (i) through the tidal creeks; (ii) through the southern marsh, where water flows perpendicularly to the marsh border with the main channel; (iii) along the border with the freshwater forest in the northern marsh.
This work establishes the concepts and techniques needed to use two UAVs to precisely and cost-effectively describe the hydrodynamics on highly vegetated salt marshes. The method can be easily adapted to marine and riverine applications. Moreover, the moderate cost of the UAVs (~1500$ each) and the software employed in the survey (Litchi, ArcGIS, and Python) make our method very attractive.
Future studies will focus on calibrating a numerical model by using the data collected in our surveys. Velocities at the domain boundaries, together with the water level measured at a tidal gage, will provide the boundary conditions for hydrodynamic and eco-morphological models. Velocities surveyed at different times over the creeks and marsh will serve as a validation dataset for these models.

Author Contributions

Conceptualization, D.P. and A.C.; methodology, D.P. and A.C.; software, L.F., and D.P.; validation, D.P.; formal analysis, D.P. and L.F.; investigation, D.P., A.C. and L.F.; resources, A.C.; data curation, D.P. and L.F.; writing—original draft preparation, D.P. and L.F.; writing—review and editing, D.P., and A.C.; visualization, D.P., L.F. and A.C.; supervision, A.C.; project administration, D.P. and A.C.; funding acquisition, A.C. All authors have read and agreed to the published version of the manuscript.

Funding

Pinton was supported by UF SEED award (P0081941) and by the UF “Moonshot award” (no. 00129098).

Acknowledgments

Authors want to thanks the University of Georgia Marine Institute. In particular Ike Sellers who helped with boat maintenance, and Gracie Townsend for the accommodation arranging. Authors also want to thanks Christine Angelini for landing her boat for the fieldwork, and Collin Ortals for the contribution in the fieldwork and for the implementation of the image classification algorithm.

Conflicts of Interest

The authors declare that they have no conflict of interest.

References

  1. Boesch, D.F.; Turner, R.E. Dependence of Fishery Species on Salt Marshes: The Role of Food and Refuge. Estuaries 1984, 7, 460–468. [Google Scholar] [CrossRef]
  2. Barbier, E.; Hacker, S.D.; Kennedy, C.J.; Koch, E.W.; Stier, A.; Silliman, B. The value of estuarine and coastal ecosystem services. Ecol. Monogr. 2011, 81, 169–193. [Google Scholar] [CrossRef]
  3. Pendleton, L.; Donato, D.C.; Murray, B.C.; Crooks, S.; Jenkins, W.A.; Sifleet, S.; Craft, C.; Fourqurean, J.W.; Kauffman, J.B.; Marbà, N.; et al. Estimating Global “Blue Carbon” Emissions from Conversion and Degradation of Vegetated Coastal Ecosystems. PLoS ONE 2012, 7, e43542. [Google Scholar] [CrossRef] [PubMed] [Green Version]
  4. Cowardin, L.M.; Carter, V.; Golet, F.C.; LaRoe, E.T. Classification of Wetlands and Deepwater Habitats of the United States; US Department of the Interior; Fish and Wildlife Service; US Government Printing Office: Washington, DC, USA, 1979.
  5. Silvestri, S.; Defina, A.; Marani, M. Tidal regime, salinity and salt marsh plant zonation. Estuar. Coast. Shelf Sci. 2005, 62, 119–130. [Google Scholar] [CrossRef]
  6. Wiegert, R.G.; Chalmers, A.G.; Randerson, P.F. Productivity Gradients in Salt Marshes: The Response of Spartina Alterniflora to Experimentally Manipulated Soil Water Movement. Oikos 1983, 41, 1–6. [Google Scholar] [CrossRef]
  7. Beeson, C.; Doyle, P.F. Comparison of bank erosion at vegetated and non-vegetated channel bends. J. Am. Water Resour. Assoc. 1995, 31, 983–990. [Google Scholar] [CrossRef]
  8. Temmerman, S.; Bouma, T.J.; Govers, G.; Wang, Z.B.; De Vries, M.B.; Herman, P.M.J. Impact of vegetation on flow routing and sedimentation patterns: Three-dimensional modeling for a tidal marsh. J. Geophys. Res. Earth Surf. 2005, 110, 1–18. [Google Scholar] [CrossRef]
  9. Fagherazzi, S.; Kirwan, M.L.; Mudd, S.M.; Guntenspergen, G.R.; Temmerman, S.; D’Alpaos, A.; Van De Koppel, J.; Rybczyk, J.M.; Reyes, E.; Craft, C.; et al. Numerical models of salt marsh evolution: Ecological, geomorphic, and climatic factors. Rev. Geophys. 2012, 50, 79. [Google Scholar] [CrossRef]
  10. Rozema, J.; Leendertse, P.; Bakker, J.; Van Wijnen, H. Nitrogen and Vegetation Dynamics in European Salt Marshes. In Concepts and Controversies in Tidal Marsh Ecology; Springer: Dordrecht, The Netherlands, 2002; pp. 469–491. [Google Scholar] [CrossRef]
  11. Neumeier, U.; Ciavola, P. Flow Resistance and Associated Sedimentary Processes in a Spartina maritima Salt-Marsh. J. Coast. Res. 2004, 202, 435–447. [Google Scholar] [CrossRef]
  12. D’alpaos, A.; Lanzoni, S.; Marani, M.; Rinaldo, A. Landscape evolution in tidal embayments: Modeling the interplay of erosion, sedimentation, and vegetation dynamics. J. Geophys. Res. Earth Surf. 2007, 112, 1–17. [Google Scholar] [CrossRef] [Green Version]
  13. Mariotti, G.; Fagherazzi, S. A numerical model for the coupled long-term evolution of salt marshes and tidal flats. J. Geophys. Res. Earth Surf. 2010, 115, 1–15. [Google Scholar] [CrossRef]
  14. Mariotti, G.; Canestrelli, A. Long-term morphodynamics of muddy backbarrier basins: Fill in or empty out? Water Resour. Res. 2017, 53, 7029–7054. [Google Scholar] [CrossRef]
  15. Temmerman, S.; Bouma, T.; Van De Koppel, J.; Van Der Wal, D.; De Vries, M.; Herman, P.M.J. Vegetation causes channel erosion in a tidal landscape. Geology 2007, 35, 631–634. [Google Scholar] [CrossRef]
  16. Alizad, K.; Hagen, S.C.; Medeiros, S.C.; Bilskie, M.V.; Morris, J.T.; Balthis, L.; Buckel, C.A. Dynamic responses and implications to coastal wetlands and the surrounding regions under sea level rise. PLoS ONE 2018, 13, e0205176. [Google Scholar] [CrossRef] [PubMed]
  17. Alizad, K.; Hagen, S.C.; Morris, J.T.; Medeiros, S.C.; Bilskie, M.V.; Weishampel, J.F. Earth’s Future Special Section: Coastal wetland response to sea-level rise in a fluvial estuarine system. Earth’s Future 2016, 4, 483–497. [Google Scholar] [CrossRef]
  18. Kirwan, M.L.; Temmerman, S. Coastal marsh response to historical and future sea-level acceleration. Quat. Sci. Rev. 2009, 28, 1801–1808. [Google Scholar] [CrossRef]
  19. Alizad, K.; Medeiros, S.C.; Foster-Martinez, M.R.; Hagen, S.C. Model Sensitivity to Topographic Uncertainty in Meso- and Microtidal Marshes. IEEE J. Sel. Top. Appl. Earth Obs. Remote. Sens. 2020, 13, 807–814. [Google Scholar] [CrossRef]
  20. Muste, M.; Yu, K.; Spasojevic, M. Practical aspects of ADCP data use for quantification of mean river flow characteristics; Part I: Moving-vessel measurements. Flow Meas. Instrum. 2004, 15, 1–16. [Google Scholar] [CrossRef]
  21. Muste, M.; Yu, K.; Pratt, T.; Abraham, D. Practical aspects of ADCP data use for quantification of mean river flow characteristics; Part II: Fixed-vessel measurements. Flow Meas. Instrum. 2004, 15, 17–28. [Google Scholar] [CrossRef]
  22. Wu, W.; Asce, M. Measuring Velocity and Shear Stress over Dunes with Acoustic Doppler Profile. J. Hydraul. Eng. 2004, 130, 1013–1024. [Google Scholar] [CrossRef]
  23. Gaeuman, D.; Jacobson, R.B. Aquatic Habitat Mapping with an Acoustic Doppler Current Profiler: Considerations for Data Quality; U.S. Geological Survey Open-File Report 2005-1163. Available online: http://pubs.er.usgs.gov/publication/ofr20051163 (accessed on 21 May 2020).
  24. Gonzalez, J.; Melching, C.; Oberg, K. Analysis of Open-Channel Velocity Measurements Collected with an Acoustic Doppler Current Profiler. In Proceedings of the 1st International Conference on New/Emerging Concepts for Rivers, IWR Association, Chicago, IL, USA, 22–26 September 1996; Volume 2, pp. 838–845. [Google Scholar]
  25. Spicer, K.R.; Costa, J.E.; Placzek, G. Measuring flood discharge in unstable stream channels using ground-penetrating radar. Geology 1997, 25, 423–426. [Google Scholar] [CrossRef]
  26. Costa, J.E.; Spicer, K.R.; Cheng, R.T.; Haeni, F.P.; Melcher, N.B.; Thurman, E.M.; Plant, W.J.; Keller, W.C. measuring stream discharge by non-contact methods: A Proof-of-Concept Experiment. Geophys. Res. Lett. 2000, 27, 553–556. [Google Scholar] [CrossRef]
  27. Plant, W.; Keller, W.; Hayes, K. Measurement of river surface currents with coherent microwave systems. IEEE Trans. Geosci. Remote. Sens. 2005, 43, 1242–1257. [Google Scholar] [CrossRef]
  28. Lin, Y.; Hyyppa, J.; Jaakkola, A. Mini-UAV-Borne LIDAR for Fine-Scale Mapping. IEEE Geosci. Remote. Sens. Lett. 2010, 8, 426–430. [Google Scholar] [CrossRef]
  29. Grenzdörffer, G.J.; Engel, A.; Teichert, B. UAVs in Agriculture: Perceptions, Prospects, and “Probably Not”. Int. Arch. Photogramm. Remote Sens. Spat. Inf. Sci. 2008, 1, 1207–1213. [Google Scholar]
  30. Gonçalves, J.A.; Henriques, R. UAV photogrammetry for topographic monitoring of coastal areas. ISPRS J. Photogramm. Remote Sens. 2015, 104, 101–111. [Google Scholar] [CrossRef]
  31. Wang, R.; Gamon, J.A. Remote sensing of terrestrial plant biodiversity. Remote Sens. Environ. 2019, 231, 111218. [Google Scholar] [CrossRef]
  32. Wang, J.; Liu, Z.; Yu, H.; Li, F. Mapping Spartina alterniflora Biomass Using LiDAR and Hyperspectral Data. Remote Sens. 2017, 9, 589. [Google Scholar] [CrossRef] [Green Version]
  33. Powers, C.; Hanlon, R.; Schmale, D.G. Tracking of a Fluorescent Dye in a Freshwater Lake with an Unmanned Surface Vehicle and an Unmanned Aircraft System. Remote Sens. 2018, 10, 81. [Google Scholar] [CrossRef] [Green Version]
  34. Adrian, R.J. Twenty years of particle image velocimetry. Exp. Fluids 2005, 39, 159–169. [Google Scholar] [CrossRef]
  35. Lüthi, B.; Tsinober, A.; Kinzelbach, W. Lagrangian measurement of vorticity dynamics in turbulent flow. J. Fluid Mech. 2005, 528, 87–118. [Google Scholar] [CrossRef]
  36. Lükő, G. Lagrangian Analysis of River Flow from Uav Videos. In Proceedings of the Scientific Students’ Associations Conference, Budapest, Hungary, 18–20 June 2016; Budapest University of Technology and Economics Department of Hydraulic and Water Resources Engineering: Budapest, Hungary, 2016. [Google Scholar]
  37. Trowse, G.; Roc, T.; Karsten, R.; Locke, J.; Hay, A.; Cheel, R. Drones and Drifters: The Great Pumpkin Race; OERA Research Project, Project Completation Report; Dalhousie University: Halifax, NS, Canada, 2017; pp. 1–22. Available online: https://oera.ca/sites/default/files/2019-05/Drones%20and%20Drifters-%20The%20Great%20Pumpkin%20Race%20%E2%80%93%20Project%20Completion%20Report.pdf (accessed on 21 May 2020).
  38. Tauro, F.; Grimaldi, S. Ice dices for monitoring stream surface velocity. J. Hydro-Environment Res. 2017, 14, 143–149. [Google Scholar] [CrossRef]
  39. Sukhodolov, A.N.; Uijttewaal, W.S.; Schnauder, I.; Sukhodolova, T.A.; Erdbrink, C.; Brevis, W.; Garcia, X.F.; Pusch, M.; Gabel, F. Quantitative Visual Methods for Natural Streams: Examples and Perspectives. Proc. Congr. Int. Assoc. Hydraul. Res. 2007, 32, 1–68. [Google Scholar]
  40. Hughes, S.A. Estimating Surface Currents Using Dyes and Drogues; ERDC/CHL CHETN-VI-37, 14; U.S. Army Engineer Research and Development Center: Vicksburg, MS, USA, 2002.
  41. Pinton, D.; Canestrelli, A.; Angelini, C.; Wilkinson, B.; Ifju, P.; Ortega, A. A New Algorithm for Estimating Ground Elevation and Vegetation Characteristics in Coastal Salt Marshes from High-Resolution Point Clouds. ESPL. Submitted.
  42. Hladik, C.; Schalles, J.; Alber, M. Salt marsh elevation and habitat mapping using hyperspectral and LIDAR data. Remote Sens. Environ. 2013, 139, 318–330. [Google Scholar] [CrossRef]
  43. Schalles, J.; Hladik, C.; Lynes, A.; Pennings, S. Landscape Estimates of Habitat Types, Plant Biomass, and Invertebrate Densities in a Georgia Salt Marsh. Oceanography 2013, 26, 88–97. [Google Scholar] [CrossRef] [Green Version]
  44. Day, R.H.; Williams, T.M.; Swarzenski, C.M. Hydrology of Tidal Freshwater Forested Wetlands of the Southeastern United States; Springer: Dordrecht, The Netherlands, 2007. [Google Scholar]
  45. Zarillo, G. Tidal dynamics and substrate response in a salt-marsh estuary. Mar. Geol. 1985, 67, 13–35. [Google Scholar] [CrossRef]
  46. Blois, G.; Best, J.L.; Christensen, K.T.; Cichella, V.; Donahue, A.; Hovakimyan, N.; Kennedy, A.; Pakrasi, I. UAV-based PIV for quantifying water-flow processes in large-scale natural environments. In Proceedings of the 18th International Symposium on the Application of Laser and Imaging Techniques to Fluid Mechanics, Lisabon, Portugal, 4–7 July 2016. [Google Scholar]
  47. Dérian, P.; Almar, R. Wavelet-Based Optical Flow Estimation of Instant Surface Currents from Shore-Based and UAV Videos. IEEE Trans. Geosci. Remote. Sens. 2017, 55, 5790–5797. [Google Scholar] [CrossRef]
  48. Jung, D.; Lee, J.S.; Baek, J.Y.; Nam, J.; Jo, Y.H.; Song, K.M.; Cheong, Y.I. High Temporal and Spatial Resolutions of Sea Surface Current from Low-Altitude Remote Sensing. J. Coast. Res. 2019, 90, 282–288. [Google Scholar] [CrossRef]
  49. Balsillie, J.H. Surf Observations and Longshore Current Prediction; US Army, Corps of Engineers, Coastal Engng. Research Center, 1975. Available online: https://books.google.com/books/about/Surf_Observations_and_Longshore_Current.html?id=tBxLygEACAAJ (accessed on 21 May 2020).
  50. Putnam, J.A.; Munk, W.H.; Taylor, M.A. The prediction of longshore currents. Eos Trans. Am. Geophys. Union 1949, 30, 337–345. [Google Scholar] [CrossRef]
  51. Ganju, N.K.; Kirwan, M.L.; Dickhudt, P.J.; Guntenspergen, G.R.; Cahoon, D.R.; Kroeger, K.D. Sediment transport-based metrics of wetland stability. Geophys. Res. Lett. 2015, 42, 7992–8000. [Google Scholar] [CrossRef] [Green Version]
  52. Canestrelli, A.; Lanzoni, S.; Fagherazzi, S. One-dimensional numerical modeling of the long-term morphodynamic evolution of a tidally-dominated estuary: The Lower Fly River (Papua New Guinea). Sediment. Geol. 2014, 301, 107–119. [Google Scholar] [CrossRef]
  53. Fischer, H.; List, J.; Koh, C.; Imberger, J.; Brooks, N. Mixing in Inland and Coastal Waters, 1st ed.; Academic Press: Cambridge, MA, USA, 2013; ISBN 9780122581502. [Google Scholar]
  54. Want, W.J.; Huai, W.X.; Thompson, S.; Katul, G.G. Steady nonuniform shallow flow within emergent vegetation. Water Resour. Res. 2015, 51, 10047–10064. [Google Scholar] [CrossRef]
Figure 1. Location of the salt marsh in Little Sapelo Island, Georgia, USA, in the Georgia Coastal Ecosystem Long Term Ecological Research (GCELTER). The cyan lines indicate the main creeks surveyed in our study and crossing the study area.
Jmse 08 00364 g001
Figure 2. Flowchart describing the procedure used in our study to calculate surface water velocity from UAV-released dye clouds. The main passages of the procedure are indicated in the colored boxes using a larger, bold and italic font type, and the related sections are described in the white filled boxes, using a bold, underlined and italic font type. The colored squares indicate different steps of the procedure: orange filled boxes indicate data collection steps; blue filled boxes indicate pre-processing and data analysis steps; green boxes indicate image classification steps, considered as a pre-processing macro-step; red boxes indicate result generation steps; and purple boxes indicate post-processing steps. The yellow diamond indicates decision steps. The reads should refer to the indicated sections for a broader description of the passages.
Jmse 08 00364 g002
Figure 3. (A) Water level measured using a pressure sensor we placed at Sapelo Island ferry dock (dotted line) and the water level measured by an acoustic Doppler current profiler (ADCP) placed in the marsh (see Figure 4). Note that the flat water level region is at +0.5 m, that is 0.69 m above the transducer level (−0.19 m). Due to a wrong setting we imposed on the minimum depth, the signature did not measure for depths <0.69 m. (B,C) Wind speed and direction measured in the station “8670870 Fort Pulaski, GA”, in meters per second. Wind direction is the angle, in degrees from the north (clockwise), from which the wind originates. The dots represent the starting time of the unmanned aerial vehicle (UAV) survey. Red dots indicate the surveys performed on the marsh; green dots show the surveys conducted in the creeks and the main channel. For clarity, the subscripts “28” and “29” have been removed from the M1, M2, M3, C1, C2, C3 labels.
Jmse 08 00364 g003
Figure 4. Spatial distribution of the flight path for the two UAVs over (A) the salt marsh and (B) the tidal channels. The positions of the ground control points (GCPs) and the ADCP are also shown. (C) Pictures of the DJI Phantom 4 Pro UAV with the dye-filled IV-bag (top), the ADCP sensor used to measure the velocity (middle), and an elevated GCPs (bottom).
Jmse 08 00364 g004
Figure 5. Flight paths of the drone releasing the dye (green lines) and image footprints for the high-altitude drone at each waypoint (black squares) in (A) the tidal channels; (B) the marshes (odd waypoints); (C) the marshes (even waypoints). Odd and even waypoints have been plotted separated for clarity.
Jmse 08 00364 g005
Figure 6. Dye analysis workflow. (STEP 1) A corridor to use for the dye detection is created by offsetting the flight path followed by the UAV; (STEP 2) dye clouds are identified in the clipped images, using a classification algorithm; (STEP 3) detected clouds are converted in polygons, of which area and centroid are calculated; (STEP 4) centroid associated with areas smaller than 0.01 m2 or larger than 1 m2 are removed from the analysis; (STEP 5) given the ith dye cloud in the Nth image, having Ci,N as center (red circle and black center dots), the possible candidates describing the same cloud in the (N+1)th image are the clouds having their barycenter inside a circle of radius Ri,N and centered in Ci,N (red circle and center dots); (STEP 6) the correct cloud (red circle and center dot) is selected considering the angle α j , i of the displacement vector d j , i connecting the ith barycenter in the Nth and (N+1)th images, and an angle of ±20° from this direction.
Jmse 08 00364 g006
Figure 7. (AC) Planar view of surface velocity vectors computed with our algorithm (red and green arrows) and surface velocities measured with the ADCP (blue arrow) during the flights performed to survey the creeks. The green arrows indicate velocities computed from the clouds that were compared with the velocity measured by the ADCP. (D) Comparison between dye-derived and ADCP-derived velocities (magnitude and direction). In order to have them both ranging between 0 and 1, flow velocities are made dimensionless with the max magnitude measured by the ADCP over the 2 days (0.9 m/s), and directions are divided by 360°.
Jmse 08 00364 g007
Figure 8. The instantaneous velocities calculated over the marsh (left) are filtered by removing the values close to the creeks and interpolated over the marsh area. This results in a surface water velocity field with a spatial resolution of ~60 m (right).
Jmse 08 00364 g008
Figure 9. Velocities calculated in the field during the flights for the survey performed on the 28th of October. The blue arrows describe the velocities calculated from the dye clouds, interpolated over the marsh for the M28 flights, and instantaneous for the C28 flights. The red arrows are the average velocities in each waypoint, described by numbered yellow dots. The dots (red for the marsh, green for the creeks) represent the reported central time of the UAV survey. The subfigures show the flow field for: (A) The first flight over the channels (C128); (B) The first flight over the marsh (M128); (C) The second flight over the marsh (M228); (D) The third flight over the marsh (M328); (E) The second flight over the channels (C228); (F) The third flight over the channels (C328).
Jmse 08 00364 g009
Figure 10. Velocities calculated in the field during the flights for the survey performed on the 29th of October. The blue arrows describe the velocities calculated from the dye clouds, interpolated over the marsh for the M29 flights, and instantaneous for the C29 flights. The red arrows are the average velocities in each waypoint, described by numbered yellow dots. The dots (red for the marsh, green for the creeks) represent the reported central time of the UAV survey. The subfigures show the flow field for: (A) The first flight over the channels (C129); (B) The first flight over the marsh (M129); (C) The second flight over the marsh (M229); (D) The second flight over the channels (C229); (E) The third flight over the marsh (M329); (F) The third flight over the channels (C329).
Jmse 08 00364 g010
Figure 11. (A) Surface water velocities are progressively reduced with the increase in vegetation height and density approaching a tidal creek; (B) Water flows are entering a creek-head in the ebb phase. The black arrows describe the non-interpolated velocities obtained from the dye survey.
Jmse 08 00364 g011
Figure 12. The progressive effect of continuous survey activities in the salt marsh is the creation of pathways in the vegetation (right), causing its death, and the creation of a preferential route for the water movement and stagnation.
Jmse 08 00364 g012
Table 1. Day and starting time for the UAV flights performed on the Little Sapelo salt marsh (M1, M2, M3) and its creeks and main channel (C1, C2, C3) on the 28th and the 29th of October 2019. The day is added as subscript on the flight label. For instance, M128 refers to the first flight over the marsh on October 28th.
DateStarting HourFlight LabelDateStarting HourFlight Label
28th October 20197:30 AMC12829th October 20198:08 AMC129
8:20 AMM1289:00 AMM129
9:35 AMM22810:01 AMM229
10:50 AMM32811:01 AMC229
11:05 AMC22812:01 AMM329
12:20 AMC32813:07 AMC329
Table 2. Flight details for the first UAV, which releases the dye tracer over marshes, the main channel, and creeks.
CharacteristicsSalt MarshCreeks + Main Channel
Flight modeAutomatic pilotManual + VO
Total length3.5 km1.5 km
Number of waypoints76-
Flight duration≈12 min≈10 min
Flight altitude10 m MSL7.5 m MSL
Average cruising speed27 km/h6 km/h1–35 km/h2
1 UAV Cruise speed above the creeks. 2 UAV Cruise speed moving from a creek to another.
Table 3. Flight details for the second UAV, which collected RGB images over marshes, creeks, and main channel.
CharacteristicsSalt MarshCreeks + Main Channel
Flight modeAutomatic pilotAutomatic pilot
Total length2 km1.1 km
Number of waypoints2310
Flight duration≈12 min≈12 min
Flight altitude105 m MSL105 m MSL
Average cruising speed40 km/h30 km/h
Table 4. The main ArcPy and ArcMap tools used to process the RGB images.
Arcpy. ToolsInputOutput
MLclassifyRGB nadir image and Classification fileClassified raster (in our case, two classes)
RasterToPolygon_conversionClassified rasterPolygon feature
AddGeometryAttributes_managementPolygon featurePolygon geometric properties (area and centroid)
WarpFromFileRGB nadir image and polygons centroidsGeorectified RGB image
Table 5. For each waypoint and flight over the channels, a dot indicates that at least one velocity vector was computed. Refer to Figure 5 for a planar view of the waypoints. Refer to Table 1 for the initial time of the flight.
Flight
WP
10/28/201910/29/2019Flight
WP
10/28/201910/29/2019
C128C228C328C129C229C329C128C228C328C129C229C329
1 7
2 8
3 9
4 10
5 TOT714977
6
Table 6. For each waypoint and flight over the marshes, a dot indicates that at least one velocity vector was computed. Refer to Figure 5 for a planar view of the waypoints. Refer to Table 1 for the initial time of the flight.
Flight WP10/28/201910/29/2019Flight WP10/28/201910/29/2019
M128M228M328M129M229M329M128M228M328M129M229M329
1 13
214
3 15
4 16
5 17
6 18
7 19
8 20
9 21
10 22
11 23
12TOT151519121410
Table 7. Surface water flow velocity and direction measured using an ADCP and calculated using dye clouds detected by our image processing algorithm. For the velocity, the relative and absolute errors are reported. For the direction, only the absolute error is reported. The direction was measured in degrees from the east (counterclockwise).
Parameter\FlightC128C328C329M328M329MAE/MRE
Velocity ADCP [m/s]0.490.700.600.140.37-
Velocity DYE [m/s]0.430.660.640.130.38
Relative Error [%]13.96.06.27.72.67.31
Absolute Error [m/s]0.060.04−0.040.01−0.010.032
Direction ADCP [°E]214.219.819.016.324.4-
Direction DYE [°E]206.725.522.523.522.2
Absolute Error [°E]7.55.7−3.5−7.22.25.22