Article

Pressure Sensing Technique for Observing Seabed Deformation Caused by Submarine Sand Wave Migration

1
Shandong Provincial Key Laboratory of Marine Environment and Geological Engineering, Ocean University of China, Qingdao 266100, China
2
Laboratory for Marine Geology, Qingdao National Laboratory for Marine Science and Technology, Qingdao 266061, China
*
Author to whom correspondence should be addressed.
J. Mar. Sci. Eng. 2020, 8(5), 315; https://doi.org/10.3390/jmse8050315
Submission received: 12 April 2020 / Revised: 26 April 2020 / Accepted: 28 April 2020 / Published: 30 April 2020
(This article belongs to the Special Issue New Advances in Marine Engineering Geology)

Abstract

:
Long-term, continuous in-situ observation of seabed deformation plays an important role in studying the mechanisms of sand wave migration and engineering early warning methods. Research on pressure sensing techniques has examined the possibility of using the temporal characteristics of the vertical deformation of the seafloor to identify important factors (e.g., wave height and migration rate) of submarine sand wave migration. Two pressure sensing tools were developed in this study to observe the seabed deformation caused by submarine sand wave migration (a fixed-depth total pressure recorder (TPRFD) and a surface synchronous bottom pressure recorder (BPRSS)), based on the principle that as a sand wave migrates under hydrodynamic forcing, the near-bottom water pressure, bottom pressure and total fixed pressure synchronously change with time. Laboratory flume experiments were performed, using natural sandy sediments taken from the beach of Qingdao, China, to better present and discuss the feasibility and limitations of using these two pressure sensing methods to acquire continuous observations of seabed deformation. The results illustrate that the proposed pressure sensor techniques can be effectively applied in reflecting elevation caused by submarine sand wave migration (the accuracy of the two methods in observing the experimental bed morphology was more than 90%). However, an unexpected step-like process of the change in sand wave height observed by BPRSS is presented to show that the sensor states can be easily disturbed by submarine environments, and thus throw the validity of BPRSS into question. Therefore, the TPRFD technique is more worthy of further study for observing submarine sand wave migration continuously and in real-time.

1. Introduction

Submarine sand waves are approximately regular undulating landforms [1] formed by the movement of sandy sediments under various marine hydrodynamic forces, such as ocean currents [2], tidal currents [3] and internal waves [4]. Submarine sand waves are widely distributed across continental slopes [5,6], continental shelves [7,8], straits [9,10], gulfs [11], and other geomorphic units around the world, in shallow to deep seas. Under the action of ocean dynamics, sand waves undergo periodic migration movements, and rates can reach nearly 70 meters per year [12,13]. From this process, vertical deformation may spur the suspension or burial of submarine cables [3,14] and submarine pipelines [8,15], which can seriously damage them. Therefore, the observation and study of the geomorphic morphology of seabed sand waves has attracted the attention of numerous researchers.
At present, the positioning and repeated measurement of water depths is used to observe the migration of seabed sand waves. By analyzing high-precision digital terrain model (DTM) data measured at several time points in a study area, the average rate and direction of sand wave migration for a given period can be obtained [16,17]. DTM data obtained from multi-beam water depth measurements can also be used to calculate the rate of seabed sand wave migration by profile analysis [13,18]. Franzetti [7] used the spatial cross-correlation three-dimensional analysis approach to analyze and calculate the horizontal migration rate and the vertical variation of sand waves. Zhou [19] also used three sets of repeated multi-beam sounding data for 2011–2013 to study the first migration and changes of giant sand wave fields in the Taiwan Shoal in the northern South China Sea. However, because these methods depend on ship operations, they cannot be used to observe continuous changes in height, due to weather, sea conditions and cost constraints.
In-situ integrated observation techniques have been developed to better understand processes and mechanisms of sand wave migration at finer scales since the late 20th Century. Fixed flow meters and small bottom observation platforms, equipped with scan sonar and acoustic backscattering, have been used to observe sand wave surfaces, the dynamic sand wave processes on bottom surfaces [20], variations in sediment velocity on sand wave surfaces [21] and sand ripple variations with rising tides [22]. However, because these acoustic or optical instruments are not only susceptible to the concentration of suspended sediments in near-surface water, but also generate a lot of power consumption during the actual operation, they might not always meet the need for continuous on-site observations in sand wave areas.
Due to their stability and environmental adaptability, pressure sensors have increasingly been used for sea floor height measurements [23,24,25,26] and vertical seabed deformation observations [27,28,29] since the 1990s. Japan’s MH21 plan for the exploitation of natural gas hydrates in Japan’s seabed involves formation subsidence monitoring at a precision level of 10 mm [30]. In the North Sea, high-precision water pressure measurement technology is used to monitor seabed subsidence [31]. These successful cases highlight possibilities to apply pressure sensing technology in the study of seabed sand wave migration.
In view of this summary of past research, this paper focuses on the application of pressure sensing techniques in the study of sand wave migration. Based on the principle of vertical pressure change caused by sand wave migration, two observation methods were designed and verified by indoor water flume tests. The work presented in this paper can guide the monitoring and early detection of submarine sand wave migration, and be used to better understand mechanisms of submarine sand wave migration.

2. Materials and Methods

2.1. Theory

When using pressure sensing technology to continuously observe the height of the sea floor, the position of the observation point must first be determined. Assuming that the observation point is located at the trough of the initial position of a sand wave (solid line), under hydrodynamic action, the sand wave migrates to the left toward the dotted line (Figure 1). According to the pressure change law acting on the sand wave profile during this process, the bottom pressure (PB) at the observation point mainly includes the hydrostatic pressure determined by the sea floor surface height (H) and dynamic water pressure created by the waves and current (ΔPN). The total pressure change (ΔPT) is mainly shaped by changes in the soil–water pressure ratio’s contribution to total pressure created by ΔH, and by changes in dynamic water pressure caused by waves and currents. Therefore, in combining the device arrangement depth of the in-situ observation (b) with the near-bottom pressure sensor mounting height (a), it can be deduced that there is a relationship (shown by Equations (1) and (2)) between ΔH, and ΔPB and ΔPT.
Δ H = ( Δ P B Δ P N ) / ρ w g ,
Δ H = a · ( Δ P T Δ P N ) / ( P T 0 P N 0 ρ w gb ) ,
Δ P T = Δ H · γ + Δ P N ,
where ρ w is the density of seawater, g is gravity acceleration, γ is the buoyant unit weight of the seabed sediment; PT0 is the total fixed-depth pressure level at the time of initial recording and PN0 is the near-bottom pressure level at the time of initial recording.
Thus, both PT and PN can be used to measure vertical height changes of the sea floor caused by sand wave migration. Based on this, we propose two tools for observing the vertical deformation of the sea floor caused by sand wave migration: (a) a fixed-depth total pressure recorder (TPRFD) kept at a certain depth within a sand wave at the observation point and (b) a surface synchronous bottom pressure recorder (BPRSS) kept at the surface of a sand wave at the point of observation.

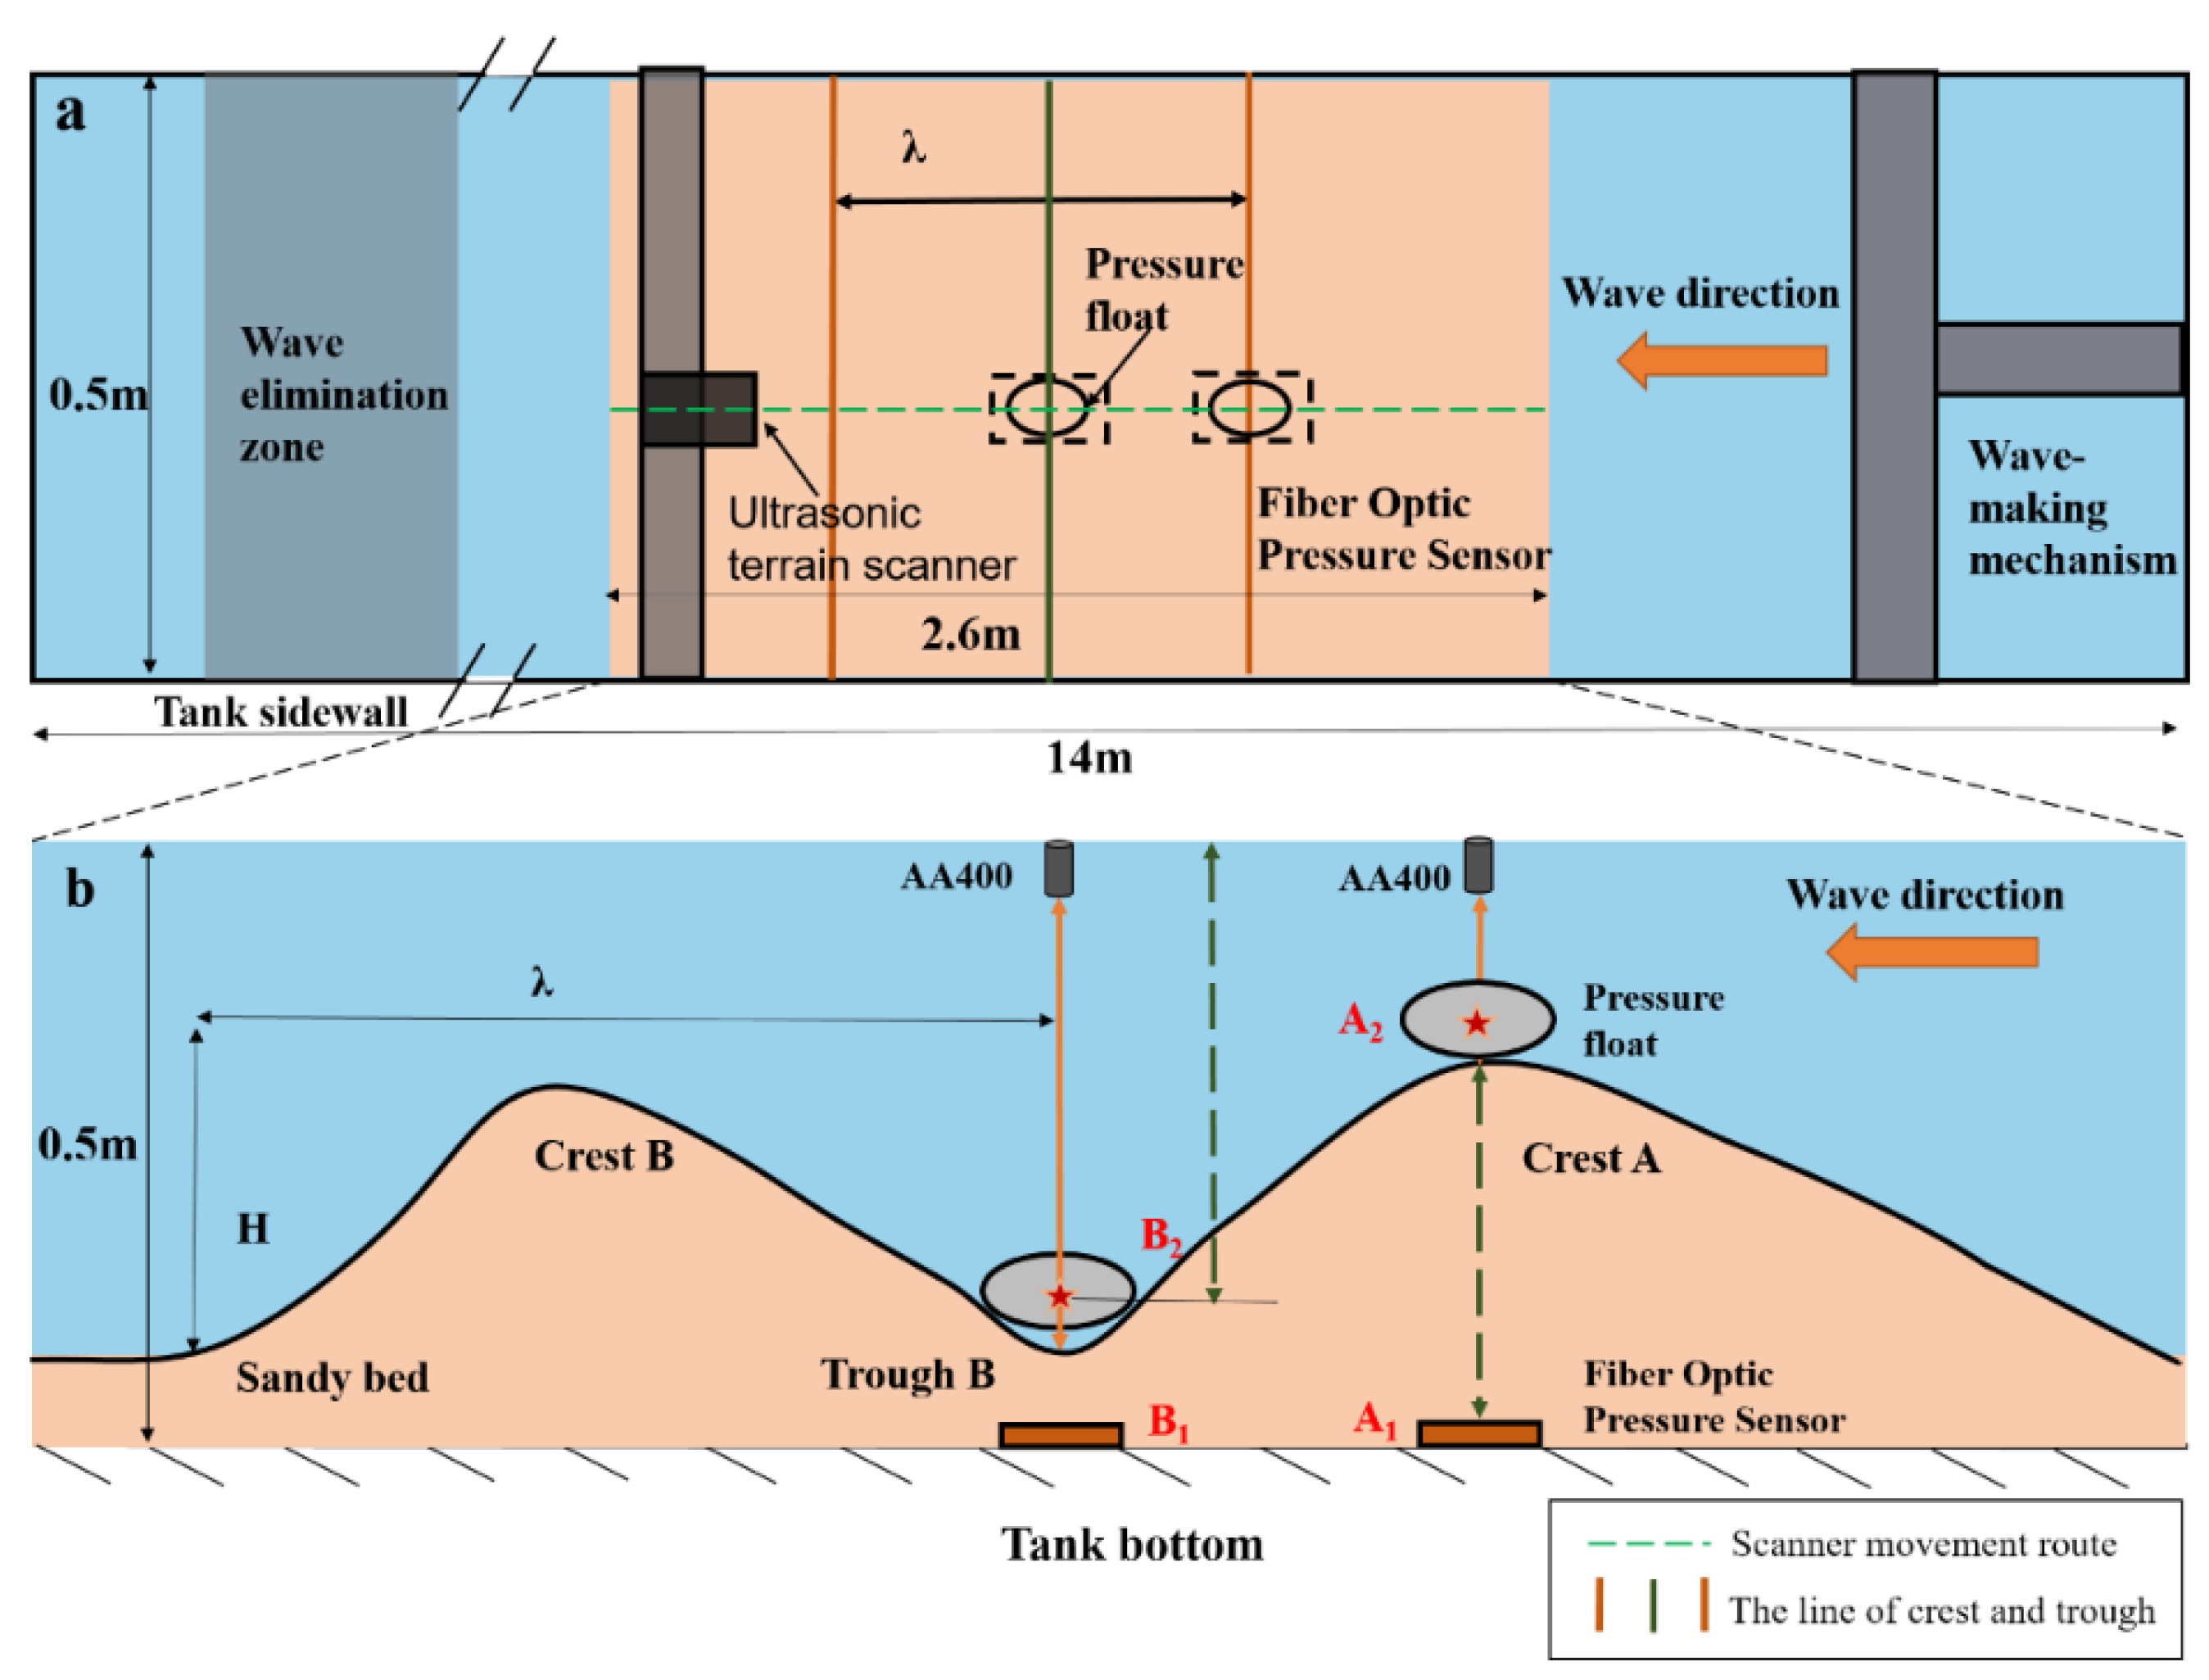
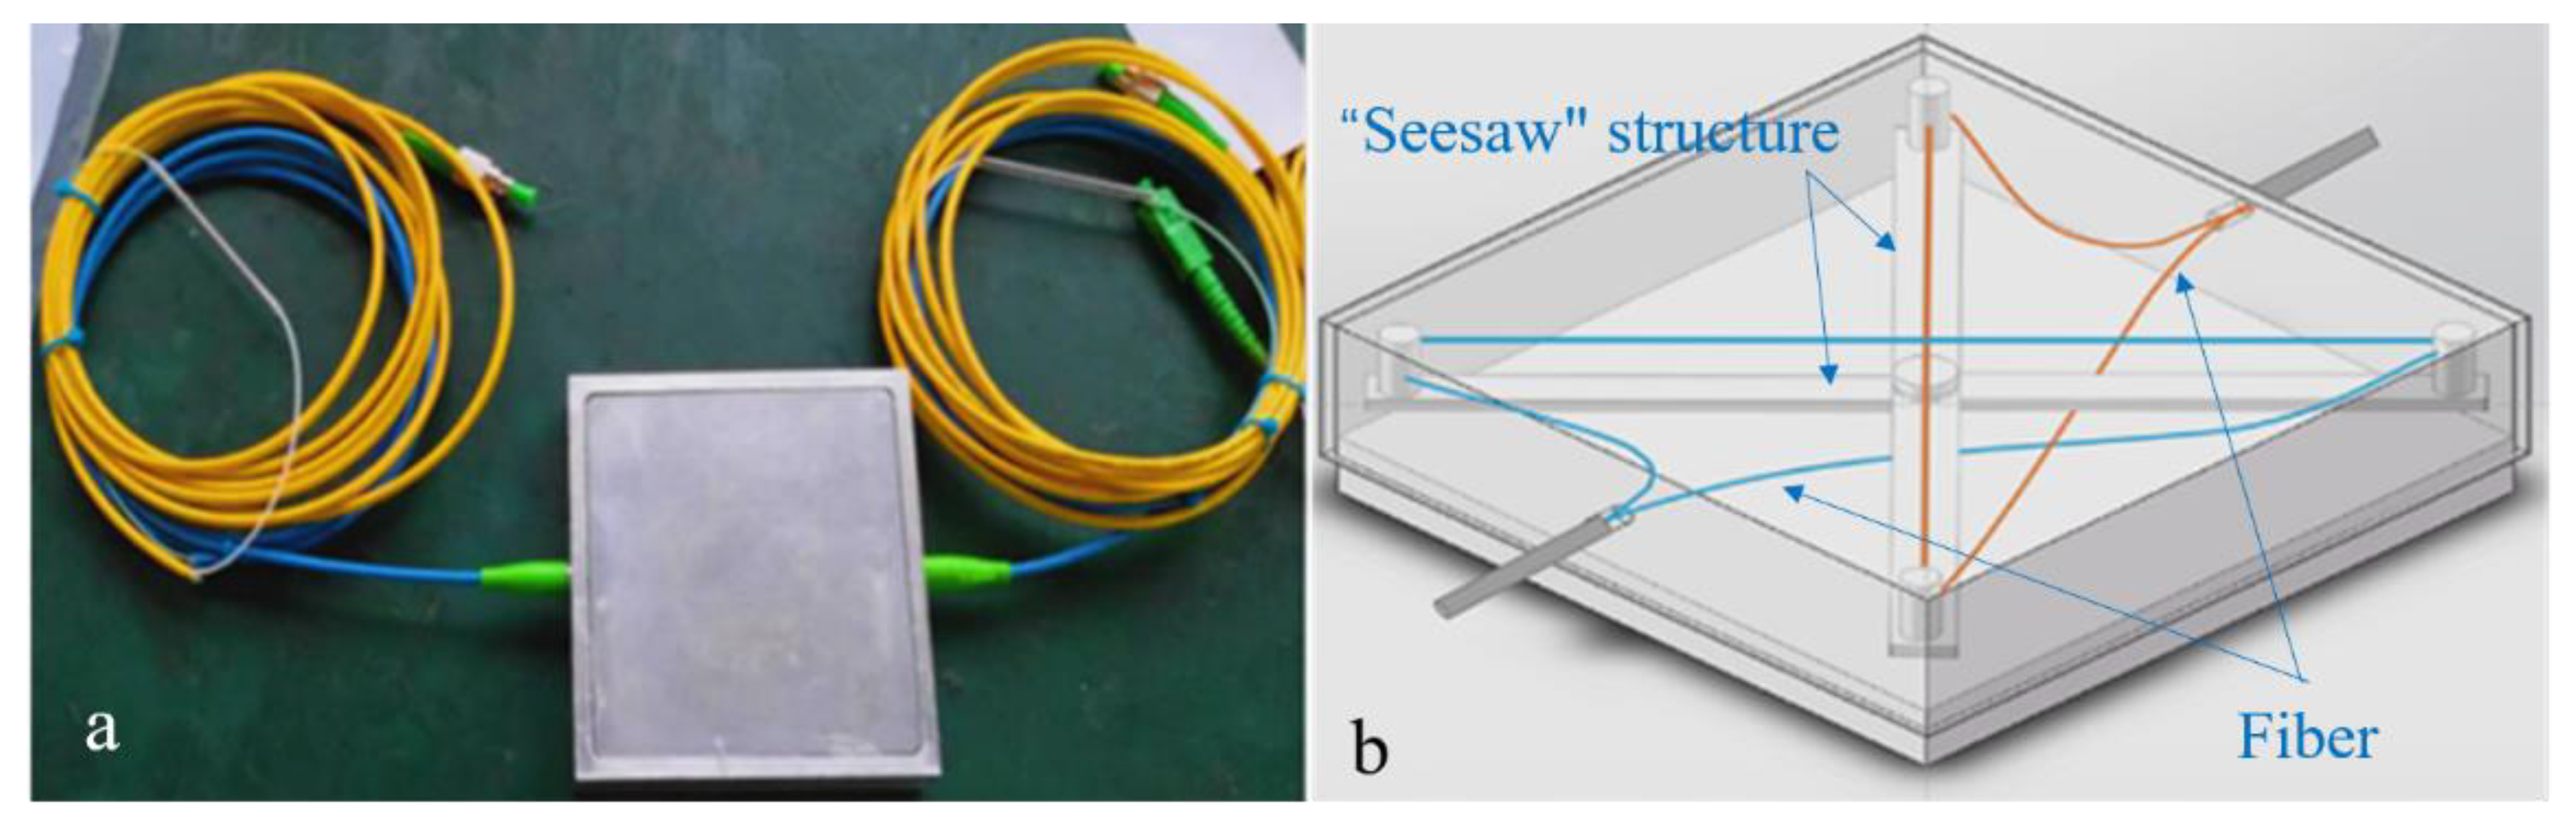
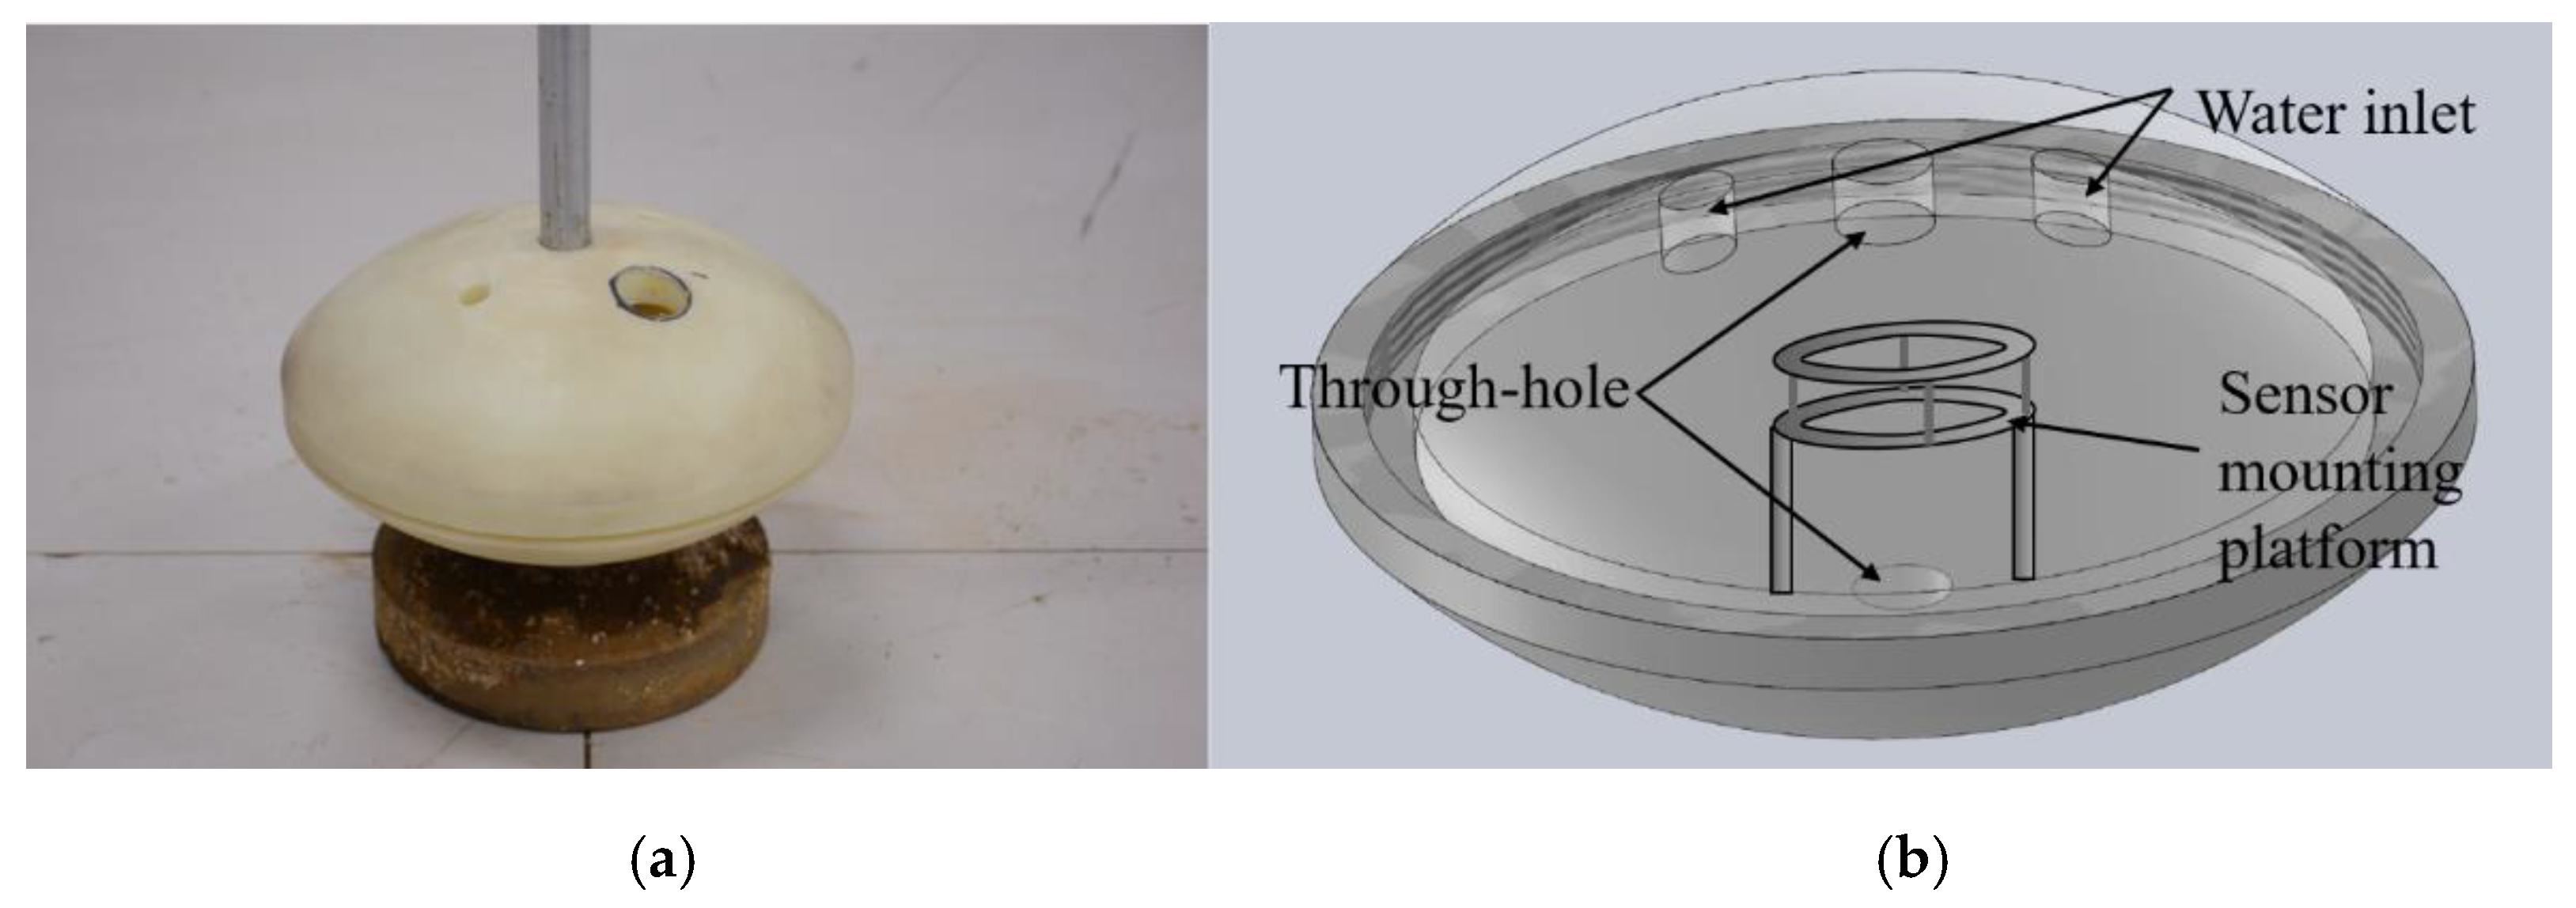
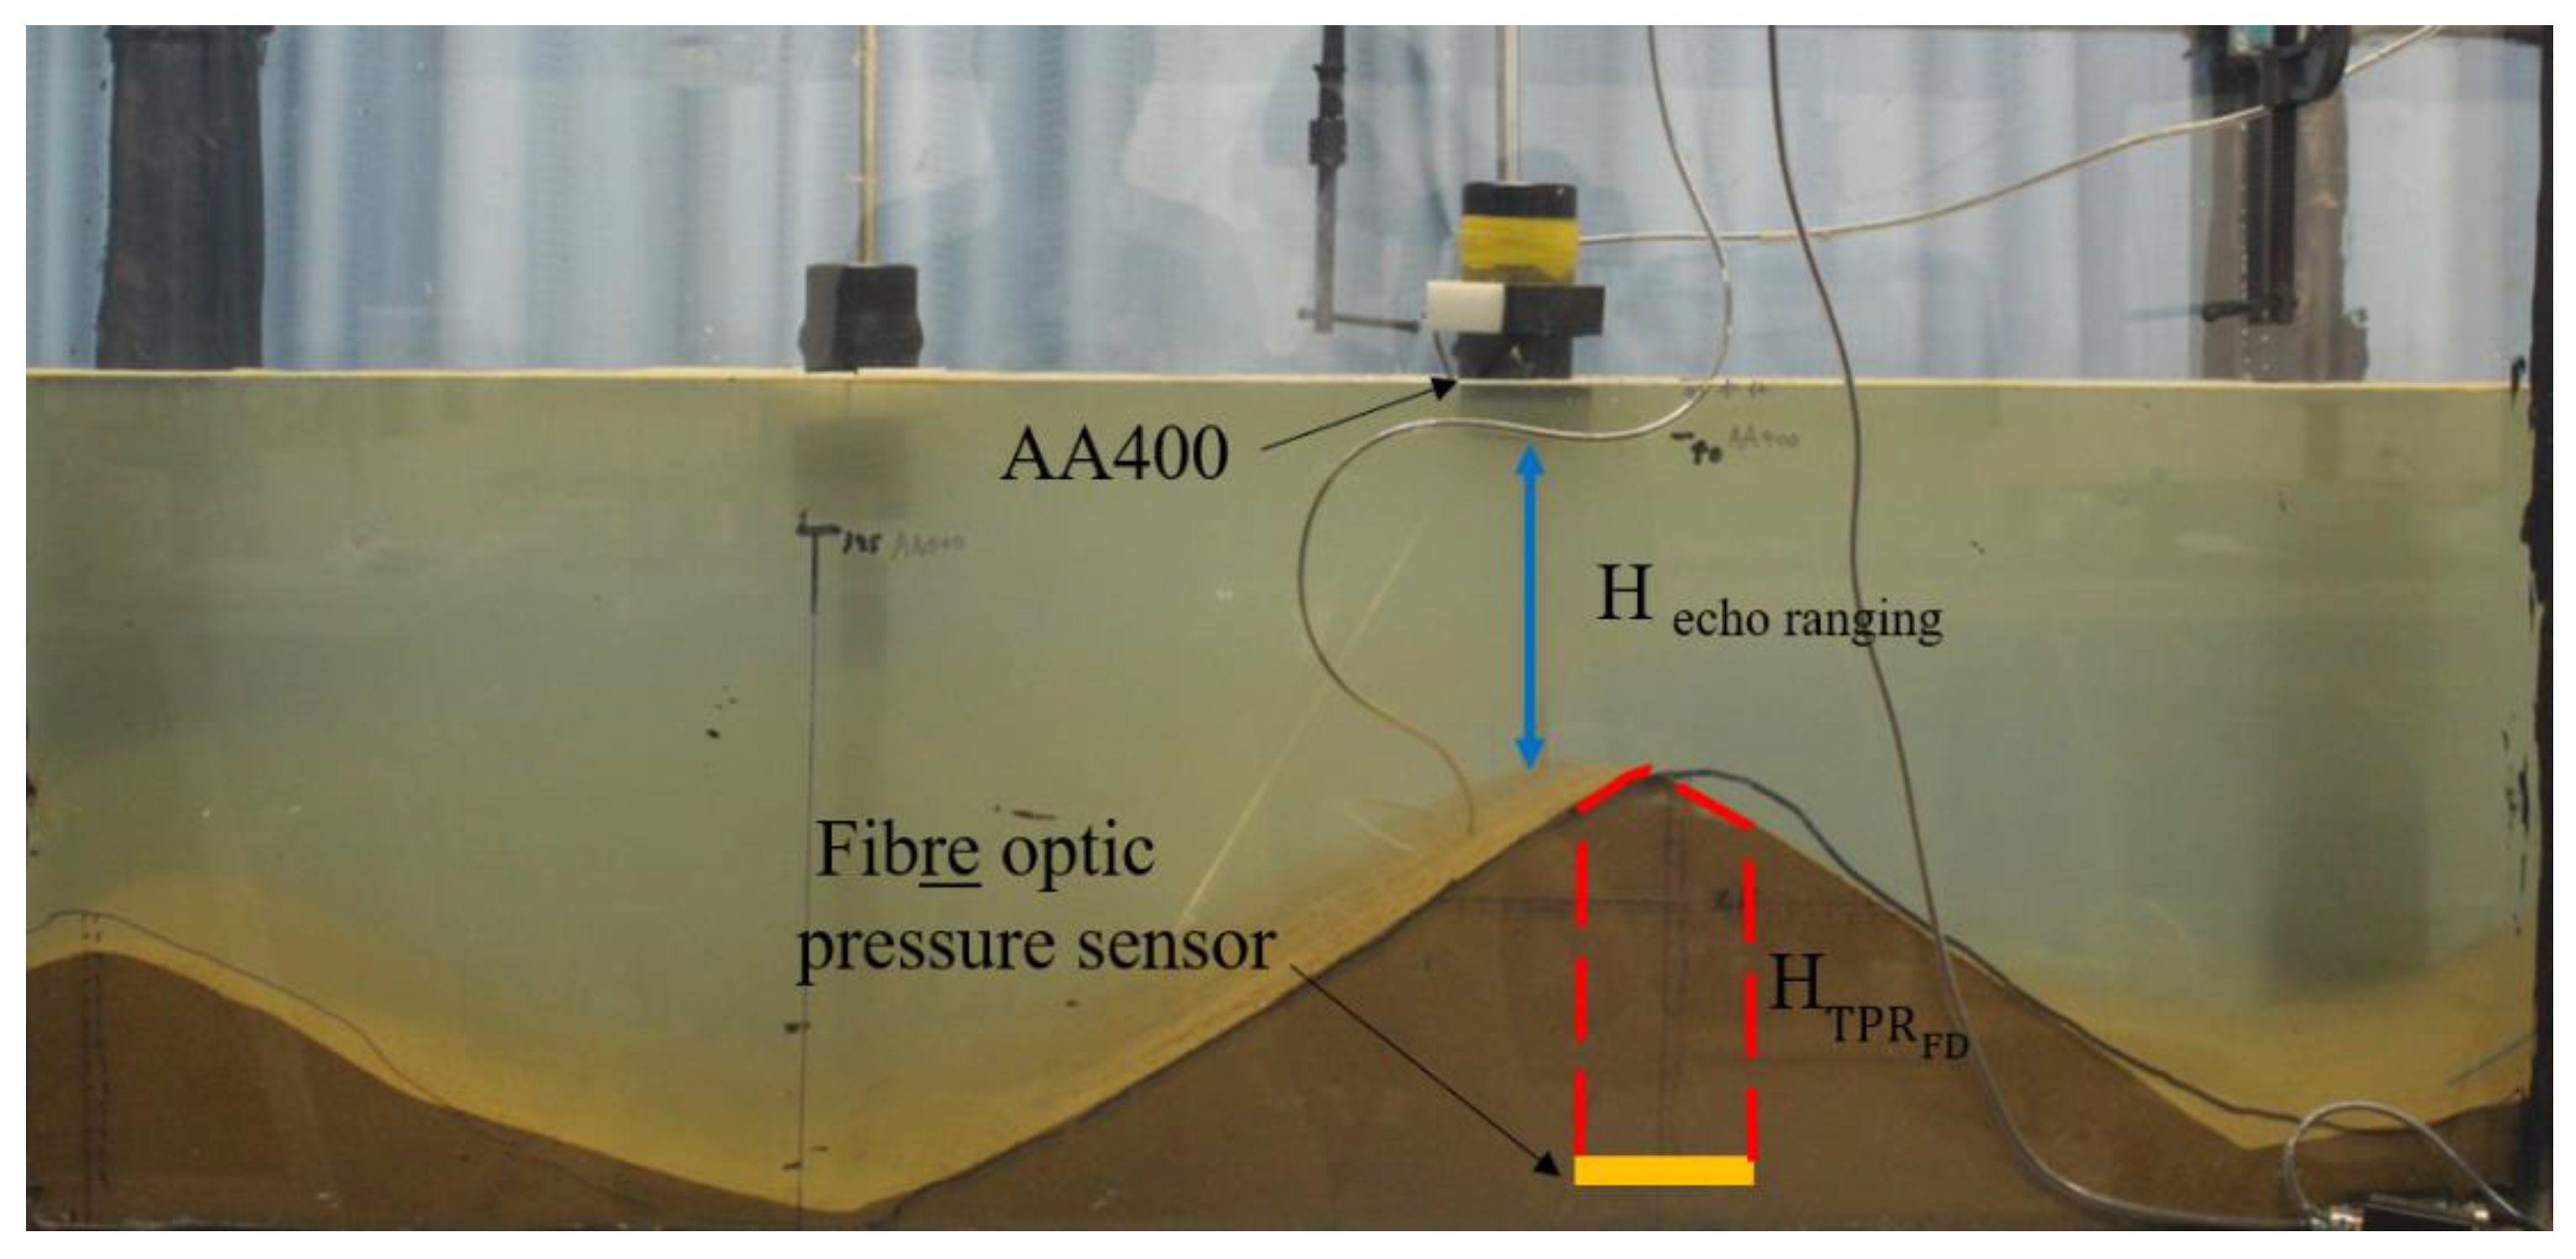
2.2. Experimental Set-Up and Arrangement
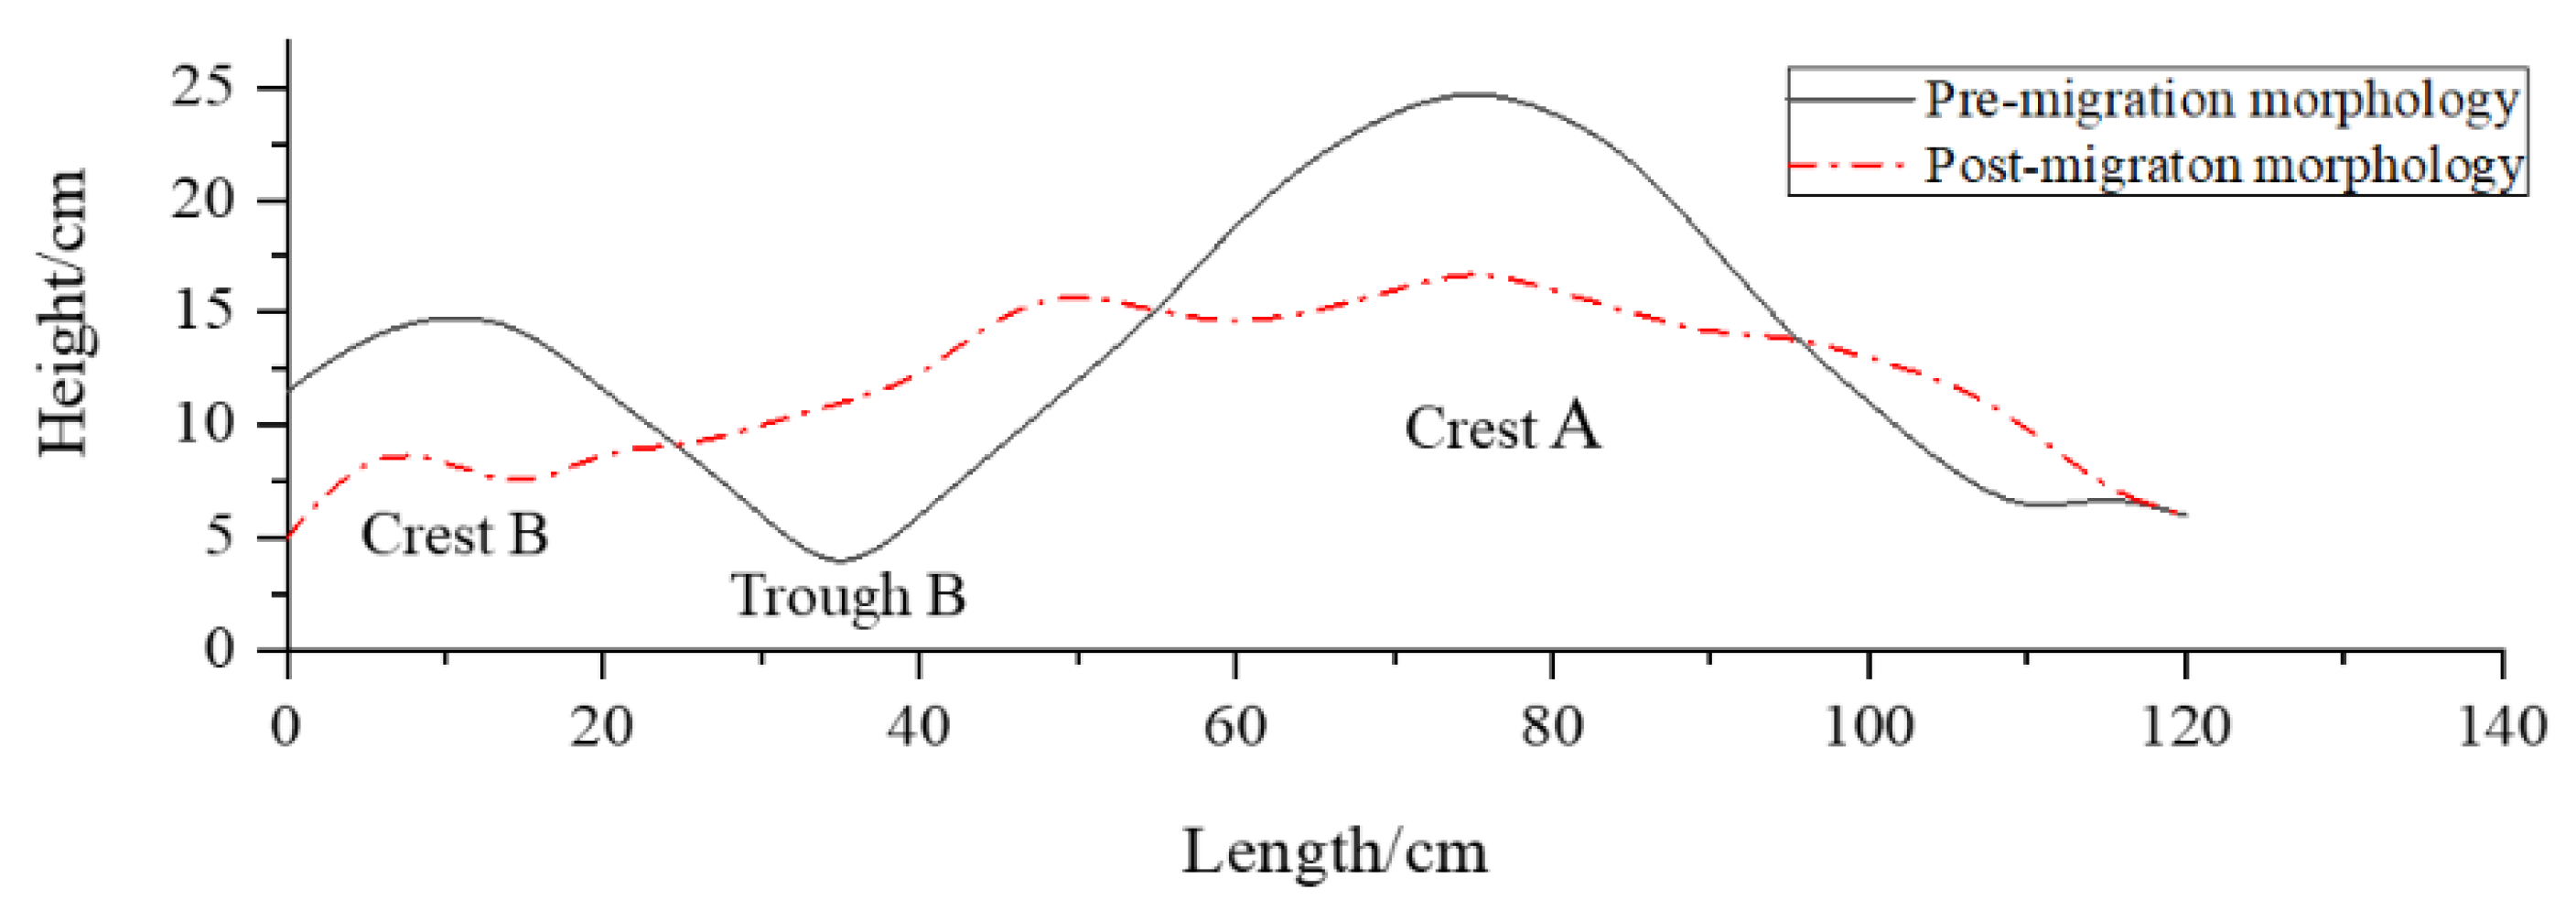
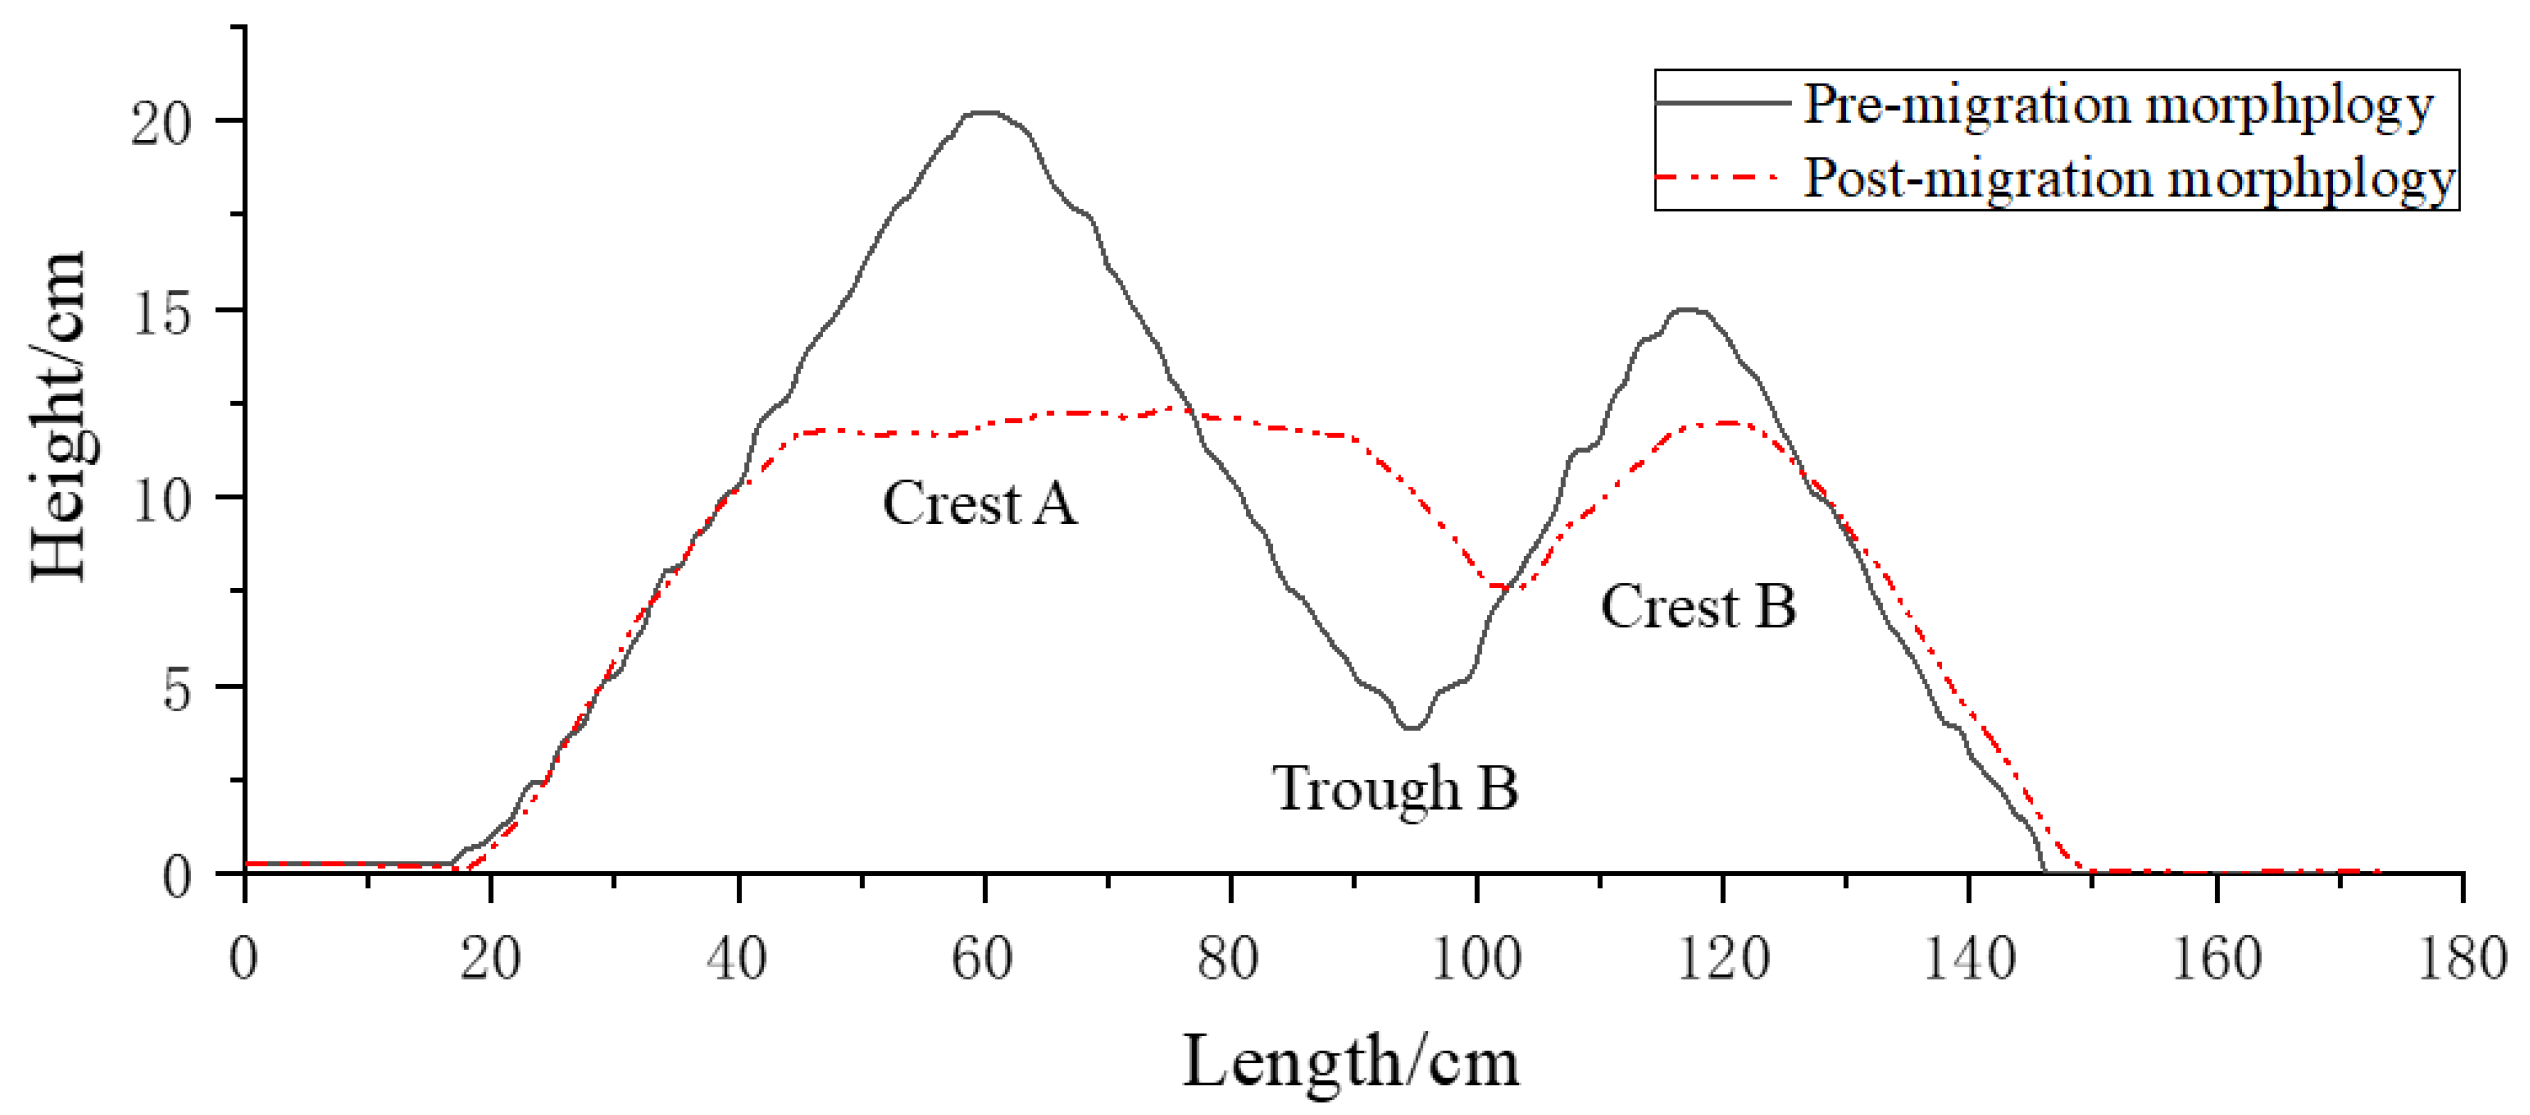
To verify the feasibility of the above two methods, a physical model test was carried out in the wave flume (14.0 m × 0.5 m × 1.3 m) (Figure 2) housed at the Environmental Geotechnical Laboratory of the College of Environmental Science and Engineering, Ocean University of China. The 2.6 m wave-shaped test bed (Figure 2b) used to simulate sand wave terrain was filled with sand samples (Qingdao Beach, China) (Table 1). A wave generator with a wave frequency of 0.2 to 50 Hz was fixed to the right end of the water flume to form a wave with a controllable wave height and frequency (Figure 2a). A permeable slope with a slope of 1:4 was set on the left side of the sink to eliminate the influence of reflected waves (Figure 2a). The two side walls of the sink are made from transparent tempered glass to easily observe test phenomena and markings.
The traditional electrical pressure sensor is easily affected by its own thermal effect and poor linearity, while the optical fiber pressure sensor is small in size, highly sensitive and stable, and responds directly to pressure changes. Therefore, because the measurement performance of a pressure sensor directly determines the accuracy of the ocean observation depth [32], in this experiment, the optical fiber pressure sensor (Suzhou NanZee Sensing Technology Co., Ltd., Suzhou, China) was used to observe the total pressure level. The sensor is 100 mm × 100 mm × 19.2 mm in size, and the interior of it is designed as a “Seesaw” structure (Figure 3). The pressure was measured from the change in the strain wavelength (P1, P2) caused by the change in the force of the two fibers installed on the seesaw structure. With no stress, the strain wavelengths of the two fibers were: P1 = 1538.22 nm and P2 = 1546.303 nm. The pressure calculation formula is W = K P × ( Δ P 1 + Δ P 2 ) where W is the weight of the overlying object, and ∆P1 and ∆P2 are the changes in the strain wavelength after being stressed. The NZS-FBG-A01 (M) multi-channel fiber grating sensor demodulation module (Suzhou NanZee Sensing Technology Co., Ltd., Suzhou, China) was used to collect and demodulate the data measured by the fiber sensor. It is a high-resolution Bragg grating sensor demodulation system and a high-precision spectrum analysis system. The resolution of the demodulation wavelength is 0.1 pm and the speed of demodulation is 1 Hz. The central wavelength, peak value and wavelength scanning reflection spectrum of the optical fiber pressure sensor can be output to the computer connected to the demodulation module in real-time through the USB cable. After using standard weights, increasing the number of weights step by step, and combining calculation formulas to calibrate the sensors in the test environment, parameter KP is 290.3 g/nm, and the linear equation is W X = 290.3 × ( Δ P 1 X + Δ P 2 X ) .
Whether the height of the bottom pressure sensor can synchronously change with the height of the sea floor at the observation point is key to whether the BPRSS method can be used for observation. Therefore, a float with a density value between those of the sand bed and water was designed to carry the pressure sensor. Float spheres made from polyamide (PA) have a density (1.14 g/cm3) slightly greater than that of seawater (1.10 g/cm3). Because a dish-shaped object has good hydrodynamic features, to reduce measurement errors caused by the movement of the floating ball due to hydrodynamic forces, a dish-shaped floating ball was used in the test. As Figure 4 shows, the float has a diameter of 186 mm on the horizontal axis and a height of 93 mm on the vertical axis. In the middle of the upper structure of the float, a 16 mm diameter penetration hole is reserved. A smooth stainless steel rod is connected to the metal base through the floating ball penetration hole to reduce the left and right sway caused by the wave as the floating ball moves up and down. The interior is hollow, and a bracket is reserved to mount the pressure sensor. There are four through holes with a diameter of 12 mm above and below the sphere to keep internal and external hydrostatic pressure levels consistent.
The test was applied to TPRFD and BPRSS groups, and observation points were set at the crest (A1, A2) and trough (B1, B2) (Figure 2) of each group to compare the applicability of the two methods at different positions. With the exception of the pressure sensor, the layout and test conditions of the instruments used in the two groups of tests remained the same. In this test, a hydrodynamic force was applied over two stages. First, waves with a frequency of 34 Hz and a height of 7.9 cm were applied for one hour, and then waves with a frequency of 50 Hz and a height of 12.0 cm were applied for 25 min (in the experiment without any measuring instrument in advance, through direct observation, we found that when the wave action in the second stage reached 25 min, the bed shape had reached a stable state). In addition, to evaluate the accuracy of the two methods, we applied echo ranging, which has been widely used in seabed deformation measurement [33,34], as a control group. A freestyle sonar altimeter (AA400, EofE Ultrasonics Co., Ltd., Goyang-si, Korea) and an ultrasonic terrain scanner were used for the echo ranging group (Table 1). The ultrasonic terrain scanner was used to collect bottom bed morphological data before and after each test, while the AA400 made real-time observations of the bottom bed height at the observation point.

3. Results

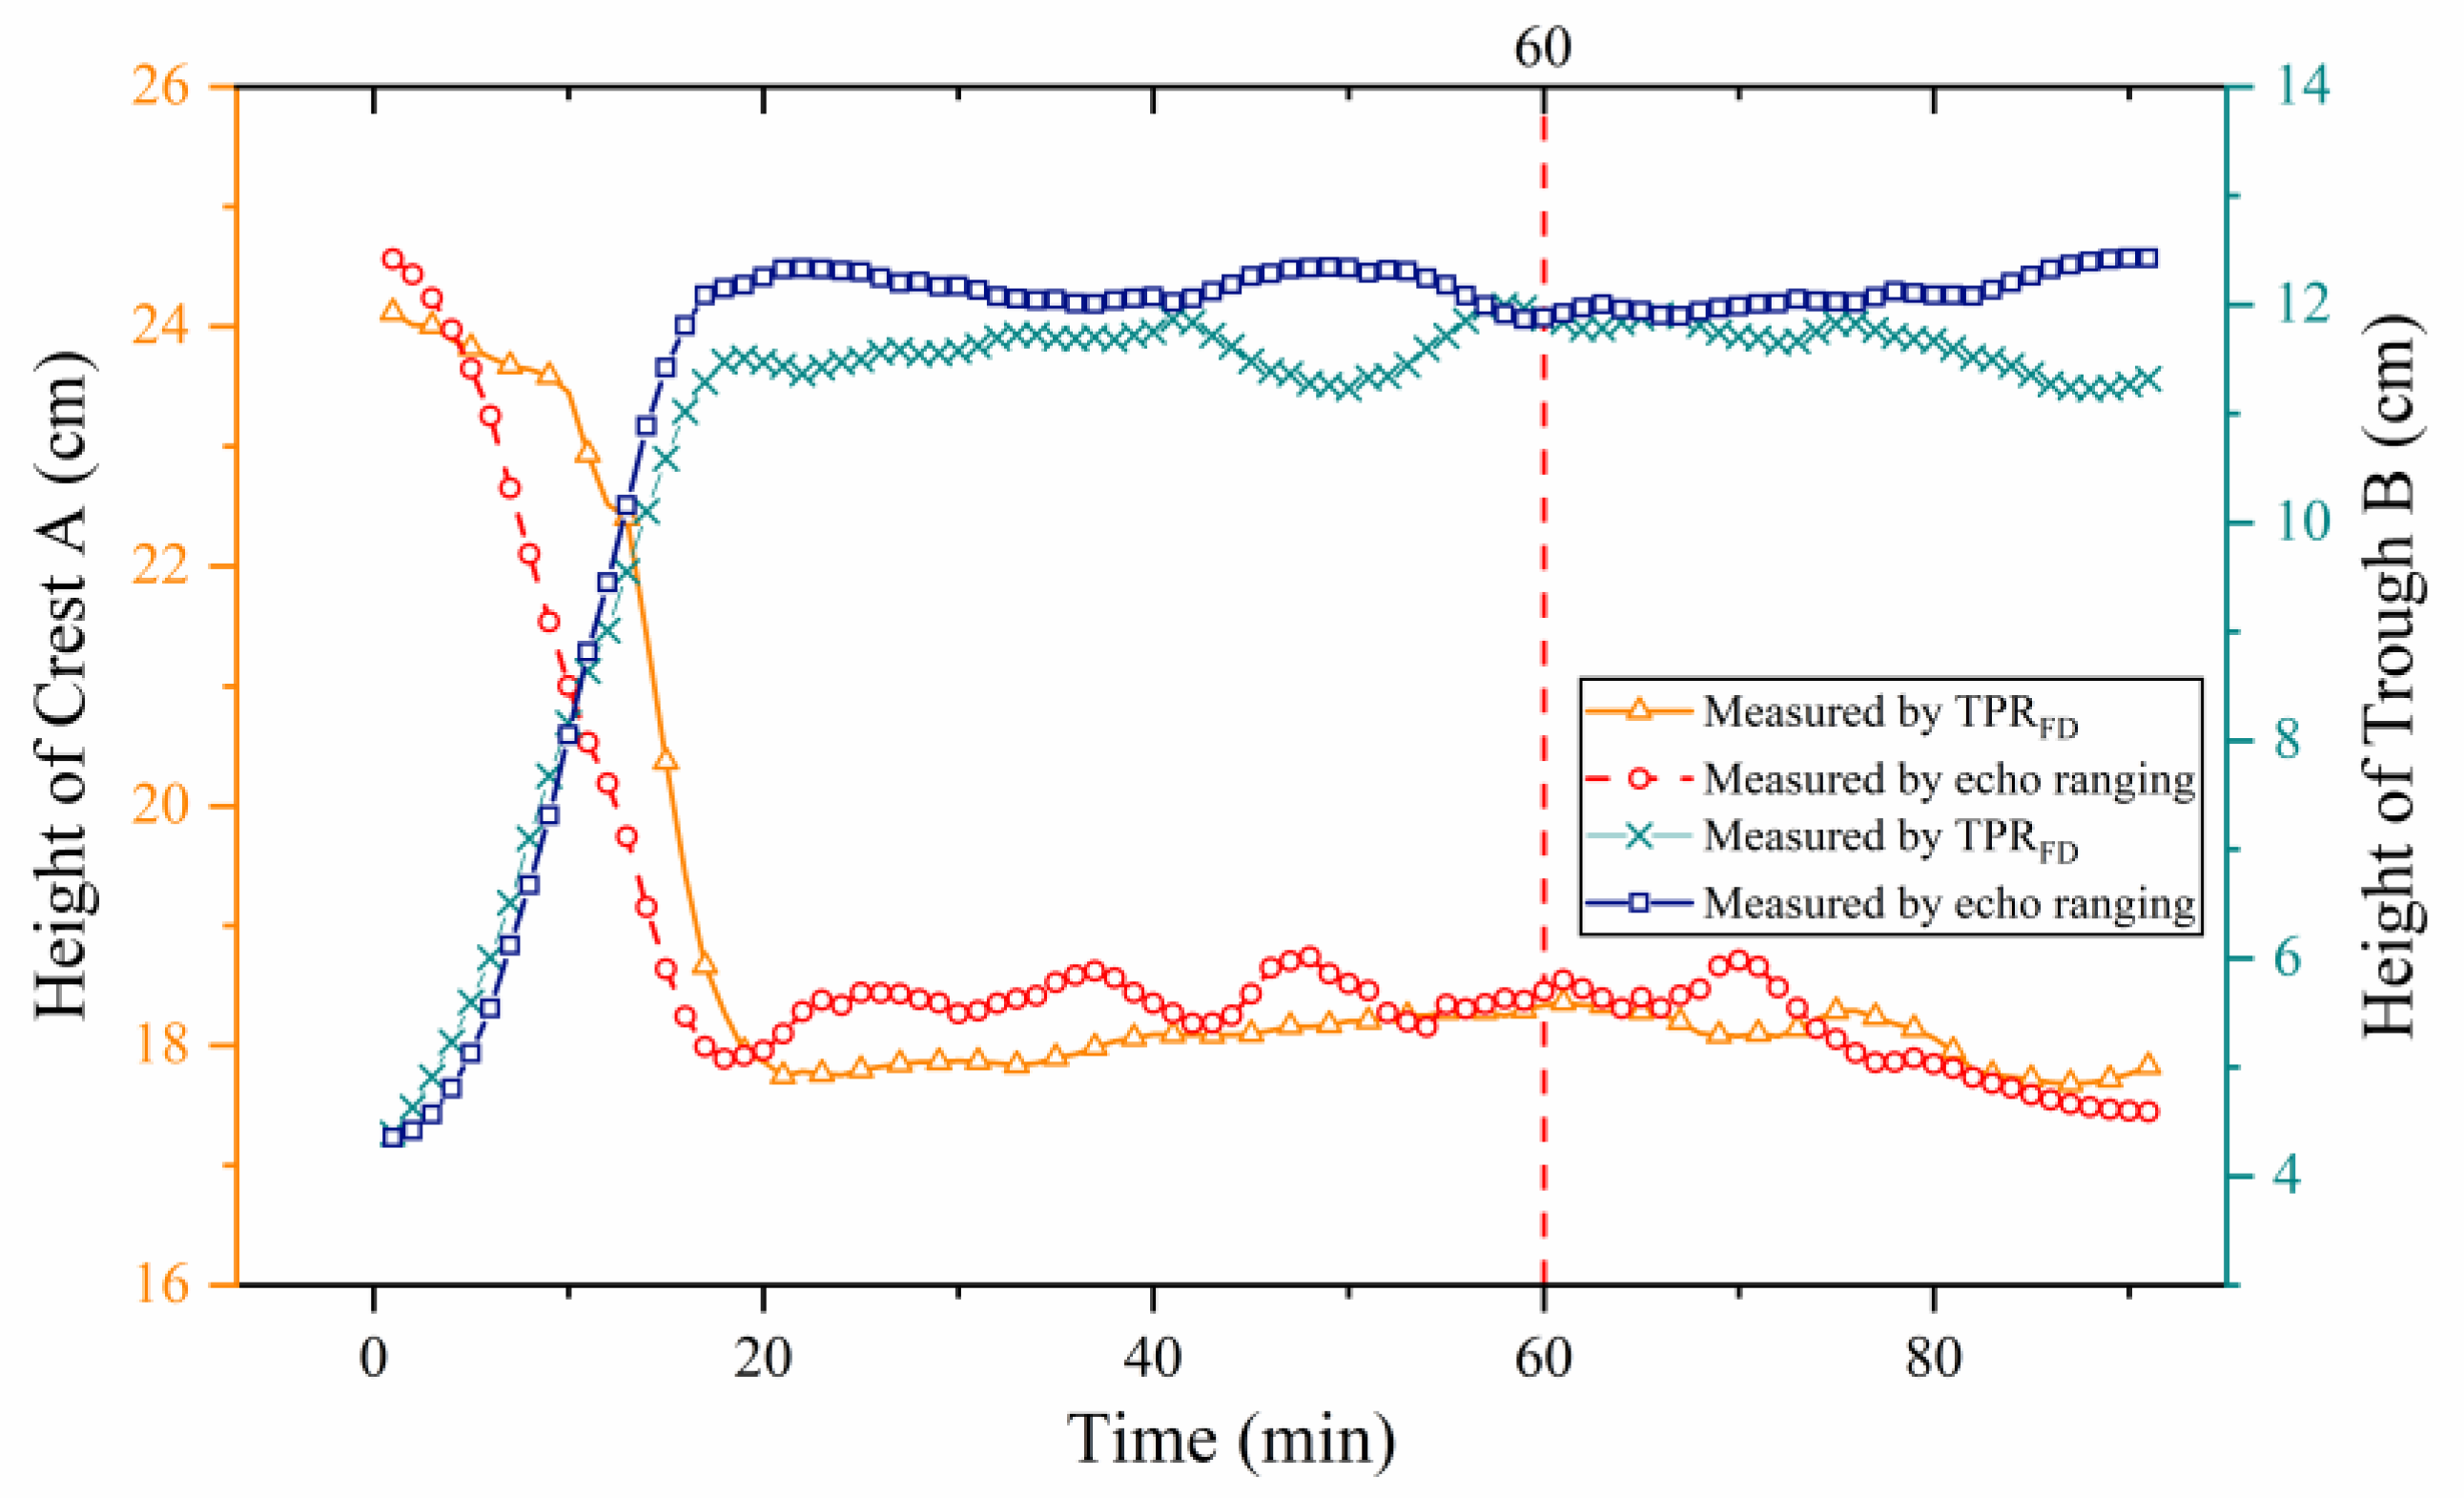
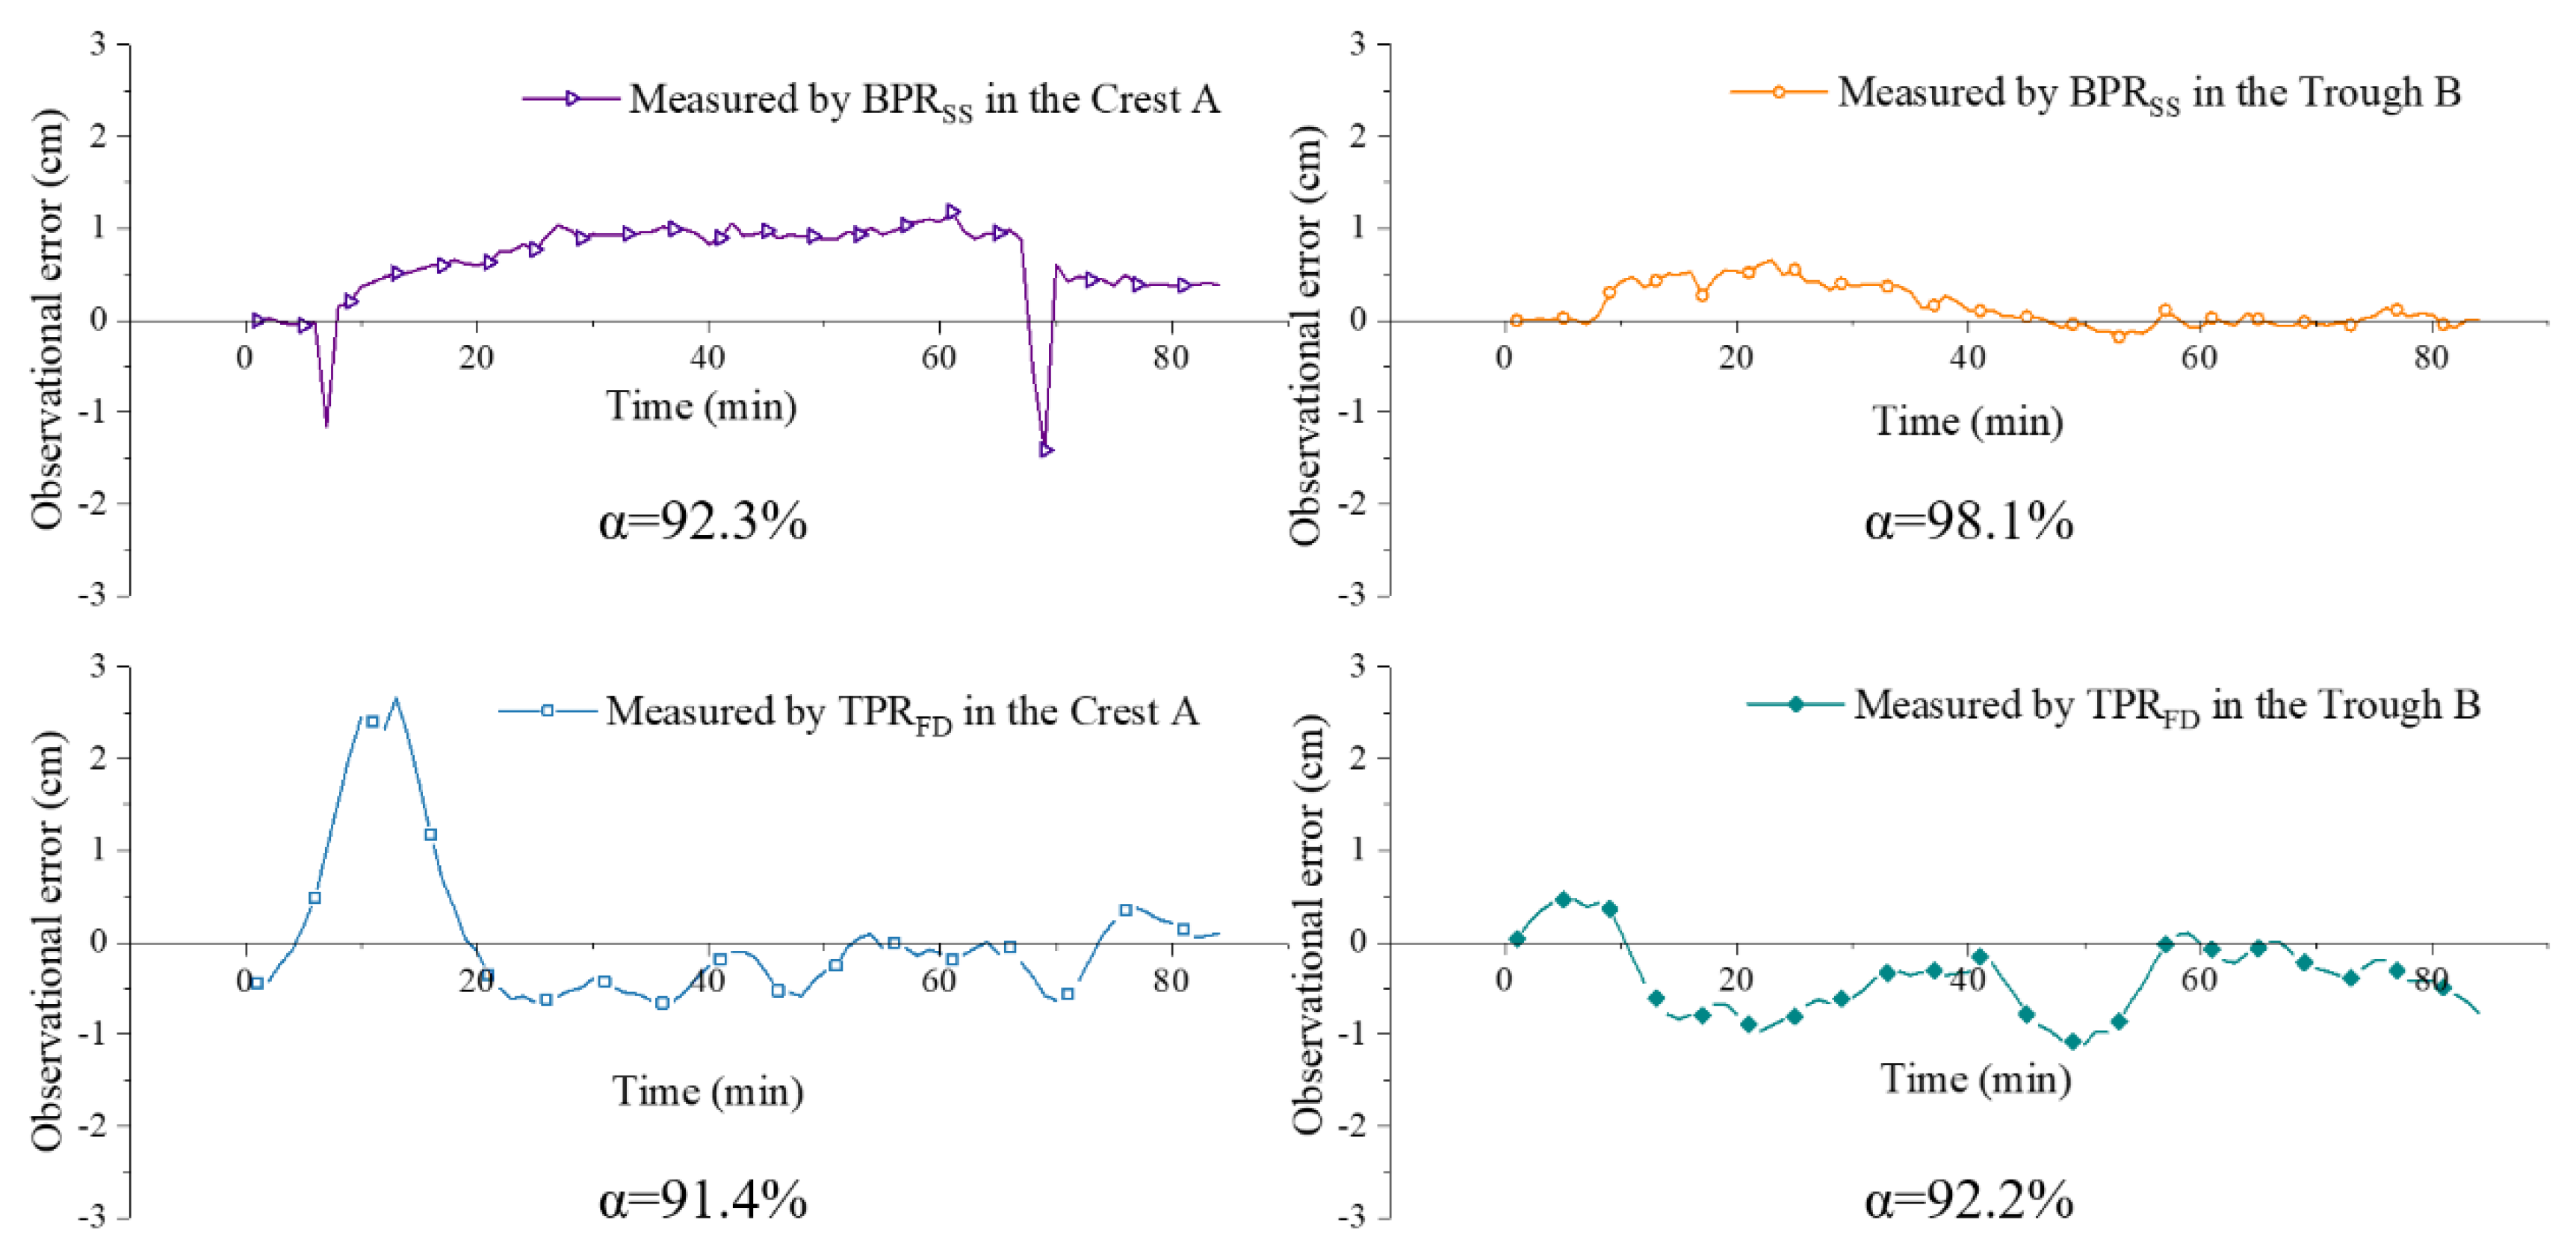
3.1. Measurements Made by the Fixed-depth Total Pressure Recorder (TPRFD)

Shown by the echo ranging group data and experimental records, the shape of the sandy bed underwent significant migration and deformation after continuous wave loading (Figure 5). The height of the bottom bed surface at observation point A1 decreased by roughly 7.0 cm, while that at B1 increased by approximately 7.9 cm. Wave crest A and trough B moved roughly 3.2 cm along the wave propagation direction.
From the measurement results of echo ranging and the TPRFD (Figure 6), overall terrain changes can be divided into two processes: (a) a sharp period of change of 0–20 min, and (b) a slow adjustment period of 20–90 min. The experimental records show that wave crest flattening and wave trough filling processes mainly occurred during the period of sharp change. During this period, the positions of wave crests and troughs moved roughly 2 cm along the wave propagation direction, and the terrain was gentle overall. The height remained basically stable, and the terrain slowly moved in the wave propagation direction and then moved roughly 3.2 cm relative to the original terrain.

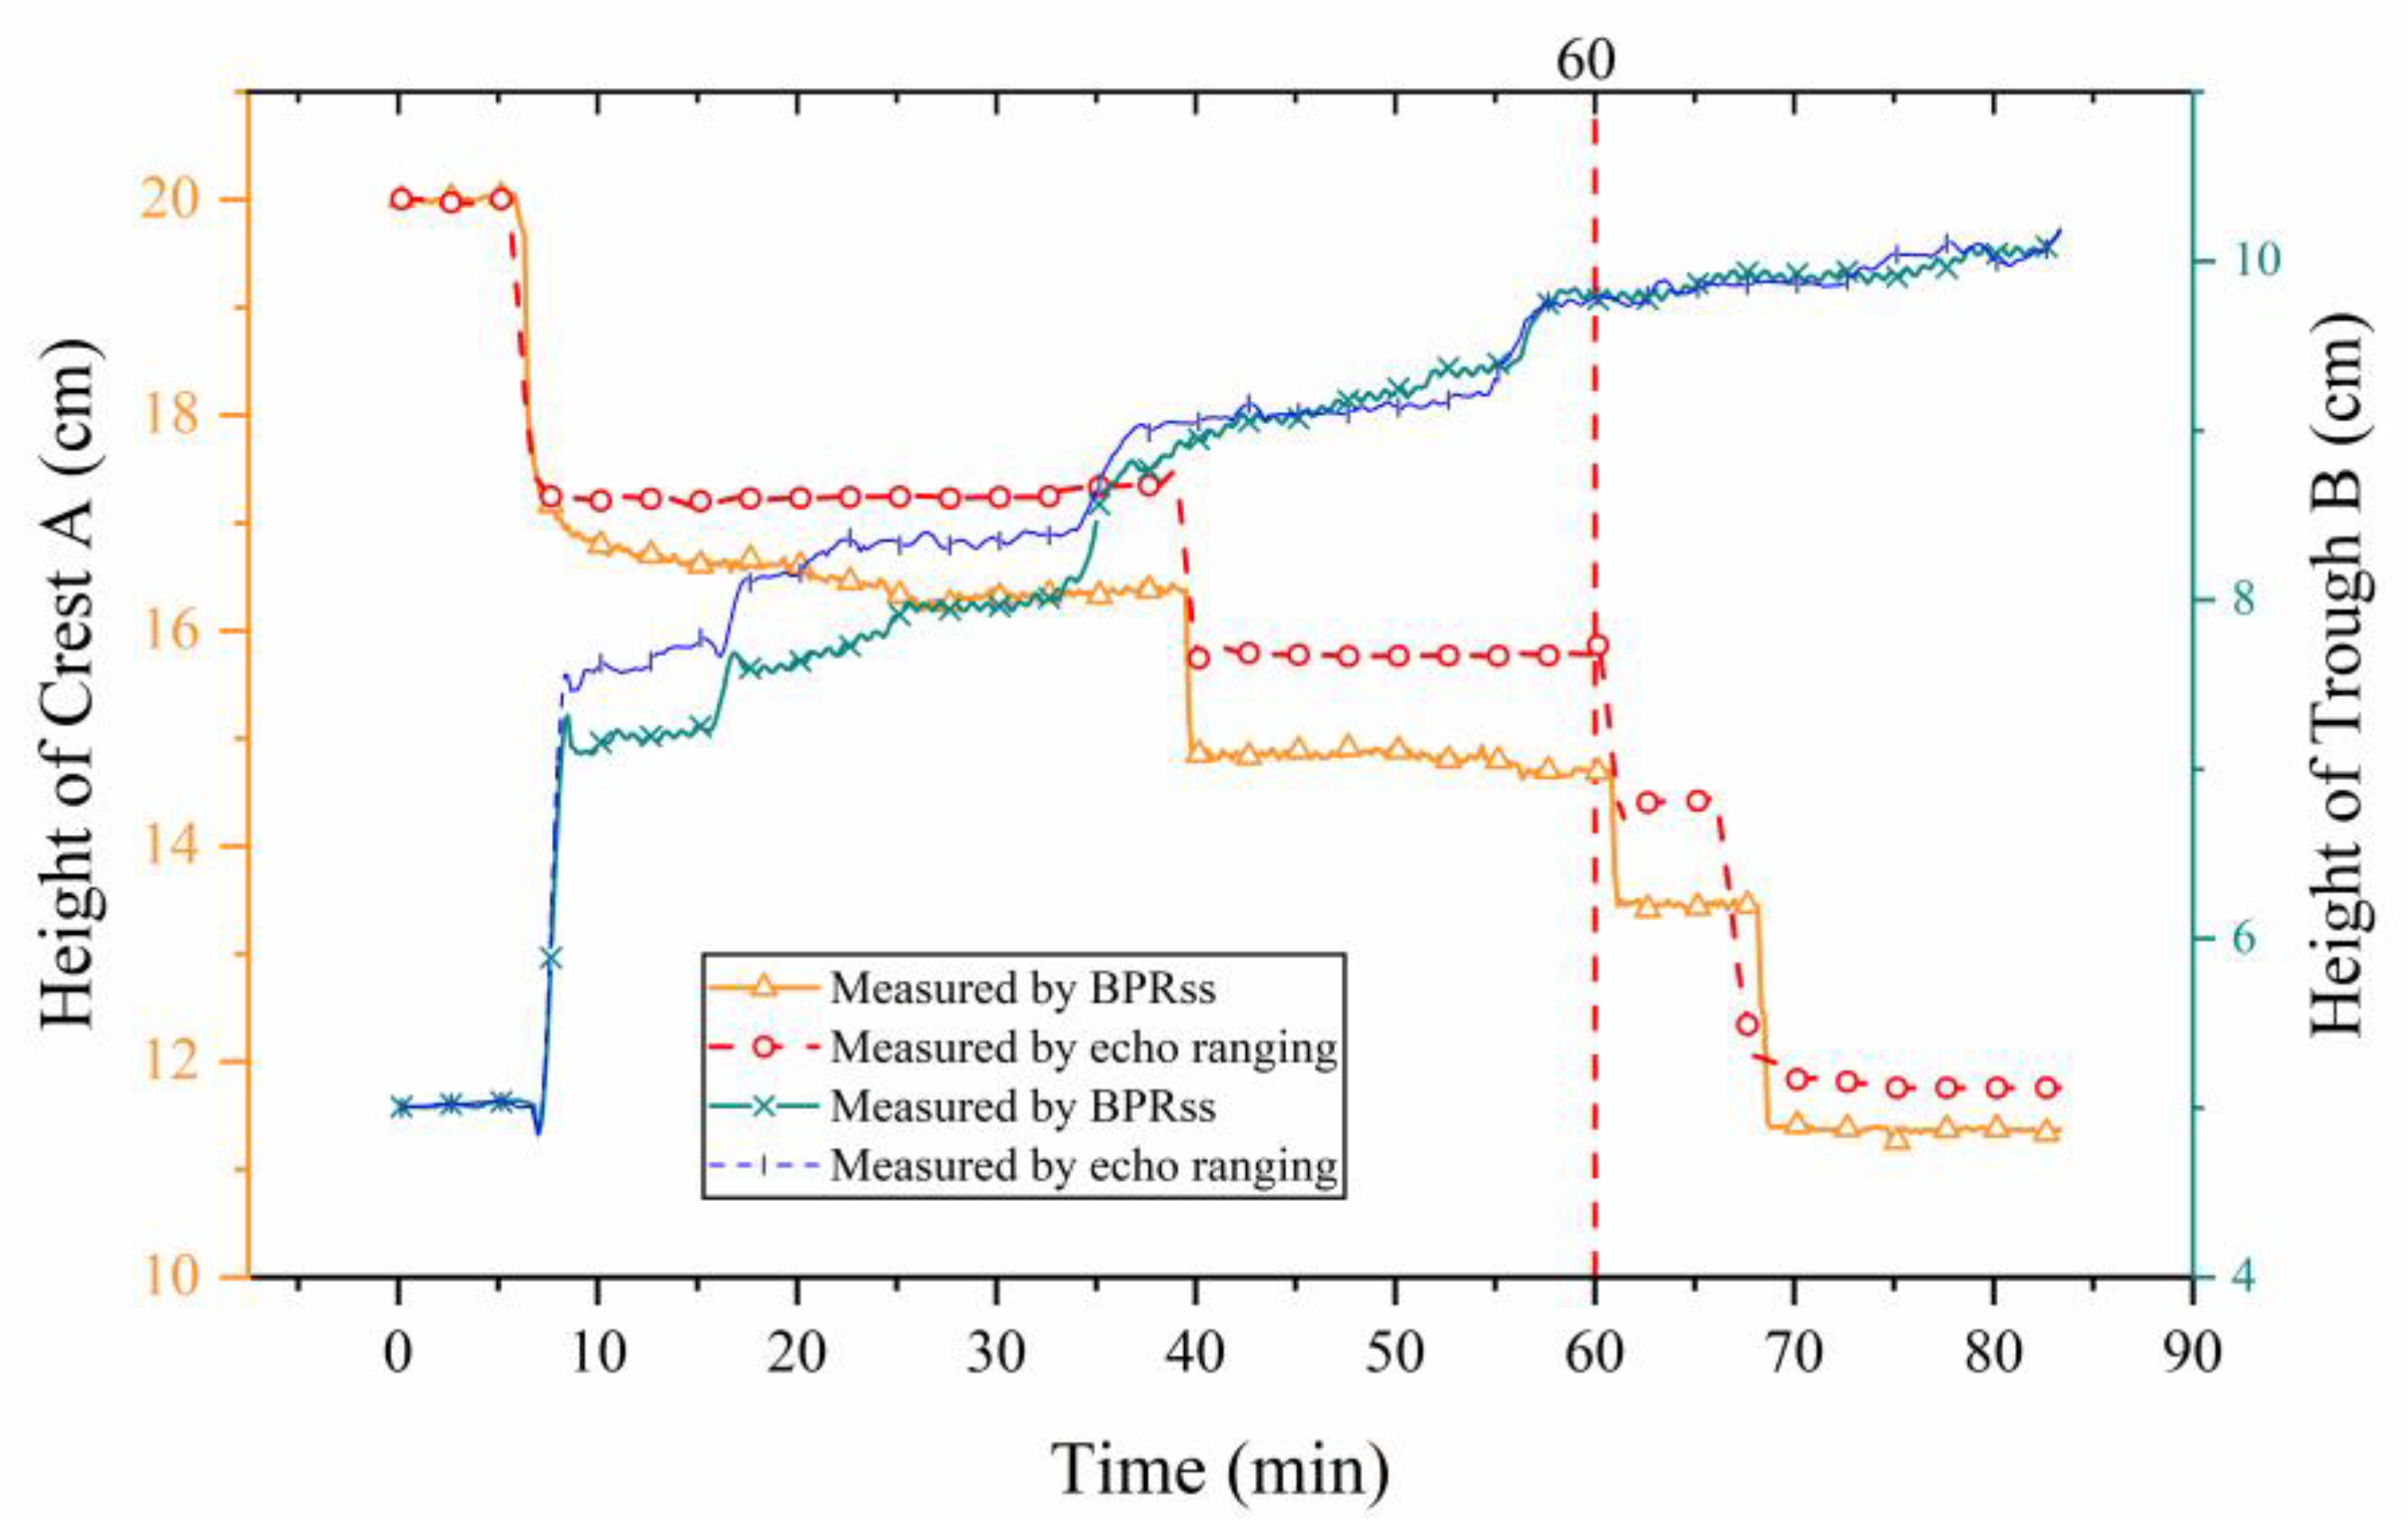
3.2. Measurements Made by the Surface Synchronous Bottom Pressure Recorder (BPRSS)

The bed height data measured by echo ranging (Figure 7) show that the height of crest A before migration was 20.19 cm, while the trough B reached 11.50 cm. After migration, the height at initial crest A dropped by 8.2 cm, the height of trough B increased by 6.4 cm, and the sand wave migrated roughly 3.4 cm in the wave direction.
The data measured by the BPRSS and echo ranging (Figure 8) show that the height of the float at the position used in this test continuously rose or descended in a stepwise manner, without an obvious stability period. During the test period of 85 min, heights at observation points A2 and B2 underwent four step-like changes. According to the pressure data, the height of the bed at B2 was increased by roughly 5 cm, falling 1.4 cm below test records. The height of the bed at A1 dropped by 8.3 cm, which is consistent with test records.

4. Discussion

4.1. The comparison of the Results Measured by Pressure Sensor Techniques and Echo Ranging

It is worth noting that there was a significant response delay to the change in elevation within the first 20 min of the TPRFD measurement at crest A. During this period, the results measured by the TPRFD and echo ranging have similar changes in elevation, but there is a delay of about 5 min. From the experimental records, this phenomenon may have occurred because the weight measured by the TPRFD is the total weight of overlying sand in an area of 100 mm × 100 mm, while the height measured by echo ranging is a point height (Figure 9). For this reason, for the point height of sharp terrain changes, rendering the response sensitivity of the fiber optic pressure sensor is insufficient. Therefore, quantitative research into the process of this phenomenon, by increasing the number of acoustic ranging points on the plane where the optical fiber pressure sensor is located or reducing the surface area of the sensor, is needed in the following research.
A comparison of measurement results from the BPRSS and the TPRFD shows that there are two reasons for this stepwise manner: (a) due to the presence of the floating ball, the water flow speed on both sides of the floating ball accelerated, increasing the erosion of the sediment on both sides of the floating ball (Figure 10); (b) because the density of the float is slightly greater than that of seawater, relative to the downward movement at the wave crest, the upward movement of the float at the trough is subjected to more resistance. It should be noted that only the impact of the existing floating ball on the movement of the bottom sediment, and whether and to what extent the movement of the sediment in other areas is affected, still needs to be explored by designing more controlled experiments.

4.2. The Accuracy of Pressure Sensor Techniques in Reflecting Elevation

A comparison of the two methods with the observation results of the echo ranging group shows that, while the two methods reflect height changes that are consistent with actual height changes of the observation points as a whole, there are significant differences in the accuracy of the observations. Therefore, to quantify the accuracy of the height observations of the BPRSS and TPRFD, we define the observation error and accuracy α as:
error = H P R H echo   ranging ,
α = H ¯ ( error ) H ¯ echo   ranging × 100 % ,
where “ H P R ” is the height calculated using the pressure observation method, and “ H echo   ranging ” is the height measured by echo ranging.
The two methods produced crest and trough observations with accuracy levels of more than 90%, with the most accurate (98.1%) observation obtained using the pressure floating ball method at the trough (Figure 11). The largest error (2.7 cm) was made in the 17th min of observing the crest using the fiber-optic pressure sensor. With the corresponding delay occurring after 15 min, the overall observation accuracy level decreased to 91.4%, representing the least accurate observation. In addition, the two methods exhibit the following two characteristics in terms of accuracy levels: (a) observations of the trough are more accurate than those of the crest, and (b) the BPRSS method is more accurate than the TPRFD method. These findings show that while seabed elevation can be measured from the weight of overlying sand, this approach is less accurate than using water pressure to reflect elevation.

4.3. Applicability of In Situ Observations

A method’s reliability is essential to practical observations. Our experiments show that while the BPRSS method, using the floating ball as a carrier, can more accurately reflect bottom bed elevation, it affects the migration of sand waves. When the underflow velocity of active sand wave areas reaches 58 cm/s [16], a floating ball with a density slightly higher than the density of the seawater can generate up and down movement under the action of the current. Increasing the density to reduce this effect may exacerbate the disturbance of the sand wave migration process. Therefore, its optimal density is difficult to determine, making the authenticity of the migration process reflected in observation results difficult to confirm.
In this respect, as a fixed-depth total pressure recorder with an optical fiber pressure sensor is buried in the sea floor, sediment migration on the sea floor surface is less likely to be interrupted. Furthermore, because the sand wave has a common height of approximately 0.4–5 m and a wavelength of approximately 5–100 m [35], it is much larger than that of the bed model used in this experiment. Therefore, the effect of the response delay phenomenon exhibited by the TPRFD method used in this experiment should be greatly reduced. Therefore, the TPRFD method is more applicable for field applications. However, if this technique is to be applied to the field observation, there are still many unresolved problems. How large is this noise caused by bottom current and potential turbulence relative to the measured noise? Further, how to ensure that the TPRFD is always inside the sand wave, and not exposed to current during the sand wave migration process. A designed field observation device, equipped with a TPFRD observation probe and some instruments for measuring hydrodynamics, may help to explore these issues. A multistage penetrating method can also be used to ensure that the TPRFD is always located inside the sand waves [36]. Nevertheless, more relevant subjects in pressure sensing techniques for observing seabed deformation caused by submarine sand wave migration are still expected to be studied and explored.

5. Conclusions

The application of pressure sensing technology in observing changes in the sea floor caused by the migration of submarine sand waves has been demonstrated in this paper. In studying the change law of the near-bottom water pressure, bottom pressure and total fixed pressure during sand wave migration, we propose two methods: BPRSS and TPRFD. Through a simulation experiment with an indoor water flume, the observation effects of the two methods were evaluated. Overall, the main conclusions of this study can be summarized as follows:
(1) Pressure sensor techniques can be used to observe seabed elevation changes (accuracy of above 90%), but for microtopography with severe terrain fluctuations (such as the sand wave crests considered in this experiment), their observation accuracy will decrease.
(2) Reflecting seabed elevation from the weight of overlying sand is feasible, but less accurate than using water pressure to reflect elevation.
(3) The use of a floating ball-mounted pressure sensor as a surface synchronous bottom pressure recorder (BPRSS) to observe sea floor elevation will affect sediment migration on the surface of a sand wave, causing the results to show a step-like change process not observed under real conditions.
(4) Considering the underflow velocity of a sand wave development area, and the actual size of sand waves during field observations, it is more effective to use a fixed-depth total pressure recorder (TPRFD) to observe a trough.

Author Contributions

Conceptualization, X.L.; Methodology, X.Z.; Project administration, X.L.; Resources, X.Z.; Supervision, X.L.; Writing–original draft, X.Z.; Writing–review & editing, X.L., Z.T., H.Z. and T.C. All authors have read and agreed to the published version of the manuscript.

Funding

This research was supported by the Fundamental Research Funds for the Central Universities (grant number 201822013), the National Natural Science Foundation of China (41877221), the Shandong Provincial Natural Science Foundation (ZR2019QD001), and the National Key Research and Development Plan of China (2016YFC0802301).

Conflicts of Interest

The authors declare no conflict of interest.

References

  1. Allen, J.R.L. Sand waves: A model of origin and internal structure. Elsevier 1980, 26. [Google Scholar] [CrossRef]
  2. Flemming, B.W. Underwater sand dunes along the southeast African continental margin â Observations and implications. Elsevier 1978, 26, 177–198. [Google Scholar] [CrossRef]
  3. Morelissen, R.; Hulscher, S.J.M.H.; Knaapen, M.A.F.; Nemeth, A.A.; Bijker, R. Mathematical modelling of sand wave migration and the interaction with pipelines. Coast. Eng. 2003, 48, 197–209. [Google Scholar] [CrossRef]
  4. Karl, H.A.; Cacchione, D.A.; Carlson, P.R. Internal-Wave Currents as a Mechanism to Account for Large Sand Waves in Navarinsky Canyon Head, Bering Sea. SEPM J. Sediment. Res. 1986, 56, 706–714. [Google Scholar] [CrossRef]
  5. Reeder, D.B.; Ma, B.B.; Yang, Y.J. Very large subaqueous sand dunes on the upper continental slope in the South China Sea generated by episodic, shoaling deep-water internal solitary waves. Mar. Geol. 2011, 279, 12–18. [Google Scholar] [CrossRef]
  6. King, E.L.; Boe, R.; Bellec, V.K.; Rise, L.; Skardhamar, J.; Ferre, B.; Dolan, M.F.J. Contour current driven continental slope-situated sandwaves with effects from secondary current processes on the Barents Sea margin offshore Norway. Mar. Geol. 2014, 353, 108–127. [Google Scholar] [CrossRef] [Green Version]
  7. Franzetti, M.; Le Roy, P.; Delacourt, C.; Garlan, T.; Cancouet, R.; Sukhovich, A.; Deschamps, A. Giant dune morphologies and dynamics in a deep continental shelf environment: Example of the banc du four (Western Brittany, France). Mar. Geol. 2013, 346, 17–30. [Google Scholar] [CrossRef] [Green Version]
  8. Games, K.P.; Gordon, D.I. Study of sand wave migration over five years as observed in two windfarm development areas, and the implications for building on moving substrates in the North Sea. Earth Environ. Sci. Trans. R. Soc. Edinb. 2015, 105, 241–249. [Google Scholar] [CrossRef]
  9. Idier, D.; Astruc, D.; Garlan, T. Spatio-temporal variability of currents over a mobile dune field in the Dover Strait. Cont. Shelf Res. 2011, 31, 1955–1966. [Google Scholar] [CrossRef]
  10. Droghei, R.; Falcini, F.; Casalbore, D.; Martorelli, E.; Mosetti, R.; Sannino, G.; Santoleri, R.; Chiocci, F.L. The role of Internal Solitary Waves on deep-water sedimentary processes: The case of up-slope migrating sediment waves off the Messina Strait. Sci. Rep. 2016, 6, 36376. [Google Scholar] [CrossRef] [Green Version]
  11. Li, Y.; Lin, M.A.; Jiang, W.B.; Fan, F.X. Process Control of the Sand Wave Migration in Beibu Gulf of the South China Sea. J. Hydrodyn. 2011, 23, 439–446. [Google Scholar] [CrossRef] [Green Version]
  12. Buijsman, M.C.; Ridderinkhof, H. Long-term evolution of sand waves in the Marsdiep inlet. I: High-resolution observations. Cont. Shelf Res. 2008, 28, 1190–1201. [Google Scholar] [CrossRef]
  13. van Dijk, T.A.G.P.; Kleinhans, M.G. Processes controlling the dynamics of compound sand waves in the North Sea, Netherlands. J. Geophys. Res. Earth Surf. 2005, 110. [Google Scholar] [CrossRef]
  14. Besio, G.; Blondeaux, P.; Brocchini, M.; Hulscher, S.J.M.H.; Idier, D.; Knaapen, M.A.F.; Németh, A.A.; Roos, P.C.; Vittori, G. The morphodynamics of tidal sand waves: A model overview. Coast. Eng. 2008, 55, 657–670. [Google Scholar] [CrossRef] [Green Version]
  15. Németh, A.A.; Hulscher, S.J.M.H.; Van Damme, R.M.J. Simulating offshore sand waves. Coast. Eng. 2006, 53, 265–275. [Google Scholar] [CrossRef]
  16. Fenster Michael, S.; Fitzgerald Duncan, M.; Bohlen, W.F.; Lewis Ralph, S.; Baldwin Christopher, T. Stability of giant sand waves in eastern Long Island Sound, U.S.A. Elsevier 1990, 91. [Google Scholar] [CrossRef]
  17. Ingersoll, R.W.; Ryan, B.A. Repetitive surveys to assess sand ridge movement offshore Sable Island. In Proceedings of the Oceans 97 MTS/IEEE Conference, Halifax, NS, Canada, 6–9 October 1997. [Google Scholar] [CrossRef]
  18. Salvatierra, M.M.; Aliotta, S.; Ginsberg, S.S. Morphology and dynamics of large subtidal dunes in Bahia Blanca estuary, Argentina. Geomorphology 2015, 246, 168–177. [Google Scholar] [CrossRef]
  19. Zhou, J.Q.; Wu, Z.Y.; Jin, X.L.; Zhao, D.N.; Cao, Z.Y.; Guan, W.B. Observations and analysis of giant sand wave fields on the Taiwan Banks, northern South China Sea. Mar. Geol. 2018, 406, 132–141. [Google Scholar] [CrossRef]
  20. Traykovski, P.; Hay, A.E.; Irish, J.D.; Lynch, J.F. Geometry, migration, and evolution of wave orbital ripples at LEO-15. J. Geophys. Res.-Oceans 1999, 104, 1505–1524. [Google Scholar] [CrossRef]
  21. Malikides, M.; Harris, P.T.; Tate, P.M. Sediment transport and flow over sandwaves in a non-rectilinear tidal environment: Bass Strait, Australia. Cont. Shelf Res. 1989, 9, 203–221. [Google Scholar] [CrossRef]
  22. Jo, H.R.; Lee, H.J. Sediment transport processes over a sand bank in macrotidal Garolim Bay, west coast of Korea. Geosci. J. 2008, 12, 243–253. [Google Scholar] [CrossRef]
  23. Fox, C.G. In situ ground deformation measurements from the summit of Axial Volcano during the 1998 volcanic episode. Geophys. Res. Lett. 1999, 26, 3437–3440. [Google Scholar] [CrossRef]
  24. Fox, C.G.; Chadwick, W.W.; Embley, R.W. Direct observation of a submarine volcanic eruption from a sea-floor instrument caught in a lava flow. Nature 2001, 412, 727–729. [Google Scholar] [CrossRef] [PubMed]
  25. Hino, R.; Inazu, D.; Ohta, Y.; Ito, Y.; Suzuki, S.; Iinuma, T.; Osada, Y.; Kido, M.; Fujimoto, H.; Kaneda, Y. Was the 2011 Tohoku-Oki earthquake preceded by aseismic preslip? Examination of seafloor vertical deformation data near the epicenter. Mar. Geophys. Res. 2014, 35, 181–190. [Google Scholar] [CrossRef] [Green Version]
  26. Wallace, L.M.; Webb, S.C.; Ito, Y.; Mochizuki, K.; Hino, R.; Henrys, S.; Schwartz, S.Y.; Sheehan, A.F. Slow slip near the trench at the Hikurangi subduction zone, New Zealand. Science 2016, 352, 701–704. [Google Scholar] [CrossRef] [Green Version]
  27. Phillips, K.A.; Chadwell, C.D.; Hildebrand, J.A. Vertical deformation measurements on the submerged south flank of Kīlauea volcano, Hawai’i reveal seafloor motion associated with volcanic collapse. J. Geophys. Res. Solid Earth 2008, 113. [Google Scholar] [CrossRef] [Green Version]
  28. Ballu, V.; Ammann, J.; Pot, O.; Viron, O.; Sasagawa, G.S.; Reverdin, G.; Bouin, M.-N.; Cannat, M.; Deplus, C.; Deroussi, S.; et al. A seafloor experiment to monitor vertical deformation at the Lucky Strike volcano, Mid-Atlantic Ridge. J. Geod. 2009, 83, 147–159. [Google Scholar] [CrossRef]
  29. Chadwick, W.W.; Nooner, S.L.; Butterfield, D.A.; Lilley, M.D. Seafloor deformation and forecasts of the April 2011 eruption at Axial Seamount. Nat. Geosci. 2012, 5, 474–477. [Google Scholar] [CrossRef] [Green Version]
  30. Yokoyama, T.; Shimoyama, M.; Matsuda, S.; Tago, K.; Takeshima, J.; Nakatsuka, Y. Monitoring System of Seafloor Subsidence for Methane Hydrate Production Test. In Proceedings of the SPWLA 18th Formation Evaluation Symposium of Japan, Chiba, Japan, 27 September 2012; p. 6. [Google Scholar]
  31. Stenvold, T.; Eiken, O.; Zumberge, M.A.; Sasagawa, G.S.; Nooner, S.L. High-precision relative depth and subsidence mapping from seafloor water-pressure measurements. SPE J. 2006, 11, 380–389. [Google Scholar] [CrossRef]
  32. Lobo, F.J.; Hernández-Molina, F.J.; Somoza, L.; Rodero, J.; Maldonado, A.; Barnolas, A. Patterns of bottom current flow deduced from dune asymmetries over the Gulf of Cadiz shelf (southwest Spain). Mar. Geol. 2000, 164, 91–117. [Google Scholar] [CrossRef]
  33. McKelvey, D.; Honkalehto, T.; Williamson, N.J. Results of the March 2006 Echo Integration-Trawl Survey of Walleye Pollock (Theragra Chalcogramma) Conducted in the Southeastern Aleutian Basin Near Bogoslof Island, Cruise MF2006-03; NOAA: Silver Spring, MD, USA, 2006. [Google Scholar]
  34. Bassoullet, P.; Le Hir, P.; Gouleau, D.; Robert, S. Sediment transport over an intertidal mudflat: Field investigations and estimation of fluxes within the “Baie de Marenngres-Oleron” (France). Cont. Shelf Res. 2000, 20, 1635–1653. [Google Scholar] [CrossRef]
  35. Ashley, G.M. Classification of large-scale subaqueous bedforms; a new look at an old problem. J. Sediment. Res. 1990, 60, 160–172. [Google Scholar] [CrossRef]
  36. Liu, X.; Zheng, X.; Zhang, B.; Jia, Y.; Tian, Z.; Ji, C. A Multistage Penetrating In-Situ Device and Method to Observe Sand Waves on the Seabed Based on Resistivity Probe. Australia Patent AU2019100321, 2 May 2019. [Google Scholar]
Figure 1. Pressure changes at key points during sand wave migration.
Jmse 08 00315 g001
Figure 2. Schematic diagram of the water flume structure and test device. (a) Top view of the test device; (b) side view of the simulated sand wave bed.
Jmse 08 00315 g002
Figure 3. Fiber optic pressure sensor. (a) Appearance; (b) internal structure.
Jmse 08 00315 g003
Figure 4. Dish-shaped float. (a) Appearance; (b) internal structure.
Jmse 08 00315 g004
Figure 5. Bed morphology measured by echo ranging for the TPRFD group.
Jmse 08 00315 g005
Figure 6. Comparison of results measured by echo ranging and the TPRFD.
Jmse 08 00315 g006
Figure 7. Bed morphology measured by echo ranging for the BPRSS group.
Jmse 08 00315 g007
Figure 8. Comparison of results measured by the BPRSS and echo ranging.
Jmse 08 00315 g008
Figure 9. Measurement state of echo ranging and optical fiber pressure sensor.
Jmse 08 00315 g009
Figure 10. Bottom depression formed by the bottom of the floating ball at the trough.
Jmse 08 00315 g010
Figure 11. Comparison of the accuracy of the BPRSS and TPRFD methods.
Jmse 08 00315 g011
Table 1. Soil sample properties and instrument parameters.
InstrumentCharacteristic Parameters
Sand SampleAverage particle diameter 0.25 mm
Nonuniformity coefficient 1.47
Curvature coefficient1.14
Buoyant unit weight16.2 N/cm3
AA400Accuracy1 mm
Range0.15–100 m
Ultrasonic terrain scannerAccuracy1 mm
Range0.1–2 m
Pressure sensorAccuracy0.5%
Range0–20 kPa
Fiber optic pressure sensorAccuracy1‰ F.S
Range0–30 kN

