Review

Damage in Rubble Mound Breakwaters. Part II: Review of the Definition, Parameterization, and Measurement of Damage

by
Álvaro Campos
1,*,
Rafael Molina-Sanchez
1 and
Carmen Castillo
2
1
Universidad Politécnica de Madrid (UPM), HRL-UPM & CEHINAV-UPM, 28040 Madrid, Spain
2
Universidad de Castilla-La Mancha (UCLM), 13071 Ciudad Real, Spain
*
Author to whom correspondence should be addressed.
J. Mar. Sci. Eng. 2020, 8(5), 306; https://doi.org/10.3390/jmse8050306
Submission received: 20 March 2020 / Revised: 15 April 2020 / Accepted: 22 April 2020 / Published: 28 April 2020
(This article belongs to the Special Issue Modelling of Harbour and Coastal Structures)

Abstract

:
Damage in rubble mound breakwaters has been addressed for more than 80 years and, as reported in “Part I: Historical review of damage models”, a considerable number of hydraulic instability models have been proposed up to date. Most of them were developed from small-scale physical tests, based on damage descriptors not always parameterized nor measured in the same way, which indeed complicates the comparison and reproducibility from different experimental data sources. The latter is increased by the lack of a standardized methodological approach inside an experimental and measuring process that involves many sources of uncertainty. Currently, the latest innovations applicable to damage measurement, together with the growing demand of reliable decision-making tools for conservation/maintenance strategies and structural/operational risk management, venture an upcoming proliferation of prototype monitoring, as well as new approaches aimed to characterize the stochastic nature of damage evolution. In this context, this paper is meant to review the concept of damage in rubble mound breakwaters, the different proposals for its parameterization, the past and present measuring techniques, and main challenges in the near future.

1. Introduction

Damage of an element can be defined as the partial or total loss of its functionality. The Coastal Engineering Manual [1], referred as CEM in this paper, describes it as “structure degradation that occurs over a relatively short period such as a single storm event, a unique occurrence, or perhaps a winter storm season”. Regarding rubble mound breakwaters, the concept of damage is usually related to the hydraulic instability of the armor layer [1,2]. It is commonly utilized to refer to the geometrical evolution in comparison with the “undamaged” section and, occasionally, also to the breakage of armor units. Therefore, the conceptualization of damage is dual: it has a qualitative character associated with the level of functionality and a quantitative character related to measuring the movement of armor units along the slope. However, the two approaches are not always correlated in the same way.
For instance, the geometrical variations of a berm breakwater might not cause the structure to be considered as damaged until a certain degree of deformation is achieved, because its thicker armor layer is actually designed to reshape. On the other hand, in a conventional cube armored breakwater with economic activities carried out at the emerged platform, a simple face-to-face reorganization of the cubes can alter the functionality of the structure. This slight readjustment can increase wave run-up and overtopping and, consequently, might affect activities such as bulk storing. In this case, the breakwater could be considered as damaged, even without a significant degree of deformation.
As not every rubble mound breakwater is designed under the same functional requirements and not every structure presents the same fragility, the concept of damage needs to be addressed from a multidimensional perspective. Note that there is a relatively wide variety of breakwater typologies and each type of armor unit presents a singular behavior against wave action. In addition, damage levels in single-layer structures are not equivalent in multi-layer ones. However, as mentioned before, the general trend is to use the term “damage” to simply refer to the quantification of the deformation of a section.
The amount of information on the definition, parameterization, and measurement of damage is quite extensive. For this reason, the present review of damage in rubble mound breakwaters is divided in two separated papers, which are closely linked but conceptually different. On the one hand, Part I [3] is focused on how damage initiation and progression is modeled, i.e. which are the available hypothesis and strategies for characterizing the structural response. It compiles 146 references on this topic, chronologically discussed from 1933 to 2020, and including main advances together with 23 formulations of hydraulic stability models and 11 formulations of damage progression models. On the other hand, the present paper (Part II) is centered on how damage is defined (see Section 2.1), parametrized (see Section 2.2), and measured (see Section 2.3), i.e., which are the strategies for defining damage descriptors and which are the instrumental techniques available for monitoring the structural response. Damage descriptors are required for building and calibrating damage models and they are conditioned by the accuracy of the available measuring techniques.
Damage monitoring has been mainly enclosed so far to small-scale physical tests aimed to analyze the stability of generic typologies. They are also quite common nowadays in design tenders in order to verify the stability of real (prototype) structures. This kind of experiments has a certain range of validity not only dependent on the wave conditions and water levels tested, but also on the breakwater geometry and armor unit type. The assimilation of the results from different wave flumes is also dependent on how damage is parametrized and measured. Therefore, a complete description of the experimental methodology is needed for reproducibility, which is not often the case. Reproducibility is required even within each particular laboratory, due to the fact that damage initiation and evolution are random variables and, thus, experiments need to be repeated [4,5,6,7]. According to Marzeddu et al. [8], taking into account laboratory occupation times, a minimum of five repetitions should be performed to obtain an average damage value.
Despite each laboratory has their own standardized protocols for accomplishing this kind of experiments, many authors claim for a general standardization of the methodology. In Vidal et al. [9], an attempt for establishing standards by the Organismo Público de Puertos del Estado (the Spanish organism in charge of managing state-owned ports) was pointed out. More recently, the International Breakwater Directory is working on expanding the CLASH (acronym for “Crest Level Assessment of coastal Structures by full scale monitoring, neural network prediction and Hazard analysis on permissible wave overtopping”) overtopping database [10] by including information of armor damage in rubble mound breakwaters and seawalls [11]. The latter can be used as a motivation to establish a standardization of procedures between the different laboratories and Port Authorities worldwide in order to provide comparable results. In this sense, Clavero et al. [12] proposed a methodology that can help deciding whether two series of data obtained in different laboratories are assimilable or not.

2. Review of Damage Definition, Damage Parameterization, and Damage Measurement

2.1. Damage Definition

As presented in the introduction, the definition of damage in rubble mound breakwaters is conceptually dependent on aspects such as the typology, design, armor type, or the functional requirements. Despite the general and quite ambiguous connotation of the term “damage”, in coastal engineering it is commonly used to refer to the degree of reshaping of the armor layer. It is therefore linked to the failure mode known as “hydraulic instability of the armor layer” [1,2] and usually quantified by means of the eroded volume or number of units removed. In steep slopes, displacements can be also due to the sliding of the armor layer as a consequence of compaction or loss of support.
Nevertheless, from the point of view of the organism in charge of the port (or terminal), damage is likely to be linked to the economical repercussion caused by the loss of functionality of the breakwater. These consequences are not only associated with the costs from the reparation of the structure if needed, but also with the effects on the activities and goods depending on the sheltering performance of the structure. This global approach [13] to the concept of damage demands monitoring, in prototype, the spatial and temporal evolution of the geometrical variations of the slope. It also requires the previous characterization of the interaction with other failure modes, i.e., developing failure diagrams considering settlements, overtopping rates, and variation of armor layer porosity, among others. In addition, it is necessary to address how the different damage levels might affect the functionality of the structure (operational thresholds) and how the deterioration rate is expected to evolve (structural thresholds).
Losada et al. [14] defined three qualitative damage thresholds, complemented with a fourth one (initiation of destruction) in Vidal et al. [15]:
  • Initiation of damage: a certain number of armor units are displaced a distance equal to or larger than a nominal diameter (Dn50) from their original position. Holes larger than the average porous size are clearly appreciated, but the functionality of the structure is not compromised.
  • Iribarren’s damage: the holes are big enough to expose the lower layer of the armor layer, which units start to be susceptible of being extracted. An incipient S-profile is developed.
  • Initiation of destruction: it is similar to the concept of “initiation of damage” but applied to the lower layer of the armor layer. A small number of units (two or three) in the lower layer are pulled out and the underlayer starts to be exposed to wave action.
  • Destruction: the underlayer is exposed to wave action and their units are easily removed. The mound is likely to eventually cease to give the designed level of service.
In Figure 1, a particular interpretation of the four qualitative damage thresholds is presented, based on a set of damage progression experiments carried out at the Harbour Research Laboratory of Universidad Politécnica de Madrid (HRL-UPM):
As it can be deduced from Figure 1, the interpretation of this damage classification has a certain degree of subjectivity, particularly for the “initiation of damage”. Even for quantitative methods, the dispersion when predicting lower values of damage is higher than for larger values of damage, in relative terms regarding the coefficient of variation. The latter was pointed out by many authors, such as Van Gent et al. [7] or Davies et al. [16], who stated that “lower damage levels have been seen to exhibit greater experimental variability”.
Vidal et al. [15] stablished the hypothesis that the breakwater remains stable at each damage level if wave action is not increased (except for destruction). However, other authors maintain that damage does not stabilize, but its progression rate is reduced. From a probabilistic point of view, after applying a certain wave energy, the probability of the extraction of armor units when exposed to the same wave energy is associated with the way they are integrated in the granular system: once the pieces with higher probability of being removed are pulled out, there is a lower probability of extraction of new pieces.
The damage criteria of Vidal et al. [15] is based on experience and introduces a useful qualitative description of the armor layer’s behavior by characterizing main pseudo static stages in the geometrical evolution of a generic breakwater until destruction. Note that other qualitative damage thresholds might be considered. For instance, the CEM [1] proposed the following three qualitative damage levels:
  • Initial damage: few units are displaced, corresponding to the no damage level used in the Shore Protection Manual [17], referred as SPM in the present document.
  • Intermediate damage: units are displaced but without causing exposure of the under layer or filter layer to direct wave attack.
  • Failure: the under layer or filter layer is exposed to wave attack.
These three levels were re-defined in Almeida et al. [18] on the basis of establishing unified concepts for damage characterization. However, this pseudo static vision is likely to evolve in the near future due to the availability and affordability of the latest technological advances (see Section 2.3), which allow a continuous monitoring of prototypes and small-scale structures. In this way, the generic conceptualization of damage would move on understanding the particular response and requirements of each specific structure. Not only will the dynamic definition of main failure modes be addressed, but also the combinations between them [19] and their impacts on the port economic activities and on the structural integrity during the whole useful life. Probabilistic models based on physical/numerical studies would allow the characterization of breakwater response scenarios and the definition of operational/structural thresholds. The latter, together with the full-scale real time monitoring, would permit the development of ad hoc decision-making tools. This evolution in the conceptualization of damage would presumably be a key factor regarding port design and management inside a global trend demanding optimal conservation strategies for both new and existing structures.

2.2. Damage Parameterization

The parameterization of the reshaping of a rubble mound section is needed for the quantification of the hydraulic instability of armor layers. This is done by the definition of a damage descriptor, which also involves the need to state a concise description about the methodology for measuring and selecting its representative parameters. In Abanades et al. [20], the following properties were recommended for a consistent damage descriptor:
  • The descriptor should increase together with breakwater damage, i.e., the damage descriptor should be directly proportional to breakwater damage.
  • The descriptor should be dimensionless in order to show no dependence on the scale.
  • The descriptor should present a known range of variation, independently of the rubble mound’s characteristics, water levels, or type of wave actions.
  • The descriptor should be easily interpretable, i.e., it should provide clear information about the qualitative damage level.
In order to fulfill the last requirement, it is necessary to previously characterize the response of the structure, up to the destruction level. Only in this way, it would be possible to link the descriptor to the qualitative response or damage level. As an example, Vidal et al. [21] proposed relating the dimensionless eroded area, S (see Section 2.2.1), to the qualitative response of a conventional structure (straight slope, two layers, high crest level, and deep water conditions) for different slopes, as shown in Table 1. However, taking into account the wide range of rubble mound designs, armor units’ types, and functional requirements, these thresholds are not likely to be applied to every single case. What is more, even for the same breakwater design, the comparison between results from different sources when not applying the same methodology for defining and measuring the damage descriptor might be inconsistent. Indeed, as an example of the variations identified comparing different sources, Table 1 also shows some of the values suggested in Chapter 5 of the Rock Manual [2] regarding the three damage levels from the CEM [1].
As mentioned before, thanks to the improvements on measuring techniques, this simplified approach based on qualitative damage levels might move on the particular characterization of the whole deterioration rate of each singular structure up to destruction. By modeling this evolution as a random variable [6,22] and monitoring prototypes, breakwater designs together with conservation and maintenance strategies would significantly improve in reliability.
The conceptualization and selection of a damage descriptor can be affected by the available measuring techniques. These techniques, mainly divided into visual approaches and measuring approaches, are summarized in Section 2.3, whereas main damage descriptors up to date are detailed below.

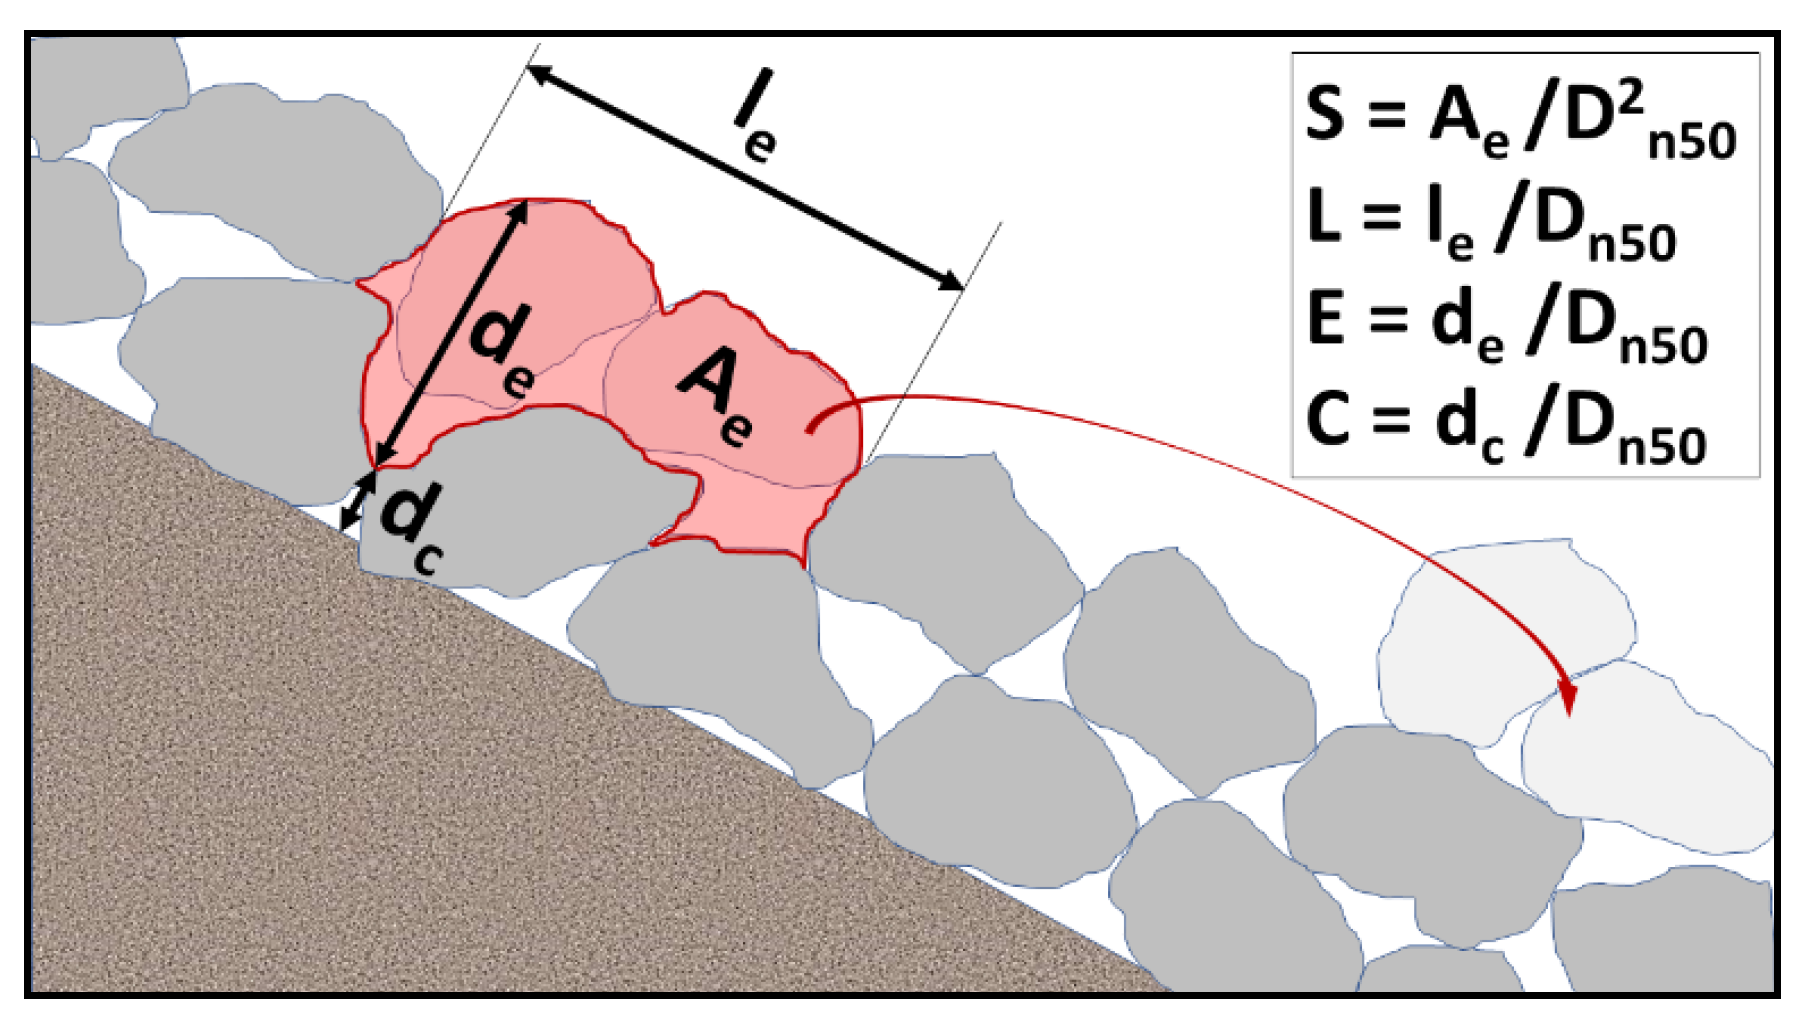
2.2.1. S, Dimensionless Eroded Area

This descriptor is one of the most extended nowadays and it is referred with other terms such as damage parameter, non-dimensional damage level parameter, or dimensionless damage index. It was proposed by Broderick and Ahrens [23] in 1982 and it was used in recognized damage studies [5,24,25]. It is defined as the eroded volume per unit length (see Figure 2), i.e., the cross-sectional eroded area (Ae) divided by the square of the nominal stone diameter (Dn50):
S = A e / D n 50 2
A physical description of S is the number of eroded cubic pieces with a side of Dn50 within a width of one Dn50. The actual number of eroded units depends on the porosity, armor grading, and shape of the stones but, according to Van der Meer [24], it is equal to 0.7 to 1 times the value of S.
The interpretation of this descriptor is linked to the size and type of the breakwater. The eroded area was traditionally calculated from a profiler as a comparison with the undamaged profile. Therefore, it is also dependent on the width considered and how the eroded area is averaged. The influence of the width of the test section on mean damage variation was analyzed in Van Gent et al. [7] and Almeida et al. [18], recommending a minimum width of about 25 stones in wave flumes. As shown in Table 1, there are some difficulties when correlating the value of S with qualitative damage criteria. For example, for the initiation of damage, the SPM [17] suggested an erosion of 0% to 5% of the active armor zone (S from 0 to 1.6), Van der Meer [24] considered an erosion of S = 2 and Medina [27] aimed for a value of S = 1. Medina [27] found that the failure point also differs from different authors.
These shortcomings in the interpretability of S might be due to two main reasons, which are extensible for most of the descriptors detailed herein. The first one is that S is not capable of characterizing the spatial shape of damage, because it represents a mean eroded area on a whole profile, as shown in Figure 3.
The second one is that there is not a concise methodology for measuring and calculating S. On the contrary, profiling techniques, distance between profiles, post-processing strategies (see Section 2.3.2), or error estimations are typically different between publications or, in many cases, are not meticulously defined or not defined at all. What is more, when S is computed from several profiles over a section, the strategy differs from each author: some calculate S from an averaged profile [24], others consider each profile as an independent value of damage [5], and others calculate an averaged magnitude of S from the values of S on each profile [6]. Note that, as detected in Bradbury et al. [28], how damage is evaluated can lead to differences, especially for the lowest damage indexes (see Figure 4), although they decrease with the increase on damage level.

2.2.2. D%, Percentage Volume of Stones Eroded Relative to the Total Volume of Stones in the Active Armor Layer

This is the historical descriptor for characterizing damage from the U.S. Army Engineer Waterways Experimental Station (WES) and it was used in relevant experiments such as the ones from Hudson [29].
In line with the damage descriptor S, the eroded volume was traditionally measured utilizing a profiler. The active armor layer was defined as extending from the middle of the breakwater crest to one zero-damage wave height below the still water level. The complete methodology is described in Melby [26].
By limiting damage to a specific zone, comparison between various structures would be, at first, more direct than using S. Nevertheless, in addition to the shortcomings mentioned for S, in this case, the definition of D% is also dependent on how the zero-damage is defined and on the crest geometry. The new definition of the active armor layer by the CEM [1] complicates a little more the systematicity of this descriptor, as the active layer is extended to a “reference area”, such as the complete armor area or, preferably, a specific zone around the sea water level to be defined for each particular case.
Dealing with the association of D% with qualitative damage levels, the SPM [17] presented their Table 7.9, original from Jackson [30]. Despite being widely used, this table is limited to regular waves starting from an undamaged structure. Additionally, the CEM [1] in their Table VI-5-21, related this descriptor to the aforementioned three-levels damage classification for rock slopes from 1:2 to 1:3.

2.2.3. SN, Dimensionless Eroded Area Accounting for Number of Displaced Units

The descriptor S can be re-formulated when visual methods are used, as it was proposed in Davies et al. [16]. The volume eroded from a section of width X can be expressed in terms of the average eroded area (Ve = Ae ·X), or in terms of the number of displaced armor stones: Ve = NdD3n50/(1 − n), where Nd is the number of displaced stones and n is the porosity. Combining both terms together with Equation (1), SN is obtained as follows:
S N = N d D n 50 X ( 1 n )
This descriptor is widely used when unit counting is carried out [31,32,33,34]. In Vidal et al. [33], values relating SN to qualitative damage criteria are provided.
SN is dependent on the porosity, which is not easy to measure, nor even homogeneous. In addition, the diameter of the stones is also variable and, thus, Dn50 is likely to be inaccurate for representing the eroded volume for breakwaters armored with stones. In addition, the eroded volume is calculated assuming that the layer thickness is equivalent to the nominal diameter, which is not always the case, as it depends on the shape of the units and the placement method. Therefore, in order to provide comparable results, SN needs to be calibrated with direct volumetric measurements, for instance, by estimating a correction factor after comparing SN with S. The same shortcomings of S regarding the characterization of the spatial concentration of damage are also extensible to SN. In addition, it can be unreliable or directly unfeasible for a high number of removed units. The latter is applicable to all damage descriptors based on unit counting.

2.2.4. DN%, Percentage of Stones Displaced Relative to the Total Number of Stones in the Active Armor Layer

This descriptor is similar to D% but, in this case, it is based on individual counting of displaced units. It was defined in the SPM [17] and presents the same general shortcomings of D%, because the number of stones within the active zone is dependent on how this zone is defined and on the breakwater geometry.

2.2.5. No, Number of Units Displaced out of the Armor Layer within a Strip Width of One Equivalent Cube Length

This descriptor is also based on unit counting and it was firstly introduced by Hedar [35]. It is dependent on the length of the slope and on how the descriptor is considered: individually for each strip, averaged, or taking into account just the maximum value. Van der Meer [24] coined the term Nod when referring to displacements and Nor for rocking.

2.2.6. NΔ, Equivalent Number of Spherical Stones

Using a similar profiling methodology than WES’s experiments, Thompson and Shuttler [36] calculated the damage number NΔ as the number of stones in a 9Dn50 wide region of the breakwater, assuming spherical armor shape:
N Δ = 54 ρ b A e π ρ a D 50 2 ,
where ρb is the armor bulk density, Ae is the cross-sectional eroded area, ρa is the actual armor density, and D50 is the diameter of the stones exceeding the 50% value of the sieve curve. This descriptor gives a rough estimation of the actual number of displaced stones, but presents some shortcomings that reduce its applicability: the measurement of bulk density in prototype might be difficult and Dn50 is preferable for construction purposes than D50, because it allows the straight consideration of the weight of the stones.

2.2.7. St, Dimensionless Eroded Area based on Planar Exposed Area

This damage descriptor was suggested in Vidal et al. [9] and it is based on counting the number of pixels of the planar exposed area, Ape, between two consecutive layers. St is calculated from the average transversal eroded area, Ate, which is estimated after applying a layer thickness factor, δ, according to the following equation:
S t = A t e D n 50 2 = δ A p e X D n 50 .
The correcting factor, δ, depends on the armor characteristics and the angle of the camera with regard to the slope’s surface (in case it is not orthogonal). This factor is used for calibrating the descriptor with direct measurements of other damage descriptors, mainly the dimensionless eroded area, S. As an example, Vidal et al. [9] obtained a calibration value of δ = 1.58.
Being derived from a planar exposed area, St is only suitable when damage is limited to the outer layer and when there is enough color contrast between the outer layer and the sublayers.

2.2.8. De, Equivalent Dimensionless Damage Accounting for Porosity Variation

Rather than being included as an evolutionary parameter within a damage descriptor, porosity is normally assumed to be constant. However, as it was stated by Gómez-Martín and Medina [37], changes in the packing density of cubes may end up with losses in the desired functionality of the structure. This failure mode, named heterogeneous packing (HeP), is related to a serviceability limit state and it was considered in different studies [38,39,40,41].
In Gómez-Martín and Medina [38], a virtual net method for visual damage assessment was proposed, together with a damage descriptor considering both HeP and the extraction of armor units. The methodology, proven to be adequate for regular armor units, is based on creating a virtual array over the armor layer in which the porosity is evaluated on each strip of known real dimensions. Individual dimensionless damage (Di) is calculated for each strip by means of the initial porosity in the strip (p0), the actual porosity in the strip (pi), and an integer (d) which represents the number of nominal diameters contained within a strip width. Integrating these values over the slope, the equivalent dimensionless damage (De) is obtained as follows:
p i = 1 N d D n 50 2 a b ,
D i = d ( 1 1 p i 1 p 0 ) ,
D e = D i .
After the detection of the HeP failure mode, the importance of quantifying the randomness in the positioning of concrete armor units was pointed out by Medina et al. [42] and Pardo et al. [43]. They proposed three Armor Randomness Indexes (ARIs) for cubes and Cubipod®, which are calculated from the angles between the armor unit’s faces, the slope plane, and the faces of the neighboring armor units. The coefficients ARI1 and ARI2 serve to evaluate the face-to-face disposition around a given armor unit.

2.2.9. C, Cover Depth

The minimum remaining depth of the cover layer along a profile (see Figure 2) was defined by Tørum et al. [44] and used by authors such as Davies et al. [16] or Melby and Kobayashi [5]. This descriptor decreases with damage and, thus, it does not accomplish the desired properties of a damage descriptor described before. In addition, Medina and Hudspeth [45] stated that Cis not a good damage parameter to be selected for practical design applications” because, even for C = 0, the breakwater still preserves significant resistance.

2.2.10. E, Dimensionless Eroded Depth and L, Dimensionless Eroded Length

E and L (see Figure 2) were defined by Melby and Kobayashi [15] after noticing some of the already-mentioned weaknesses in the dimensionless eroded area, S. These descriptors provide information, respectively, about the worst eroded depth and worst eroded length of a section and they are directly proportional to damage increase:
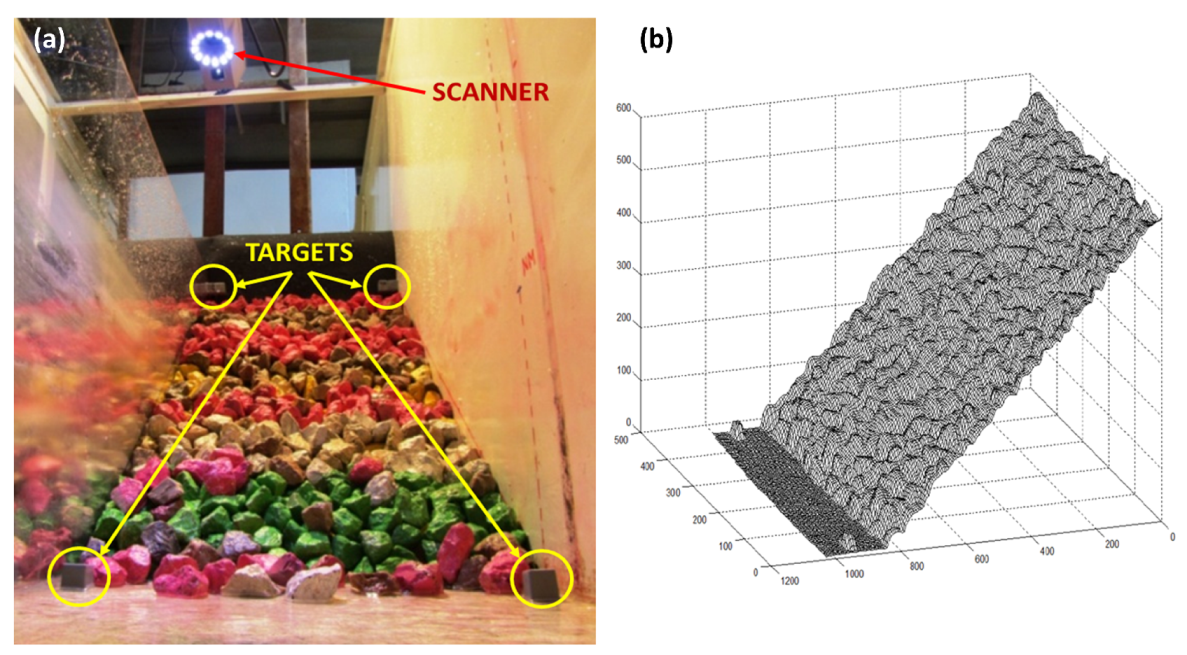
  • E is calculated from the maximum eroded depth. It indicates the progress towards failure, especially if failure is defined by the exposure of the underlayer. In line with the descriptor S, the magnitude of E differs from being calculated as a maximum value of a whole section, as a maximum value from an averaged profile or as a mean value from the maximum depths on each profile. In Campos [46], also a mean eroded depth was evaluated by considering the whole eroded volume from a high-resolution 3D mesh measured with a structured light scanner.
  • L, which is related to the extension of the damage area, was not directly measured in the experiments from Melby and Kobayashi [15]. However, nowadays its measurement is feasible and affordable with the latest techniques described in Section 2.3.2., offering information about the shape of the holes when combined together with E and S.
Based on applying innovative and accurate measuring techniques and inspired by the descriptors from Melby and Kobayashi [15], Hofland et al. [47] proposed averaging the eroded depth as a stable descriptor less dependent on the breakwater slope. In this case, E is calculated from a moving average applied to the cross-shore direction in 2D cases and over a circular area in 3D cases. Again, this descriptor allows a local identification of damage based on the exposure of the underlayer, although it does not provide information about the horizontal extent of the damage hole. Based on a few examples, Holfland et al. [47] recommended three qualitative damage thresholds regarding E, which were re-analyzed in de Almeida et al. [18]. New 3D descriptors based on modifying the size of the averaging circular area for computing the value of E were explored and analyzed in de Almeida et al. [18] and Van Gent et al. [7].

2.2.11. hn, Neutral Point between Eroded and Accreted Areas

Despite not being a damage descriptor, an almost constant value of water depth between the eroded and accreted areas was reported by Medina [27]. The neutral water depth was stated to match with HD = 0, the limit wave height that induces zero damage. This is in line with the indications for defining the “active zone” by the SPM [17]. The neutral point seems to be independent of the damage level and also independent of Iribarren’s number. Nevertheless, it is expectable a variation of this parameter together with variations in the water level. Ota et al. [48] also found a constant location of the neural point for revetments, showing no dependence on armor damage level.

2.2.12. Summary of Damage Descriptors

Damage descriptors described in this Section are summarized in Table 2, together with a color code for evaluating the accomplishment of the recommended requirements from Abanades et al. [20]:
  • All of them increase with damage, except for the cover depth. For this reason, and also because even for C = 0 the breakwater still preserves significant resistance, the cover depth is not a good damage index to be selected for practical design.
  • All of them are dimensionless and, therefore, independent of the scale. However, small-scale experiments are subjected to scale effects [49,50], especially taking into account the effect of core porosity on the stability and run-up [51,52] and the potential surface tension scale effects. In addition, the so-called length effect introduced by Van Gent et al. [7] needs to be considered, i.e., damage deviations might be expectable as the width of a real structure is likely to be longer than the scaled width tested on a wave flume. In this sense, damage characterization needs to be extrapolated also to prototypes, typically by monitoring campaigns after storms, in order to increase the accuracy of damage models.
  • The range of variation is known for damage descriptors varying from 0 to 100%. For those descriptors with limited available information or with an undefined range of variation, this requirement is classified as not accomplished. Finally, those descriptors in which limit values are found in the literature, but they vary according to each author, are evaluated as partially accomplished. For instance, different maximum (failure) values of S were given for the same conventional breakwater as shown in Table 1.
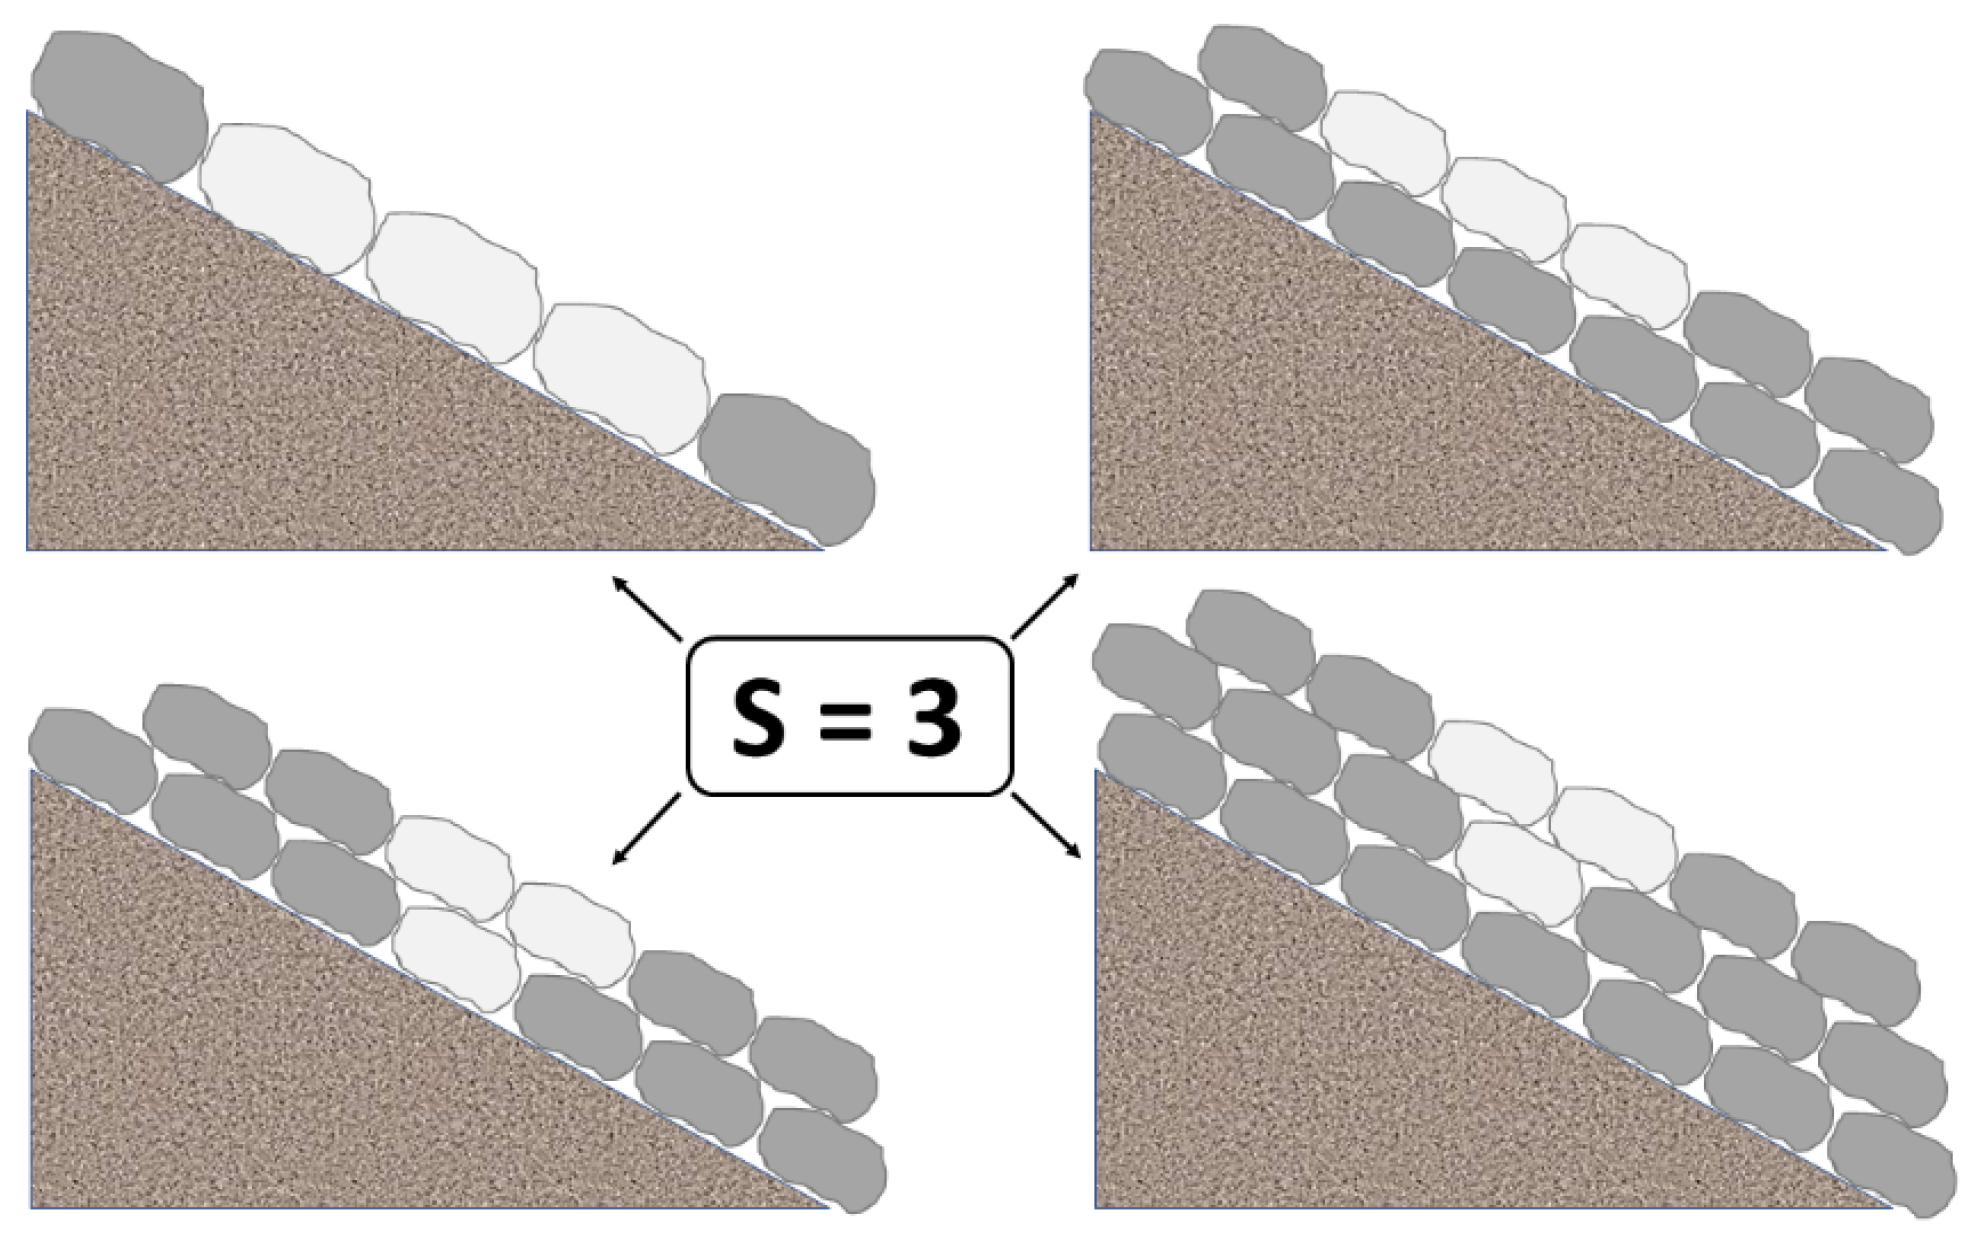
  • None of them were considered to provide clear information about damage level, i.e., none of them were evaluated as easily interpretable, because their direct extrapolation to qualitative damage criteria seems not to be straightforward. As it was presented in Table 1, even for the same conventional breakwater, there are differences in the magnitudes of S for each qualitative damage criteria. In addition, as shown in Figure 3, many damage configurations can be assigned to the same value for all the descriptors presented. This is due to the fact that none of the descriptors are capable of characterizing the shape and size of damage holes by themselves.
Damage initiation and progression is a 3D process, even for breakwaters tested in a wave flume. The eroded units from a certain profile are not necessarily accreted at the bottom of the same profile, as they could roll down following a non-normal trajectory. In addition, the consequences of the extraction of units concentrated in a deep pocket are different from an extensive superficial removal. The spatial component and shape of damage is, therefore, crucial to understand this failure mode; nevertheless, the available descriptors up to date seem to be mainly focused on measuring an averaged magnitude on a 2D profile. Even damage descriptors derived from visual methods, which are based on a front view of the slope, are averaged over a longitudinal width or over an active region, loosing information such as the planar shape of the eroded area or the number of eroded pockets.
The improvements and availability of accurate 3D measuring techniques and the versatility of artificial vision algorithms give us the chance nowadays to step forward more interpretable damage descriptors or combinations between them. What is more, new strategies might be explored, such as characterizing hole development and progression patterns. Thanks to the advances that can be already implemented for measuring damage (see Section 2.3), it is expectable that the traditional “side view” of profiling methods and the “front view” of visual methods will be combined together for a better characterization of the slope reshaping.

2.3. Damage Measurement

Damage measurement comes after choosing an adequate damage descriptor, but it could also affect how damage is defined due to technical or methodological limitations. Damage after a real or modeled storm is traditionally characterized following two main strategies: a visual approach or a measuring approach. Each of them presents different possibilities and considerations, as described in the following sections.

2.3.1. Visual Approach

This approach is quite common for monitoring real structures although it is not necessarily linked to a damage descriptor. For example, visual surveys in prototypes are usually aimed to obtain a qualitative indication of the condition of a breakwater. Usual surveying activities are locating the development of holes in the armor, identifying the exposure of under-layers, or checking the breakage of armor units or the evolution of cracks in the concrete capping.
The quantification of damage using visual methods is mostly related to counting the number of displaced units. For this purpose, the breakwater condition before and after the storm needs to be visually available with reference points.
In laboratory, a fixed camera, preferably under controlled lighting conditions, is commonly employed for that aim. The image resolution is essential in order not to restrict accuracy. A color coding for the various layers, or even for strips in the same layer, is normally utilized for facilitating the identification of armor movements. The counting process is accomplished by photo overlays or flicker technique. Additionally, semi-automated tools such as the armor tracking software of Holtzhausen et al. [53] can be used. As exposed in Section 2.2, some damage descriptors have their own measuring methodology; this is the case of the virtual net method [37] and the pixel counting method [9]. When combining the simultaneous treatment of all the color channels (RGB) with particle image velocimetry techniques, potential damage areas may be predicted through the identification of the energy dissipation zones at the structure [54].
In prototype, a fixed framing with an adequate point of view is rather unfeasible and, thus, additional resources are needed when accomplishing photographic surveying, such as marine or aerial vehicles. In these cases, the measuring process is less systematic as it depends on the capability of the craft, positioning system, and pilot/captain to set the craft at the desired place. It also depends on the ability of the photographer to spot the required area of interest. In addition, the process of identifying displacements is dependent on the skills of the trained assessor to interpret the visual information, especially when it comes from different campaigns with little matching between photographs.
Visual methods are easy to implement both in small-scale models and in prototype, economical and non-intrusive. They are particularly extended for the characterization of slopes with complex shapes, such as the ones containing special shaped concrete units. However, they present the following shortcomings:
  • First of all, they are just suitable for low damage levels. Note that, for a high number of displaced stones, unit counting is likely not to yield accurate results, it could be highly time consuming or it could be directly unfeasible. As a reference, David et al. [16] stated that for more than 50 removed stones, counting was likely to be complicated although it showed good agreement with profiling measurements up to 60–80 removed units. Similarly, Vidal et al. [9] stated that for SN > 12, the counting method was difficult to implement.
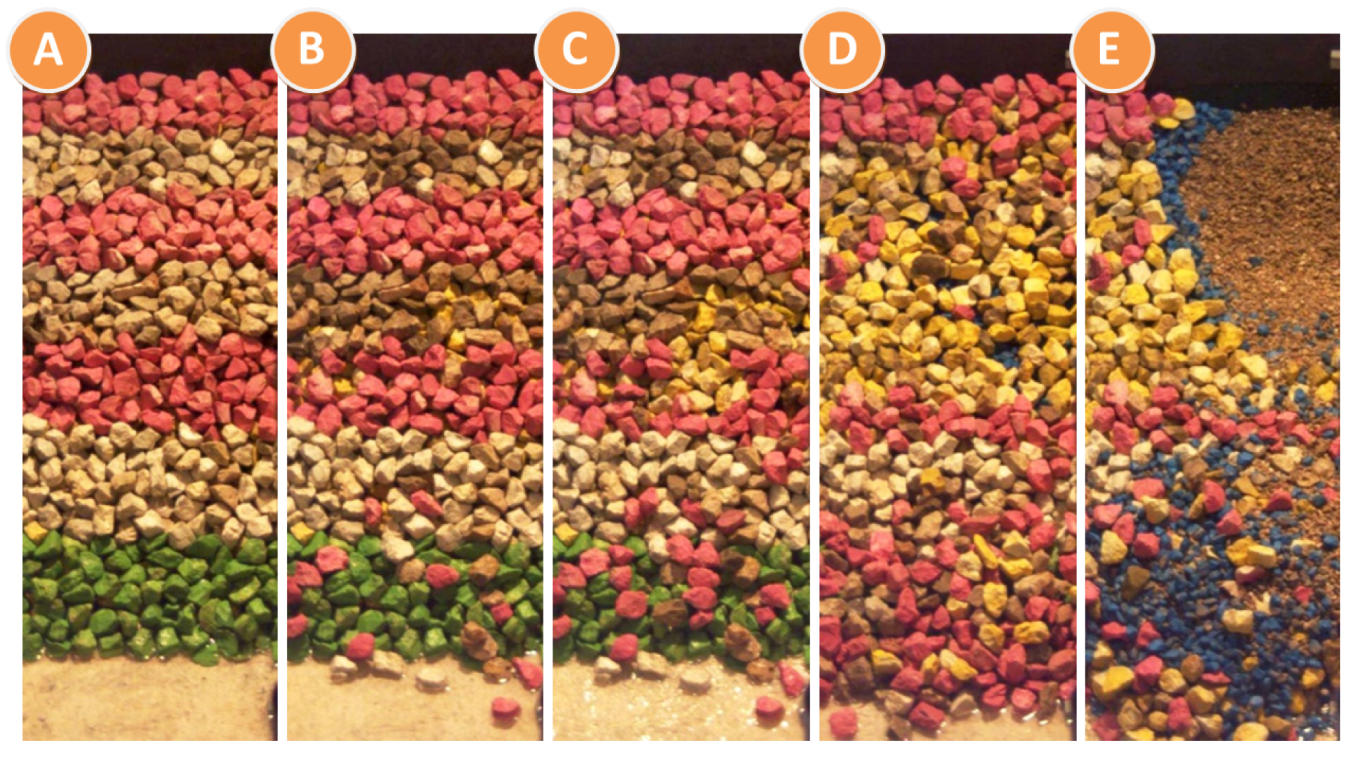
  • Secondly, most techniques are focused just on the surface, but not on the degree of penetration. This can be partially solved in small scale tests by using a color coding for the different layers. Note that, in laboratory, the whole section can be visually inspected, whereas in prototype this method is just able for the emerged zone.
  • Finally, the identification of displacements has a certain degree of subjectivity and expertise. In this sense, the standardization of the inspection process, the use of assisting software, or the concise definition of thresholds for distinguishing between rocking and displacements are some of the issues needed for reproducibility. In order to assess the uncertainty in the identification process, analyzing the information by different trained assessors is recommended.

2.3.2. Measuring Approach

This method is based on the 2D or 3D reconstruction of a profile or section, in which the quantification of damage is usually calculated by means of eroded area/volume regarding a non-damaged section. Note that the construction process induces some “initial damage” when comparing the theoretical shape with the real one and, thus, the characterization of the initial state after construction is mandatory.
There is a wide range of measuring techniques, not always transferable from laboratory to prototype and vice versa. Some of them are described in this Section.
One of the most extended methods for damage measurement in laboratory is profiling several cross sections of the small-scale breakwater. Davies et al. [16] presented a complete description of the semi-automated profiling strategy used in their experiments and defined two kinds of profilers: electro-mechanical and mechanical profilers. The second ones were used in relevant studies on damage in rubble mound breakwaters [5,24,29,36,55,56]. According to Melby [26], the mechanical profiler usually employed at the WES consists on a rod equipped with a circular foot with a diameter equal to 0.56Dn50. This circular foot not only measures, but also acts like a physical filter, as pockets smaller than its size are neglected. However, due to the physical contact, mechanical profilers are an intrusive technique that could even provoke movements of armor units. Indeed, De Jong [57] reported that some rocks were pushed over a few times during their experiments. Despite being widely extended, it seems that there is not a standardized agreement on how to measure and compute damage, as it was remarked throughout this paper. In addition, there are no references on the optimal accuracy of the profiles or the required number of profiles, i.e., the long-shore distance between chainages and the number of cross sections respectively. For instance, Ahrens [55] measured 6 profiles, Thompson and Shuttler [36] aimed for 10 profiles, and Davies et al. [16] studied 9 profiles. In prototype, Tulsi [58] described the use of crane and ball survey methods, which can be seen as the extrapolation of mechanical profiling to prototype. However, in these cases, the profiles were not measured in the slope direction, but normal to the armor slope. Tulsi also reported that these prototype methods not always yielded accurate results and were highly time-consuming.
While profilers provide information about the 2D geometry, scanning, and photogrammetric methods are capable of measuring the 3D shape of the slope. Nowadays, there are different technologies that might be used for 3D restitutions, such as structured light scanners, infrared scanners, laser scanners, structure from motion (SfM) techniques, or digital stereo photography (DSP). Some of them were also available some years ago, e.g., the LIDAR technology (Laser Imaging Detection And Ranging) was developed in the early 1960’s, shortly after the invention of the laser. Nevertheless, they presented limitations in the availability and applicability for damage experiments in laboratory. Some authors, such as Melby [26], considered the possibility of using a laser scanner instead of a mechanical profiler, but rejected this option due to the limitations in the accuracy of the measurements and the post-processing difficulties. Indeed, before 2003 [9], no references of scanning methods in laboratory were found by the authors.
In recent years, new scanning instruments have been developed, together with new generations of post-processing and graphic tools that make easier the generation, treatment, and interpretation of the results. This technological development permits to measure in detail rubble mound slopes with a non-intrusive instrumentation that can be implemented both in small-scale experiments and in prototype. Some examples of the application of the LIDAR technology for measuring damage can be found in Pardo et al. [43], Thomsen et al. [59], or Puente et al. [60], characterizing different types of armor units such as rocks, cubes, and Cubipod®. Regarding techniques based on digital images, Moltisanti et al. [61], worked on the roto-translation tracking of every single accropode of a section using RGB-D cameras. Hofland et al. [47] proposed the DSP technique, applied also by other authors [7,18], which allows high accuracy and fine resolution based on pose estimation, triangulation, and bundle adjustment over a set of digital photographs. In order to avoid possible shadow areas from DSP, Campos et al. [6,46,62] utilized a similar technique based on a structured light scanner for developing a methodology for the probabilistic characterization of damage evolution in rubble mound breakwaters (see Figure 5).
In laboratory, the controlled conditions facilitate the scanning process, whereas in prototype, additional resources are usually needed, typically by means of aircrafts or watercrafts. Airborne LIDAR is probably one of the most extended measuring strategies for real structures, in which the SHOALS method (Scanning Hydrographic Operational Airborne Lidar Survey) from the USACE (United States Army Corps of Engineers), in operation since 1994, is one of the best-known examples.
The recent advent of non-military UAVs (unmanned aerial vehicles), also known as drones or RPAS (remotely piloted aircraft system), for consumer and commercial use has opened the door to photogrammetric techniques for reconstructing the 3D surfaces of breakwaters, such as the SfM technique. For that purpose, overlapped imagery is captured with a camera mounted on a gimbal and further parameters, such as the 3D position for each photograph, are acquired by the drone. The surface reconstruction is carried out afterwards, enhancing the results with surveyed ground control points. One of the main advantages of this novel technique is its affordability. As shown in Figure 6, it has been already applied for photogrammetric restitutions of breakwaters with accurate results.
According to Phelp and Zwamborn [64], at least one third of the “active zone” is not properly monitored when using aerial photography. Based on this, a factor of 1.5 is suggested to get a better approximation of total damage from the information recorded above water. Some of the techniques, such as LIDAR, have, nevertheless, a certain degree of penetration underwater and, thus, the 1.5 factor is just a broad approximation.
In order to characterize the submerged part of the breakwater in laboratory, water is usually drained out. In prototype, sounding methods are available for that aim, such as side-scan sonar or multi-beam echo soundings, which are relatively common for bathymetric restitutions. These methods, however, are not adequate in laboratory as the confined study area induces significant sound wave reflection and noise.
The different measuring techniques can be combined together for double checking or for obtaining seamless data of the whole section, including the emerged part, intertidal zone, and submerged part. As an example, Tulsi [58] proposed the characterization of the whole 3D surface of a real dolos breakwater, for damage survey purposes, by using a dual measuring method mounted on a boat. It consisted of a LIDAR scanner for the terrestrial mapping together with a multi-beam echo sounder for the submerged part.
The measuring approach requires, regardless of the technique employed, several post-processing strategies that are likely to affect the quantification of the eroded volume. Generally speaking, the following aspects need to be specified for reproducibility:
  • Methods for identifying and filtering erroneous values in the raw data.
  • Profile/surface reconstruction methods (such as interpolation, fitting, or meshing), including incomplete data reconstruction strategies [65].
  • Smoothing methods when applied.
  • Methods for filtering possible settlements, so as the geometrical characterization actually refers to the gaps caused by the displacements of armor units. In addition, methods for neglecting or classifying rocking might be of interest.
  • Methods for integrating the eroded area/volume (such as the Simpson’s method), for which correcting methods based on a balance between the eroded and the accreted area/volume can be considered. When using correcting methods, note that the porosity of the accreted volume might differ from the one derived from the construction process. Additionally, when applying them to the cross-sectional area, note that armor units’ movements are not necessarily gathered within the profile axis.
  • Finally, the basis for the calculation of the damage descriptor need to be unequivocal.
Measuring methods can be economically more demanding than visual methods but, on the other hand, they provide more accurate information and are able for any damage level, up to destruction. Some techniques, such as profiling, offer just a partial characterization of the surface, whereas others, such as scanning, collect the complete visible geometry. They also present the advantage of being independent of the subjectivity in the identification of displacements, although the quantification of the eroded volume can be affected by the measuring technique chosen, the data acquisition procedures and the post-processing strategies.
It is expectable that damage measurement will be common in prototype in the near future. In this sense, the complete methodology for its characterization, preferably transferable from laboratory to prototype and vice versa, needs to be defined in detail. Standard methodologies will foster the generation of comparable results and the possibility to monitor prototypes under the same basis.

3. Conclusions and Future Research

In many countries around the world, a strong economical effort in the construction of coastal infrastructures has already been faced. This, together with the expected modifications in the sea level and met-ocean conditions due to climate change, encourage the coastal engineering community towards the development of reliable risk management and decision-making tools. Taking into account the complexity and peculiarity of each harbor, initiatives such as Algeciras SAFEPORT [66] or Algeciras BRAINPORT [67] have dealt with this challenge by joining together all data sources associated with the port inside a big data platform. Data sources include, for instance, densified instrumental records, numerical predictions over a detailed meshing, and operational thresholds. Based on this platform, user-oriented interfaces were developed for a custom provision of the information and for improving collaboration and synergies among the whole port and logistics community.
In this context, it is expectable that the evolution in the concept of damage discussed in the present paper would be linked to the development of hybrid monitoring systems [68] together with virtual interfaces [69] in which all the collected information is adequately disposed for the user. These hybrid systems would require, on the one hand, the probabilistic characterization of the damage progression curve of each section [22] and how it is associated with other failure modes. In this way, depending on the functional requirements and the response of the structure, different operational and structural thresholds can be particularized for each case. On the other hand, damage models would need to be validated and enhanced by monitoring prototypes.
To accomplish this, as recursively reported by different authors, one of the pending challenges of the parameterization and measurement of damage is the standardization of procedures both in laboratory and prototype. This is needed for characterizing damage dispersion by repeating the experiments inside the same laboratory, for assimilating data from different laboratories, and for fostering an adequate monitoring of real structures. In this way, a gradually increasing data base with normalized results could be generated as a reference for similar structures. As suggested within the present paper, a standardized methodology would need to take into account, at least, the following considerations:
  • Firstly, the damage descriptor should increase together with breakwater damage, should be easily interpretable, should be dimensionless, and should present a known rank of variation. The review of main damage descriptors highlights the importance of unequivocally defining how its different parameters are meant to be computed.
  • Secondly, all factors involved in the data acquisition process should be specified, including the characteristics and settings of the measuring instruments. Depending on how damage is planned to be characterized, acquired data would mainly consists of images, videos, profiles, point clouds, or meshes and should be adequately identified temporally and spatially. In addition, in order to estimate the error derived from the measuring process and surface reconstruction, several repetitions of the same measured section may be compared, as recommended by Medina and Hudspeth [45].
  • Specifically, for small-scale experiments, an additional review on all the aspects that could condition the reproducibility of the results should be faced [46]. According to Clavero et al. [12], three issues are relevant for assimilating data from different sources: (1) the wave generation curve and the experimental space at the breakwater toe, (2) the location in the wave flume and the geometric scale of the models, and (3) the forcing sequence based on the increasing wave energy steps.
  • Finally, post-processing strategies need to be detailed. This includes (1) criteria for distinguishing between rocking movements and displacements, (2) filtering methods for erroneous values, settlements or rocking, (3) smoothing strategies when applied, (4) surface reconstruction methods, and (5) methods for integrating the eroded volume, possibly including erosion/accretion balance methods.

Author Contributions

Conceptualization: C.C. and R.M.-S.; investigation: Á.C.; resources: C.C. and R.M.-S.; writing—original draft preparation: Á.C.; writing—review and editing: Á.C., C.C. and R.M.-S.; visualization: Á.C., C.C. and R.M.-S.; supervision: C.C. and R.M.-S.; project administration: C.C. and R.M.-S.; funding acquisition: C.C. and R.M.-S. All authors have read and agreed to the published version of the manuscript.

Funding

This research was funded by the Spanish Ministry of Science and Innovation under the project BIA2009-10483 and the grant BES-2010-034048.

Acknowledgments

The authors are indebted to Cátedra Pablo Bueno for partial support.

Conflicts of Interest

The authors declare no conflict of interest.

References

  1. United States Army Corps of Engineers. Coastal Engineering Manual, EM 110-2-1100 (Part VI) Change 3 (28 September 2011); USACE: Washington, DC, USA, 2002. [Google Scholar]
  2. Construction Industry Research and Information Association. The Rock Manual. The Use of Rock in Hydraulic Engineering, 2nd ed.; CIRIA: London, UK, 2007. [Google Scholar]
  3. Campos, A.; Castillo, C.; Molina, R. Damage in Rubble Mound Breakwaters. Part I: Historical Review of Damage Models. J. Mar. Sci. Eng. 2020, in press. [Google Scholar]
  4. Carver, R.D.; Wright, B.J. Investigation of Wave Grouping Effects on the Stability of Stone-Armored, Rubble-Mound Breakwaters; U.S. Army Engineer Waterways Experiment Station: Vicksburg, MS, USA, 1991. [Google Scholar]
  5. Melby, J.A.; Kobayashi, N. Damage Progression and Variability on Breakwater Trunks. In Proceedings of the International Conference Coastal Structures ‘99, Santander, Spain, 7–10 June 1999; Volume 1, pp. 309–315. [Google Scholar]
  6. Campos, A.; Castillo, C.; Molina, R. Analysis of the Influence of the Different Variables Involved in a Damage Progression Probability Model. In Proceedings of the 34th International Conference on Coastal Engineering, Seoul, Korea, 15–20 June 2014. [Google Scholar]
  7. van Gent, M.; de Almeida, E.; Hofland, B. Statistical Analysis of the Stability of Rock Slopes. J. Mar. Sci. Eng. 2019, 7, 60. [Google Scholar] [CrossRef] [Green Version]
  8. Marzeddu, A.; Oliveira, T.C.A.; Sánchez-Arcilla, A.; Gironella, X. Effect of Wave Storm Representation on Damage Measurements of Breakwaters. Ocean Eng. 2020, 200, 107082. [Google Scholar] [CrossRef]
  9. Vidal, C.; Martin, F.; Negro, V.; Gironella, X.; Madrigal, B.; García-Palacios, J. Measurement of Armor Damage on Rubble Mound Structures: Comparison between Different Methodologies. Coast. Struct. 2003, 189–200. [Google Scholar]
  10. van Gent, M.R.A.; van den Boogaard, H.F.P.; Pozueta, B.; Medina, J.R. Neural Network Modelling of Wave Overtopping at Coastal Structures. Coast. Eng. 2007, 54, 586–593. [Google Scholar] [CrossRef] [Green Version]
  11. Allsop, N.; Cork, R.; Henk Jan Verhagen, I. A Database of Major Breakwaters around the World. In Proceedings of the ICE Breakwaters Conference, Edinburgh, UK, 16–18 September 2009. [Google Scholar]
  12. Clavero, M.; Díaz-Carrasco, P.; Losada, M.Á. Bulk Wave Dissipation in the Armor Layer of Slope Rock and Cube Armored Breakwaters. J. Mar. Sci. Eng. 2020, 8, 152. [Google Scholar] [CrossRef] [Green Version]
  13. Gómez, R.; Molina, R.; Castillo, C.; Rodríguez, I.; López, J.D. Conceptos y Herramientas Probabilísticas Para El Cálculo Del Riesgo En El Ámbito Portuario; Puertos del Estado: Madrid, Spain, 2018. [Google Scholar]
  14. Losada, M.A.; Desire, J.M.; Alejo, L.M. Stability of Blocks as Breakwater Armor Units. J. Struct. Eng. 1986, 112, 2392–2401. [Google Scholar] [CrossRef]
  15. Vidal, C.; Losada, M.; Medina, R. Stability of Mound Breakwater’s Head and Trunk. J. Waterw. Port Coast. Ocean Eng. 1991, 117, 570–587. [Google Scholar] [CrossRef]
  16. Davies, M.H.; Mansard, E.P.D.; Cornett, A.M. Damage Analysis for Rubble-Mound Breakwaters. In Proceedings of the 24th International Conference on Coastal Engineering, Kobe, Japan, 23–28 October 1994; Volume 1, pp. 1001–1015. [Google Scholar]
  17. USACE. Shore Protection Manual, 4th ed.; U.S. Army Engineer Waterways Experiment Station, U.S. Government Printing Office: Washington, DC, USA, 1984.
  18. de Almeida, E.; van Gent, M.R.A.; Hofland, B. Damage Characterization of Rock Slopes. J. Mar. Sci. Eng. 2019, 7, 10. [Google Scholar] [CrossRef] [Green Version]
  19. Campos, A.; Castillo, C.; Molina, R. Optimizing Breakwater Design Considering the System of Failure Modes. In Proceedings of the 32nd International Conference on Coastal Engineering, Shanghai, China, 30 June–5 July 2010. [Google Scholar]
  20. Abanades, J.; Gómez, R.; Castillo, C.; Molina, R. Revisión Histórica de Las Variables y Modelos de Evolución de Daño En Diques En Talud y Su Adecuación Al Estudio Del Fenómeno. In Proceedings of the XI Jornadas Españolas de Costas y Puertos, Las Palmas, Spain, 5 May 2011. [Google Scholar]
  21. Vidal, C.; Losada, M.A.; Medina, R.; Losada, I. Análisis de La Estabilidad de Diques Rompeolas. Diques Rompeolas 1994, 1, 17–34. [Google Scholar] [CrossRef] [Green Version]
  22. Castillo, C.; Castillo, E.; Fernández-Canteli, A.; Molina, R.; Gómez, R. Stochastic Model for Damage Accumulation in Rubble-Mound Breakwaters Based on Compatibility Conditions and the Central Limit Theorem. J. Waterw. Port Coast. Ocean Eng. 2012, 138, 451–463. [Google Scholar] [CrossRef]
  23. Broderick, L.; Ahrens, J.P. Riprap Stability Scale Effects, Technical Report TP 82-3; ASCE: Reston, VA, USA, 1982. [Google Scholar]
  24. Van Der Meer, J.W. Rock Slopes and Gravel Beaches under Wave Attack. Ph.D. Thesis, Delft Technical University, Deltf, The Netherlands, 1988. [Google Scholar]
  25. van Gent, M.; Smale, A.; Kuiper, C. Stability of Rock Slopes with Shallow Foreshores. Coast. Struct. 2003, 100–112. [Google Scholar] [CrossRef]
  26. Melby, J.A. Damage Progression on Rubble-Mound Breakwaters, Technical Report CHL-99-17; US Army Corps of Engineers, Waterways Experiment Station: Vicksburg, MS, USA, 1999. [Google Scholar]
  27. Medina, J.R. Robust Armor Design to Face Uncertainties. In Proceedings of the 23rd International Conference on Coastal Engineering, Venice, Italy, 4–9 October 1992; Volume 2, pp. 1371–1384. [Google Scholar]
  28. Bradbury, A.P.; Allsop, N.W.H.; Latham, J.P.; Mannion, M.B.; Poole, A.B. Rock Armour for Rubble Mound Breakwaters, Sea Walls and Revetments: Recent Progress, Report SR 150; Hydraulics Research: Wallingford, UK, 1988. [Google Scholar]
  29. Hudson, R.Y. Laboratory Investigation of Rubble-Mound Breakwaters. J. Waterw. Harb. Div. ASCE 1959, 85, 93–121. [Google Scholar]
  30. Jackson, R.A. Limiting Heights of Breaking and Nonbreaking Waves on Rubble Mound Breakwaters, Technical Report H-68-3; U.S. Army Engineer Waterways Experiment Station: Vicksburg, MI, USA, 1968. [Google Scholar]
  31. Teisson, C. Statistical Approach of Duration of Extreme Storms: Consequences on Breakwater Damages. In Proceedings of the 22nd International Conference on Coastal Engineering, Delft, The Netherlands, 2–6 July 1990; pp. 1851–1860. [Google Scholar]
  32. Cornett, A.M. A Study of Wave-Induced Forcing and Damage of Rock Armour on Rubble-Mound Breakwaters. Ph.D. Thesis, University of British Columbia, Vancouver, BC, Canada, 1995. [Google Scholar]
  33. Vidal, C.; Losada, M.; Mansard, E. Stability of Low-Crested Rubble-Mound Breakwater Heads. J. Waterw. Port Coast. Ocean Eng. 1995, 121, 114–122. [Google Scholar] [CrossRef]
  34. Burcharth, H.F.; Kramer, M.; Lamberti, A.; Zanuttigh, B. Structural Stability of Detached Low Crested Breakwaters. Coast. Eng. 2006, 53, 381–394. [Google Scholar] [CrossRef] [Green Version]
  35. Hedar, P.A. Stability of Rock-Fill Breakwaters. Ph.D. Thesis, University of Goteborg, Gothenburg, Sweden, 1960. [Google Scholar]
  36. Thompson, D.M.; Shuttler, R.M. Riprap Design for Wind-Wave Attack, a Laboratory Study in Random Waves, Report No. EX 707; Hydraulics Research: Wallingford, UK, 1975. [Google Scholar]
  37. Gómez-Martín, M.E.; Medina, J.R. Wave-to-Wave Exponential Estimation of Armor Damage. In Proceedings of the 29th International Conference on Coastal Engineering, Lisbon, Portugal, 19–24 September 2004; pp. 3592–3604. [Google Scholar]
  38. Gómez-Martín, M.E.; Medina, J.R. Damage Progression on Cube Armored Breakwaters. In Proceedings of the 30th International Conference on Coastal Engineering, San Diego, CA, USA, 3–8 September 2006; pp. 5229–5240. [Google Scholar]
  39. Medina, J.R.; Molines, J.; Gómez-Martín, M.E. Influence of Armour Porosity on the Hydraulic Stability of Cube Armour Layers. Ocean Eng. 2014, 88, 289–297. [Google Scholar] [CrossRef] [Green Version]
  40. Gómez-Martín, M.; Herrera, M.; Gonzalez-Escriva, J.; Medina, J. Cubipod® Armor Design in Depth-Limited Regular Wave-Breaking Conditions. J. Mar. Sci. Eng. 2018, 6, 150. [Google Scholar] [CrossRef] [Green Version]
  41. Argente, G.; Gómez-Martín, M.; Medina, J. Hydraulic Stability of the Armor Layer of Overtopped Breakwaters. J. Mar. Sci. Eng. 2018, 6, 143. [Google Scholar] [CrossRef] [Green Version]
  42. Medina, J.R.; Gómez-Martín, M.E.; Corredor, A. Armor Unit Placement, Randomness and Porosity of Cube and Cubipod Armor Layers. In Proceedings of the Coastal Structures, Yokohama, Japan, 6–8 September 2011; pp. 743–754. [Google Scholar]
  43. Pardo, V.; Herrera, M.P.; Molines, J.; Medina, J.R. Placement Test, Porosity, and Randomness of Cube and Cubipod Armor Layers. J. Waterw. Port Coast. Ocean Eng. 2013, 140, 04014017. [Google Scholar] [CrossRef] [Green Version]
  44. Tørum, A.; Mathiesen, B.; Escutia, R. Reliability of Breakwater Model Tests. In Proceedings of the Coastal Structures, Washington, DC, USA, 14–16 March 1979; pp. 454–469. [Google Scholar]
  45. Medina, J.; Hudspeth, R. Discussion about the Article from Melby, J.A., Kobayashi, N. Progression and Variability of Damage on Rubble Mound Breakwaters. J. Waterw. Port Coast. Ocean Eng. 2000, 126, 268–272. [Google Scholar] [CrossRef]
  46. Campos, A. A Methodology for the Analysis of Damage Progression in Rubble Mound Breakwaters. Ph.D. Thesis, Universidad de Castilla-La Mancha, Ciudad Real, Spain, 2016. [Google Scholar]
  47. Hofland, B.; Gent, M.V.; Raaijmakers, T.; Liefhebber, F. Damage Evaluation Using the Damage Depth. In Proceedings of the Coastal Structures, Yokohama, Japan, 5–9 September 2011; pp. 812–823. [Google Scholar]
  48. Ota, T.; Matsumi, Y.; Hirayama, T.; Kimura, A. Models for Profile Change of Rubble Mound Revetment and Profile Evaluation. In Proceedings of the 32nd International Conference on Coastal Engineering, Shanghai, China, 30 June–5 July 2010. [Google Scholar]
  49. Hughes, S.A. Physical Models and Laboratory Techniques in Coastal Engineering; World Scientific Publishing Company Incorporated: Hackensack, NJ, USA, 1993; Volume 7. [Google Scholar]
  50. Tirindelli, M.; Lamberti, A.; Paphitis, D.; Collins, M.; Vidal, C.; Hawkins, S.; Moschella, P.; Burcharth, H.; Sanchez-Arcilla, A. Wave Action on Rubble Mound Breakwaters: The Problem of Scale Effects, Delos Report D52; Hydraulic Engineering Reports; University of Bologna: Bologna, Italy, 2004. [Google Scholar]
  51. Hegde, A.V.; Srinivas, R.P. Effect of Core Porosity on Stability and Run-up of Breakwaters. Ocean Eng. 1995, 22, 519–526. [Google Scholar] [CrossRef]
  52. Burcharth, H.F.; Liu, Z.; Troch, P. Scaling of Core Material in Rubble Mound Breakwater Model Tests. In Proceedings of the 5th International Conference on Coastal and Port Engineering in Developing Countries, COPEDEC V, Cape Town, South Africa, 19–23 April 1999; pp. 1518–1528. [Google Scholar]
  53. Holtzhausen, A.H.; Retief, G.D.F.; Zwamborn, J.A. Physical Modelling of Dolos Breakwaters: The Coega Results and Historical Perspective. In Proceedings of the 27th International Conference on Coastal Engineering, Sydney, Australia, 16–21 July 2000; Volume 276, pp. 1536–1549. [Google Scholar]
  54. Molina, R.; Moyano, J.M.; Ortega-Sánchez, M.; Losada, M.A. Analysis of the Wave Interaction with a Rouble Mound Breakwater Using Video Imagery Techniques. In Proceedings of the Mediterranean Days PIANC, Palermo, Italia, 7–9 October 2008. PIANC. [Google Scholar]
  55. Ahrens, J.P. Large Wave Tank Tests of Riprap Stability; U.S. Army Engineer Waterways Experiment Station CERC: Vicksburg, MS, USA, 1975. [Google Scholar]
  56. Broderick, L. Riprap Stability, a Progress Report. In Coast. Struct; ASCE: Reston, VA, USA, 1983; pp. 320–330. [Google Scholar]
  57. De Jong, W. Experimental Research on the Stability of the Armour and Secondary Layer in a Single Layered Tetrapod Breakwater. Ph.D. Thesis, TU Delft, Delft, The Netherlands, 2003. [Google Scholar]
  58. Tulsi, K. Three-Dimensional Method for Monitoring Damage to Dolos Breakwaters. Ph.D. Thesis, Stellenbosch University, Stellenbosch, South Africa, 2016. [Google Scholar]
  59. Thomsen, J.B.; Røge, M.S.; Christensen, N.F.; Andersen, T.L.; Van Der Meer, J.W. Stability of Hardly Reshaping Berm Breakwaters Exposed to Long Waves. In Proceedings of the 34th International Conference on Coastal Engineering, Seoul, Korea, 15–20 June 2014. [Google Scholar]
  60. Puente, I.; Sande, J.; González-Jorge, H.; Peña-González, E.; Maciñeira, E.; Martínez-Sánchez, J.; Arias, P. Novel Image Analysis App.roach to the Terrestrial LiDAR Monitoring of Damage in Rubble Mound Breakwaters. Ocean Eng. 2014, 91, 273–280. [Google Scholar] [CrossRef]
  61. Moltisanti, D.; Farinella, G.M.; Musumeci, R.E.; Foti, E.; Battiato, S. Monitoring Accropodes Breakwaters Using RGB-D Cameras. In Proceedings of the VISAPP 2015-10th International Conference on Computer Vision Theory and Applications, Berlin, Germany, 11–14 March 2015; Volume 1, pp. 76–83. [Google Scholar]
  62. Campos, Á.; Molina-Sanchez, R.; Castillo, C. Damage in Rubble Mound Breakwaters. New Advances in the Calibration of a Damage Progression Probability Model . In Proceedings of the 7th International Conference on Physical Modelling in Coastal Science and Engineering (CoastLab), Santander, Spain, 22–26 May 2018. [Google Scholar]
  63. Rodríguez, B.; Díaz-Hernández, G.; López-Lara, J.; Tomás, A.; Álvarez de Eulate, M.F.; Medina, R.; Álvarez-Fanjul, E.; Pérez-Gómez, B.; García-Valdecasas, J.M. Proyecto SAMOA-2: Módulos de Agitación, Ondas Largas y Rebase, Descripción General (in Spanish). In Proceedings of the XV Jornadas Españolas de Ingeniería de Costas y Puertos, Malaga, Spain, 8–9 May 2019. [Google Scholar]
  64. Phelp, D.; Zwamborn, J.A. Correlation between Model and Prototype Damage of Dolos Breakwater Armouring. In Proceedings of the 27th International Conference on Coastal Engineering, Sydney, Australia, 16–21 July 2000; Volume 276. [Google Scholar]
  65. Esposito, M.B.; Díaz-Vilariño, L.; Martínez-Sánchez, J.; González -Jorge, H.; Arias, P. 3D Reconstruction of Cubic Armoured Rubble Mound Breakwaters from Incomplete Lidar Data. Int. J. Remote Sens. 2015, 36, 5485–5503. [Google Scholar] [CrossRef]
  66. Molina, R.; Rodríguez-Rubio, P.; Carmona, M.Á.; De los Santos, F.J. Guía Para La Aplicación de Un Sistema de Gestión de Riesgos Océano-Meteorológicos En El Ámbito Portuario y Su Evaluación: Certificación de Puerto Seguro Océano-Meteorológico; Autoridad Portuaria Bahía de Algeciras: Cádiz, Spain, 2017. [Google Scholar]
  67. Pernia, O.; De los Santos, F. Digital Ports: The Evolving Role of Port Authorities. Mega-sh. Issue PTI J. 2016, 69, 3032. [Google Scholar]
  68. Pereira, M.; Teodoro, A.C.; Veloso-Gomes, F.; Lima, J.; Oliveira, S. Port Infrastructure Control (Madeira Island, Portugal) through a Hybrid Monitoring System (GNSS and Accelerometers). Mar. Georesour. Geotechnol. 2016, 34, 617–629. [Google Scholar] [CrossRef]
  69. Marujo, N.; Trigo-Teixeira, A.; Sanches-Valle, A.; Araújo, A.; Caldeira, J. A New Methodology for Breakwater Damage Assessment and Its Implementation on a WebGIS. In Proceedings of the 34th International Conference on Coastal Engineering, Seoul, Korea, 15–20 June 2014. [Google Scholar]
Figure 1. Particular interpretation of the qualitative damage criteria defined in Vidal et al. [15] after a set of damage progression experiments carried out at the HRL-UPM of Madrid, Spain: (A) non-damaged section, (B) initiation of damage, (C) Iribarren’s damage, (D) initiation of destruction, (E) destruction.
Jmse 08 00306 g001
Figure 2. Sketch of a breakwater section with the definition of some damage parameters. Adapted from Melby [26].
Jmse 08 00306 g002
Figure 3. Various possible damage configurations with the same damage descriptor, S = 3. Adapted from Davies et al. [16].
Jmse 08 00306 g003
Figure 4. Bias (left) and relative error (right) between calculating the dimensionless eroded area of a section from an averaged profile (S) or from averaging damage indexes from each profile (Smd). Despite, in theory, both options should yield exactly the same results, in this case, the differences seem to be derived from the smoothing method based on cubic splines applied to the profiles: Smd is calculated from smoothed profiles, whereas the averaged slope for evaluating S is calculated smoothing the profile resulting from averaging the measurements at each fixed chainage. Figure based on the experimental data of Bradbury et al. [28].
Jmse 08 00306 g004
Figure 5. (a) Scanning in process (with a structured light scanner) of a drained section as part of damage progression tests carried out at the HRL-UPM of Madrid, Spain; (b) Resulting point cloud. Reproduced from Campos [46].
Jmse 08 00306 g005
Figure 6. Image from a RPAS (remotely piloted aircraft system) equipped with a digital camera and photogrammetric restitution of a section of the breakwater of Carboneras, Almería (Spain). Source: ZEUSair Project / SAMOA II Overtopping Project [63].
Jmse 08 00306 g006
Table 1. Thresholds of S for different damage levels for non-overtopped two layers conventional breakwaters according to Vidal et al. [21] and the Rock Manual [2].
DIMENSIONLESS EROSION AREA (S)
Threshold 1Threshold 2–3Threshold 4
Cot αDamage Initiation [21]Start of Damage [2]Iribarren’s damage [21]Initiation of destruction [21]Intermediate Damage [2]Destruction [21]Failure [2]
1.51.522.56.53 to 5128
222384 to 6148
32.523.59.56 to 91612
4334118 to 121817
Table 2. Synthesis of damage descriptors and accomplishment of the recommended requirements defined in Abanades et al. (2011) [20].
Requirements of a Damage Descriptor Defined in Abanades et al. (2011) [20]SD%SNDN%NoNΔStDeCEL
Increase with damage
Dimensionless
Known range of variation
Easily interpretable
Accomplished Partially accomplished Not accomplished

