Technical Note

Modelling of Waves for the Design of Offshore Structures

by
Ove Tobias Gudmestad
Department of Mechanical and Structural Engineering and Materials Science, University of Stavanger, N-4036 Stavanger, Norway
J. Mar. Sci. Eng. 2020, 8(4), 293; https://doi.org/10.3390/jmse8040293
Submission received: 27 March 2020 / Revised: 14 April 2020 / Accepted: 18 April 2020 / Published: 19 April 2020

Abstract

:
For the design of structures we need to select design safety levels to ensure structures shall safely operate and not collapse. These levels are given in relevant safety standards. For these levels we need to identify the actions and ensure that we design according to recognized codes. The objective of this technical note is to shed light on the identification of the design action due to waves to ensure that the design action events be incorporated in the design phase of the structures. The approach used in this technical note is to give a description of an actual extreme event, discuss the efforts and research that was undertaken to explain the event, investigate wave conditions which possibly could have been present at the day of the event, and present a challenge and suggestion for wave tanks to ensure that design action events really are identified during wave tank experiments. We will, in particular, discuss the need for modelling of nonlinear waves to ensure that the action effects from waves are properly identified.

1. Introduction

The safety level selected for engineered facilities is to be chosen in accordance with international standards. Countries or even corporations can, however, select higher safety levels if deemed adequate. In modern Load and Resistance Factor Design codes (for example, for oil and gas facilities and for the most important land-based structures, such as hydropower dams and nuclear energy producing facilities), the design of important facilities shall ensure that no collapse takes place for action effects having an annual probability of exceedance of 10−4 [1]. It is, therefore, of importance to identify a reliable estimate of the action effects with the selected annual probability of exceedance. In the case of structures or vessels in the sea, particular concern is related to identification of the design wave action effects.
In order to emphasis the need to identify the design action event, we are referring to a hereto unpublished large wave action event (the Draugen platform “ringing event” of March 1995). The possible occurrence of such an event was first identified during wave tank testing and the resulting actions identified in the experiments were incorporated in the design. Several years after the platform installation, the platform was shaken by a large wave. This event was considered to be a ringing event and the event identified in the wave tank was in principle confirmed. The challenge raised in this note is to ensure that extreme events be identified by wave tank testing.
The modern method of identifying design events by Computational Fluid Dynamics (CFD) modelling (see, for example, [2,3]) would represent an excellent way of carrying out parameter studies in the future; however, the CFD results need to be calibrated with results from wave tank tests to be considered reliable. In addition, to create a model of a full platform exposed to very large waves (which may be near to breaking) acting on a dynamic model of the platform would be a challenge which may exceed present computer capabilities.

2. The Draugen Ringing Event

A special wave action effect was reported on 12 March 1995 in the Norwegian Sea. It caused the Draugen mono-tower fixed concrete platform (Figure 1) at the Haltenbanken Area offshore central Norway to “shake fiercely”. The Draugen field is located in blocks 6407/9 and 6407/12, and the platform is located at 64.35 degrees North and 7.77 degrees East.
For reference regarding the wave event, we will cite descriptions given by Platform Manager N. G. Gundersen who was in charge of initiating Draugen, the first offshore oil and gas platform in the Haltenbanken Area (Norwegian Sea).
In 2016 Gundersen was interviewed by Reyne [4]: “During one day of March 1995, I was working in my office when I noticed that the painting hanging in front of my desk was not only swinging as it usually did, but punctually be lifted away from the wall before hitting it back. A hurricane was announced that day, and we could tell by the “bangs” shrilling in the site. I then received an unexpected call from Aberdeen Weather Center, warning me of a very large wave coming in our direction. According to them, we had only thirty minutes to prepare. I ran to the microphone in order to quickly stop the production and to summon every present individual to the gymnasium located on the lower deck. Once everyone gathered were standing in front of the inner walls, I stood in the center of the room and told them about “Rasmus”—this is the name sailors give to the largest waves. Everyone was quiet and alert. I explained them how well the conception of the platform had been led, using a short presentation that the engineering team gave me. I finally tried to reassure everyone expressing my unconditional faith in the designers’ work. My short speech was concluded by this precise sentence: now we can only wait for “Rasmus” to hit us. As soon as I finished pronouncing these words, the loudest, most shivery and violent “BANG” I have ever heard rang out in the gymnasium. We started to feel increasingly large motions under our feet, the projector I was using for the presentation all of a sudden left its place and rolled towards a wall. Once I caught it, all sundry sat and no one batted an eye while the room kept on pitching. I could not tell exactly how long it lasted but my guess would be more than a minute”.
To support this description, we will cite from a mail Gundersen wrote on 4 April 2007 to his former colleagues who were present during the event: “We had learned from the Aberdeen weather center that the hurricane that blew at its worst just then, could result in waves reaching abnormal sizes, quite likely near what is defined as the hundred-year wave. Both wind and wave direction, frequency of waves and the number of days that the wind had blown were all factors that could indicate such a situation. Some of the crew were upset, and I decided to gather all 134 persons in the gym for an orientation about the situation. Some had sat down on the floor, but most were standing along the walls. Pål Holme and I were even standing in the middle of the room”.
Gundersen informed about the design process and the large wave the platform was designed to withstand and reassured persons onboard; “….. but I hadn’t told this until Rasmus came full force. It first hit the shaft and then lifted itself up under the deck with a violent force. The entire platform shook and shook for many seconds. Everyone standing along the walls immediately sat down on the floor. I remember telling that we had just been hit by Rasmus. After a little more talk about the matter, everyone quietly went back to work. Draugen platform had certainly passed the test, but all the fish that the northern fishermen had hung up to dry under the platform had disappeared without a trace”.
Note that the airgap on the Draugen platform (from still water level to cellar deck) is 30 m. This does not mean, however, that the wave crest was 30 m, as the run-up of water along the legs is considerable under large wave events. Brief reports from four persons staying at Draugen during the event confirm Gundersen’s description. One person is firm in noting there were two consecutive wave impacts.
At Haltenbanken the significant wave height estimate (based on the Hindcast model NORA10 [5] for the period 1958–2011) corresponding to an annual exceedance probability of 10-2 is 17 m with an associated spectral peak period of 18 s. A 13 m significant wave was registered on 13th October 1995, however, the response to the wave event on 12th March of the same year was, according to Gundersen, more severe. An environmental contour diagram for design significant wave height Hs and associated peak period Tp at the Haltenbanken Area is given in Figure 2 [6]. The figure shows that waves close to the breaking limit (H/L > 0.14) would not be likely in deep water, however steep waves with relatively shorter wave periods and larger associated significant waves could occur. The diagram given in Figure 2 does not, however, cover any rogue wave situations as these waves are very unlikely.
One would like to know how the Aberdeen Weather Center could send a forecast, via a message, regarding the approach of a large wave. Notice that Shell was the operator of the platform and that Aberdeen was commissioned to give weather forecasts to the first platform installed in this region to the north on the Norwegian Shelf. It has, however, not been possible to obtain information regarding the background for the specific message given 27 years ago. Possible explanations are that:
  • A nonlinear wave [7] or rogue wave was detected in the area and it was estimated that it would appear at the Draugen platform within half an hour. Note that reports are available that nonlinear waves could sustain over such long distances [7,8].
  • Data from a MIROS radar were available from another location on the Haltenbanken area, at the Heidrun field [9]. This field, located 120 km to the north-north-west, had the platform installed in August 1994 and the field came into production in August 1995. Given a recording of a very steep wave event at this field, say with a period of 17 to 20 s, it would take an estimated 1 h to 1 h and 20 min for the wave event to reach Draugen. This would have made it possible for the Aberdeen Weather Center to reach out in time to warn the Draugen platform crew. Although the waves in February and March of 1995 in general were large, there is, however, no indication in the report [9] that there were waves with Hs higher than 10.5 m.
  • A Polar Low-pressure area was approaching with a speed equal to the phase speed of waves in the Polar Low [10] causing very rapid build-up of large waves. In a Polar Low the wave heights will continue to grow with time when the “resonant motion” continues, i.e., when the phase velocity is equal to the propagation speed of the Polar Low-pressure area.
  • Note that there were no wave radar nor buoy measurements at the Draugen platform until 1996.
Was there any warning that such an event as the 12 March 1995 event causing ringing motions could appear? It should be noted that in the late design phase of the Draugen platform, wave tank tests carried out at Marintek, Trondheim, Norway, identified that large waves could cause the platform (located in 250 m water depth) to oscillate/shake heavily, like in a “ringing” mode. As the ringing effect was detected in the late design phase, the platform was reinforced and redesigned to tolerate such events. One design modification was to raise the level of the deck and to widen the shaft below the deck to reduce the extreme load on the platform [11], see Figure 1. Since then, several researchers have presented explanations of the ringing events. The best-known explanation is the suggestion termed “FNV” by Faltinsen et al. [12]. We have also presented an explanation that the relative velocity term of the Morison equation may cause ringing-like motions for relatively slender offshore fixed structures where the Morison equation normally can be used to calculate the actions [13]. An unpublished study by Stansberg [14] has confirmed that a combined FNV-Morison model may explain the ringing identified by the Marintek scientists during the wave tank testing of the Draugen platform in the design phase.

3. Possible Explanation of the Draugen “Ringing Event”

It is well known that the traditional assumption of modelling irregular seas as sums of independent linear waves is insufficient for a proper description of severe low probability sea states. Crests get higher (Stokes nonlinear effects) and nonlinear wave-wave interactions make the waves grow at the expense of others [15,16].
The basic equations of wave analysis are partial differential equations, having an unlimited number of solutions. In this respect, it is relevant to also to point to nonlinear Soliton waves that satisfy all equations of hydrodynamics, whereby we replace the assumption that an irregular large sea state is composed of independent linear waves for wave conditions at very low probability of exceedance levels.
The Draugen platform was obviously hit by large waves in March 1995, and the response was reported to be of the “ringing type”. The event should be further investigated. Through discussions with Magnusson [17], it has been possible to identify, through using the hindcast database NORA10 [18], that the significant wave height at Draugen on the afternoon of 12 March 1995 grew from 5.1 meters to close to 9.6 meters in six hours (Figure 3), which is a very rapid increase of the sea state, similar to conditions which could appear in the case of Polar Lows [10] when the phase velocity is close to the speed of the Polar Low pressure area.
The growth of the significant wave height over the short time led to the suggestion that a very large sea state was approaching the area and the Aberdeen Weather Centre could have forecasted this development of the wave situation. Figure 2 cannot, however, confirm that the wave, which caused the event, was of a freak (rogue) wave type [19] or a steady wave that travelled undisturbed over a long distance; the Aberdeen Weather Centre warned that the platform staff “had only thirty minutes to prepare”. Explanations for the wave generation could be sought in modelling the sea state as an interaction between nonlinear waves as explained by, e.g., Osborne [7].
Concluding, the Draugen “ringing event” was probably caused by a high sea state situation which cannot be described as a sum of regular waves, rather by a nonlinear wave-wave interaction situation.

4. Freak Wave Modelling/Rogue Waves

Freak waves are a special type of nonlinear waves. They have been the attention of many researchers, in particular following the publication of the “Draupner New Year Wave”; see Haver [20] for a discussion of the phenomenon. Peaked three-dimensional freak waves were well known on the Danish Continental Shelf [21] and are of large concern due to their crest height. The air gaps have to be increased for fixed platforms to avoid large wave forces acting on the deck of a platform, which can topple the platforms. For the Danish Shelf, the author in the late 1990s recommended that jack-ups should be raised two additional meters to account for freak waves. The feed-back from the platform following a drilling spread on the Danish oil field Siri was that the wave had just passed below the platform deck raised according to the recommendation.
From time to time ships also encounter huge freak waves, almost rising unexpectedly from a calmer sea [22]. Professor Faulkner has contributed several papers on this theme; see, for example, [23].
It should furthermore be noted that Magnusson et al. [8] refer to a special wave condition called “The three sisters” and they analyze an event occurring on 30th November 2018 involving three consecutive double rouge waves. They state “that the wave group with the “Three Sisters” was quite long-lived, and may have had even more than three siblings prior to reaching target location”.
A possible explanation of the wave conditions at the Draugen ringing event may be found by using Nonlinear Fourier Analysis for studying ocean waves. This has been suggested by Osborne ([7] and [24]) and by using this formalism, the long-lived wave form might also be explained. This formalism, a type of Schrödinger nonlinear wave modelling, is to be considered, whereby we allow nonlinear wave-wave interaction [15].

5. The Challenge to Model Nonlinear Waves in the Wave Tank

Due to the discussion presented in this note, there is a need to ensure that the design wave is captured during wave tank testing. In order to carry out CFD analysis, it is also important to have wave tank tests to calibrate the CFD model results.
The design wave has to be captured in the wave tank by proper wave modelling. This can be done by ensuring that nonlinearity of the waves be modelled properly [7] and we should limit the length of the wave modelling to save time in the wave tank, while ensuring that the extreme situation be generated. Initial ideas and procedures on how one can reduce the necessary test duration time have been tested and discussed in [25]. It will in particular be necessary to model freak waves properly to ensure sufficient air gap and reliable estimates of the value of the action and action effects in case of wave in-deck events [26].
We will suggest that the modelling in the wave tank could be done by:
  • Creating a model wave trace (based on observed rogue wave information), analyze its Fourier components linearly, and ensure that the Fourier components catch up with each other and interact nonlinearly at the test location in the tank.
  • We could carry out a long time series experiment using linear waves whereby eventually a very large wave would appear through nonlinear wave-wave interaction, and then ensure that the captured surface profile is recreated from a sum of linear waves by Fourier analysis as suggested above.
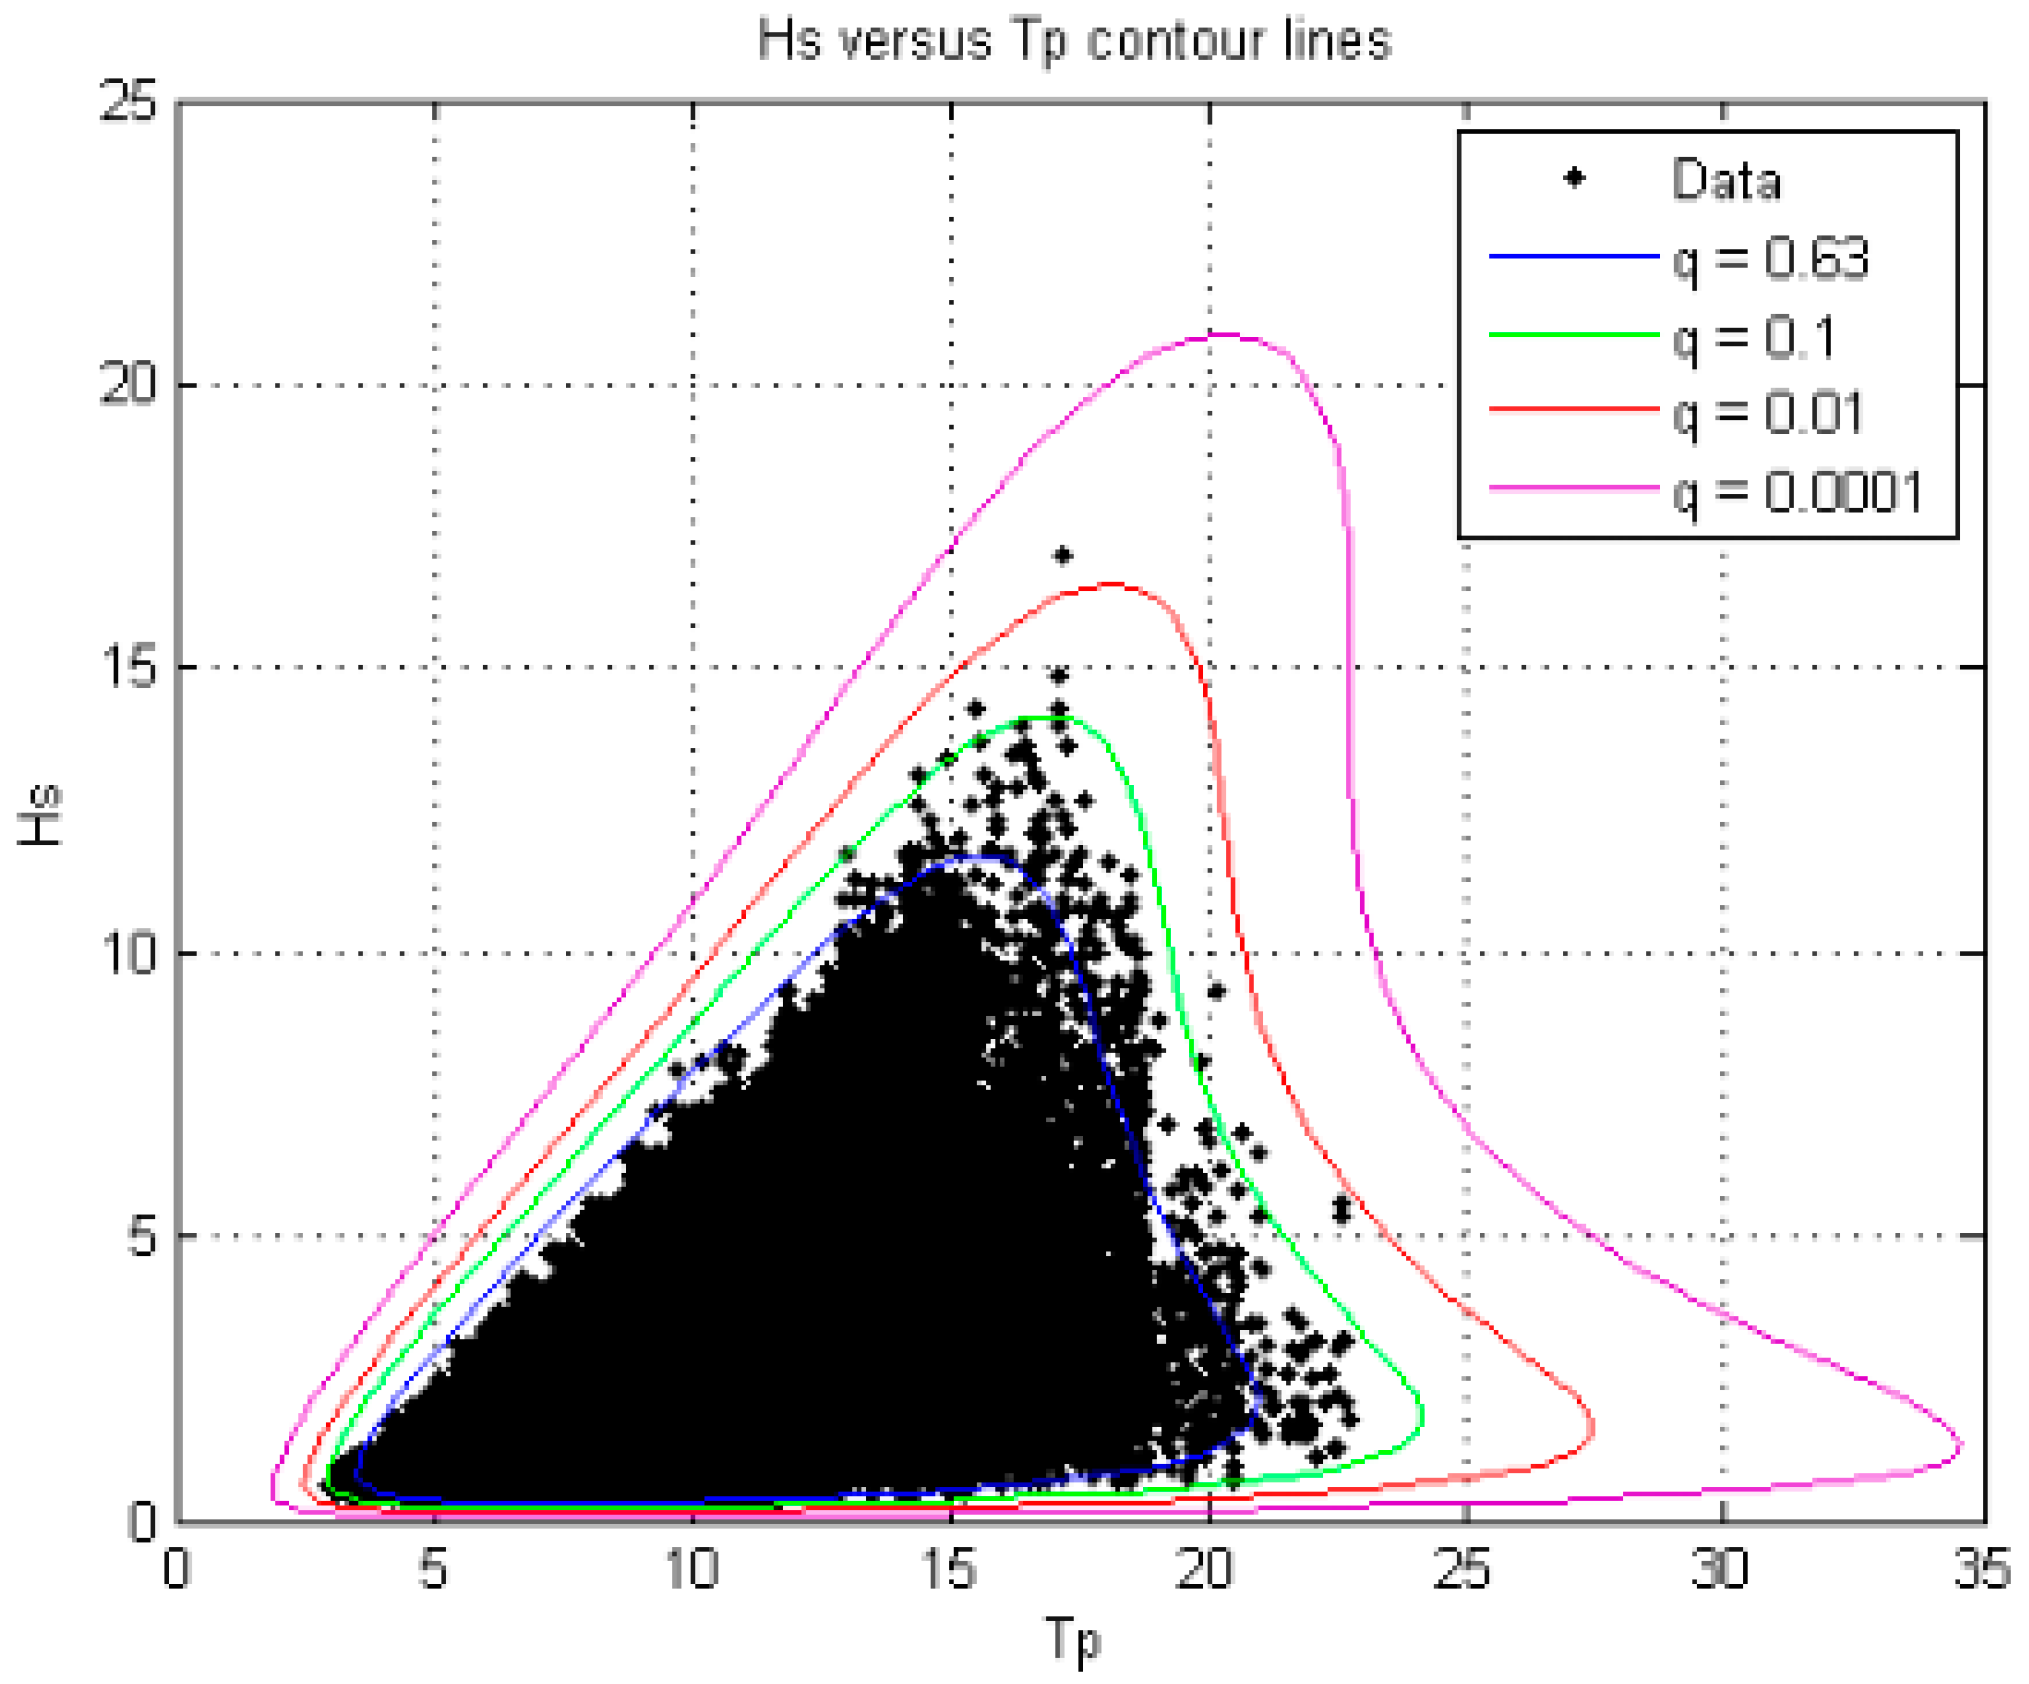
  • Alternatively, and preferably, we could create a series of steep waves selected in accordance with the environmental contour (Figure 2), which would interact nonlinearly at the test location in the wave tank.
  • We could also revisit the suggestion of Professor Clauss [27] to use wavelets to capture the design action situation.
For a situation like the “Three sisters” event [8], in addition to a linear wave superposition test, the first method suggested above may be fruitful. In the future, it may also be possible to identify the nonlinear interaction mechanism between steep waves, so the wave profile could be more easily created at the test location in the wave tank.
It may not be necessary to model breaking waves as these are considered rare and may not represent the design condition in deep waters, unless we need to design for a sloping sea bottom. It is well known, for example, that waves are breaking on the Dogger Bank in the North Sea [2]. Here, wind turbines are being considered. Studies of breaking wave loads on wind turbines have been undertaken for such conditions [3].

6. Conclusions

It is suggested that there are challenges to understand and to model the proper waves in a wave-tank in order to identify the design actions and action effects. Some specific challenges have been highlighted and references to published research considered to be of most relevance have been given.
The challenges should not be considered negligible, as it is important to identify the extreme waves, whereby the wave actions and the wave action effects are modelled such that safety of structures in the sea can be achieved. In this respect, we should notice that the same considerations apply to waves as to other rare natural events [28,29].

Funding

This research received no external funding.

Acknowledgments

The author acknowledges discussions with N.G. Gundersen, platform manager onboard the Draugen platform in 1995 and support from as well as good discussions with A.K. Magnusson of the Norwegian Meteorological Institute, Bergen, Norway.

Conflicts of Interest

The author declares no conflict of interest during preparation and publishing of this work.

References

  1. International Standardization Organization, ISO: ISO 19902. Petroleum and Natural Gas Industries—Fixed Steel Offshore Structures; ISO: Geneva, Switzerland, 2011. [Google Scholar]
  2. Choi, S.J. Breaking Wave Impact Forces on an Offshore Structure. Ph.D. Thesis, University of Stavanger, Stavanger, Norway, 2014. [Google Scholar]
  3. Jose, J. Offshore Structures Exposed to Large Slamming Wave Loads. Ph.D. Thesis, University of Stavanger, Stavanger, Norway, 2017. [Google Scholar]
  4. Reyne, B. Apparent Negative Damping, an Original Approach to the Oscillations of Offshore, Structures. Master’s Thesis, University of Nantes, Nantes, France and University of Stavanger, Stavanger, Norway, 2016. [Google Scholar]
  5. Standards Norway. Actions and Actions Effects; Norsok Standard N003: Lysaker, Norway, 2019. [Google Scholar]
  6. Haver, S.; Bruserud, K.; Baarholm, G.S. Environmental Contour Method: An Approximate Method for Obtaining Characteristic Response Extremes for Design Purposes. Statoil, DNV, 2012. Available online: http://waveworkshop.org/13thWaves/Papers/Sverre%20Haver%20_%20Wave%20Hindcast%20%20Forecast%20%20Environmental%20contour%20method.pdf (accessed on 10 April 2020).
  7. Osborne, A.R. Breather Turbulence: Exact Spectral and Stochastic Solutions of the Nonlinear Schrödinger Equation. Fluids 2019, 4, 72. [Google Scholar] [CrossRef] [Green Version]
  8. Magnusson, A.K.; Trulsen, K.; Bitner-Gregersen, E.M.; Aarnes, O.J.; Malila, M.P. “Three sisters” measured as a triple rogue wave group. In Proceedings of the Conference OMAE 2019, Paper OMAE2019-96837, Glasgow, UK, 9–14 June 2019. [Google Scholar]
  9. Iden, K.; Tønnessen, H. Environmental Data Heidrun TLP, Annual Synthesis 1997, Report Number 12/98 Klima; Norwegian Meteorological Institute: Bergen, Norway, 1998. [Google Scholar]
  10. Orimolade, A.P.; Furevik, B.R.; Noer, G.; Gudmestad, O.T.; Samelson, R.M. Waves in polar lows. J. Geophys Res. Ocean. 2016, 121, 6470–6481. [Google Scholar] [CrossRef]
  11. Gudmestad, O.T. Management of Challenges during the construction of offshore facilities. Int. J. Energy Prod. Manag. 2019, 4, 187–197. [Google Scholar] [CrossRef]
  12. Faltinsen, O.M.; Newman, J.N.; Vinje, T. Nonlinear wave loads on a slender vertical cylinder. J. Fluid Mech. 1995, 289, 179–198. [Google Scholar] [CrossRef]
  13. Hellevik, K.; Gudmestad, O.T. Limit cycle oscillations at resonances for systems subjected to nonlinear damping or external forces. J. Phys. Conf. Ser. (JPCS). The open-access IOP Conference Series. 2017. Available online: https://uis.brage.unit.no/uis-xmlui/handle/11250/2498756 (accessed on 18 April 2020).
  14. Stansberg, C.T. Comparing simple models for prediction of ringing loads and responses. In Sintef Report 580133.00.01; 2009. [Google Scholar]
  15. Dysthe, K.B. Note on a modification to the nonlinear Schrödinger equation for application to deep water waves. Proc. R. Soc. A 1979, 369, 105–114. [Google Scholar]
  16. Trulsen, K.; Dysthe, K.B. A modified nonlinear Schrödinger equation for broader bandwidth gravity waves on deep water. Wave Motion 1996, 24, 3281–3289. [Google Scholar] [CrossRef]
  17. Magnusson, A.K.; Meteorologisk Institutt, Oslo, Norway. Personal communication on mail on 25th October 2019 related to the Draugen ringing event, 1995.
  18. Reistad, M.; Breivik, Ø.; Haakenstad, H.; Aarnes, O.J.; Furevik, B.R.; Bidlot, J.R. A high-resolution hindcast of wind and waves for the North Sea, the Norwegian Sea, and the Barents Sea. J. Geophys. Res. 2011, 116, C05019. [Google Scholar] [CrossRef] [Green Version]
  19. Lopatoukhin, L.J.; Boukhanovsky, L.V. Statistics of extreme and freak waves. In Proceedings of the OMAE2006 25th International Conference on Offshore Mechanics and Arctic Engineering (Proceedings of the Conference OMAE 2006), Hamburg, Germany, 4–9 June 2006. Paper number OMAE2006-92236. [Google Scholar]
  20. Haver, S. A possible freak wave event measured at the Draupner Jacket January 1 1995. In Proceedings of the Conference on Rogue Waves, Brest, France, 20–22 October 2004; Olagnon, M., Prevosto, M., Eds.; Ifremer: Brest, France, 2004. [Google Scholar]
  21. Sand, S.E.; Ottesen-Hansen, N.E.; Jacobsen, V.; Gudmestad, O.T.; Sterndorff, M. Freak Wave Kinematics. In Proceedings of the NATO Advanced Research Workshop, Molde, Norway, 22–25 May 1989; Tørum, A., Gudmestad, O.T., Eds.; Kluwer Academic Press: Amsterdam, The Netherlands, 1990. [Google Scholar]
  22. Haver, S. Evidences of the Existence of Freak Waves. In Proceedings of the Rogue Waves 2000; Ifremer: Brest, France, 2000; pp. 129–140. [Google Scholar]
  23. Faulkner, D.; Buckley, W.H. Critical survival conditions for ship design. In Proceedings of the RINA first International Conference on Design and Operations for Abnormal Conditions, Glasgow, UK, 21–22 October 1997; pp. 1–25. [Google Scholar]
  24. Osborne, A.R. Nonlinear Fourier Analysis of Ocean waves. In Proceedings of the Keynote lecture at Sintef’s Seminar “Future paths and needs in wave Modelling”, Trondheim, Norway, 21–22 October 2019. [Google Scholar]
  25. Bunnik, T.; Stansberg, C.T.; Pakozdi, C.; Fouques, S.; Somers, L. Useful indicators for screening of sea states for wave impacts on fixed and floating platforms. In Proceedings of the Conference OMAE 2018, Paper No. OMAE2018-78544, Madrid, Spain, 17–22 June 2018. [Google Scholar]
  26. van Raaij, K.; Gudmestad, O.T. Wave in deck loading on fixed steel jacket decks. Mar. Struct. 2007, 20, 164–184. [Google Scholar] [CrossRef]
  27. Clauss, G.; Bergmann, J. Gaussian Wave Packets—A New Approach to Seakeeping Tests of Ocean Structures. Appl. Ocean Res. 1986, 8, 190–206. [Google Scholar] [CrossRef]
  28. Gudmestad, O.T. Rationale for Development of Design Basis for Barents Sea field developments. In Proceedings of the IOP Conference Series: Materials Science and Engineering 2019, Stavanger, Norway, 27–29 November 2019; The open-access IOP Conference Series. Volume 700. [Google Scholar]
  29. Bitner-Gregersen, E.M.; Toffoli, A. Probability of occurrence of rogue sea states and consequences for design of marine structures. Ocean Dyn. 2014, 64, 1457–1468. [Google Scholar] [CrossRef]
Figure 1. The Draugen platform ready to be towed to site in 1993. Note the slender concrete shaft and the widening at the top to support the topside facilities.
Jmse 08 00293 g001
Figure 2. Environmental contour lines for Haltenbanken [6], q is the annual probability of exceedance. Reproduced from [6]: Haver, S.; Bruserud, K.; Baarholm, G.S. Environmental Contour Method: An Approximate Method for Obtaining Characteristic Response Extremes for Design Purposes. Statoil, DNV, 2012 with permission from lead author Haver, 2020,The description of the wave event of 12 March 1995 can be summarized as follows: The wave event was forecasted by the Aberdeen Weather Center. There had been strong winds for a longer period and the wind during the event was strong with hurricane gusts. The platform was hit by two consecutive waves which caused the platform to oscillate (in “a ringing event”) for half a minute to one minute due to the impact load. The water splashed with large forces into the cellar deck removing fish hanging for drying under the deck and displacing fiberglass boxes that were strapped to the deck 30 m above the still water line.
Jmse 08 00293 g002
Figure 3. Significant wave height at Draugen, Haltenbanken during March 1995. Courtesy of the Norwegian Meteorological Institute, Bergen. The figure is reproduced from [17]; Magnusson, A.K. Personal communication 25th October 2019 related to the Draugen ringing event, March 1995 with permission from Magnusson October 2019.
Jmse 08 00293 g003

