Article

Consequences of Anthropic Actions in Cullera Bay (Spain)

Department of Civil Engineering, University of Alicante, Ctra. San Vicente del Raspeig s/n, 03690 San Vicente del Raspeig, Alicante, Spain
*
Author to whom correspondence should be addressed.
J. Mar. Sci. Eng. 2020, 8(4), 240; https://doi.org/10.3390/jmse8040240
Submission received: 14 February 2020 / Revised: 13 March 2020 / Accepted: 24 March 2020 / Published: 1 April 2020
(This article belongs to the Special Issue Selected Papers from the Spanish Days of Ports and Coasts)

Abstract

:
Urbanization and anthropogenic activities have generated significant imbalances in coastal areas. This study analysed the shoreline evolution of the Bay of Cullera (Spain), characterized by strong urban and tourist pressure and with important human interventions during the last century. The evolution of the shoreline was analysed using 60 years of aerial images since the 1950s of the seabed, the maritime climate and the distribution of sediment, as well as anthropogenic actions, such as urban development or the channelling of the Júcar River through the integration of information in a geographical information system (GIS). The results showed: (i) Changes in land-use, in which the substitution of the crop and mountain areas by urban areas was mainly observed. (ii) A general increase in the beach area, although there were important periods of erosion in some points due to anthropic actions. (iii) A significant decrease in the median sediment size in the whole bay since 1987, with a current D50 of 0.125–0.180 mm. The analysis carried out has made it possible to identify trends in coastal accumulation and regression in the different sections of the sector, as well as to demonstrate the usefulness and advantages of GIS.

1. Introduction

Since the 1950s, coastal erosion has increased in many areas as a result of human activity [1]. Accelerated erosion, the disappearance of beaches and dunes, increased frequency of flooding and ecosystem degradation are all symptoms of an inability to provide competent coastal management [2]. In addition to these impacts of urbanization, other anthropogenic actions have strongly influenced the balance of the coastal area [3,4,5], such as the extraction of sand and gravel from rivers and beaches (for construction and agricultural use), the construction of dams (which prevent the maximum supply of sediments from reaching the sea), the construction of groins and jetties and the destruction of coastal dunes for the construction of infrastructures.
In the context of coastal erosion, the disappearance of the dune areas deserves special attention. Coastal dunes constitute approximately three-quarters of the world’s coastline, occupying areas of transition between terrestrial and marine ecosystems [6,7]. These environments have specialized flora and fauna, and also constitute one of the most dynamic landscapes on earth, offering unique ecological services such as the filtration of large volumes of seawater, nutrient recycling, flood control and storm protection [8]. Defending against coastal erosion through dune systems is the most efficient and least costly measure [6,9]. This is because dunes are an integral part of the dynamic cycle of the coast, with a constant exchange between the two ecosystems in which it is in transition. Thus, when high-energy storms are generated that erode the beach, the dune is undermined, and this detached sand is washed offshore to the sandbanks that are responsible for dissipating the energy of the waves, causing them to break offshore.
One of the elements that can explain the coastal processes is the sediment, due to the relation that exists between their size, specific weight and the energy of the waves [10]. Therefore, it is necessary to study the evolution of the shoreline, and the transport and spatial and temporal distribution of sediments [11]. In this sense, geographic information systems (GIS), widely used in coastal risk assessment [12,13], or the evolution of cliff and seabed topography, are very useful [14,15]. Among the studies conducted, those of Rosskopf et al. [16] investigated the possible influence of natural and anthropogenic factors, especially climate variability and coastal defence structures designed on the coast of Molise. These authors concluded that the observed differences in rates of coastal change over time on the decadal to interannual scale and did not find an answer in the analysis of available data on marine meteorological conditions and indices of climate variability. Using the DSAS extension of ArcGIS software evidenced the impact of rigid structures, Molina et al. [17] found that accretion was essentially observed updrift of ports and groins and in correspondence of protection structures, especially of breakwaters. Erosion classes were observed downdrift of ports and groins and in correspondence of revetments/seawalls, and at largest river deltas, and “stability” was observed at pocket beaches and coastal areas locally stabilized by protection structures. Also, Di Paola, et al. [18] used GIS to study coastal risk in Gran Canaria, and highlighted the need for the relevant public administrations to develop a strategic approach to coastal management and sustainable development that considers socio-economic values and natural resources together.
This study aimed to analyse the actions carried out in the area of study (channelling, construction on the dune systems) that have led to the current situation of this biophysical system between land, sea and air. Specifically, the evolution of the shoreline, the distribution of sediment on the seafloor and the waves were analysed to predict future behaviour in the study area, as well as the consequences that must be considered before undertaking anthropogenic actions in any area.

2. Area of Study

This study was conducted in the municipality of Cullera, specifically in the so-called Bay of Cullera, which is located between the Cape of Cullera and the mouth of the Júcar River. Cullera is a municipality specially dedicated to the tourist offer with a population of 24,121 inhabitants [19], increasing it to 150,000 inhabitants in high season [20].
Except for the cliff area that constitutes the Cape of Cullera, the low, sandy coast predominates along the coastline under study. The width of the beaches differs significantly between the north and south of the river mouth, being wider from this division towards the north due to natural and anthropic factors [21]. The average width on the southern beaches is 12 m, while, on the northern beaches, the average width of the beaches is 20 m [22]. The shoreline studied extends from Los Olivos beach to San Antonio beach (Figure 1).
From the morphosedimentary perspective, the space considered is within a sedimentary dynamic that encompasses the entire southern sector of the Gulf of Valencia, which extends from the port of Valencia to the coast of Denia (Figure 1b). This longitudinal sedimentary transport dynamic is characterized, as in the rest of the gulf, by the existence of a coastal drift from north to south [23]. The sedimentary supply that reaches the studied coast comes from the fluvial contributions of the rivers that predominate in this sector: (i) The River Túria, which affects the beaches to the north of the Cape of Cullera, and which contributes sand in strong storms to the study beaches by circumventing the Cape; and (ii) the River Júcar, which covers the rest of the beaches [24]. Geologically, the area is divided into two zones. The first zone is composed of the slope of the mountain where the land is located belongs to the upper Cretaceous. The rock formation is defined as polygenic and limestone gaps. The latter are fine-grained grey-beige or brown, sometimes with silex concretions, and maybe dolomitized. The rest of the area is presented as a pre-coastal plain occupied by sediments and flood silt corresponding to the Júcar River [25].
The main anthropogenic actions conducted in the area are [26]:
  • Between 1947 and 1956, two groins of the same size were built at the mouth of the Júcar to channel the river’s outlet into the sea and prevent it from closing due to the accumulation of sediments. In the 1980s, the groin located to the north of the mouth was extended.
  • In the same period (1947–1956), a groin was built between Racó beach and Cap Blanc beach.
  • Taking advantage of the previous groin, at the end of 1978, work began on a marina. Thus, on Los Olivos beach, the beginning of an L-shaped breakwater was built, which was removed in November 1992 because the breakwater was a barrier to the circulation of the waves that caused erosion on Racó beach. Besides, 18,000 m3 of sand from Cap Blanc was dumped at the northern end of this beach so that the waves themselves would follow the dynamics naturally.
  • In 1994, 40,000 m3 of sand was deposited along the entire length of the Racó beach with materials from the Cap Blanc and Los Olivos beaches. In 1995, the Racó beach promenade was rebuilt, and 20,000 m3 of sand was dumped from nearby beaches.
  • In the last decades (1990–2019), there were hardly any modifications in the infrastructures that produced geomorphological alterations in the study area.

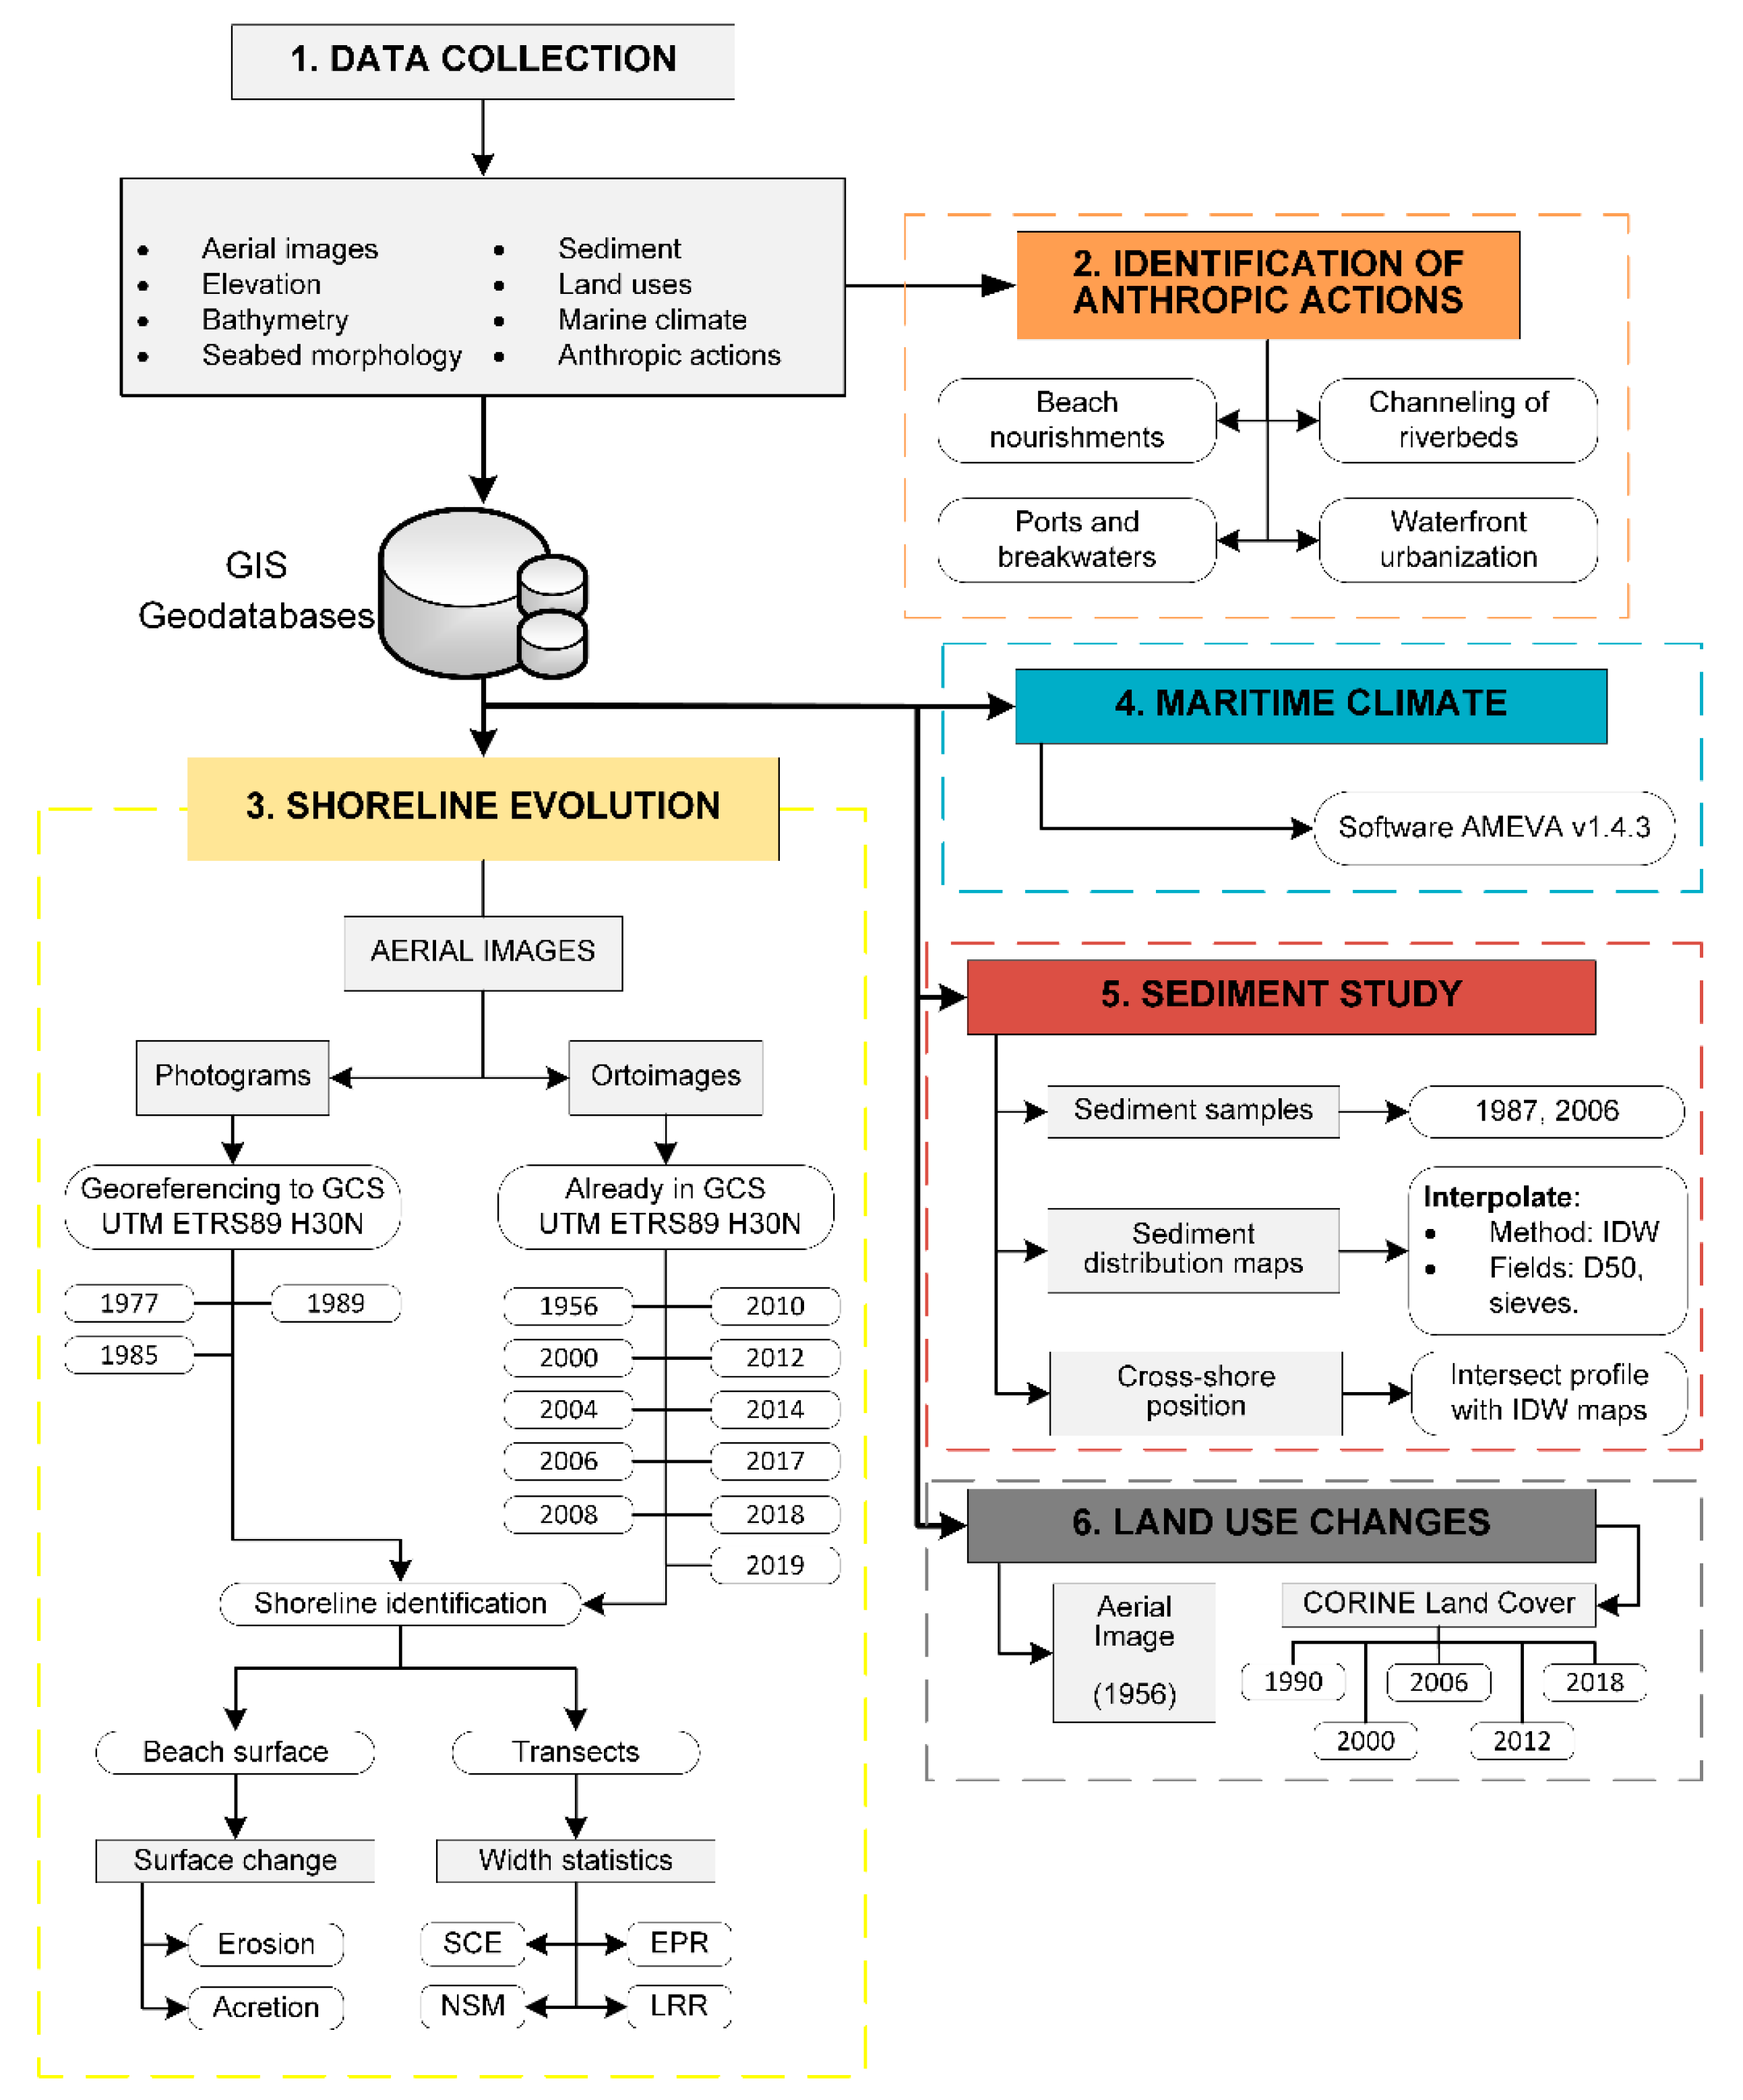
3. Materials and Methods

3.1. Shoreline Evolution and Land-Use Change

The evolution of the shoreline was studied by means of the comparative analysis of its position from aerial images from 1956 to 2019 (Figure 2) following the procedure described by Pagán et al. [27]. The images were downloaded from Institut Cartogràfic Valencià under CC BY 4.0 license in ECW raster format, with geographic coordinate system UTM ETRS89 H30N. The spatial resolution of the images from 1956 to 2012 is 50 cm/pixel, whereas from 2014 to 2018 is 25 cm/pixel. The georeferencing process (the assignment of coordinates to the photograms raster datasets) was carried out using ArcGIS 10.6®. The target image was the orthophoto of the year 2000. Each photogram was georeferenced identifying a series of ground control points (GCP) that link locations on the raster dataset with locations in the spatially referenced data (target data). For each raster, at least 50 GCP were used, which were spread over the entire image. Once the GCP were placed, the transformation of the raster was carried out using the adjust transformation. This transformation optimized the image for both global and local accuracy. The errors obtained were <0.25 m root mean square (RMS). Since all the aerial images were collected in summer and the state of the sea was relatively calm, the methodology provided optimal results for the manual vectorization of the shoreline at a scale of 1:1000.
For the study of the evolution of the shoreline, the fundamentals of the DSAS program for ArcGIS [28] were used, increasing its capacities calculating the erosion-accretion surfaces. The shoreline was identified as the last visible wetland mark on the beach and vectorised using ArcGIS 10.6®. Beach area was obtained from the polygon enclosed by the input reference line and the shoreline in each period. Overlapping the layers form different periods, erosion or accretion areas were obtained. In addition, beach width can be measured by means of transects perpendicular to the coast, starting at the promenade or dune toe (used as reference line) and reaching a depth of 10 m. The intersection between transects and the shoreline enabled the measurement of the beach width in each transect for each period studied. A discrete number of transects was needed in order to analyse the shoreline changes and present the results. The separation between transects ranges from 300 m [29] in large beaches to 50 m for smaller ones [30]. The average value set by USACE [31] is 100 m and was thus used in this research, although with the GIS tool measurements can be obtained throughout the whole study area extension.
Data from the CORINE Land Cover project (Coordination of Environmental Information), also known as the CLC [32], was used to analyse changes in land use. CORINE Land Cover polygons were used to identify the developed coastal area within a 1-km radius of the study beaches. The collection of land use data is based on basic terminology that distinguishes between artificial surfaces (urban fabric), agricultural areas, forest and semi-natural areas (scrub) and beaches, dunes and sandy areas. The reference date of the database is the date of acquisition of the satellite data used as basic data (1990, 2000, 2006, 2012 and 2018). Polygons in ArcGIS Geodatabase format were downloaded from scne.es under CC BY 4.0 license. For each reference year, the surface cover for each polygon was measured and grouped into the abovementioned categories. Then, a comparative analysis of the area coverage evolution of each surface was carried out.

3.2. Sediment Distribution

The study of sediment distribution was performed using a GIS. From the available information, cross-sectional layers and profiles of the D50 and the percentage of sample retained on each sieve were generated.
The data used in this work came from: (i) 1987 maps in printed format (Marine Geophysical Survey [33]), which were digitized using the ArcGIS Georeferencing tool. The root mean square error (RMS) was used to determine the error made in this process. The mean RMS value varies from 0.25 to 0.48, which implies a good accuracy considering the scale of the maps (1:5000). (ii) The Ecocartographic Study of the Provinces of Valencia and Alicante, which were provided in digital format [22]. Both types of maps contain information about the location of the sediment samples collected in the different sampling campaigns. Each of the samples has a card associated with its characteristics: the weight of the sample collected, coordinates and depth of its location and granulometry with the weight of the sample retained on each sieve.

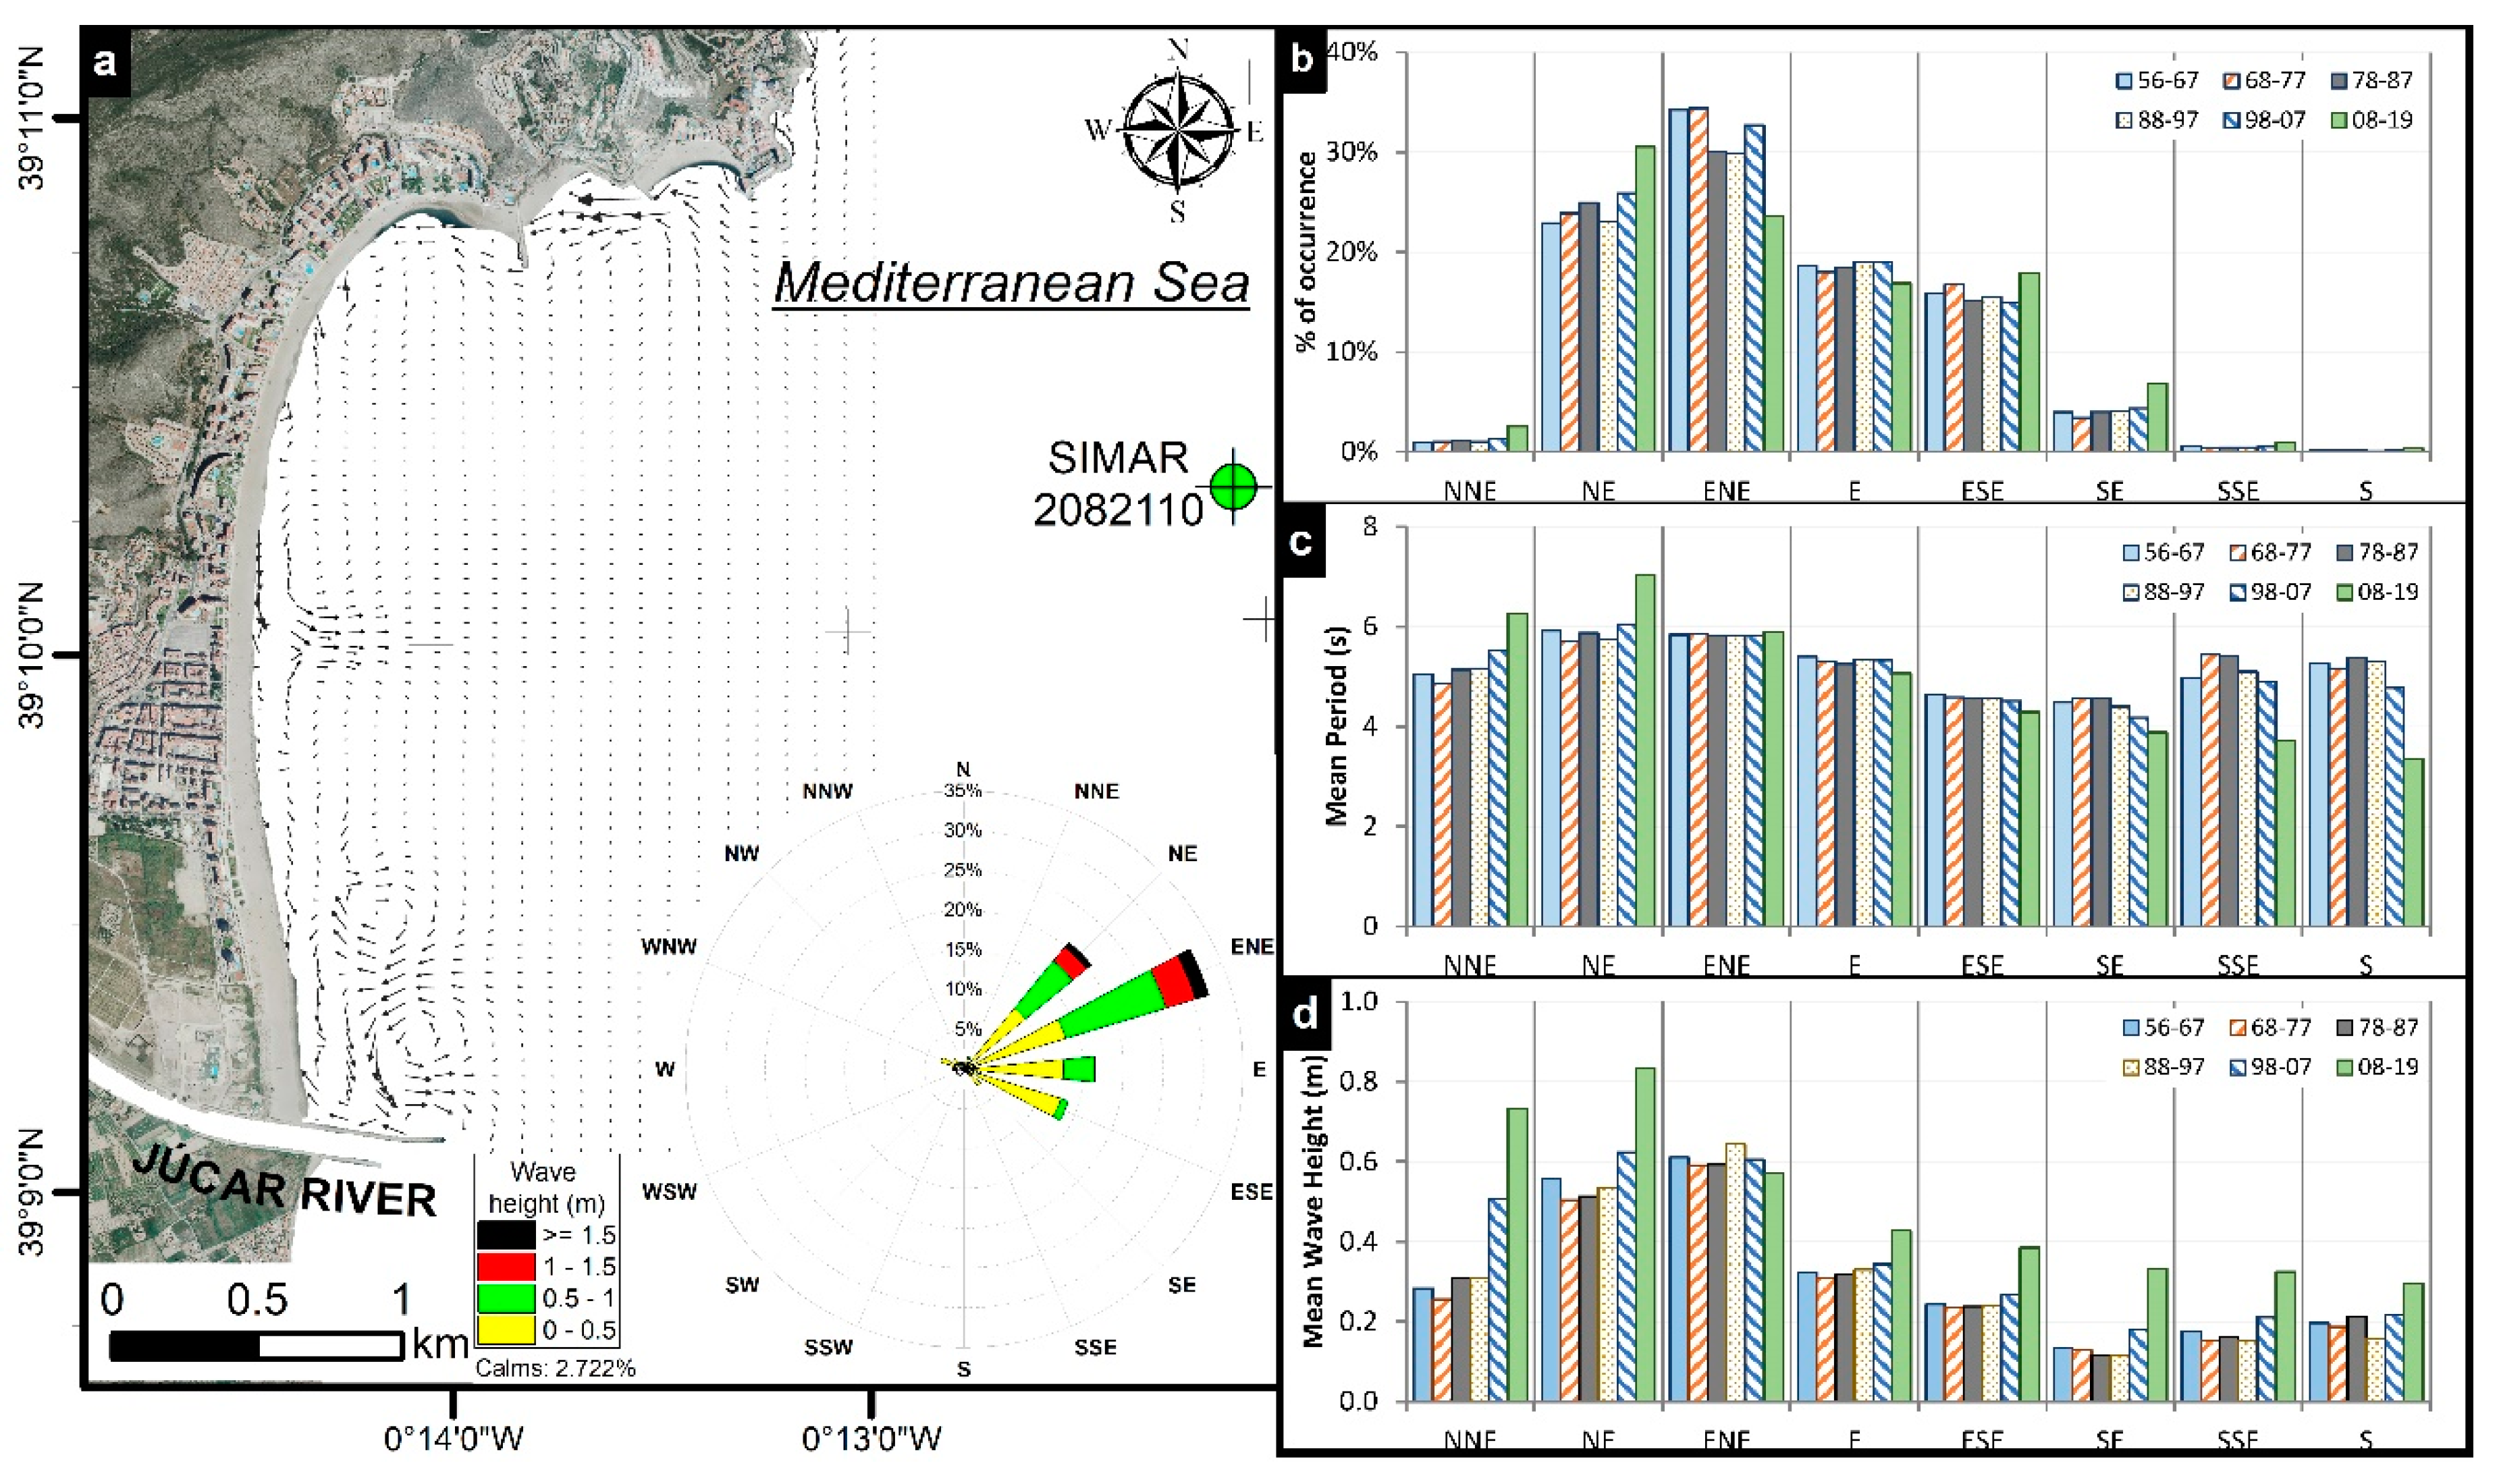
3.3. Maritime Climate

The marine dynamics of the area, as in the rest of the Mediterranean, hardly experience tidal intensity. The importance of astronomical tides is very low, with values ranging around 0.3 m, while meteorological tides can reach values of up to 0.45 m (http://www.puertos.es).
The analysis of the maritime climate was conducted using data from SIMAR Node 2082110 (0.17° W, 39.17° N). The data from this point were treated through the AMEVA v1.4.3 software [34], obtaining the wave height and its corresponding periods, directions and probabilities of occurrence for each of the study periods. The swell in the area is conditioned by the Cape of Cullera to the north and the mouth of the Júcar River to the south.
After obtaining climate data, a study of the currents was carried out using the SMC software (Sistema de Modelado Costero, http://www.smc.unican.es). This type of numerical model is based on a description of the most important physical processes concerning bathymetry, using a series of separate submodels that simulate the main hydrodynamic mechanisms. The current two-dimensional model of the SMC program follows the Navier-Stokes equations [35,36].
The overall workflow followed in this research is shown in Figure 2.

4. Results

Throughout the 62 years of study, a continuous decrease in the mountain (scrub) and the agricultural area was observed (Figure 3). In 1956, a large part of the surface area was occupied by mountainous areas covered with scrub (49.6%) and areas used for agriculture (43.5%). According to this decrease, the territory was occupied by urbanized area, which grew from a small town on the beach of San Antonio that barely covered 1.9% of the area to reach 37.1% of the current area. Also noteworthy are the changes suffered by the beach area, which increased by 147,670 m2, which means increasing from 5% of the surface area in 1956 to 7% in 2018.
According to the evolution of the shoreline, the bay of Cullera has been defined as an area of growth since 1956 (Figure 4). From the beginning of the study until now (2019), the set of four beaches included in the bay have increased their surface area by 256,499 m2, which means an average evolution rate of +1.18 m/year. However, if the evolution is analysed by periods, a balance can be seen in all the beaches since 2000, with a slight increase in the beach of San Antonio (+4.6% since 2000). The shoreline position of each year studied and the beach width at each transect can be consulted in Supplementary File S1.
Analysing each of the beaches separately, Cap Blanc beach was the only one that remained stable throughout the study period, although it suffered significant variations between 1977–2000, with a maximum erosion rate of −6.3 m/year (1997–1989) and a maximum accretion rate of +8.5 m/year in the period 1989–2000. San Antonio beach was the one that has suffered the greatest variations above all in the period 1956–2000, in which the beach surface area increased by 192,413 m2, which, considering the length of the beach, means an average increase of 84 m in beach width. As for the other two beaches (Racó and Los Olivos), the main variations occurred between 1977 and 1992. These variations, which produced the accretion of Los Olivos beach and the erosion of Racó beach, occurred due to the construction and subsequent removal of an L-shaped breakwater for the creation of a marina, which caused a destabilisation of the whole. Both beaches have remained stable since the removal of the breakwater, with an average beach width of 70 m on Racó beach and 73 m on Los Olivos beach (Figure 5).
The analysis of sediment distribution showed a significant decrease in median sediment size across the bay (Figure 6). Thus, in 1987, there was a predominance of fine sand (0.180–0.250 mm), except for the area around the mouth of the Júcar river, where there was a significant accumulation of silt (0.02–0.002 mm) and clay (<0.002 mm). However, in 2006, the distribution was much more homogeneous, with fine sand along the whole bay with some occasional sources of slightly thicker sand (0.250–0.350 mm). These areas were mainly found around Los Olivos beach and next to the mouth of the Júcar River. By analysing the different proportions of sediment sizes in depth (Figure 7), it has been found that the smaller sizes accumulate outside the depth of closure (≈5.69 m, obtained according to Aragonés, et al. [37]) irregularly, while the larger sizes (0.180 mm and 0.250 mm) show a clear tendency to remain in the first 4–5 m of the profile and not change position. A clear example can be found at Racó beach, where the predominant sizes near the shore are those of the larger sediments.
As far as the waves are concerned, as shown in Figure 8, the most common directions were those between the NE and the ESE (both inclusive), while the waves from the NNE, SE, SSE and S were practically insignificant, with an average accumulated value of 6.5%. The most common wave heights were those below 1 m with periods between 5–6 s, which indicates that this is an area with relatively calm coastal dynamics throughout the year. On average, 56% of the waves were less than 0.5-m high, and 29.2% were between 0.5-m and 1-m high (Figure 9). The probability of occurrence of wave height and direction was practically stable during the periods analysed. However, the last period (2008–2019) stands out, in which a variation of the probability of occurrence was observed, mainly: (i) The NE waves increased 6.4% concerning the average of the rest of the periods. There was a decrease in the wave heights below 0.5 m, but heights between 0.5 m and 1.5 m increased. (ii) Waves from the ENE decreased by 8.7% to the average, mainly due to the decrease in wave heights below 1 m. (iii) The rest of the directions suffered slight variations below 2%.

5. Discussion

Among all the natural environments, the coasts are the ones that most frequently present modifications in their form and disposition due to the action of several factors both natural and human [38]. The beach changes naturally in the long term due to varying conditions of wind, sea and coastal dynamics or the contribution of sediments [39]. However, short-term human alterations—actions which have become stronger in the last century—must also be considered [40,41]. This is simple thanks to the use of cartographic and photographic documents that show the variations of the coast at different dates in recent decades. The study period can be divided into two periods: 1956–1992 and 1992–2019. In the first period (1956–1992), the modification of the geomorphology was observed due to the installation of all the groins and jetties, together with the whole development process due to human activity. In the second period (1992–2019), the development of the coast was observed as a consequence of the multiple human actions that could be related to the maintenance of groins and actions, such as sand dumping. Both aspects are discussed below.
Regarding the urban expansion, the bay of Cullera has shown the same trend that has been observed in any coastal area, increasing the urban area of the whole municipality from 0.11 km2 in 1956 to 0.78 km2 in 1990, to finally reach 2.32 km2 in 2018 (Figure 3). This is in line with what has been observed in the rest of the world, where the coast began to become urbanized in 1990 and around 60% of the world’s population has been concentrated in the first 60 km of coastline [42,43]. On the Valencian coast, the appearance of tourist activities, in general, first affected places close to the sea and fertile agricultural lands [2,44]. In the specific case of Cullera, tourist activities gobbled up the mountain and scrubland area (Figure 3). Between 1968 and 1975, the construction of roads began in the mountain area, replacing the contour lines and initiating a process of urbanization that was stopped by the economic crisis in 1976, but continued in the urban development boom of 1998, replacing 0.687 km2 of the mountain with single-family homes. The effects due, in general, to urbanization and anthropization of the environment led to changes in riverbeds and land uses (among others, mountain slopes) that supplied sediments to rivers and gullies that flow into the coast, which has caused a change in the regime and volume of sediments contributed by these routes to the coastal system [2,45]. Just like the mountain area, the agricultural use area has been drastically reduced. Currently, the whole crop areas on the coast have become an urban area, producing an intense and progressive urban occupation, to the point that buildings can be followed almost without interruption along the bay of Cullera [46].
The beach in the study area grew over the entire period from 1956–2019. This growth occurred due to two factors: (i) The construction in the 1970s in the northern zone of breakwaters for what was to be a marina at Cap Blanc, which was never completed, and a groin between Racó beach and Cap Blanc, which caused two phenomena. A large accumulation of sediments in the first 500 m of the beach from the cape toward the south corresponded to a beach with an E-W orientation and a clear retreat over a wide area of almost 1 km until the beach recovered the fundamental coastal direction (see Supplementary File S1). (ii) The construction of groins at the mouth of the Júcar River in the 1950s, with its subsequent expansion in the 1980s, caused a barrier effect of the sediments and generated a strong accretion on the beach to the north of the mouth (Figure 4). However, contrary to the beneficial effect that this last work had on the beaches located to the north, it is known that, in many places, the coastal engineering structures built to stabilize the coast generally end up generating short-term erosion effects, as is the case on the beaches to the south of the river mouth [2,11]. The accumulation that has occurred since 1956 on the beach of San Antonio continued until 2000, although in a less significant form and without a major upward trend near the mouth of the Júcar River. This trend has been controlled due to the extraction of sand to feed the area further south in recent years [47].
Finally, analysis of sediment distribution shows that the finest fraction of the sediment was concentrated in the intermediate zone of the bay, while the areas near the mouth of the river concentrated the largest fraction (Figure 6b). These observations are consistent with the observations of Cupul-Magaña et al. [48] in the same study area and with the explanations of Griffiths [49]. The sediment distribution was associated with coastal circulation currents that distribute the sediments brought by the Júcar River to the central and northern part of the bay, where the concentration of finer-sized sediments was observed. The waves in the area showed a clear predominance of the directions from the NE to the ESE (Figure 8), which generated currents with both N and W components. The N component is explained by the influence of the cape and the W component by the waves themselves, which is consistent with what was observed by the authors of Reference [24]. The influence of the Cape of Cullera caused the waves in the northern area to be directed toward the coast, generating a current toward the south and causing a seaward current toward the middle of San Antonio beach, which coincided with the point in Figure 7 where an increase in the size of the sediment can be seen. This is because the finer material was dragged by the waves, leaving the thicker fractions in that area. In the southern zone, due to the groins of the River Júcar, some cells of circular currents were generated that accumulated the material next to the mouth. Furthermore, the high concentrations of silt and clayey material observed in 1987 in front of the mouth of the river were explained by the influence of the discharges of the Júcar River during the rainy season that year, when precipitation reached 700 l/m2 and a maximum river flow of 1100 m3/s [48,50].

6. Conclusions

The results presented suggest two issues that deserve to be discussed. On the one hand, the evolutionary trend followed in the coastal sector of the municipality of Cullera with the consideration of the complex natural and human processes that are interacting. On the other hand, the study conducted shows the potential of the combined use of high-resolution satellite images and GIS techniques to monitor the state and dynamics of the coast.
Regarding the first question, the whole of the sector studied had a fundamentally cumulative dynamic of sediments. The main cause of the imbalances in the area were the stiffening and channelling of the mouth of the Júcar River, as well as the construction of groins on the beaches of the cape. From that moment on, the sedimentary flow associated with the coastal drift was interrupted, causing a strong accumulation on the beaches located to the north of the river (San Antonio beach) and a growing regression on those located to the south. These processes of interruption of the continental drift, together with the massive tourist urbanization between 1960 and 1970, with the extraction of a traditional sand and road construction, trampling, agriculture, etc., contributed to the physical and ecological degradation of the dune systems. Thus, the vulnerability of these coastal landscapes was disturbed and threatened by the above-mentioned dangers, especially within the last 50 years.
Concerning the methodology used in the analysis, the results achieved indicate that digital image processing and GIS are very useful tools for the evolution of coastal changes since they allow the quantification of the areas affected by the different activities undertaken on the coast. Furthermore, it was demonstrated that GIS has great versatility in varying the spatial and temporal scale of the analyses, allowing the manager to select the level of detail required in each analysis, whose potential and precision will depend on the quantity and quality of data. Thus, the creation of a complete, precise and updated database would facilitate the identification of the most effective strategies for sustainable management to avoid the high economic costs derived from the loss of coastal dunes and associated ecological services, even allowing the simulation of scenarios of future changes.

Supplementary Materials

The following are available online at https://www.mdpi.com/2077-1312/8/4/240/s1, Supplementary File S1: Shoreline evolution and transects in Cullera Bay.

Author Contributions

Conceptualization, J.I.P. and I.L. Methodology, L.B. and J.I.P. Software, L.B. and J.I.P. Validation, L.B. and J.I.P. Formal analysis, L.A. and J.I.P. Investigation, I.L. and J.I.P. Resources, I.L. and J.I.P. Data curation, J.I.P. Writing—original draft preparation, L.A. and J.I.P. Writing—review and editing, L.A., I.L., and J.I.P. Visualization, J.I.P. and I.L. Supervision, L.B. and L.A. Project administration, I.L. All authors have read and agreed to the published version of the manuscript.

Funding

This research was funded by the Generalitat Valenciana through the project GV/2019/017 (Estudio sobre el desgaste y composición de los sedimentos y su influencia en la erosión de las playas de la Comunidad Valenciana).

Acknowledgments

We would like to thank the Provincial Services of Coasts from Alicante, Puertos del Estado and the University of Alicante for the information provided.

Conflicts of Interest

The authors declare no conflict of interest.

References

  1. Xian, G.; Crane, M.; Su, J. An analysis of urban development and its environmental impact on the Tampa Bay watershed. J. Environ. Manag. 2007, 85, 965–976. [Google Scholar] [CrossRef] [PubMed]
  2. Sanjaume, E.; Pardo-Pascual, J. Erosion by human impact on the Valencian coastline (E of Spain). J. Coast. Res. 2005, 49, 76–82. [Google Scholar]
  3. Naik, D.; Kunte, P.D. Impact of port structures on the shoreline of karnataka, West Coast, India. Int. J. Adv. Remote Sens. GIS 2016, 5, 1726–1746. [Google Scholar] [CrossRef]
  4. Jiang, S.; Hu, R.; Feng, X. Influence of the construction of the Yantai West Port on the dynamic sedimentary environment. Mar. Georesour. Geotechnol. 2017. [Google Scholar] [CrossRef]
  5. Newton, A.; Carruthers, T.J.B.; Icely, J. The coastal syndromes and hotspots on the coast. Estuar. Coast. Shelf Sci. 2012, 96, 39–47. [Google Scholar] [CrossRef]
  6. Gómez-Pina, G.; Muñoz-Pérez, J.J.; Ramírez, J.L.; Ley, C. Sand dune management problems and techniques, Spain. J. Coast. Res. 2002, 36, 325–332. [Google Scholar] [CrossRef]
  7. Touili, N.; Baztan, J.; Vanderlinden, J.-P.; Kane, I.O.; Diaz-Simal, P.; Pietrantoni, L. Public perception of engineering-based coastal flooding and erosion risk mitigation options: Lessons from three European coastal settings. Coast. Eng. 2014, 87, 205–209. [Google Scholar] [CrossRef]
  8. Malavasi, M.; Santoro, R.; Cutini, M.; Acosta, A.; Carranza, M.L. What has happened to coastal dunes in the last half century? A multitemporal coastal landscape analysis in Central Italy. Landsc. Urban Plan. 2013, 119, 54–63. [Google Scholar] [CrossRef]
  9. Zanuttigh, B. Coastal flood protection: What perspective in a changing climate? The THESEUS approach. Environ. Sci. Policy 2011, 14, 845–863. [Google Scholar] [CrossRef]
  10. Salazar, A.; G Lizano, O.; J Alfaro, E. Composición de sedimentos en las zonas costeras de Costa Rica utilizando Fluorescencia de Rayos-X (FRX). Rev. Biol. Trop. 2004, 52, 61–75. [Google Scholar]
  11. Pagán, J.I.; López, I.; Aragonés, L.; Garcia-Barba, J. The effects of the anthropic actions on the sandy beaches of Guardamar del Segura, Spain. Sci. Total Environ. 2017, 601, 1364–1377. [Google Scholar] [CrossRef] [PubMed] [Green Version]
  12. Brown, I. Modelling future landscape change on coastal floodplains using a rule-based GIS. Environ. Model. Softw. 2006, 21, 1479–1490. [Google Scholar] [CrossRef]
  13. Budetta, P.; Santo, A.; Vivenzio, F. Landslide hazard mapping along the coastline of the Cilento region (Italy) by means of a GIS-based parameter rating approach. Geomorphology 2008, 94, 340–352. [Google Scholar] [CrossRef]
  14. Castedo, R.; de la Vega-Panizo, R.; Fernández-Hernández, M.; Paredes, C. Measurement of historical cliff-top changes and estimation of future trends using GIS data between Bridlington and Hornsea—Holderness Coast (UK). Geomorphology 2015, 230, 146–160. [Google Scholar] [CrossRef]
  15. Dawson, J.L.; Smithers, S.G. Shoreline and beach volume change between 1967 and 2007 at Raine Island, Great Barrier Reef, Australia. Glob. Planet. Chang. 2010, 72, 141–154. [Google Scholar] [CrossRef]
  16. Rosskopf, C.M.; Di Paola, G.; Atkinson, D.E.; Rodríguez, G.; Walker, I.J. Recent shoreline evolution and beach erosion along the central Adriatic coast of Italy: The case of Molise region. J. Coast. Conserv. 2018, 22, 879–895. [Google Scholar] [CrossRef]
  17. Molina, R.; Anfuso, G.; Manno, G.; Gracia Prieto, F.J. The Mediterranean coast of andalusia (Spain): Medium-term evolution and impacts of coastal structures. Sustainability 2019, 11, 3539. [Google Scholar] [CrossRef] [Green Version]
  18. Di Paola, G.; Aucelli, P.P.C.; Benassai, G.; Iglesias, J.; Rodríguez, G.; Rosskopf, C.M. The assessment of the coastal vulnerability and exposure degree of Gran Canaria Island (Spain) with a focus on the coastal risk of Las Canteras Beach in Las Palmas de Gran Canaria. J. Coast. Conserv. 2018, 22, 1001–1015. [Google Scholar] [CrossRef]
  19. INE. Instituto Nacional de Estadística. Demografía y Población. Available online: https://www.ine.es/dyngs/INEbase/es/categoria.htm?c=Estadistica_P&cid=1254734710984 (accessed on 20 December 2019).
  20. Rodilla, M.; Martí, E.; Falco, S.; Río, J.D.; Sierra, J.; Sánchez-Arcilla, A. Eutrophication of sediments in the Cullera Bay: Composition and abundance of macrobenthos. J. Coast. Res. 2006, 39, 1533–1537. [Google Scholar]
  21. Mestres, M.; Sanchéz-Arcilla, A.; Sierra, J.P.; Mösso, C.; Tagliani, P.R.A.; Möller Junior, O.O.; Niencheski, L.F.H. Coastal bays as a sink for pollutants and sediment. J. Coast. Res. 2006, SI39, 1546–1550. [Google Scholar]
  22. ECOLEVANTE. Estudio Ecocartográfico de las Provincias de Valencia y Alicante; Costas, D.G.D., Ed.; Ministerio de Medio Ambiente: Santiago, Chile, 2006. [Google Scholar]
  23. Falco, S.; Hermosilla, Z.; Romero, I.; Martínez, R.; Sierra, J.; Mösso, C.; Mestres, M. Spatial and temporal patterns of water quality in Cullera Bay. J. Coast. Res. 2010, 47, 40–47. [Google Scholar] [CrossRef]
  24. Mösso, C.; Sierra, J.; Mestres, M.; Cupul, L.; Falco, S.; Rodilla, M.; Sánchez-Arcilla, A.; González del Río, J. The influence of topography on wind-induced hydrodynamics in Cullera bay. J. Coast. Res. 2010, 47, 17–30. [Google Scholar] [CrossRef]
  25. Del Rio, V.D.; Rey, J.; Vegas, R. The Gulf of Valencia continental shelf: Extensional tectonics in Neogene and Quaternary sediments. Mar. Geol. 1986, 73, 169–179. [Google Scholar] [CrossRef]
  26. MAPAMA. Galería de Imágenes. Available online: http://www.mapama.gob.es/es/prensa/galeria-de-imagenes/ (accessed on 21 March 2017).
  27. Pagán, J.I.; Aragonés, L.; Tenza-Abril, A.J.; Pallarés, P. The influence of anthropic actions on the evolution of an urban beach: Case study of Marineta Cassiana beach, Spain. Sci. Total Environ. 2016, 559, 242–255. [Google Scholar] [CrossRef] [PubMed]
  28. Thieler, E.R.; Himmelstoss, E.A.; Zichichi, J.L.; Ergul, A. The Digital Shoreline Analysis System (DSAS) Version 4.0—An ArcGIS Extension for Calculating Shoreline Change; 2008-1278; US Geological Survey: Reston, VA, USA, 2009. [Google Scholar]
  29. Grosskopf, W.G.; Kraus, N.C. Guidelines for Surveying Beach Nourishment Projects. Coastal Engineering Thecnical Note, CETN II-31; Coastal Engineering Research Center, U.S. Army Engineering Water Experiment Station: Vicksburg, MS, USA, 1993; p. 12. [Google Scholar]
  30. Muñoz-Perez, J.J.; Payo, A.; Roman-Sierra, J.; Navarro, M.; Moreno, L. Optimization of beach profile spacing: An applicable tool for coastal monitoring. Sci. Mar. 2012, 76, 1–8. [Google Scholar] [CrossRef] [Green Version]
  31. USACE. Engineering and Design, Hydrographic Surveying. U.S: Army Corps of Engineers, Manual No. 1110-2-1003; USACE: Washington, WA, USA, 2003. [Google Scholar]
  32. Heymann, Y. CORINE Land Cover: Technical Guide: Office for Official Publish of the Europe Communities; European Environment Agency: Copenhagen, Denmark, 1994. [Google Scholar]
  33. MOPU. Estudio Geofísico Marino Entre el Puerto de Denia y el Puerto de Valencia. Programa de Planeamiento de Actuaciones en la Costa; Dirección General de Costas: Madrid, España, 1987. [Google Scholar]
  34. IHCantabria. Análisis Matemático y Estadístico de Variables Medioambientales (AMEVA); Cantabria, Spain, 2013; Available online: http://ihameva.ihcantabria.com/ (accessed on 16 April 2019).
  35. González, M.; Medina, R.; Gonzalez-Ondina, J.; Osorio, A.; Méndez, F.J.; García, E. An integrated coastal modeling system for analyzing beach processes and beach restoration projects, SMC. Comput. Geosci. 2007, 33, 916–931. [Google Scholar] [CrossRef]
  36. González, M.; Medina, R.; Osorio, A.; Lomónaco, P. Sistema de Modelado Costero Español (SMC). In Proceedings of the XXI Congreso Latinoamericano de Hidráulica, São Pedro, Brasil, 18–22 October 2004. [Google Scholar]
  37. Aragonés, L.; Pagán, J.I.; López, I.; Serra, J.C. Depth of closure: New calculation method based on sediment data. Int. J. Sediment Res. 2018, 33, 198–207. [Google Scholar] [CrossRef] [Green Version]
  38. Rowland, M.J.; Ulm, S. Key issues in the conservation of the Australian coastal archaeological record: Natural and human impacts. J. Coast. Conserv. 2012, 16, 159–171. [Google Scholar] [CrossRef]
  39. Lopez, M.; Pagán, J.I.; López Úbeda, I.; Aragonés, L.; Tenza-Abril, A.J.; Garcia-Barba, J. Factors influencing the retreat of the coastline. Int. J. Comput. Methods Exp. Meas. 2017, 5, 741–749. [Google Scholar] [CrossRef]
  40. Passeri, D.L.; Hagen, S.C.; Medeiros, S.C.; Bilskie, M.V.; Alizad, K.; Wang, D. The dynamic effects of sea level rise on low-gradient coastal landscapes: A review. Earth’s Future 2015, 3, 159–181. [Google Scholar] [CrossRef]
  41. Ludka, B.; Guza, R.; O’Reilly, W.; Merrifield, M.; Flick, R.; Bak, A.; Hesser, T.; Bucciarelli, R.; Olfe, C.; Woodward, B. Sixteen years of bathymetry and waves at San Diego beaches. Sci. Data 2019, 6, 1–13. [Google Scholar] [CrossRef] [PubMed] [Green Version]
  42. Murray, N.J.; Phinn, S.R.; DeWitt, M.; Ferrari, R.; Johnston, R.; Lyons, M.B.; Clinton, N.; Thau, D.; Fuller, R.A. The global distribution and trajectory of tidal flats. Nature 2019, 565, 222. [Google Scholar] [CrossRef] [PubMed]
  43. Burt, J.A.; Bartholomew, A. Towards more sustainable coastal development in the Arabian Gulf: Opportunities for ecological engineering in an urbanized seascape. Mar. Pollut. Bull. 2019, 142, 93–102. [Google Scholar] [CrossRef] [PubMed]
  44. Vera, J.; Baños, C. Renovación y reestructuración de los destinos turísticos consolidados del litoral: Las prácticas recreativas en la evolución del espacio turístico. Bol. Asoc. Geógr. Esp. 2010, 56, 185–206. [Google Scholar]
  45. Atasoy, M. Assessing the impacts of land-use/land-cover change on the development of urban heat island effects. Environ. Dev. Sustain. 2019, 90, 1–11. [Google Scholar] [CrossRef]
  46. Pardo, J.E.; Sanjaume, E. Características sedimentológicas y morfológicas de los espacios costeros de transición situados al sur de la desembocadura del Xúquer. Cuad. Geogr. 2003, 73–74, 183–206. [Google Scholar]
  47. Pardo-Pascual, J.E.; Sanjaume, E. Beaches in Valencian coast. In The Spanish Coastal Systems; Springer: Berlin/Heidelberg, Germany, 2019; pp. 209–236. [Google Scholar]
  48. Cupul-Magaña, L.; Mösso-Aranda, C.; Sierra, J.; Marti, E.; Ferman-Almada, J.; Rodilla, M.; González-del-Río, J.; Sánchez-Arcilla, A. Characterization and distribution patterns of surficial sediments of Cullera Bay, Spain. Cienc. Mar. 2006, 32, 617–629. [Google Scholar] [CrossRef]
  49. Griffiths, J.C. Scientific Method in Analysis of Sediments; McGraw-Hill: New York, NY, USA, 1967; p. 508. [Google Scholar]
  50. Aragonés, L.; Pagán, J.I.; López, M.P.; García-Barba, J. The impacts of Segura River (Spain) channelization on the coastal seabed. Sci. Total Environ. 2016, 543, 493–504. [Google Scholar] [CrossRef]
Figure 1. (a) Study area in Valencia, Spain. (b) Detail of the study area, with the position of the SIMAR Node used in the wave calculations. (c) Location of the beaches and significant elements on the coast of the Bay of Cullera. (d) Aerial image of the Bay of Cullera.
Jmse 08 00240 g001
Figure 2. Scheme of the methodology followed.
Jmse 08 00240 g002
Figure 3. Evolution of land use in the study area. Table shows the land use area of each class in m2.
Jmse 08 00240 g003
Figure 4. (a) Beach width for each transect in 1956 and 2019. (b), (c), (d) and (e), Linear regression rates (LRR) for each period of study in m/yr. Since the periods 1956–1977 and 1989–2000 are each composed of only two dates, End Point Rates (EPR) were presented.
Jmse 08 00240 g004
Figure 5. Shoreline evolution and beach width in (a) 1956, (b) 1977, (c) 1985, (d) 2000, (e) 2010 and (f) 2019. Also, the change from crops fields to urbanized areas from 1956 to 2000 can be appreciated.
Jmse 08 00240 g005
Figure 6. Distribution of the median sediment size in 1987 (a) and 2006 (b).
Jmse 08 00240 g006
Figure 7. (a) Beach profile and median sediment size (D50) profile with depth of closure (DoC) marked. (b) Grain size distribution with depth.
Jmse 08 00240 g007
Figure 8. (a) Position of the SIMAR Node and currents generated by the mean wave flow. (b) Evolution of the percentage of occurrence of each of the study directions. (c) Evolution of the mean period of each of the study directions. (d) Evolution of the mean wave height of each of the study directions.
Jmse 08 00240 g008
Figure 9. Percentage of occurrence of wave heights. (a) Wave height between 0 m and 0.5 m. (b) Wave height between 0.5 m and 1.0 m. (c) Wave height between 1.0 m and 1.5 m. (d) Wave height greater than 1.5 m.
Jmse 08 00240 g009

