Article

Suppression of Tip Vortex Cavitation Noise of Propellers using PressurePoresTM Technology

1
Department of Naval Architecture, Ocean and Marine Engineering, University of Strathclyde, Glasgow G1 1XQ, UK
2
Naval Architecture and Marine Engineering Department, Maritime Faculty, Bursa Technical University, 152 Evler Mahallesi, Eğitim Caddesi, 16330 Bursa, Turkey
3
Oscar Propulsion Ltd, West Sussex RH12 3EH, UK
*
Author to whom correspondence should be addressed.
J. Mar. Sci. Eng. 2020, 8(3), 158; https://doi.org/10.3390/jmse8030158
Submission received: 21 January 2020 / Revised: 5 February 2020 / Accepted: 6 February 2020 / Published: 1 March 2020

Abstract

:
This study aims to demonstrate the merits of pressure-relieving holes at the tip region of propellers, which is introduced as “PressurePoresTM” technology as a retrofit on marine propellers to mitigate tip vortex cavitation noise for a quieter propeller. Shipping noise originates from various sources on board a vessel, amongst which the propeller cavitation is considered to dominate the overall radiated noise spectrum above the inception threshold. Thus, by strategically introducing pressure-relieving holes to modify the presence of cavitation, a reduction in the overall cavitation volume can be achieved. This mitigation technique could consequently result in a reduction of the radiated noise levels while maintaining the design efficiency as much as possible or with the least compromise. The strategic implementation of the holes was mainly aimed to reduce the tip vortex cavitation as this is one of the major contributors to the underwater noise emissions of a ship. In this paper, the details and results of a complementary numerical and experimental investigation is presented to further develop this mitigation concept for underwater radiated noise (URN) and to validate its effectiveness at model scale using a research vessel propeller. An overall finding from this study indicated that a significant reduction in cavitation noise could be achieved (up to 17 dB) at design speed with a favourable strategic arrangement of the pressure pores. Such a reduction was particularly evident in the frequency regions of utmost importance for marine fauna while the propeller lost only 2% of its efficiency.

1. Introduction

The technological developments over the last half-century have revolutionised the world that we live in. One of the main driving factors for such swift advancement is the globalisation of the world. Commercial shipping has contributed the globalisation by providing the most efficient means of transportation of bulk materials. With the ever-increasing world population, the volume of commercial shipping has been experiencing an increasing trend over the last five decades. Unfortunately, this has also resulted in the elevation of emissions produced by the maritime industry [1].
One of the most adverse by-products of commercial shipping has been underwater radiated noise (URN) emission [2]. The extraordinary expansion of the world fleet has resulted in increased levels of ambient noise in the world’s seas, especially in the low-frequency domain [3]. Unfortunately, this domain is also utilised by marine mammals for their various fundamental living activities. Thus, exposing them to such an abrupt change in ambient noise levels may disorient them or disrupt their communication signals, leading to behavioural changes of these mammals and hence local extinction [4,5].
Within the framework described above, the recently conducted PressurePoresTM Technology development project (Patent Application Number PCT/GB2016/051129) aimed to explore the merits of implementing pressure-relieving holes (PressurePores) on marine propellers to mitigate the cavitation induced noise for a more silent propeller. This paper presents a review and results of the experimental and computational study conducted to develop this technology.
Before the pressure-relieving holes implementation, different methods in the literature were reviewed for the mitigation of cavitation and resulting noise. Firstly, the studies of blade geometry modification were investigated. According to [6], the main source of the noise, the pressure fluctuations, can be reduced with propeller geometry modifications. For example, larger skew angles can affect the cavitation dynamics reducing pressure fluctuations, noise and vibration [7,8,9]. Another solution for cavitating noise reduction is by increasing the number of blades which can also reduce the unsteady force on each propeller blade [10]. By improving the finishing of the blade surfaces, modifying the trailing edge [11], changing the blade area, or optimisation of blade pitch distribution might also be further solutions for the mitigation of cavitation noise.
In this study, a literature review was conducted for the pressure-relieving holes method as a solution to cavitating noise mitigation. This review revealed that in the late 1990s, the Indian Institute of Technology in Bombay conducted research involving cavitation noise on marine propellers [12]. In their research study, Sharma et al [12] tried to delay the onset of the tip vortex cavitation and to reduce noise emissions without influencing the propeller performance adversely. They achieved a noise reduction by modifying model propellers by drilling 300 holes of 0.3 mm diameter in each blade. The holes were drilled at the tip and the leading edge areas of the blades. Sharma et al.’s tests indicated that the dominant cavitation type at inception was the tip vortex cavitation under any testing conditions. The modifications did not demonstrate any measurable influence on the performance characteristics of any of the propellers tested, but it had a great influence on the development of the Tip Vortex Cavitation (TVC).
The resulting acoustic benefit obtained in the Sharma et al. study [12] was a great improvement by a substantial attenuation of the low-frequency spectral peaks, as shown in Figure 1. While the test results with the original (not modified) propellers showed a consistent rise of spectrum levels throughout the frequency range, as the advance coefficients were reduced, this was not the case for the modified propellers with reduced spectral peaks. Also, the advance coefficients had a weak effect on the noise levels which was attributed to the consequences of the modification where the tips were unloaded. Furthermore, the suction peak in the leading edge was also minimised while the TVC strength was decreased due to the increase in the angle of incidence.
Figure 1, which was taken from [12], also presents a comparison of the noise characteristics for the original and the two modified propellers, A and B, at the advance coefficient of J = 0.38. In such a low J value, the improvement was more significant. Particularly for low frequencies, between 1 and 2 kHz, a reduction of about 15 dB was observed in the noise levels of both propellers. Sharma et al. concluded that “the modifications carried out had no measurable influence on the performance characteristics of the basic propellers”. However, they achieved a delay in the onset of the cavitation and significant noise reductions. One interesting point to note in Sharma et al.’s work was that all the propellers were tested in uniform flow conditions. This inherently disregarded the effect of the ship hull (wake) on the propeller flow, which is one of the most significant contributors to cavitation dynamics and hence induced radiated noise.
To explore the merits of the pressure relief holes, a pilot experimental study was conducted in The Emerson Cavitation Tunnel (ECT) of Newcastle University as part of an MSc thesis by Xydis [13]. The model scale propeller used for this study (Figure 2) was an existing propeller model with a diameter of 0.35 m, which was based on the as-fitted propeller of a 95,000 tonnes tanker with four blades and an expanded blade area ratio (BAR) of 0.524. There were two further replicas of this model propeller, which had previously been used for coating research; all were made of aluminium. In the pilot study, the blue coloured, anodized model (without drilled holes) was used to establish a base line (or reference) performance measurement. The other two models were modified with pressure-relieving holes on their blades and tested for comparison with the reference propeller. To see the effect of the holes on the two observed types of cavitation (sheet and tip vortex), the 2nd model was modified with a number of small holes drilled near the blade tip region above 90% of the propeller radius, while the 3rd model propeller had tip holes and mid-span holes above 60% of the blade radius, respectively. The three models used are shown in Figure 2 and called “Base”, “Tip modified” and “Sheet modified” related to the intact propeller (no holes), their intended effect on the tip vortex and sheet cavitation, respectively. To simulate more realistic operational conditions, these propellers were tested behind a wake using 2D wake screen.
A summary of the comparative propeller performance measurements in terms of the thrust and torque curves of the three model propellers is shown in Figure 3. A large number of holes spread over the mid and tip region of the “Sheet” propeller blades gave a significant reduction in the thrust, torque and efficiency. The more conservative number of pressure relief holes concentrated around the tip region for the “Tip” modified propeller did not produce such a significant impact on the thrust and torque compared to the “base” propeller as also shown in Figure 3. These experimental results, moreover, are in very close agreement with the established CFD models (omitted to shorten the length of the paper) which shows up to 13.8% cavitation volume reduction and 0.5% loss of efficiency.
The noise measurements shown in Figure 4 and Figure 5 correspond to typical operating conditions of this vessel. They reveal up to a 10 dB reduction in the sound pressure levels (SPL) for the mid-frequency region (300 Hz to 2 kHz) as well as in the high-frequency region (10 to 20 kHz) for the tip modified propeller and for advance coefficients of J = 0.55 and J = 0.5, respectively.
While the study demonstrated some encouraging signs of the radiated noise reduction, the level of the reduction in cavitation extent to support this mitigation technique needed more sophisticated and detailed observations. Inspired by this MSc study, and based on the model propellers tested in the same study [13], a comprehensive Computational Fluid Dynamics (CFD) investigation was conducted by Aktas et al. [14] to demonstrate the effectiveness of this mitigation method using the propeller of Newcastle University’s Research Vessel, The Princess Royal. This mitigation method was later patented as the PressurePoresTM Technology by the sponsoring company. Based on the results of this CFD investigation, the best performing cases with the strategically selected PressurePoresTM were applied on the Princess Royal’s propeller model to be tested at a towing tank for efficiency measurements. Cavitation tunnel tests were performed for the cavitation characteristics and noise measurements and to compare with the CFD investigations.
The details and results of the above mentioned computational and experimental investigations on the PressurePoresTM technology are presented in the remaining sections of this paper. Therefore, Section 2 describes the model propeller of research vessel The Princess Royal together with the experimental set-up and test conditions for both the CFD simulations and the cavitation tunnel tests which were conducted in the University of Genova Cavitation Tunnel (UNIGE). Section 3 presents the prototype testing including cavitation tunnel test observations in UNIGE and radiated noise measurements together with propeller performance tests conducted in the CTO towing tank of Gdansk. In Section 4, the details and results of the CFD model of the cavitating propeller are presented. Finally, Section 5 presents the main conclusions obtained from the oveall study.

2. Experimental Investigations

The Experimental Fluid Dynamics (EFD) approach adopted in this study used a propeller model modified for two versions of the PressurePoresTM technology, a cavitation tunnel and a towing tank as described in the following including the experimental test matrix.

2.1. Propeller Model; The Princess Royal Propeller

The propeller model used for both tests represented the port side propeller of The Princess Royal [15] with a scale ratio of 3.41, giving a 220 mm model propeller diameter. The reason was selecting this propeller as the test case two folds: firstly, this vessel has become a benchmark vessel worldwide for URN and cavitation investigations; secondly, the Authors had extensive information and access to this vessel for future use in validation studies at full-scale as part of the PressurePoreTM technology project.
The propeller model was manufactured with high accuracy in consideration of cavitation testing as shown by the deviation contour plot given in Figure 6. The principal dimensions of the full-scale propeller are given in Table 1.

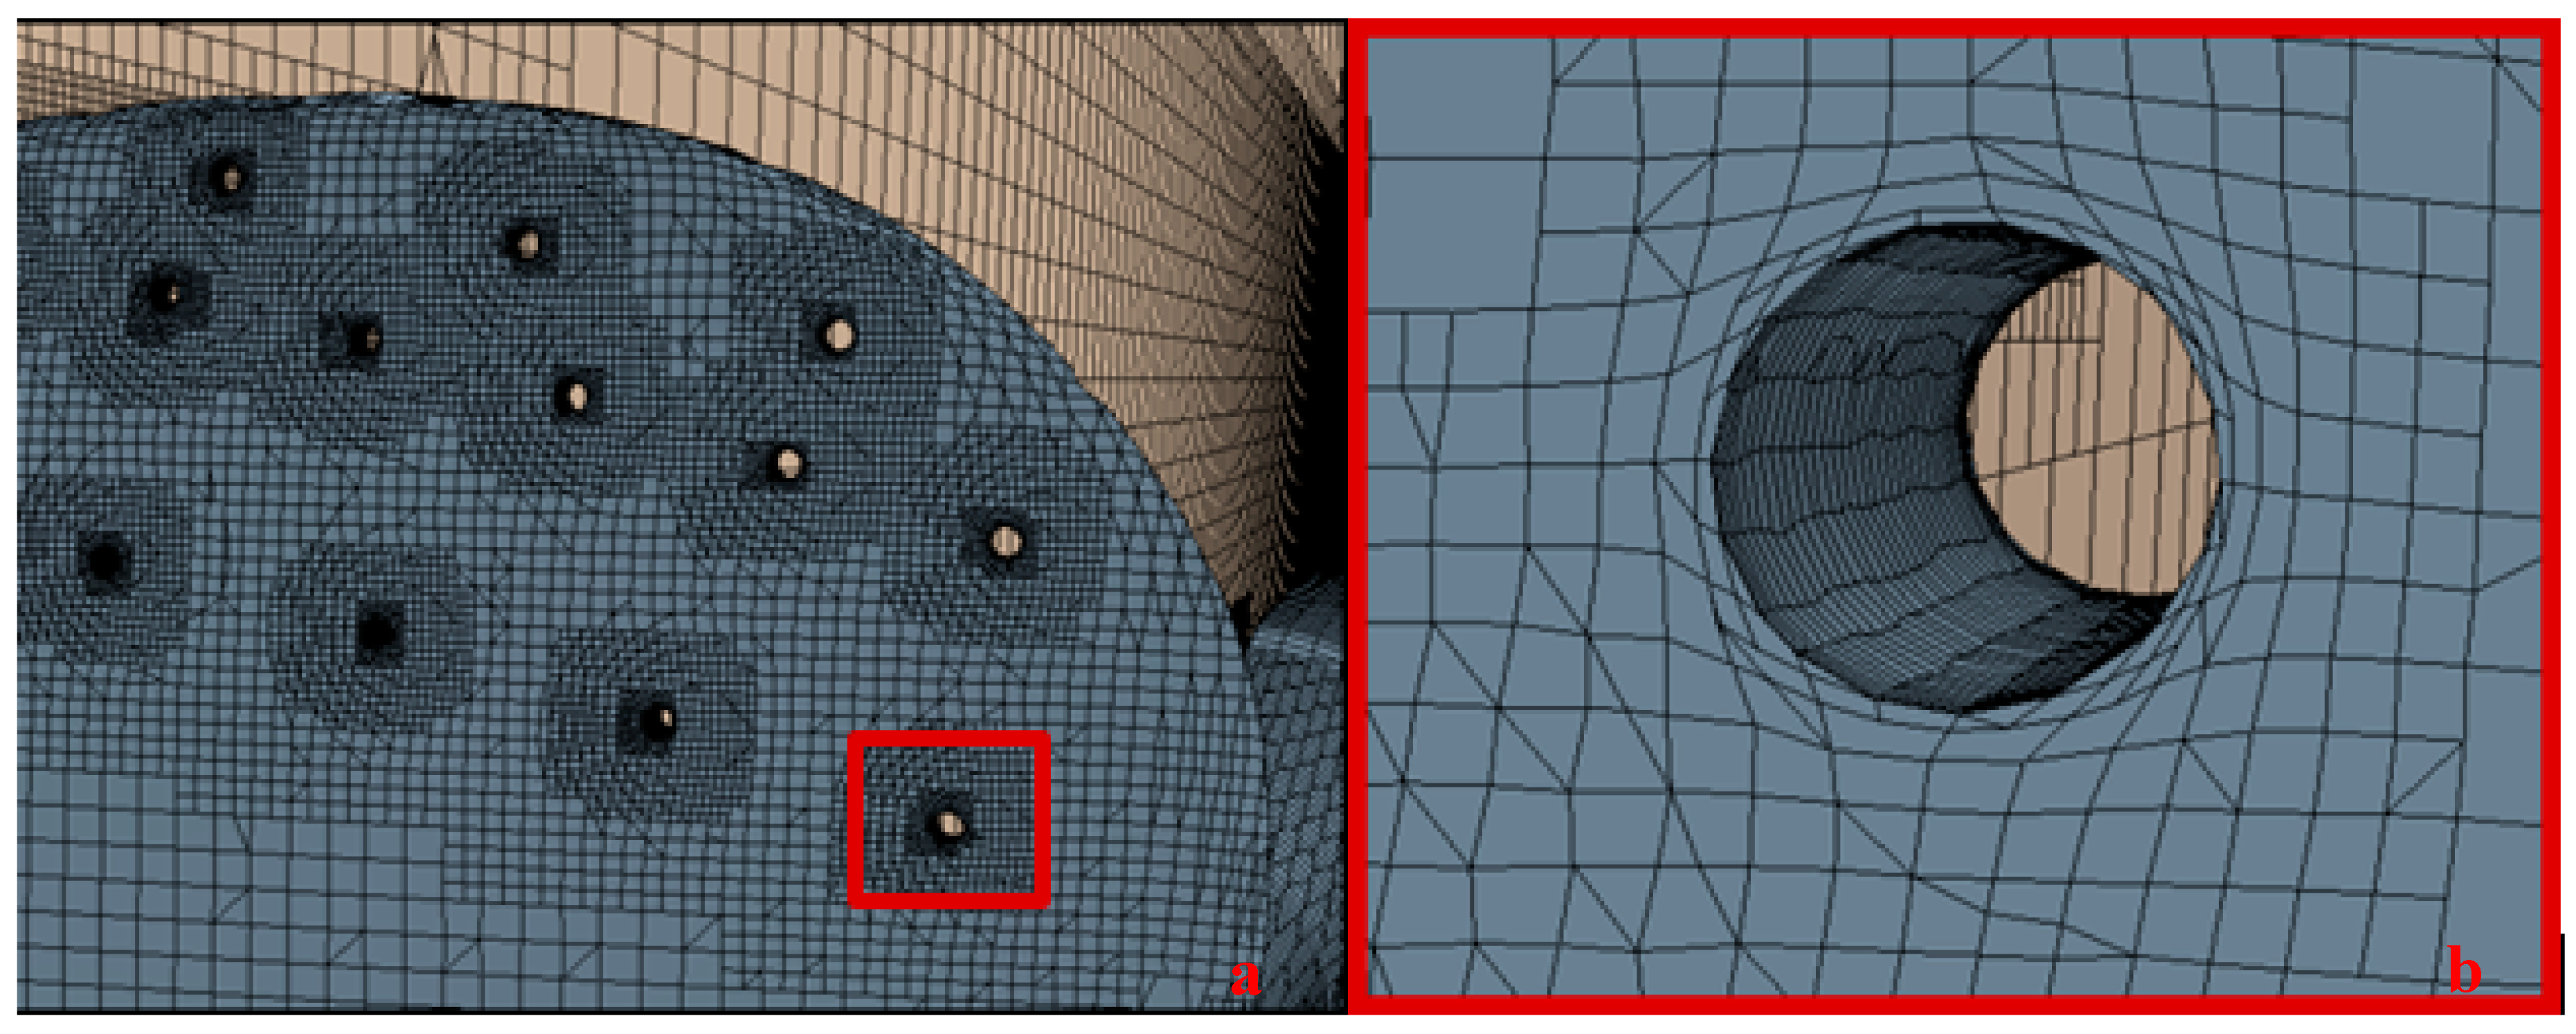
2.2. Application of the PressurePoresTM Technology

The application of the PressurePoreTM technology to this benchmark test propeller used the knowledge and experience gained through CFD studies conducted both with this propeller, as reported in Section 3, and another the preliminary test case propeller for a 95,000 tonnes merchant tanker as reviewed in Section 1.
In establishing the PressurePoreTM technology, different variations of the number of holes, hole size, hole axis directions (i.e., normal to the blade and shaft axis) were investigated by referring to the results of the Sharma et al. [12], and the recent study by Xydis [13] using CFD. An adaptive mesh refinement technique for evaluating the impacts of these variations on the propeller performance (KT, KQ and η0) in cavitating flow conditions was used. In these investigations, the pore configurations applied were simulated initially by using a non-optimised TVC model but later using the advanced adaptive mesh refinement technique of Yilmaz et al. [16] as described and discussed in Section 4.
From the CFD investigations with different pore configurations, two were selected and adopted on the Princess Royal model propeller which was tested at the CTO towing tank for accurate prediction of the propeller open water performance parameters. These tests were followed by further experiments conducted in the UNIGE cavitation tunnel for the cavitation observation and underwater noise measurements. The two-pore configurations applied are shown in Figure 7 and Figure 8, as “Modified Propeller” and “Modified Propeller-2”, respectively. As a result of the CFD investigation and considering the practicality of the pores implementation the pore diameter was selected as 1 mm. The Modified propeller had 33 pores while the Modified-2 propeller had 17 pores.
Comprehensive numerical investigations were carried out to determine optimum PressurePore geometry and distribution. These investigations involved varying number, size, shape and finish of the pressure-relieving holes as well as their strategic arrangement (distribution) over the blades. The focus of the investigations was to reduce the cavitation volume, mainly due to TVC while maintaining propeller efficiency.

2.3. Test Facilities

Tests were conducted in the medium-size cavitation Tunnel of the University of Genoa (UNIGE) and in the large towing tank of the Centrum Techniki Okrętowej S.A. (CTO) Model Basin in Gdansk.
The UNIGE tunnel is a Kempf & Remmers (K&R) closed water circuit tunnel, schematically represented in Figure 9. The tunnel has a square testing section of 0.57 m × 0.57 m, having a total testing section length of 2 m. The nozzle contraction ratio is 4.6:1, allowing a maximum tunnel flow speed of 8.5 m/s in the test section. The tunnel is equipped with a K&R H39 dynamometer, which measures the propeller thrust, torque and rate of revolution.
The CTO towing tank is approximately 270 m × 12 m × 6 m in length, breadth and depth, respectively and is fitted with a towing carriage having a maximum speed of 12 m/s. The performance of the propeller model before and after the application of the PressurePoresTM technology was measured using a standard open water dynamometer, as shown in Figure 10.

2.4. Test Setup and Test Matrix

The test set-up used for the cavitation tunnel is shown in Figure 11. To simulate realistic operational conditions, the tunnel tests were carried out behind a simulated (nominal) wake field which was produced based on the wake survey conducted with The Princess Royal model at the Ata Nutku Towing tank of Istanbul Technical University [17]. For this purpose, a wire mesh wake screen was constructed upstream of the propeller and was verified using a 2D Laser Doppler Velocimetry (LDV) device. The cavitation tunnel setup is schematically presented in 11.
The comparative velocity distributions of the simulated wake in the UNIGE tunnel and the nominal wake measured in the ITU towing tank are shown in Figure 12. A part of the simulated wake data is missing due to the shaft blocking the LDV paths since the measurements could only be made from the starboard side of the test section.
Based on typical in-service operational conditions of The Princess Royal, which correspond to 10.5 kn and 15.1 kn vessel speeds, the cavitation tunnel test matrix is as shown in Table 2.
In Table 2, STW represents the vessel speed through the water. KT and KQ are the standard thrust and torque coefficients, respectively, while the cavitation number is defined based on the propeller shaft speed using Equation (1):
σ n = P a + ρ g h s P v 0.5 ρ ( n D ) 2
where Pa is the atmospheric pressure, g is the gravitational acceleration, ρ is the density of water, hs is the shaft immersion of the propeller, Pv is the vapour pressure, n is the propeller shaft speed in rps, and finally D is the diameter of the propeller. Table 3 shows the non-dimensional parameters used for some of the performance and operational characteristics of the propeller.
The model scale test conditions were specified according to the thrust coefficient identity. As shown in Table 2, while Condition V2 corresponded to the actual service speed (about 15 knots) of the research vessel, Condition V1 corresponded to the 10.5 kn speed condition.
The cavitation tunnel tests were completed in three stages: the first stage involved the tests with the original propeller model (Intact propeller), the second stage involves the propeller model with 33-1 mm pores on each blade (Modified propeller); and the third and final stage, with 17-1 mm pores on each blade (Modified-2 propeller) which was achieved by closing a half of the pores on the Modified propeller with an epoxy material and smoothing them with care.
During the tests, the water quality was assessed based on the dissolved oxygen content of the tunnel which was monitored by using the ABB dissolved oxygen sensor, model 8012/170, coupled with an ABB analyser model AX400.

3. Prototype Testing

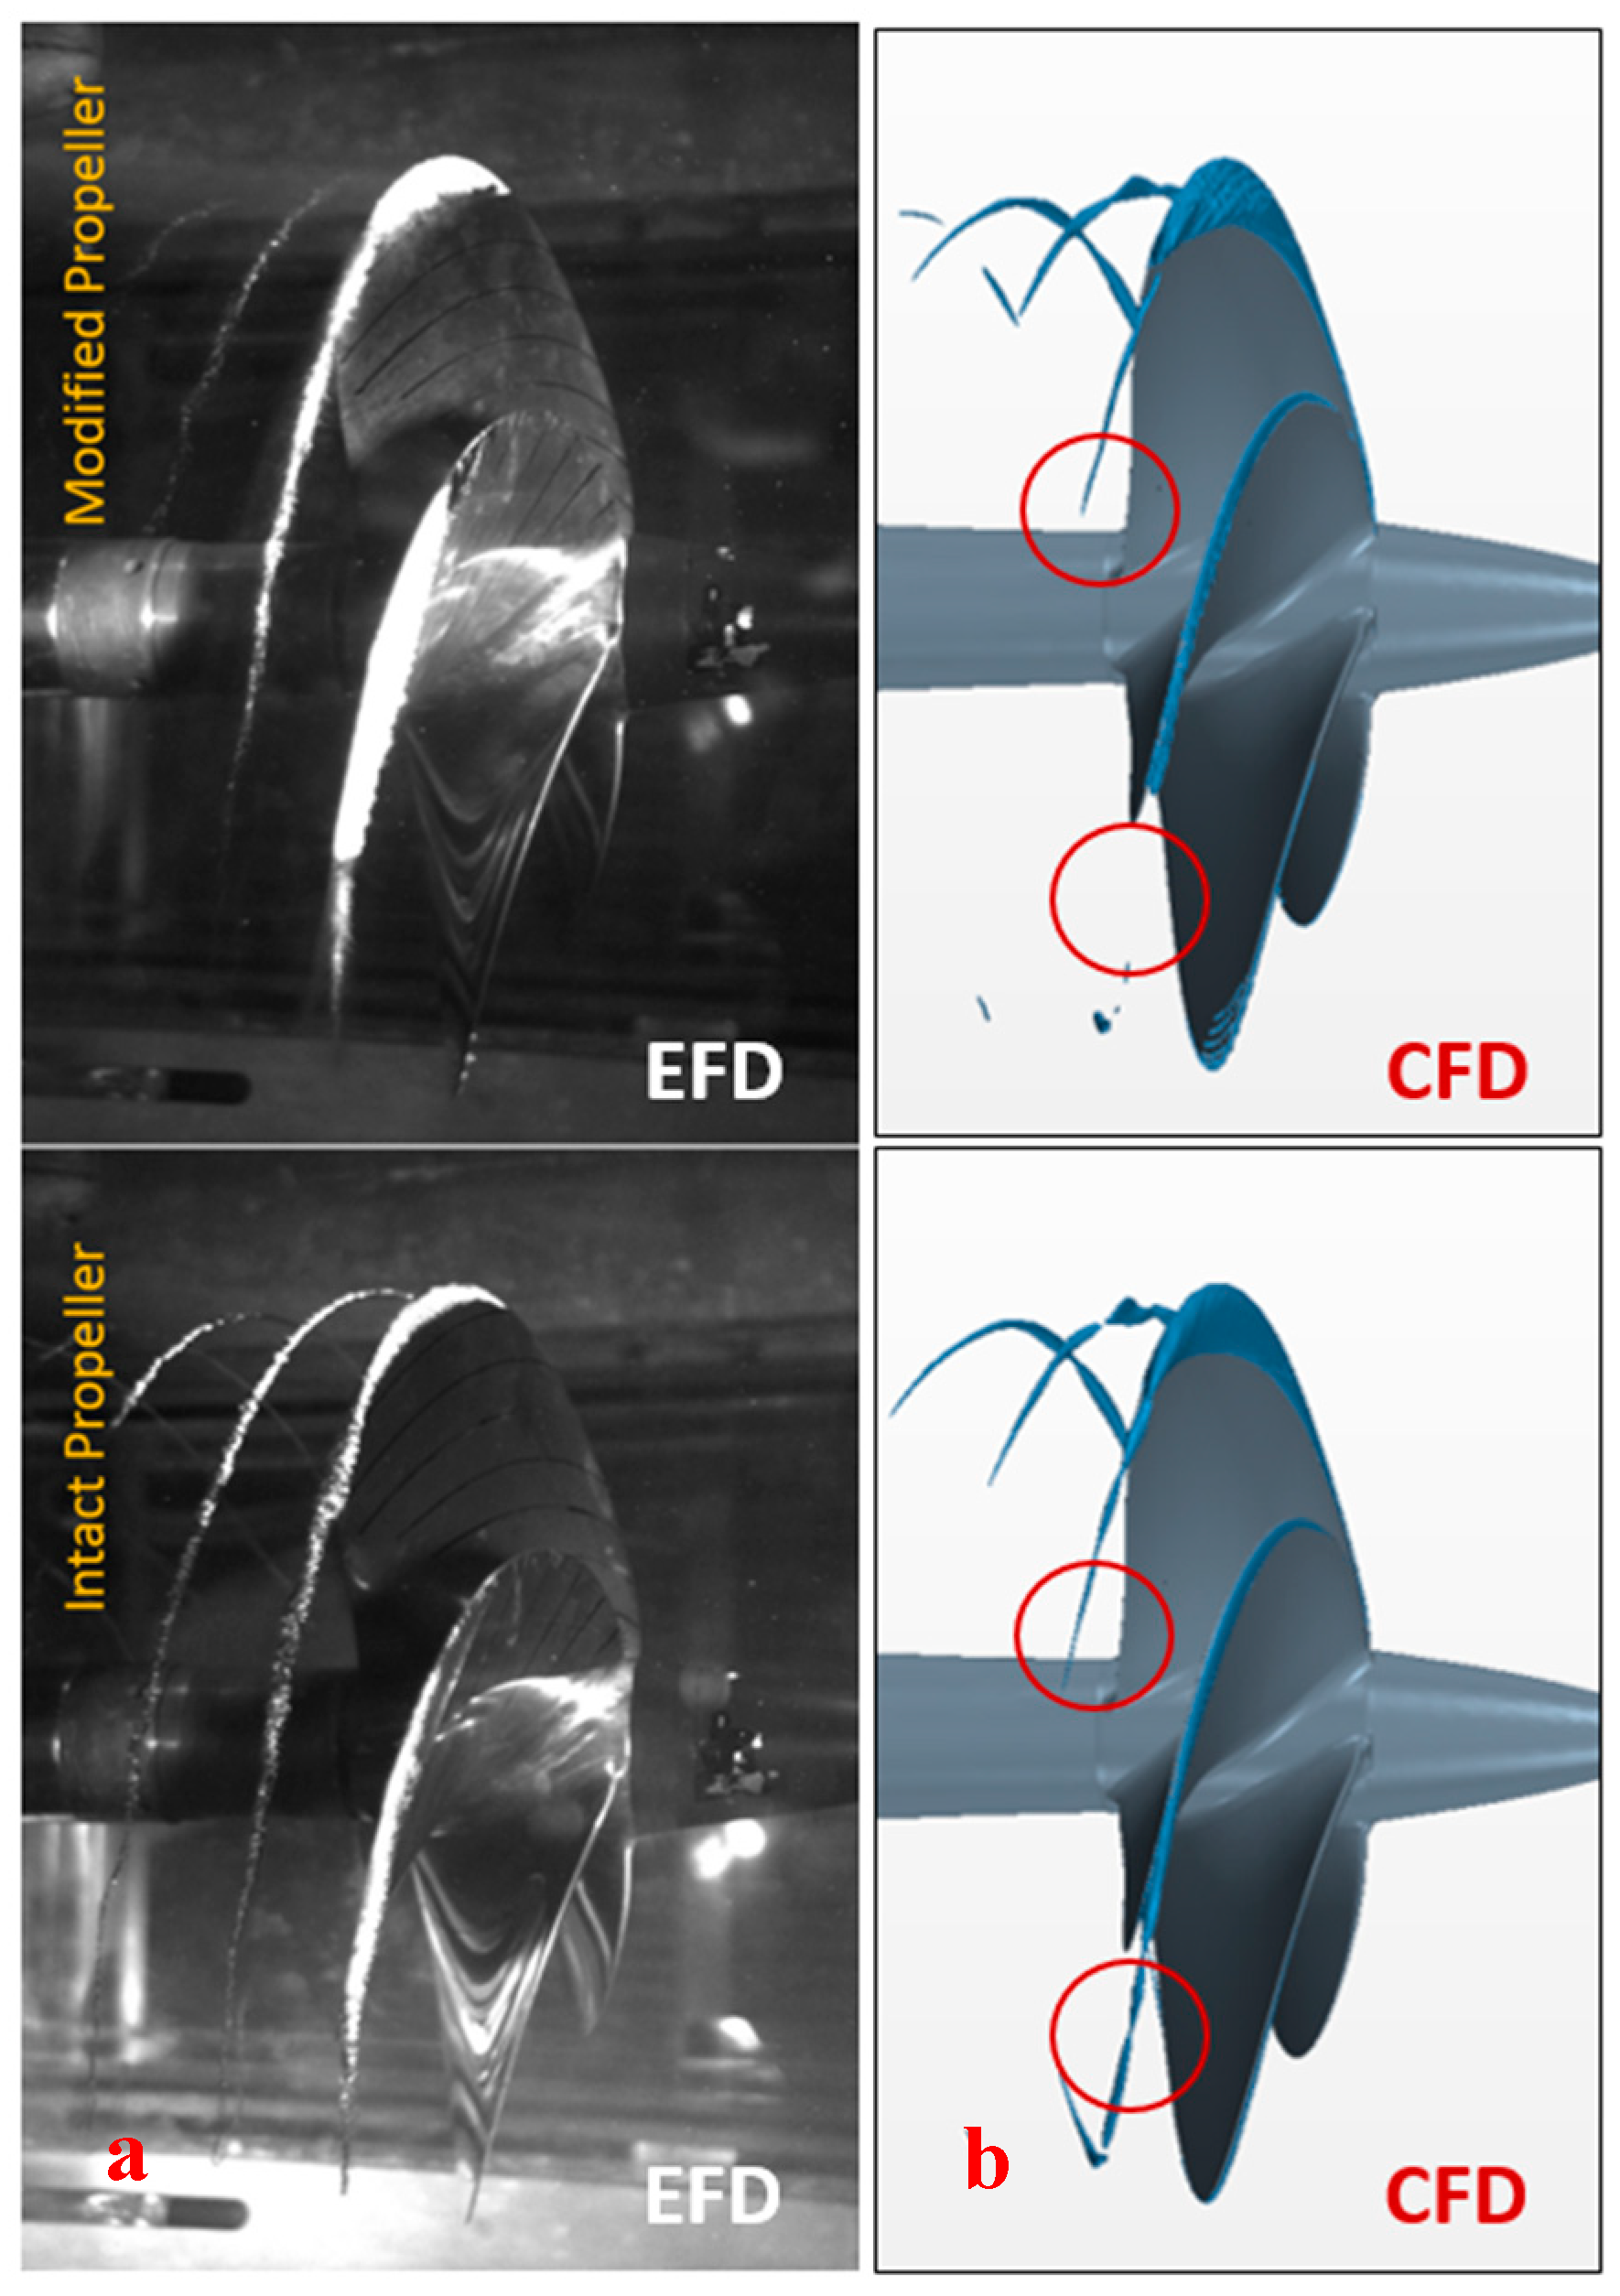
3.1. Cavitation Observations

To be able to make qualitative comparisons between the cavitation experienced by the intact and modified propeller cases, cavitation observations were carried out at the UNIGE Cavitation tunnel. For this purpose, a mobile stroboscopic system was utilised to visualize and record the cavitation phenomenon on and off the propeller blades. The cavitation recordings were made with three Allied Vision Tech Marlin F145B2 Firewire Cameras, with a resolution of 1392 × 1040 pixels and a frame rate up to 10 fps.
Remarks on the cavitation observation for the intact propeller, Modified Propeller and Modified Propeller-2 cases for Condition V1 and V2 are provided in Table 4. Some sample images are also shown in Figure 13 and Figure 14 for the three propellers alongside Case V1 and V2 in this respective order. From the images and the remarks in Table 4, it is evident that with the introduction of PressurePoresTM, tip vortex cavitation experienced by the intact propeller was disrupted. For the Modified propeller case, in both conditions, the tip vortex cavitation almost disappeared. For the Modified Propeller-2 case, the PressurePoresTM changed the nature of the steady, solid tip vortex cavitation to a cloudier line with less strength and reduced core diameter.

3.2. Radiated Noise Measurements

In Section 2, Figure 11 showed a schematic of the setup adopted during these tests, including the positions of three hydrophones. As shown in Figure 11, two hydrophones were mounted on fins downstream of the propeller: one on the port side at the same vertical position as the propeller shaft (H2); the other (H3) on the starboard at a lower vertical position. The third hydrophone (H1) was mounted in an external plexiglass tank filled with water and mounted on the bottom window of the test section. The measurements from H3 were used for the noise results presented throughout this paper.
Moreover, the noise tests were also repeated at least three times. For the post-processing of the noise measured, the ITTC [18] guidelines for model scale noise measurements were followed.
The average Power Spectral Density, G(f) in Pa2/Hz, was computed from each sound pressure signal p(t) using Welch’s method of averaging modified spectrograms. The Sound Pressure Power Spectral Density Level, Lp, is then represented by Equation (2):
L p ( f ) = 10 log 10 ( G ( f ) p r e f 2 ) ( dB   re   1   μ Pa 2 / Hz )
where pref = 1 µPa.
The background noise of the facility and setup was measured by replacing the propeller with a dummy hub while applying the same conditions of the shaft revolutions, flow speed and vacuum. Only one series of the background noise measurements were carried out since the tunnel operational conditions do not vary significantly when changing from the intact to the modified propeller cases.
Based on the comparison of the total noise measured and background noise, the net sound pressure levels of the propeller were analysed with the following procedure in [19]:
  • Signal to noise ratio higher than 10 dB: No correction made
  • Signal to noise ratio higher than 3 dB but lower than 10dB:
    L PN = 10 Log 10 [ 10 ( L Ptot / 10 ) 10 ( L Pbg / 10 ) ]
  • Signal to noise ratio lower than 3 dB:
    Results disregarded
The net sound pressure levels may be scaled to a reference distance of 1-m exploiting measured transfer functions, or simply according to Equation (5):
L PN @ 1 m = L PN + 20 Log 10 ( r )
where r is the distance between propeller (acoustical centre) and sensor.
The latter formulation has been used in the present work. The acoustical centre of the propeller was defined with respect to the centre of the propeller disk.
Based upon the above-described post-processing, Figure 15, Figure 16, Figure 17 and Figure 18 shows the measured noise levels for the intact propeller, Modified propeller and Modified Propeller-2 in the narrow and Third-octave band for condition V1 and V2. In both cases, significant reductions in the radiated noise levels can be observed over a frequency range from 200 Hz to 1 kHz. For the service speed condition V2, the reductions are consistent almost throughout the entire frequency range tested. Whereas for condition V1, the pores caused some increase in the URN in the high-frequency region.
Figure 19 presents the net difference between the noise levels of the intact propeller and both modified propellers for Condition V2 as measured by hydrophone H3 to demonstrate the effectiveness of the PressurePoreTM technology. As shown in Figure 19, a maximum of 17 dB reduction is possible by using this technology at the critical low-frequency region of the URN spectrum.

3.3. Propeller Performance Tests

This section presents details and results of the propeller open water tests conducted at the CTO towing tank. The purpose of these tests was to determine the propeller performance characteristics (thrust, torque and efficiency) before and after applying the PressurePoresTM technology.
During these tests, the rate of the propeller shaft revolutions was selected for Reynolds Numbers above the critical threshold of 500,000. To confirm the typical convergence of the measurements, for the single advance ratio of J = 0.6, the tests were repeated for three additional values of the Reynolds number. Figure 20 shows the resulting test data analysed for thrust, torque and efficiency coefficients as fitted by 4th-degree polynomials for the three propeller test cases.
The principal operating condition of The Princess Royal propeller is very close to Advance Coefficient J = 0.5. As shown in Figure 20, the open water tests indicated that there is a 2% loss of thrust and 4% gain in torque which consequently results in a propeller efficiency loss of 5.7% for the Modified Propeller compared to the intact propeller. For the Modified Propeller-2 case, with only half of the pores of the Modified propeller, the loss in thrust was about 0.1% gain in torque was 2.2% giving an efficiency loss of 2.3%.

4. Numerical Investigations (CFD Approach)

The effect of the drilled holes on the propeller performance and cavitation dynamics were simulated using CFD (Star CCM+) on the Base (intact) and Modified propeller. This allowed the expected cavitation volume reduction to be estimated at the modification stage of the propeller and selecting the favourable pressure pores arrangement using the new meshing refinement approach, MARCS, as explained in detail in the following.

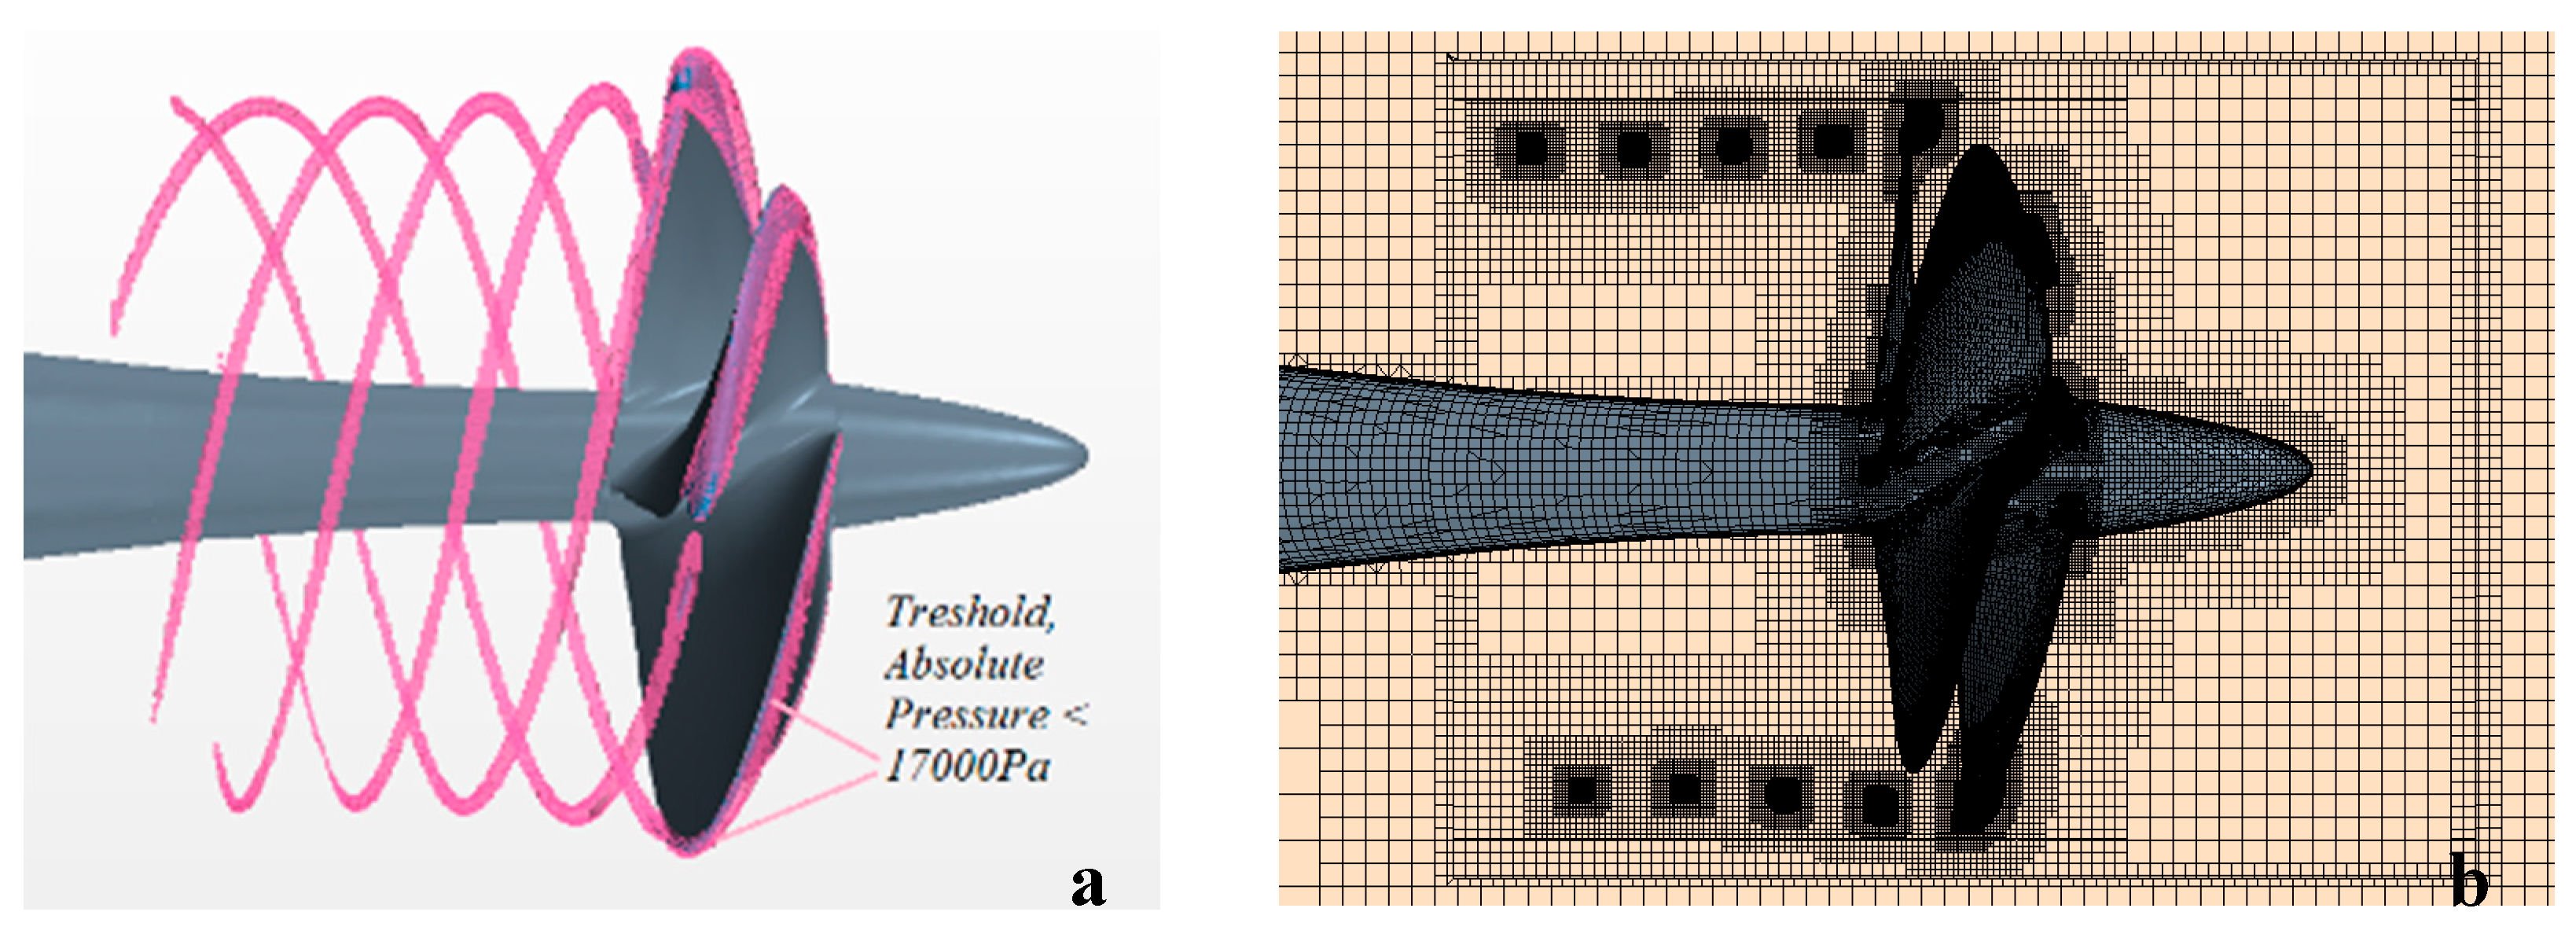
4.1. Mesh Adaption Refinement Approach for Cavitation Simulations (MARCS)

An advanced mesh refinement technique for capturing tip vortex cavitation in a propeller slipstream was proposed [20], where preliminary results were presented for a limited range of tip vortex extensions for two benchmark propeller models (PPTC and INSEAN E779A). The method was further developed by using the INSEAN E779A propeller, allowing a greater extension of the TVC in the propeller slipstream to be achieved [16]. This mesh refinement approach (MARCS) was further applied on The Princess Royal propeller model, capturing an even greater extension of the tip cavitating tip vortex development in the propeller slipstream [21].
In MARCS, the adaptive mesh refinement was created only in the region where the tip vortex cavitation may occur. First, the upper limit of absolute pressure in the solution was determined by creating a threshold region in Star CCM+ (Figure 21, Left). In such cavitation simulations, the volume fraction of vapour shows the volume where the absolute pressure is below the saturation pressure of water, thus identifying the cavitating volume. A threshold region was created by increasing the saturation pressure from a default saturation pressure, 3169 [Pa] to a higher value, 17,000 [Pa] thus generating, the pink region shown in Figure 21, Left. This artifice provided an indication of the volumetric trajectory on which to generate a fine mesh (Figure 21 Right) for accurately capturing the pressure-drop correctly and tracking the cavity bubbles in the propeller slipstream.
The numerical mesh is an unstructured trimmed grid, and basic prismatic cells are applied near to the blade surface for resolving the boundary layer (trying to keep y+ close to 1). MARCS was also used for local mesh refinement to be able to simulate TVC and evaluate the benefit of using the drilled holes in the presence of more realistic TVC extents. Additionally, for the tip drilled propeller, different mesh arrangements were generated around the drilled holes. Smaller mesh size for the pressure pore surfaces was used to capture the cylindrical hole shape properly as shown in Figure 22.
For evaluating the quality of the numerical results, an uncertainty analysis was conducted for the essential grid and time step sensitivity on the numerical solutions. For these cases, it was concluded that the most dominant errors were due to discretisation errors instead of iterative errors which were neglected accordingly. Uncertainty calculations followed the approach of Stern et al. [22]; this required at least 3 different cases (such as computational grids, time step values etc.) and estimated the uncertainty values for the calculations. This analysis method had been previously applied for non-cavitating and cavitating propellers, including the intact model of The Princess Royal [16,21].

4.2. Numerical Model
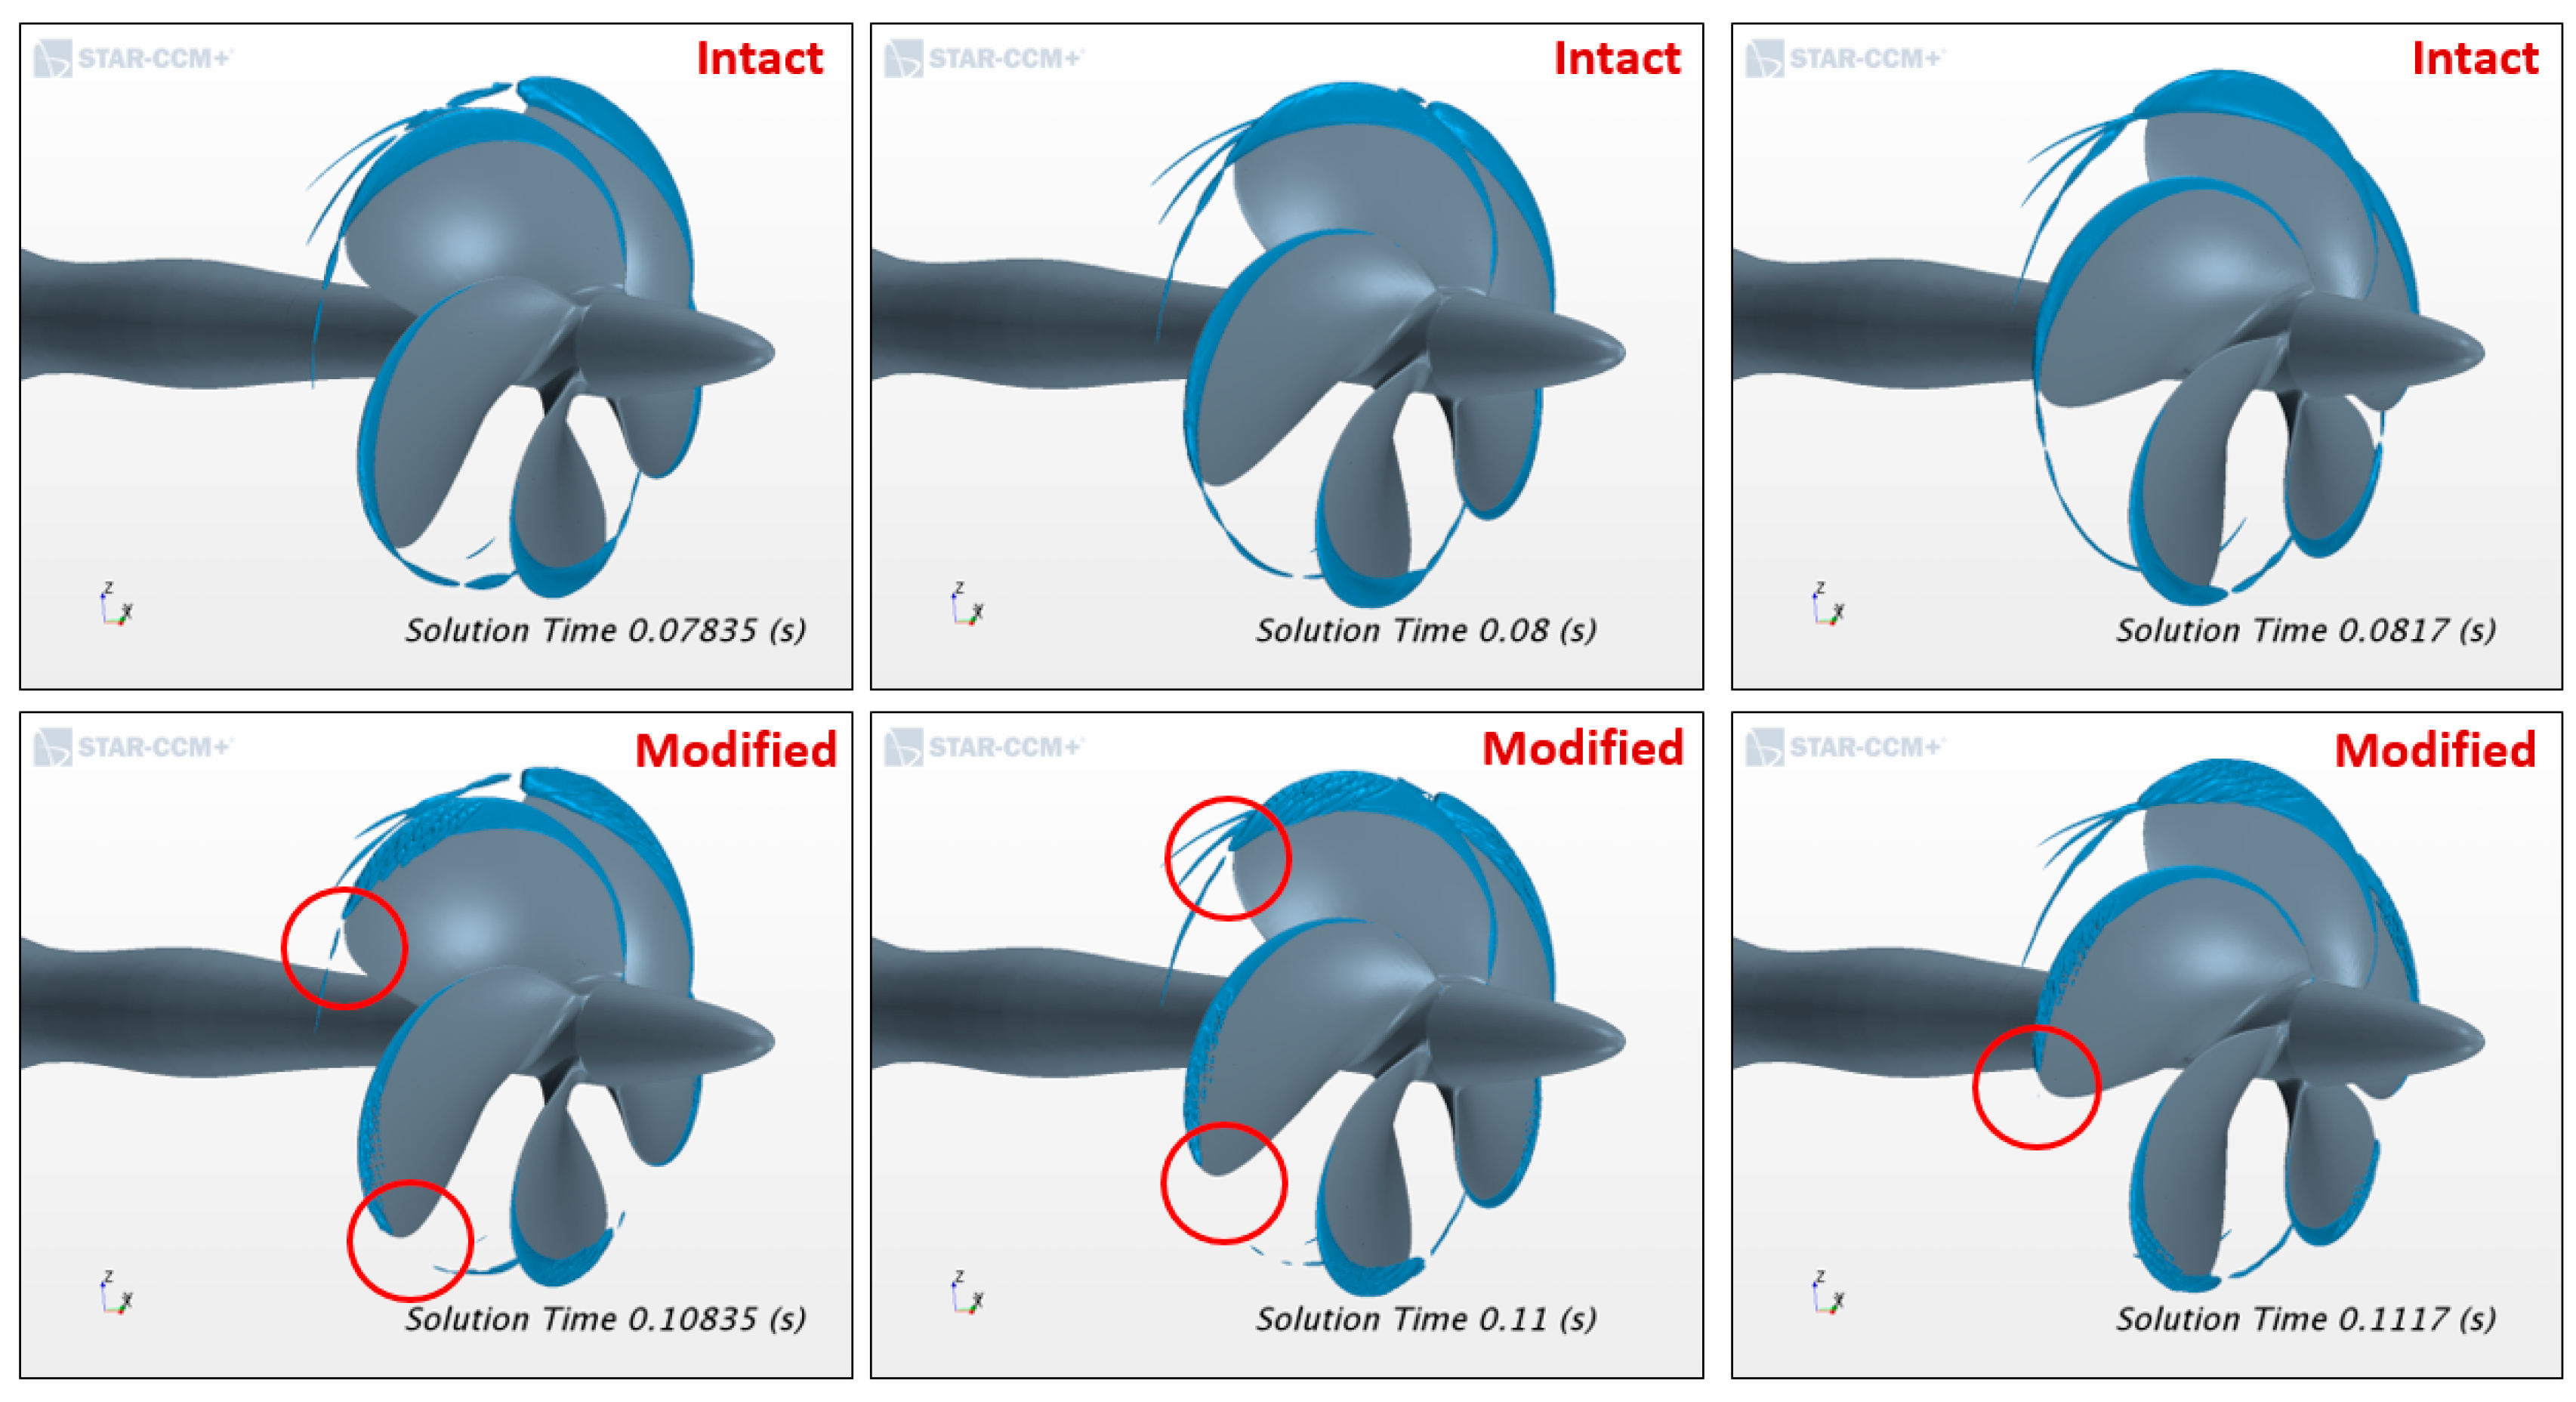
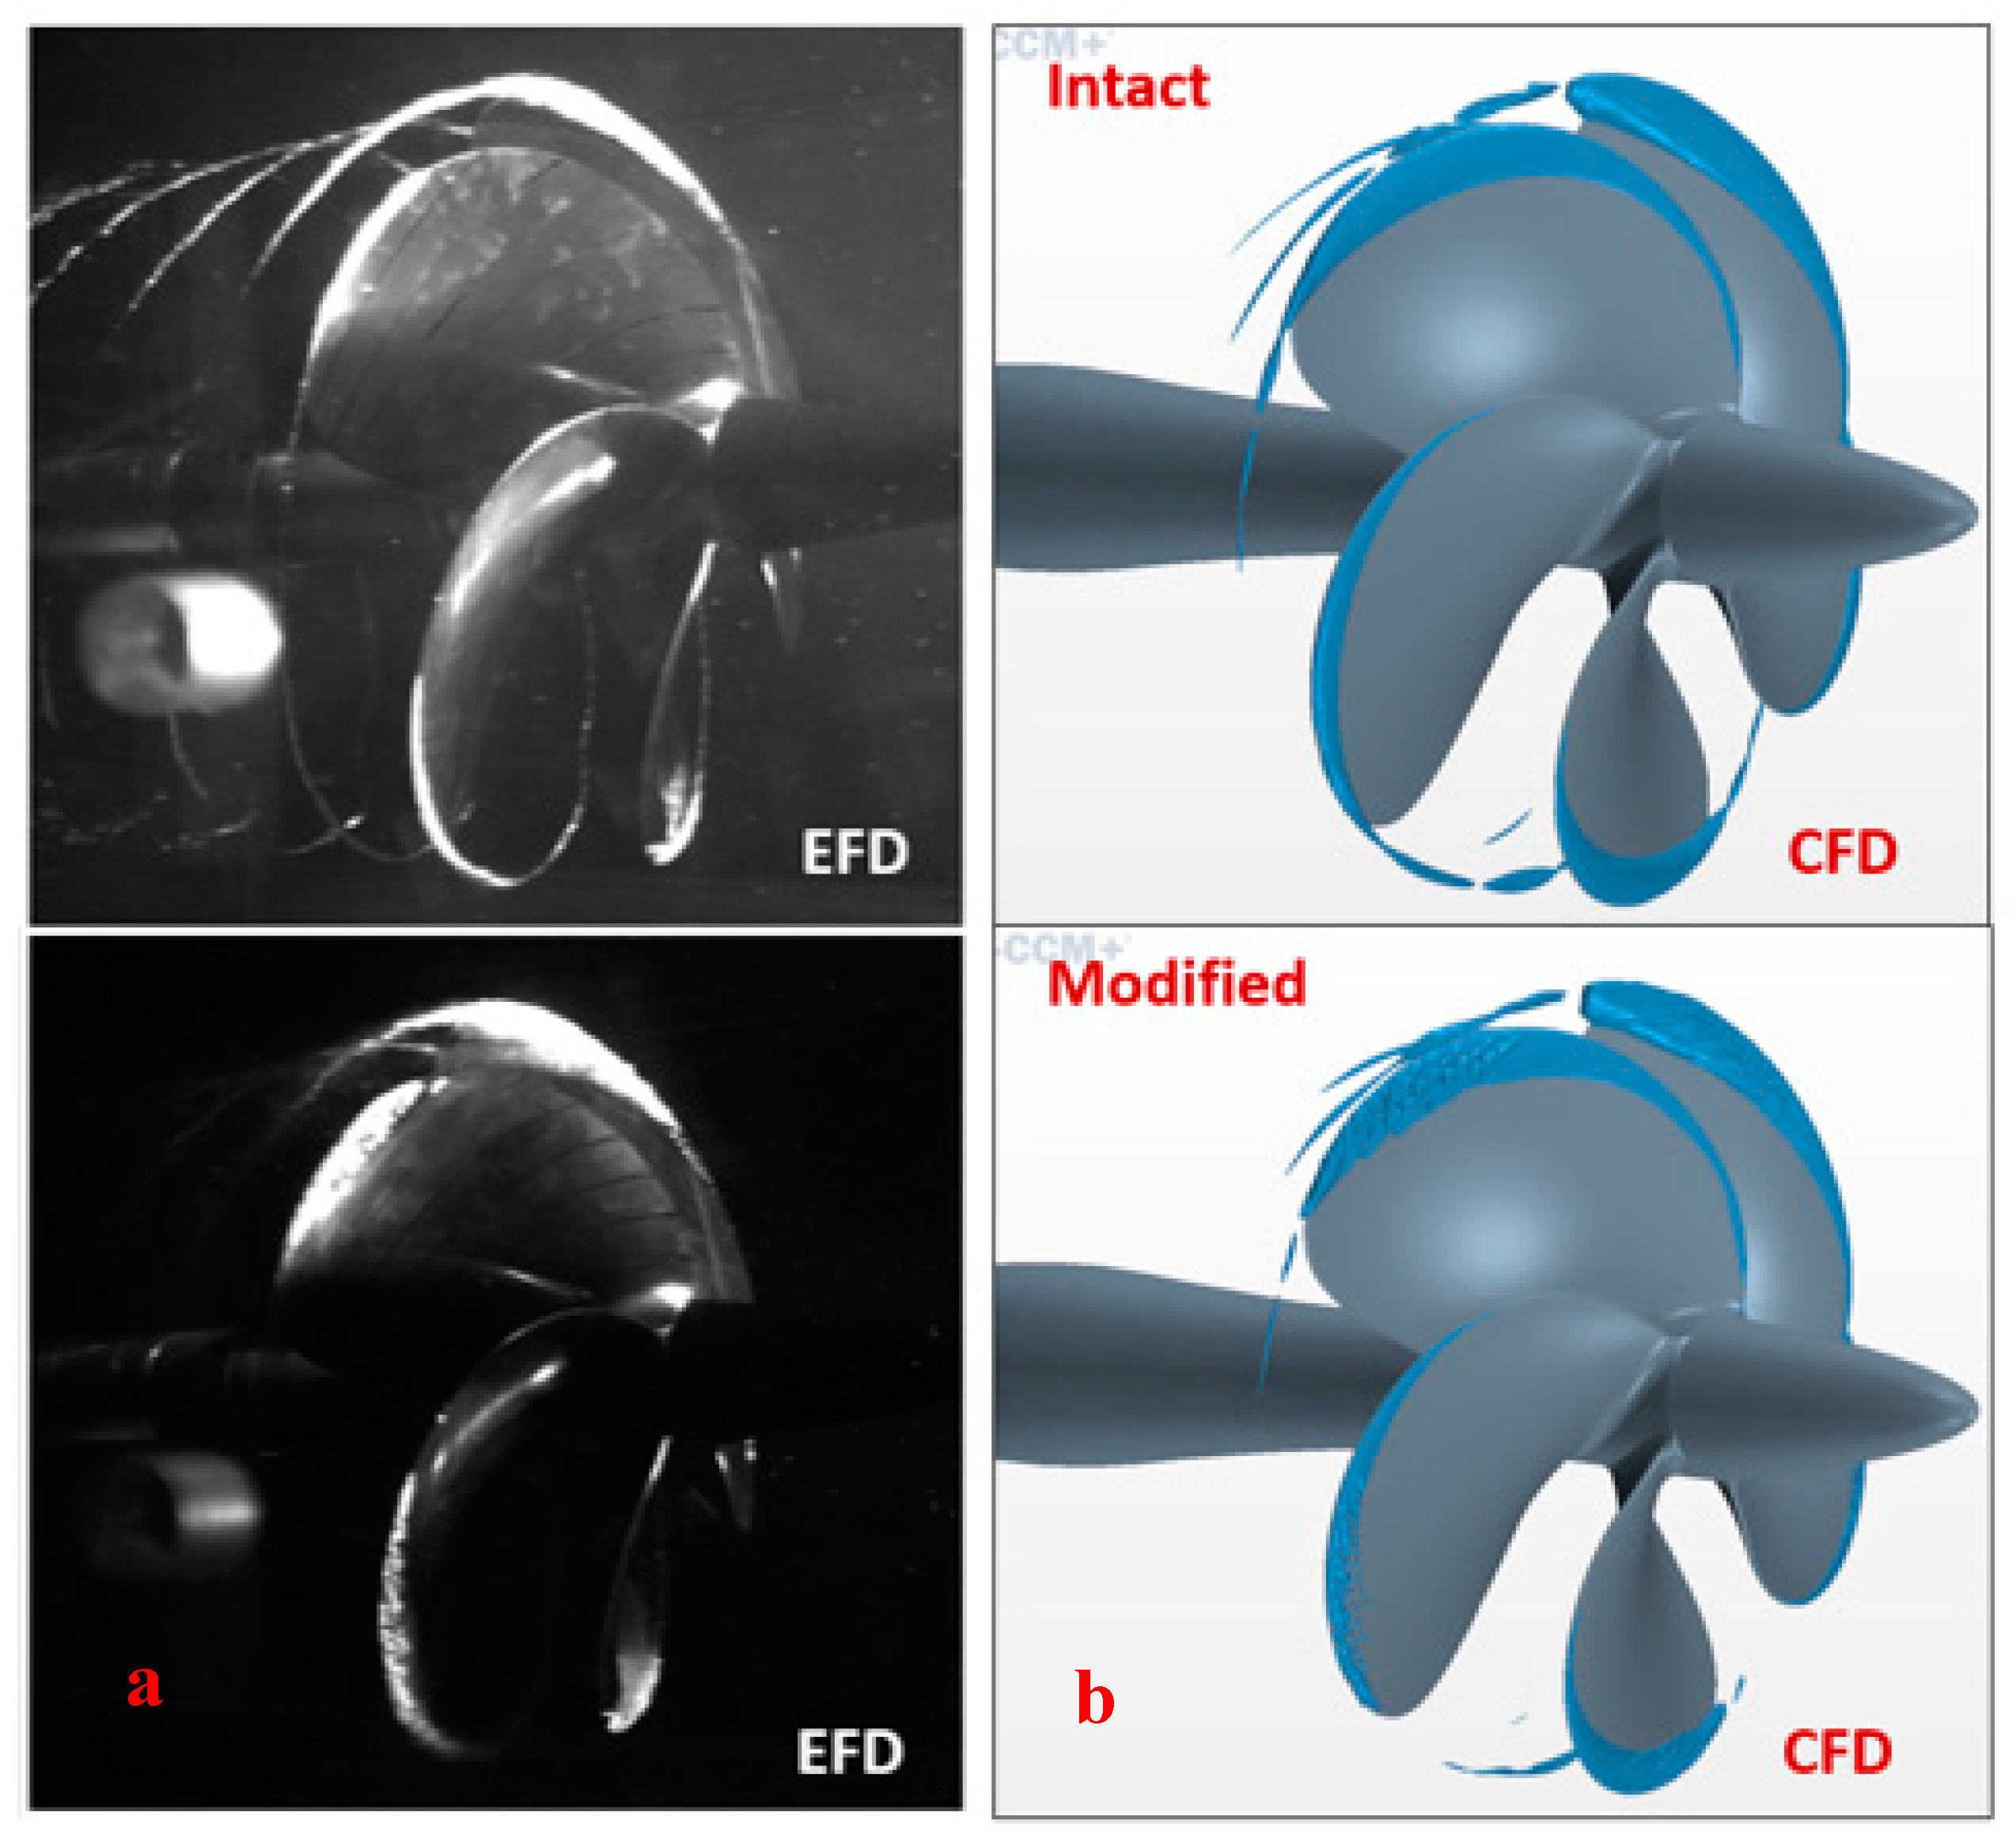
The commercial CFD software, STAR-CCM+ finite volume stress solver, was used in the present simulations to solve the governing equations (such as continuity and momentum) [23].
In CFD procedures, fluid flows are simulated using various methodologies depending on the nature of the flow problem and the availability of computational resources. Numerical methods can be broadly categorized as Reynolds Averaged Navier-Stokes (RANS), Detached Eddy Simulation (DES), Large Eddy Simulation (LES) and Direct Numerical Simulation (DNS). While RANS solvers are widely used for open water simulations to predict propeller performance coefficients, scale-resolving simulations such as DES and LES models are commonly required for calculating turbulent cavitating flows.
With the selection of the LES turbulence model for the tip vortex cavitation simulations of the base (intact) propeller model and modified model, different time step values were tried based on the time steps recommended by ITTC and others in the open literature. Hence the time step was calculated such that the propeller rotates between 0.5 and 2 degrees per time step [24]. Finally, a time step value of Δt = 5 × 10⁻⁵ s, corresponding to 0.59 degree of propeller rotation, was used for the cavitation simulations.
For cavitation modelling, while a Volume of Fluid (VOF) model was used in describing the multiphase flow, the present modelling used the Schnerr-Sauer model which is based on the Rayleigh-Plesset Equation (see STAR-CCM+ [23]).
The numerical domain for this study consisted of a static domain representing the cavitation tunnel and a rotational domain around the propeller employing a sliding mesh approach. The domain boundaries are defined as velocity inlet and pressure outlet. The tunnel wall, as well as the propeller, were defined as the wall-type of boundary conditions. The rotating domain passes through the gap between shaft and hub.

4.3. Results

In the following section, the results of the CFD investigations of The Princess Royal model propeller (intact and modified) in cavitating conditions are presented and discussed using cavitation patterns, including TVC extension. The cavitation pattern images are also compared with the EFD results of the cavitation observations for validation purposes.

Cavitation Pattern including TVC

Cavitation patterns derived using MARCS (Section 4.1) are shown in Figure 23 for the intact propeller (in top row figures) and Modified propeller (in bottom row figures), thus allowing the cavitation volume reduction to be estimated by CFD in selecting the favourable pressure pores arrangement.
Figure 24 and Figure 25 also compare the cavitation pattern images obtained through the EFD observations in the UNIGE cavitation tunnel and CFD computations for the intact and modified propellers. Good agreement was found for the visual cavitation dynamics, TVC size and extent. The expected cavitation volume reduction was also confirmed in both EFD and CFD results.
Furthermore, while Table 5 demonstrates KT comparison between CFD calculations and EFD results for the intact propeller, Table 6 compares KT and cavitation volume values that have been obtained from CFD computations for the intact and modified propeller.
The EFD and CFD results confirmed that the application of the Pressure Pores in the tip region of the propellers results in cavitation volume reduction. This can be observed through the decreased TVC appearance particularly in Figure 24. Although the Authors have not yet developed a CFD module for predicting cavitating noise levels within the scope of this study, the EFD measured reductions in noise from the drilled propeller blades are consistent with the cavitation volume reductions (up to 20%) estimated in CFD simulations (Table 6). This CFD modelling approach, based on MARCS, was used extensively in the selection process for the most favourable Pressure Pores arrangements as described in more detail in [14].

5. Conclusions

A complementary combination of experimental and numerical investigations was conducted to develop and explore the benefits of the PressurePoresTM concept to mitigate the URN levels of a cavitating marine propeller. Following a pilot study in a cavitation tunnel, which showed promising results, the extensive CFD simulations were conducted for further development of this mitigation technique and establish its strategic application.
To accurately simulate the effects of PressurePoresTM on the TVC of a propeller, a recently developed advanced adaptive meshing technique (MARCS) was coupled with a commercial CFD code to capture cavitating propeller flow properties. With the understanding achieved through the CFD simulations, the PressurePoresTM technology was applied on a prototype propeller and then validated by using model tests conducted in the University of Genoa cavitation tunnel and the CTO towing tank for the cavitation characteristics, noise and efficiency.
The test results conducted with the model propeller of a research vessel and two different combinations of the PressurePoresTM technology revealed that significant reductions in the measured propeller noise levels can be achieved.
Comparative test results for the “Modified Propeller-2” test case indicated a noise reduction as high as 17 dB compared to the unmodified propeller. This was achieved particularly in the frequency region which is of utmost importance for some marine mammals. For this configuration, towing tank results showed about a 2% loss in the propeller efficiency.
The test results for the first “Modified Propeller” showed further superior underwater noise reduction in the same high-frequency range but with a higher loss (of about 5.7%) in propeller efficiency.
The study shows that a recently developed advanced CFD modelling application can simulate sheet and tip vortex cavitation characteristics for intact blades and this with pressure relief holes. The CFD studies showed up to 13.8% cavitation volume reduction for the pressure pores applied on the earlier mentioned commercial tanker propeller used in [13], while the corresponding cavitation tunnel tests showed significant noise emission reductions (up to 10 dB) with only 0.5% loss of efficiency. This suggests that PressurePoresTM technology may be a useful and attractive noise mitigation technique for the retrofit of noisy marine propulsors within the framework of increasing scrutiny on the marine noise pollution from commercial shipping.

Author Contributions

Author contributions for various aspects of the manuscript is as following: Conceptualization, M.A., B.A. and D.T.; methodology, B.A, M.A. and N.Y.; software, N.Y., B.A. and N.S.; validation, N.Y., B.A. and P.F.; investigation, N.Y., B.A. and M.A; resources, M.A. and D.T.; data curation, B.A., N.Y.; writing—original draft preparation, B.A., N.Y., M.A., P.F. and N.S.; writing—review and editing, B.A., N.Y., M.A.; supervision, M.A., N.S., P.F. and D.T.; project administration, M.A.; funding acquisition, D.T. All authors have read and agreed to the published version of the manuscript.

Funding

This research was funded by OSCAR Propulsion Ltd.

Acknowledgments

The access provided to High-Performance Computing for the West of Scotland (Archie-West) through EPSRC grant no. EP/K000586/1 is gratefully acknowledged.

Conflicts of Interest

The authors declare no conflicts of interest.

References

  1. International Maritime Organization. Noise from commercial shipping and its adverse impacts, on marine life. Mar. Environ. Prot. Comm. Int. Marit. Organ. (MEPC) 2013, 66, 17. [Google Scholar]
  2. Ross, D. Mechanics of Underwater Noise; Peninsula Publishing: CA, USA, 1976. [Google Scholar]
  3. Frisk, G.V. Noiseonomics: The relationship between ambient noise levels in the sea and global economic trends. Sci. Rep. 2012, 2, 2–5. [Google Scholar] [CrossRef] [Green Version]
  4. Richardson, W.J.; Greene, C.R., Jr.; Malme, C.I.; Thomson, D.H. Marine mammals and noise. J. Exp. Mar. Biol. Ecol. 2013, 210, 161–163. [Google Scholar]
  5. White, P.; Pace, F. The Impact of Underwater Ship Noise on Marine Mammals. In Proceedings of the 1st IMarEST Ship Noise and Vibration Conference, London, UK, 27–28 January 2010. [Google Scholar]
  6. Chekab, M.A.F.; Ghadimi, P.; Djeddi, S.R.; Soroushan, M. Investigation of Different Methods of Noise Reduction for Submerged Marine Propellers and their Classification. Am. J. Mech. Eng. 2013, 1, 34–42. [Google Scholar] [CrossRef] [Green Version]
  7. Mautner, T.S. A Propeller Skew Optimization Method; Naval Ocean Systems Center: San Diego, CA, USA, 1987. [Google Scholar]
  8. Mosaad, M.A.; Mosleh, M.; El-Kilani, H.; Yehia, W. Propeller Design for Minimum Induced Vibrations. Port Said Eng. Res. J. 2011, 10, 2. [Google Scholar]
  9. Ji, B.; Luo, X.; Wu, Y. Unsteady cavitation characteristics and alleviation of pressure fluctuations around marine propellers with different skew angles. J. Mech. Sci. Technol. 2014, 28, 1339–1348. [Google Scholar] [CrossRef]
  10. Andersen, P.; Kappel, J.; Spangenberg, E. Aspects of Propeller Developments for a Submarine. In The First International Symposium on Marine Propulsors: Smp’09; Norwegian Marine Technology Research Institute (MARINTEK): Trondheim, Norway, 2009; pp. 551–561. [Google Scholar]
  11. Hyung-Sik, P.; Su-Hyun, C.; Nho-Seong, K. Identification of Propeller Singing Phenomenon through Vibration Analysis of Propeller Blade. In Proceedings of the 15th International Offshore and Polar Engineering Conference, (The International Society of Offshore and Polar Engineers), Seoul, Korea, 19–24 June 2005. [Google Scholar]
  12. Sharma, S.D.; Mani, K.; Arakeri, V.H. Cavitation noise studies on marine propellers. J. Sound Vib. 1990, 138, 255–283. [Google Scholar] [CrossRef]
  13. Xydis, K. Investigation into Pressure Relieving Holes on Propeller Blades to Mitigate Cavitation and Noise. Master’s Thesis, Newcastle University, Newcastle, UK, 2015. [Google Scholar]
  14. Aktas, B.; Yilmaz, N.; Atlar, M. Pressure-Relieving Holes to Mitigate Propeller Cavitation and Underwater Radiated Noise; Department of Naval Architecture Ocean and Marine Engineering; Strathclyde University: Glasgow, UK, 2018. [Google Scholar]
  15. Atlar, M.; Aktas, B.; Sampson, R.; Seo, K.C.; Viola, I.M.; Fitzsimmons, P.; Fetherstonhaug, C. A Multi-Purpose Marine Science & Technology Research Vessel for Full-Scale Observations and Measurements. In Proceedings of the International Conference on Advanced Model Measurement Technologies for the Marine Industry, Gdansk, Poland, 17–18 September 2013. [Google Scholar]
  16. Yilmaz, N.; Atlar, M.; Khorasanchi, M. An Improved Mesh Adaption and Refinement Approach to Cavitation Simulation (MARCS) of Propellers. J. Ocean Eng. 2019, 171, 139–150. [Google Scholar] [CrossRef] [Green Version]
  17. Korkut, E.; Takinaci, A.C. 18M Research Vessel Wake Measurements; Istanbul Technical University Faculty of Naval Architecture and Ocean Engineering: İstanbul, Turkey, 2013; p. 6. [Google Scholar]
  18. ITTC. Model-scale Propeller Cavitation Noise Measurements. Recommended Procedures and Guidelines 7.5-02-01-05. Available online: https://ittc.info/media/4052/75-02-01-05.pdf (accessed on 19 February 2020).
  19. ANSI. Quantities and Procedures for Description and Measurement of Underwater Sound from Ships – Part 1: General Requirements. American National Standard ANSI/ASAS. 2009. Available online: https://www.iso.org/obp/ui/#iso:std:iso:pas:17208:-1:ed-1:v1:en (accessed on 29 February 2020).
  20. Yilmaz, N.; Khorasanchi, M.; Atlar, M. An Investigation into Computational Modelling of Cavitation in a Propeller’s Slipstream. In Proceedings of the Fifth International Symposium on Marine Propulsion SMP’17, Espoo, Finland, 12–5 June 2017. [Google Scholar]
  21. Yilmaz, N. Investigation of Cavitation Influence on Propeller-Rudder-Hull Interaction. Ph.D. Thesis, University of Strathclyde, Glasgow, Scotland, 2019. [Google Scholar]
  22. Stern, F.; Wilson, R.V.; Coleman, H.W.; Paterson, E.R. Comprehensive Approach to Verification and Validation of CFD Simulations-Part1: Methodology and Procedures. J. Fluids Eng. 2001, 123, 793–802. [Google Scholar] [CrossRef]
  23. Siemens. STAR-CCM+ User Guide. 2018. Available online: https://www.plm.automation.siemens.com/media/global/en/Siemens%20PLM%20Simcenter%20STAR-CCM_tcm27-62845.pdf (accessed on 29 February 2020).
  24. The International Towing Tank Conference. ITTC Recommended Procedures and Guidelines, Practical Guidelines for Ship-Propulsion CFD, 7.5-03-03-01; The International Towing Tank Conference: Bournemouth, UK, 2014. [Google Scholar]
Figure 1. Influence of blade modification on cavitation noise for J = 0.38. Reproduced from [12] with permission from Elsevier, 1990.
Jmse 08 00158 g001
Figure 2. From left to right: “Base” propeller; “Tip” (region) modified propeller; and mid and tip (region) modified, “Sheet” propeller. Reproduced from [13] with permission from Newcastle University.
Jmse 08 00158 g002
Figure 3. Comparative non-dimensional thrust and torque coefficients in open water and cavitation condition. Reproduced from [13] with permission from Newcastle University.
Jmse 08 00158 g003
Figure 4. Comparative sound pressure levels of three model propellers J = 0.55 and cavitation condition. Reproduced from [13] with permission from Newcastle University.
Jmse 08 00158 g004
Figure 5. Comparative sound pressure levels of three model propellers tested for J = 0.50 and cavitation condition. Reproduced from [13] with permission from Newcastle University.
Jmse 08 00158 g005
Figure 6. Manufacturing accuracy Image of the Princess Royal Propeller.
Jmse 08 00158 g006
Figure 7. Princess Royal “Modified Propeller”.
Jmse 08 00158 g007
Figure 8. Princess Royal “Modified Propeller-2”.
Jmse 08 00158 g008
Figure 9. University of Geneva (UNIGE) cavitation tunnel.
Jmse 08 00158 g009
Figure 10. CTO Towing tank open water test set-up.
Jmse 08 00158 g010
Figure 11. Cavitation tunnel setup, longitudinal view.
Jmse 08 00158 g011
Figure 12. Nominal wake field: Simulated in cavitation tunnel (Left); Measured at towing tank (Right).
Jmse 08 00158 g012
Figure 13. Intact vs. Modified propeller and Modified Propeller-2 in condition V1 and viewed from starboard.
Jmse 08 00158 g013
Figure 14. Intact vs. Modified propeller and Modified Propeller-2 in condition V2 and viewed from starboard.
Jmse 08 00158 g014
Figure 15. 2 Net noise levels: Intact, Modified propeller and Modified Propeller-2 in the 1 m (narrowband), condition V1, hydrophone H3.
Jmse 08 00158 g015
Figure 16. Comparison between Intact, Modified Propeller and Modified Propeller-2 net noise levels at 1 m (one third octave band), condition V1, hydrophone H3.
Jmse 08 00158 g016
Figure 17. Comparison between Intact, Modified propeller and Modified Propeller-2 net noise levels at 1 m (narrowband), condition V2, hydrophone H3.
Jmse 08 00158 g017
Figure 18. Comparison between Intact, Modified Propeller and Modified Propeller-2 net noise levels at 1 m (one third octave band), condition V2, hydrophone H3.
Jmse 08 00158 g018
Figure 19. Noise reduction with application of pressure relief holes in Third Octave band for condition V2, measured at hydrophone H3.
Jmse 08 00158 g019
Figure 20. Open water characteristics of The Princess Royal model propeller (intact) before and after the application of PressurePoresTM (Modified propeller and Modified Propeller-2).
Jmse 08 00158 g020
Figure 21. Tip vortex cavitation refinement (MARCS); (a) Left; Treshold Region, (b) Right; Generated Mesh.
Jmse 08 00158 g021
Figure 22. Local drilled hole refinements for capturing accurate flow through the holes (a) Left; Propeller tip, (b) Right; Zoom to the hole.
Jmse 08 00158 g022
Figure 23. Pattern comparisons between intact and modified propellers for different blade positions. (Top row: Intact propeller, Bottom row: Modified propeller).
Jmse 08 00158 g023
Figure 24. Comparison between (a) EFD (Left) and (b) CFD (Right) results for intact and modified Propellers.
Jmse 08 00158 g024
Figure 25. Comparison between (a) EFD (Left) and (b) CFD (Right) for intact and modified propellers.
Jmse 08 00158 g025
Table 1. Propeller main characteristics and particulars.
ParametersValueUnit
Number of blades5
Full scale propeller diameter0.75(m)
Model scale propeller diameter0.22(m)
Pitch ratio0.8475
Blade area ratio 1.057
Rake0(deg)
Table 2. Full-scale operational conditions during sea trials.
ConditionEngine (RPM)Shaft (rps)STW (kn)KT10KQσN (nD)
V1150014.310.50.2110.3231.91
V2200019.015.10.1880.3181.07
Table 3. Non-dimensional performance and operational parameters for propellers.
Performance CharacteristicsSymbolFormula
Thrust coefficientKT T ρ n 2 D 4
Torque coefficientKQ Q ρ n 2 D 5
Advance coefficientJ V a n D
Efficiencyη0 J × K T 2 π × K Q
where T is the thrust, Va is the advance velocity, Q is the torque and η0 is the propeller efficiency.
Table 4. Cavitation observation for the intact propeller, Modified Propeller and Modified Propeller-2 cases for Condition V1 and V2.
ConditionKTσNIntact Propeller” ObservationsModified Propeller” ObservationsModified Propeller-2” Observations
V10.2111.91TVC everywhere, starting from blade L.E.; S.S. sheet cavitation at 0°, from 0.8R to the tip, for 15% of the chord at 0.8R, 100% at 0.97R; S.S. sheet cavitation at 180°, from 0.85R to the tip, for 10% of the chord at 0.85R.Pores cavitation everywhere; TVC at 0° and 180°, only cloudy vortex at other positions; S.S. sheet cavitation at 0°–45° from 0.8R for 10% of the chord, merging with holes cavitation at outer radii; S.S. sheet cavitation at 180°, from 0.85R for 5% of the chord, merging with holes cavitation at outer radii.Pores cavitation everywhere; TVC everywhere, at 90° and 270° the cavitating core is at inception; S.S. sheet cavitation at 0°, from 0.8R, for 15% of the chord, at 180°, from 0.85R for 10% of the chord.
V20.1881.07TVC everywhere, starting from blade L.E.; double vortex at 0°–60°; S.S. sheet cavitation at 0°, from 0.8R to the tip, for 50% of the chord at 0.8R, 100% at 0.85R; S.S. sheet cavitation at 90° and 270°, from 0.9R for 10% of the chord; S.S. sheet cavitation at 180°, from 0.83R to the tip, for 50% of the chord at 0.83R, 100% of the chord at 0.92RPores cavitation everywhere; TVC everywhere, with double vortex at 0°–60°; S.S. sheet cavitation at 0°–45° from 0.8R for 30% of the chord, merging with holes cavitation at outer radii; S.S. sheet cavitation at 180°, from 0.83R for 20% of the chord, merging with holes cavitation at outer radii.Pores cavitation everywhere; TVC everywhere, the cavitating core is now well developed but still presents unstable behaviour; double vortex at 0°; S.S. sheet cavitation at 0° from 0.8R for 40% of the chord, at 180° from 0.8R for 30% of the chord.
Table 5. Comparison of KT values for intact propeller between the EFD and computational fluid dynamics (CFD) results.
Intact Propeller
EFDCFD
KT0.2110.225
Δ% KT-6.6%
Table 6. KT and cavity volume comparison between Intact and Modified Propeller (CFD).
CFD
IntactModified
Cavitation volume (m3)8.11 × 10−66.47 × 10−6
KT0.2250.222
Δ% KT−1.3%
Δ% cavitation volume−20.1%

