Abstract
The objective of this study is to investigate the strength of the rectangular plates subjected to cyclic load reversals with varying strain ranges. The finite element solution is implemented to estimate the load-carrying capacity. The influence of the initial imperfections, plate thicknesses and aspect ratio parameters have been accounted for. The cyclic response is predicted by using the material model assumed to follow the combined non-linear isotropic and kinematic strain hardening rules with Von Misses yield criterion accounting for the Bauschinger effect. It has been shown that the type of plastic formation during the cyclic load has a significant influence on the structural capacity and stiffness reduction. The initial imperfection has a significant impact on the ultimate load capacity reduction where the uni-modal initial imperfection type leads to a more stable load transition and plastic formation, reducing the structural capacity during the cyclic load exposure.
1. Introduction
The cyclic load phenomenon is a common load type that the structures are subjected during their service life. Its impact has been investigated accounting for different aspects of problems in various fields of engineering. It may take place as a result of a variety of causes, for example, when civil buildings are exposed to earthquakes or ships are subjected to extreme wave loads (Det Norske Veritas-Germanischer LIyod, DNV-GL [1], Eurocode-3 [2], Eurocode-8 [3], the Federal Emergency Management Agency, FEMA [4]).
When the steel structure is subjected to a cyclic load, their hysteretic behaviour becomes a critical issue to be investigated involving the structural capacity and stiffness reduction. Its impact is magnified with the strain reversals. Ibarra et al., 2005 [5] provided the description, calibration and application of hysteretic models accounting for the strength and stiffness deteriorations for a variety of materials including steel.
Azevedo et al., 1994 [6] provided an overview of experimental methodologies for the cyclic load and analytical methods to simulate the hysteretic behaviour of steel structural components.
Zhou et al., 2015 [7] performed a series of cyclic load tests accounting for several cyclic loading protocols and material properties under considerable inelastic strain exposure and they concluded that the loading history has a considerable influence on the stress-strain response and it is more pronounced at low amplitude loadings. Different cyclic load protocols have also been studied by Shi et al., 2011 [8] and Shi et al., 2012 [9] where the difference between the monotonic and hysteretic curves has been presented.
Krolo et al., 2016 [10] investigated the behaviour of structures, built of mild steel and subjected to the cyclic load accounting for variable strain ranges by applying the displacement controlled load. They compared the hysteretic curves as predicted by the finite element solution and experimental results, showing a good agreement.
Zhao et al., 2019 [11] studied aluminium alloys under low-cycle fatigue loading and they showed that as the number of the cyclic load increases, it gives rise to the load-carrying capacity and stiffness reduction. Wang et al., 2019 [12] analysed steel-reinforced concrete columns subjected to the cyclic load employing a damage assessment approach where the hysteretic and skeleton curves have been developed based on the test results.
Ship hull structures are made up of steel by and largely are exposed to a variety of loads throughout the ship’s service life at sea. The imposed loads play a significant role in defining the overall structural capacity of the ship structure. Hence, the structural behaviour and capacity to resist different loads are to be well understood in the first place to enhance the ship and crew safety and also to protect the marine environment in case of structural failure.
The cyclic load is also one of the load types that the ships are subjected to. The degree of the cyclic load exposure may differ depending on the sea state conditions where the ships are operating.
A variety of tools and methods have been developed to estimate the ultimate load-carrying capacity of the ship structure (Smith 1977 [13], Paik et al., 2012 [14], ALPS/HULL [15]).
Smith 1977 [13] proposed a progressive collapse method also widely used by the Common Structural Rules [16], in order to estimate the ultimate ship strength. The ship cross-section is divided into components defined as a unit of plates with associated stiffeners, hard corner or plate elements. Each element is independent and progressively loses its strength and stiffness during the incremental permissible curvature.
Gordo and Guedes Soares 1997 [17] used the progressive collapse method to assess the ultimate load-carrying capacity of the hull girders and verified with the experimental results demonstrating good accuracy. The progressive collapse method was also implemented in Gordo and Guedes Soares 1996 [18] and Paik et al., 2012 [19].
The finite element solution is also being commonly used for the ultimate collapse analysis of marine structures which was initially performed by Chen et al., 1983 [20]. Several authors, Paik et al., 2008 [21], Xu et al., 2013 [22] and Tekgoz et al., 2018 [23], studied the ultimate shipload carrying capacity using the finite element solution which is based on a force-rotation-controlled static load.
In these approaches, the structure is allowed to follow a path under a static pure-bending load with an incrementally increasing curvature.
However, the ship plating is predominantly subjected to the dynamic loads that subsequently leads to the cyclic load attack, which is added to the complexity of the geometrical and material nonlinearity of the structural assessment.
Yao et al., 1990 [24] performed a series of elastic-plastic large deflection analysis on plates under cyclic load. They studied the influence of the cyclic load on the plate in-plane rigidity, re-yielding and ultimate load capacity reduction for a wide plate.
Goto et al., 1995 [25] studied the influence of the localization of the plastic buckling on the steel structures where they concluded that it significantly reduces the loading capacity of the steel structure under the cyclic load.
Komoriyama et al., 2018 [26] studied the influence of the cumulative buckling under the cyclic load on the load capacity of the stiffened panels. They showed that when the cyclic compressive load is around the ultimate capacity of the structure, the cumulative buckling deformation is high. However, its impact on the ultimate load carrying capacity is small.
Yao et al., [27] developed an analytical solution for a plate subjected to a cyclic load in order to simulate the collapse behaviours accounting for the welding induced residual stresses where a simple dynamical model has been introduced presenting a good agreement with the one defined by the finite element solution.
Cui et al., 2018 [28] studied the ultimate load-carrying capacity of the ship hull girder under a cyclic load using the Smith’s method and a good agreement has been achieved when compared to the one predicted by the finite element solution.
Li et al., 2019 [29] proposed an analytical solution to predict the buckling and collapse response of both plates and stiffened panels under the cyclic load showing a good agreement with the FEM prediction.
The cyclic response is a complex phenomenon that involves several aspects to be considered both from material non-linearity being a function of the material stress-strain definition and geometrical non-linearity being the buckling, initial imperfections, plastic formation pattern, etc.
Here in this study, the ship is considered to be exposed to an extreme cyclic load. The term extreme cyclic load has been considered in the sense that the ship is already failed and she is in post-collapse stages. In this state, the ship may experience extreme cyclic behaviour, and its post-collapse structural capacity might be lower than what the static approaches predict.
Therefore, the strain ranges considered in this study can be considered within the range of the extreme ones. The plates, as a part of the ship hull structure, have been assumed to be failed in the initial loading and exposed to the multiple cyclic loads in order to see how the structural response of the plate changes.
The objective of this study is to investigate the strength of rectangular plates subjected to cyclic load with varying strain ranges. The finite element solution is implemented to estimate the load-carrying capacity. The influence of the initial imperfections, plate thicknesses and aspect ratio parameters have been accounted for.
2. Finite Element Modelling
2.1. Material and Structural Description
The material properties are assumed as reported in Krolo et al., 2016 [10] for the present study, as can be seen in Table 1.

Table 1.
Material property descriptors.
Due to the complexity of the cyclic behaviour of the structures which may exhibit strain hardening accompanying a structural capacity increase, and material yield stress reduction which is termed as the Bauschinger effect, that leads to the structural capacity reduction, a comprehensive material model that may mimic this complex behaviour under the cyclic load is defined.
Here the Chaboche [30] nonlinear kinematic hardening and the non-linear isotropic hardening rules under the cyclic load has been used, and its descriptors have been shown in Table 1. which have been calibrated based on the experimental cyclic test data as given by Krolo et al., 2016 [10].
The yield surface definition is defined following the Von Mises criterion, ANSYS [31]:
where is the material yield stress and is the equivalent Von Mises stress concerning the back stress , that equals to:
where is the stress tensor, is the deviatoric stress tensor and is the deviatoric part of the back stress tensor.
The material yield stress definition with the material isotropic hardening rule is defined as, ANSYS [31]:
where is the material initial yield stress at zero plastic strain. and are the material parameters of the isotropic hardening behaviour of the materials, defined based on the experimental cyclic test data and is the equivalent plastic strain.
The evolution of each back stress model with the kinematic hardening rule equals to, ANSYS [31]:
where and are the material parameters of the kinematic hardening behaviour of materials, defined based on the experimental cyclic test data, and finally, is the overall back stress defined as, ANSYS [31]:
where is the back stress number which has been set to 3 here.
Three different plates with varying plate aspect ratios and plate thicknesses have been studied here in order to investigate their impact on the structural capacity under the cyclic load, as shown in Table 2.
Table 2.
The plate structural definition.
2.2. Load, Boundary Condition and Initial Imperfection
The boundary conditions applied to the Finite Element Method, FEM model edges are simply supported conditions. The simply supported boundary conditions have been kept for all FEM studies performed here.
For the plate with an aspect ratio 1, only a quarter part of the plate has been modelled, and the symmetry boundary conditions have been applied to the respective locations, and for the longer plates, the entire plate has been modelled as shown in Figure 1:
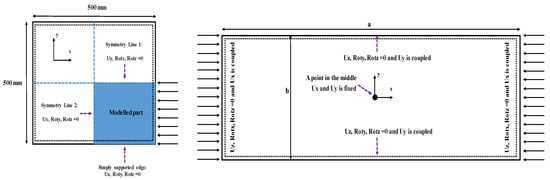
Figure 1.
Boundary conditions for plate 1 (left) and plate 2 and 3 (right).
There are two types of initial imperfections used, namely, the uni-modal and the multi-modal ones (see Figure 2). The uni-modal one, which is termed here as Initial imp_B, takes the general form as defined by Ueda et al., 1985 [32]:
where a is the length of the plate, b is the breath of the plate, m and n are parameters depending on the number of half-waves considered. For all FE studies here, n is set to 1 and m is calculated as the minimum integer as follows:
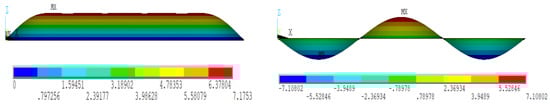
Figure 2.
Multi-modal initial imperfection (left) and uni-modal initial imperfection (right).
As for the mid-plate maximum initial imperfection, Wmax is given as for the average initial imperfections unless stated otherwise in the respective sections, as defined by Smith et al., 1988 [33]:
where represents plate slenderness and tp is the plate thickness.
As for the multi-modal initial imperfection that is labelled as Initial imp_A, it takes the general form of Ueda et al., 1985 [32]:
where is the maximum magnitude of each component of initial imperfection which is defined concerning each plate aspect ratio and n is set to 1 for each component here.
As to the cyclic load, a displacement controlled load has been applied in order to avoid sudden load fluctuations that may occur during the plate buckling phenomenon as can be seen in Figure 3.
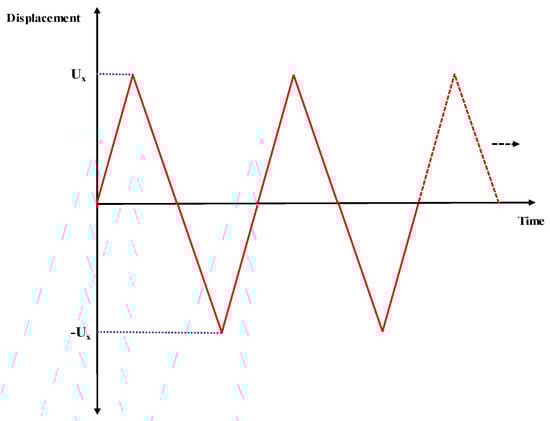
Figure 3.
Load application.
The cyclic load response has been estimated by the FEM method using commercial finite element software, ANSYS [31]. The shell element SHELL181 has been used to model the studied plates. The element type has four nodes with six degrees of freedom at each node, including translations and rotations about the x, y, and z-axes.
3. Results
3.1. The Impact of the Cyclic Load on the Load Capacity, Plate 1
Here the impact of the cyclic load on the ultimate strength is analysed. Firstly, a square plate, that is labelled as Plate 1, with a thickness of 5 mm and 10 mm is studied. The amplitude of the initial imperfection, Wmax, is taken as 10% of the plate thickness. The material property and load definition are provided in Section 2.1 and Section 2.2. Under these conditions, the plate may experience the elastic and plastic buckling.
The influence of the varying strain range is studied employing one half-cycle load as can be seen in Figure 4 and Figure 5. Figure 4 shows the normalized strength and strains as a result of the half-cycle load. The load is initially compressive, and the tensile load follows to complete the half cycle. Figure 5 shows the normalized strength and strains under half-cycle load. The load is initially tensile, and the compressive load follows to complete the half cycle.
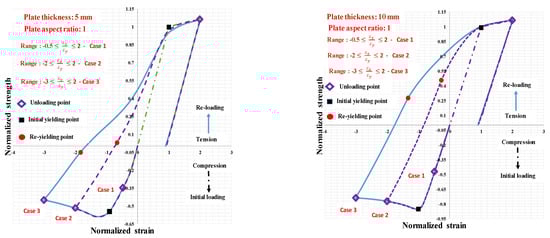
Figure 4.
Plate thickness: 5 mm (left) and plate thickness: 10 mm (right), first compressive followed by a tensile load.
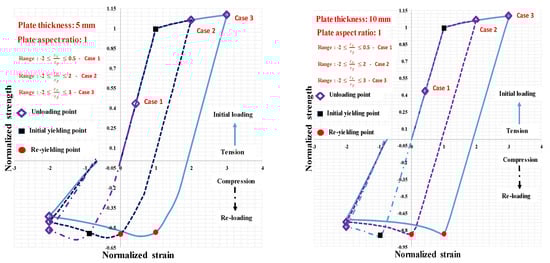
Figure 5.
Plate thickness: 5 mm (left) and plate thickness: 10 mm (right), first tensile followed by compressive load.
The square plate response may differ depending on how the plate is initially loaded. The plate re-yielding points do not differ if it is first loaded under tensile load and followed by a compressive load. However, it significantly changes if it is firstly loaded under compression and followed by a tensile load. This holds true for both plate thickness cases. Similar findings have also been given in Yao et al., 1990 [24] for a wider plate.
This might be explained with the non-uniform residual plastic deformations that occur in previous compressive loading history and due to the buckling phenomenon.
Additionally, the plate with a 5 mm thicknesses creates a local plasticity line forming a partial failure mechanism (see Figure 6). When a failure mechanism occurs in the plate, it governs the plate deformation and causes unloading on the stresses in the other parts of the plate, and this phenomenon, apart from the developed residual plastic strains and Bauschinger effect, may also explain why the re-yielding reduction is more influenced when it is re-loaded in the case of a plate thickness of 5 mm (see Figure 4).
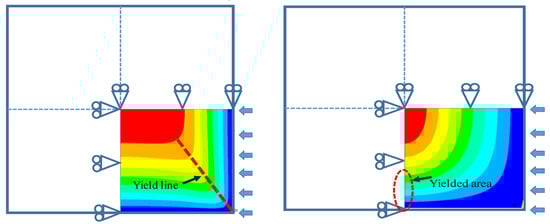
Figure 6.
Plate thickness: 5 mm (left) and plate thickness: 10 mm (right), yielding location.
On the next stage, the square plate is subjected to the multiple cycle load with a variable strain range. Figure 7 shows the normalized strength and strain response of the plate that is subjected to the multiple cyclic loads accounting for the plate thicknesses. For both cases, a plate thickness of 5 mm and 10 mm, the response approaches to converged loop after several cyclic loads.
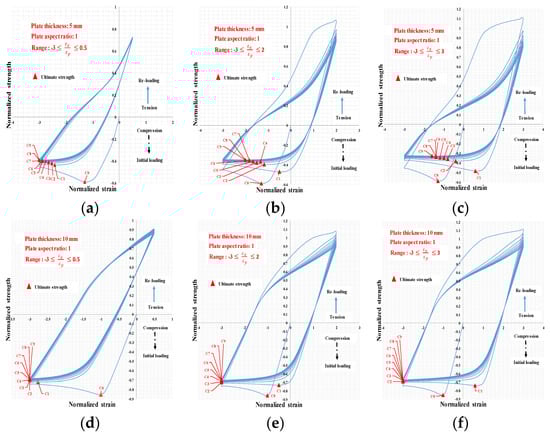
Figure 7.
(a) t = 5 mm, ; (b) t = 5 mm, ; (c) t = 5 mm, ; (d) t = 10 mm, ; (e) t = 10 mm, ; (f) t = 10 mm, .
As the number of the cyclic load is increasing, this gives a rise of the ultimate strength and initial stiffness reduction which has been observed with the square plate (see Figure 8).
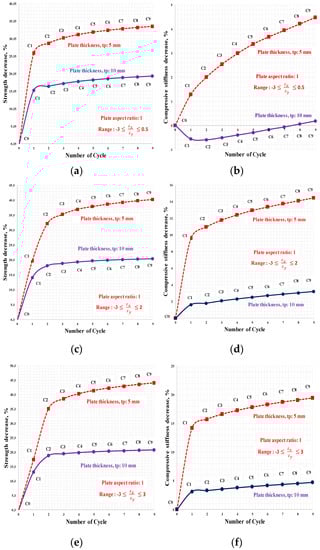
Figure 8.
(a) Strength decrease, ; (b) Stiffness decrease, ; (c) Strength decrease, ; (d) Stiffness decrease, ; (e) Strength decrease, ; (f) Stiffness decrease, .
It has been observed in the case of a square plate that as the plate thicknesses are reduced, the ultimate load-carrying capacity and its stiffness reduction is more pronounced and in addition to this, the reduction is magnified with the increase of the strain range.
3.2. Impact of the Cyclic Load on the Load Capacity, Plate 2 and 3
Firstly, the impact of the plate thickness using the Initial imp_B has been studied under a half load cycle, as shown in Figure 9. This study is performed to see the influence of the order of the loading with long plates by varying the plate thicknesses. A particular case with a plate thickness of 8 mm is also presented to analyse the response under the half-cycle load concerning the order of the cyclic load.
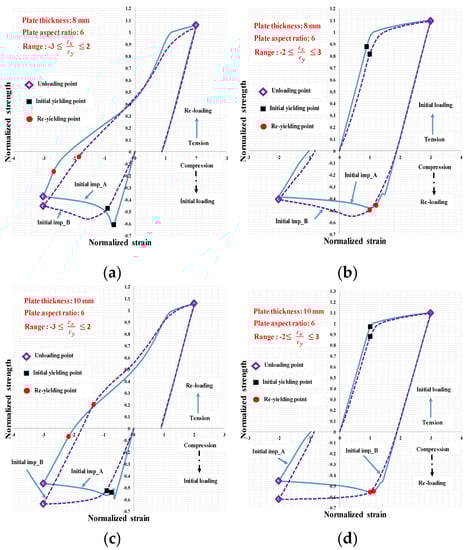
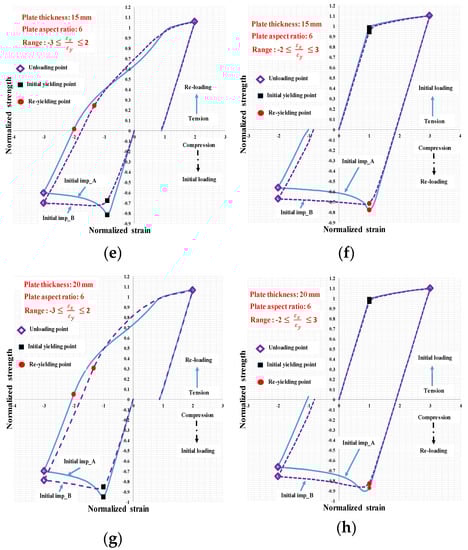
Figure 9.
(a) t = 8 mm, first compressive followed by tensile load; (b) t = 8 mm, first tensile followed by compressive load; (c) t = 10 mm, first compressive followed by tensile load; (d) t = 10 mm, first tensile followed by compressive load; (e) t = 15 mm, first compressive followed by tensile load; (f) t = 15 mm, first tensile followed by compressive load; (g) t = 20 mm, first compressive followed by tensile load; (h) t = 20 mm, first tensile followed by compressive load.
The results show that when the plate thickness is less than 10 mm, it may show a different structural capacity when it is loaded first under tensile load. For the rest of the cases, the order of the loading does not have a significant impact on the structural response.
At the next stage, the impact of the uni-modal and multi-modal initial imperfection is studied under multiple cyclic loads with a constant strain range of using Plate 2 and 3 that has an aspect ratio of 3 and 6, respectively in order to see the effect of the initial imperfection on the ultimate load-carrying capacity under the multiple cyclic load exposure.
Figure 10 shows the normalized strength and strain prediction of the FEM accounting for the plate initial imperfections under the multiple cyclic loads for the plate with an aspect ratio: 6.
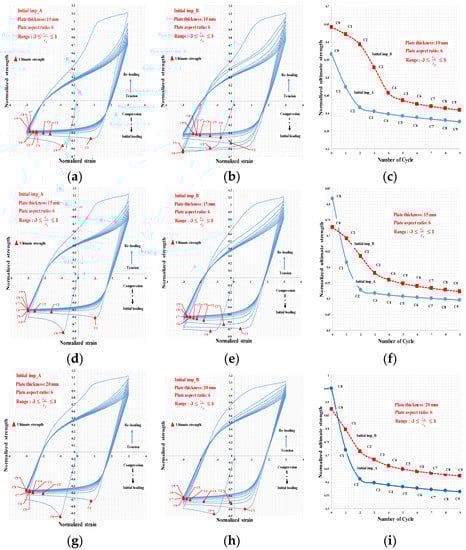
Figure 10.
(a) t = 10 mm, Initial imp_A ; (b) t = 10 mm, Initial imp_B, ; (c) Normalized ultimate strength, ; (d) t = 15 mm, Initial imp_A, ; (e) t = 15 mm, Initial imp_B ; (f) Normalized ultimate strength ; (g) t = 20 mm, Initial imp_A ; (h) t = 20 mm, Initial imp_B ; (i) Normalized ultimate strength .
The multi-modal initial imperfection, the initial imp_A, exhibits lower strength performance contrary to the uni-modal initial imperfection, the Initial imp_B, as can be seen in Figure 10.
In the case of the uni-modal case, Initial imp_B, the load transition forms smooth plastic deformation to other parts and follows the pattern during the entire cyclic load exposure. However, in the case of the multi-modal case, Initial imp_A, the load transition is not smooth and very local plastic formation occurs at the early stage of the cyclic load and continues with it throughout the cyclic load exposure. In addition to that, at the final stages of the cyclic load exposure, in both cases, the structure creates a local plastic mechanism by which the structure is governed, and it may finally lead to rupture as can be seen from Figure 11 and Figure 12.
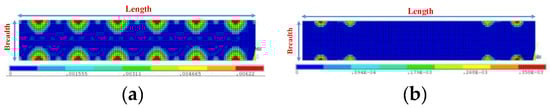
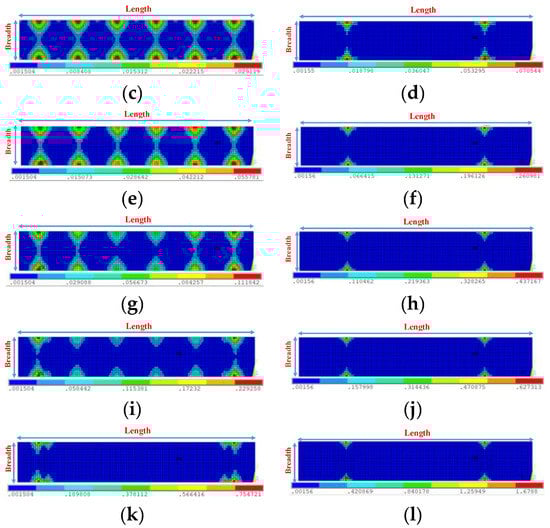
Figure 11.
(a) Initial imp_B, plastic strains at C0; (b) Initial imp_A, plastic strains at C0; (c) Initial imp_B, plastic strains at C1; (d) Initial imp_A, plastic strains at C1; (e) Initial imp_B, plastic strains at C2; (f) Initial imp_A, plastic strains at C2; (g) Initial imp_B, plastic strains at C3; (h) Initial imp_A, plastic strains at C3; (i) Initial imp_B, plastic strains at C4; (j) Initial imp_A, plastic strains at C4; (k) Initial imp_B, plastic strains at C9; (l) Initial imp_A, plastic strains at C9.
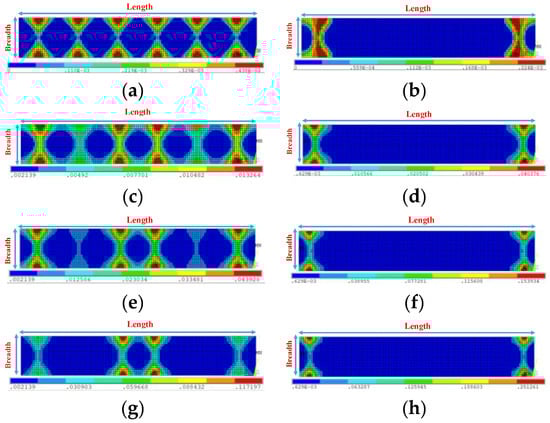
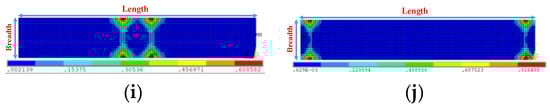
Figure 12.
(a) Initial imp_B, plastic strains at C0; (b) Initial imp_A, plastic strains at C0; (c) Initial imp_B, plastic strains at C1; (d) Initial imp_A, plastic strains at C1; (e) Initial imp_B, plastic strains at C2; (f) Initial imp_A, plastic strains at C2; (g) Initial imp_B, plastic strains at C3; (h) Initial imp_A, plastic strains at C3; (i) Initial imp_B, plastic strains at C9; (j) Initial imp_A, plastic strains at C9.
Figure 11 shows the progress of the equivalent plastic strains at the ultimate compressive capacity under the cyclic load for the plate thicknesses of 10 mm using an aspect ratio of 6 accounting for the different initial imperfection.
Figure 12 shows the progress of the equivalent plastic strains at the ultimate compressive capacity for a plate thickness of 20 mm with an aspect ratio of 6.
It is observed that in the case of a plate thickness of 10 mm, the load transition is faster contrary to the one of 20 mm as shown in Figure 11 and Figure 12 in the case of the uni-modal initial imperfection. This may be one of the reasons why the plate with a 10 mm thickness exhibits more considerable ultimate carrying capacity reduction as the cycle number is increasing.
Figure 13 shows the normalized strength and strain prediction of the FEM accounting for the plate initial imperfections under multiple cyclic loads with an aspect ratio of 3. The multi-modal initial imperfection exhibits a lower strength performance compared to the uni-modal initial imperfection, as can be seen in Figure 13. Similar predictions have also been observed with the plate aspect ratio of 6.
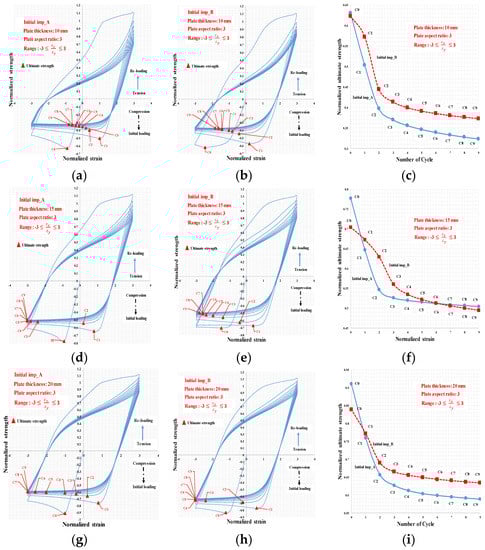
Figure 13.
(a) t = 10 mm, Initial imp_A ; (b) t = 10 mm, Initial imp_B, ; (c) Normalized ultimate strength, ; (d) t = 15 mm, Initial imp_A, ; (e) t = 15 mm, Initial imp_B ; (f) Normalized ultimate strength ; (g) t = 20 mm, Initial imp_A ; (h) 20 mm, Initial imp_B ; (i) Normalized ultimate strength .
Figure 14 shows the progress of the equivalent plastic strains at the ultimate compressive capacity under the cyclic load for a plate thicknesses of 10 mm with an aspect ratio of 3.
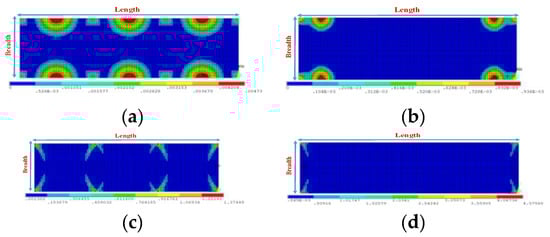
Figure 14.
(a) Initial imp_B, plastic strains at C0; (b) Initial imp_A, plastic strains at C0; (c) Initial imp_B, plastic strains at C9; (d) Initial imp_A, plastic strains at C9.
Figure 15 shows the progress of the equivalent plastic strains at the ultimate compressive capacity under the cyclic load for a plate thicknesses of 20 mm with an aspect ratio of 3.
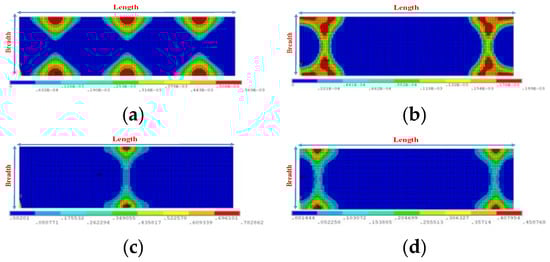
Figure 15.
(a) Initial imp_B, plastic strains at C0; (b) Initial imp_A, plastic strains at C0; (c) Initial imp_B, plastic strains at C9; (d) Initial imp_A, plastic strains at C9.
Similar observation as with the plate with an aspect ratio of 6 can be seen in the case of a plate thickness of 20 mm, where the uni-modal initial imperfection has smooth load transition, plastic formation, as can be seen in Figure 15 and in the case of the multi-modal one, the local plastic formation again occurs at early stages during the cyclic load exposure.
The plate with a thickness of 10 mm and aspect ratio:3 shows a different plastic formation which may be one of the reasons why the ultimate load-carrying capacity is more pronounced under the multiple cyclic load exposure. The plate, in this case, might follow the plastic formation pattern, as shown in Figure 16. In this case, the plastic lines govern the plate deformation, which gives rise to more considerable ultimate load capacity reductions during the cyclic load exposure.
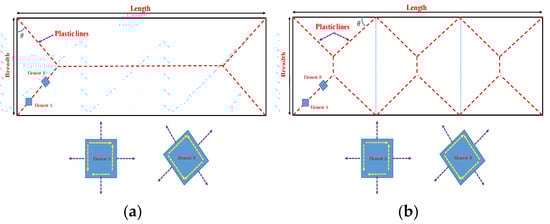
Figure 16.
Initial imp_A (left) and initial imp_B (right), possible plastic formation pattern, t = 10 mm, aspect ratlio:3.
In the next study, the longer plates are subjected to a multiple load exposure considering only the uni-modal initial imperfection, the initial imp_B, in order to analyse the ultimate load-carrying capacity reduction accounting for the plate thickness and aspect ratios.
Figure 17 and Figure 18 show the cyclic response of the plate with an aspect ratio of 6 and 3, respectively, by varying the plate thicknesses and strain ranges.
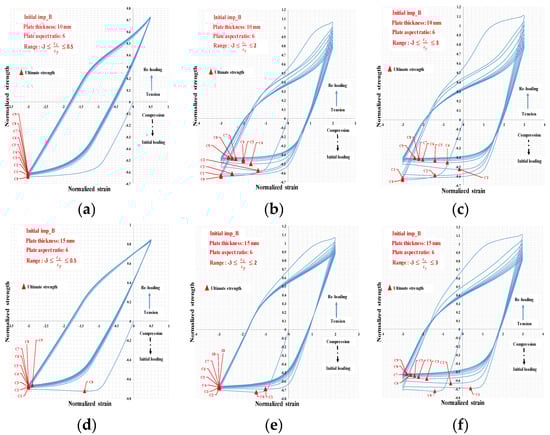
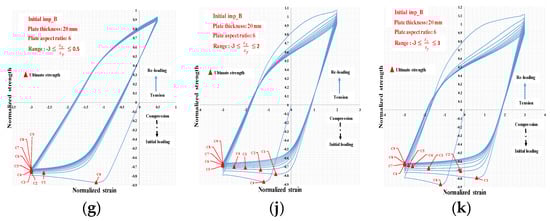
Figure 17.
(a) t = 10 mm, ; (b) t = 10 mm, ; (c) 10 mm, ; (d) t = 15 mm, ; (e) 15mm, ; (f) 15 mm, ; (g) 20 mm, ; (j) 20 mm, ; (k) 20 mm, .
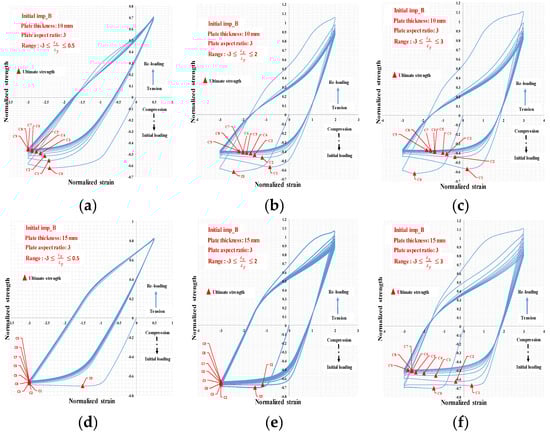
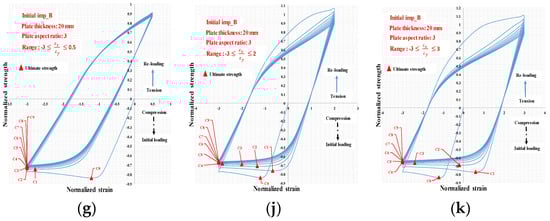
Figure 18.
(a) t = 10 mm, ; (b) t = 10 mm, ; (c) t = 10 mm, ; (d) t = 15 mm, ; (e) t = 15mm, ; (f) 15 mm, ; (g) t = 20 mm, ; (j) t = 20 mm, ; (k) t = 20 mm, .
Figure 19 shows the ultimate capacity reduction accounting for the plate thickness and aspect ratios subjected to multiple cyclic loads.
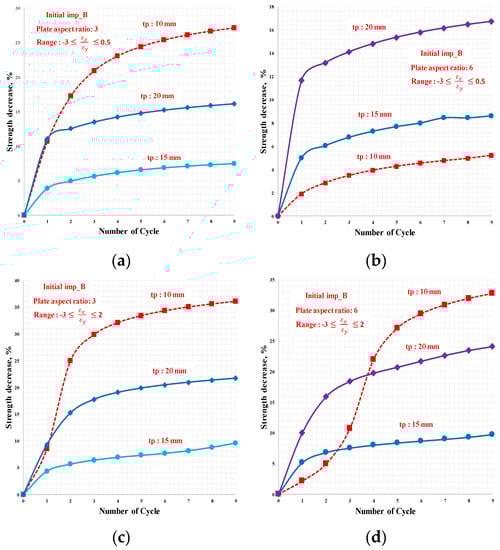
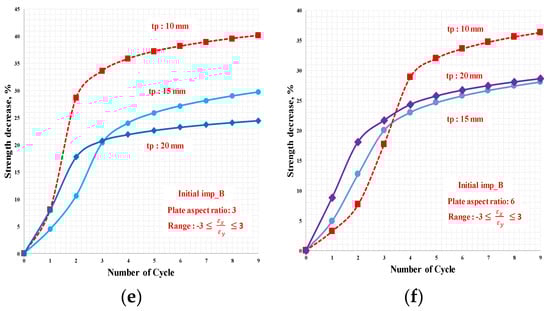
Figure 19.
(a) Aspect ratio: 3, Initial imp_B, Strength decrease, ; (b) Aspect ratio: 6, Initial imp_B, Strength decrease, ; (c) Aspect ratio: 3, Initial imp_B, Strength decrease, ; (d) Aspect ratio: 6, Initial imp_B, Strength decrease, ; (e) Aspect ratio: 3, Initial imp_B, Strength decrease, ; (f) Aspect ratio: 6, Initial imp_B, Strength decrease, .
It has been observed that in the longer plates, there is a correlation between the plate thickness and ultimate load capacity reduction that as the plate thickness gets larger, it gives rise to more load-carrying capacity reduction during the cyclic load.
However, there are cases where the reduction is more pronounced with the thinner plates. The reason for this is attributed to the pattern of the plastic formation where a partial failure mechanism may form and governs the entire plate collapse. This phenomenon has been observed with a plate thickness of 10 mm, with an aspect ratio of 3, as shown in Figure 14.
4. Conclusions
The strength of rectangular plates subjected to cyclic loads has been analysed by employing the finite element method accounting for different plate aspect ratios and thicknesses. It has been shown that as the plates are subjected to the cyclic load, the ultimate load capacity, along with their stiffness decreases. The reduction is more pronounced as the strain range is increased.
It has been observed that with the square plate, there is a correlation between the ultimate capacity reduction and the plate thickness as the plate thickness gets smaller that gives rise to the capacity reduction under the multiple cyclic loads. The capacity reduction might also be influenced by the type of plastic formation that may lead to local plastic collapse during the cyclic load exposure.
For the plates with higher aspect ratios, as the plate gets thicker, the plate load capacity reduction gets more pronounced under the cyclic load. The response is also highly influenced by the type of plastic formation.
Therefore, the ultimate capacity reduction might be more pronounced as the cyclic load exposure is increased in the case of the thinner plate because of the local plastic formations.
It has been observed that the initial imperfection has a significant influence on the ultimate load reduction during the cyclic load exposure that has been seen with the plate with higher aspect ratios.
The multi-modal initial imperfection is observed to be less stable, as opposed to the uni-modal initial imperfection. The ultimate load capacity reduction is more significant with the multi-modal initial imperfection during the cyclic load exposure because the local plastic formation is earlier and governs the plate deformations.
However, in the case of the uni-modal initial imperfection, during the cyclic load exposure, the load transition and plastic formation are smooth and more balanced, which can be observed with the equivalent plastic strain formation sequence.
Author Contributions
The concept of the problem is developed by M.T. and Y.G. The analysis is performed by M.T. and writing of the original draft manuscript is done by M.T. and Y.G. All authors have read and agreed to the published version of the manuscript.
Funding
This work was performed within the Strategic Research Plan of the Centre for Marine Technology and Ocean Engineering (CENTEC), which is financed by Portuguese Foundation for Science and Technology (Fundação para a Ciência e Tecnologia-FCT) under contract UID/Multi/00134/2013-LISBOA-01-0145-FEDER-007629.
Acknowledgments
In this section you can acknowledge any support given which is not covered by the author contribution or funding sections. This may include administrative and technical support, or donations in kind (e.g., materials used for experiments).
Conflicts of Interest
The authors declare no conflict of interest.
References
- DNV-GL. Class Guidelines, Fatigue Assessment of Ship Structures; DNV-GL: Oslo, Norway, 2015. [Google Scholar]
- Eurocode-3. Design of Steel Structures-Part 1-6, Strength and Stability of Shell Structures; European Committee for Standardization: Brussels, Belgium, 2007. [Google Scholar]
- Eurocode-8. Design of Structure for Earthquake Resistance, Part 1: General Rules Seismic Actions and Rules for Buildings; European Committee for Standardization: Brussels, Belgium, 2004. [Google Scholar]
- FEMA. Improvement of Nonlinear Static Seismic Analysis Procedure; FEMA 440; Applied Technology Council (ATC-55 Project): Washington, DC, USA, 2005. [Google Scholar]
- Ibarra, L.F.; Medina, R.A.; Krawinkler, H. Hysteretic models that incorporate strength and stiffness deterioration. Earthq. Eng. Struct. Dyn. 2005, 34, 1489–1511. [Google Scholar] [CrossRef]
- Azevedo, J.; Calado, L. Hysteretic behaviour of steel members: Analytical models and experimental tests. J. Constr. Steel Res. 1994, 29, 71–94. [Google Scholar] [CrossRef]
- Zhou, F.; Chen, Y.; Wu, Q. Dependence of the cyclic response of structural on loading history under large inelastic strains. J. Constr. Steel Res. 2015, 104, 64–73. [Google Scholar] [CrossRef]
- Shi, Y.; Wang, M.; Wang, Y. Experimental and constitutive model study of structural steel under cyclic loading. J. Constr. Steel Res. 2011, 67, 1185–1197. [Google Scholar] [CrossRef]
- Shi, G.; Wang, M.; Bai, Y.; Wang, F.; Shi, Y.; Wang, Y. Experimental and modelling study of high-strength structural steel under cyclic loading. Eng. Struct. 2012, 37, 1–13. [Google Scholar] [CrossRef]
- Krolo, P.; Grandi, D.; Smolcic, Z. Experimental and numerical study of mild steel behaviour under cyclic loading with variable strain ranges. Adv. Mater. Sci. Eng. 2016, 2016, 1–13. [Google Scholar] [CrossRef]
- Zhao, X.; Li, H.; Chen, T.; Cao, B.; Li, X. Mechanical properties of aluminium under low-cycle fatigue loading. Materials 2019, 12. [Google Scholar]
- Wang, B.; Sun, Y.; Zheng, S. Hysteretic behaviour of steel-reinforced concrete columns based on damage analysis. Appl. Sci. 2019, 9, 687. [Google Scholar] [CrossRef]
- Smith, C. Influence of local compressive failure on ultimate longitudinal strength of a ship hull. In Proceedings of the International Symposium on Practical Design in Shipbuilding (PRADS), Tokyo, Japan, 18–20 October 1977; pp. 73–79. [Google Scholar]
- Paik, J.K.; Kim, D.K.; Park, D.H.; Kim, H.B.; Mansour, A.E.; Caldwell, J.B. Modified Paik-Mansour formula for ultimate strength calculations of ship hulls. Ships Offshore Struct. 2012, 8, 245–260. [Google Scholar] [CrossRef]
- ALPS/HULL. A Computer Program for Progressive Collapse Analysis of Ship Hulls; Advanced Technology Center, DRS C3 Systems, Inc.: Parsippany, NJ, USA, 2018; Available online: www.proteusengineering.com; www.maestromarine.com; (accessed on 1 November 2019). [Google Scholar]
- CSR. Common Structural Rules for Bulk Carriers and Oil Tankers; International Association of Classification Societies, IACS: London, UK, 2017. [Google Scholar]
- Gordo, J.M.; Soares, C.G. Approximate method to evaluate the hull girder collapse strength. Mar. Struct. 1997, 9, 449–470. [Google Scholar] [CrossRef]
- Gordo, J.M.; Soares, C.G. Approximate assessment of the ultimate longitudinal strength of the hull girder. J. Ship Res. 1996, 40, 60–69. [Google Scholar]
- Paik, J.K.; Amlashi, H.; Boon, B.; Branner, K.; Caridis, P.; Das, P.; Kim, C.W.; Fujikubo, M.; Huang, C.-H.; Josefson, L.; et al. ISSC committee III.1 ultimate strength. In Proceedings of the 18th International Ship and Offshore Structures Congress, Rostock, Germany, 9–13 September 2012; Fricke, W., Bronsart, R., Eds.; Schiffbautechnische Gesellschaft: Hamburg, Germany, 2012; pp. 285–364. [Google Scholar]
- Chen, K.Y.; Kutt, L.M.; Piaszczyk, C.M.; Bieniek, M.P. Ultimate strength of ship structures. SNAME Trans. 1983, 91, 149–168. [Google Scholar]
- Paik, J.K.; Kim, B.J.; Seo, J.K. Methods for ultimate limit state assessment of ships and ship-shaped offshore structures. Ocean Eng. 2008, 35, 281–286. [Google Scholar] [CrossRef]
- Xu, M.; Garbatov, Y.; Soares, C.G. Ultimate strength assessment of a tanker hull based on experimentally developed master curves. J. Mar. Sci. Appl. 2013, 12, 127–139. [Google Scholar] [CrossRef]
- Tekgoz, M.; Garbatov, Y.; Soares, C.G. Strength assessment of an intact and damaged container ship subjected to asymmetrical bending loadings. Mar. Struct. 2018, 58, 172–198. [Google Scholar] [CrossRef]
- Yao, T.; Nikolov, P.I. Buckling/Plastic collapse of plates under cyclic loading. Soc. Nav. Archit. Jpn 1990, 168, 449–462. [Google Scholar] [CrossRef]
- Goto, Y.; Toba, Y.; Matsuoka, H. Localization of plastic buckling patterns under cyclic loading. J. Eng. Mech. 1995, 121, 493–501. [Google Scholar] [CrossRef]
- Komoriyama, Y.; Tanaka, Y.; Ando, T.; Hashizume, Y.; Tatsumi, A.; Fujikubo, M. Effects of cumulative buckling deformation formed by cyclic loading on ultimate strength of stiffened panel. In Proceedings of the International Conference on Ocean, Offshore and Arctic Engineering, Madrid, Spain, 17–22 June 2018. [Google Scholar]
- Yao, T.; Fujikubo, M.; Nie, C. Development of a Simple Dynamical Model to Simulate Collapse Behaviour of Plates with Residual Welding Stresses under in-Plane Load; The Japan Society of Naval Architects and Ocean Engineers: Hiroshima, Japan, 1997; pp. 171–182. [Google Scholar]
- Cui, H.W.; Yang, P. Ultimate strength assessment of hull girder under cyclic bending based on Smith´s method. J. Ship Res. 2018, 62, 77–88. [Google Scholar] [CrossRef]
- Li, S.; Hu, Z.; Benson, S. An analytical method to predict the buckling and collapse behaviour of plates and stiffened panels under cyclic loading. Eng. Struct. 2019, 199, 109627. [Google Scholar] [CrossRef]
- Chaboche, J.L. Constitutive equations for cyclic plasticity and cyclic viscoplasticity. Int. J. Plast. 1989, 5, 247–302. [Google Scholar] [CrossRef]
- ANSYS. Advanced Analysis Techniques Guide, Southpointe, 2600 ANSYS Drive; Ansys, Inc.: Canonsburg, PA, USA, 2019. [Google Scholar]
- Ueda, Y.; Yao, T. The influence of complex initial deflection modes on the behaviour and ultimate strength of rectangular plates in compression. J. Constr. Steel Res. 1985, 5, 265–302. [Google Scholar] [CrossRef]
- Smith, C.S.; Davidson, P.C.; Chapman, J.C. Strength and stiffness of ship´s plating under in-plane compression and tension. R. Inst. Nav. Arch. Trans. 1988, 130. [Google Scholar]


© 2020 by the authors. Licensee MDPI, Basel, Switzerland. This article is an open access article distributed under the terms and conditions of the Creative Commons Attribution (CC BY) license (http://creativecommons.org/licenses/by/4.0/).