Article

Tensile Bending Stresses in Mortar-Grouted Riprap Revetments Due to Wave Loading

by
Moritz Kreyenschulte
* and
Holger Schüttrumpf
Institute of Hydraulic Engineering and Water Resources Management, RWTH Aachen University, Mies-van-der-Rohe-Str. 17, 52056 Aachen, Germany
*
Author to whom correspondence should be addressed.
J. Mar. Sci. Eng. 2020, 8(11), 913; https://doi.org/10.3390/jmse8110913
Submission received: 7 October 2020 / Revised: 9 November 2020 / Accepted: 10 November 2020 / Published: 12 November 2020
(This article belongs to the Special Issue Modelling of Harbour and Coastal Structures)

Abstract

:
One of the most common revetment types in Germany is the mortar-grouted riprap revetment (MGRR), which is constructed by placing riprap on a filter or separation layer and subsequent grouting with mortar. Existing technical standards and guidelines for MGRRs do not consider the interaction between dynamic wave loading and structural response. To date, scientifically sound design approaches verified by model tests are missing. Therefore, the aim of this work is to establish a process-based model for the calculation of the acting bending tensile stresses during wave attack for MGRRs to asses crack formation. To this end, MGRRs were modelled as plates on an elastic foundation (PEF). Hydraulic boundary conditions were determined with full-scale hydraulic model tests. Model parameters of the PEF model were established by investigations into the mechanical parameters of the constituents of MGRRs. The results show that tensile bending stresses are particularly dependent on the pressure difference between the top and bottom edge of the top layer, which varies significantly for MGRRs as their porosity and permeability varies significantly depending on the amount of mortar used for grouting. Enveloping functions for maximum relative tensile bending stress σx,max/(ρwgHm0) are given for four configurations of MGRRs that are of great practical relevance.

1. Introduction

1.1. Motivation

In high energy coastal environments dikes can be protected by revetments against damage caused by wave loading [1,2]. One of the most common revetment types in Germany is the mortar-grouted riprap revetment (MGRR). To construct a MGRR, riprap is placed on a filter or separation layer that is in most cases a geotextile, subsequently the riprap is grouted with mortar. MGRRs in coastal environments have a thickness of at least 0.40 m and are made of riprap of class CP90/250 (coarse particles of diameter 90–250 mm according to standard DIN EN 13383-1 [3]), LMB5/40 or LMB10/60 (light mass with stone mass of 5–40 kg and 10–60 kg according to DIN EN 13383-1, respectively). They can be constructed either by filling the entire pore volume of the riprap with mortar (fully grouted) or by partially filling the pore volume of the riprap with mortar while at the same time ensuring a mortar bond between the individual stones in the uppermost stone layer (partially grouted). Hence a fully grouted MGRR has an impermeable top layer with a rough surface, whereas a partially grouted MGRR has a rough, porous and permeable top layer. Figure 1 depicts the cross-sections of MGRRs and gives an impression of a partially and a fully grouted top layer.
MGRRs form a coherent structure that is able to withstand shear forces and momentums, thus leading to a planar load distribution. Compared to non-grouted riprap revetments it is possible to use smaller and lighter stones and construct thinner armor layers under the same loading conditions with MGRRs. Although MGRRs have been built for decades, the design of their top layer is yet mainly based on empirical knowledge. On this basis, guidelines on construction of mortar-grouted riprap revetments [5,6] have been established. In combination with general design guidelines for revetment design [2,4,7], these guidelines define the composition of MGRRs and give a framework for the planning of the construction works, the tendering process and the construction itself. Furthermore, quality standards for the grout, the application of the grout to the stones and the grout distribution in the top layer are defined by the code of practice “Use of Cementitious and Bituminous Materials for Grouting Armourstone on Waterways” [5]. The thickness of the top layer and the amount of grouting mortar (in L/m2) can be chosen using these technical standards and guidelines.
However, the existing technical standards and guidelines for MGRRs do not consider the interaction between dynamic wave loading and structural response. To date, scientifically sound design approaches verified by model tests are missing. This may potentially lead to an uneconomic design of MGRRs exceeding the load and safety criterion for a particular site. It is also possible that the current design practice may lead to a weaker revetment than is required for the load and safety criterion for a particular site.
Existing design approaches for other types of revetments are not applicable or have to be modified for the design of MGRRs, due to the structural behavior of MGRRs under wave attack and due to the fact that MGRRs substantially differ with regard to possible wave loading conditions when compared to other revetments. With regard to the structural behavior when subject to wave attack, three different types of revetments can be differentiated according to their flexibility:
  • Flexible revetments: Limited interaction between individual elements of the revetment results in the individual elements resisting wave loading mainly by their weight while the whole revetment can deform by redistribution of the single elements and thereby easily adapt to subsoil settlement. Non-grouted (loose) riprap forms a flexible revetment, see for example [8].
  • Revetments with some flexibility: Revetments made of individual elements with high interaction or monolithic revetments that due to their creep behavior can adapt to subsoil settlement to a certain degree while remaining coherent. This type of revetment can resist higher wave loads than fully flexible revetments given the same size of the individual elements or the same revetment thickness, but especially asphalt is subject to fatigue and abrasion [9]. Asphalt revetments or riprap grouted with asphalt are examples of revetments with some flexibility.
  • Revetments with no flexibility: These monolithic revetments or revetments made of individual elements with high interaction are too stiff to follow subsoil settlement. It is therefore possible that cavities beneath the revetment are present, resulting in a non-continuous bedding of the revetment. This type of revetment can also resist higher wave loads than fully flexible revetments given the same size of the individual elements or the same revetment thickness, but it is subject to breaking and crack formation. Mortar-grouted riprap revetments are revetments with no flexibility [10].
The pressures on and beneath the revetment top layer represent the external load acting on the top layer of a cohesive revetment. The pressure beneath the top layer as a function of the pressure on the top layer is significantly influenced by the permeability of the top layer [11,12,13]. With regard to possible wave loading conditions, Schiereck [14] therefore distinguishes three different types of revetments:
  • For very permeable revetments such as loose riprap the pressure beneath the revetment almost instantaneously adapts to the pressure on the revetment. In case of small amounts of grouting mortar, MGRRs also represent this type of revetment.
  • With decreasing permeability of the top layer the load on the top layer is increasingly dominated by the pressure difference on and beneath the top layer. For pattern placed revetments the leakage length, which takes into account the permeability and thickness of both the filter layer and top layer of the revetment, is a measure for the loading of the top layer [15]. In case of high amounts of grouting mortar, MGRRs can qualitatively represent this type of revetment. However, the concept of the leakage length assumes flow in the filter layer parallel to the embankment and can therefore not be applied for MGRRs that are in most cases placed on a geotextile filter layer, because the thickness of a geotextile filter is in the order of a few centimeters and does not allow any significant flow in its plane.
  • In the case of a non-permeable top layer, the pressure beneath the revetment adapts to the pressure on the revetment only for time periods of several hours or longer (tides, storms), but not for the time periods of individual waves [9]. This is the case for fully grouted MGRRs and for example for asphalt revetments.
While most revetments can be assigned to one category of loading and structural behavior, MGRRs are revetments with no flexibility that can be subject to loading conditions of each of the revetment loading types mentioned above.

1.2. Modelling Tensile Stresses for Crack Formation Assessment

Crack formation in the top layer of MGRRs represents a deterioration of the revetment. Furthermore, cracks are the prerequisite for all other possible damage or failure mechanisms with regard to the structural integrity of MGRRs. Due to their missing flexibility, MGRRs are prone to crack formation as a consequence of uneven settlement of the subsoil and cavities beneath the top layer, especially in combination with wave loading. Further possible causes for crack formation are temperature differences or shrinkage of the fresh mortar. Crack formation can be facilitated by aging or fatigue of the mortar. Already existing cracks can be widened by ice pressure due to freeze-thaw cycles.
Cracks reduce the existing contact surface between mortar and riprap or the existing cross-section of mortar that withstands the bending stresses in the revetment cross-section, which in turn increases the stress in the remaining cross-section for the same load. This can result in further deterioration of the revetment, which can ultimately lead to damage and failure of the revetment. The risk of cracks with regard to the durability, serviceability or load-bearing capacity of MGRRs under wave loading is as yet unclear and can only be assessed with process-based models of the relevant damage mechanisms. Furthermore, since crack widths and lengths in MGRRs are not recorded during dike inspections, it is difficult to properly asses their development and thus their causes.
Monolithic or coherent revetments are often modelled as a plate on an elastic foundation (PEF) for the top layer design. With this model, bending stresses due to wave attack can be calculated and in a limit state equation be compared to permissible stresses, whereby crack formation can be predicted. Among these revetments are asphalt revetments [16], polyurethane bonded revetments [17] and riprap fully grouted with asphalt [18]. For all these revetments the wave impact load is defined as critical load condition for the formation of cracks. In the design process, the wave impact load is simplified as a static load and an analytical solution for infinite beam length is deployed to calculate the bending stresses. The wave impact load is spatially idealized and simplified as a triangular load on the revetment surface. This load is defined in space by its wave impact magnitude pmax and width B (see Figure 2), which are found in hydraulic experiments, see for example Oumeraci et al. [19]. The wave impact magnitude is determined with the following equation [16]:
p m a x = k p × ρ w × g × H s
where kp is a dimensionless wave impact coefficient, ρw the density of water, g the acceleration due to gravity and Hs the significant wave height. Major influences on the wave impact coefficient kp are structural parameters of the revetment, namely roughness and porosity, as well as the revetment slope angle α [20]. Table 1 gives an overview of the different parameters used for each type of revetment.
For asphalt revetments Rijkswaterstraat [18] describes calculating the bending stress under buoyancy loads during wave run down with a PEF model. However, the actual pressure distribution under the cover layer during wave run down must be determined by the designer of the revetment [18]. Consequently, an evaluation of the model is not given in [18].
As a result of friction and interlocking pattern placed revetments also act as a coherent structure and can therefore be modelled as a PEF. Peters [15] calculates stresses and deflections of pattern placed revetments during wave impact using a static solution and additionally, as pattern placed revetments are more flexible than the other types of revetments listed in Table 1, by using a dynamic solution for the equation for a PEF. Peters [15] recommends carrying out a dynamic calculation or a static calculation with amplification factors for pattern placed revetments.

1.3. Objective and Outline

The hydraulic boundary conditions, especially the pressures on and beneath the revetment, the relevant structural properties and the stresses within the revetment resulting from the combination of these properties and the wave loading are not yet known for MGRRs. Furthermore, MGRRs have a wide range of possible permeabilities and porosities due to different amounts of mortar used for grouting. These parameters are of paramount importance for the wave-structure interaction [11,12,13,22]. Therefore, it is not possible to determine beforehand which external loading is decisive for the formation of cracks in MGRRs.
The aim of the present work is to establish a process-based model to calculate the bending stresses for MGRRs. To this end, MGRRs are numerically modelled as a PEF using the finite differences method. This allows a large number of load situations to be calculated quickly. These load situations are represented by time series of pressure transducers (PT), which were recorded in full-scale hydraulic model tests. Therefore, no decisive load situations have to be defined beforehand and the respective loads do not have to be parameterized, but the actual loads are used in the form of the pressure distribution along the top layer. The bending stresses can be used as acting stresses in a limit state equation and thereby be compared to permissible tolerable stresses.
Firstly, the PEF model and the full-scale hydraulic model tests are presented, then the boundary conditions and model parameters of the PEF model as well as their variations are described. The results of the model are presented as relative tensile bending stresses.

2. Materials and Methods

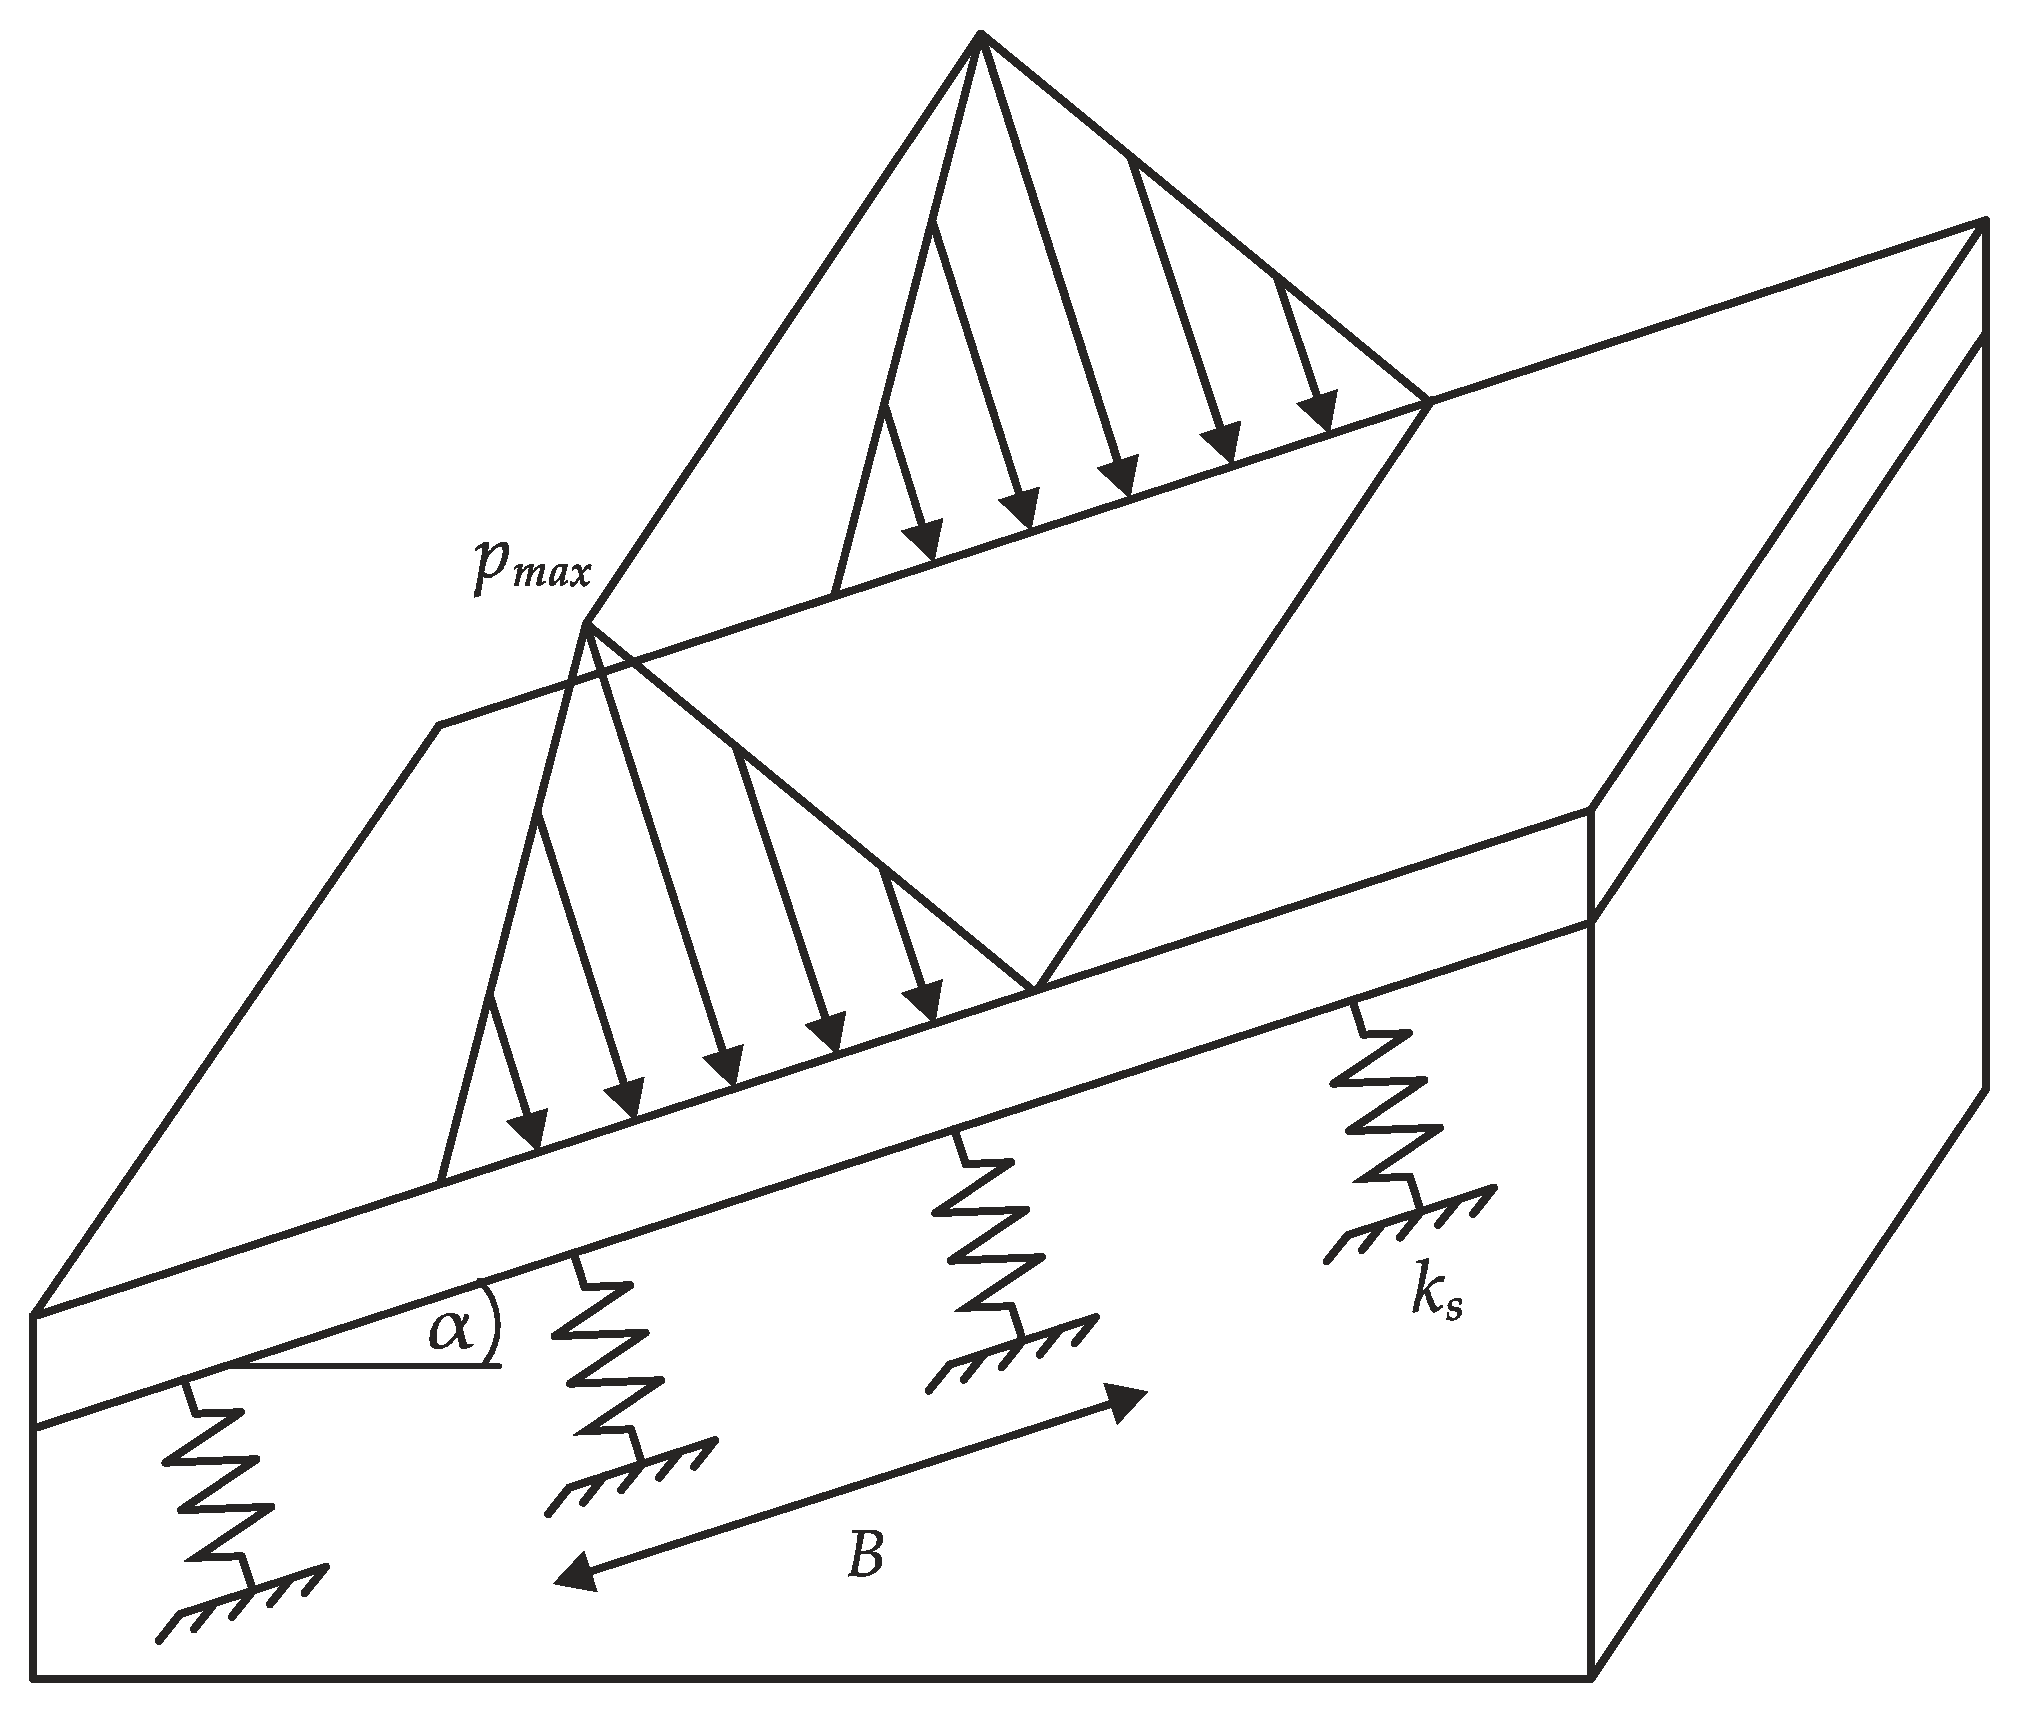
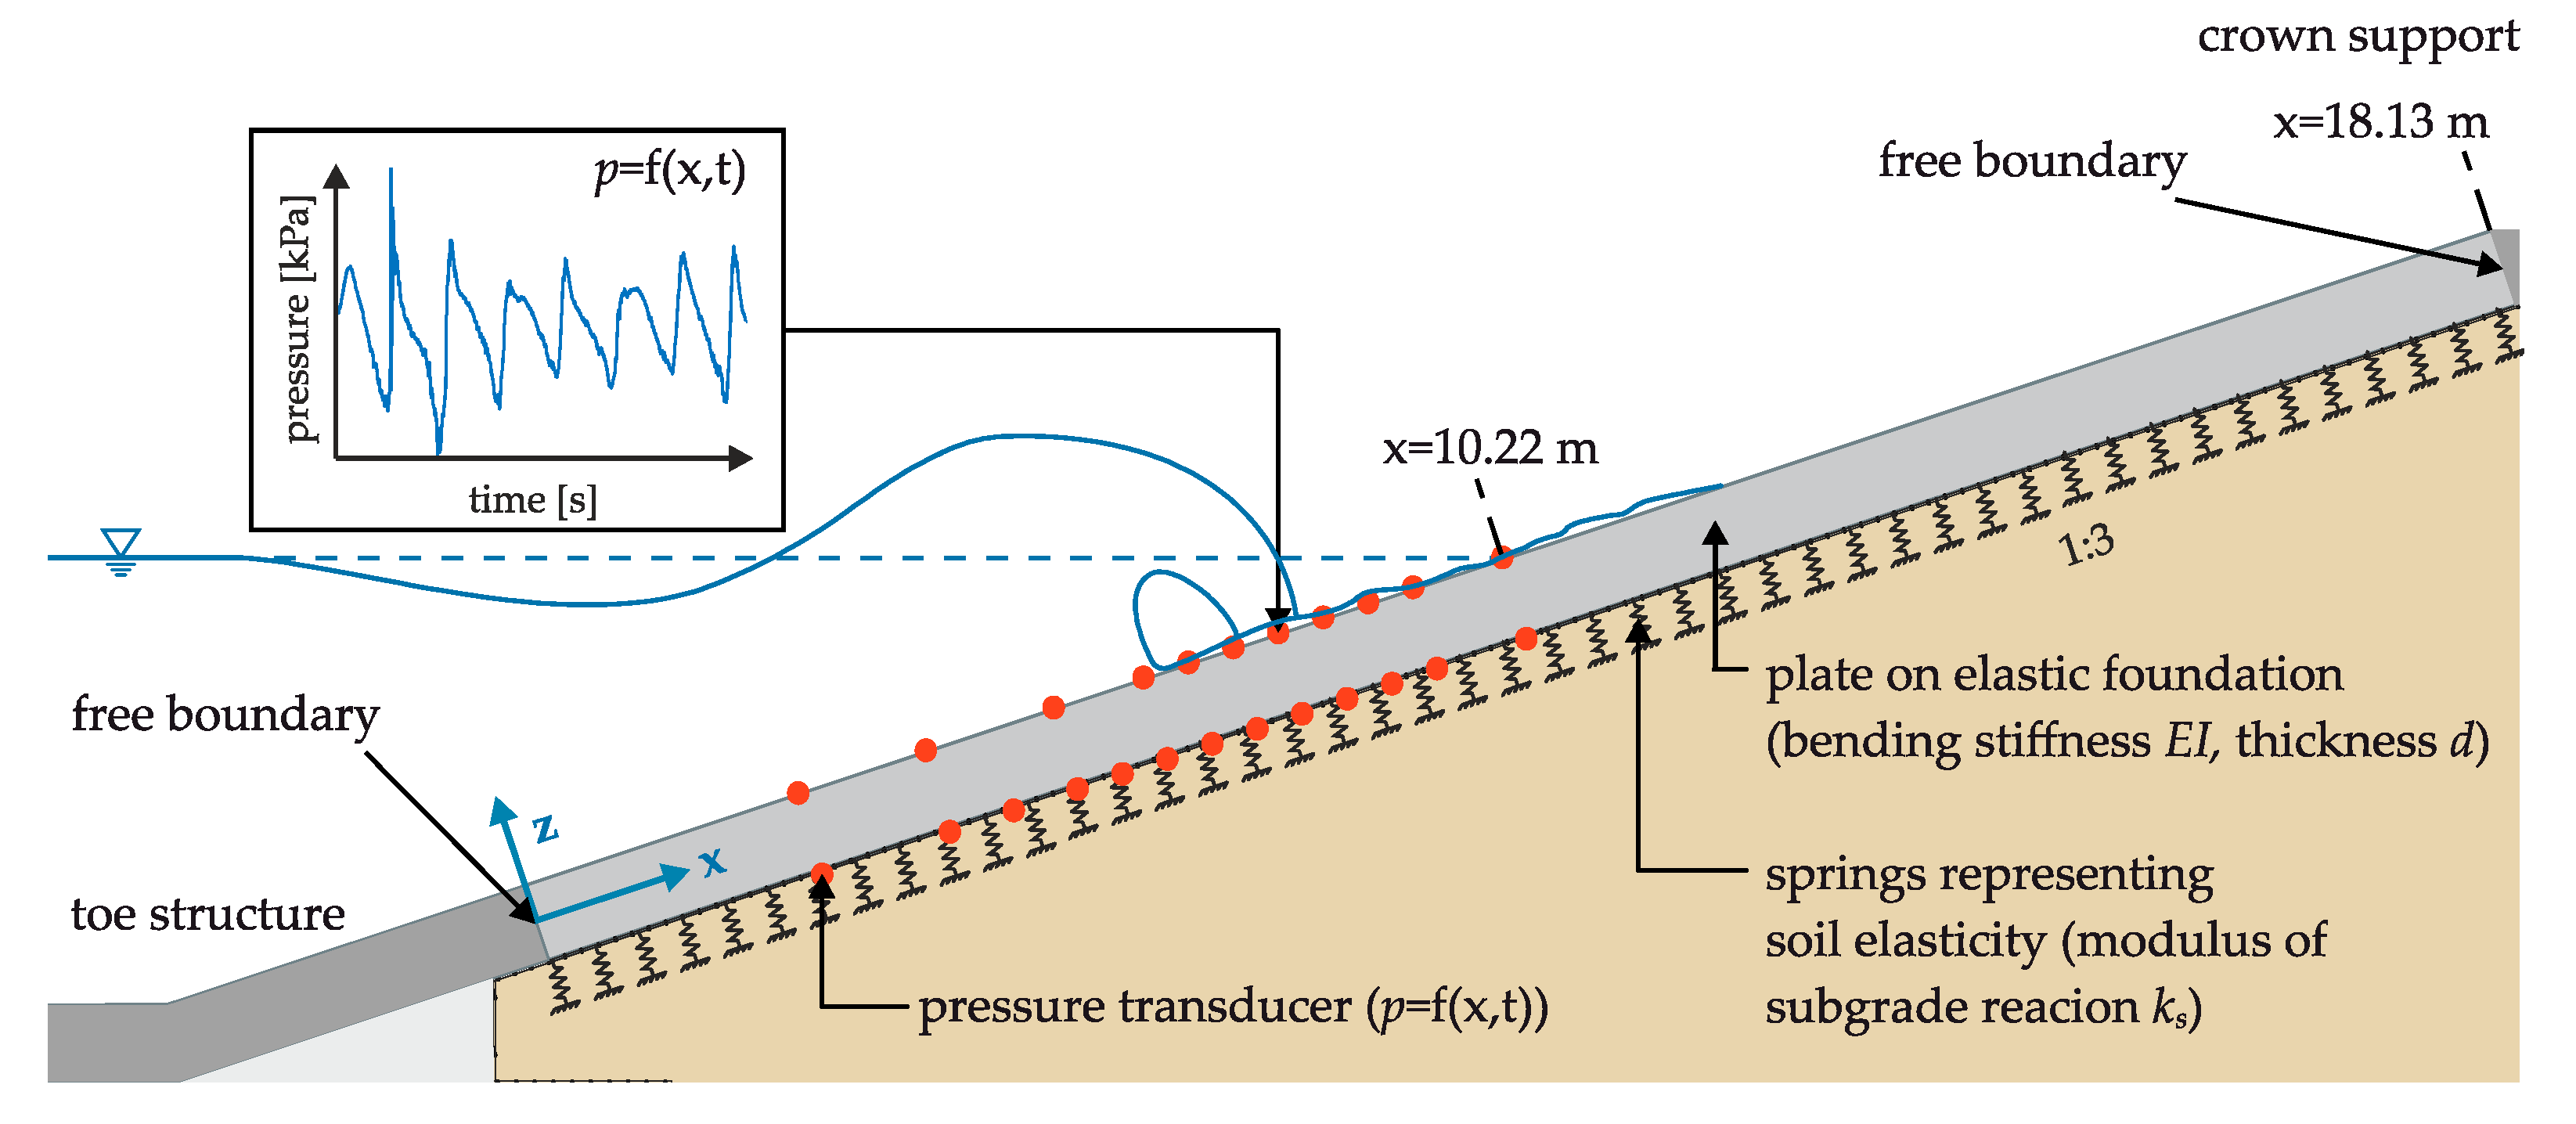
2.1. Plate on an Elastic Foundation Model

A coherent revetment on a compressible embankment, e.g., made of sand or clay, can be modelled as a plate on an elastic foundation, see for example [15] or [16]. The basis for the theory of the PEF is the hypothesis of Winkler/Zimmermann [23] that states that the elastic support beneath the plate reacts to the deformation of the plate with a counterpressure that is proportional to the deflection w of the plate. The elastic support of the plate is represented by springs unaffected by each other and a linear-elastic deformation behavior of the springs is assumed. The differential equation of the deflection of the PEF for static loads is [23]:
d 2 d x 2 [ E I y y ( x ) d 2 w ( x ) d x 2 ] + k s ( x ) w ( x ) = q ( x )
where EIyy is the bending stiffness of the plate, w its deflection, ks the modulus of subgrade reaction and q the external load. The x-axis is defined in the longitudinal direction of the plate.
However, the soil beneath the plate cannot transfer tensile forces. Therefore, if the external force acts against gravity and leads to an upward deflection of the plate, the spring force at this point becomes zero. The external force is then distributed to other areas of the plate by transverse forces and bending moments. The bending moment My is calculated from the deflection as follows:
M y ( x ) = E I y y d 2 w ( x ) d x 2
Analytical solutions of Equation (3) for infinitely long plates and special loads such as point loads are given, for example, by Dankert and Dankert [23]. In order to be able to calculate as many different load situations as possible with a finite length of the plate and loads that vary greatly along the plate in the shortest possible computing time, the differential equation was converted into a finite difference equation in this work. The model was then implemented in MATLAB (MATLAB R2018b MathWorks®, Natick, Massachusetts, United States). The algorithm gabamp.m (Gauss algorithm with column pivoting for asymmetric band matrices) of Dankert and Dankert [23] was used to solve the resulting system of equations.

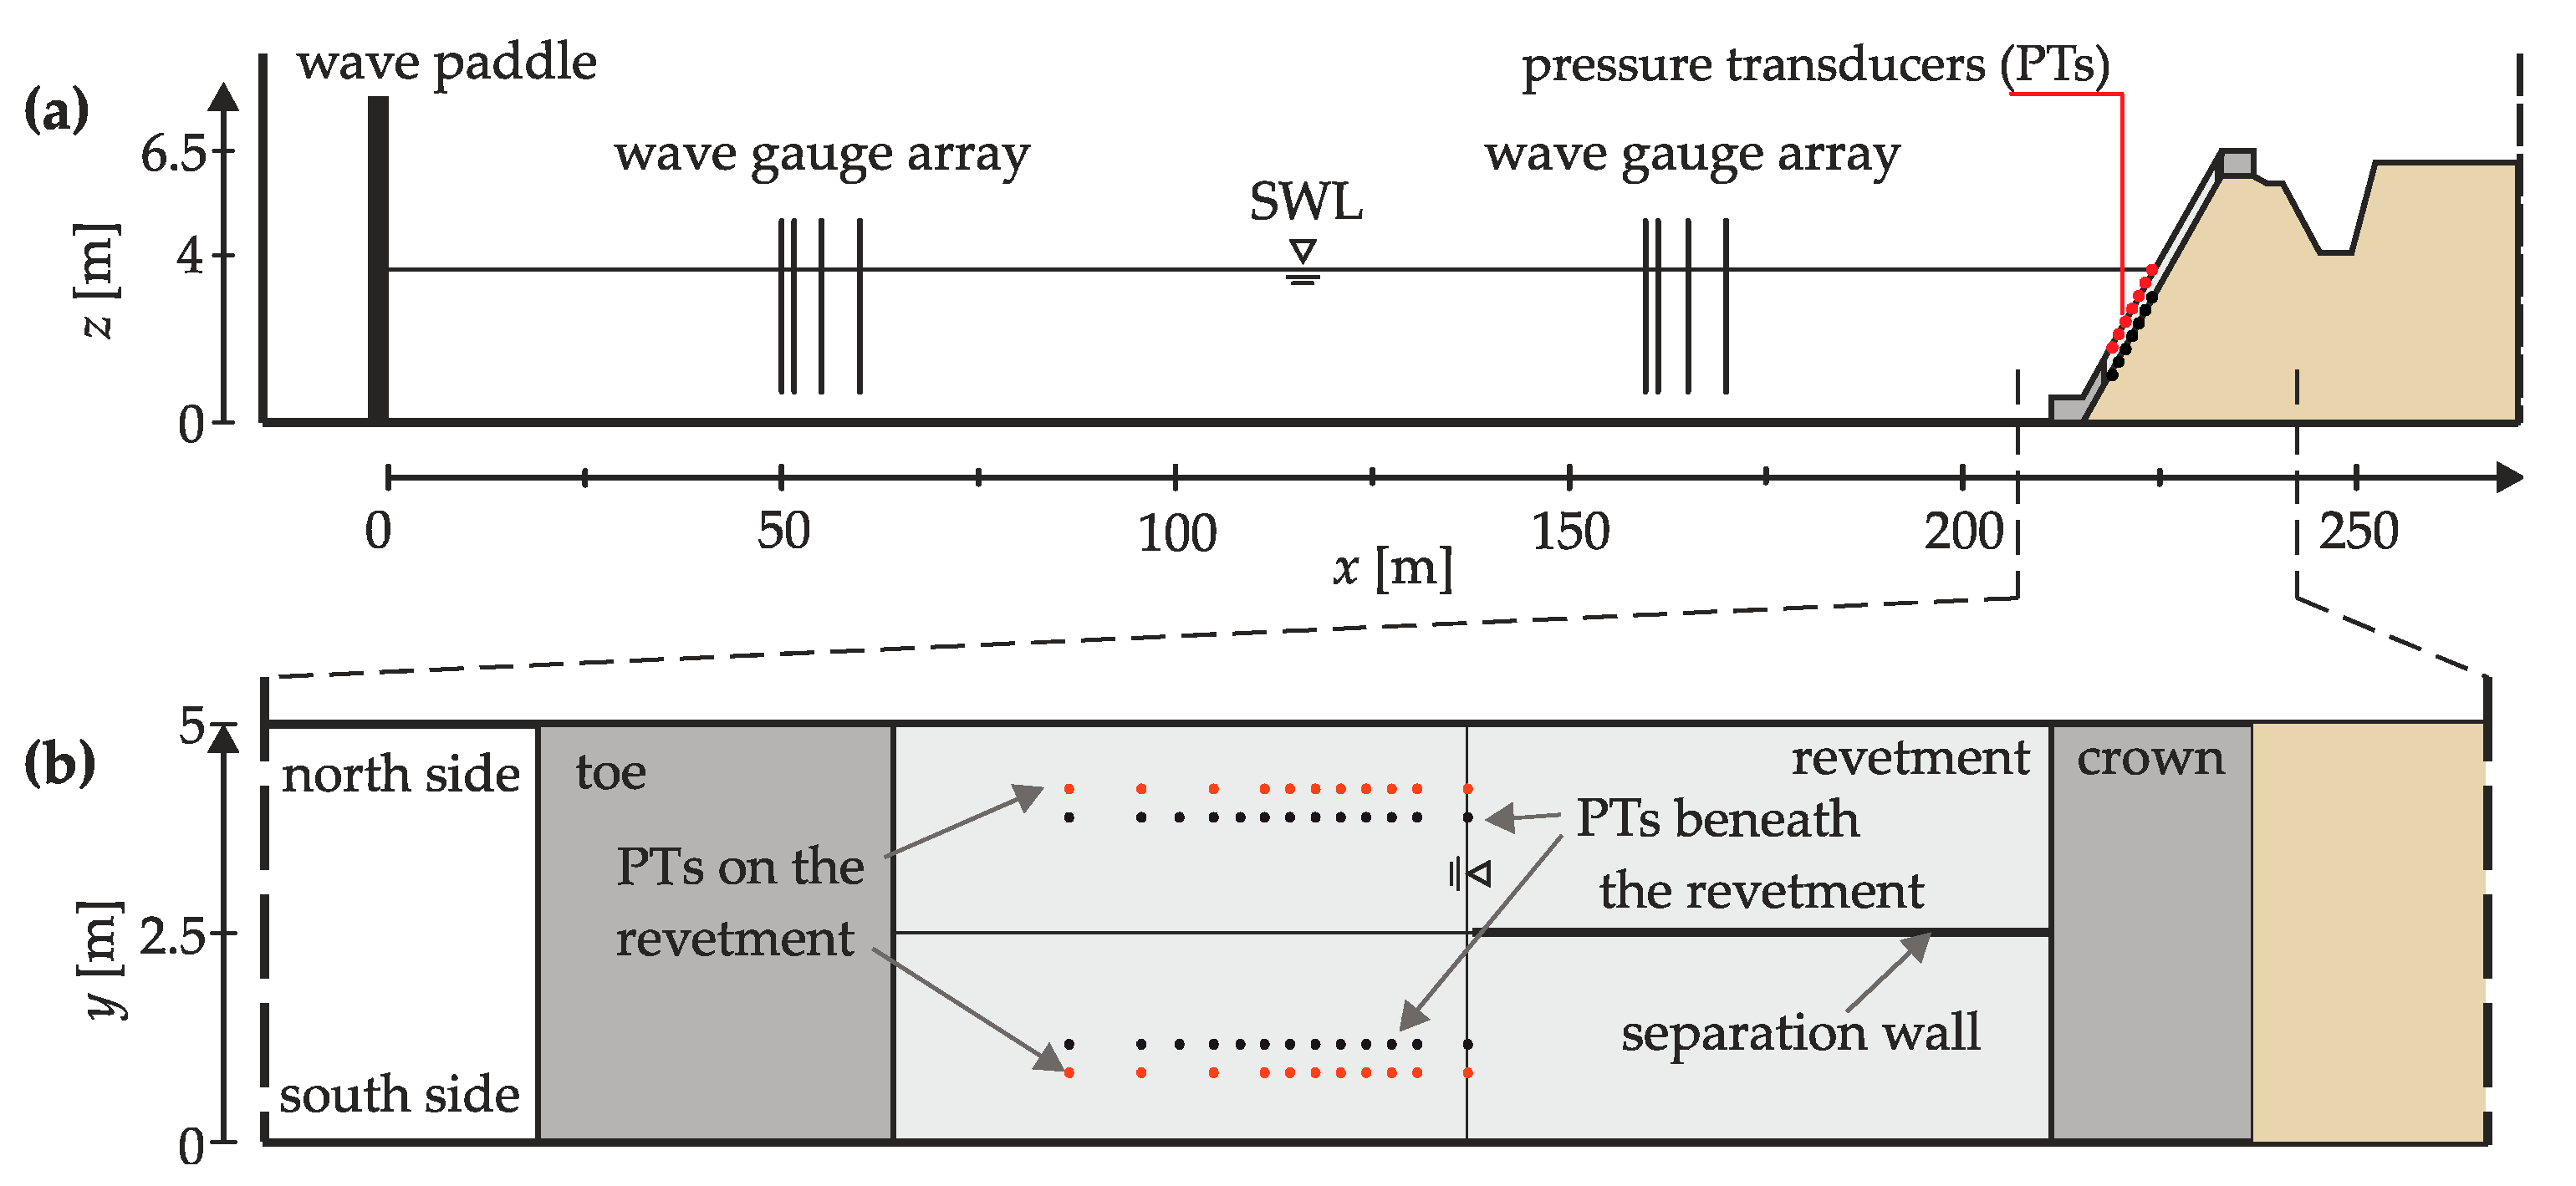
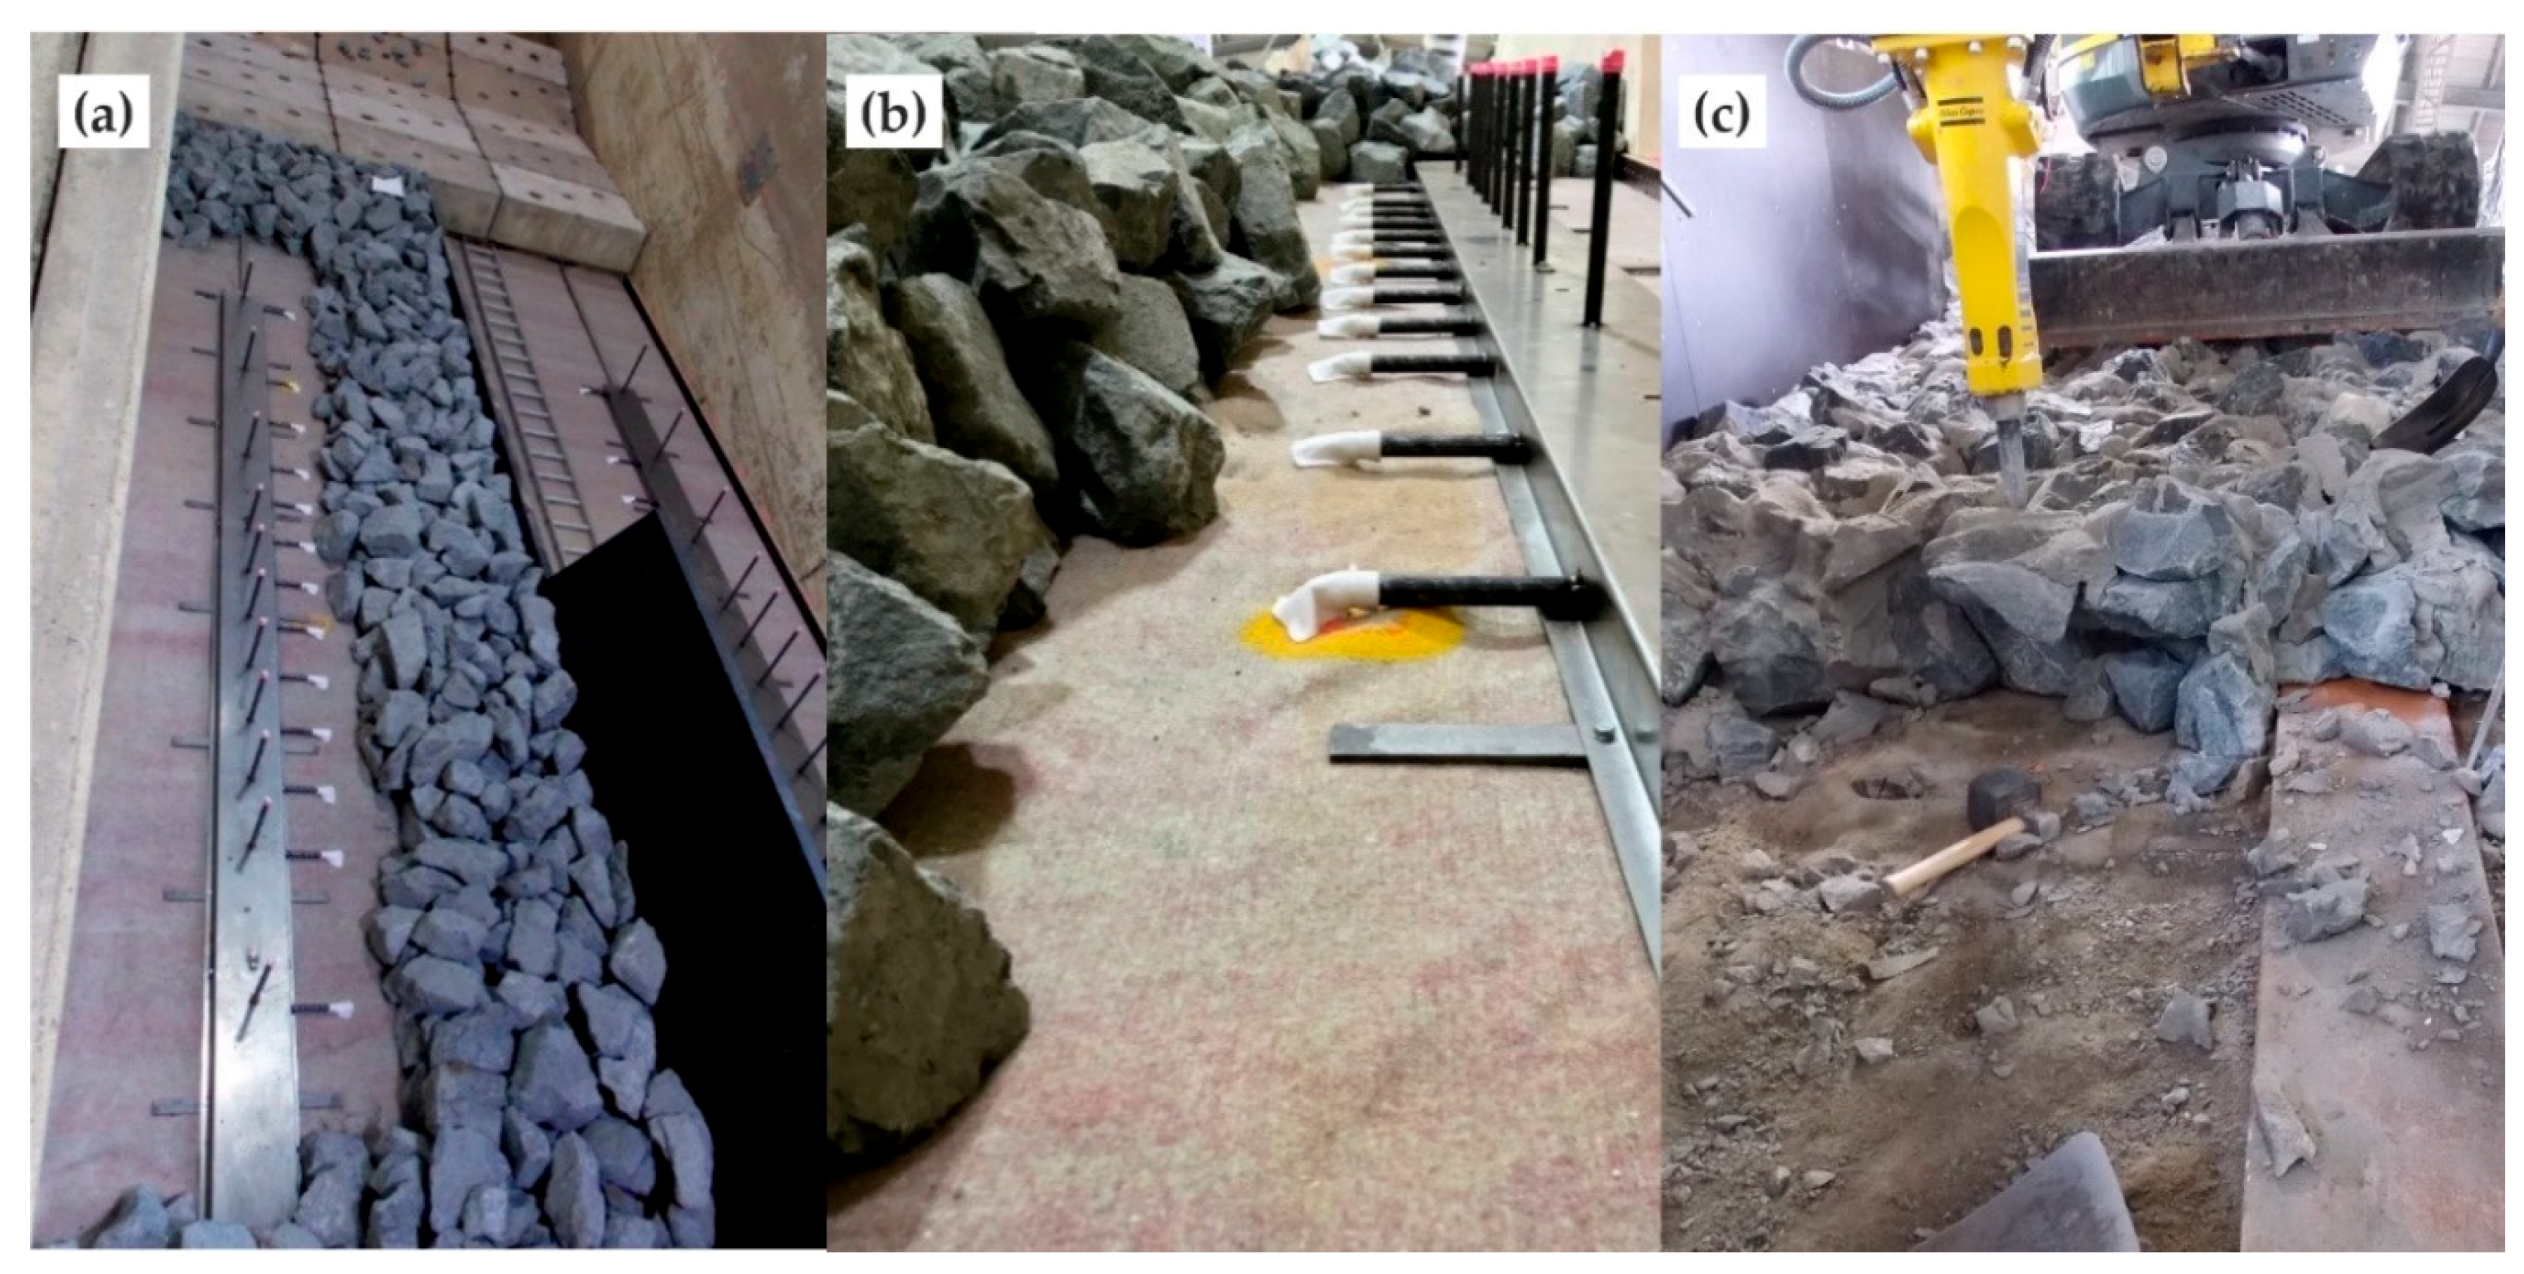
2.2. Full Scale Hydraulic Model Tests

Four different configurations of MGRRS were tested in full scale hydraulic model tests in the Large Wave Flume (in German “Großer Wellenkanal”, abbreviation: GWK) of the Coastal Research Centre, which is a joint research facility of Technische Universität Braunschweig and Leibniz Universität Hannover. The width of the embankment section was split in half by a thin wooden wall, see Figure 3. In this manner, two revetment configurations could be tested at the same time and a maximum of different revetment configurations and wave parameters could be tested whilst minimizing testing time.
The slope angle of all revetment configurations was cot(α) = 3. On the north side of the separation wall (see Figure 3), a 0.60 m thick riprap revetment was built while on the south side the thickness of the revetment was dt = 0.40 m. Before the first test phase, both revetments were grouted with 80 L/m2 mortar. The revetments were grouted by hand by experienced contractors that have been grouting MGRRs for decades. Assuming a porosity of 0.45 before grouting (riprap dumped in dry conditions, medium density according to [5]) this resulted in permeable revetments after grouting with a porosity of n = 0.25 (dt = 0.40 m) and n = 0.32 (dt = 0.60 m), respectively.
Before test phase two, the revetment on the south side of the separation wall was removed completely and replaced by a riprap revetment which again had a layer thickness of 0.40 m. This revetment was then fully grouted so that the whole pore volume of the stone layer was filled with mortar. This constitutes the standard process of constructing an impermeable, fully-grouted revetment [5]. The amount of mortar needed to fill up the entire pore volume was 180 L/m2, confirming the assumption of a porosity of 0.45 before grouting, which results in an available pore volume of Vp = 180 L/m2 (Vp = n × dt × 1000 L/m3 = 0.45 × 0.40 m × 1000 L/m3) before grouting.
The revetment on the north side of the separation wall was not removed but instead grouted until the top layer was apparently impermeable. The amount of mortar needed for this was 100 L/m2, confirming that the lower part of the cross-section of the top layer still exhibited a free pore volume and was only partially grouted. The potential free pore volume before any grouting of the top layer took place (before test phase one) was 270 L/m2 (0.45 × 0.60 m × 1000 L/m3), thus a pore volume of 90 L/m2 was still available in the lower part of the top layer in test phase two. The overall volumetric porosity of the revetment equaled 0.16, while it was at the same time impermeable for any flow perpendicular to the embankment.
The revetment on the north side is of practical relevance as it represents a revetment that was constructed as a permeable revetment but due to repair works, during which the damaged parts of the revetment were re-grouted with mortar, became more and more impermeable over the years. It also represents a revetment which was designed as a fully grouted revetment but was grouted with mortar that was not sufficiently flowable and poorly adjusted to fill the free pore volume of the riprap. All revetment configurations tested and their characteristics are listed in Table 2.
All top layers were placed on a geotextile (permeability k10,H50mm = 2.86 × 10⁻³ m/s, thickness 8 mm, characteristic opening size 0.1 mm), which was directly placed on the sand embankment. The toe structure of the revetment below the lowest wave run-down was made of concrete blocks in order to support the revetment. By this means, an efficient construction of the revetment was ensured, covering only the relevant section of the slope with grouted riprap material. The crest of the embankment was constructed of concrete blocks behind which any overtopping water was collected in a basin and discharged back into the flume during the tests.
The riprap used for the top layer was stone weight class LMB5/40 with a median weight of G50 = 23.5 kg and a narrow grading with d85/d15 = 1.5. The grouting mortar can either be produced by adding additives to the mortar or by mixing it in a colloidal mixer with high velocity shear action [24] to ensure an appropriate consistency of the fresh grout for a distribution of mortar inside the pore space of the riprap that results in a “sufficient” permeability and bonding of the individual stones. The latter method was chosen for grouting the riprap for the experiments in the GWK. The mortar was tested and fulfilled all requirements stated by the code of practice “Use of Cementitious and Bituminous Materials for Grouting Armourstone on Waterways” [5].
In order to gain results of practical relevance, the revetments were exposed to JONSWAP-spectra with a minimum of 1000 waves per test. Wave heights from Hm0 = 0.38–0.94 m and wave periods from Tm−1,0 = 2.7–9.0 s were generated which resulted in surf similarity parameters ξm−1,0 = 1.55–4.64. In this way a wide range of wave loading conditions and breaker types were covered. The still water level in all experiments was set to 4 m.
Incident wave parameters, wave run-up as well as wave induced pressures on and beneath the revetment were measured. For the results presented in this work only wave induced pressures are of interest. Figure 4 shows a longitudinal section of the GWK and the instrumentation relevant for the results presented herein.
In order to measure the wave parameters, two wave gauge arrays were set up in the GWK, each consisting of four resistance type wave gauges with a measuring frequency of 100 Hz. The wave gauge array next to the revetment was used to calculate the wave parameters at the toe of the structure. Analyzing the signal of the four wave gauges with the computer program L~davis [25], which makes use of the method of Mansard and Funke [26], gave the incident and reflected wave parameters. Using the incident wave period Tm−1,0, the fictitious wave length in deep water according to EurOtop [27] was calculated:
L m 1 , 0 = g T m 1 , 0 2 2 π
The fictitious surf similarity parameter in deep water is calculated with Equation (5) [27]:
ξ m 1 , 0 = tan α / H m 0 L m 1 , 0
For every revetment configuration 11 pressure transducers (PTs) were installed at the top edge and 13 PTs were installed at the bottom edge of the top layer. The bottom PTs were arranged in pairs perpendicular to the PTs at the top edge of the revetment. The time series of the PTs can thus be used directly to calculate the pressure difference between the upper and lower edge of the top layer, which represents the resulting load on the revetment. The PTs at the top edge of the top layer were of type PDCR 830 (0.1% accuracy with a measuring range of 5 bar in the upper part of the top layer and 1 bar for the two PTs furthest seaward) manufactured by Druck Ltd. (Leicester, UK) and recorded the pressure with a measuring frequency of 1000 Hz. The PTs at the bottom edge of the top layer were of type PDCR 1830 (0.1% accuracy at a measuring range of 1 bar) manufactured by GE Sensing (Boston, Massachusetts, USA) and recorded the pressure with a measuring frequency of 200 Hz. Figure 5 shows the position of the PTs in detail.
To avoid damage of the PTs during construction of the revetment and to assure their defined position, the PTs were installed in steel pipes attached to a steel channel, see Figure 6a,b. In this way, also the reconstruction of the revetment on the south side of the GWK before test phase two was made possible, see Figure 6c. This is the reason why the PTs on the top edge of the top layer have not been installed in the middle of the north or south section but were instead shifted 0.45 m to the outer walls of the GWK, from which the PTs are 0.80 m away. The PTs at the bottom edge of the top layer are shifted 0.34 m to the inner wooden separation wall between the revetments in order to avoid any influence on the recorded pressure due to the steel channel.

2.3. Boundary Conditions PEF

The geometry of the top layers in the GWK is represented in the PEF model. As both the toe structure and the crown support are placed in front of the top layer and neither transverse forces nor moments can be transferred there, the model edges are defined as free at x = 0 m and x = 18.13 m, see Figure 7. The spatial resolution of the top layer for the calculations is defined as Δx = 0.18 m, thus ensuring a reasonable calculation time while maintaining accuracy of the results.
An event, i.e., an incoming wave, was defined using the zero downcrossing method for the time series of the pressure transducer located furthest seaward. This definition of an event was also used by Klein Breteler et al. [29] when investigating pattern placed revetments.
In order to calculate the pressure difference along the x-axis from the time series of the pressures on the upper and bottom edge of the top layer, a moving average was used to average the measurements on the upper edge of the top layer to a frequency of 200 Hz. For this purpose, the method described by [29] was used.

2.4. Plate on an Elastic Foundation Model

2.4.1. Bending Stiffness

No large-scale mechanical tests are available to determine the bending stiffness of MGRRs. Therefore, the bending stiffness of the top layer is calculated by considering the cross-section of a MGRR as a composite cross-section. Thus, the mechanical properties of the MGRR can be calculated from the mechanical properties of its constituents, namely mortar and riprap. The procedure described below was also used by Rijkswaterstraat [18] for calculating the bending stiffness of riprap fully grouted with asphalt.
It is assumed that the top layer is exposed to pure bending load. This assumption is on the safe side with regard to the maximum bending tensile stress, as the normal force in the top layer due to its own weight would act as a compressive force. It is assumed that cracks will occur in the mortar or the bonding surface between mortar and riprap as a result of tensile forces. For pure bending, the bending stiffness of the top layer can be determined in the same way as for composite cross-sections of materials with different moduli of elasticity. The following assumptions are necessary [30]:
  • The materials cannot shift against each other at their interfaces (no slippage).
  • Since the behavior of a mortar-grouted riprap is to be described up to the first crack formation, a linear relationship between stress and strain is assumed in the uncracked state according to Hooke’s law.
For simplicity, it is further assumed that the area filled with grout and the area of the riprap are evenly distributed in the entire cross-section. It is also assumed that the moduli of elasticity of the components under compression and tension are the same, as the resulting deviation of the calculated bending stiffness is small. The bending stiffness E I ¯ is then calculated as follows [30]:
E I ¯ = i E i I i = E R R A z ¯ R R 2 × d A + E M A z ¯ M 2 × d A
where ERR and EM are the moduli of elasticity of riprap (index RR) and mortar (index M), respectively, A is the area of each component in the cross-section and z ¯ is the distance of the center of gravity of each surface from the center of the ideal total cross-section, which corresponds to the center of gravity of the cross-section under the assumptions made. The bending stiffness of the top layer is therefore calculated as follows:
E I ¯ = E R R × a R R × b × d t 3 12 ( 1 μ R R 2 ) + E M × a M × b × d t 3 12 ( 1 μ M 2 )
where aRR and aM are the area shares of the components in the total cross-section, dt is the top layer thickness, b the cross-section width and μRR and μM Poisson’s ratio of riprap and mortar, respectively. The stress in the respective components can be calculated as a function of the distance from the center of the ideal cross-section according to:
σ i = E i E ¯ M y I ¯   z ¯
At the Institute of Building Materials Research at RWTH Aachen University mechanical tests were carried out on riprap and colloidal grout to determine the static modulus of elasticity, see [31]. In addition, Poisson’s ratio was determined during these tests. The tests as well as their results are summarized in the Appendix A of this work. Table 3 provides a summary of the elastic moduli of the top layer components. Poisson’s ratio was μM = 0.06 (coefficient of variation σ’ = 0.10) for the mortar and μRR = 0.23 (coefficient of variation σ’ = 0.11) for the riprap.
Values in the range of the mean values of the elastic moduli of the components are used for calculating the bending stiffness of the composite cross-section (top layer). The area shares of mortar and riprap are assumed to correspond on average to the volumetric proportions of the components and were therefore chosen according to the porosity and the amount of mortar used for grouting. As Poisson’s ratios of riprap and mortar only have a slight influence on the calculated bending stiffness of the top layer, they were neglected. All selected values and the resulting bending stiffnesses for each cover layer are summarized in Table 4.

2.4.2. Modulus of Subgrade Reaction

The mechanical properties of the soil beneath the revetment are represented in the model by the modulus of subgrade reaction ks, which must be determined in physical tests for the respective soil. Peters [15] points out that there are no measurements of the modulus of subgrade reaction for soils beneath revetments. For the calculations carried out here, the modulus of subgrade reaction is therefore obtained from literature. As a non-exhaustive summary, Table 5 shows the range of possible values of moduli of subgrade reaction and shows which values were used in other publications to calculate the stresses in the cross-section of a revetment using a PEF model.
According to Peters [15], low values of 10–20 MN/m3 for the modulus of subgrade reaction for soils beneath revetments are realistic because, in contrast to soils beneath other structures like building foundations or roads, the soil beneath a revetment is often not treated and compacted as elaborately. Especially in the case of permeable revetments, the external loads additionally cause the pore water pressures in the soil beneath the revetment to oscillate and thus loosen rather than compact the grain structure of the soil, which further reduces the modulus of subgrade reaction [15,34]. Richwien [34] points out that when designing revetments with a PEF model, the soil properties that may change during a storm event must be considered by adjusting the modulus of subgrade reaction accordingly. The calculations for MGRRs are performed with ks = 10 MN/m3 and ks = 50 MN/m3. These values are intended to represent sandy soils in different degrees of compaction during cyclic wave loading.

2.4.3. Parameter Variations

The model parameters resulting from the considerations and physical model tests presented herein, with which the internal forces and tensile bending stresses of the MGRRs in the GWK are calculated using the PEF model, are shown in Table 6.

3. Results

3.1. Paramter Combination 1

With the PEF model and the measured data of the PTs for each experiment in the GWK with at least 1000 waves as boundary condition the resulting maximum tensile bending stresses were calculated and analyzed depending on the revetment configuration. Figure 8 shows the calculated maximum relative tensile bending stress σx,max/(ρwgHm0) at the edge of the cross-section (the maximum bending stresses either occur at the top or bottom edge of the cross-section) of the partially grouted MGRRs over the surf similarity parameter ξm-1,0 for parameter combination 1, i.e., ks = 50 MN/m3. The relative stress is calculated by dividing the stress by a fictitious hydrostatic pressure at wave height Hm0. The magnitude of the bending stresses depends in particular on the mean wave height Hm0 and the way the waves break on the revetment or are reflected at the revetment, which is taken into account by depicting the bending stresses as a function of the surf similarity parameter ξm-1.0. In Figure 8 and all following figures depicting the stresses, no distinction is made between the maximum stress at the upper edge or bottom edge of the top layer.
The bending stress for each configuration of MGRR is described by functions representing an upper envelope. Based on the procedure used to describe the maximum relative pressures on a polyurethane bonded top layer by Alcérreca-Huerta and Oumeraci [11], these functions are the sum of the quasi-static stress σx,qst resulting from the quasi-static component of the wave load and the impact component σx,imp resulting from wave impacts:
σ x ρ W g H m 0 = σ x , q s t ρ W g H m 0 + σ x , i m p ρ W g H m 0
The quasi-static stress is modelled by Equation (10):
σ x , q s t ρ W g H m 0 = c 1 × tan h ( c 2 × ξ m 1 , 0 )
where c1 and c2 are empirical factors. Equation (10) gives meaningful limit values for quasi-static loads, as f(ξm−1,0)→0 for ξm−1,0→0, i.e., for spilling breakers the stresses tend to zero. For ξm−1,0→∞, f(ξm−1,0) tends to a limit value that is dependent on the revetment characteristics. As the maximum relative stresses for ξm−1.0 > 2.5 mostly occur during wave run-down, this limit value is particularly dependent on the time it takes for the pressure beneath the top layer to adapt to the pressure on the top layer, which is dependent on the porosity and permeability of the top layer.
The impact component of Equation (9) is modelled as Rayleigh distributed by Equation (11):
σ x , i m p ρ W g H m 0 = c 3 × ξ m 1 , 0 × e ( 0.5 × ξ m 1 , 0 2 / c 4 )  
Again, meaningful limit values are assured because f(ξm−1,0)→0 for ξm−1,0→0 and f(ξm−1,0)→0 for ξm1,0→∞, as the number of impact loads tends to zero for spilling breakers as well as for reflected waves. For this reason, the Technical Advisory Committee on Flood Defence [9] as well as Alcérreca-Huerta and Oumeraci [11] represent the magnitude of wave impacts by a Rayleigh distribution. The sum of quasi-static load and impact load (Equation (9)) tends to the quasi-static load (ftotalm1,0)fquasi-static(ξm1,0)) for ξm1,0 → ∞. The quasi-static component of the relative bending stress can be understood as the lower envelope function and the sum of the quasi-static component and the component due to the impact load as the upper envelope function. The empirical parameters c1c4 in Equations (10) and (11) are given for each MGRR configuration in Table 7. In Figure 8 and all following figures depicting the relative bending stress, the solid lines show the validity range of the functions for which pressure measurement data from the physical model tests in the GWK is available. The dashed lines show the values of the function for smaller surf similarity parameters where no pressure measurements are available.
For surf similarity parameters ξm1.0 ≤ 2.5 in Figure 8 the relative bending tensile stress and its scattering increase due to the higher probability of occurrence of wave impacts and due to the increase in their magnitude. For larger surf similarity parameters (ξm1.0 > 2.5), the relative bending stress seems to reach a limit value. The non-breaking waves occurring in this range of surf similarity parameters therefore do not seem to be able to generate larger pressure differences as a result of wave rundown, since the top layers are permeable and thus the pressure beneath the top layers can adapt quickly to the pressure on the top layers. Given the same load, the relative bending stresses are lower for the 0.60 m thick revetment, because of its higher bending stiffness. This results in lower stresses in the 0.60 m thick revetment for almost all wave loads measured in the GWK, see also Figure 9.
The high relative bending stresses for the 0.40 m thick top layer at ξm1.0 ≈ 2.4, compared to other values for similar surf similarity parameters, are due to a particularly high wave impact load. This highlights the inherent natural variability of the magnitude of the wave impact load, which becomes particularly apparent when considering the maximum values of the bending tensile stresses. Figure 9 shows the calculated maximum relative tensile bending stress σx/(ρWgHm0) at the edge of the cross-section of the fully grouted MGRR and regrouted MGRR as a function of the surf similarity parameter ξm1,0 for parameter combination 1.
In the case of the fully grouted and impermeable top layer with a thickness of 0.40 m, the increase in relative bending stress is much more pronounced for surf similarity parameters associated with a high number of plunging breakers leading to wave impact (ξm1.0 ≤ 2.5) than in the case of permeable top layers (cf. Figure 8).
Higher bending stresses in fully grouted MGRRs compared to partially grouted MGRRs are due to greater wave loading of fully grouted MGRRs. Fully grouted top layers are smoother than partially grouted top layers. Therefore, the probability that there is a water layer from the previous wave run-down on the top layer during wave impact is lower for fully grouted top layers. Such a water layer greatly reduces the magnitude of wave impacts [35]. Another reason is that the pressure beneath the top layer cannot adopt as quickly to the pressure on the revetment as in the case of a permeable top layer, because the fully grouted top layer is impermeable. As a result, a large pressure difference between the upper and bottom edge of the top layer is created when it is exposed to wave impact. The high bending stress at ξm−1,0 ≈ 1.9 again highlights the inherent natural variability of the magnitude of the wave impact load.
In contrast, the increase in relative bending stress for surf similarity parameters ξm−1.0 ≤ 2.5 is small in the case of the regrouted top layer (dt = 0.60 m). The pressure changes more quickly beneath the top layer in the case of the regrouted top layer compared to the fully grouted top layer for the same wave conditions. The peak pressure beneath the regrouted revetment in the instant of maximum stresses during wave impact was about 20% of the peak pressure on the revetment in that same instant. As a consequence, the pressure difference is reduced. This also decreases the variation in the relative bending stresses for ξm−1.0 ≤ 2.5 as the pressure gradient along the top layer decreases in comparison to the fully grouted MGRR. Another reason for lower variation of the relative bending stress for the regrouted top layer is the fact that the variation of the peak pressure on the revetment was smaller than for the fully grouted MGRR, which is most probably caused by the natural variability of the wave impact load in combination with slightly different surface characteristics of the top layers.
The pressure changes more quickly beneath the top layer in the case of the regrouted top layer due to the grout distribution in the lower part of the regrouted top layer that is similar to a partially grouted top layer. As the mortar in case of the regrouted top layer was applied to the already partially grouted top layer, an impermeable top layer was created but not the entire pore volume of the top layer was filled with mortar. A porosity of the regrouted top layer of nregrouted = 0.16 remained.
For wavelengths Lm−1.0 > 50 m (corresponds approximately to surf similarity parameters ξm−1.0 > 3 in Figure 9), greater wave run-down heights were observed for both impermeable cover layers. Because the PTs did not cover the entire length of the revetment (the most seaward PT on the top edge of the top layer has a coordinate of z = 2.28 m), they did not resolve the complete load figure during wave run-down for such long wavelengths. Therefore, for the impermeable MGRRs and wavelengths Lm−1.0 > 50 m, the PTs do not provide reliable boundary conditions for the model. The calculated relative bending stresses are therefore not meaningful. The validity of the given functions and empirical parameter (see Table 7) is therefore limited to wavelengths Lm−1,0 < 50.

3.2. Parameter Combination 2

Figure 10 shows the calculated maximum relative tensile bending stress σx/(ρWgHm0) at the edge of the cross-section (a) of the partially grouted MGRRs and (b) of the fully and regrouted MGRRs over the surf similarity parameter ξm-1,0 for parameter combination 2. Again, functions for the upper envelope of the results are defined.
The smaller modulus of subgrade reaction (ks = 10 MN/m3) leads to greater deflections and thus to higher relative bending stresses for the same external load and bending stiffness of the revetments. The relative bending stresses are therefore increased in comparison to parameter combination 1. The same remarks regarding the validity range of the equations apply as for parameter combination 1. Table 7 gives an overview of the empirical coefficients used for the equations.

4. Discussion

The magnitude of the maximum relative tensile bending stress is firstly governed by the wave loading that exerts pressures on the MGRR. For different MGRR configurations, the difference in pressures beneath the top layer accounts for most of the difference of wave loading between partially and fully grouted MGRRs. Different probabilities for water layers on the top layer during wave impact account for a minor proportion of this difference. Under the same wave conditions, partially grouted MGRR are therefore subject to smaller tensile bending stresses. For other revetment types, an increase in permeability reduces hydraulic loads, too. This is reflected for example in design equations for pattern placed revetments, see for example [36] or [37].
Secondly, all boundary conditions being equal, the magnitude of the maximum relative tensile bending stress is particularly dependent on the ratio between bending stiffness of the top layer and modulus of subgrade reaction. For relatively high bending stiffness and relatively low modulus of subgrade reaction this magnitude is increased, compare the results of parameter combination 1 (Section 3.1) and 2 (Section 3.2).
Thirdly, the boundary conditions at the toe structure and the upper end of the revetment influence the internal forces and thereby the bending stresses in the top layer of MGRR. Many different constructions are conceivable, but in most cases the upper end of the revetment will not be fixed to any structure that transfers forces or momentums. The same can be said about the toe structure, which in many cases will be a sheet pile wall or a footing made of riprap or mortar-grouted riprap. The boundary conditions considered for the PEF model in this work (see Section 2.3) are therefore deemed to be representative for most MGRRs.
All hydraulic model tests in the GWK were carried out in prototype scale. This was necessitated in particular by the interaction of the processes on the top layer, which are dominated by inertia, with the flow in the porous top layer, which is dominated by friction [38]. Furthermore, the breaking process of the waves and the resulting pressures on the top layer are not scalable due to the great dependence of the pressures on the air content of the water, especially in the case of plunging breakers [35,39].
With regards to model effects, wave reflection at the wave paddle is prevented by active wave absorption in the GWK [40]. The wave load is represented two-dimensional in the wave channel. Regarding the stability of mortar-grouted riprap, the results for two-dimensional loading are on the safe side, since the load can only be transferred by the revetment along the slope (x-direction in Figure 7). Peters [15] notes for pattern placed revetments that under three-dimensional loading forces can be transferred into unloaded areas transverse to the direction along the slope, which increases the stability of the revetments.
Effects at the model boundaries are counteracted in particular by a sufficient width of the model, although these effects can never be completely avoided. The PTs were installed as close to the middle of each model section as the boundary constraints of installation, reconstruction and removal of the revetments allowed. In the wave channel fresh water was used instead of salt water. However, dimensionless quantities which take the density of the fluid into account are used to describe the results.
Assumptions regarding the distribution of grout in the top layer and equal moduli of elasticity for compression and tension for each revetment component were made to calculate the bending stiffness of the MGRR idealized as a PEF. These assumptions can easily be adjusted to be less restrictive. However, in the absence of full-scale bending tests on MGRRs, it is not certain whether such adjustments would yield any considerable improvements for the calculation of the bending stresses in MGRRs.
Due to the lack of detailed field data regarding damages and damage progression for MGRRs as well as due to missing full-scale bending tests on MGRRs the PEF model can be validated only with the observations made during the full-scale hydraulic model tests in the GWK. The sand beneath the revetments in the GWK was compacted, therefore probably yielding higher moduli of subgrade reaction that reduce the deflection and thereby reduce the bending stresses in the revetments. If we assume ks = 50 MN/m3, then the tensile bending stresses in all experiments in the GWK were σx < 0.1 N/mm2 for the partially grouted MGRRs and σx < 0.3 N/mm2 for the fully grouted and regrouted MGRRs. These stresses are lower than the average values of the tensile strength of colloidal mortar (βt ≈ 0.96 N/mm2) as well as the adhesive tensile strength (βt,adh ≈ 0.55 N/mm2) and adhesive bending tensile strength (βbt,adh ≈ 1.44 N/mm2) between riprap and colloidal mortar as determined by the Institute of Building Materials Research at RWTH Aachen University [28,31]. The laboratory conditions in the GWK facilitated quality assurance of the application of the mortar as well as of the grouting mortar itself, supporting the assumption that the same strengths and adhesive strengths were present in the GWK experiments. The results of the PEF model therefore suggest that no cracks over the whole width of the revetments would occur and none were observed in the GWK experiments. Therefore, the observations are in line with the results of the PEF model.
The representation of the soil beneath the revetment as a spring is a considerable simplification. Due to this simplification, the modulus of subgrade reaction depends on a large number of variables, e.g., the load velocity, the duration and magnitude of the load as well as water saturation, load history, compaction and other parameters of the soil [15,33]. The modulus of subgrade reaction also depends on the bending stiffness of the structure, which influences the distribution of the soil bearing pressure [41]. Due to its simplicity and also due to the lack of detailed investigations into the mechanical properties of soils beneath revetments under wave loading in coastal environments, the modulus of subgrade reaction represents a reasonable model choice. The modulus of subgrade reaction for different soils beneath MGRRs could in a first step be determined in large scale laboratory tests by conducting bending tests on bedded MGRRs and comparing the measured deflection and load to results of calculations with the structural model that is described in this work.
As was described in Section 1, revetments with no flexibility are not able to not adapt to subsoil settlement and as a consequence, cavities can occur beneath these revetments and the bedding of the top layer is lost locally. In this case the stresses in the top layer during wave loading are significantly increased and it therefore represents a damage mechanism that has to be taken into account when designing a MGRR. This is not considered in the results presented herein, as this work describes a first step for determining bending stresses in MGRRs in which newly constructed MGRR with constant bedding were considered. However, the PEF model presented in this work can also be used to calculate bending stresses in MGRRs that lost their bedding locally or for soils exhibiting different moduli of subgrade reaction, for that matter. Prerequisite for such a calculation are the spatially discretized load figures during wave impact and wave run-down, which will be presented in a follow-up paper.
Equations (9)–(11) in combination with the coefficients given in Table 7 only apply to the wave parameters and structural parameters of the revetments examined in the hydraulic model test in the GWK and must not be extrapolated beyond these parameters. However, these equations give meaningful limit values and are chosen as to best represent the physical phenomena.

5. Conclusions

The PEF model presented herein for the first time describes the tensile bending stresses due to hydraulic loads as basis for the limit state equation of crack formation in the top layer of MGRRs. Enveloping functions for maximum relative tensile bending stress σx,max/(ρwgHm0) are given for four configurations of MGRRs that are of great practical relevance. The procedure described herein can be used for further boundary conditions, e.g., for determining the equations of the enveloping functions of the 98% quantile of the relative bending stresses.
However, for MGRR with a non-continuous bedding or other mechanical parameters, for example due to different stones or mortars used for construction or due to already existing deterioration of the revetment, the given enveloping functions cannot be used to calculate the bending stresses. These conditions may well be decisive for the design of MGRRs, thus the results presented herein are a first step to describe the loading on newly constructed MGRRs. In order to calculate bending stresses for MGRRs with a non-continuous bedding or with other mechanical parameters, the hydraulic loading has to be schematized and parametrized in order to be used as boundary condition for the PEF model so that the bending stresses can be calculated in this case as well. In this regard, the analysis of the pressure distribution on and beneath the top layer during maximum bending tensile stresses revealed that the sole consideration of the impact load to determine the maximum bending tensile stress is not sufficient for all wave parameters, but that especially for surf similarity parameters ξm−1,0 > 2.5 the load resulting from the wave run-down must also be considered. A detailed analysis and subsequent parametrization of the pressure distributions along the top layer due to wave loading will be presented in a follow-up paper.
Further research is needed to verify and refine the assumptions made for representing MGRRs as PEF models and to validate the PEF model. Especially bending tests on large top layer specimens of MGRRs are necessary to determine the fracture mechanical parameters and verify the calculated bending stiffness of this composite construction. Furthermore, a more detailed insight into the mechanical properties of the soil beneath revetments subject to wave loading in coastal environments would not only benefit the model presented herein, but also every other revetment design that utilizes the modulus of subgrade reaction.

Author Contributions

Conceptualization, M.K. and H.S.; methodology, M.K.; software, M.K.; formal analysis, M.K.; investigation, M.K. and others; data curation, M.K.; writing—original draft preparation, M.K.; writing—review and editing, H.S.; visualization, M.K.; supervision, H.S.; project administration, H.S.; funding acquisition, H.S. and others. All authors have read and agreed to the published version of the manuscript.

Funding

This work was funded by the German Federal Ministry of Education and Research within the project “Wave Loading and Stability of Hydraulically Bonded Revetments”, grant numbers 03KIS110 and 03KIS111. The project was initiated in the framework of the German Coastal Engineering Research Council.

Acknowledgments

The authors thank the technical staff at the Coastal Research Center in Hannover. Further, the authors acknowledge the continued administrative and financial support of the Leibniz Universität Hannover and Technische Universität Braunschweig to operate and maintain the Coastal Research Center and its Large Wave Flume (GWK). The authors further would like to thank the project support group and Hocine Oumeraci for their scientific support and expertise.

Conflicts of Interest

The authors declare no conflict of interest. The funders had no role in the design of the study; in the collection, analyses, or interpretation of data; in the writing of the manuscript, or in the decision to publish the results.

Appendix A

Appendix A.1. Introduction

Mechanical and fracture mechanical tests on riprap and grouting mortar were conducted by the Institute of Building Materials Research at RWTH Aachen University. The compressive strength, tensile strength and bending tensile strength as well as the dynamic and static modulus of elasticity of riprap and grouting mortar were investigated. Furthermore, the bond properties between riprap and grouting mortar were tested. For this purpose, the adhesive tensile strength, adhesive shear strength and adhesive bending tensile strength of composite specimens were determined as well. Klotzek [31] gives a detailed description of the tests.
In the context of the present work the elastic moduli of riprap and grouting mortar are of interest because they are used to calculate the modulus of elasticity of the composite structure that is a MGRR, see Section 2.4.1. Therefore, the tests to determine the modulus of elasticity and their results are summarized in the following with the approval of the Institute of Building Materials Research at RWTH Aachen University.

Appendix A.2. Materials, Methods and Results: Riprap

The riprap investigated is from a quarry in Jelsa, Norway, near Stavanger. It was classified as gabbro, a magmatite. Figure A1 gives an impression of the stones.
Figure A1. (a) Stone (specimen 3) of group 1 and (b) detail of stone surface. (c) Stone (specimen 6) of group 2 and (d) detail of its surface. Stone group 1 has a coarser grain size and darker minerals than stone group 2 (after [31]).
Jmse 08 00913 g0a1
Half of the stones tested have significantly higher proportions of light minerals such as plagioclase and quartz in the form of grains than the other half of the stones. Therefore, on the basis of their mineral composition and the grain size of these minerals, the stones can be divided into two different sets of specimens, see Figure A1. These different mineral compositions mainly affect the modulus of elasticity under tension. However, as in the case of revetment construction these different stones are always present in practice, the results for their mechanical properties are shown and discussed together.
The stones were roughly cut into pieces with a diamond saw blade. These pieces were then sawed into cubes and beams with a precision saw. Cylinders were drilled with a core drill. Subsequently, the surfaces of the test specimens were ground with a surface grinding machine.
The bulk density and porosity of the stones were determined according to the standard DIN EN 1936 [42] on ten cubes with an edge length of 50 mm. For this purpose, the test specimens were dried and weighed at 70 °C until constant mass was achieved, then stored in demineralized water for 24 h and weighed again. Both the mass of the cube wiped with a cloth and that of the cube immersed in water were determined. The dry bulk density was determined both via the volume determined by length measurements and via the volume determined by immersion methods. The mean density of the specimens in all cases (after removal, after drying and after storage in water) was 2.86 t/m3 with a coefficient of variation of 4%. The porosity was 0.3% with a coefficient of variation of 24%.
The static modulus of elasticity of the riprap under compression was determined using six cylindrical test specimens with a slenderness of λ = 2 and a diameter of d = 50 mm in accordance with DIN EN 14580 [43]. The compressive strength, which was tested on equilateral cylinders and cubes in wet and dry conditions, was taken into account for the maximum load when determining the static modulus of elasticity. The longitudinal and transverse strains were recorded with strain gauges. For the longitudinal strains, two 50 mm long strain gauges were applied to the lateral surface of the cylinders in axial direction. Strain gauges with a length of 25 mm were mounted orthogonally to determine the transverse strain, see Figure A2.
Figure A2. Testing the static modulus of elasticity on a stone under compression. (a) Specimen in test facility (Instron 5587), (b) detail showing the strain gauges and (c) stone after failure (after [31]).
Jmse 08 00913 g0a2
In accordance with the requirements of the standard DIN EN 14580, the test specimens were subjected to three load cycles at a constant load speed of 1 kN/s. Subsequently, the load was increased until the test specimens broke. The results of the tests are shown together with the results for Poisson’s ratio in Table A1. The static modulus of elasticity of the riprap under tension was tested on seven cylinders with pulling plates glued to their square faces and a loading speed of 0.5 kN/s.
Table A1. Static modulus of elasticity of revetment stones under compression and tension as well as compressive strength, Poisson’s ratio and tensile strength (after [31]).
CompressionTension
Specimen No.GroupCompressive Strength βDModulus of Elasticity ECPoisson’s Ratio µSpeci-men No.GroupTensile Strength βZModulus of Elasticity ET
(N/mm2)(N/mm2)(-) (N/mm2)(N/mm2)
31268.375,3850.2183113.464,861
41231.260,9510.2234110.340,394
71143.467,4750.200718.652,698
62257.063,3310.247128.577,009
92171.476,7710.2682211.769,932
102141.668,6860.2138211.653,792
9216.274,870
Mean202.268,7670.228Mean11.4761,936
Coefficient of variation0.280.090.11Coefficient of variation0.240.22

Appendix A.3. Materials, Methods and Results: Grouting Mortar

In the code of practice “Use of Cementitious and Bituminous Materials for Grouting Armourstone on Waterways” [5], requirements for fresh and hardened grouting mortar are specified. The basic materials for grouting mortars must therefore comply with DIN 1045-2 [44] and DIN EN 206 [45]. According to [5], only cements in accordance with DIN EN 197-1 [46] and DIN EN 1164-10 [47] are to be used for the production of grouting mortar.
For the preparation of the grouting mortar, at first water and cement are mixed in a centrifuge with high mixing energy. This creates shear and friction which distribute and wet the binder particles uniformly, resulting in an increased formation of hydration products. In the second step sand with a maximum grain size of 2–8 mm is added to the mixture. The resulting grouting mortar is called ‘colloidal’ mortar. This preparation of the mortar produces the mortar properties required for grouting MGRR without the addition of chemical additives, in particular high flowability and high resistance to segregation. Further information on the mixing process is given by [24,48].
The mortar test specimens were produced at a revetment construction site. The sand used for the mortar can be classified as ‘fine-grained’ according to DIN 1045-2. There were shell fragments in the range of grain sizes d ≥ 0.5 mm. The cement used was a Portland-limestone cement (CEM II/A-LL 32.5 R (80–94% clinker, 6–20% limestone)) according to DIN EN 197-1. According to information provided by the construction site personnel, the basic materials of the mortar are composed of 26.9% cement, 60.6% sand and 12.5% water. This results in a water/cement ratio of 0.46. This corresponds to the requirements according to [5]. The compliance with permissible properties of the fresh grouting mortar according to [5] was also checked.
The filling of the formwork for the production of the test specimens was carried out in two steps. For this purpose, the formworks were filled up to half with mortar and then compacted by slightly lifting and dropping the formwork ten times. After complete filling and renewed compaction, the formworks were covered with damp cloths and foil. The test specimens were then transported to the Institute of Building Materials Research after 24 h and subsequently the formwork was removed. The specimens were stored under water until the tests were done after 34 days.
The static modulus of elasticity of the mortar under compression was tested on six cylinders (slenderness λ = 2, d = 150 mm). In addition, Poisson’s ratio of the mortar was determined. The longitudinal strains were recorded by three inductive displacement transducers while the transverse strains were determined by means of a measuring chain, see Figure A3.
Figure A3. Testing the static modulus of elasticity on grouting mortar under compression. (a) Specimen in test facility (Form+Test Prüfsysteme, ALPHA 4-3000) and (b) detail showing the measuring chain and inductive displacement transducers (after [31]).
Jmse 08 00913 g0a3
The test specimens were subjected to compression at a constant load speed of 8.8 kN/s over three load cycles. The upper and lower stress was set to 197.5 kN and 8.8 kN, respectively. The test specimens were then tested until the breaking load was reached. The static modulus of elasticity under tension was tested on five cylinders with pulling plates glued to their square faces and a loading speed of 0.5 kN/s. The results are given in Table A2.
Table A2. Static modulus of elasticity of grouting mortar under compression as well as compressive strength and Poisson’s ratio (after [31]).
CompressionTension
Specimen No.Compressive Strength βDModulus of Elasticity ECPoisson’s Ratio µSpecimen No.Tensile Strength βZModulus of Elasticity ET
(N/mm2)(N/mm2)(-) (N/mm2)(N/mm2)
135.622,5320.06111.118,621
235.423,2290.05421.017,766
333.122,9620.06731.021,329
437.824,2870.06640.720,085
534.523,5910.06151.019,802
631.623,0200.052
Mean34.723,2700.060Mean0.9619,520
Coefficient of variation0.060.030.10Coefficient of variation0.160.07

Appendix A.4. Discussion

The mechanical and fracture mechanical values of the tests on stones are subject to high scatter. As the two groups of stone specimens differ considerably in their strengths, scatter increases when the strengths are considered as a whole.
When the elastic moduli under tension are examined, the different properties of the two stone groups become particularly apparent. Stone group 1 has on average significantly lower moduli of elasticity under tension than group 2 (deviation: approx. 24%). Here, too, the mineral contents are the reason for the deviations. Stone group 2 is characterized by a higher proportion of dark minerals. The brittle fracture behavior of the dark minerals yields lower strain at fracture and thus a higher tensile modulus.
Compared to mortar, natural stone has a significantly higher compressive and tensile strength and a significantly higher modulus of elasticity. The mean value of the static modulus of elasticity of natural stone is about three times higher than that of mortar.
Scatter of the mechanical and fracture mechanical values reduces for the mortar. The main reason for this is that the mortar has a more homogeneous structure than natural stone.
On the basis of the elasticity investigations it could be shown that mortar and stone under compressive load show a similar transverse elongation behavior, but clear differences in longitudinal elongation behavior. Consequently, there are also strong differences in Poisson’s ratio for both materials.

References

  1. CIRIA. The International Levee Handbook; C731: London, UK, 2013; ISBN 978-0-86017-734-0. [Google Scholar]
  2. EAK. Empfehlungen für die Ausführung von Küstenschutzwerken durch den Ausschuss für Küstenschutzwerke der Deutschen Gesellschaft für Geotechnik e.V. und der Hafenbautechnischen Gesellschaft e.V.; Westholsteinische Verlagsanstalt Boyens & Co.: Heide, Germany, 2007; ISBN 978-3-8042-1056-1. [Google Scholar]
  3. German Institute for Standardization. Armourstone—Part 1: Specification; Beuth Verlag GmbH: Berlin, Germany, 2002. [Google Scholar]
  4. Federal Waterways Engineering and Research Institute. Anwendung von Regelbauweisen für Böschungs- und Sohlensicherungen an Binnenwasserstraßen (Application of Standard Construction Methods for Embankment and Bottom Protection on Inland Waterways); Federal Waterways Engineering and Research Institute: Karlsruhe, Germany, 2008. [Google Scholar]
  5. Federal Waterways Engineering and Research Institute. Use of Cementitious and Bituminous Materials for Grouting Armourstone on Waterways (Anwendung von Hydraulisch Gebundenen Stoffen zum Verguss von Wasserbausteinen an Wasserstraßen, MAV); Federal Waterways Engineering and Research Institute: Karlsruhe, Germany, 2017. [Google Scholar]
  6. Federal Waterways Engineering and Research Institute. Prüfung von Hydraulisch- und Bitumengebundenen Stoffen zum Verguss von Wasserbausteinen an Wasserstraßen (Testing of Hydraulically and Bitumen-Bonded Materials for Grouting Armourstones on Waterways); Federal Waterways Engineering and Research Institute: Karlsruhe, Germany, 2008. [Google Scholar]
  7. Federal Waterways Engineering and Research Institute. Grundlagen zur Bemessung von Böschungs- und Sohlensicherungen an Binnenwasserstraßen (Principles for the Design of Embankment and Bottom Protection on Inland Waterways); Federal Waterways Engineering and Research Institute: Karlsruhe, Germany, 2010. [Google Scholar]
  8. CIRIA; CUR; CETMEF. The Rock Manual. The use of Rock in Hydraulic Engineering, 2nd ed.; C683: London, UK, 2007. [Google Scholar]
  9. Technical Advisory Committee on Flood Defence. Technisch Rapport Asfalt voor Waterkeren; Rijkswaterstaat, DWW: Delft, The Neterlands, 2002. [Google Scholar]
  10. Knieß, H.-G.; Köhler, H.-J. Untersuchung gebundener Steinschüttungen auf Flexibilität, Verbundfestigkeit und Wasserdurchlässigkeit. Bull. Fed. Waterw. Eng. Res. Inst. 1984, 55, 113–134. [Google Scholar]
  11. Alcérreca-Huerta, J.C.; Oumeraci, H. Wave-induced pressures in porous bonded revetments. Part I: Pressures on the revetment. Coast. Eng. 2016, 110, 87–101. [Google Scholar] [CrossRef]
  12. Alcérreca-Huerta, J.C.; Oumeraci, H. Wave-induced pressures in porous bonded revetments. Part II: Pore pressure just beneath the revetment and in the embankment subsoil. Coast. Eng. 2016, 110, 76–86. [Google Scholar] [CrossRef]
  13. Liebisch, S. Bonded Porous Revetments—Effect of Porosity on Wave-Induced Loads and Hydraulic Performance: An Experimental Study. Ph.D. Thesis, Technische Universität Carolo-Wilhelmina, Braunschweig, Germany, 2015. [Google Scholar]
  14. Schiereck, G.J. Introduction to Bed, Bank and Shore Protection; Spon Press: London, UK, 2004; ISBN 0-415-33177-3. [Google Scholar]
  15. Peters, D.J. Design of Pattern-Placed Revetments. Ph.D. Thesis, Delft University of Technology, Delft, The Netherlands, 2017. [Google Scholar]
  16. De Looff, A.K.; t’Hart, R.; Montauban, K.; van den Ven, M. GOLFKLAP A Model to Determine the Impact of Waves on Dike Structures with an Asphaltic Concrete Layer. In Proceedings of the 30th International Conference, San Diego, CA, USA, 3–8 September 2006; pp. 5106–5116. [Google Scholar]
  17. ARCADIS. Polyurethane Bonded Aggregate Revetments Design Manual; ARCADIS: Amsterdam, The Netherlands, 2010. [Google Scholar]
  18. Rijkswaterstraat. The Use of Asphalt in Hydraulic Engineering; Rijkswaterstraat: Utrecht, The Netherlands, 1985. [Google Scholar]
  19. Oumeraci, H.; Staal, T.; Pfoertner, S.; Ludwigs, G.; Kudella, M. Hydraulic Performance, Wave Loading and Response of Elastocoast Revetments and their Foundation—A Large Scale Model Study; TU Braunschweig—Leichtweiss Institut: Braunschweig, Germany, 2010. [Google Scholar]
  20. Führböter, A.; Sparboom, U. Shock Pressure Interactions on Prototype Sea Dikes Caused by Breaking Waves. In Proceedings of the SOWAS’88 (Modelling Soil-Water-Structure Interactions), Delft, The Netherlands, 29 September–2 October 1988. [Google Scholar]
  21. IMS Ingenieurgesellschaft mbH. Werkstoff Elastocoast—Zusammenstellung der Technischen Bemessungsgrundlagen für den Werkstoff Elastocoast; IMS Ingenieurgesellschaft mbH: Hamburg, Germany, 2010. [Google Scholar]
  22. Losada, I.J.; Lara, J.L.; del Jesus, M. Modeling the interaction of water waves with porous coastal structures. J. Waterw. Port Coast. Ocean Eng. 2016. [Google Scholar] [CrossRef]
  23. Dankert, J.; Dankert, H. Technische Mechanik. Statik, Festigkeitslehre, Kinematik/Kinetik, 7th ed.; Springer: Berlin/Heidelberg, Germany, 2013; ISBN 978-3-8348-1809-6. [Google Scholar]
  24. Monnet, W.; Dartsch, B.; Wehefritz, K. Colcrete-Beton im Wasserbau; Beton-Verlag: Düsseldorf, Germany, 1980; ISBN 3-7640-0134-8. [Google Scholar]
  25. Leichtweiß-Institut für Wasserbau. L~davis: Manual for the Data Analysis and Visualization Software of the Leichtweiss Institute; Leichtweiß-Institut für Wasserbau: Braunschweig, Germany, 2007. [Google Scholar]
  26. Mansard, E.P.D.; Funke, E.R. The Measurement of Incident and Reflected Spectra Using a Least Square Method. In Proceedings of the 17th International Conference on Coastal Engineering (ICCE), Sydney, Australia, 23–28 March 1980; pp. 154–172. [Google Scholar]
  27. EurOtop. Manual on Wave Overtopping of Sea Defences And Related Structures. An Overtopping Manual Largely Based on European Research, but for Worldwide Application. 2018. Available online: www.overtopping-manual.com (accessed on 11 November 2020).
  28. Kreyenschulte, M. Wellen-Bauwerks-Interaktion bei Mörtelvergossenen Schüttsteindeckwerken. Ph.D. Thesis, RWTH Aachen University, Aachen, Germany, 2020. [Google Scholar]
  29. Klein Breteler, M.; van der Werf, I.; Wenneker, I. Kwantificering Golfbelasting en Invloed Lange Golven. Onderzoeksprogramma Kennisleemtes Steenbekledingen; Deltares: Delft, The Netherlands, 2012. [Google Scholar]
  30. Gross, D.; Hauger, W.; Schröder, J.; Wall, W.A. Technische Mechanik 2—Elastostatik; Springer: Berlin/Heidelberg, Germany, 2017; ISBN 978-3-662-53678-0. [Google Scholar]
  31. Klotzek, T. Mechanical and Fracture Mechanical Properties of Hydraulically Bonded Revetments. Master’s Thesis, RWTH Aachen University, Aachen, Germany, 2017. Unpublished Work. [Google Scholar]
  32. Stichting Toegepast Onderzoek Waterbeheer. State of the Art Asfaltdijkbekledingen; Rijkswaterstraat: Utrecht, The Netherlands, 2010. [Google Scholar]
  33. Ruygrok, P.A. Dimensioneren van Asfaltbekledingen op Golfbelasting, Analyse van de Relatie Tussen Golfbelasting en Rekken; Report CO-347160/17; Grondmechanica: Delft, The Netherlands, 1994. [Google Scholar]
  34. Richwien, W. Seegang und Bodenmechanik—Geotechnische Versagensmechanismen von Seedeichen. Bull. Fed. Waterw. Eng. Res. Inst. 1989, 66, 139–154. [Google Scholar]
  35. Witte, H.-H. Druckschlagbelastung durch Wellen in Deterministischer und Stochastischer Betrachtung. Ph.D. Thesis, Technische Universität Carolo-Wilhelmina, Braunschweig, Germany, 1988. [Google Scholar]
  36. Klein Breteler, M.; Pilarczyk, K.W.; Stoutjesdijk, T. Design of Alternative Revetments. Coast. Eng. Proc. 1998, 1. [Google Scholar] [CrossRef]
  37. Klein Breteler, M.; Bezuijen, A. Design criteria for Placed Block Revetments. In Dikes and Revetments. Design, Maintanance and Safety Assessment; Pilarczyk, K.W., Ed.; A.A. Balkema: Rotterdam, The Netherlands, 1998; pp. 217–248. ISBN 90 5410 455 4. [Google Scholar]
  38. Hughes, S.A. Physical Models and Laboratory Techniques in Coastal Engineering; World Scientific Publishing Co. Pte. Ltd.: Singapore, 1993; ISBN 981-02-1540-1. [Google Scholar]
  39. Führböter, A. Wellenbelastung von Deich- und Deckwerksböschungen; Schiffahrts-Verlag “Hansa”: Hamburg, Germany, 1991. [Google Scholar]
  40. Oumeraci, H. More than 20 years of experience using the Large Wave Flume (GWK): Selected research projects. Die Küste 2010, 77, 179–239. [Google Scholar]
  41. EAU. Empfehlungen des Arbeitskreises “Ufereinfassungen”. Häfen und Wasserstraßen; Wilhelm Ernst & Sohn Verl.: Berlin, Germany, 2012. [Google Scholar]
  42. German Institute for Standardization. Natural Stone Test Method—Determination of Real Density and Apparent Density, and of Total and Open Porosity; Beuth Verlag GmbH: Berlin, Germany, 2007. [Google Scholar]
  43. German Institute for Standardization. Natural Stone Test Methods—Determination of Static Elastic Modulus; Beuth Verlag GmbH: Berlin, Germany, 2005. [Google Scholar]
  44. German Institute for Standardization. Concrete, Reinforced and Prestressed Concrete Structures—Part 2: Concrete—Specification, Properties, Production and Conformity—Application Rules for DIN EN 206-1; Beuth Verlag GmbH: Berlin, Germany, 2008. [Google Scholar]
  45. German Institute for Standardization. Concrete— Specification, Performance, Production and Conformity; German Version EN 206:2013+A1:2016; Beuth Verlag GmbH: Berlin, Germany, 2017. [Google Scholar]
  46. German Institute for Standardization. Cement—Part 1: Composition, Specifications and Conformity Criteria for Common Cements; German and English Version prEN 197-1:2018 (Draft); Beuth Verlag GmbH: Berlin, Germany, 2018. [Google Scholar]
  47. German Institute for Standardization. Special Cement—Part 10: Composition, Requirements and Conformity Evaluation for Cement with Low Effective Alkali Content; Beuth Verlag GmbH: Berlin, Germany, 2013. [Google Scholar]
  48. Hallauer, O. Vergussstoffe für Uferdeckwerke. Bull. Fed. Waterw. Eng. Res. Inst. 1986, 58, 29–69. [Google Scholar]
Figure 1. View of (a) a partially grouted top layer and (b) a fully grouted top layer (Photos: Kreyenschulte, 2015) as well as schematic representations of the cross-section of (c) partially grouted MGRRs and (d) fully grouted MGRRs (modified after [4]).
Jmse 08 00913 g001
Figure 2. Plate on an elastic foundation (PEF) and wave impact load, idealized as triangular load (after [16]).
Jmse 08 00913 g002
Figure 3. Partially grouted MGRRs (vg = 80 L/m2) in test phase one (Photos: Kreyenschulte and Kühling, 2017).
Jmse 08 00913 g003
Figure 4. (a) Schematic longitudinal cross-section of the GWK showing the wave paddle at the left, the instrumentation along the flume and the revetment on the right. (b) Top view of the revetment section with the pressure transducers on and beneath the top layer in red and black, respectively.
Jmse 08 00913 g004
Figure 5. Position of the PTs in the GWK (after [28]).
Jmse 08 00913 g005
Figure 6. (a) Top view and (b) close up of the placement of the steel channel for the PTs in the top layer. (c) Demolition of the 0.40 m thick revetment on the south side before test phase two in order to construct a new revetment. The steel channel is visible in the lower right part of the picture. Notice also the partial grouting of test phase one, recognizable by portions of free pore space and grout (Photos: Kreyenschulte, 2017).
Jmse 08 00913 g006
Figure 7. Model of the MGRRs as a plate on an elastic foundation with boundary conditions and model parameters (after [28]).
Jmse 08 00913 g007
Figure 8. Maximum relative tensile bending stress σx,max/(ρwgHm0) dependent on the surf similarity parameter ξm−1,0 with enveloping functions (permeable, partially grouted MGRRs, parameter combination 1). The quasi-static component of the relative bending stress from Equation (9) is shown as a dotted line. The dashed line for illustration shows the enveloping functions for surf similarity parameters for which no experimental data is available (after [28]).
Jmse 08 00913 g008
Figure 9. Maximum relative tensile bending stress σx,max/(ρwgHm0) dependent on the surf similarity parameter ξm−1,0 with enveloping functions (impermeable, regrouted and fully grouted MGRR, parameter combination 1). The quasi-static component of the relative bending stress from Equation (9) is shown as a dotted line. The dashed line for illustration shows the enveloping functions for surf similarity parameters for which no experimental data is available (after [28]).
Jmse 08 00913 g009
Figure 10. Maximum relative tensile bending stress σx,max/(ρwgHm0) dependent on the surf similarity parameter ξm−1,0 with enveloping functions (parameter combination 2) for (a) permeable, partially grouted MGRR and (b) impermeable, regrouted and fully grouted MGRR (after [28]).
Jmse 08 00913 g010
Table 1. Parametrization of the wave load in the design of different kinds of monolithic or coherent revetments with a PEF model.
RevetmentkpWidth BSlope Angle Tan (α)Reference
Asphaltapprox. 2–6 *Hs1:3–1:8[9,16]
Polyurethane bonded revetment4Hs1:3[17,21]
Riprap fully grouted with asphaltapprox. 2–6 *Hs1:3–1:8[18]
* Is calculated in the design process with a probability density function.
Table 2. Characteristics of the MGRRs in the GWK.
Partially GroutedFully Grouted
SectionNorthSouthNorthSouth
Configuration Nr.1234
Top layer thickness dt (m)0.60.40.60.4
Amount of mortar vg (L/m2)808080 + 100180
Estimated porosity n before grouting (-)0.450.450.450.45
Porosity n after grouting (-)0.320.250.160
Pore volume Vp after grouting (L/m2)190100900
Table 3. Static modulus of elasticity Estat,33 of the components of MGRRs, dependent on the load (after [31]).
Component and LoadStatic Modulus of Elasticity Estat,33 (N/mm2)
MinimumMeanMaximumStandard DeviationCoefficient of Variation (–)
Riprap (Compression)60,95168,76776,77163270.09
Riprap (Tension)40,39461,93677,00913,4330.22
Mortar (Compression)22,53223,27024,2876060.03
Mortar (Tension)17,76619,52021,32913740.07
Table 4. Parameter for MGRR in the PEF model.
Top Layer Thickness dt (m)DescriptionStatic Modulus of Elasticity Estat,33 (N/mm2)Area Share of Components in Cross-Section (–)Bending Stiffness E I ¯   (MNm2)
RiprapMortaraRRaM
0.40Fully grouted60,00020,0000.550.45224.00
Partially grouted, vg = 80 L/m20.20197.33
0.60Regrouted, vg = 80 + 100 L/m260,00020,0000.550.29698.40
Partially grouted, vg = 80 L/m20.13642.00
Table 5. Overview of moduli of subgrade reaction ks used for PEF revetment models.
Soilks (MN/m3)DescriptionReference
“Sandy soil“10–20Recommendation for soils beneath revetments, wave impact load[15]
“Dense sand“100Beneath asphalt revetments, wave impact load[32]
64
“Sand“40–100 *Beneath asphalt revetments[9]
35–60Beneath asphalt revetments, quasi-static load[33]
50–90Beneath asphalt revetments, wave impact load
* 100 MN/m2 for medium to well compacted sand, proctor density >95%.
Table 6. Model parameter combinations for the MGRRs of the GWK tests.
Top Layer Thickness dt (m)DescriptionBending Stiffness   E I ¯   (MNn2) Modulus of Subgrade Reaction ks (MN/m3)Denomination
0.40Fully grouted224.0050Parameter combination 1
Partially grouted, vg = 80 L/m2197.33
0.60Regrouted, vg = 80 + 100 L/m2698.40
Partially grouted, vg = 80 L/m2642.00
0.40Fully grouted224.0010Parameter combination 2
Partially grouted, vg = 80 L/m2197.33
0.60Regrouted, vg = 80 + 100 L/m2698.40
Partially grouted, vg = 80 L/m2642.00
Table 7. Empirical coefficients of the enveloping functions of the maximum relative bending stress for each parameter combination and top layer configuration.
dt (m)Descriptionc1c2c3c4Restriction of Validity *
0.40Fully Grouted200.2301.8Lm1,0 <50 mParameter combination 1
(ks = 50 MN/m3)
Partially grouted, vg = 80 L/m270.4141.5-
0.60Regrouted, vg = 80 + 100 L/m2200.2101.8Lm1,0 <50 m
Partially grouted, vg = 80 L/m250.481.5-
0.40Fully grouted400.2501.8Lm1,0 <50 mParameter combination 2
(ks = 10 MN/m3)
Partially grouted, vg = 80 L/m2120.4201.5-
0.60Regrouted, vg = 80 + 100 L/m2300.25181.8Lm1,0 <50 m
Partially grouted, vg = 80 L/m2100.4141.5-
* Other than the restriction that the results are only valid for the parameters investigated in the GWK.
Publisher’s Note: MDPI stays neutral with regard to jurisdictional claims in published maps and institutional affiliations.

