Article

A Comparative Analysis of EEDI Versus Lifetime CO2 Emissions

by
Nikoletta L. Trivyza
1,*,
Athanasios Rentizelas
2 and
Gerasimos Theotokatos
3
1
Department of Design Manufacturing and Engineering Management, University of Strathclyde, Glasgow G4 0LZ, UK
2
School of Mechanical Engineering, Sector of Industrial Management and Operational Research, National Technical University of Athens, 15780 Athens, Greece
3
Maritime Safety Research Centre, Department of Naval Architecture, Ocean, and Marine Engineering, University of Strathclyde, Glasgow G4 0LZ, UK
*
Author to whom correspondence should be addressed.
J. Mar. Sci. Eng. 2020, 8(1), 61; https://doi.org/10.3390/jmse8010061
Submission received: 17 December 2019 / Revised: 12 January 2020 / Accepted: 15 January 2020 / Published: 20 January 2020
(This article belongs to the Special Issue Modelling and Optimisation of Ship Energy Systems)

Abstract

:
The Energy Efficiency Design Index (EEDI) was introduced as a regulatory tool employed at the ship design phase to reduce the carbon dioxide (CO2) emissions and increase the vessel’s operational efficiency. Although it stimulated the greening of the shipping operations, its effectiveness is considerably criticised from various shipping industry stakeholders. The aim of this study is to investigate the EEDI effectiveness on accurately representing the environmental performance of the next-generation ships power plants for two representative ship types, in specific, an ocean-going tanker and a cruise ship. The performance of the optimal power plant solutions identified in previous studies is analysed according to the existing EEDI regulatory framework and compared with the lifetime CO2 emissions estimated based on an actual operating profile for each ship. The results indicate that the EEDI underestimates the effect of technologies for reducing carbon emissions in all the investigated cases. In this respect, it is concluded that EEDI is classified as a conservative metric, which however can be used as an approximation to compare alternative solutions early in the design phase.

1. Introduction

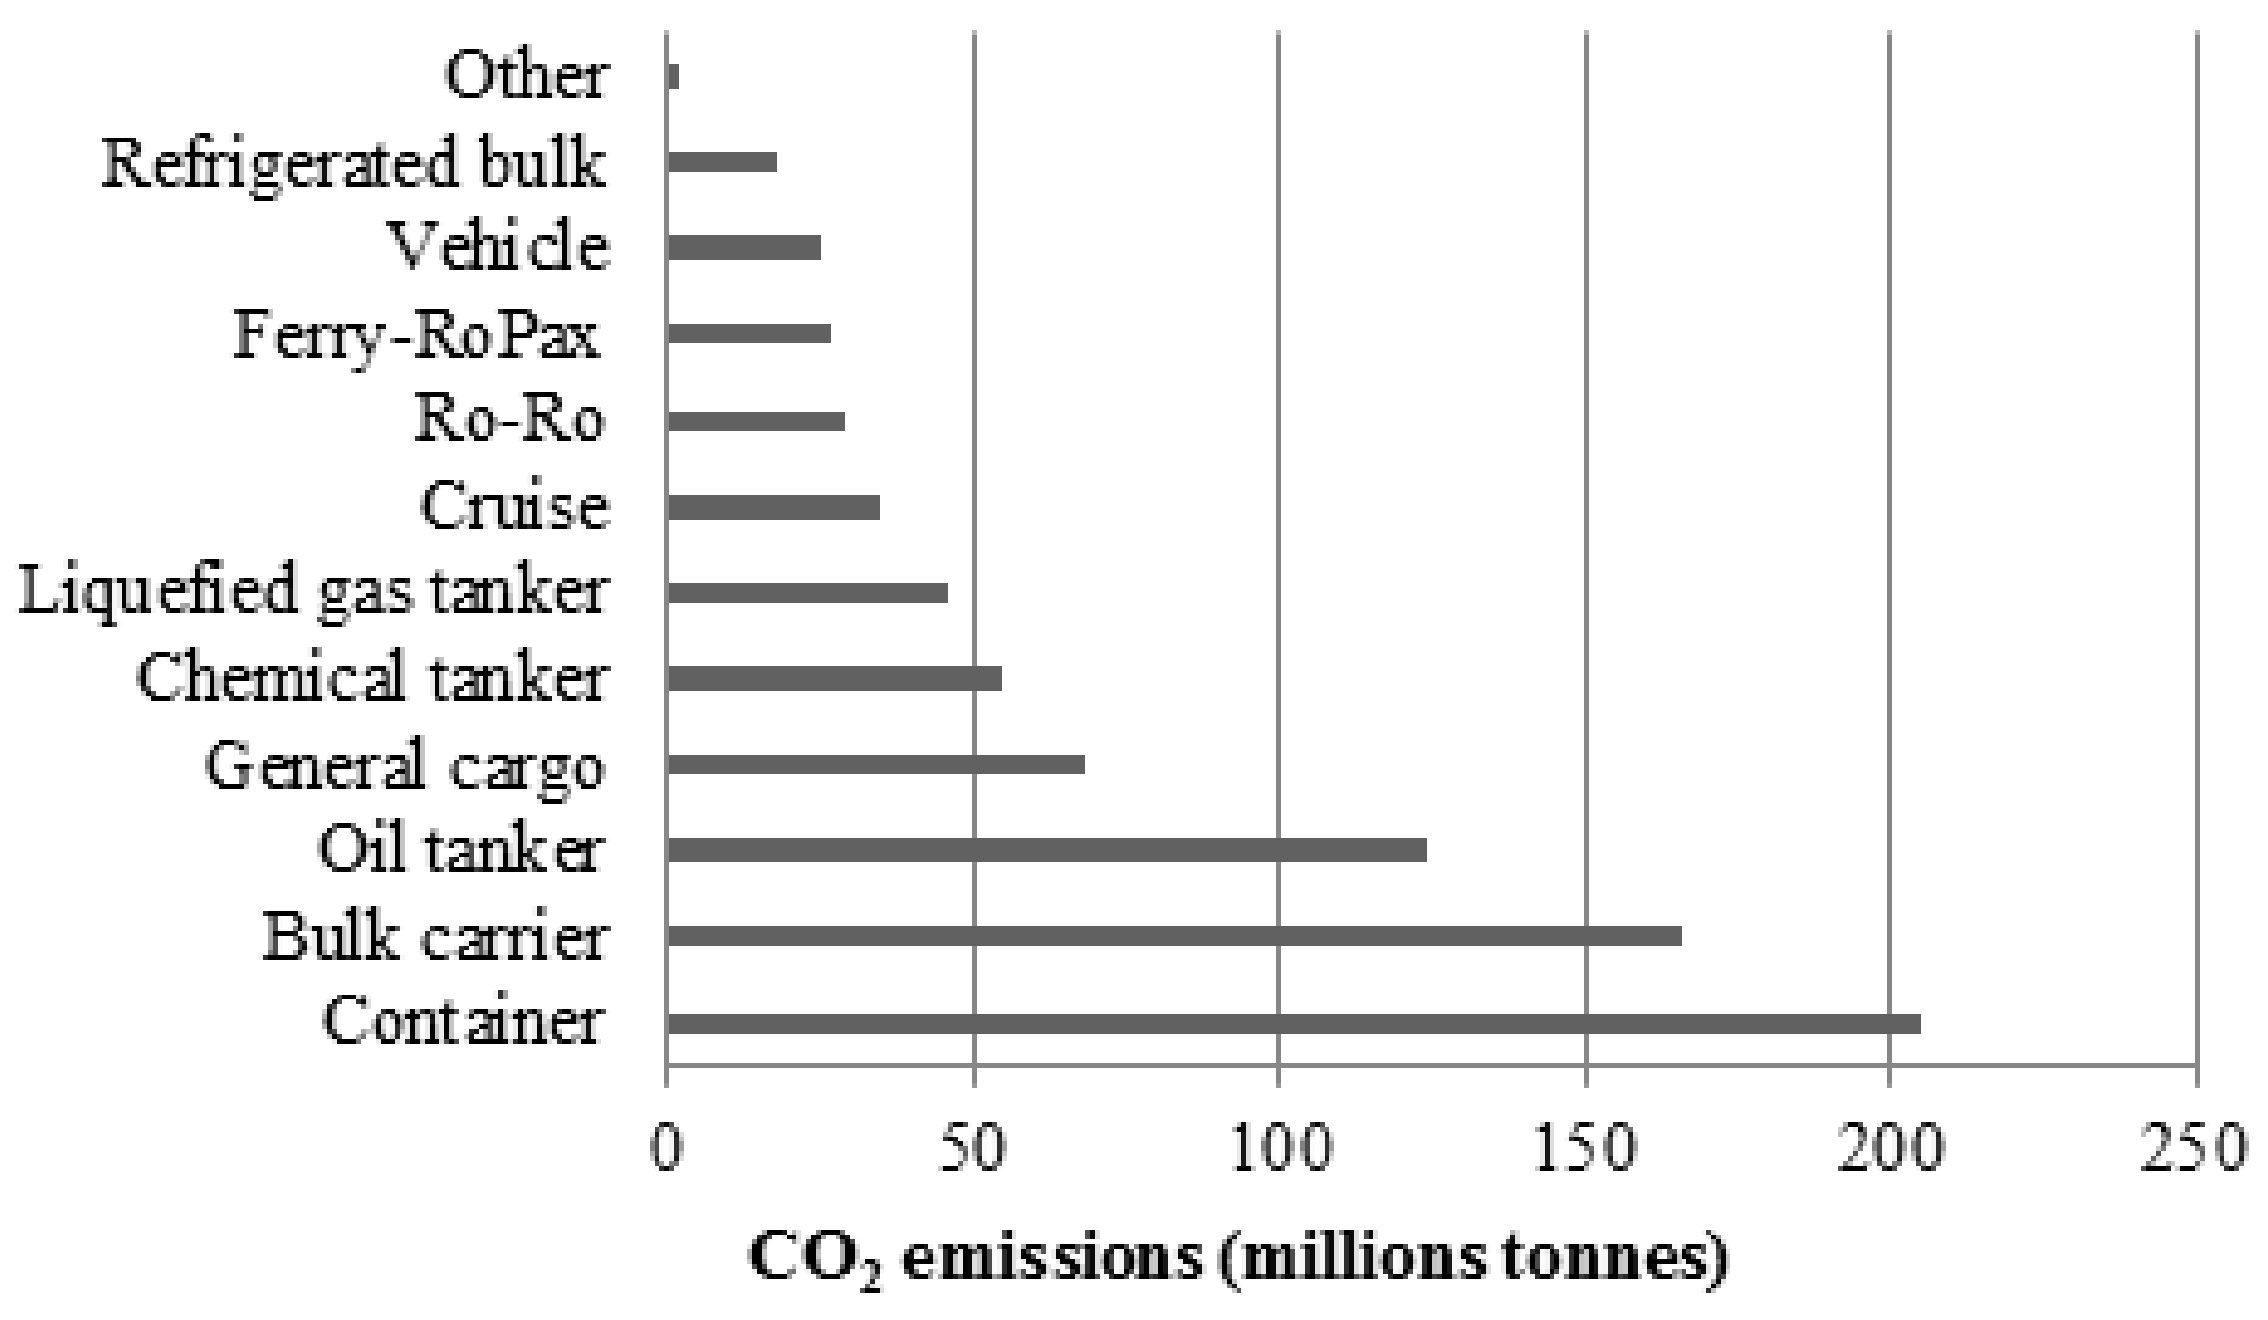
Global shipping has a great impact on global carbon emissions as it accounts for approximately 3% of the global CO2 emissions [1]. The shipping industry is responsible for almost 11% of the CO2 emissions from the transportation sector [2], which, in turn, contributed to around 29% of the global CO2 emissions in 2016 [3]. It is forecasted that the CO2 emissions from international shipping will experience a significant rise between 50% to 250% by 2050 [4], and it might reach 17% of the global emissions if no measures are taken [5]. A reduction of CO2 emissions around 90% is required from 2010 to 2050 [6] in order for the shipping industry to contribute to the global target of keeping the temperature increase below 2 °C. The International Maritime Organisation (IMO) Marine Environmental Protection Committee (MEPC), acknowledging the great contribution of the shipping sector to the global CO2 emissions, set a target to reduce the CO2 emissions from the shipping sector by 50% until 2050 [7].
For reducing the ships’ carbon emissions, regulations to improve the ship energy efficiency and reduce the Greenhouse Gas (GHG) emissions have been introduced, and further pressure to reduce the CO2 emissions is foreseen in the future. IMO introduced the first maritime energy efficiency regulation in 2011 [8], which is highly related to the reduction of CO2 emissions. All new ships have to comply with the Energy Efficiency Design Index (EEDI) [9], and all new and existing ships are required to have a Specific Ship Energy Efficiency Management Plan (SEEMP) [10]. In addition, a Monitoring, Reporting and Verification (MRV) system for CO2 emissions was introduced by the European Union [11].
The EEDI regulation is considered one of the most significant measures taken by the IMO in order to promote more environmentally friendly technologies that can improve the ships’ energy efficiency and carbon footprint. According to the EEDI limits, the carbon emissions per nautical mile and transported cargo unit need to be reduced by 30% until 2025 [12]. The existing and imminent EEDI targets can be achieved by improving the ship energy efficiency employing energy efficiency technologies, by reducing the hull resistance and by using renewable energy sources or low carbon content fuels. Other solutions to comply with the EEDI targets is to install engines with smaller power, which equivalently leads to the design speed reduction [13]. However, this may result in underpowered ships that might affect safety during navigation or adverse weather conditions [14].
The implementation of the EEDI in different ship types was investigated in a number of studies. A more realistic formulation of the EEDI that considers multiple operating points instead of a design speed was proposed and investigated for bulk carriers in [15]. The analysis of the EEDI formula for a Liquefied Natural Gas (LNG) carrier was presented in [16,17], concluding that the EEDI is inadequate to promote improvements on the LNG carriers design. The effect of the ship size on the EEDI was investigated for large container ships, and suggestions were provided for a more efficient EEDI implementation [18]. The EEDI was estimated for a Ro-Ro passenger ship, and it was identified that the use of renewable energy sources has a substantial impact on the carbon emissions, whereas minor changes were observed on the EEDI [19]. The reduction factors of the EEDI for bulk carriers were discussed in [20] for the forthcoming EEDI phases, concluding that the reduction factors imposed by the IMO are either rigid or lenient; instead, a ‘market self-regulation policy’ was proposed that would have a more positive impact on the ship energy efficiency.
As the ship machinery is the greatest contributor to carbon emissions, having a significant impact on ship energy efficiency, its selection is a critical decision to improve the ship carbon footprint [21]. Several researchers have looked into alternative ship machinery configurations and how these could affect the EEDI. Alternative power plant configurations for a research vessel were assessed by employing the EEDI, as well as various other indicators [22]. The analysis of the power plant configuration of a liquefied hydrogen tanker was performed considering economic, technical and environmental criteria, as well as the EEDI [23]. The energy efficiency of a passenger ship with a waste heat recovery system employing as criteria the EEDI was investigated in [24]. The techno-economic analysis and the calculated EEDI of alternative propulsion systems for Ferries and Ro-Ro ships were presented in [25]. The impact of solar energy technology on the EEDI was investigated in [26], where it was concluded that solar energy could address requirements of future EEDI phases. The compliance of a ROPAX vessel and a containership with the forthcoming EEDI phases was investigated in [27]. A cost-benefit analysis was performed in [12] for an Aframax tanker in order to propose alternatives that reduce the EEDI under realistic operating conditions.
In the existing literature, there is a variety of studies that investigated and evaluated the EEDI regulation effectiveness. The impact of the EEDI and SEEMP on the global carbon emissions was investigated in [28], and it was identified that despite the positive impact of the regulations to reduce the carbon emissions, it is not enough to reach the targets set. In [13], it was assessed whether the EEDI could support the 50% carbon emissions reduction target and concluded that more realistic operating conditions should be used when estimating the EEDI in order to reach the targets. A critical overview of the EEDI was performed in [14], and it was supported that the insufficient implementation of EEDI is highly based on political obstacles. The ineffectiveness of the EEDI compared to other life cycle assessment methods regarding the environmental impact of ships was reported in [29]. Other studies discussed problems associated with the EEDI implementation, especially on more complex ships [30,31]. Along these lines, a new methodology was introduced in [32] to overcome the hindrance of the EEDI applicability on complex integrated power systems of Ro-Ro ships.
In the existing literature, the effectiveness of the EEDI to improve the ship energy efficiency has been criticised, and amendments of the existing regulatory instrument have been proposed. It has been highlighted that the EEDI cannot capture the ship actual operation and promotes plants with lower installed power rather than technologies that reduce the carbon emissions. It has also been suggested that employing a life cycle indicator would be a more effective tool in order to reduce the shipping operations carbon footprint [29].
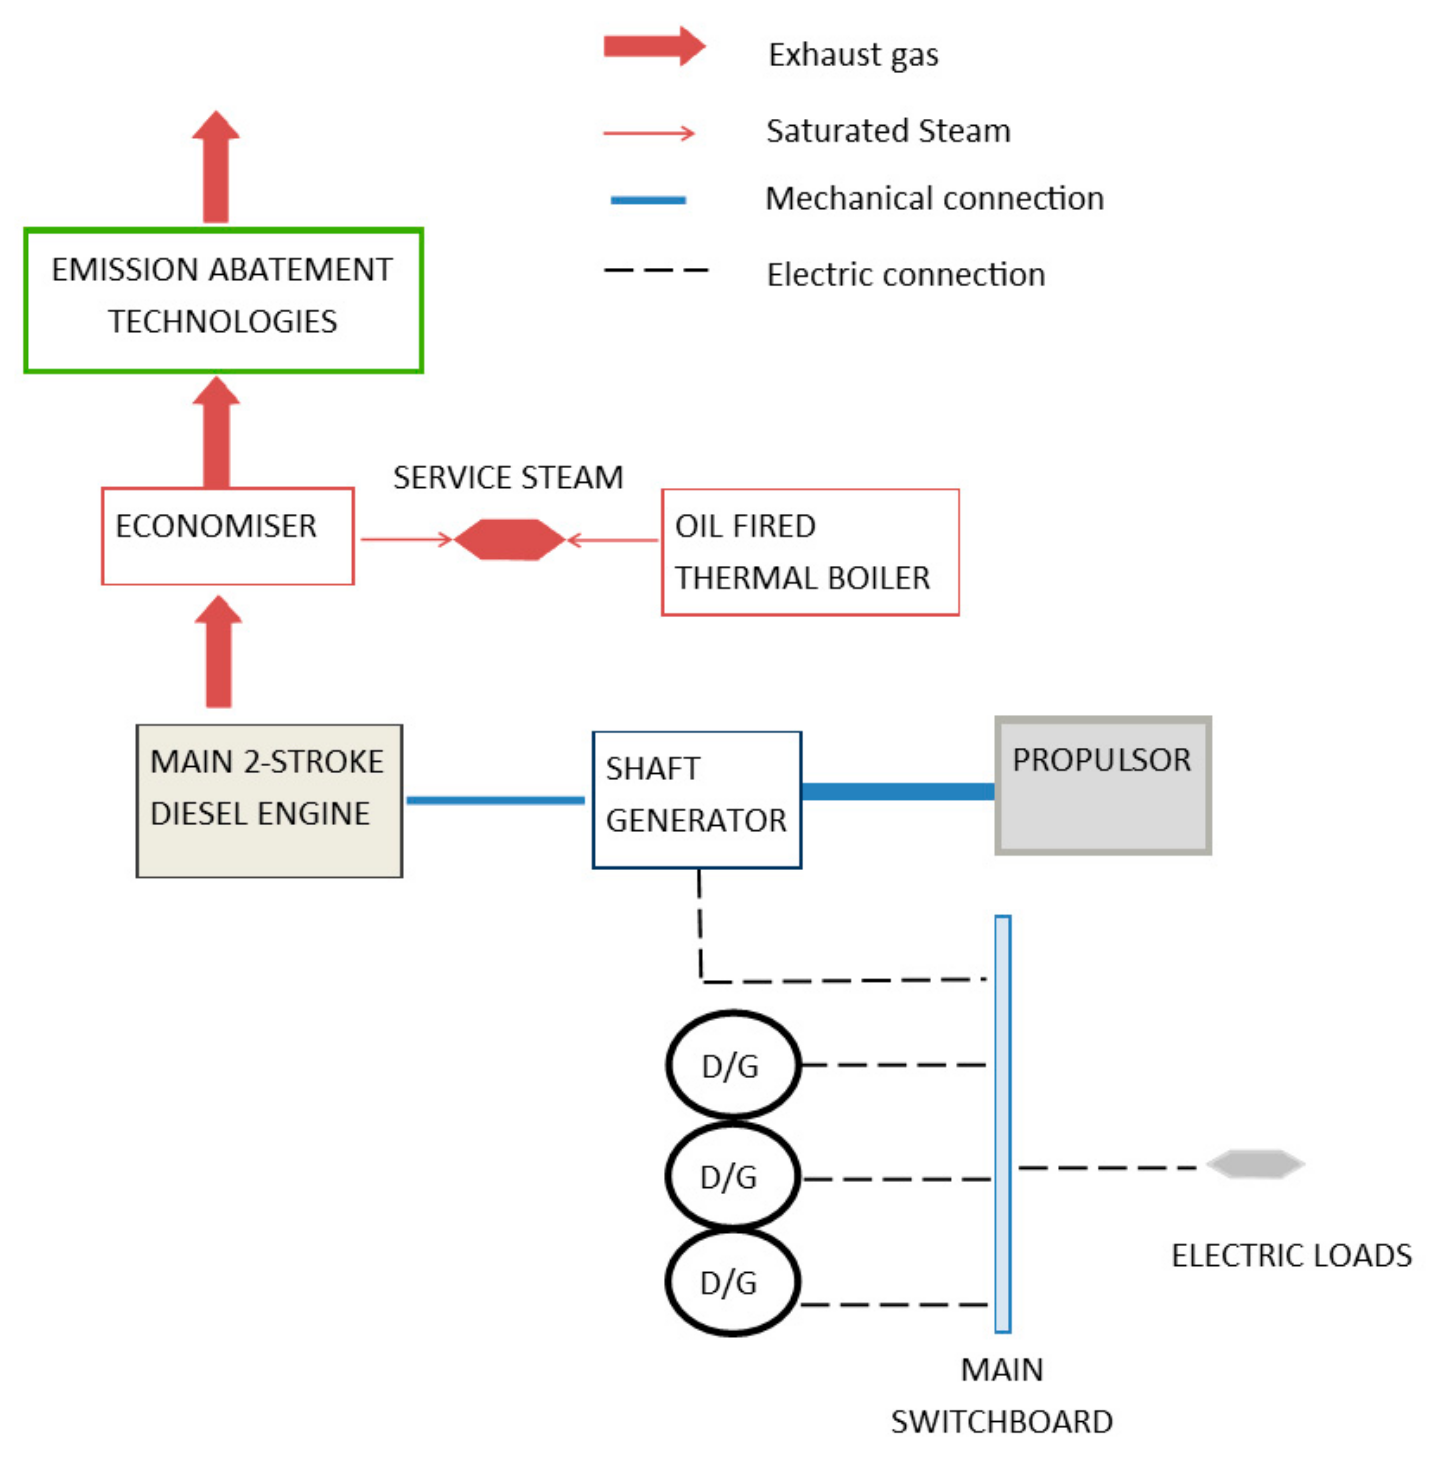
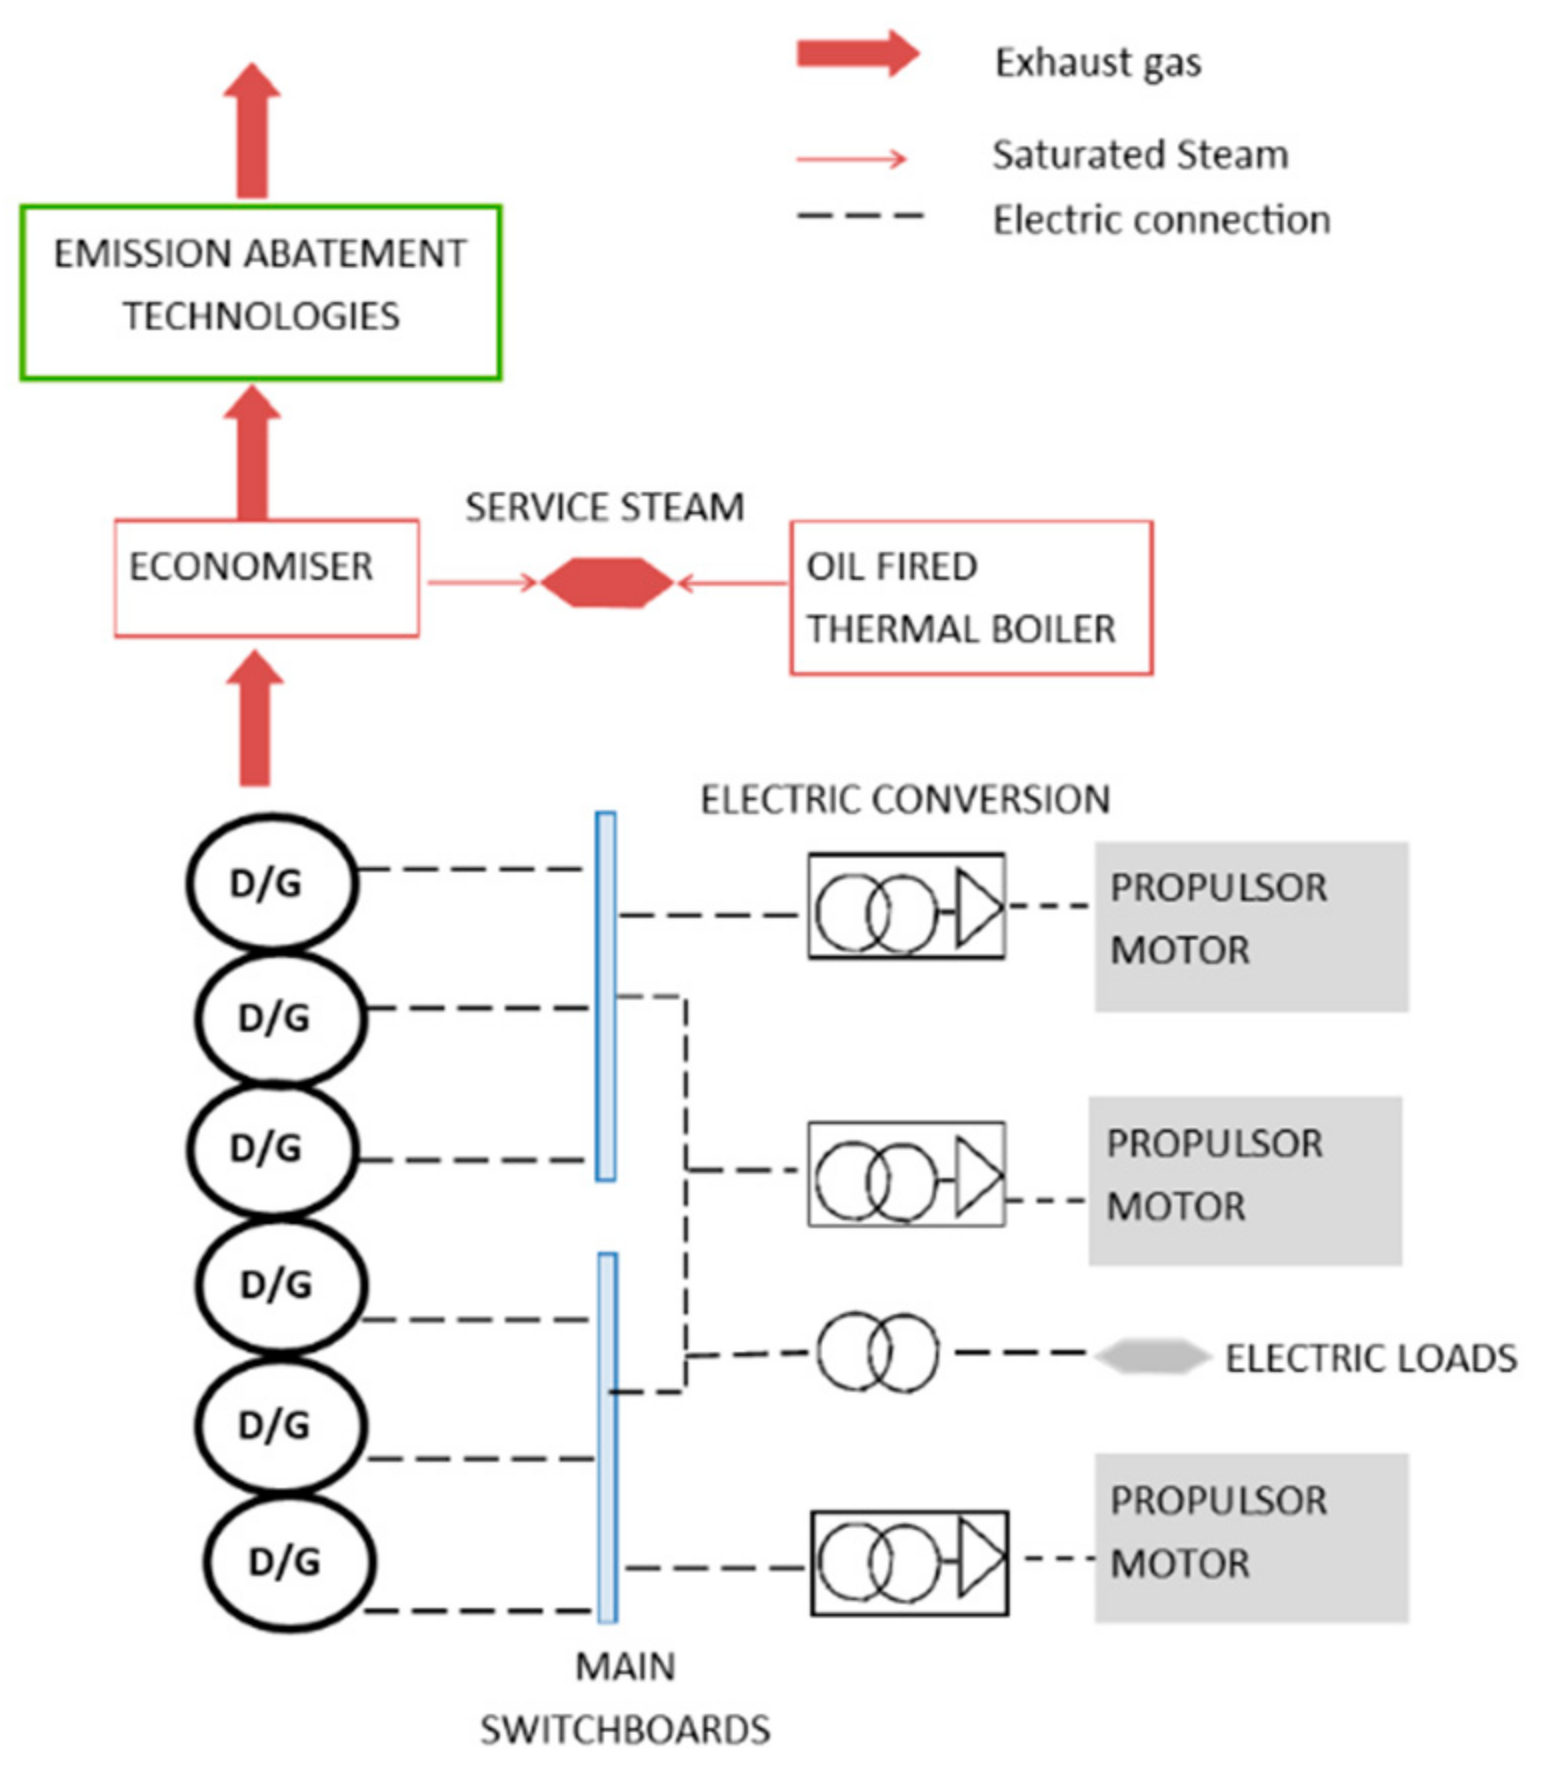
This study focused on the investigation of the EEDI effectiveness to accurately represent the environmental performance in comparison with the lifetime ships emissions. Two ships, an ocean-going tanker and a cruise ship, were selected, for which optimal configurations for the ships next-generation power plant designs are available from previous authors’ studies [33]. Based on this study results, the following points were discussed: (a) assess whether the EEDI is a realistic representation of the lifetime operational CO2 emissions; (b) identify the optimal ship configurations that can comply with the current and forthcoming EEDI targets; (c) investigate whether the current configurations for ships that form a great part of the global fleet will be able to comply with the future EEDI limits, and (d) evaluate the impact of emerging and traditional technologies on the EEDI.
The remaining of this article is structured as follows. The investigated ships and power plants are presented in Section 2. The method to calculate the EEDI and lifetime carbon emissions is described in Section 3. The optimal power plants of the two investigated ships are discussed in Section 4. The EEDI calculations for the considered power plant configurations of the two investigated ships and their comparison to the life cycle CO2 emissions are outlined in Section 5, along with the cost-benefit analysis of the proposed configurations. Finally, the findings of this study are analysed, and recommendations regarding the EEDI are provided in Section 6.

2. Investigated Ships and Power Plants

The ships investigated in this study were an Aframax tanker and a cruise ship. According to the information provided in Figure 1, which is taken from [34], the tankers emitted around 130 million tonnes of CO2 emissions in 2012, which renders them the third larger polluter among the global fleet, being responsible for 16% of the total CO2 emissions from ships. Although the bulk carriers and the container ships are the heaviest polluters, tankers were investigated in this study; tankers have more complicated power plants than bulk carriers and container ships due to the requirement to cover considerable thermal power demand.
On the other hand, even though the emissions from cruise ships are relatively low, the cruise ships environmental impact is very high compared to the other passenger transportations means. It is estimated that the cruise ships annual global fuel consumption is more than 30 million tonnes, constituting almost 10% of the ships overall annual consumption and leading to 96 million tonnes of CO2 emissions [35]. It is estimated that cruise ships have approximately 160 kg CO2 emissions per passenger per day [36], which corresponds to higher carbon emissions per passenger-kilometre than the economy class aviation [37]. In addition, cruise ships sail the majority of their time on coastal routes and spend more than 30% of their time in ports [38], which implies that they emit a significant amount of emissions in the coastal areas, leading to serious health problems for their inhabitants [39]. Finally, ferries and cruise ships have more complex configurations than the ocean-going ships due to the imposed safety and manoeuvering requirements.

2.1. Investigated Tanker Power Plants

The Aframax tanker ship characteristics and the baseline power plant configuration layout are presented in Table 1 and Figure 2, respectively. The alternative technologies that are considered for the ship power plant configurations are displayed in Table 2. In addition, the operating profile employed to assess the power plants lifetime performance is presented in Figure 3. The operating profile for the mechanical power was derived from existing data found in [40] and operational data for the thermal and electric demand from shipboard measurements.

2.2. Investigated Cruise Ship Power Plants

The investigated cruise ship characteristics are displayed in Table 3, whereas the baseline power plant configuration is presented in Figure 4. The technologies that are considered in the ship power plant layouts are displayed in Table 4, whereas the operating profiles employed to assess the power plants lifetime performance are shown in Figure 5. The profile was derived from operational data acquired from a cruise vessel for a period of five years.

2.3. Economic Parameters for the Investigated Technologies

The parameters considered for the cost-benefit analysis of the investigated configurations are presented in Table 5.

3. CO2 Emissions Calculations

3.1. EEDI Calculation

The EEDI estimated the CO2 emissions per transport work (g CO2/ tonne-mile) for newly built ships. A reference line was established for each ship type [9], which was produced by regression analysis of a large number of data primarily provided by IHS Fairplay [51]. The reference line EEDI was derived by employing the following equation:
EEDIref = a b−c
where the parameters a and c depend on the ship type; b represents the ship deadweight (DWT) or gross tonnage (GT). These parameters for tankers and cruise ships are provided in Table 6. For reducing the future ships carbon footprint, three phases with stricter limits were introduced [9] by employing the reduction factor X, the values of which are reported in Table 7. The required EEDI value for any newly built ship was calculated by using the reference EEDI (Equation 1) and the reduction factor, according to the following equation:
E E D I r e q = 1 X 100   E E D I r e f
For complying with the IMO regulations, the newly built ships needed to have an attained EEDI less than the required EEDI:
E E D I a t t a i n e d   E E D I r e q
The EEDI attained value for no ice-class ships was calculated according to Equation (4).
E E D I a t t a i n e d = ( P M E   C M E S F O C M E + P A E   C A E S F O C A E f e f f   P A E e f f C A E S F O C A E ) 1 f c c C a p a c i t y   V r e f
where:
PAEeff [kW]auxiliary power reduction due to the waste heat recovery
PME [kW] 0.75   P M E ,   M C R P P T O ; main engine power
PME [kW]main engine power at maximum continuous rating (MCR)
PPTO [kW]nominal power of the shaft generator (if installed)
PAE [kW] 0.025   P M E ,   M C R + 250 + P c c   ; auxiliary engines power
PCC [kW]power penalty due to the carbon capture system operation
Vref [kn]nominal ship speed
feff [−]equals 1 if a waste heat recovery system is installed
fcc [−]carbon capture system [52] and CO2 reduction potential (it is restricted by the constraint on the ship available capacity for the CO2 chemicals and carbon by-products)
C [g CO2/g fuel]carbon conversion coefficient (for dual-fuel engines, both the pilot fuel and the main gas fuel are considered)
Capacity [t]DWT for tanker and GT for the cruise ship
SFOC [g/kWh]specific fuel oil consumption at the design point (in case there is a dual fuel engine, both the pilot fuel and the natural gas need to be accounted for)
In the case of cruise ships with an electric propulsion system, the following equation was adapted for calculating the attained EEDI [53]:
E E D I a t t a i n e d = ( P A E + P P T I )   C A E S F O C A E f e f f   P A E e f f C A E S F O C A E 1 f c c C a p a c i t y   V r e f
PPTI [kW]
75% of the rated power of the installed shaft motors divided by the efficiency of the electric generator (taken as 0.95) and the propulsion drive efficiency (taken as 0.92).

3.2. Lifetime CO2 Emissions Calculation

The lifetime CO2 emissions (ECO2) from the power plant systems were calculated for all the ship energy systems (s), including the main engine, generators, and thermal boilers, according to the following equation:
E C O 2 = s   E F C O 2   f c s
where EFCO2 denotes the CO2 emissions factor in g CO2/g fuel that depends on the fuel type, and fcs is the fuel consumption.
The fuel consumption of each system i was estimated by employing the following equation:
f c i = H j   F o O j   P j f   S F O C f , j
where H denotes lifetime operating hours; FoOj is the frequency of occurrence of each operating point j; Pj is the power at the operating point j; SFOCf,j is the specific fuel consumption of each fuel f at the operating point j.
The lifetime CH4 emissions (ECH4) from the power plant systems were calculated for all the ship energy systems (s), including the main engine and the generator sets, according to the following equation:
E C H 4 = H j s   F o O j   P j , s   E F C H 4
where EFCH4 denotes the CH4 emissions factor in g CH4/kWh that depends on the dual-fuel engine type. The methane emissions (methane slip) was assumed to be 0.2 g/kWh of the Dual Fuel (DF) direct gas injection engines [54] and 4 g/kWh for the DF pre-mixed [17,55]. It was assumed that the thermal boilers operating with natural gas exhibited zero methane emissions. In addition, the methane release due to leakages in the ship fuel storage and feeding systems were not taken into account.
By considering that the equivalent carbon emissions were 25 times the methane emissions [56], the equivalent lifetime CO2 emissions were calculated according to the following equation:
E C O 2 e =   E C H O 2 + 25   E C H 4
The emission factors used to estimate the lifetime carbon emissions are displayed in Table 8.

3.3. Cost-Benefit Analysis

The cost-benefit analysis of the various investigated power plant solutions was based on the ratio of the cost difference and the CO2 emissions difference (from the ones of the baseline solution), according to the following equation:
C B = Δ C Δ E = C s o l C b a s E s o l E b a s
where the nominator represents the life cycle cost difference between the investigated solution and the baseline, whereas the denominator is the lifetime equivalent CO2 emissions difference between the solution and the baseline. The results from the cost-benefit analysis can be negative when the solutions life cycle cost or emissions are less than the baseline, whereas they can be positive when both differences are negative or positive.

4. Optimal Ships Power Plants

This section presents the power plant configurations along with their characteristics for the two investigated vessels. These configurations were taken from the authors’ previous studies and represent solutions that could comply with the current regulatory framework for CO2, SOx, and NOx emissions.

4.1. Optimal Tanker Power Plants

The alternative power plant configurations characteristics for the investigated tanker were taken from [33]. Marine two-stroke engines that directly drive the ship propeller were considered for all the configurations combined with after-treatment systems (exhaust gas scrubber, selective catalytic reaction system, and carbon capture system), and energy efficiency increased technologies (waste heat recovery system and shaft generator). These configurations were derived by employing a multi-objective evolutionary optimisation algorithm with the lifetime of NOx, SOx, and CO2 emissions, as well as the life cycle cost as objectives. Each objective was considered separately; hence, there was not a single solution that manages to simultaneously optimise all the objectives. These solutions, along with the baseline (existing power plant of the investigated tanker) configuration characteristics, are presented in Table 9. In total, 13 configurations were identified. These solutions presented in Table 9 were ranked in ascending order from lower to greater CO2 emissions (the solution No. 1 exhibited the lowest CO2 emissions).
It could be inferred from Table 9 results that the two-stroke dual-fuel engine operating in natural gas was the dominant prime mover for the investigated Aframax tanker among the solutions identified. In addition, the prevailing technology for covering the thermal power demand is the gas-fired boiler, whereas the alternatives operating with natural gas are the dominant solutions for the electric auxiliary machinery (although there are few cases where diesel generator sets are selected). Generally, it is inferred that gas operating energy systems are highly preferred in the identified power plant configurations. The optimisation method description, as well as a detailed analysis of the identified optimal solutions characteristics and performance, are delineated in [33].

4.2. Optimal Cruise Ship Power Plants

The alternative power plant configurations for the investigated cruise ship were taken from [41]. The power plant is of the electric type with electric motors driving the ship propulsors; hence, generator sets driven by reciprocating engines or fuel cells are used for covering the ship electric power demand. These configurations characteristics, as well as the baseline (existing power plant for the investigated cruise ship) configuration characteristics, are shown in Table 10. The configurations were derived by employing optimisation with the lifetime CO2 emissions and life cycle cost as objectives. The solutions presented in Table 10 were ranked according to their lifetime CO2 emissions with the No. 1 configuration exhibiting the lowest CO2 emissions.
It could be inferred from the presented results that the technologies that are most prominent to mitigate the CO2 emissions whilst reducing the life cycle cost are the technologies operating with natural gas compared to the baseline configuration that consists of systems operating with heavy fuel oil (HFO). It was identified that the most dominant technology for the electric power generation that improved both the environmental and economic performance of the ship energy systems was the dual fuel generator sets operating with natural gas or a combination of dual fuel generators and fuel cells. The carbon capture technology was selected in the majority of the solutions along with the waste heat recovery in order to improve the carbon footprint of the cruise ship energy systems. A detailed discussion of these configurations characteristics can be found in [41].

5. Results and Discussion

In this section, the calculated EEDI values of the considered power plant configurations of the two investigated ships were compared with the estimated lifetime CO2 emissions. The compliance of each ship baseline (existing) power plant configuration to the forthcoming phases of EEDI was also examined.

5.1. Tanker Ship

The results of the EEDI for the solutions of Table 9 were compared with the lifetime CO2 emissions. The EEDI reference value for phase 0 for an Aframax tanker was estimated, as it was indicated in the previous section.
The reference value for phase 1 until 2019, for Phase 2 until 2024 and for Phase 3 from 2025 and onwards was estimated according to the regulations [51] and presented in Table 11. It was noted that these values corresponded to newly built ships.
The EEDI was estimated for each solution identified through the optimisation according to the IMO guidelines [9], as it was presented in Section 3. The carbon capture was also considered in the calculation of the EEDI since it was directly related to the CO2 emissions.
The attained EEDI for each optimal solution presented in Table 9 is displayed and compared with the lifetime CO2 emissions in Table 12. The solutions were ranked according to the EEDI values in ascending order. In addition, the last two columns present the percentage difference of the EEDI and lifetime emissions from the EEDI values and the lifetime carbon emissions of the current configuration. The respective values for the current configuration for the EEDI value and for the lifetime carbon emissions are also displayed in Table 12.
It is evident from Table 12 that all the solutions complied with the EEDI phase 1 and 2, and, as a result, they were considered green alternative configurations according to the imposed IMO EEDI regulation until 2019. However, not all solutions could comply with the EEDI phase 3 value; in specific, solution 11 was marginally above the reference value. Therefore, it is evident that after 2024, there are configurations derived from the optimisation that cannot comply with the EEDI phase 3.
Table 13 presents the calculated lifetime methane emissions along with the corresponding equivalent CO2 emissions and the total equivalent CO2 emissions for each investigated configuration of the Aframax tanker. The EEDI could not be compared with the equivalent CO2 emissions since it does not consider methane emissions. It could be inferred from these results that the methane emissions in CO2 equivalent were relatively low for the configurations that did not include premixed combustion DF engines (3, 2, 4, 1, 9, 10, and 8). In these cases, the total equivalent CO2 emissions were almost the same with the lifetime CO2 emissions presented in Table 12. The total CO2e emissions were increased (in comparison with the lifetime CO2 emissions presented in Table 12) for the configurations that included premixed DF engines (7, 13, 5, 12, 6, and 22) due to the considerable lifetime methane emissions in these cases.
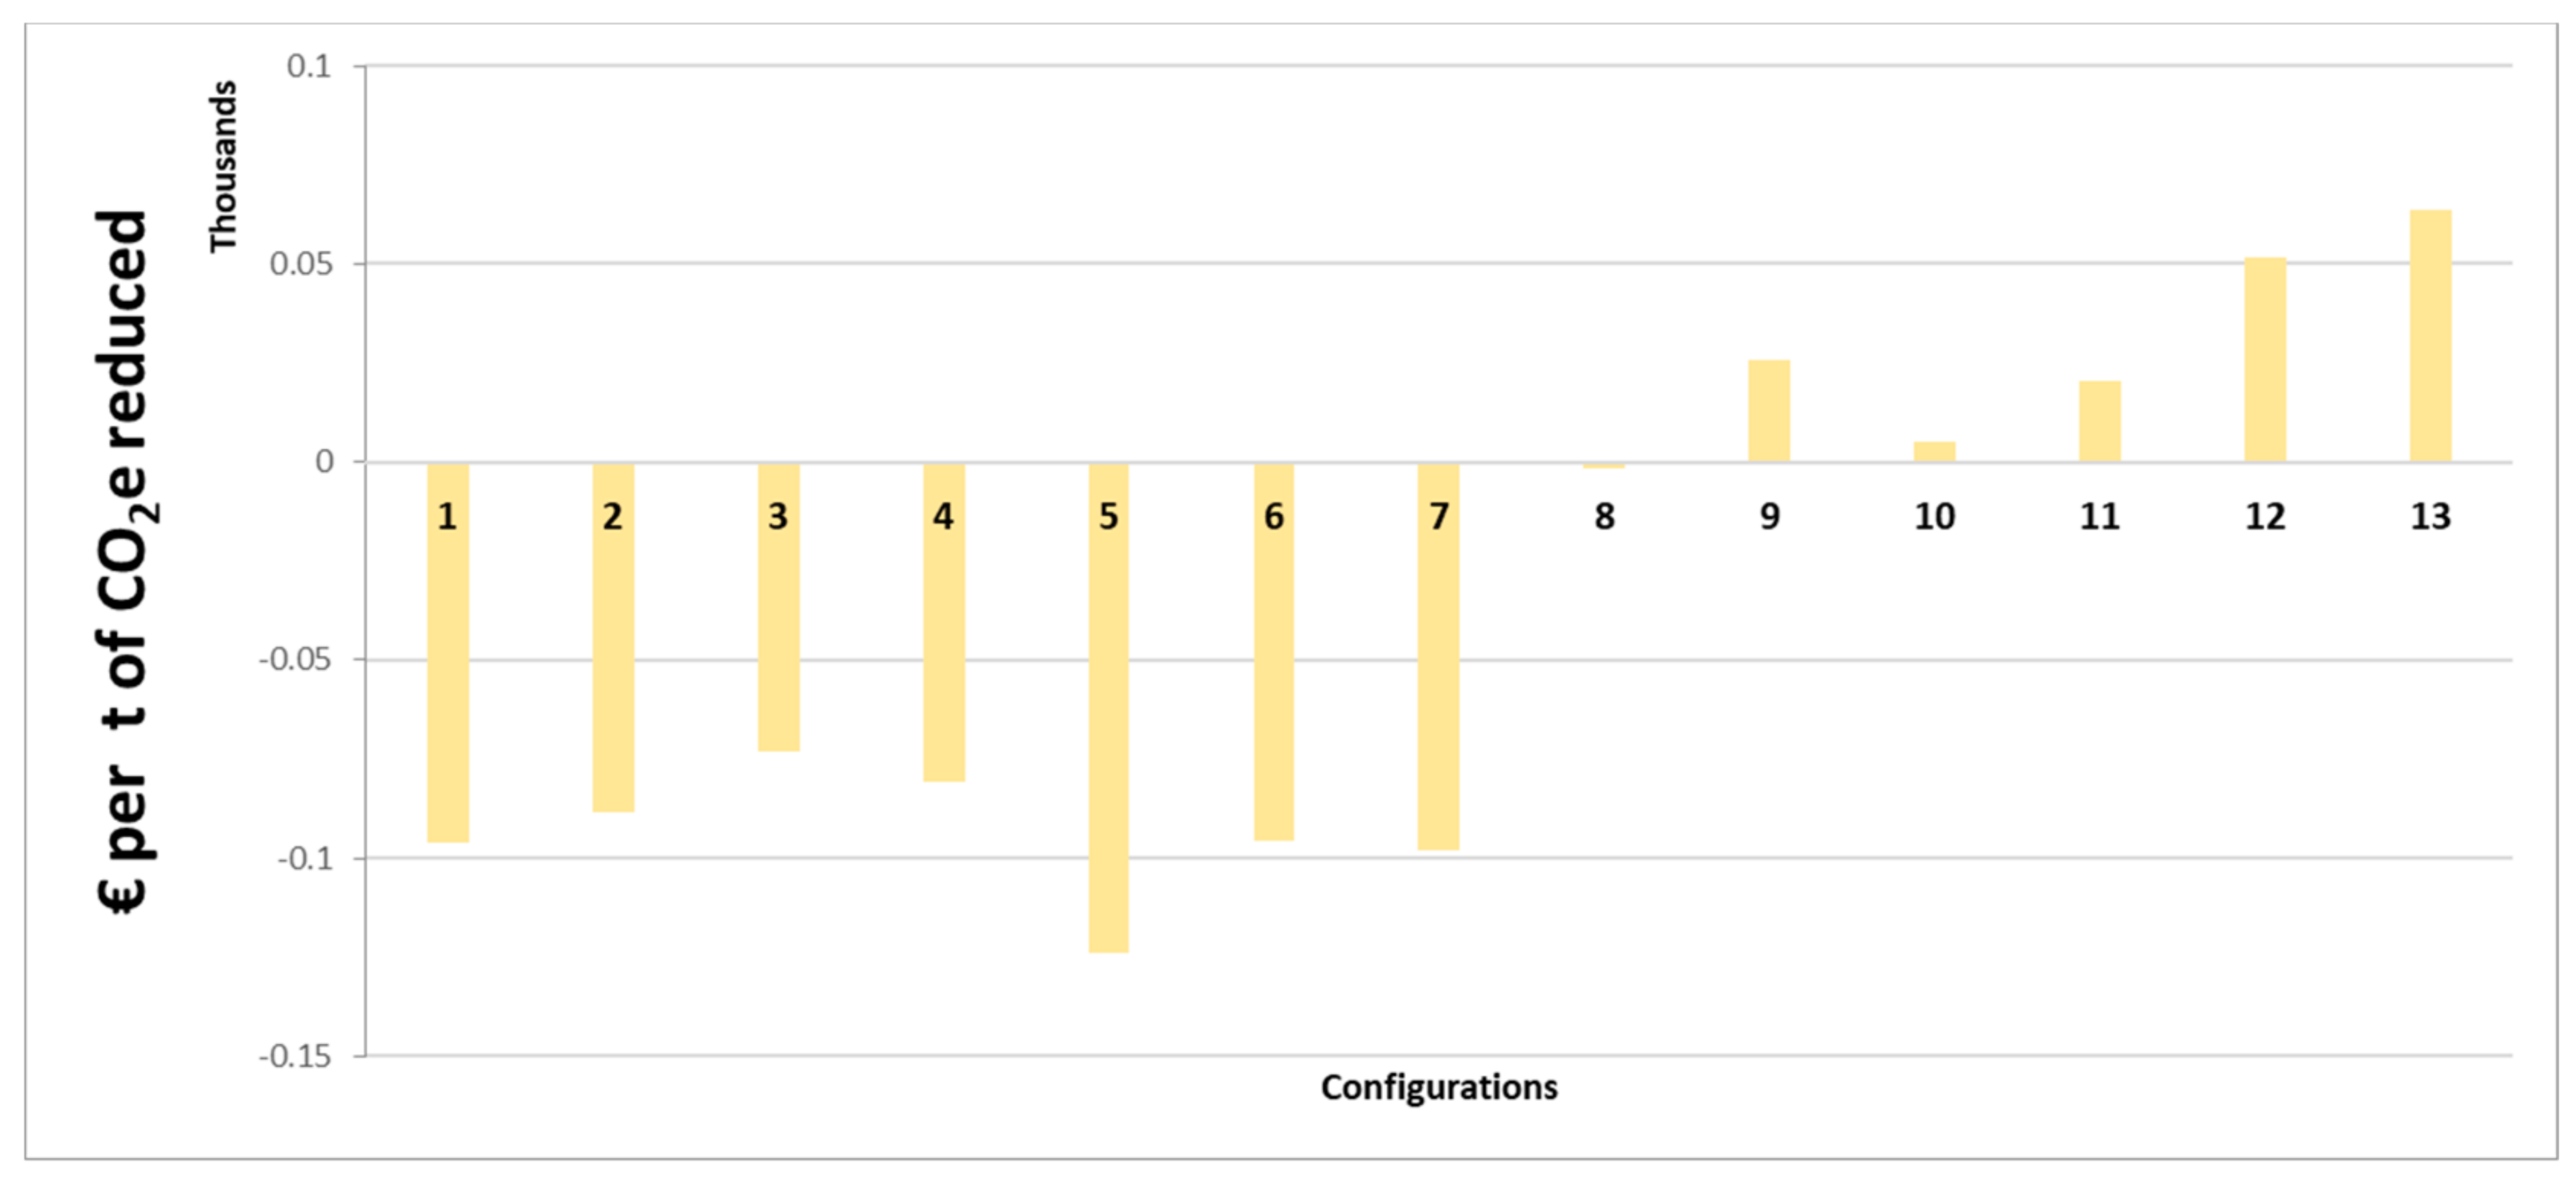
The cost-benefit analysis results (cost difference from the baseline over equivalent CO2 emissions from the baseline) are presented in Figure 6. It was observed from this figure that the cost difference of reducing the CO2e emissions for the configurations 9–13 was positive. As it was discussed previously, this was due to the fact that the life cycle cost of these configurations was less than the baseline life cycle cost due to the lowest price of the natural gas compared to the HFO, as well as the emissions of the solutions were less than the baseline.
From the results presented in Table 12, it was evident that the EEDI and the lifetime CO2 emissions indicated different solutions as optimal and worst-performing. According to the EEDI regulation, the greener alternatives belonged to solutions 3, 2 and 4; however, the lifetime CO2 emissions indicated that the solutions, which had the lowest carbon footprint, belonged to the clusters 1, 2 and 3. According to the cost-benefit analysis results, the configuration 1 seemed to have a high cost, whereas it was a very interesting solution when considering the lifetime CO2 emissions, a fact that was not reflected equally to the EEDI values. However, among the solutions 3, 2 and 4 that had a good performance both according to the lifetime carbon emissions and the EEDI, the solution that had the most benefit with the less cost was the solution 3.
On the other hand, the solutions 11, 6 and 8 exhibited the higher EEDI values, whereas, the solutions 13, 12 and 11 exhibited the greater lifetime CO2 emissions. The cost-benefit analysis indicated that the three worst-performing solutions according to the lifetime carbon emissions exhibited a lower life cycle cost compared to the baseline, and therefore were more cost-efficient. On the other hand, two of the worst-performing solutions with the EEDI (6 and 8) criterion hade a higher cost than the baseline. Therefore, in terms of worst-performing configurations, the EEDI provided a very different view than when considering lifetime emissions.
A significant deviation was also observed for the values of the percentage difference from the baseline for the EEDI and the lifetime carbon emissions for specific configurations. From the configuration 3, it was identified that its performance regarding the EEDI was improved 30% from the baseline, whereas for the equivalent carbon emissions, it was 54%. Therefore, even though the lifetime CO2 emissions were reduced by half compared to the current configuration, the EEDI demonstrated a much lower improvement that did not reflect the real emissions reduction. Another observation when comparing the solutions 13 and 7 was that their EEDI values had only a 1% difference, whereas their lifetime carbon emissions exhibited a difference of 18%. Furthermore, it was evident that the solution 11 had a minor improvement compared to the baseline regarding the EEDI, only 9%, whereas its lifetime CO2 emissions reduced 35% compared to the baseline configuration. This misalignment, among others, was based on the fact that the lifetime CO2 emissions considered also the emissions derived from the thermal boiler, whereas the EEDI included only the main and electric auxiliary engines. However, for ships like tankers, the thermal requirements were high, and therefore the thermal boiler’s emissions had a significant impact on the ship carbon footprint.
The results derived from the EEDI regulation investigation indicated that after 2024, there are some solutions derived from the optimisation that cannot comply with the reference value of EEDI for phase 3. In addition, the baseline configuration will not be able to comply with the future EEDI phases, which demonstrated the imminent need for greener technologies development. In addition, there was a misalignment with the estimations of the lifetime carbon emissions and the EEDI for all the investigated solutions. The EEDI underestimated the effect of the optimal configurations proposed to reduce CO2 emissions. This was due to the fact that it is highly dependent on the nominal power of the installed engine [27], as well as it is estimated according to design speed, and not the real ship operation. However, the real mitigation of the emissions was highly dependent on the type of technologies and the ship operating profile. From the preceding analysis, it could be inferred that the EEDI did not manage to capture the real carbon impact of the Aframax tanker ship energy systems, and, as a result, as a policy, it could not have a significant impact on improving the carbon footprint of the tanker ship energy systems. Furthermore, it could be inferred considering the presented results that EEDI seemed to be a conservative measure as it underestimated the real CO2 emissions reduction, which however could be used as a first approximation of comparing the ship performance at the design phase.

5.2. Cruise Ship

The EEDI reference values for the investigated cruise ship power plant configurations were estimated according to Section 2. The reference values for phase 1 (till 2019), for phase 2 (2020–2024) and phase 3 (2025 onwards) were estimated according to the regulations [51] and presented in Table 14.
The EEDI was estimated for each optimal configuration for non-conventional propulsion systems; in addition, the carbon capture was included in the calculation of the EEDI since it is directly related to the CO2 emissions. The derived EEDI values, along with the lifetime CO2 emissions of the investigated solutions, are displayed in Table 15. The solutions were ranked according to the EEDI values in ascending order. The EEDI and the lifetime carbon emissions for the baseline configuration are also presented in Table 15. The percentage difference of the EEDI and lifetime CO2 emissions of each solution from the baseline configuration is displayed in the last two columns of this table. The results indicated that the baseline configuration complied only with phase 1, and in order to attain phases 2 and 3, a different solution was required.
Table 15 shows that all the investigated solutions complied with the three EEDI phases. As a result, they were considered green alternatives according to the imposed EEDI regulations. The estimated EEDI and lifetime carbon emissions values concluded on the same ranking for the investigated configurations. Therefore, both indicators were aligned with regards to the investigated configurations potential to reduce the carbon footprint of the ship power plant.
However, differences were observed for the values of the solutions of the percentage difference from the current configuration of the EEDI and the lifetime carbon emissions. The percentage improvement of solution 1 from the current configuration according to the EEDI was 45%, whereas, for the lifetime emissions, it was 75%. Generally, the EEDI range of improvement from the current configuration was underestimating the lifetime carbon emissions reductions that could be achieved, therefore not being a good proxy for the actual carbon emissions reduction. Similarly, with the tanker, the fact that the carbon emissions from the thermal boiler are not included in the estimations of the EEDI had an important role in this misalignment. Therefore, even though the lifetime emissions were reduced significantly, the EEDI indicated a much lower improvement and, as a result, did not manage to accurately capture the carbon reduction benefits of using advanced configurations.
In addition, the lifetime methane emissions along with the corresponding equivalent CO2 emissions and total lifetime equivalent CO2 emissions for the investigated configurations are displayed in Table 16. It was evident that methane emissions CO2e were much lower than the CO2 emissions. However, compared to the tanker, the methane carbon equivalent emissions had a greater contribution to the overall carbon equivalent emissions. Therefore, the estimated percentage difference from the baseline configuration of CO2e emissions in some cases was more than 16%. This was due to the fact that pre-mixed dual fuel generators were considered for the cruise ship that exhibited a higher methane slip.
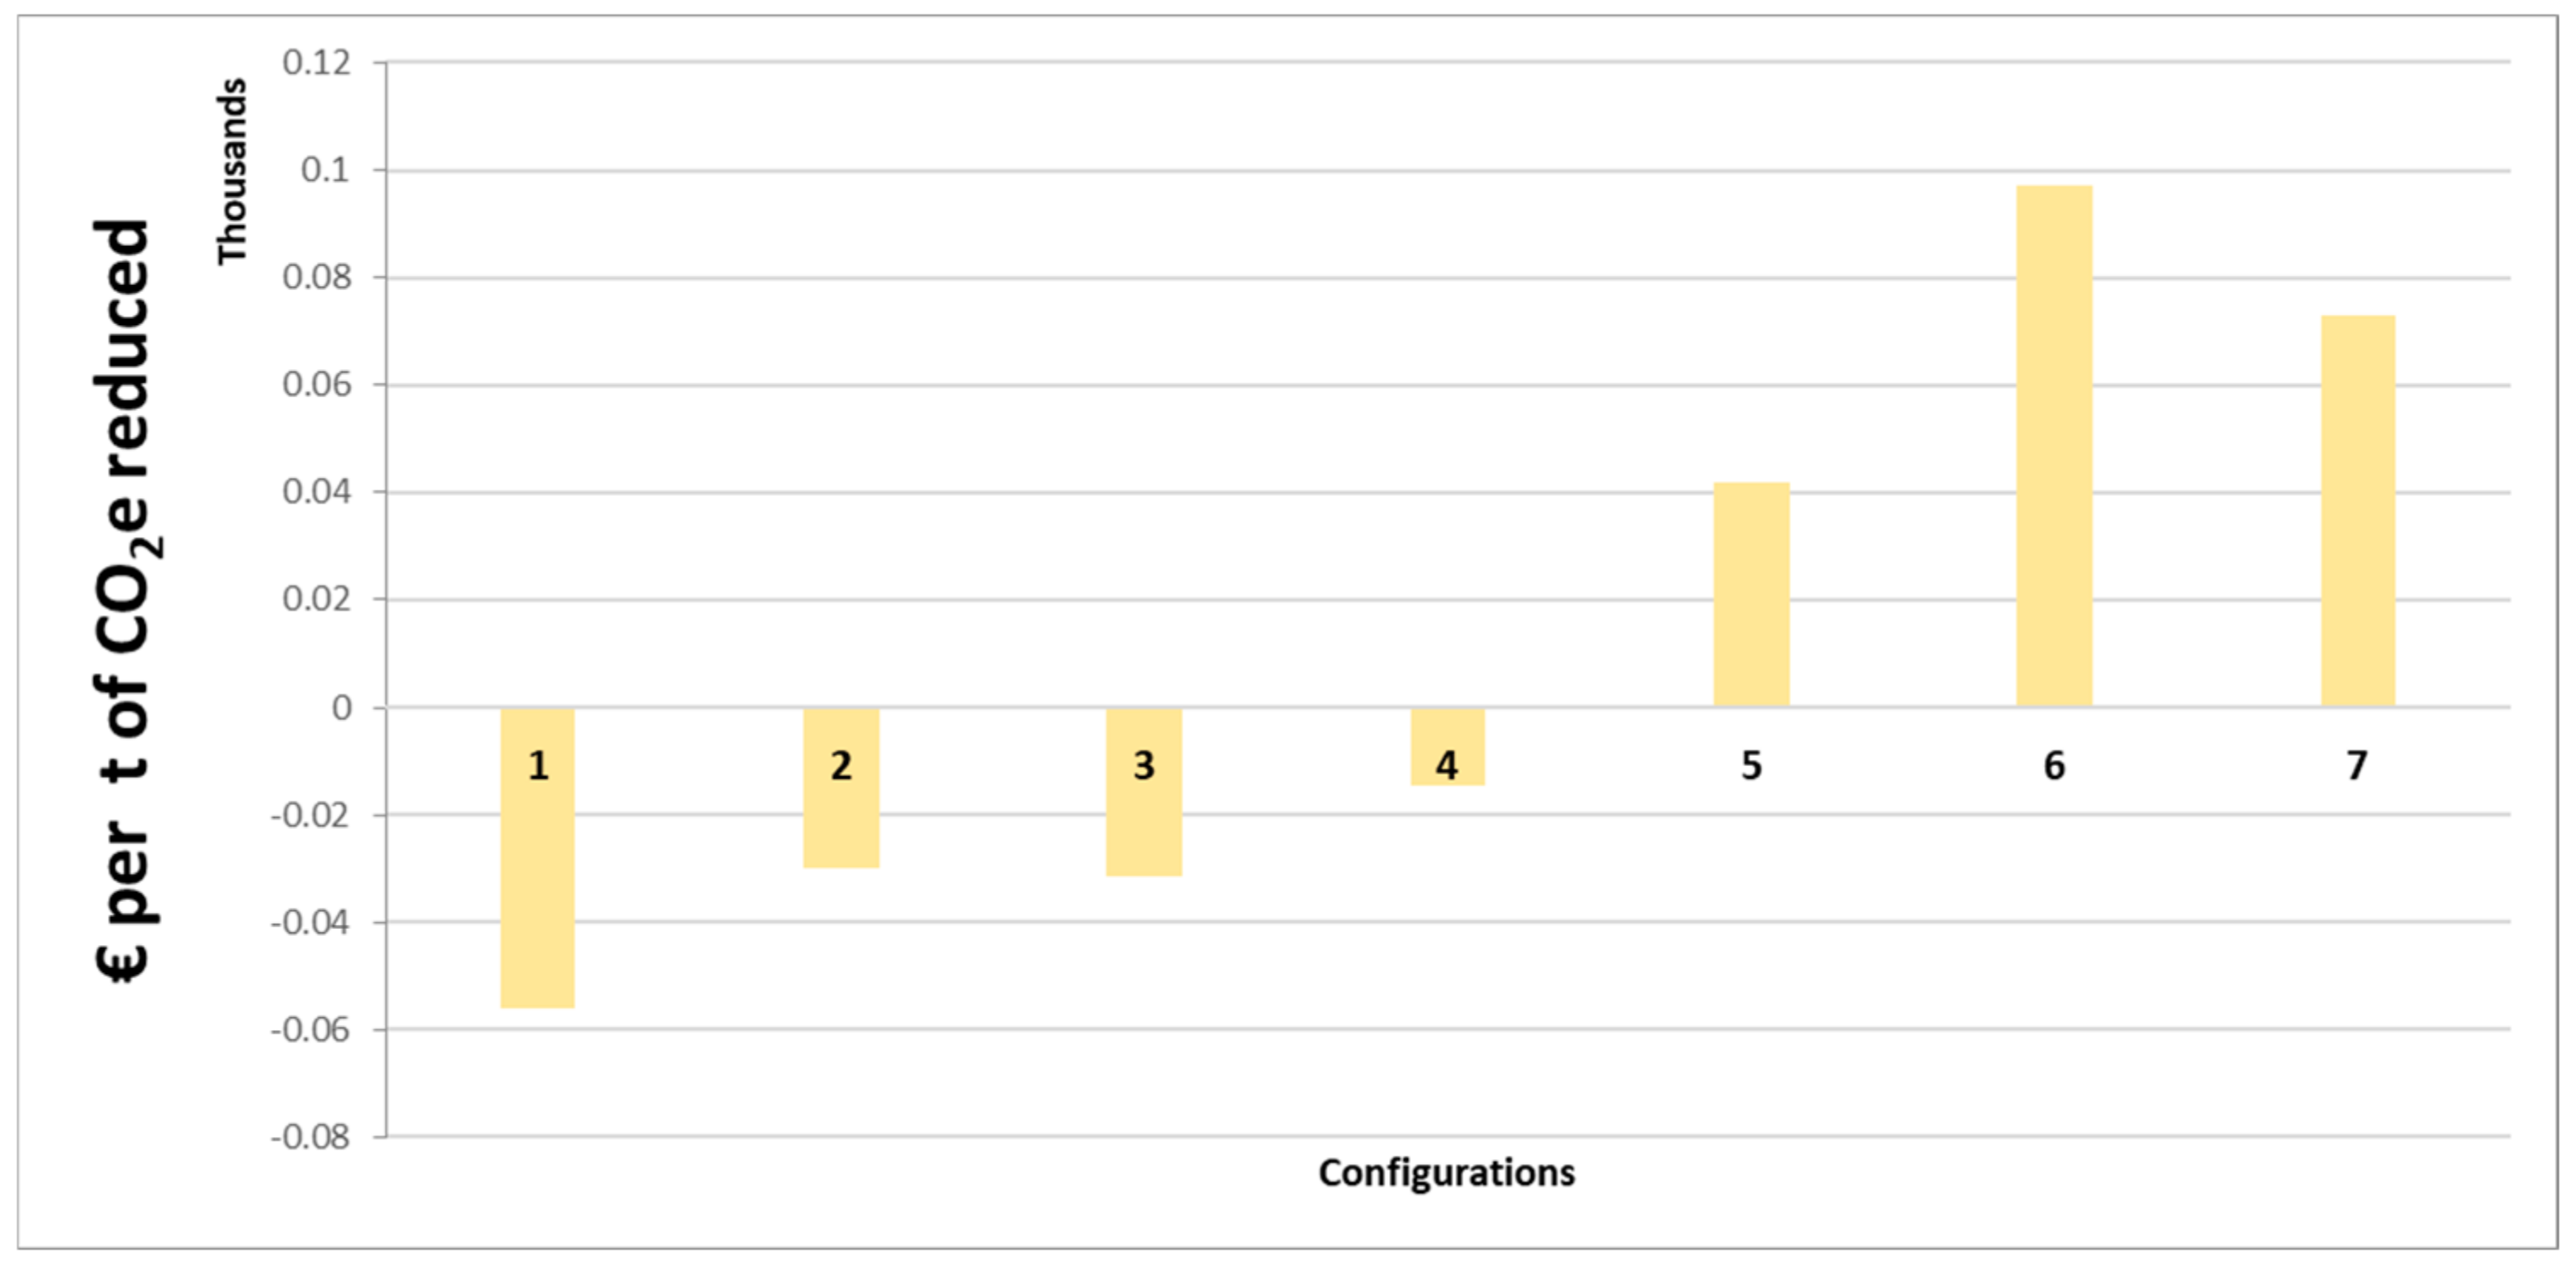
The cost-benefit analysis results for the investigated configurations are displayed in Figure 7. The results of the cost-benefit analysis in addition to the results from Table 16 indicated that solution 1 had the lowest carbon emissions and the highest life cycle cost. This solution had the lowest carbon emissions according to Table 16, and since the ratio was negative, it could be inferred that the life cycle cost of the solution was higher than the baseline. Therefore, according to the figure, it was evident that it had the highest cost for the emissions reduced. On the other hand, the solutions 5, 6 and 7 had a positive ration due to the fact that the life cycle cost of the solutions was lower than the baseline, due to the lower price of the natural gas.
It was inferred that the baseline configuration complied only with phase 1 of the EEDI regulations; thus, new greener alternatives need to be identified in future ship designs. The configurations proposed in this study managed to comply with all the EEDI phases. It was evident from the presented results that the EEDI was highly affected by the design speed compared to the lifetime carbon emissions that were estimated according to an expected operating profile. Therefore, even though both the EEDI and the lifetime carbon emissions ranked the configurations in the same order of preference, there was a misalignment in estimating the magnitude of the improvement of the configurations compared to the current configuration. As a result, the EEDI did not manage to capture the real carbon impact of the cruise ship energy systems, as well as the great benefits of the greener technologies; thus as a policy that aims to mitigate the carbon emissions, the EEDI was not accurate enough to support decisions in improving the carbon footprint of the ship. Similar to the previous section analysis, it could be also inferred for the investigated cruise ship power plant configurations that the EEDI was a conservative metric as it underestimated the CO2 reduction.

6. Conclusions and Recommendations

In this study, the EEDI effectiveness on accurately representing the environmental performance of the next-generation ships power plants for two representative ship types was investigated. The performance of the optimal power plant solutions for two ocean-going ships, which were identified in previous studies considering both environmental and economic objectives, was analysed according to the existing EEDI regulatory framework and compared with the lifetime CO2 emissions estimated based on an actual operating profile for each ship. The investigated power plants included the traditional diesel engines, thermal fired boilers, emerging technologies and fuels like natural gas and methanol, fuel cells and carbon capture technologies, as well as energy efficiency technologies, such as the shaft generator and waste heat recovery. The methane slip was included in the calculations, and the equivalent carbon emissions were identified. Finally, a cost-benefit analysis was performed for each solution, and the difference of the life cycle cost and equivalent carbon emissions of each solution from the baseline was estimated.
It was identified that the baseline configurations for both the investigated tanker and cruise ship did not manage to comply with the forthcoming phases of the EEDI, and thus designs of reduced carbon footprint are required. In addition, it was found that some optimal configurations for the investigated tanker did not manage to comply with the EEDI phase 3, despite the fact that they adopted greener technologies like fuel cells, dual-fuel engines, and waste heat recovery. Thus, it is inferred that diesel engines and HFO operating systems would be prohibitive in future power plant designs from a carbon emissions perspective. It was highlighted that the EEDI promoted configurations that had lower installed nominal power, which had a negative impact on the safe operation of the ship. Finally, it is inferred that the EEDI underestimated the effect of technologies for reducing the carbon emissions, whereas the type of the technologies, as well as the power plant operating profile, were the most significant factors for estimating the lifetime carbon emissions.
A misalignment between the EEDI and the actual lifetime carbon emissions was identified. The percentage of improvement between the solutions and the baseline configuration for the EEDI and the lifetime carbon emissions differed, and in some cases, the ranking of the solutions according to the two indicators differed too. The following paragraphs expand on this misalignment between the two metrics.
First, the lifetime carbon emissions of the main energy ship systems were estimated. This is significant, especially for ships, such as the tankers and the cruise ships, that along with the electric and mechanical load have high thermal power requirements and therefore high carbon emissions from the thermal boilers. As a result, a more holistic approach is needed for the lifetime carbon emissions estimations, which offers more realistic results regarding the carbon footprint of the ships.
Second, ships operate in variable operating profiles [40,57] that consist of different operating phases. However, the EEDI is estimated according to one ship design speed that represents a small percentage of the ship lifetime, whereas the lifetime emissions take into consideration a realistic operating profile. Therefore, the operating condition proposed by the EEDI does not accurately represent the actual operating conditions in reality. This corresponds to the inability of the EEDI to accurately capture the real lifetime carbon emissions. Hence, the EEDI cannot serve as an accurate proxy of the difference in actual carbon emissions between different configurations. Therefore, it can be inferred that the EEDI is not always consistent with the lifetime carbon emissions reduction. As a result, implementing the EEDI metric can wrongly guide the ship designers, owners and policymakers into adopting configurations that, in reality, are underperforming.
In addition, it was identified that the methane slip emissions had a considerable impact on the total carbon emissions in the cases where DF engines of the premixed combustion type are used, whereas, in others, their impact was negligible as on the tanker ship. Therefore, methane emissions should be considered, especially when DF pre-mixed engines are introduced in the power plant design.
All the aforementioned issues negatively affect the global policies for the reduction of the carbon emissions and, in specific, the IMO policies for 50% reduction by 2050. It was derived that the EEDI is a conservative measure, underestimating the actual lifetime CO2 reductions in all the investigated cases. In this respect, it could be inferred that the EEDI in its present form could be employed for a quick approximation of the carbon footprint of the alternative power plant configurations in the ship design phase. Therefore, it could not serve as a policy tool to support understanding the carbon emissions reduction and could not be used in the early design phases to support the selection of the most carbon-efficient power plants as it is not realistic.
Based on this study results, the following recommendations were proposed to the policymakers for the EEDI improvement in order to express the real lifetime carbon emissions and more effectively serve with the IMO targets.
As considering one design point is not sufficient, it is proposed that a more realistic operating profile and more than one points of the engine performance are required in order to express the real ship operation and more realistically estimate her emissions. Thus, as it is also discussed in the existing literature, a lifetime operating policy is needed to achieve real results and have a positive impact on developing effective emissions reduction policies. Therefore, indicative operating profiles for each ship type should be derived from existing operating data with more operating points.
In addition, it was evident that in many cases, there was a misalignment of the EEDI with the lifetime carbon emissions due to the fact that not all systems contribution are considered to the EEDI calculation. As a result, it is recommended to include all the ship energy systems in order to have realistic estimations of the ship performance and energy efficiency.
Furthermore, the optimisation identified as optimal configurations, power plants with dual-fuel operating engines with natural gas. The IMO future targets do not consider only the carbon emissions but also the greenhouse warming impact of ships. Therefore, methane and other equivalent carbon emissions should be considered.
Finally, it was evident from the cost-benefit analysis that some configurations proposed by the optimisation managed to reduce the carbon emissions, however, with a very high cost. Therefore, it was evident that it would be hard for the ship-owners to select more environmentally friendly power plants. As a result, complementary to the EEDI, a carbon trading scheme could be forced in order to increase the incentives for more carbon-efficient technologies.

Author Contributions

Conceptualization, N.L.T., A.R., G.T.; methodology, N.L.T., A.R., G.T.; software, N.L.T.; validation, N.L.T., A.R., G.T.; formal analysis, N.L.T., A.R., G.T.; investigation, N.L.T., A.R., G.T.; resources, N.L.T., A.R., G.T.; data curation, N.L.T., A.R., G.T.; writing—original draft preparation, N.L.T., A.R., G.T.; writing—review and editing, N.L.T., A.R., G.T.; visualization, N.L.T.; supervision, A.R., G.T.; project administration, N.L.T., A.R., G.T.; funding acquisition, A.R., G.T. All authors have read and agreed to the published version of the manuscript.

Funding

This research received no external funding.

Acknowledgments

The third author greatly acknowledges the funding provided by DNV GL AS and RCCL for the establishment and operation of the MSRC. The opinions expressed herein are those of the authors and should not be construed to reflect the views of DNV GL AS and RCCL.

Conflicts of Interest

The authors declare no conflict of interest.

References

  1. Tillig, F.; Ringsberg, J.; Mao, W.; Ramne, B. A generic energy systems model for efficient ship design and operation. Proc. Inst. Mech. Eng. Part M J. Eng. Marit. Environ. 2016, 231, 649–666. [Google Scholar] [CrossRef]
  2. EC. Transport Emissions; EC: Brussels, Belgium, 2014. [Google Scholar]
  3. EPA. Sources of Greenhouse Gas Emissions; EPA: Washington, DC, USA, 2016.
  4. Peters, G.P.; Andrew, R.M.; Boden, T.; Canadell, J.G.; Ciais, P.; Le Quéré, C.; Marland, G.; Raupach, M.R.; Wilson, C. The challenge to keep global warming below 2 °C. Nat. Clim. Chang. 2012, 3, 4. [Google Scholar] [CrossRef]
  5. Johnson, J. The Marine Professional; Insititute of Marine Engineering, Science & Technology: London, UK, 2018. [Google Scholar]
  6. Anderson, K.; Bows, A. Executing a Scharnow turn: Reconciling shipping emissions with international commitments on climate change. Carbon Manag. 2012, 3, 615–628. [Google Scholar] [CrossRef]
  7. Ancona, M.A.; Baldi, F.; Bianchi, M.; Branchini, L.; Melino, F.; Peretto, A.; Rosati, J. Efficiency improvement on a cruise ship: Load allocation optimization. Energy Convers. Manag. 2018, 164, 42–58. [Google Scholar] [CrossRef]
  8. IMO. Annex 19-Resolution MEPC.203(62), Amendments to the Annex of the Protocol of 1997 to Amend the International Convention for the Prevention of Pollution from Ships, 1973, as Modified by the Protocol of 1978 Relating Thereto; IMO, EU: London, UK, 2011. [Google Scholar]
  9. IMO. Annex 5, Resolution MEPC.245(66), Guidelines on the Method of Calculation of the Attained Energy Efficiency Design Index (EEDI) for New Ships; IMO, EU: London, UK, 2014. [Google Scholar]
  10. IMO. Annex 9, Resolution MEPC.213(63), 2012 Guidelines for the Development of a Ship Energy Efficiency Management Plan (SEEMP); IMO, EU: London, UK, 2012. [Google Scholar]
  11. EU. Proposal for a Regulation of the European Parliament and of the Council on the Monitoring, Reporting and Verification of Carbon Dioxide Emissions From Maritime Transport and Amending Regulation (EU) No. 525/2013—Political Agreement; EU: Brussels, Belgium, 2014. [Google Scholar]
  12. Lindstad, E.; Bø, T.I. Potential power setups, fuels and hull designs capable of satisfying future EEDI requirements. Transp. Res. Part D Transp. Environ. 2018, 63, 276–290. [Google Scholar] [CrossRef]
  13. Lindstad, E.; Borgen, H.; Eskeland, G.S.; Paalson, C.; Psaraftis, H.; Turan, O. The need to amend IMO’s EEDI to include a threshold for performance in waves (realistic sea conditions) to achieve the desired GHG reductions. Sustainability 2019, 11, 3668. [Google Scholar] [CrossRef] [Green Version]
  14. Psaraftis, H.N. Decarbonization of maritime transport: to be or not to be? Marit. Econ. Logist. 2018, 21, 1–19. [Google Scholar] [CrossRef]
  15. Ančić, I.; Theotokatos, G.; Vladimir, N. Towards improving energy efficiency regulations of bulk carriers. Ocean Eng. 2018, 148, 193–201. [Google Scholar] [CrossRef] [Green Version]
  16. Lin, Y.; Yu, Y.; Guan, G. Research on energy efficiency design index for sea-going LNG carriers. J. Mar. Sci. Appl. 2014, 13, 430–436. [Google Scholar] [CrossRef]
  17. Ekanem Attah, E.; Bucknall, R. An analysis of the energy efficiency of LNG ships powering options using the EEDI. Ocean Eng. 2015, 110, 62–74. [Google Scholar] [CrossRef]
  18. Vladimir, N.; Ančić, I.; Šestan, A. Effect of ship size on EEDI requirements for large container ships. J. Mar. Sci. Technol. 2018, 23, 42–51. [Google Scholar] [CrossRef]
  19. Ancic, I.; Sestan, A.; Vladimir, N.; Klisaric, V. Influence of new power sources on the Attained EEDI. In Proceedings of the International Conference on Influence on Ship Design, London, UK, 24–25 September 2014. [Google Scholar]
  20. Ančić, I.; Šestan, A. Influence of the required EEDI reduction factor on the CO2 emission from bulk carriers. Energy Policy 2015, 84, 107–116. [Google Scholar] [CrossRef]
  21. Baldasso, E.; Elg, M.; Haglind, F.; Baldi, F. Comparative Analysis of Linear and Non-Linear Programming Techniques for the Optimization of Ship-Machinery Systems. J. Mar. Sci. Eng. 2019, 7, 403. [Google Scholar] [CrossRef] [Green Version]
  22. Gualeni, P.; Flore, G.; Maggioncalda, M.; Marsano, G. Life Cycle Performance Assessment Tool Development and Application with a Focus on Maintenance Aspects. J. Mar. Sci. Eng. 2019, 7, 280. [Google Scholar] [CrossRef] [Green Version]
  23. Ahn, J.; You, H.; Ryu, J.; Chang, D. Strategy for selecting an optimal propulsion system of a liquefied hydrogen tanker. Int. J. Hydrogen Energy 2017, 42, 5366–5380. [Google Scholar] [CrossRef]
  24. El Geneidy, R.; Otto, K.; Ahtila, P.; Kujala, P.; Sillanpää, K.; Mäki-Jouppila, T. Increasing energy efficiency in passenger ships by novel energy conservation measures. J. Mar. Eng. Technol. 2017, 4177, 1–14. [Google Scholar] [CrossRef] [Green Version]
  25. Livanos, G.A.; Theotokatos, G.; Pagonis, D.-N. Techno-economic investigation of alternative propulsion plants for Ferries and RoRo ships. Energy Convers. Manag. 2014, 79, 640–651. [Google Scholar] [CrossRef] [Green Version]
  26. Zhu, Y.; Zhou, S.; Feng, Y.; Hu, Z.; Yuan, L. Influences of solar energy on the energy efficiency design index for new building ships. Int. J. Hydrogen Energy 2017, 42, 19389–19394. [Google Scholar] [CrossRef]
  27. Plessas, T.; Kanellopoulou, A.; Zaraphonitis, G.; Papanikolaou, A.; Shigunov, V. Exploration of design space and optimisation of RoPax vessels and containerships in view of EEDI and safe operation in adverse sea conditions. Ocean Eng. 2018, 162, 1–20. [Google Scholar] [CrossRef]
  28. Bazari, Z.; Longva, T. Assessment of IMO Mandated Energy Efficiency Measures for International Shipping: Estimated CO2 Emissions Reduction from Introduction of Mandatory; MEPC: London, UK, 2011. [Google Scholar]
  29. Hwang, S.; Jeong, B.; Jung, K.; Kim, M.; Zhou, P. Life cycle assessment of lng fueled vessel in domestic services. J. Mar. Sci. Eng. 2019, 7, 359. [Google Scholar] [CrossRef] [Green Version]
  30. Krueger, S. Mathematical Evaluation of the Applicability of the EEDI Concept for RoRo Vessels; Institute of Ship Design and Ship Safety: Hamburg, Germany, 2011. [Google Scholar]
  31. Devanney, J. EEDI—William Froude must be Spinning is His Grave; Lloyds List: London, UK, 2011. [Google Scholar]
  32. Ančić, I.; Vladimir, N.; Luttenberger, L.R. Energy efficiency of ro-ro passenger ships with integrated power systems. Ocean Eng. 2018, 166, 350–357. [Google Scholar] [CrossRef]
  33. Trivyza, N.L.; Rentizelas, A.; Theotokatos, G. A novel multi-objective decision support method for ship energy systems synthesis to enhance sustainability. Energy Convers. Manag. 2018, 168, 128–149. [Google Scholar] [CrossRef] [Green Version]
  34. Smith, T.W.P.; Jalkanen, J.P.; Anderson, B.A.; Corbett, J.J.; Faber, J.; Hanayama, S.; O’Keeffe, E.; Parker, S.; Johansson, L.; Aldous, L.; et al. Third IMO Greenhouse Gas Study 2014; International Maritime Organization (IMO): London, UK, 2014. Available online: http://www.imo.org/en/OurWork/Environment/PollutionPrevention/AirPollution/Documents/Third%20Greenhouse%20Gas%20Study/GHG3%20Executive%20Summary%20and%20Report.pdf (accessed on 20 January 2020).
  35. Buhaug, Ø.; Corbett, J.; Endresen, Ø.; Eyring, V.; Faber, J.; Hanayama, S.; Lee, D.; Lee, D.; Lindstad, H.; Markowska, A.; et al. Second IMO GHG Study2009; International Maritime Organization (IMO): London, UK, 2009; Volume 35, p. 11. Available online: http://www.imo.org/en/OurWork/Environment/PollutionPrevention/AirPollution/Documents/SecondIMOGHGStudy2009.pdf (accessed on 20 January 2020).
  36. Brynolf, S.; Baldi, F.; Johnson, H. Energy Efficiency and Fuel Changes to Reduce Environmental Impacts. In Shipping and the Environment: Improving Environmental Performance in Marine Transportation; Andersson, K., Brynolf, S., Lindgren, J.F., Wilewska-Bien, M., Eds.; Springer: Berlin/Heidelberg, Germany, 2016; pp. 295–339. ISBN 978-3-662-49045-7. [Google Scholar]
  37. Howitt, O.J.A.; Revol, V.G.N.; Smith, I.J.; Rodger, C.J. Carbon emissions from international cruise ship passengers’ travel to and from New Zealand. Energy Policy 2010, 38, 2552–2560. [Google Scholar] [CrossRef]
  38. Baldi, F.; Ahlgren, F.; Nguyen, T.V.; Gabrielii, C.; Andersson, K. Energy and exergy analysis of a cruise ship. In Proceedings of the Efficiency Cost Optimisation Simulation and Environmental Impact of Energy Systems, Pau, France, 30 June–3 July 2015. [Google Scholar]
  39. Corbett, J.J.; Winebrake, J.J.; Green, E.H.; Kasibhatla, P.; Eyring, V.; Lauer, A. Mortality from ship emissions: A global assessment. Environ. Sci. Technol. 2007, 41, 8512–8518. [Google Scholar] [CrossRef]
  40. Banks, C.; Turan, O.; Incecik, A.; Theotokatos, G.; Izkan, S.; Shewell, C.; Tian, X. Understanding Ship Operating Profiles with an Aim to Improve Energy Efficient Ship Operations. In Proceedings of the Low Carbon Shipping Conference, London, UK, 9–12 September 2013; pp. 1–11. [Google Scholar]
  41. Trivyza, N.L.; Rentizelas, A.; Theotokatos, G. Impact of carbon pricing on the cruise ship energy systems optimal configuration. Energy 2019, 175, 952–966. [Google Scholar] [CrossRef] [Green Version]
  42. Luo, X.; Wang, M. Study of solvent-based carbon capture for cargo ships through process modelling and simulation. Appl. Energy 2017, 195, 402–413. [Google Scholar] [CrossRef] [Green Version]
  43. Theotokatos, G.; Livanos, G. Techno-economical analysis of single pressure exhaust gas waste heat recovery systems in marine propulsion plants. Proc. Inst. Mech. Eng. Part M J. Eng. Marit. Environ. 2013, 227, 83–97. [Google Scholar] [CrossRef]
  44. Tzannatos, E.; Papadimitriou, S.; Koliousis, I. A Techno-Economic Analysis of Oil vs. Natural Gas Operation for Greek Island Ferries. Int. J. Sustain. Transp. 2015, 9, 272–281. [Google Scholar] [CrossRef]
  45. Wärtsilä. Wärtsilä’s 2-Stroke Dual-Fuel Engine Introduced; Wärtsilä: Helsinki, Finland, 2013. [Google Scholar]
  46. Clausen, N.B. Tier III NO x Emission Reduction Technologies EGR and SCR; MAN Diesel & Turbo: Augsburg, Germany, 2015. [Google Scholar]
  47. Mcphail, S.J.; Leto, L.; Della Pietra, M.; Cigolotti, V.; Moreno, A. International Status of Molten Carbonate Fuel Cells 2015. In Advanced Fuel Cells Implementing Agreement Annex 23—MCFC; ENEA: Rome, Italy, 2015; pp. 1–34. [Google Scholar]
  48. Lövblad, G.; Fridell, E. Experiences from use of some techniques to reduce emissions from ships. Swedish Marit. Adm. Göteborg. 2006. Available online: http://www.profu.se (accessed on 20 January 2020).
  49. IRENA. Renewable Energy Technologies: Cost Analysis Series: Wind Power; IRENA: Bonn, Germany, 2012; Volume 1. [Google Scholar]
  50. Vanwortswinkel, L.; Nijs, W. Industrial Combustion Boilers; IEA ETSAP: Lyngby, Denmark, 2010. [Google Scholar]
  51. IMO. Ship Energy Efficiency Regulations and Related Guidelines; IMO: London, UK, 2016. [Google Scholar]
  52. Wang, H.; Zhou, P.; Wang, Z. Reviews on current carbon emission reduction technologies and projects and their feasibilities on ships. J. Mar. Sci. Appl. 2017, 16, 129–136. [Google Scholar] [CrossRef]
  53. CLIA. Energy Efficiency for Cruise Passenger Ships, MEPC 65/4/6; CLIA: Washington, DC, USA, 2013. [Google Scholar]
  54. Nyllund, I.; Alder, R.; Hirose, T.; Umemoto, Y.; Yamada, T. The 2-stroke Low-Pressure Dual-Fuel Technology: From Concept to Reality. In Proceedings of the CIMAC Congress 2016, Helsinki, Finland, 6–10 June 2016. [Google Scholar]
  55. Juliussen, L.R.; Kryger, M.J.; Andreasen, A. Man B & W Me-Gi Engines. Recent Research and Results. In Proceedings of the International Symposium on Marine Engineering (ISME), Kobe, Japan, 17–21 October 2011; p. 6. [Google Scholar]
  56. Brander, M. Greenhouse Gases, CO2, CO2e, and Carbon: What Do All These Terms Mean? Econometrica: Edinbrugh, UK, 2012. [Google Scholar]
  57. Baldi, F.; Ahlgren, F.; Van Nguyen, T.; Thern, M.; Andersson, K. Energy and exergy analysis of a cruise ship. Energies 2018, 11, 2508. [Google Scholar] [CrossRef] [Green Version]
Figure 1. CO2 emissions in 2012 adapted by the IMO study [34].
Jmse 08 00061 g001
Figure 2. Aframax tanker power plant configuration layout.
Jmse 08 00061 g002
Figure 3. Typical operating profiles for an Aframax tanker adapted from [40].
Jmse 08 00061 g003
Figure 4. Cruise ship power plant configuration layout.
Jmse 08 00061 g004
Figure 5. Cruise ship operating profiles; (a) Total power (for propulsion and hotel load) demand; (b) Saturated steam demand adapted from [41].
Jmse 08 00061 g005
Figure 6. Cost-benefit analysis results for the Aframax tanker configurations.
Jmse 08 00061 g006
Figure 7. Cost-benefit analysis results for the cruise ship configurations.
Jmse 08 00061 g007
Table 1. Investigated tanker ship characteristics.
CharacteristicsValue
Size115,000 DWT
Displacement140,000 MT
Length250 m
Beam45 m
Draft15 m
PropulsorFixed pitch propeller
Table 2. Technologies considered for the Aframax tanker.
Prime MoverDiesel Engine, Dual-Fuel Engine (2-Stroke Engine)
Electric auxiliary machinery Diesel generator sets, dual-fuel generator sets, fuel cells
Thermal boilerOil fired, gas-fired
FuelsHFO, MDO, MGO, LSHFO, natural gas
Emissions abatement technologiesScrubber, SCR, EGR, carbon capture system
Technologies to improve energy efficiencyWHR, shaft generator
HFO: heavy fuel oil, MDO: marine diesel oil, MGO: marine gas oil, LSHFO: low sulphur heavy fuel oil, SCR: selective catalytic reactor, EGR: exhaust gas recirculation, WHR: waste heat recovery.
Table 3. Investigated cruise ship characteristics.
CharacteristicsValue
Size140,000 GT
Length300 m
Beam40 m
Draft10 m
PropulsorAzipods and bow thrusters
Table 4. Technologies considered for the cruise ship.
Generator SetsDiesel Generator Sets, Dual-Fuel Generator Sets, Fuel Cells
Thermal boilerOil fired, gas-fired
FuelsHFO, MDO, MGO, LSHFO, natural gas
Emissions abatement technologiesScrubber, SCR, EGR, carbon capture system
Technologies to improve energy efficiencyWHR
Table 5. Capital cost of technologies.
TechnologiesCapital Cost (€/kW)Adapted from
Carbon capture system 1,42600[42]
Diesel engine (4-stroke)493[25]
Diesel engine 2 (2-stroke)462[43]
Dual fuel engine (4-stroke) 5740[44]
Dual fuel engine 2 (2-stroke) direct-injected 5700[44]
Dual fuel engine 2 (2-stroke) premixed 5595[45]
EGR 480[46]
Molten carbonate fuel Cells 33485[47]
SCR 439[25]
Scrubber 4135[48]
Shaft generator 4147[49]
Thermal boiler22[50]
Waste heat recovery system 4100[25]
1 Tank storage of carbon included. 2 The storage and treatment of fuel are considered. 3 Technology with an internal reformer. 4 Cost per kW of the main engine. 5 The energy required for operating the fuel gas feeding system is not taken into account.
Table 6. Parameters for energy efficiency design index (EEDI) reference value equation.
Ship typeabc
Tanker1218.8DWT of the ship0.488
Cruise ship with non-conventional propulsion170.84GT of the ship0.214
Table 7. EEDI reduction factor X.
Ship TypePhase 0
(1/1/13–31/12/14)
Phase 1
(1/1/15–31/12/19)
Phase 2
(1/1/20–31/12/24)
Phase 3
(1/1/25 onwards)
Tanker
(≥20,000 DWT)
0102030
Cruise ship with non-conventional propulsion
(≥85,000 GT)
no required EEDI5 *2030
* for ships built after 1/9/2015.
Table 8. CO2 emission factors.
FuelsCO2 (kg/kg of Fuel)
HFO3.021
LSHFO3.075
MDO3.082
MGO3.082
NG2.75
NG and MDO pilot fuel 12.77
1 EFCO2 = 0.94 EFCO2, NG + 0.06 EFCO2, MDO.
Table 9. Investigated power plant configurations for the Aframax tanker.
Configuration No.Main engineEmission Reduction TechnologyEnergy Efficiency TechnologyElectric Auxiliary MachinerySets/Power (kW)Boiler
TypeFuelMCR Power (MW)TypeFuelTypeFuel
1DF direct gas injectionNG15.5EGR and CCWHR and SGFCNG4 × 500GFBNG
2DF direct gas injectionNG14EGR and CCWHR and SGFCNG4 × 500 GFBNG
3DF direct gas injectionNG14EGR and CCSGDGLSHFO2 × 1260 and 1 × 660GFBNG
4DF direct gas-injectionNG14EGR and CCWHR and SGDGLSHFO2 × 1260 or 2 × 1260 and 1 × 660GFBNG
5DF pre-mixed combustionNG15.5CCWHR and SGDFGNG2 × 1280GFBNG
6DF pre-mixed combustionNG15CCWHRFCNG4 × 500GFBNG
7DF pre-mixed combustionNG14CCSGDFGNG2 × 1280GFBNG
8DF direct gas injectionNG15EGRnoneFCNG4 × 500GFBNG
9DF direct gas injectionNG15EGRSGDFGNG2 × 1280 and 1 × 660GFBNG
10DF direct gas injectionNG15EGRWHRDFGNG2 × 1280GFBNG
11DF pre-mixed combustionNG15.5noneWHRFCNG4 × 500GFBNG
12DF pre-mixed combustionNG15noneWHR and SGDFGNG2 × 1280GFBNG
13DF pre-mixed combustionNG14noneSGDFGNG2 × 1280GFBNG
BaselineDieselHFO and MDO14SCRSGDGMDO3 × 800OFBHFO and LSHFO
DF: dual fuel, NG: natural gas, HFO: heavy fuel oil, MDO: marine diesel oil, EGR: exhaust gas recirculation, CC: carbon capture, SCR: selective catalytic reactor, WHR: waste heat recovery, SG: shaft generator, DFG: dual fuel generator, FC: fuel cells (molten carbon), DG: diesel generators, LSHFO: low sulphur heavy fuel oil, GFB: gas-fired boiler, OFB: oil fired boiler; MCR: maximum continuous rating.
Table 10. Investigated power plant configurations for the cruise ship.
Configuration No.Sets/Nominal Power/Type/FuelEmission Reduction TechnologyEnergy Efficiency TechnologyThermal Boiler
TypeFuel
1138 × 500 kW FC (NG)CCWHRGFBNG
296 × 500 kW FC (NG) and CCWHRGFBNG
3 × 7000 kW DFG (NG)
366 × 500 kW FC (NG) and CCWHRGFBNG
3 × 12000 kW DFG (NG)
442 × 50 kW FC (NG) and CCWHRGFBNG
4 × 12000 kW DFG (NG)
53 × 11000 kW DFG (NG) and CCWHRGFBNG
4 × 9000 kW DFG (NG)
63 × 12000 kW DFG (NG) and -WHRGFBNG
3 × 11000 kW DFG (NG)
73 × 7000 kW DG (LSHFO) and -WHRGFBNG
4 × 12000 kW DFG (NG)
Baseline6 × 12000 kW DG (HFO and LSHFO)SCREconomiserOFBHFO and LSHFO
DG: diesel generator set, LSHFO: low sulphur heavy fuel oil, DFG: dual fuel generator set, NG: natural gas, FC: fuel cells (molten carbon), CC: carbon capture system, SCR: selective catalytic reactor, WHR: waste heat recovery system, GFB: gas-fired boiler, OFB: oil fired boiler, HFO: heavy fuel oil.
Table 11. Reference values for EEDI regulation for an Aframax tanker.
PhasePeriodReference Value (g CO2/t NM)
1till 20193.72
22020−20243.3
3from 20252.89
Table 12. Calculated EEDI values and lifetime CO2 emissions for the Aframax tanker power plant solutions.
ConfigurationEEDI
(g CO2/t NM)
Lifetime CO2 Emissions (1000 t)Percentage Difference from the Baseline Configuration EEDIPercentage Difference from the Baseline Configuration CO2 Emissions
32.11557−30%−54%
22.15551−28%−54%
42.18572−27%−52%
72.29601−24%−50%
132.3816−23%−32%
12.31550−23%−54%
92.39764−20%−36%
52.51584−16%−51%
122.53787−16%−34%
102.56777−15%−35%
82.63751−12%−37%
62.65593−12%−51%
112.90781−9%−35%
Baseline configuration31201.1 (-)(-)
Table 13. Lifetime CO2 equivalent emissions for the Aframax tanker power plant solutions.
ConfigurationLifetime CH4 Emissions (1000 t)Lifetime CH4 Emissions in CO2e (1000 t)Lifetime CO2e Emissions (1000 t)Percentage Difference from the Baseline Configuration CO2e Emissions
30.297.35564–53%
20.297.35559–53%
40.297.35579–52%
75.88147.09748–38%
135.88147.09964–20%
10.307.38558–54%
90.297.37772–36%
55.22130.53714–40%
125.90147.48935–22%
100.266.53783–35%
80.266.53757–37%
65.22130.53723–40%
115.22130.53911–24%
Baseline configuration(-)(-)1201.1(-)
Table 14. EEDI reference values for a cruise ship of 140,000 GT.
PhaseReference Value (g CO2/t NM)
112.85
210.82
39.47
Table 15. Calculated EEDI values and lifetime CO2 emissions for the cruise ship power plant solutions.
ConfigurationEEDI
(g CO2/t NM)
Lifetime CO2 Emissions (1000 t)Percentage Difference from the Baseline Configuration
EEDI
Percentage Difference from the Baseline Configuration CO2 Emissions
16.46828−45%−75%
27.12832−40%−75%
37.45930−37%−72%
47.801003−34%−69%
58.451374−28%−58%
68.801976−25%−40%
79.132031−23%−38%
Baseline configuration11.83284.1(-)(-)
Table 16. Lifetime equivalent CO2 emissions for the cruise ship power plant solutions.
ConfigurationLifetime CH4 Emissions (1000 t)Lifetime CH4 Emissions in CO2e (1000 t)Lifetime CO2e Emissions (1000 t)Percentage Difference from the Baseline Configuration CO2e Emissions
100827.76–75%
22.8170.17901.87–73%
38.10202.591132.64–66%
412.92322.921325.53–60%
521.02525.511899.23–42%
621.02525.512501.36–24%
78.10202.482233.34–32%
Baseline configuration(-)(-)3284.1(-)

