Effects of Phytoplankton Growth Phase on Settling Properties of Marine Aggregates

Abstract
1. Introduction
2. Materials and Methods
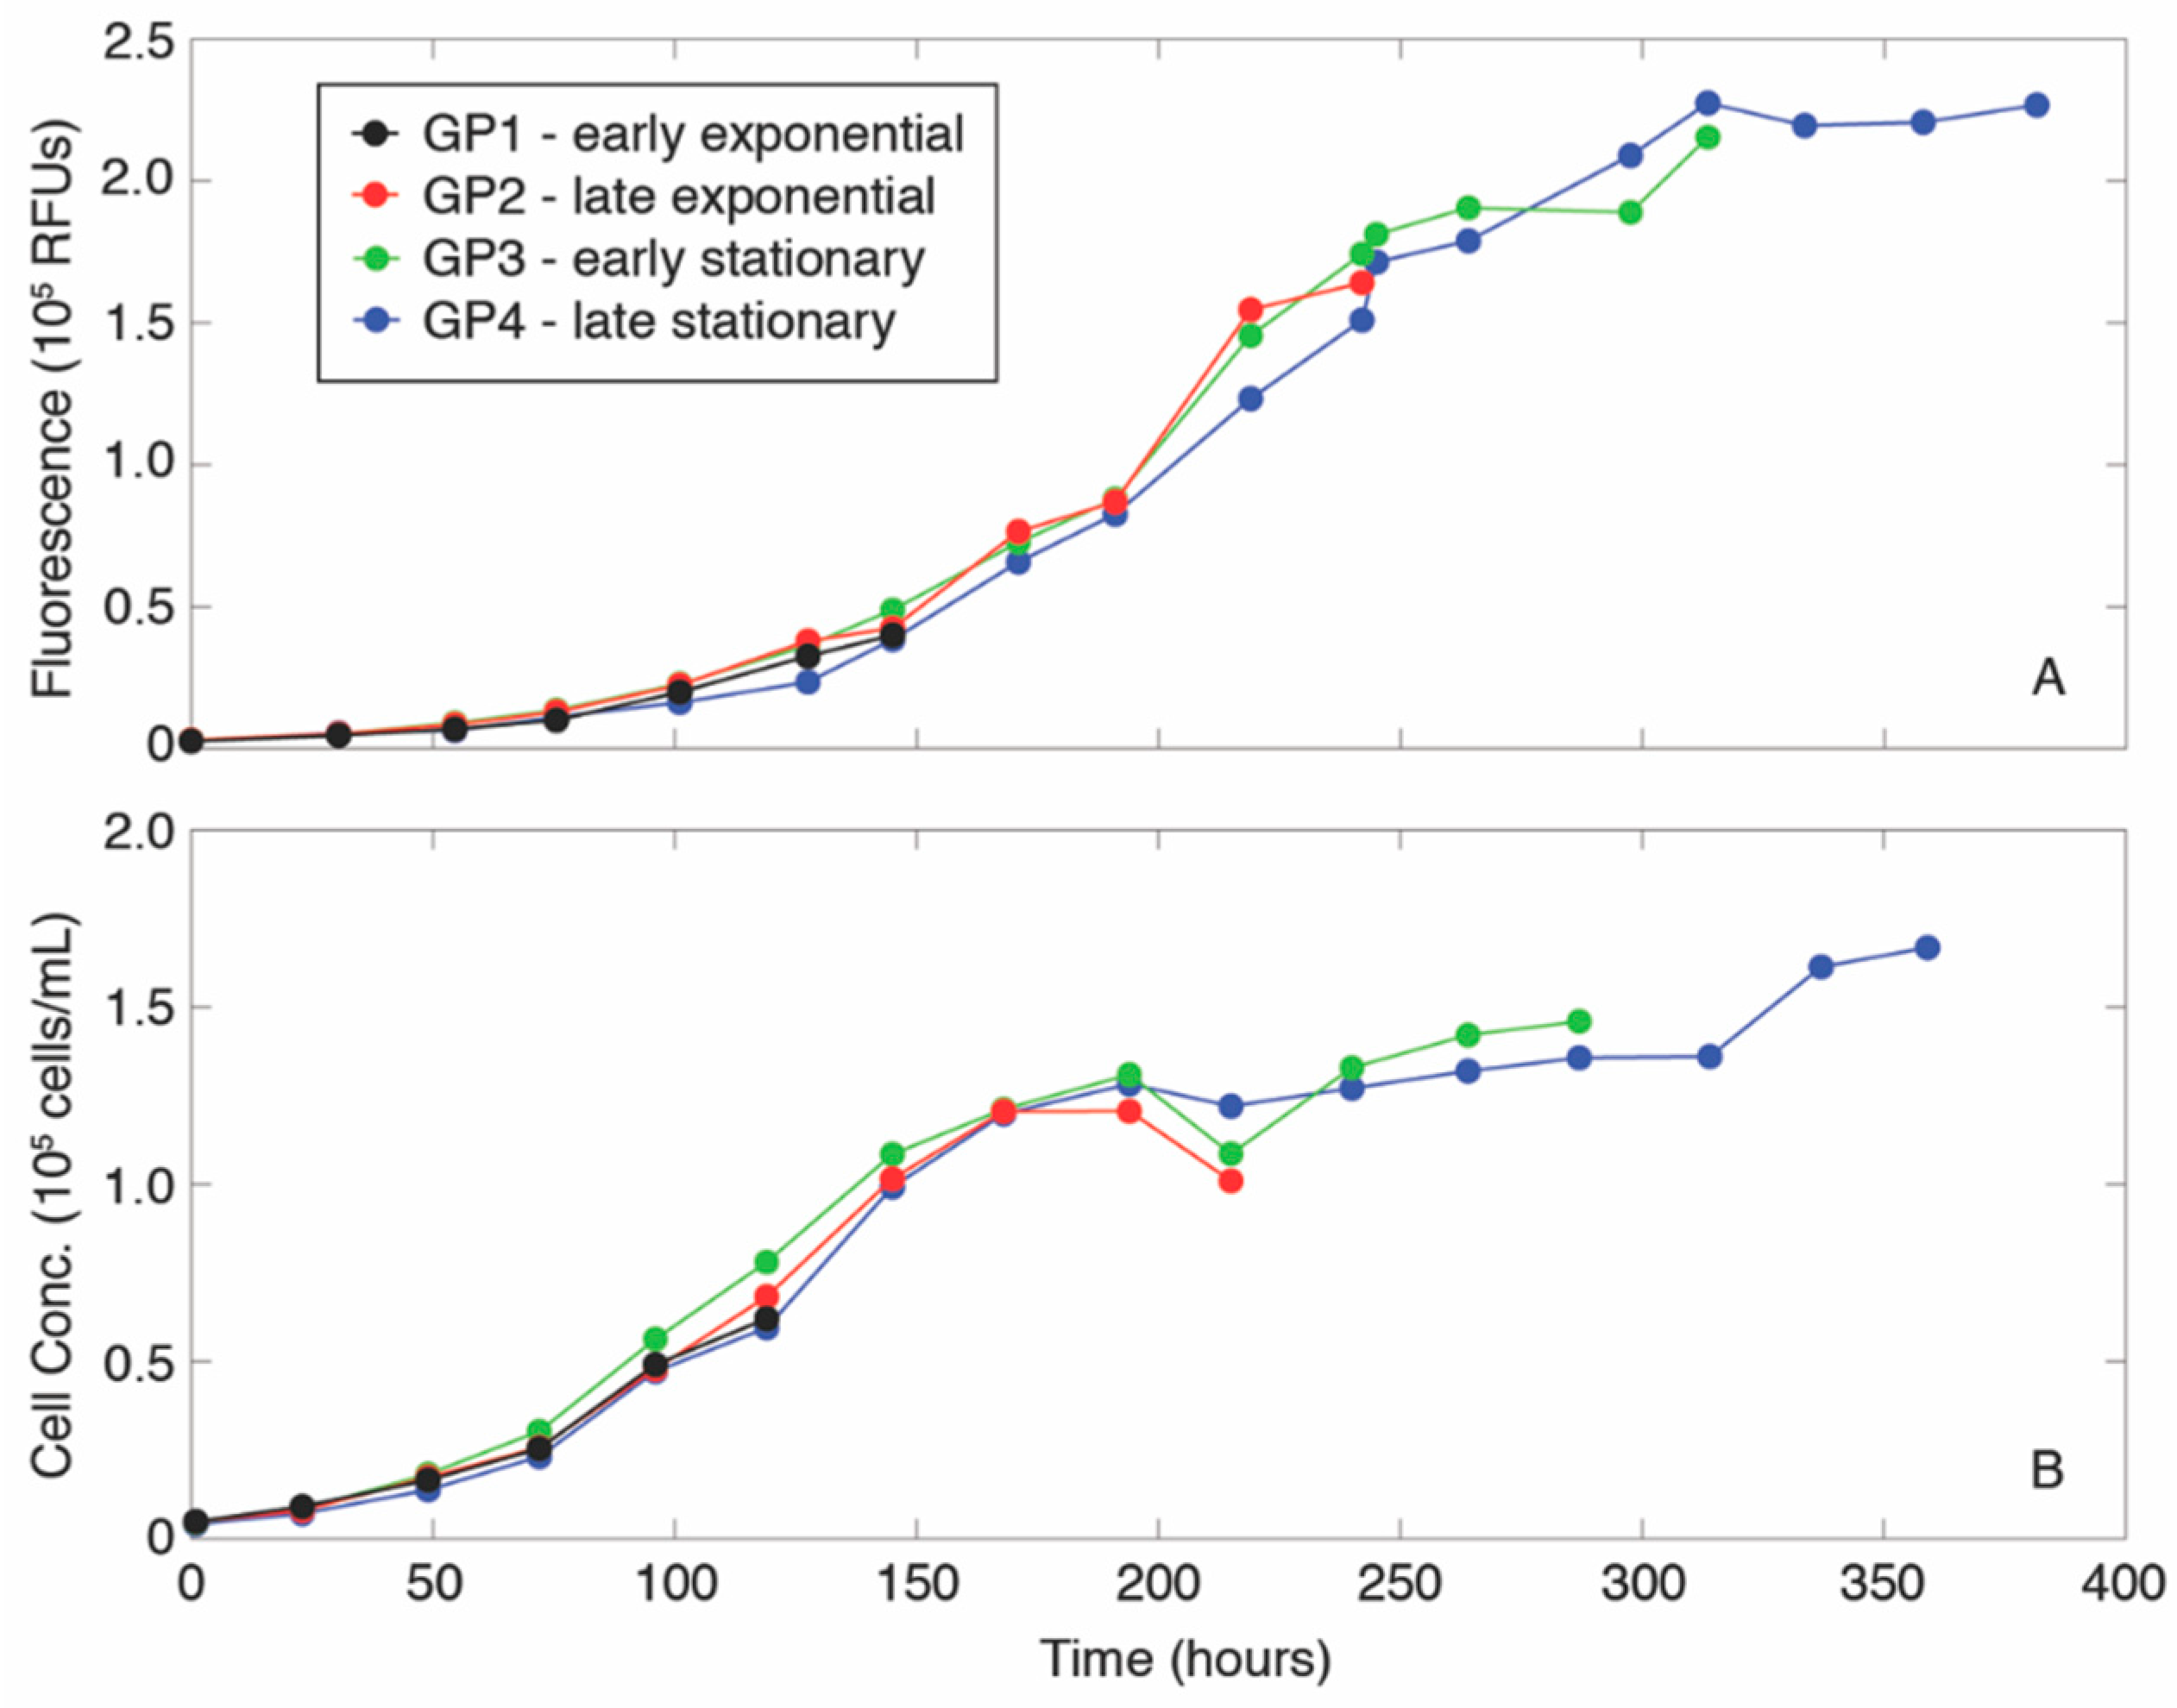
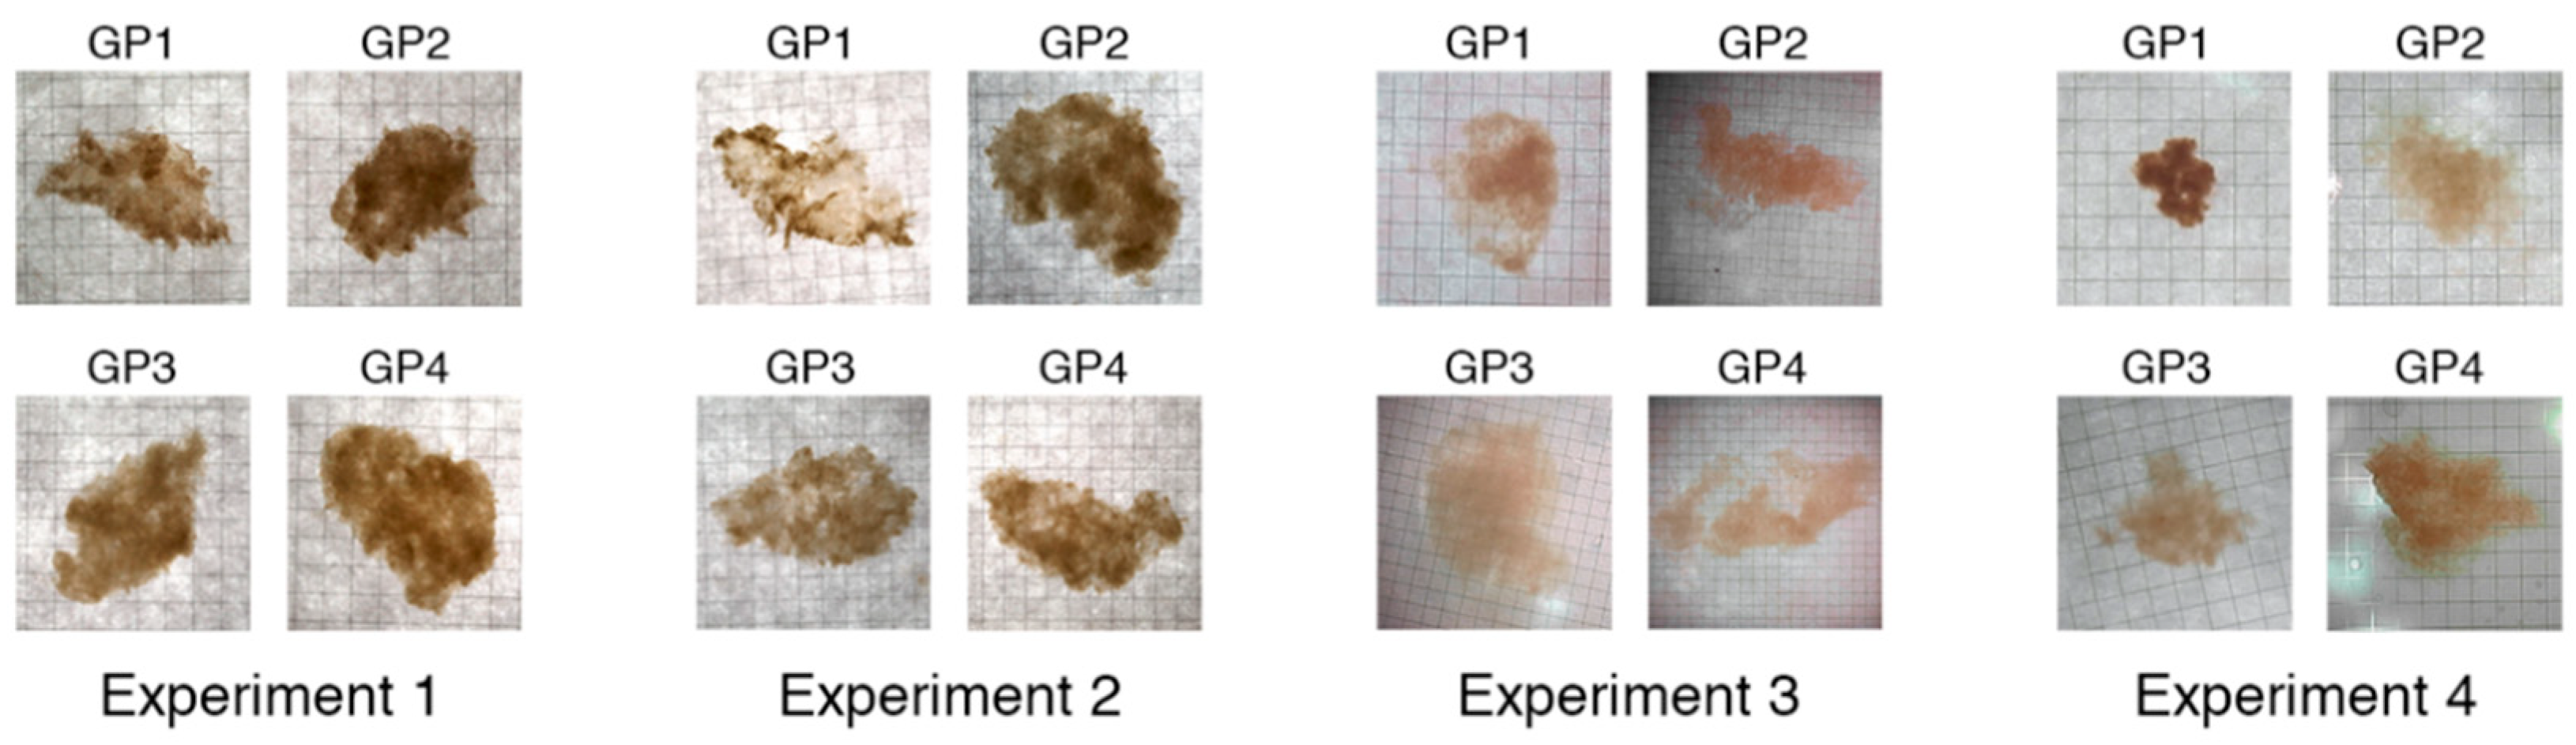
2.1. Growth of Phytoplankton Cultures and Formation of Aggregates
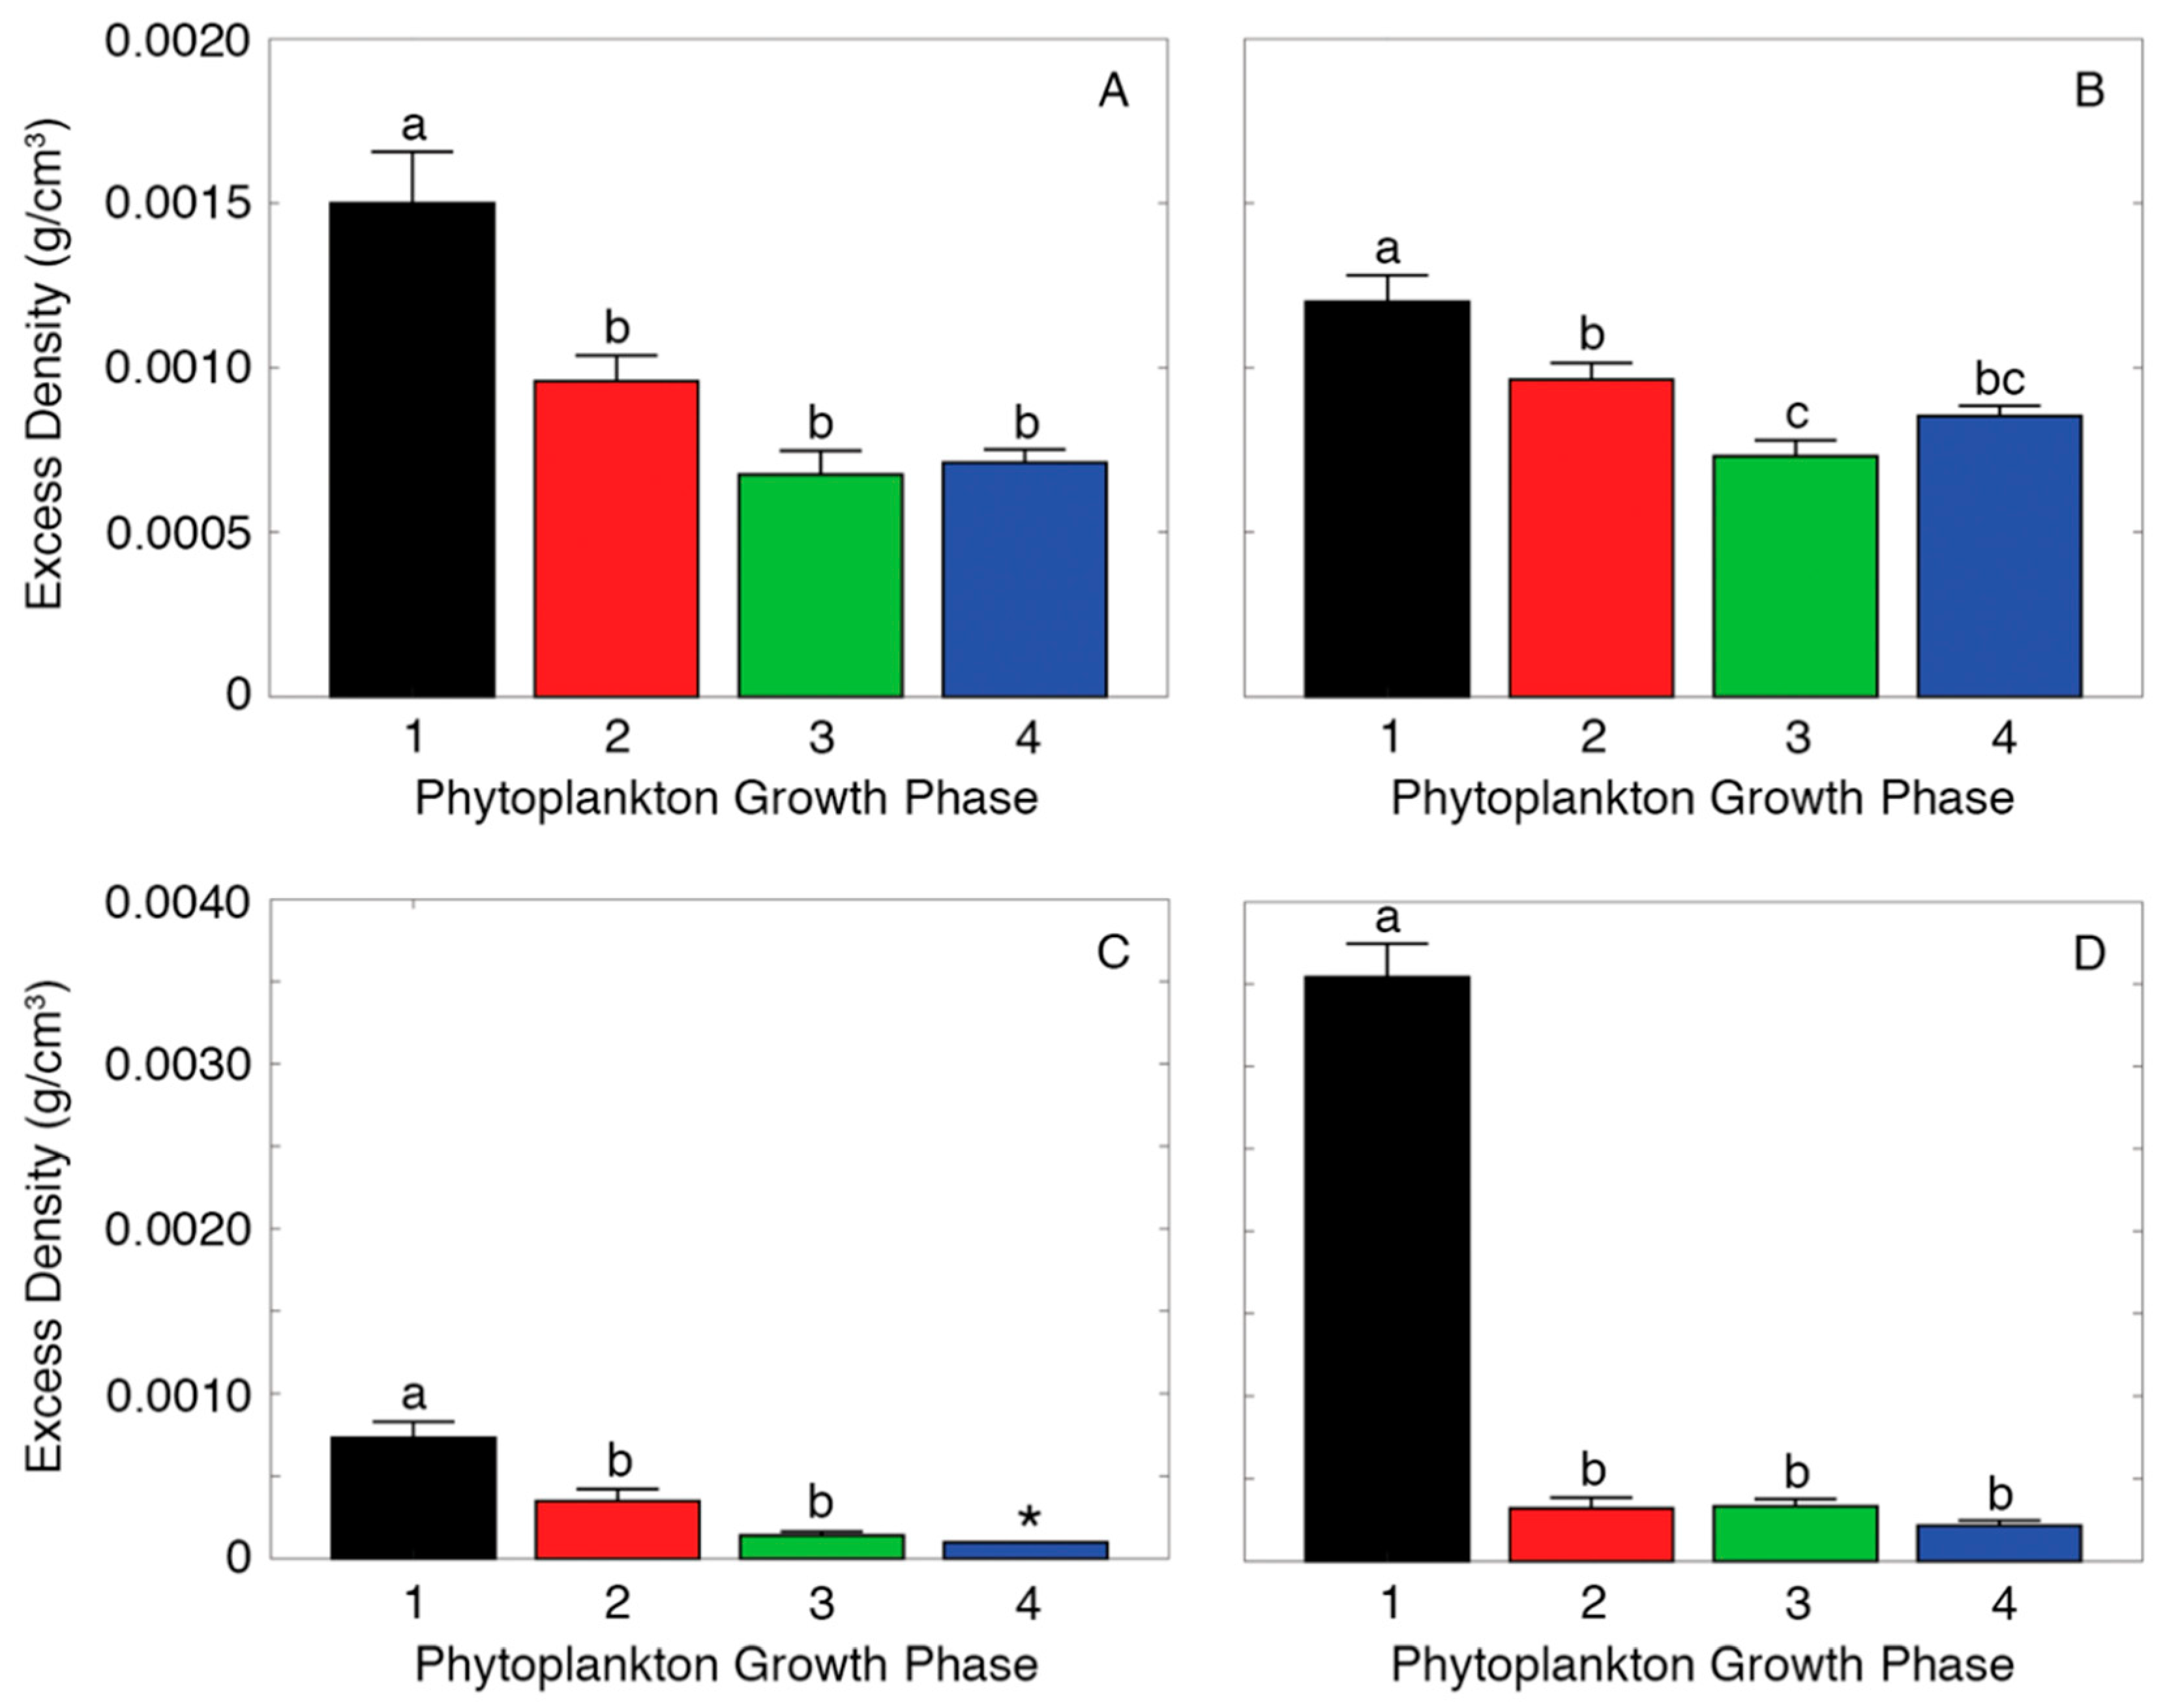
2.2. Measuring Aggregate Excess Density
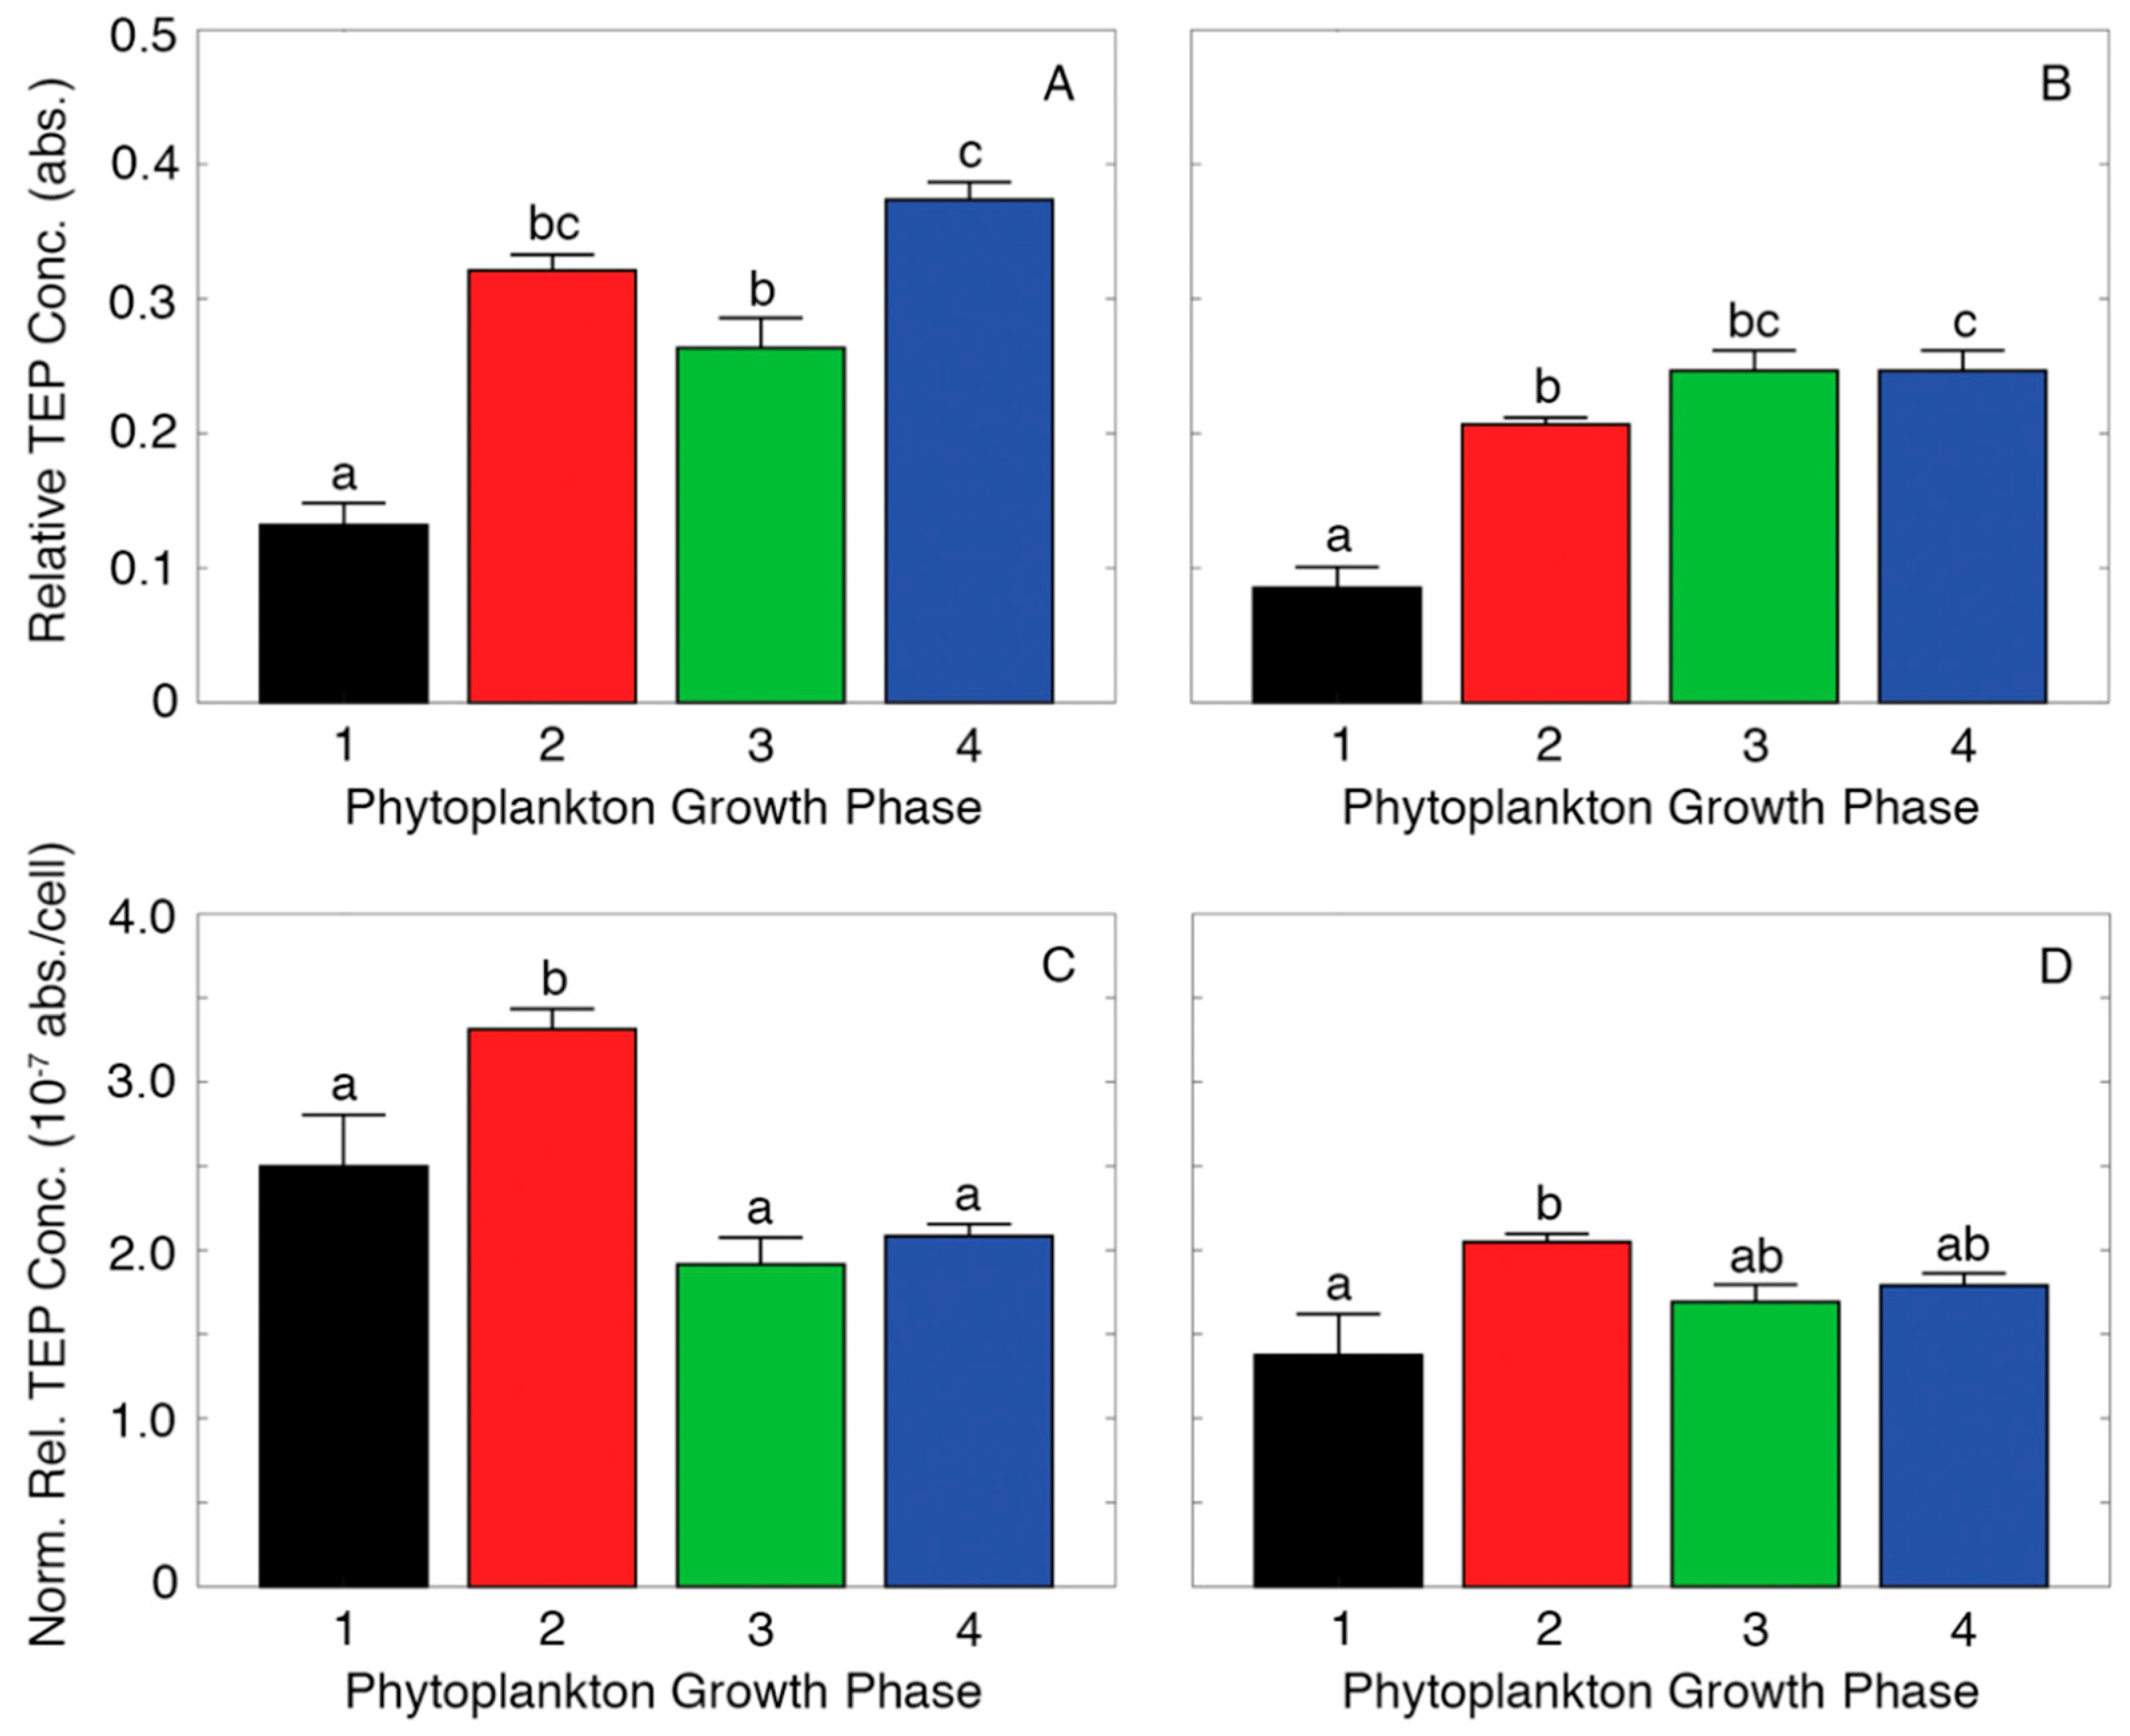
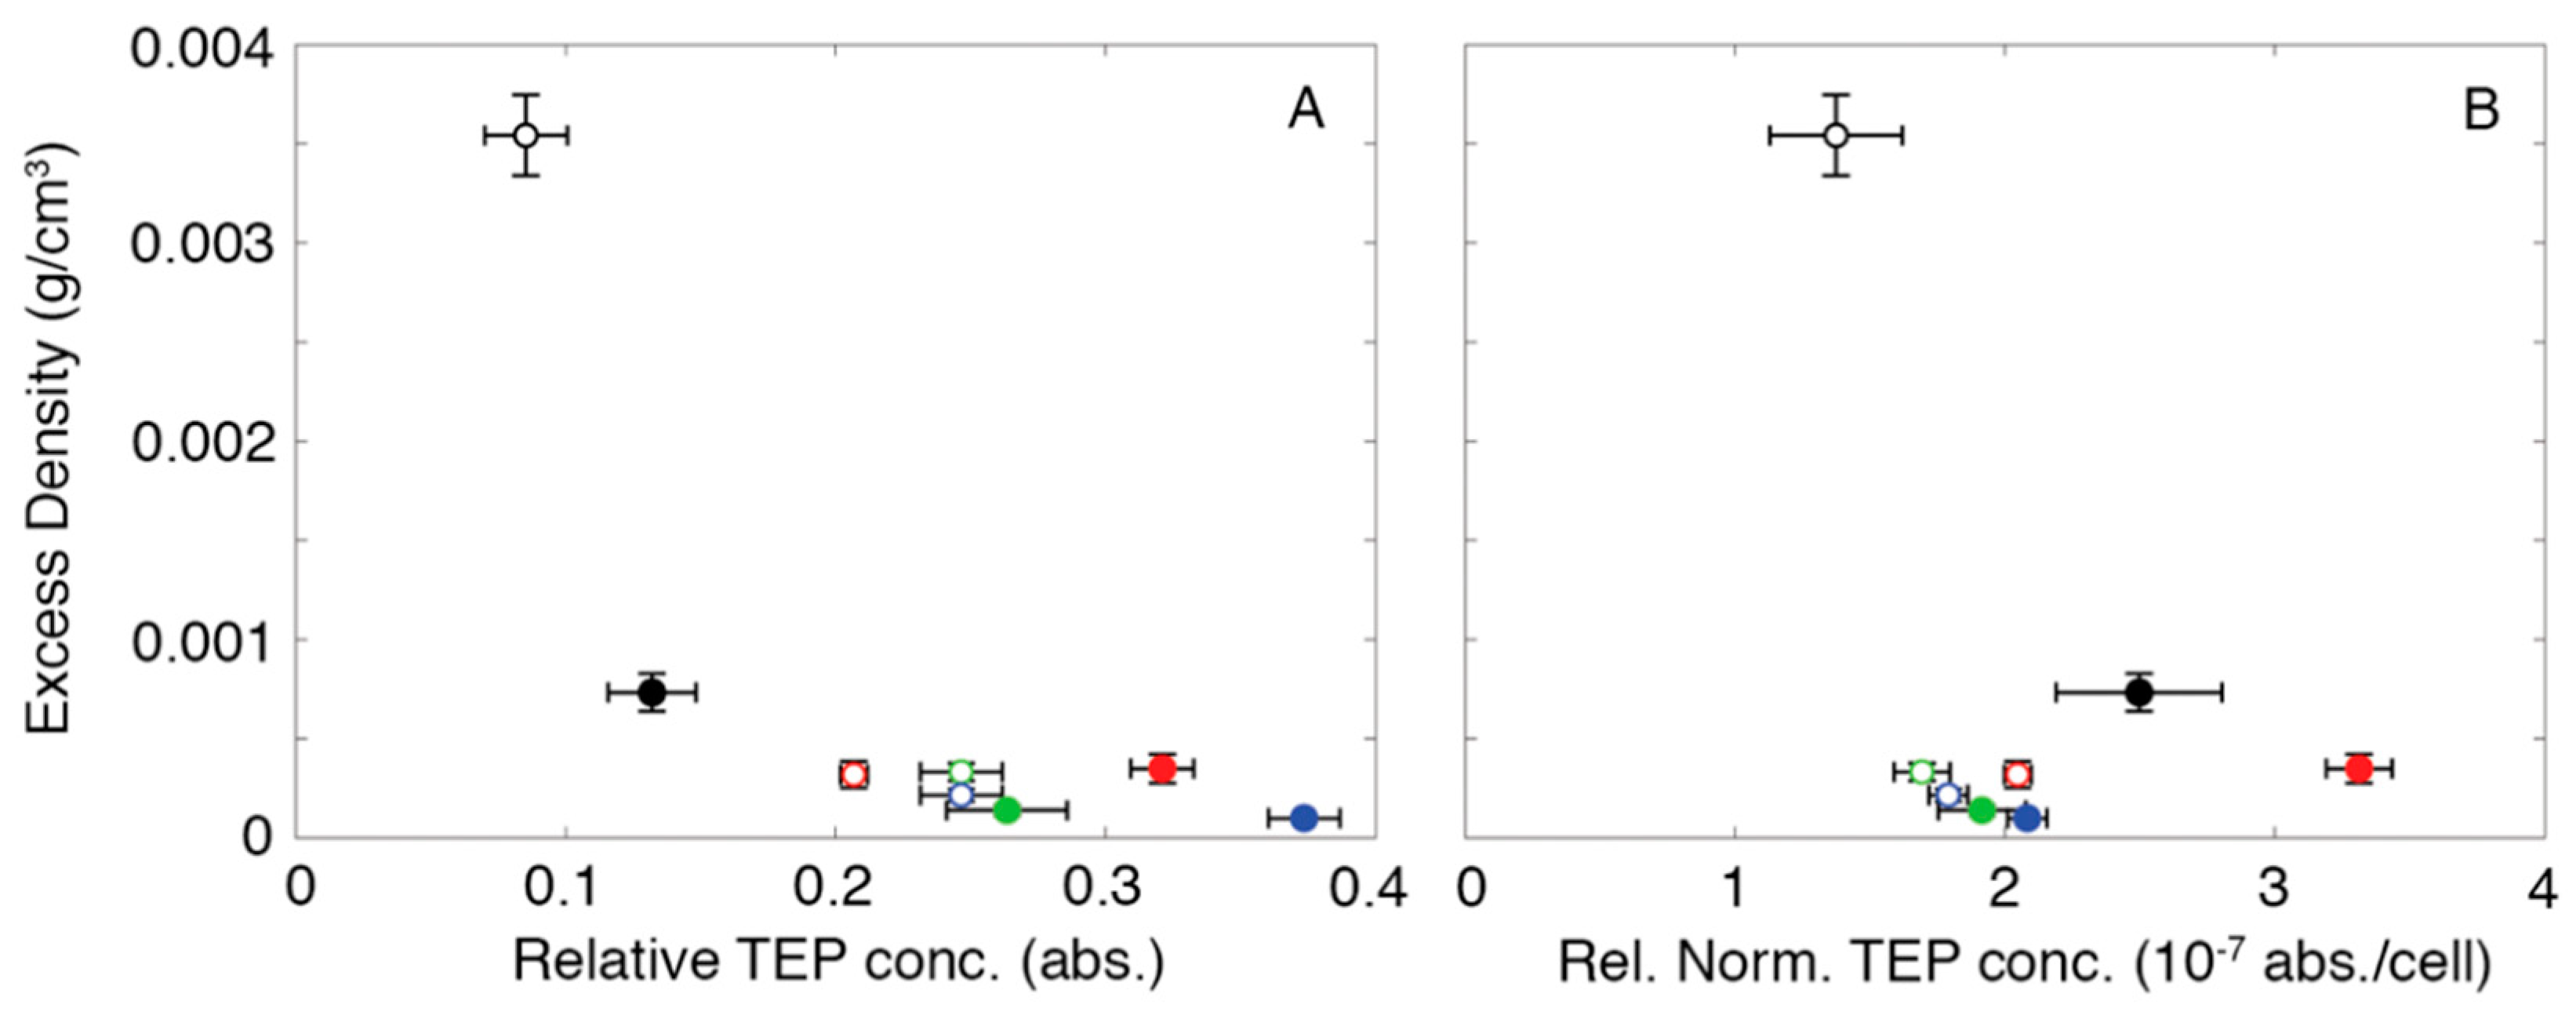
2.3. Measuring Relative TEP Concentration
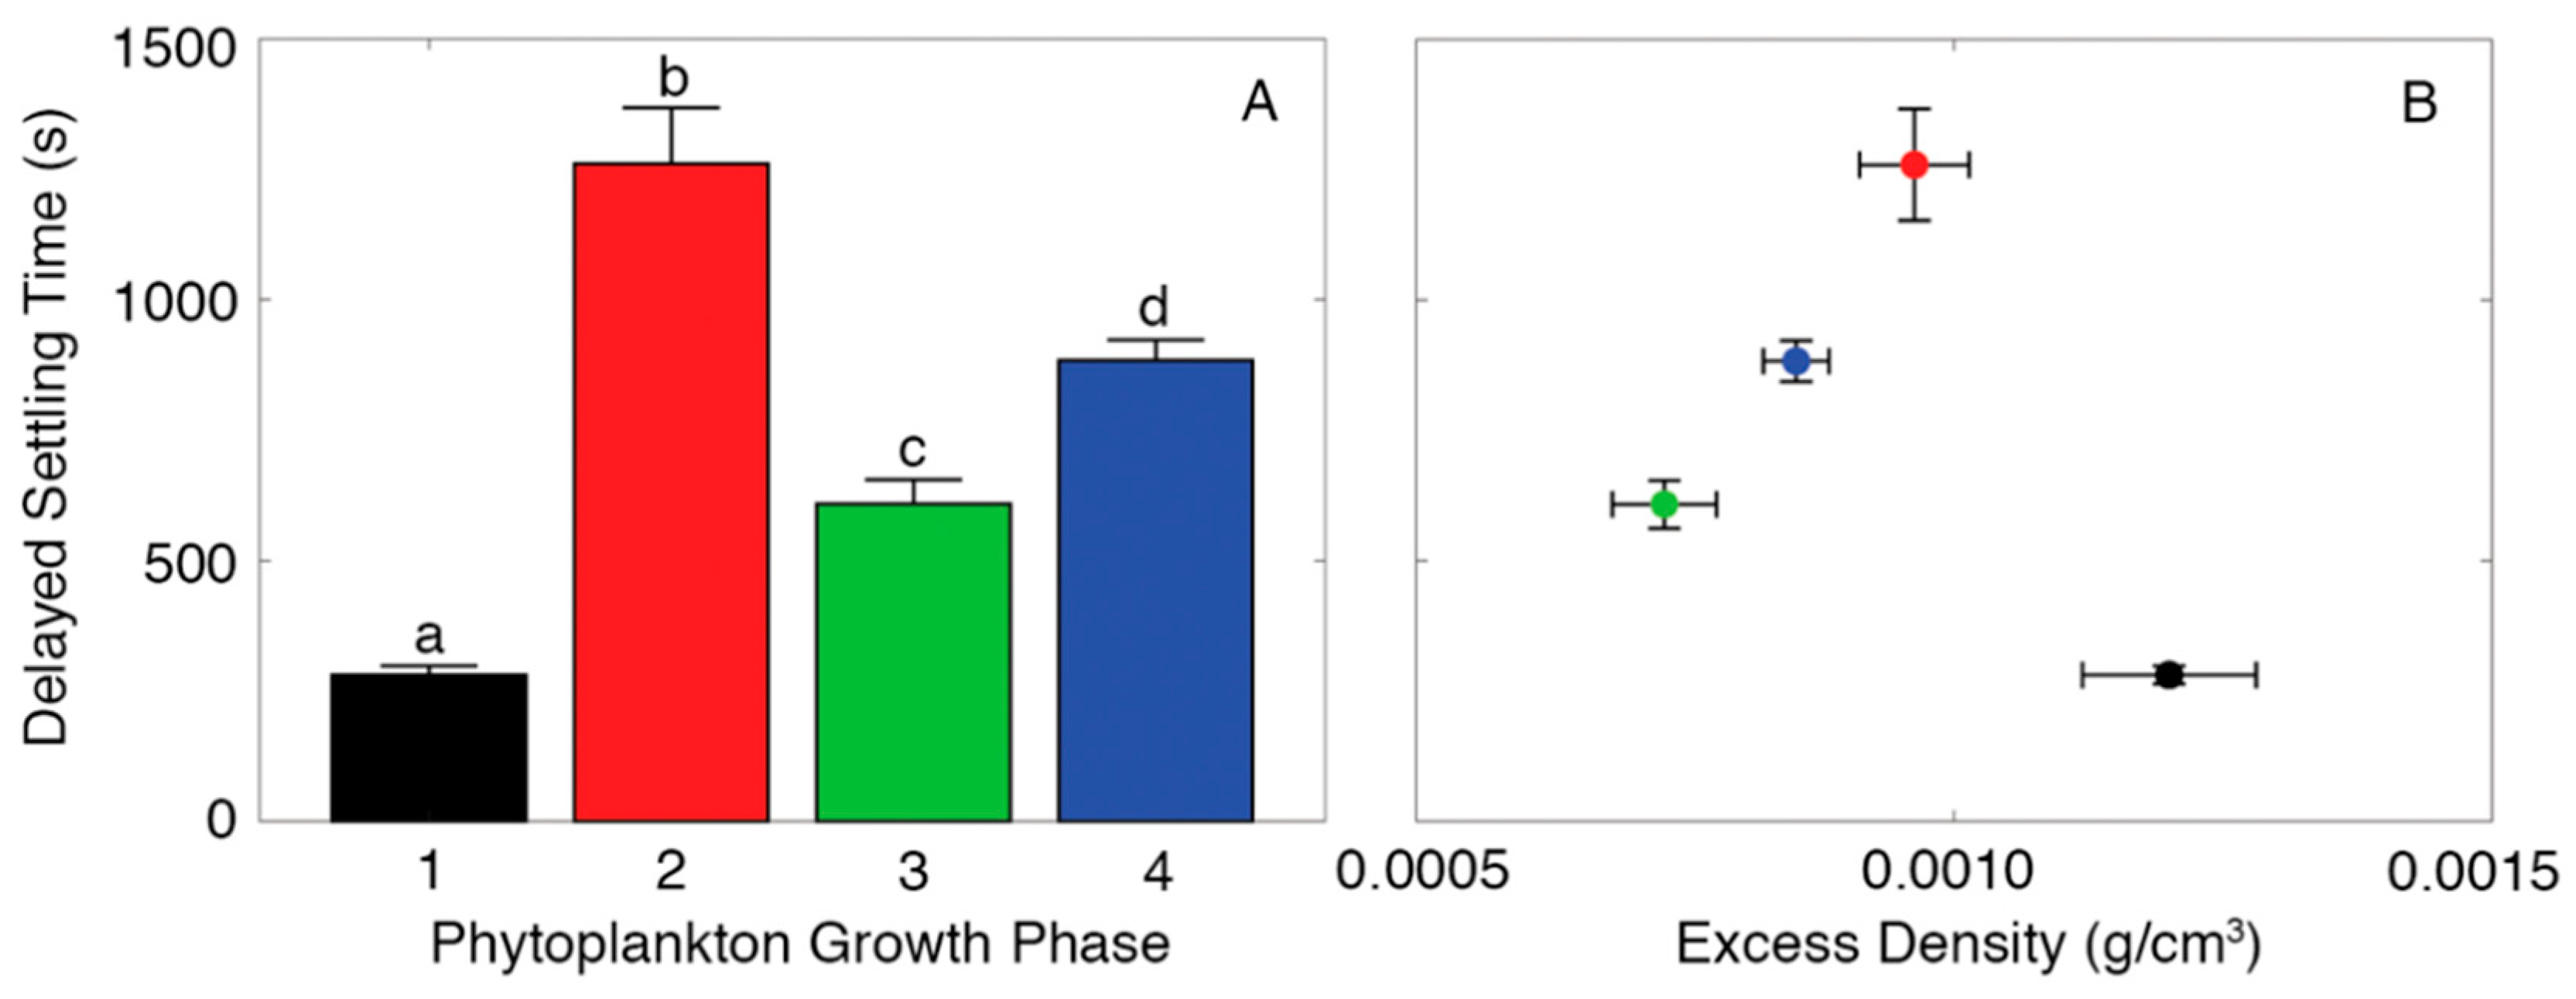
2.4. Measuring Delayed Settling Time of Aggregates at Sharp Density Gradients
3. Results
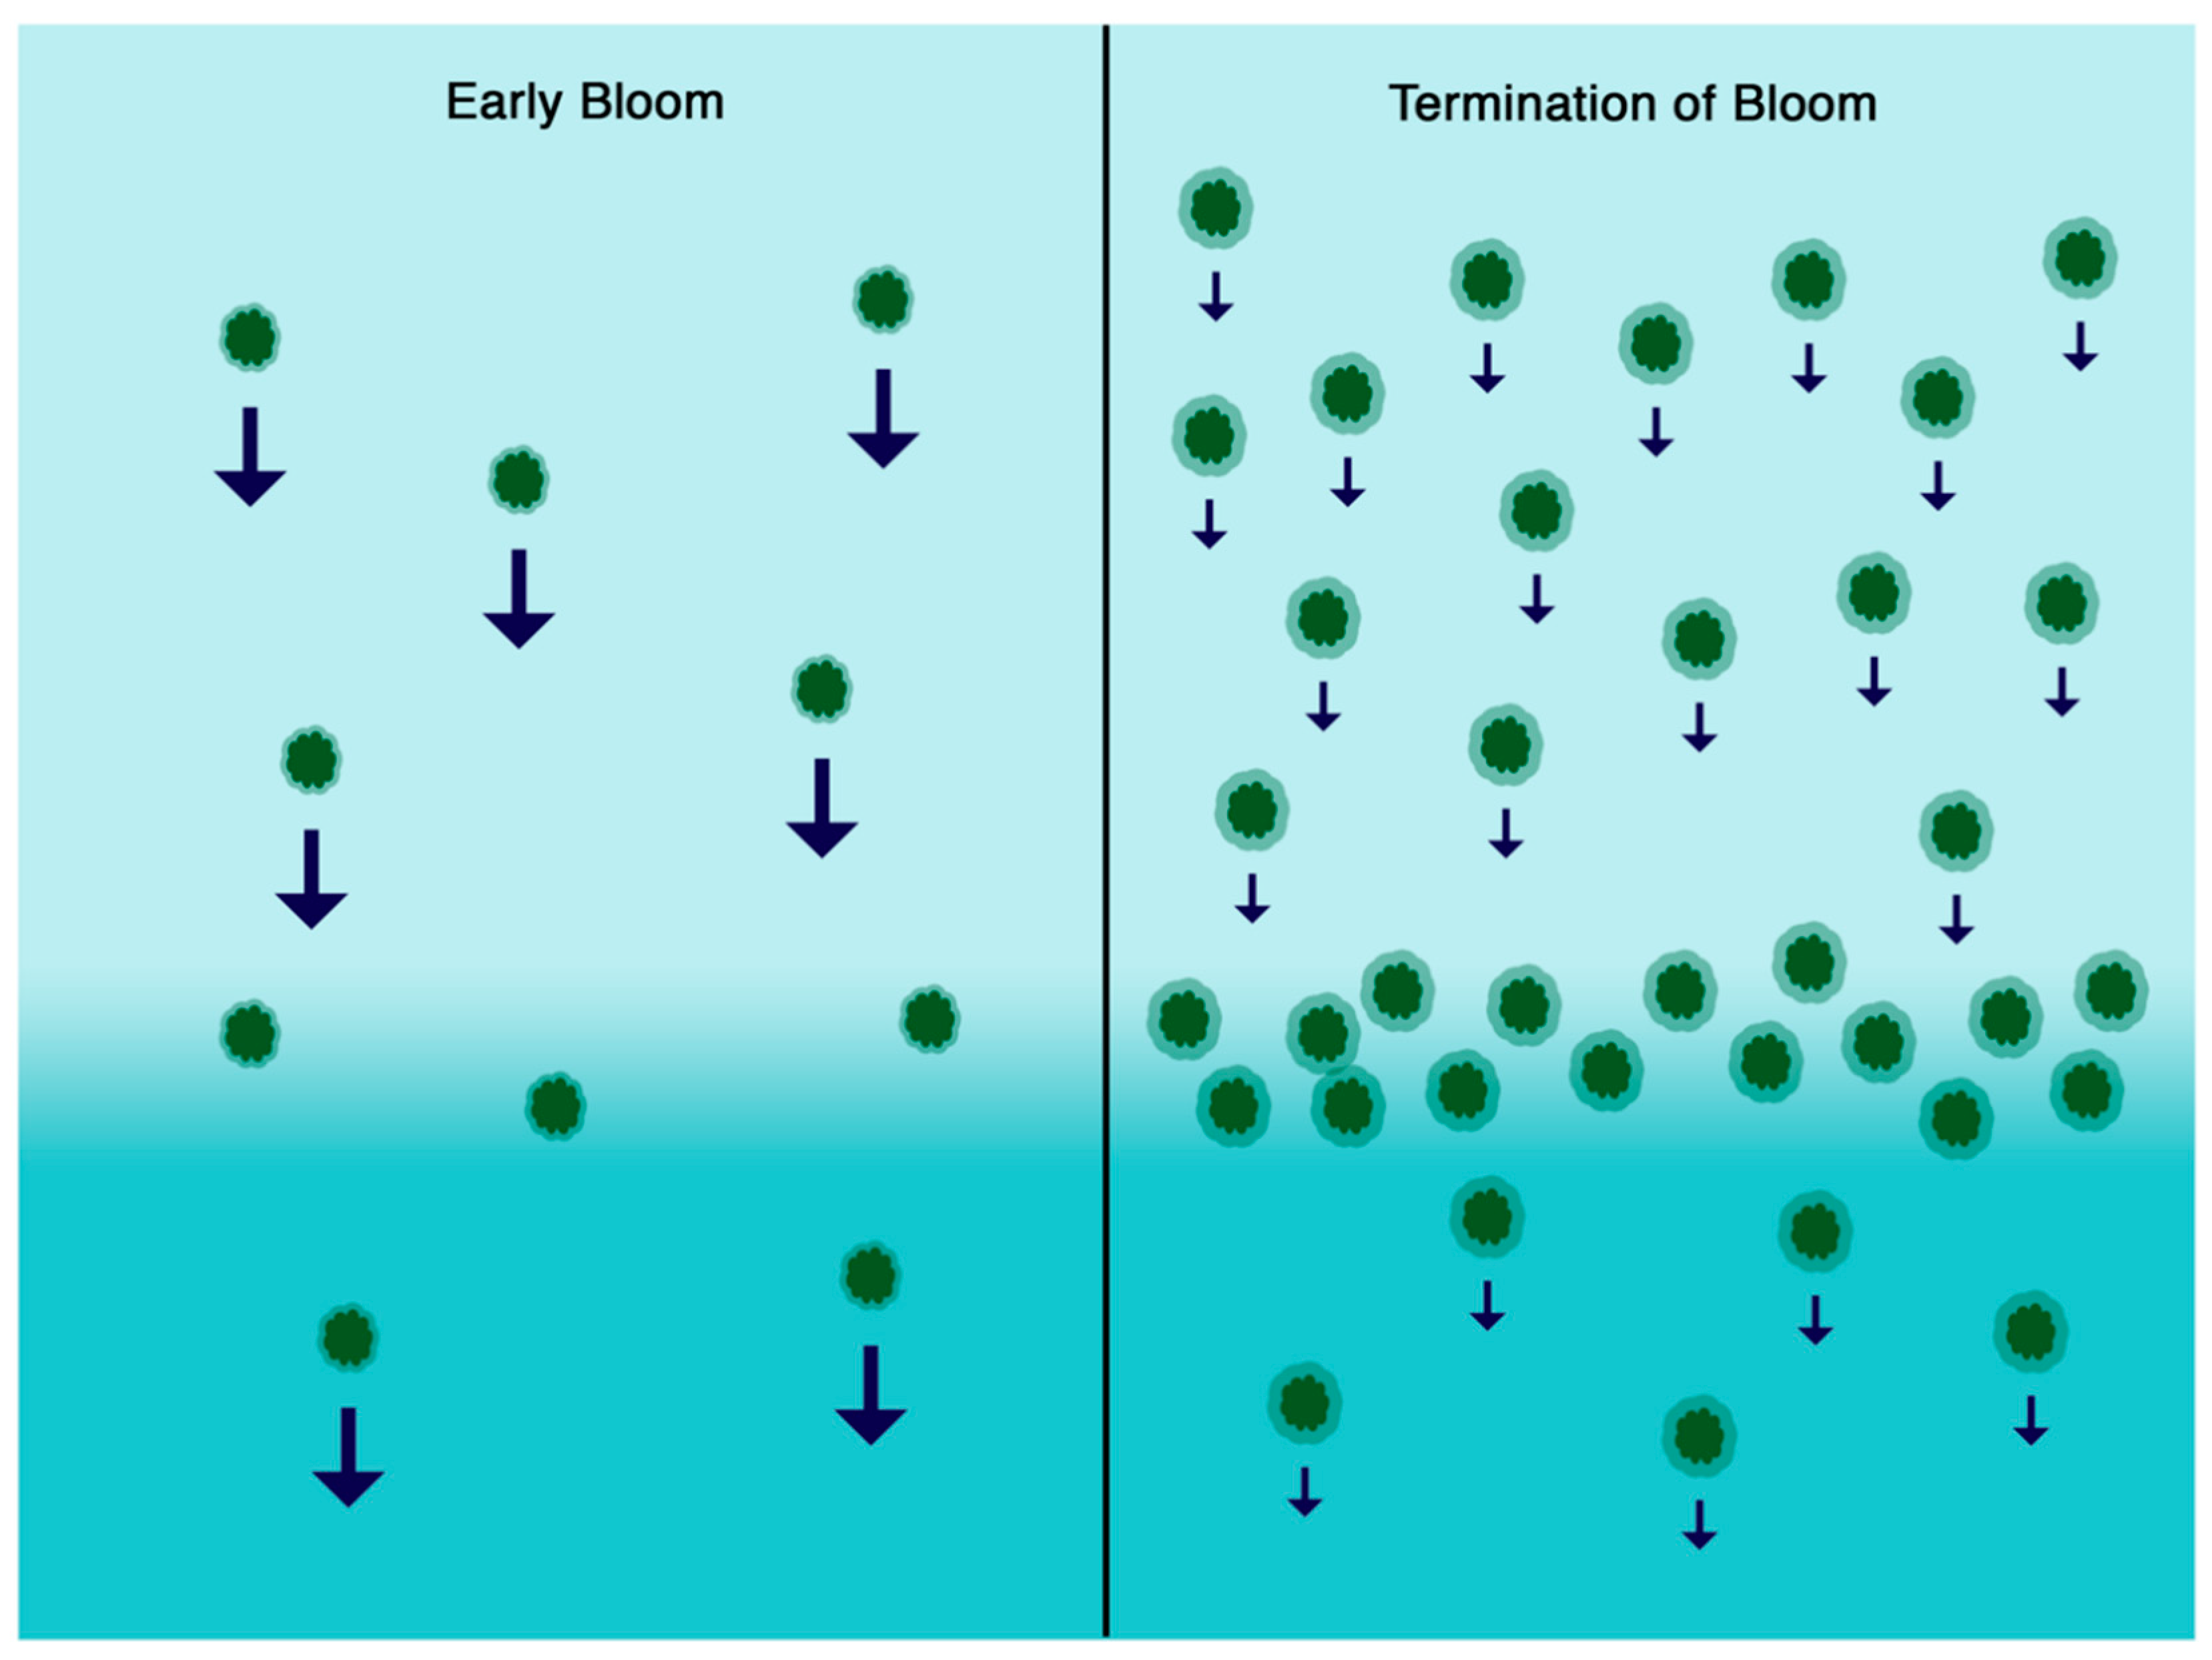
4. Discussion
Supplementary Materials
Author Contributions
Funding
Acknowledgments
Conflicts of Interest
References
- Turner, J.T. Zooplankton fecal pellets, marine snow, phytodetritus and the ocean’s biological pump. Prog. Oceanogr. 2015, 130, 205–247. [Google Scholar] [CrossRef]
- Alldredge, A.L.; Silver, M.M. Characteristics, Dynamics and Significance of Marine Snow. Prog. Oceonogr. 1988, 20, 41–82. [Google Scholar] [CrossRef]
- De La Rocha, C.L.; Passow, U. Factors influencing the sinking of POC and the efficiency of the biological carbon pump. Deep Sea Res. Part II Top. Stud. Oceanogr. 2007, 54, 639–658. [Google Scholar] [CrossRef]
- Burd, A.B.; Jackson, G.A. Particle Aggregation. Annu. Rev. Mar. Sci. 2009, 1, 65–90. [Google Scholar] [CrossRef] [PubMed]
- Guidi, L.; Stemmann, L.; Jackson, G.A.; Ibanez, F.; Claustre, H.; Legendre, L.; Picheral, M.; Gorsky, G. Effects of phytoplankton community on production, size and export of large aggregates: A world-ocean analysis. Limnol. Oceanogr. 2009, 54, 1951–1963. [Google Scholar] [CrossRef]
- Grossart, H.P.; Czub, G.; Simon, M. Algae–bacteria interactions and their effects on aggregation and organic matter flux in the sea. Environ. Microbiol. 2006, 8, 1074–1084. [Google Scholar] [CrossRef] [PubMed]
- Simon, H.; Lipsewers, Y.A.; Giebel, H.A.; Wiltshire, K.H.; Simon, M. Temperature effects on aggregation during a spring diatom bloom. Limnol. Oceanogr. 2014, 59, 2089–2100. [Google Scholar] [CrossRef]
- Beauvais, S.; Pedrotti, M.L.; Egge, J.; Iversen, K.; Marasé, C. Effects of turbulence on TEP dynamics under contrasting nutrient conditions: Implications for aggregation and sedimentation processes. Mar. Ecol. Prog. Ser. 2006, 323, 47–57. [Google Scholar] [CrossRef]
- Burns, W.G.; Marchetti, A.; Ziervogel, K. Enhanced formation of transparent exopolymer particles (TEP) under turbulence during phytoplankton growth. J. Plankton Res. 2019, 41, 349–361. [Google Scholar] [CrossRef]
- Kahl, L.A.; Vardi, A.; Schofield, O. Effects of phytoplankton physiology on export flux. Mar. Ecol. Prog. Ser. 2008, 354, 3–19. [Google Scholar] [CrossRef]
- Alldredge, A.L.; Passow, U.; Logan, B.E. The abundance and significance of a class of large, transparent organic particles in the ocean. Deep Sea Res. Part I Oceanogr. Res. Pap. 1993, 40, 1131–1140. [Google Scholar] [CrossRef]
- Mari, X.; Passow, U.; Migon, C.; Burd, A.B.; Legendre, L. Transparent exopolymer particles: Effects on carbon cycling in the ocean. Prog. Oceanogr. 2017, 151, 13–37. [Google Scholar] [CrossRef]
- Buesseler, K.O. The decoupling of production and particulate export in the surface ocean. Glob. Biogeochem. Cycles 1998, 12, 297–310. [Google Scholar] [CrossRef]
- Alldredge, A.L.; Gotschalk, C.; Passow, U.; Riebesell, U. Aggregation of diatom blooms: Insights from a mesocosm study. Deep Sea Res. Part II Top. Stud. Oceanogr. 1995, 42, 9–27. [Google Scholar] [CrossRef]
- Roca-Martí, M.; Puigcorbé, V.; Iversen, M.H.; Rutgers van der Loeff, M.; Klaas, C.; Cheah, W.; Bracher, A.; Masqué, P. High particulate organic carbon export during the decline of a vast diatom bloom in the Atlantic sector of the Southern Ocean. Deep-Sea Res. II. 2017, 138, 102–115. [Google Scholar]
- Passow, U. Production of transparent exopolymer particles (TEP) by phyto- and bacterioplankton. Mar. Ecol. Prog. Ser. 2002, 236, 1–12. [Google Scholar] [CrossRef]
- Deng, W.; Cruz, B.N.; Neuer, S. Effects of nutrient limitation on cell growth, TEP production and aggregate formation of marine Synechococcus. Aquat. Microb. Ecol. 2016, 78, 39–49. [Google Scholar] [CrossRef]
- Chen, J.; Thornton, D.C.O. Transparent exopolymer particle production and aggregation by a marine planktonic diatom (Thalassiosira weissflogii) at different growth rates. J. Phycol. 2015, 51, 381–393. [Google Scholar] [CrossRef] [PubMed]
- Kiørboe, T.; Andersen, K.P.; Dam, H.G. Coagulation efficiency and aggregate formation in marine phytoplankton. Mar. Biol. 1990, 107, 235–245. [Google Scholar] [CrossRef]
- Engel, A.; Schartau, M. Influence of transparent exopolymer particles (TEP) on sinking velocity of Nitzschia closterium aggregates. Mar. Ecol. Prog. Ser. 1999, 182, 69–76. [Google Scholar] [CrossRef]
- Prairie, J.C.; Ziervogel, K.; Arnosti, C.; Camassa, R.; Falcon, C.; Khatri, S.; McLaughlin, R.M.; White, B.L.; Yu, S. Delayed settling of marine snow at sharp density transitions driven by fluid entrainment and diffusion-limited retention. Mar. Ecol. Prog. Ser. 2013, 487, 185–200. [Google Scholar] [CrossRef]
- Prairie, J.C.; Ziervogel, K.; Camassa, R.; McLaughlin, R.M.; White, B.L.; Dewald, C.; Arnosti, C. Delayed settling of marine snow: Effects of density gradient and particle properties and implications for carbon cycling. Mar. Chem. 2015, 175, 28–38. [Google Scholar] [CrossRef]
- Prairie, J.C.; White, B.L. A model for thin layer formation by delayed particle settling at sharp density gradients. Cont. Shelf Res. 2017, 133, 37–46. [Google Scholar] [CrossRef]
- MacIntyre, S.; Alldredge, A.L.; Gotschalk, C.C. Accumulation of marine snow at density discontinuities in the water column. Limnol. Oceanogr. 1995, 40, 449–468. [Google Scholar] [CrossRef]
- Shanks, A.L.; Edmondson, E.W. Laboratory-made artificial marine snow: A biological model of the real thing. Mar. Biol. 1989, 101, 463–470. [Google Scholar] [CrossRef]
- Ploug, H.; Iversen, M.H.; Fischer, G. Ballast, sinking velocity, and apparent diffusivity within marine snow and zooplankton fecal pellets: Implications for substrate turnover by attached bacteria. Limnol. Oceanogr. 2008, 53, 1878–1886. [Google Scholar] [CrossRef]
- Alldredge, A.L.; Gotschalk, C. In situ settling behavior of marine snow. Limnol. Oceanogr. 1988, 33, 339–351. [Google Scholar] [CrossRef]
- Passow, U.; Alldredge, A.L. A dye-binding assay for the spectrophotometric measurement of transparent exopolymer particles (TEP). Limnol. Oceanogr. 1995, 40, 1326–1335. [Google Scholar] [CrossRef]
- Passow, U. Transparent exopolymer particles (TEP) in aquatic environments. Prog. Oceanogr. 2002, 55, 287–333. [Google Scholar] [CrossRef]
- Azetsu-Scott, K.; Passow, U. Ascending marine particles: Significance of transparent exopolymer particles (TEP) in the upper ocean. Limnol. Oceanogr. 2004, 49, 741–748. [Google Scholar] [CrossRef]
- Seebah, S.; Fairfield, C.; Ullrich, M.S.; Passow, U. Aggregation and sedimentation of Thalassiosira weissflogii (diatom) in a warmer and more acidified future ocean. PLoS ONE 2014, 9, e112379. [Google Scholar] [CrossRef]
- Grossart, H.P.; Kiørboe, T.; Tang, K.W.; Allgaier, M.; Yam, E.M.; Ploug, H. Interactions between marine snow and heterotrophic bacteria: Aggregate formation and microbial dynamics. Aquat. Microb. Ecol. 2006, 42, 19–26. [Google Scholar] [CrossRef]
- Gärdes, A.; Iversen, M.H.; Grossart, H.P.; Passow, U.; Ullrich, M.S. Diatom-associated bacteria are required for aggregation of Thalassiosira weissflogii. ISME J. 2011, 5, 436–445. [Google Scholar] [CrossRef]
- Thornton, D. Diatom aggregation in the sea: Mechanisms and ecological implications. Eur. J. Phycol. 2002, 37, 149–161. [Google Scholar] [CrossRef]
- McDonnell, A.M.P.; Buesseler, K.O. Variability in the average sinking velocity of marine particles. Limnol. Oceanogr. 2010, 55, 2085–2096. [Google Scholar] [CrossRef]
- Villa-Alfageme, M.; de Soto, F.; Le Moigne, F.A.C.; Giering, S.L.C.; Sanders, R.; García-Tenorio, R. Observations and modeling of slow-sinking particles in the twilight zone. Glob. Biogeochem. Cycles 2014, 28, 1327–1342. [Google Scholar] [CrossRef]
- Passow, U. Formation of rapidly-sinking, oil-associated marine snow. Deep Sea Res. Part II Top. Stud. Oceanogr. 2016, 129, 232–240. [Google Scholar] [CrossRef]
- Porter, A.; Lyons, B.P.; Galloway, T.S.; Lewis, C. Role of marine snows in microplastic fate and bioavailability. Environ. Sci. Technol. 2018, 52, 7111–7119. [Google Scholar] [CrossRef]
- Katija, K.; Choy, C.A.; Sherlock, R.E.; Sherman, A.D.; Robison, B.H. From the surface to the seafloor: How giant larvaceans transport microplastics into the deep sea. Sci. Adv. 2017, 3, e1700715. [Google Scholar] [CrossRef]
- Prairie, J.C.; Ziervogel, K.; Camassa, R.; McLaughlin, R.M.; White, B.L.; Dewald, C.; Arnosti, C. Ephemeral aggregate layers in the water column leave lasting footprints in the carbon cycle. Limnol. Oceanogr. Lett. 2017, 2, 202–209. [Google Scholar] [CrossRef]
- Möller, K.O.; St. John, M.; Temming, A.; Floeter, J.; Sell, A.F.; Herrmann, J.P.; Möllmann, C. Marine snow, zooplankton and thin layers: Indications of a trophic link from small-scale sampling with the Video Plankton Recorder. Mar. Ecol. Prog. Ser. 2012, 468, 57–69. [Google Scholar] [CrossRef]
- Kiørboe, T.; Lundsgaard, C.; Olesen, M.; Hansen, J.L.S. Aggregation and sedimentation processes during a spring phytoplankton bloom: A field experiment to test coagulation theory. J. Mar. Res. 1994, 52, 297–323. [Google Scholar] [CrossRef]
- Thornton, D.C.O.; Thake, B. Effect of temperature on the aggregation of Skeletonema costatum (Bacillariophyceae) and the implication for carbon flux in coastal waters. Mar. Ecol. Prog. Ser. 1998, 174, 223–231. [Google Scholar] [CrossRef]
- Mari, X. Does ocean acidification induce an upward flux of marine aggregates? Biogeosciences 2008, 5, 1023–1031. [Google Scholar] [CrossRef]
- Cisternas-Novoa, C.; Lee, C.; Tang, T.; de Jesus, R.; Engel, A. Effects of higher CO2 and temperature on exopolymer particle content and physical properties of marine aggregates. Front. Mar. Sci. 2019, 5, 500. [Google Scholar] [CrossRef]


| Experiment Number | Experiment Start Date | Days Each Culture was Grown Before Stopped | Aggregate Properties Measured | Number of Aggregates for Excess Density Measurements |
|---|---|---|---|---|
| 1 | 16 June 2015 | GP1: 6 GP2: 10 GP3: 13 GP4: 16 | excess density | GP1: 15 GP2: 22 GP3: 16 GP4: 17 |
| 2 | 28 July 2015 | GP1: 6 GP2: 10 GP3: 13 GP4: 16 | excess density, delayed settling time | GP1: 17 GP2: 19 GP3: 13 GP4: 15 |
| 3 | 1 August 2017 | GP1: 5 GP2: 9 GP3: 12 GP4: 15 | excess density, TEP concentration | GP1: 6 GP2: 6 GP3: 5 GP4: 2 |
| 4 | 12 August 2017 | GP1: 5 GP2: 9 GP3: 12 GP4: 15 | excess density, TEP concentration | GP1: 17 GP2: 5 GP3: 9 GP4: 6 |
© 2019 by the authors. Licensee MDPI, Basel, Switzerland. This article is an open access article distributed under the terms and conditions of the Creative Commons Attribution (CC BY) license (http://creativecommons.org/licenses/by/4.0/).
Share and Cite
Prairie, J.C.; Montgomery, Q.W.; Proctor, K.W.; Ghiorso, K.S. Effects of Phytoplankton Growth Phase on Settling Properties of Marine Aggregates. J. Mar. Sci. Eng. 2019, 7, 265. https://doi.org/10.3390/jmse7080265
Prairie JC, Montgomery QW, Proctor KW, Ghiorso KS. Effects of Phytoplankton Growth Phase on Settling Properties of Marine Aggregates. Journal of Marine Science and Engineering. 2019; 7(8):265. https://doi.org/10.3390/jmse7080265
Chicago/Turabian StylePrairie, Jennifer C., Quinn W. Montgomery, Kyle W. Proctor, and Kathryn S. Ghiorso. 2019. "Effects of Phytoplankton Growth Phase on Settling Properties of Marine Aggregates" Journal of Marine Science and Engineering 7, no. 8: 265. https://doi.org/10.3390/jmse7080265
APA StylePrairie, J. C., Montgomery, Q. W., Proctor, K. W., & Ghiorso, K. S. (2019). Effects of Phytoplankton Growth Phase on Settling Properties of Marine Aggregates. Journal of Marine Science and Engineering, 7(8), 265. https://doi.org/10.3390/jmse7080265