Article

Growth Aspects and Biochemical Composition of Synechococcus sp. MK568070 Cultured in Oil Refinery Wastewater

1
Ruđer Bošković Institute, Bijenička cesta 54, 10000 Zagreb, Croatia
2
INA PLC, Lovinčićeva 4, 10000 Zagreb, Croatia
*
Author to whom correspondence should be addressed.
J. Mar. Sci. Eng. 2019, 7(6), 164; https://doi.org/10.3390/jmse7060164
Submission received: 21 March 2019 / Revised: 12 May 2019 / Accepted: 23 May 2019 / Published: 28 May 2019
(This article belongs to the Section Marine Biology)

Abstract

:
The aim of the study was to explore the possibility of bioremediation of oil refinery wastewaters by the cyanobacterium Synechococcus sp. MK568070, isolated from the Adriatic Sea. The potential of biomass and lipid production was explored upon cultivation on oil refinery wastewater with excess CO2 after the removal of nutrients. The strain grew well in a wide range of salinities and ammonium concentrations, and was further tested on the wastewater from local oil refinery plant of various N-composition. Growth experiment under optimized conditions was used to analyze the lipid, carbohydrate and protein dynamics. The biomass yield was highly dependent on nutrient source and concentration, salinity and CO2 addition. Highest biomass yield was 767 mg/L of dry weight. Towards the end of the experiment the decline in carbohydrate to 18.9% is visible, whereas at the same point lipids, in particular saturated fatty acid methyl esters (FAME), started to accumulate within the cells. The content of lipids at the end of the experiment was 21.4%, with the unsaturation index 0.45 providing good biofuel feedstock characteristics. Fourier Transform Infrared (FTIR) spectroscopy analysis demonstrated a high degree of lipid accumulation in respect to proteins, along with the structural changes and biomass accumulation. In addition, the N-removal from the wastewater was >99% efficient. The potential of lipid accumulation, due to the functional photosynthesis even at the minimal cell quota of nutrients, is critical for the usage of excess industrial CO2 and its industrial transformation to biodiesel. These findings enable further considerations of Synechococcus sp. (MK568070) for the industrial scale biomass production and wastewater remediation.

1. Introduction

Microalgae have recently drawn a lot of attention as promising candidates for CO2 neutral biofuel production. However, highly competitive crude oil prices, as well as the high expenses related to biomass-to-biofuel processing, are hindering its economic sustainability [1]. Efforts to overcome problematic economical aspects of the biofuel production from microalgae are directed towards (i) the increase in biomass yield and cellular lipid content by transgenic engineering [2], (ii) optimization of cogeneration process including the use of the excess heat, water and flue gases from the industry and (iii) usage of the effluent water after phycoremediation [3] in agriculture and other purposes.
Some selected wild strains of microalgae can naturally produce a high proportion of valuable products such as lipids, carbohydrates or proteins, whereas recent advances in genetic engineering opened the possibilities to produce an even greater variety of valuable molecules useful for food, chemical and pharmaceutical industries [1,2]. Although it is rarely possible to achieve as high a proportion of valuable compounds in a wild strain, as in a genetically modified one there are many advantages in the cultivation of non-transgenic, indigenous algal flora [4,5]. Mass production of indigenous microalgae avoids the possible risks associated with large-scale propagation of genetically modified microorganisms and legal constraints related to their use [6].
Cyanobacteria have large surface/volume ratio due to relatively small cell size (picocyanobacteria and nanocyanobacteria), high nutrient uptake efficiency and high reproduction rates. However, these traits are strongly dependent on the environmental conditions as well as on the species individual phenotypic adaptability. Cyanobacteria vary in preference for light intensity, temperature, nutrient concentrations, salinity and pH, as well as in capabilities to tolerate different ammonia, heavy metals and other toxic substances concentrations [7]. Many studies exist on municipal wastewater phycoremediation [8,9] and some authors explore the growth of cyanobacteria on swine [10] or poultry litter effluent as well as the paper industry [11] or carpet industry [12]. However, the viability of cyanobacteria in industrial wastewater is still a challenge. The untreated petrochemical industry effluent is, thus, rich in ammonium and because of the presence of various growth inhibiting and toxic substances (such as toluene, xylene, benzene, thiols, phenols, sulfides, cyanides, heavy metals, ammonia, etc.) may represent a hostile environment for microalgal growth [13]. However, we hypothesize that due to their high stoichiometric flexibility, high tolerance to salinity stress, photoheterotrophic metabolism, as well as capabilities in the degradation of crude oil [14] cyanobacteria make good candidates for growth on heavily polluted and toxic oil refinery wastewaters. Moreover, if present in trace amounts, the metals such as Cu, Zn, Ni, etc. may represent micronutrients for growing algae [9,11].
Most of the preselected potentially oleaginous species [15,16] have not yet been systematically evaluated for the capacities in fatty acid production [17], and/or growth on wastewater. Since nutrient quality can severely affect growth rates and biochemical composition of biomass feedstock, optimization is required in order to produce a high proportion of lipids along with the fast growth. In cyanobacteria, fatty acids are doubly important, as membrane lipids and as constituents of glycolipids, which form the thylakoid membranes where photosynthesis takes place. Cyanobacteria often contain significant quantities of some essential polyunsaturated fatty acids (PUFAs) such as C18 linoleic (18:2ω6) and α-linolenic (18:3ω3) acids whose production can reach up to 20% of the cellular dry weight via genetic engineering [18]. The species rich in saturated fatty acids (SFAs) are good candidates for biofuel production whereas species rich in PUFAs are considered more appropriate for production of nutrition supplements, animal feed, etc. [19]. In cyanobacteria lipid content rarely exceeds 20% of the dry algal biomass though under certain growth conditions it can reach as high as 85%, bringing the exploitation closer to its economic sustainability [20]. Regulating the changes in lipid content is of utmost importance to the protection of the cellular metabolic functions, and a response to environmental stress. By regulating the saturation degree of the structural fatty acid profile, cyanobacteria maintain the membrane integrity/fluidity under pressures such as desiccation, heat-shock, salinity changes or the presence of toxic substances. There is also the dependence of desiccation tolerance on the accumulation of sucrose, trehalose or more complex carbohydrate molecules in cyanobacteria, i.e., in Synechococcus sp., Synechocystis sp., etc. [21]. The physiological stress of nutrient starvation leads to lipid biosynthesis and accumulation in the cells. However, the photosynthesis process is highly protein bound and P-dependent and may result in lower biomass production and overall lipid yield.
We tested Synechococcus sp. MK568070 isolated from the Adriatic Sea for growth on the oil refinery wastewater. Potential of the tested strain for production of biofuel was assessed through the analysis of lipid content and composition, as well as changes in fatty acids, carbohydrates and protein concentrations along with the growth dynamics monitored during the uptake of nutrients from wastewater. Herein we present the first results of marine Synechococcus species growth and nutrient sequestration in a heavily polluted, oil refinery wastewater.

2. Materials and Methods

2.1. Wastewater Properties

Oil refinery wastewater (WW) from three different sources (1–3) of the same plant were used in experiments. The WWs contained different concentrations of dissolved inorganic nitrogen (DIN) and phosphorus (DIP i.e., orthophosphate) and dissolved organic phosphorus (DOP). Of note, measurements of DIP, in fact, represent soluble reactive phosphorus (SRP) because of the acid-labile fraction of DOP, potentially participating with orthophosphate in the formation of the blue complex [22]. WW were pre-filtered through 0.2 µm polycarbonate filters (Whatman) and stored at −22 °C before utilization. The composition of all used effluents is presented in Table 1.
The wastewaters differed significantly in NH4+ and NO3 concentrations. Nitrification-phase wastewater (WW1) contained most of the nitrogen in the NH4+ form, and the resulting DIN/SRP ratio was 8. The 2nd wastewater (WW2) contained both NH4+ and NO3 and a high proportion of organic phosphorus because of the presence of sanitary effluent with the resulting DIN/SRP with a value of 6. The untreated oil refinery wastewater (WW3) contained the highest concentrations of NH4+ and hydrocarbons and high chemical oxygen demand (INA PLC unpublished data). In WW3 both organic and inorganic P were very scarce and for successful microbial growth, this WW needs to be enriched with bioavailable P. In addition, WW3 contained elevated concentrations of chemicals potentially inhibiting the cyanobacteria growth: mercaptans (<64 mg/L−1), sulfides (<122 mg/L−1) and hydrocarbons (<152 mg/L−1). The traces of heavy metals are below the referent values for coastal sea water (INA PLC, unpublished data).

2.2. Cyanobacteria Isolation and Culture Maintenance

The surface seawater for cyanobacteria isolation was sampled in the vicinity of the oil refinery WW outlet in Urinj Bay (Adriatic Sea) in May 2017. Isolation was performed through the subsequent plating and isolation on solid and liquid medium (PCRS11-Red Sea, Roscoff Culture Collection) amended with 10% of WW3. Cells were grown at 26 °C and photon flux density of 80 µm/(m2s) of 12:12 day/night light cycle with continuous stirring. The isolate was determined by 16S rDNA sequencing. Internal transcribed spacer (ITS) region was PCR amplified from the extracted DNA by using primers CYA106F (5′-CGGACGGGTGAGTAACGCGTGA) and 23S0R (5′-CTTCGCCTCTGTGTGCCTAGGT) specific for cyanobacteria. Clones showing different pattern were sent to Macrogen (Amsterdam, The Netherlands) for sequencing of the amplified ITS region with a reverse primer CYA-1380R (5′-TAACGACTTCGGGCGTGACC). The identified strain selected as capable of growing in the NH4+ enriched industrial wastewater was identified as picocyanobacteria Synechococcus; Synechococcales; Synechococcaceae. The sequence was deposited into the National NCBI GenBank database (https://www.ncbi.nlm.nih.gov/) under accession number MK568070 (RBI unpublished data).

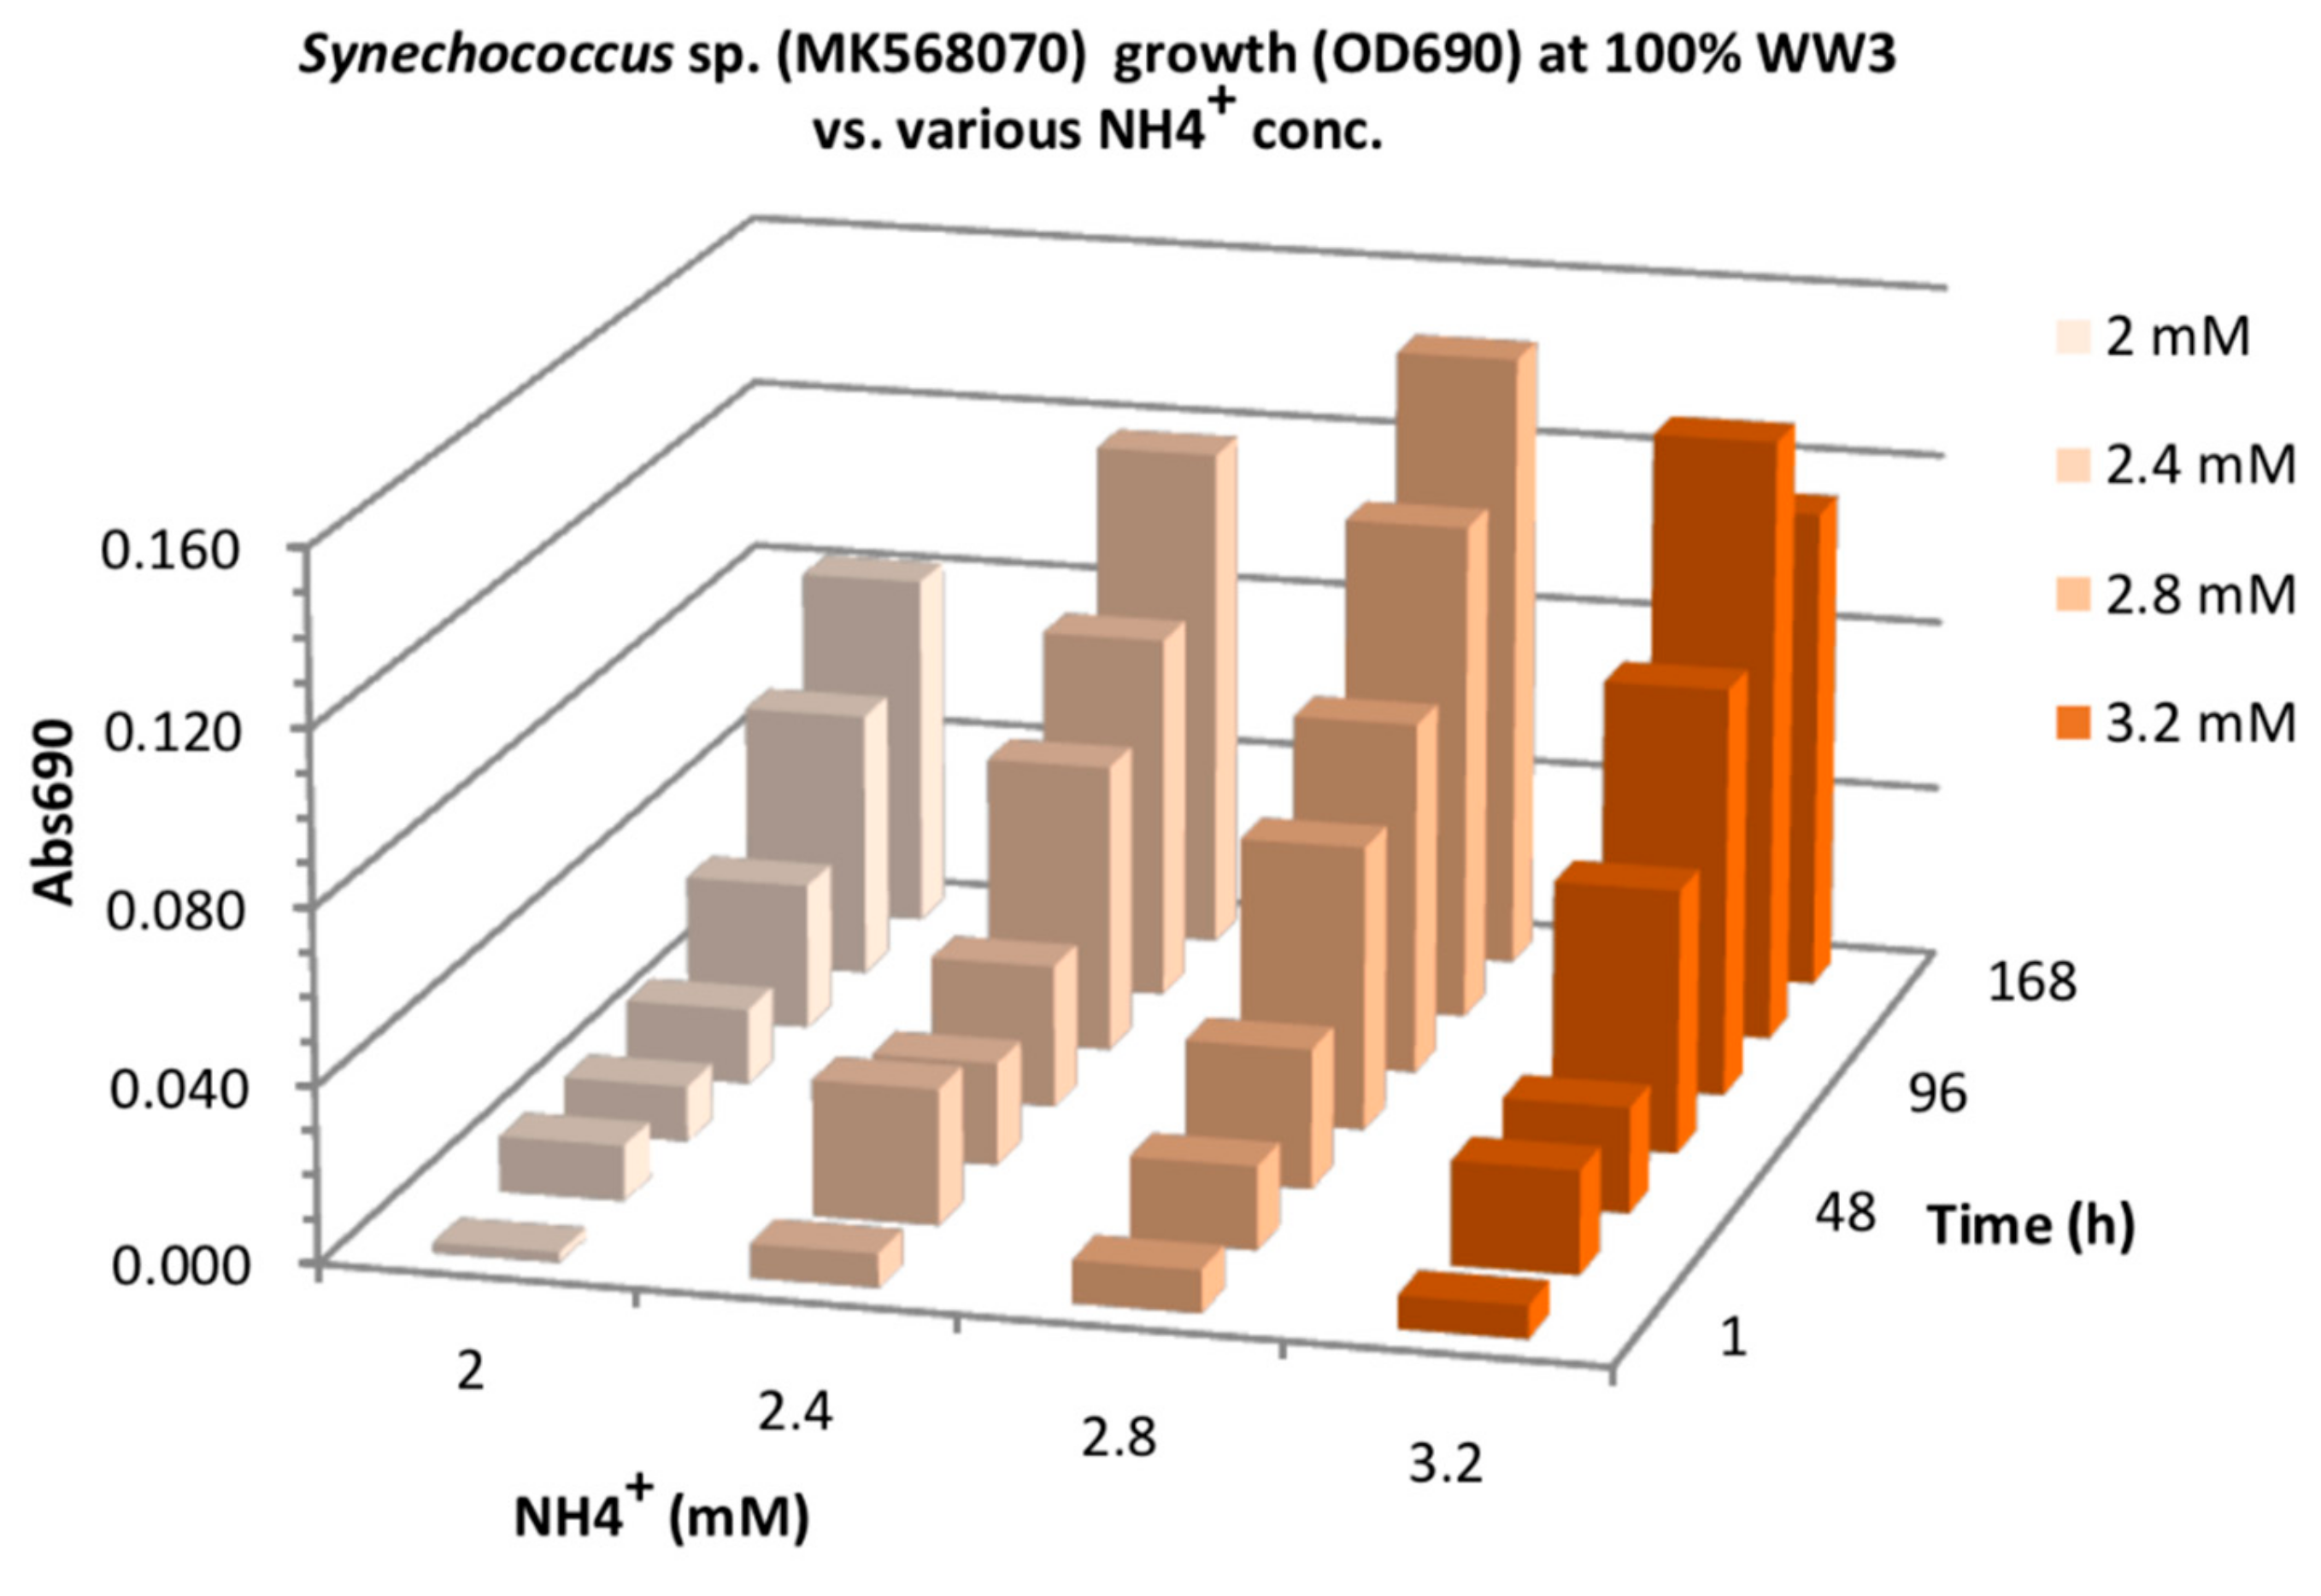
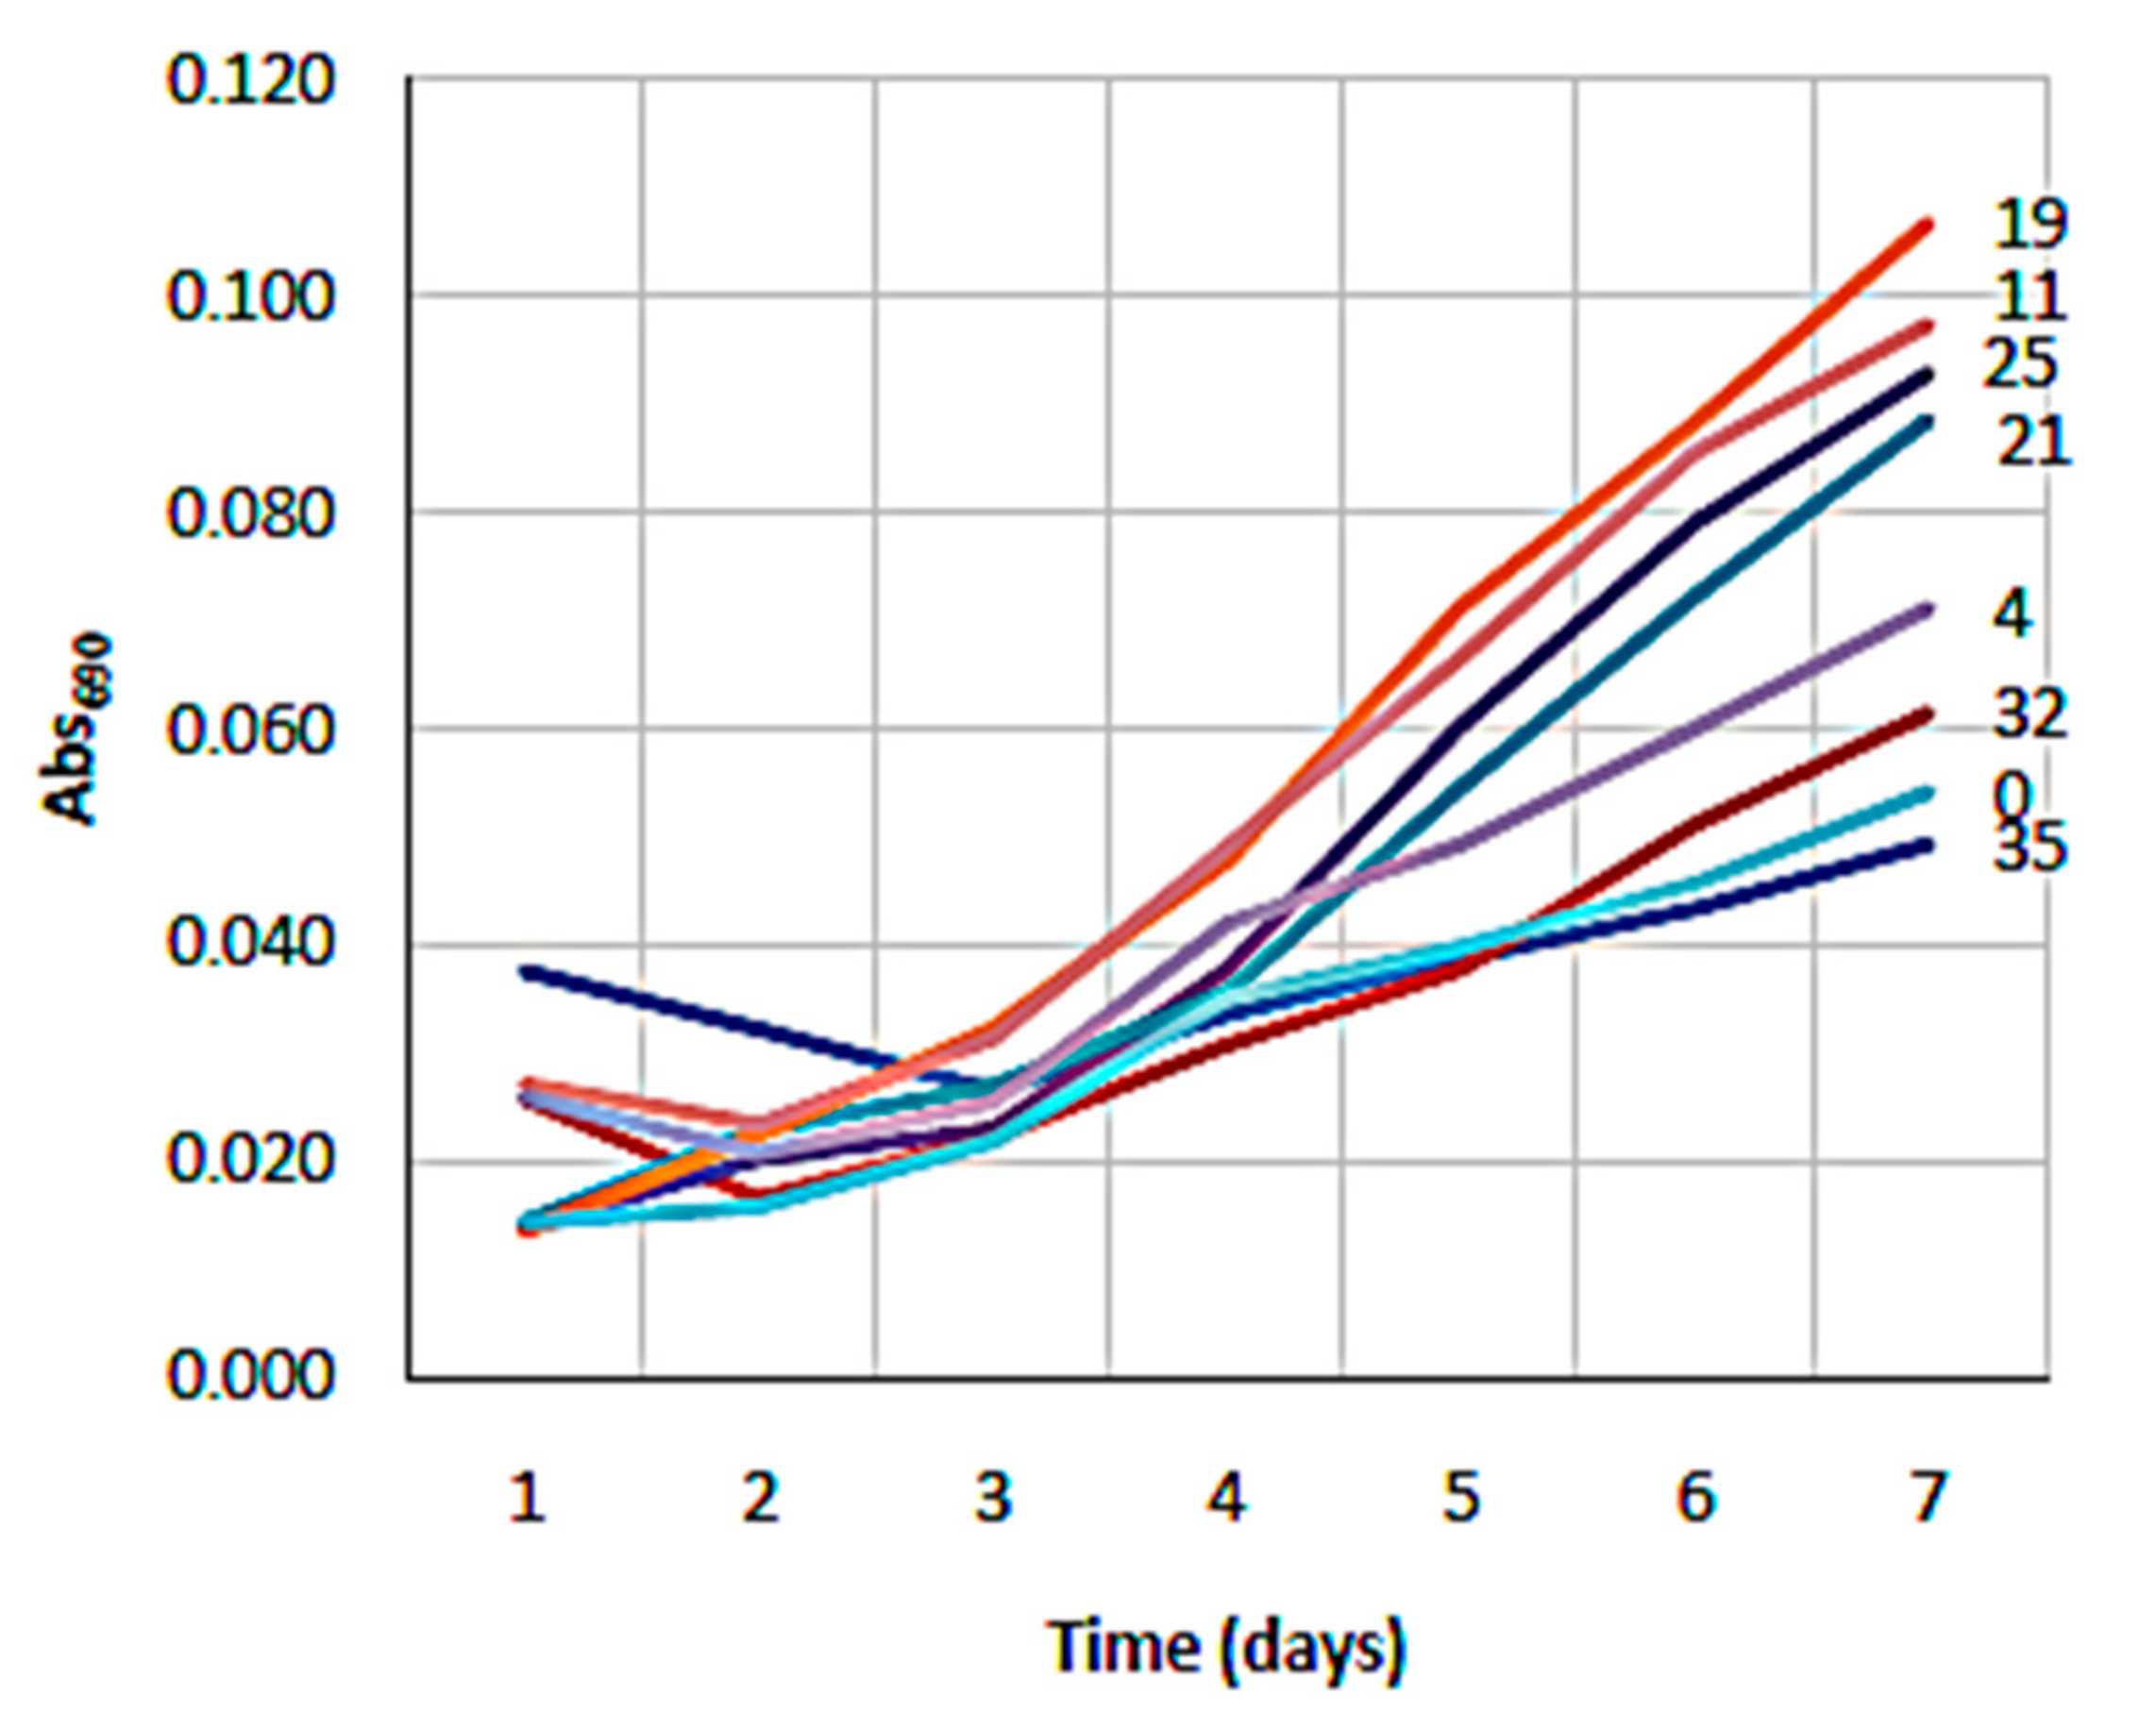
2.3. NH4+ and Salinity Tolerance Testing

To test the growth under different salinity and ammonium concentrations, short-term experiments in microwell plates were performed. A range of (i) four NH4+ concentrations and (ii) eight salinities were prepared as described in the paragraphs below. Each microwell contained 250 µL of the respective solution and was inoculated with 20 µL of Synechococcus sp. MK568070 culture. Microwells were incubated at 25 ± 0.1 °C and photon flux density of 80 µm/(m2s) of 12:12 day/night light cycle. Optical density at λ = 690 nm (OD690) was recorded daily as a proxy for growth using Multiskan Ascent microplate reader 354 (Thermo Labsystems Oy, Finland). Daily OD690 values were calculated by subtracting the average OD690 of the blanks from the average OD690 values of inoculated wells for each salinity and species. For detecting outlier values in OD690 measurements, we used a modified z-score method [23].
Four concentrations of NH4+ (2.0, 2.4, 2.8 and 3.2 mM) were prepared using the filtered (0.2 µm) WW3 To cover the common annual range of NH4+/NH3 concentration in the WW it was either diluted with distilled H2O, or amended with inorganic N. Dissolved inorganic nitrogen (DIN) and soluble reactive phosphorus (SRP) concentrations were adjusted by addition of stock solutions of ammonium-sulfate (400 mM) and phosphate buffer (100 mM). The DIN/SRP ratio was set to 8 simulating the DIN/SRP of the growth medium. Salinity was adjusted to 35 by amendment of NaCl. The prepared solutions were arranged in microwell plates in triplicates. Deionized water (250 µL) with inoculum (20 µL) was used as a blank. According to Bowen et al. [24], at pH of 8.3 and ambient temperature of 25 ± 1 °C, NH3 concentrations (a toxic form) in the prepared solutions were ~10% of the targeted NH4+ concentrations.
For salinity testing, appropriate growth medium (PCRS11-Red Sea, Roscoff Culture Collection) was prepared in the following range of salinities: 0, 4, 11, 19, 21, 25, 32 and 35. The salinity was adjusted by addition of NaCl salt into the medium. Wells contained 250 µL of media inoculated with 20 µL of microalgae culture. Measurements for Synechococcus sp. MK568070 and blanks (medium without inoculum) were determined in triplicates for each salinity level.

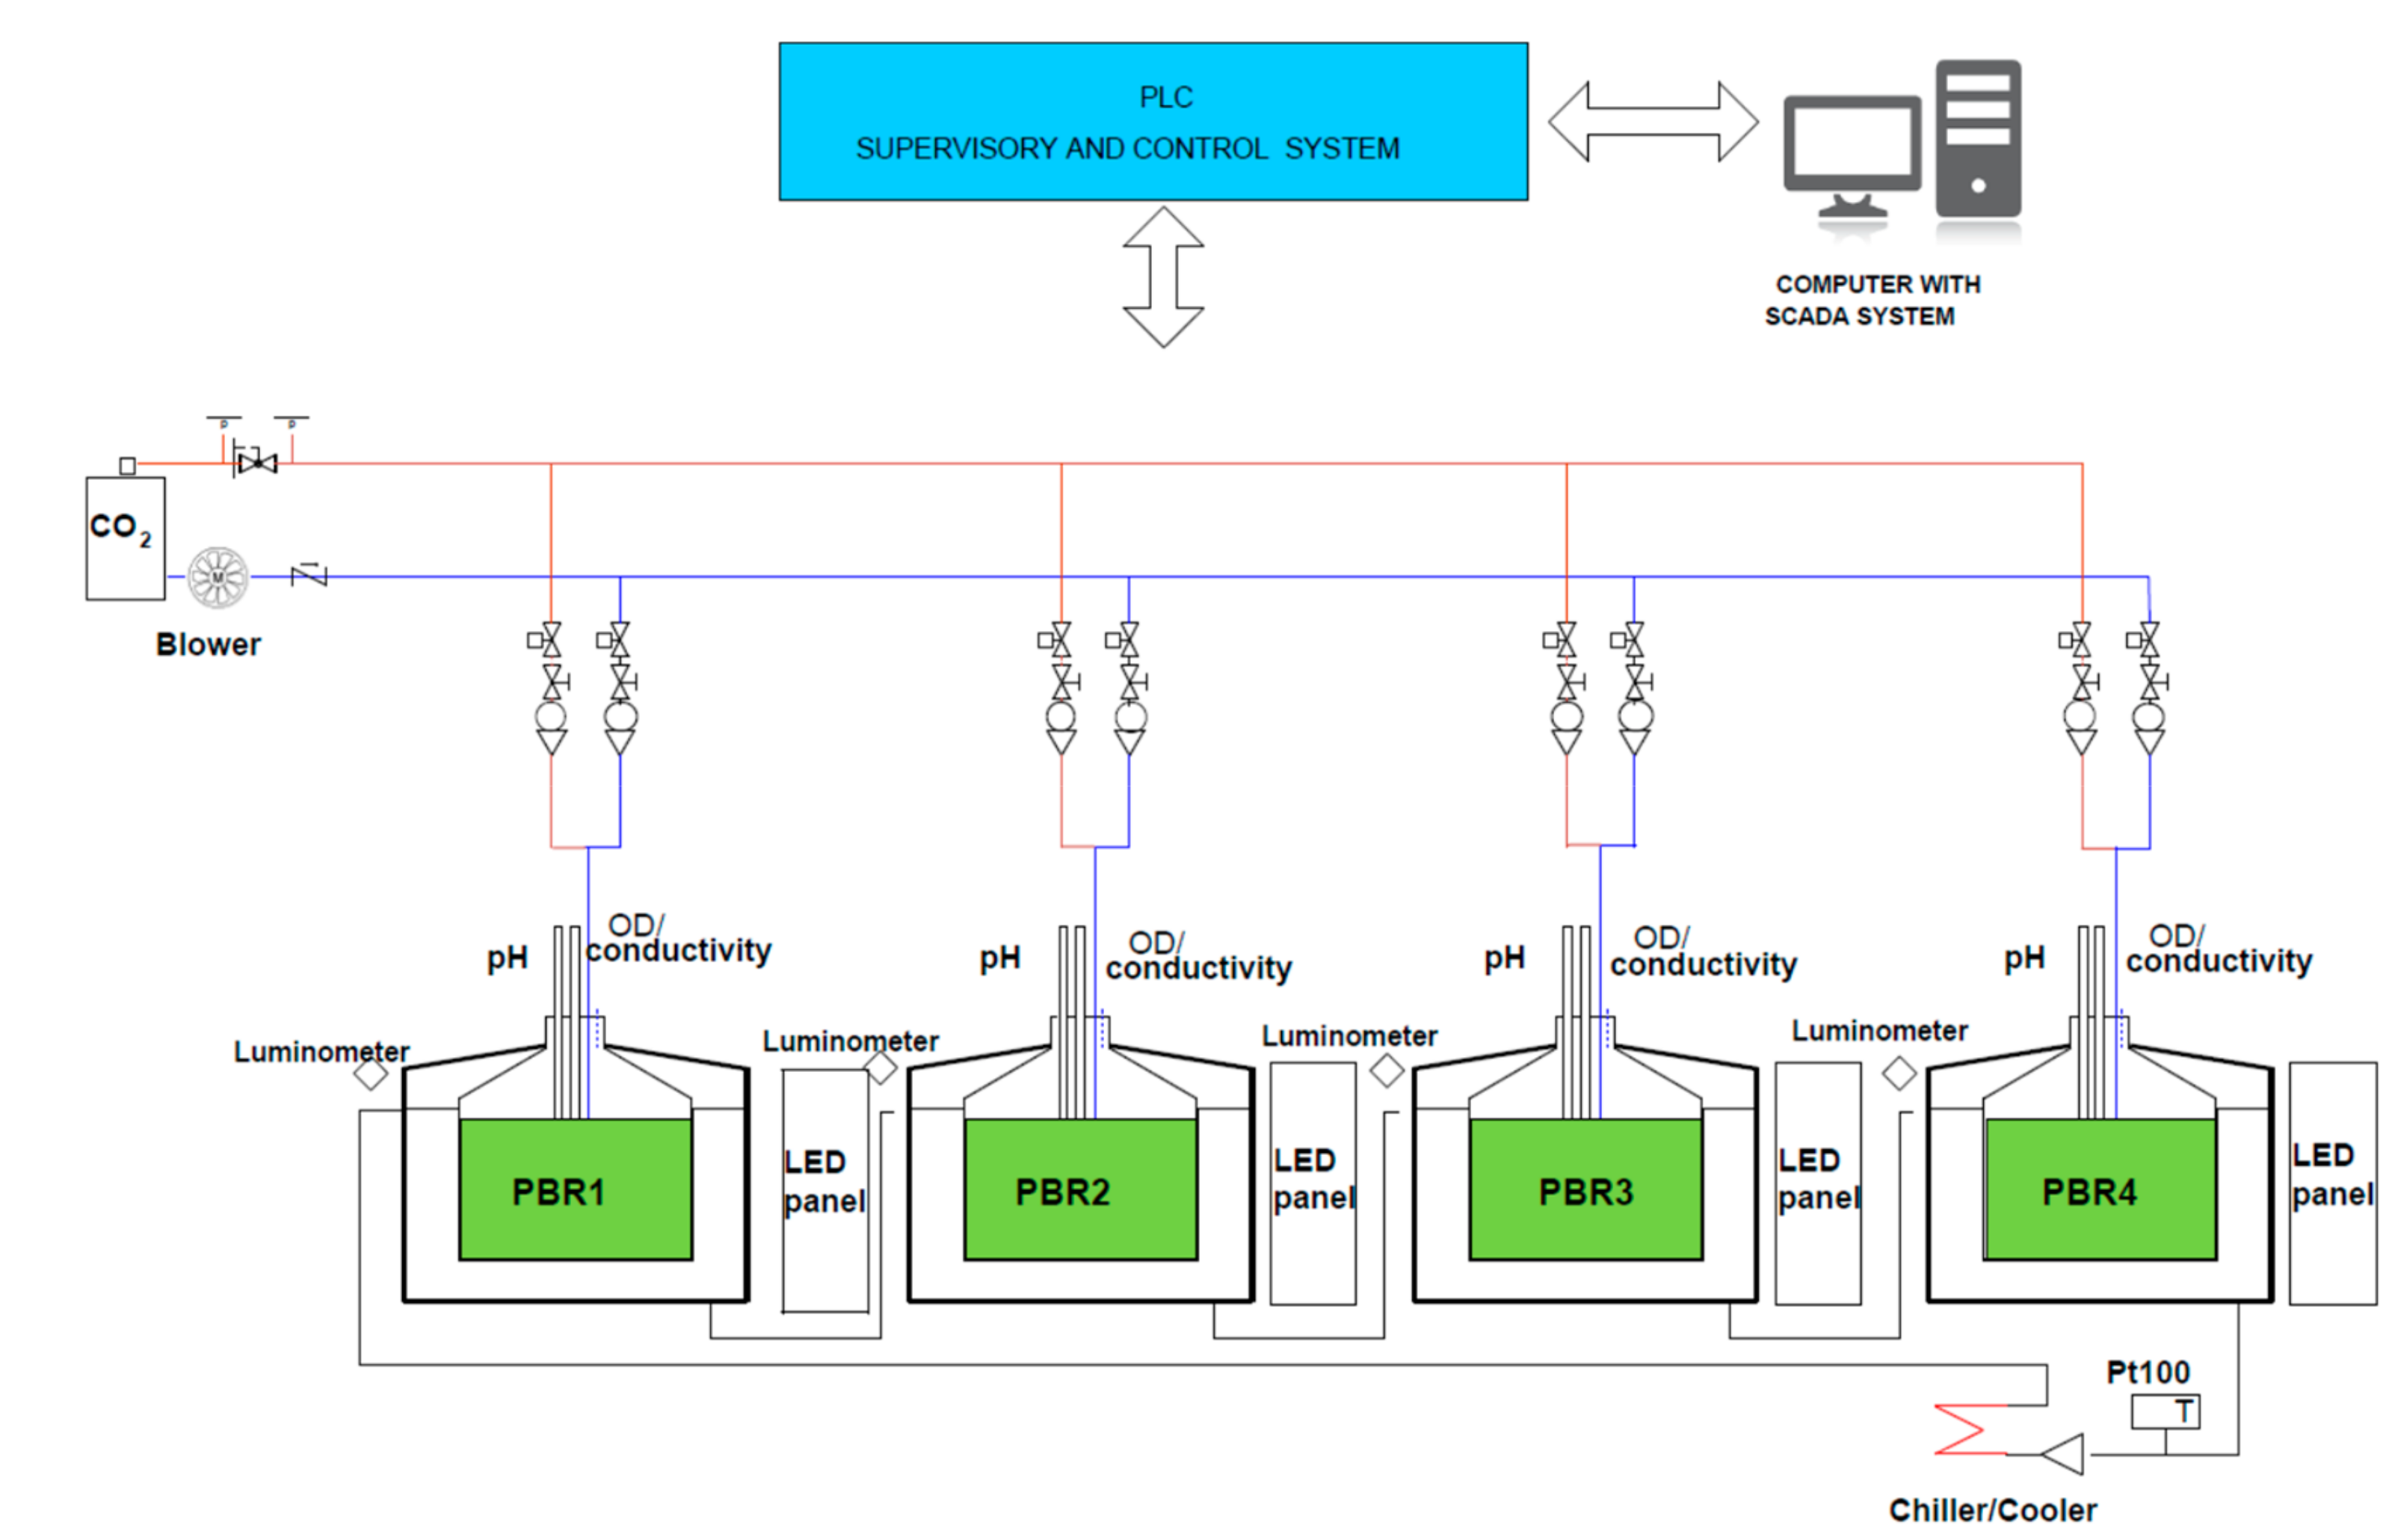
2.4. Experiments in Photobioreactors (PBRs)

To test the adaptability of the strain to different nutrient sources, the batch mode experiment was performed in four double-walled borosilicate glass 2.8 L photobioreactors (PBRs), each containing different media and operated independently (Figure 1). The initial volume of the growth medium containing inoculated cells in each PBR was 2.6 L. Each PBR was illuminated with a separate LED-light roll mantle with the illuminated surface area of 533.8 cm2. Due to the thorough mixing by air bubbling, we suppose that all cells were equally exposed to the light. The temperature of 25 ± 0.1 °C was regulated by the circulation of water through the double wall of the PBRs, using a chiller/cooler equipped with a water pump. The light intensity, light cycle and pH (via CO2 flux) were controlled by SCADA (supervisory control and data acquisition) system, a network of module and bioreactors, controlled by a single supervisory computer. Air or air/CO2 mixture (97:3 v/v) was injected at the bottom of the reactor through a glass tube. The reactors were illuminated with LED warm white light at the illumination of 80 μm photon m−2s−1 at the 12:12 h day/night cycle.
The algal cells were harvested from the culture grown in PCRS11 medium and inoculated into sterilized WW media in all four PBRs at the equal initial cell density of 0.5 ± 0.05 (OD690). Growth conditions in the PBRs are described in Section 2.4.1 and Section 2.4.2.
Salinity was monitored daily by conductometer (Mettler Toledo) and pH was controlled by pH-probe (Mettler Toledo) connected to the SCADA system.

2.4.1. Effect of N-Source on Growth of Synechococcus sp. MK568070

In PBR1 and PBR2 we used WW1 and in PBR2 we used WW2 as a source of nutrients, respectively. The salinity was adjusted to 19 by amendment of NaCl and where necessary phosphorous content was adjusted to N/P 8 with the addition of PO43−.
PBR3 contained untreated wastewater (WW3, Table 1) with NH4+ as a dominant (>99%) source of DIN diluted with artificial seawater (ASW) 1:1 (v/v). ASW was prepared according to the Cold Spring Harbor Protocol for Artificial Seawater (doi:10.1101/pdb.rec068270, Cold Spring HarbProtoc 2012. http://cshprotocols.cshlp.org/content/2012/2/pdb.rec068270.full). The resulting salinity of the medium was 19 and NH4+ concentration was 1.3 mM. The N/P ratio was set to 8 by addition of PO43− buffer. pH was controlled continuously and in case of the overnight pH-decrease below 7.7, the value was set up by the addition of NaOH (1 M).
In PBR1-3, mixing of the growth medium was achieved by air bubbling at a flow rate of 0.25 L/min. In PBR3, minimum air- bubbling for sufficient mixing of culture was set up, whereas in PBR4 (Section 2.4.2) four times stronger gas flow rate was set up by the introduction of CO2 as a significant nutrient for Synechococcus sp. MK568070.

2.4.2. Biochemical Aspects of Synechococcus sp. MK568070 Growth on WW

PBR4 contained untreated wastewater (WW3, Table 1) with NH4+ as a dominant (>99%) source of DIN diluted with artificial seawater (ASW) in 1:1 (v/v) ratio. The resulting salinity was 19 and N/P ratio was set to 8 by addition of PO43− buffer.
As a difference to PBR1-3, to provide sufficient CO2 for growth, the medium in PBR4 was amended by air/CO2 mixture (97:3 v/v) at a constant flow rate of 1 L/min. The pH was kept constant at value 8.3 via CO2 flux controlled by the SCADA system. In case of the overnight pH-decrease below 7.7, the value was set up by the addition of NaOH (1 M). The purpose of the CO2 feed to the culture was the exclusion of the CO2-limitation factor to the biomass yield.

2.5. Analytical Prcedures

2.5.1. BIOMASS Measurements

The growth of Synechococcus sp. MK568070 was monitored daily through measurements of the culture media optical density at λ = 690 nm (OD690) using SHIMADZU UV-VIS 1800 spectrophotometer at a 1 cm light path. The dry weight (dw) biomass concentration of the inoculum was calculated from OD690 measurements using the calibration curve for comparison between OD690 and dw biomass of Synechococcus sp. MK568070. The culture was sampled daily in 10 mL aliquots with three replicates. Samples were filtered on pre-weighed polycarbonate (PC) filters with 0.4 µm pore size (Whatman). Filters were dried for 2 h at 60 °C and weighed again for biomass determination. The biomass concentration was calculated by subtracting the blank filter mass from the mass of the filter with dry sample and dividing the resulting mass by the sampled volume. The triplicates were checked for outliers by using the modified z-score method [23] and averaged for the final dry weight biomass concentration. The conversion factor for dw biomass was calculated as a linear function of OD690.

2.5.2. Nutrient-Determination

Aliquots (50–100 mL) were sampled daily for dissolved nutrients determination. Nitrate (NO3), nitrite (NO2), ammonium/ammonia (NH4+/NH3), soluble reactive phosphorus (SRP) and dissolved organic phosphorus (DOP) were analyzed from the supernatant after the immediate centrifugation (10 min, 5000 rpm) of the collected samples. We followed the procedures described by Parsons et al. [25], and Ivančić and Degobbis [26], including the appropriate dilutions of the samples to fit the range of spectrophotometric determinations using Shimadzu UV 1800 at the path length of 1 cm for each method. Dissolved inorganic nitrogen (DIN) concentration was calculated as the sum of NO3, NO2 and NH4+/NH3 concentrations.

2.5.3. Lipid Extraction and Fatty Acid Analysis

For total lipid and fatty acid (FA) analysis 50 mL samples were filtered on pre-combusted GF/F filters (Whatman). Prior to extraction, filters were mechanically disrupted with a tissue homogenizer in a dichloromethane/methanol mixture (DCM:MeOH, 2:1, v/v). Total lipids were extracted according to Bligh and Dyer [27]. Extracts were saponified, methylated and analyzed as follows [28]. After addition of 1.2 M NaOH in a 50% aqueous methanol solution, the tubes were placed in a boiling bath for 30 min. After cooling, the saponificate was acidified with 6 M HCl (pH < 2), 12% BF3 in methanol was added and heated for 5 min in a boiling water bath. After cooling, the fatty acid methyl esters (FAME) were extracted in dichloromethane (DCM). FAME were analyzed by gas–liquid chromatography (GLC) on a 6890 N Network GC System equipped with a 5973 Network Mass Selective Detector with a capillary column (30 m/0.25 mm/0.25 mm; cross linked 5% phenylmethylsiloxan) and ultra-high purity helium as the carrier gas. The oven temperatures were programmed as follows: 70 °C for 5 min, then ramped to 205 °C by 4 °C min−1, holding for 4 min at 205 °C, then ramped up to 270 °C by 4 °C/min. Column pressure was constant at 15 psi. Retention times, peak areas and mass spectra were recorded on the ChemStation Software. FAME were identified by mass spectral data and the family plots of an equivalent chain length (ECL) data for GC standards for the GC column were used. FAME mix C18–C20, PUFA1, PUFA3 standards (Supelco/Sigma-Aldrich, Bellefonte, PA, USA), C4–C24 FAME standard mix, cod liver oil and various individual pure standards (Sigma, Neustadt, Germany) were applied.

2.5.4. Total Carbohydrate Determination

Total carbohydrate from each cyanobacterium pellet (from equal biomass) was quantified using the anthrone method of Loewus [29]. One milliliter of inoculum from the initial stationary phase was taken from each experimental setup in separate micro-centrifuge tubes and pelleted at 10,000 rpm at 25 °C for 10 min, and washed twice with sterile distilled water twice before drying. Equal dried biomass from each species was considered for the analysis. The biomass was treated with 1 mL of 1 M NaOH by vigorous vortexing, and later kept in the boiling water bath for 5 min. The mixture was sonicated at 40 kHz frequencies for five cycles of 30 s on and 30 s off. The crude homogenate was centrifuged at 3000 rpm for 5 min, and 100 μL supernatant from each was used for the determination of total carbohydrate. Glucose (1 mg mL−1) stock solution (1 mg mL−1) was used for the preparation of the standard. The anthrone reagent was prepared by dissolving 0.2 g anthrone in 100 mL chilled 95% H2SO4. 100 μL processed supernatant of each cyanobacteria was added to separate test tubes, and volume was top up to 1 mL by adding the 900 μL sterile distilled water. 4 mL anthrone reagent was added to each sample and the content was incubated at the room temperature for 10 min in the dark. The reaction was stopped by incubating the whole content in the boiling water bath for 10 min, as the greenish-blue color of different intensity appeared, and an immediate ice chilling was provided for 10 min, and finally the absorbance of each sample was measured at 625 nm. The corresponding absorbance of unknowns were interpolated with the absorbance of glucose standards to get the concentrations of carbohydrates produced by each species.

2.5.5. Protein Determination

The protein content in the microalgal samples was determined by using a modified Micro-Biuret method described by Safafar et al. [30].

2.5.6. FTIR Analysis

Spectroscopic tests were performed using a spectrophotometer FTIR Tensor II (Bruker, Karlsruhe, Germany) with an attenuated total reflectance (ATR) accessory with a diamond crystal. Equal volume (30 mL) of each sample was filtered on 0.4 µm PC filters (Whatman) and dried at 60 °C for 12 h. Samples were placed in the sampling accessory obtaining the best contact with the crystal. The approximate total time required for spectral collection was 5 min. All spectra were recorded within a range of 4000–800 cm−1 with a 4 cm−1 resolution. Each spectrum was calculated as the average of 40 scans and subjected to background subtraction. Analyses were carried out in triplicates. ATR spectra taken in different growth phases were compared according to the following: Base line of all spectra is corrected by means of Opus Spectroscopy Software 7.5, the absorption values of the absorption bands (v C=O and Amid I) are read. The proportion of v C=O and Amid1 are used as representative bands for lipids and proteins, respectively. The ratio between the two absorption bands is indicative of the biochemical composition changes and relationships between the molecule classes [31].

3. Results

3.1. NH4 and Salinity Tolerance Testing

In the microwell plates we tested the Synechococcus sp. MK568070 growth potential in a range of NH4+ concentrations (2–3.2 mM) corresponding to annual fluctuation of NH4+ in the refinery wastewaters. The working medium in microwells was WW3 adjusted by dilution or amendment of nutrients as described in Section 2.3 of the materials and methods section. The results are presented on Figure 2.
Cultures demonstrated identically ascending growth pattern in the whole tested range of NH4+ concentrations. The highest cell densities were achieved at ammonium concentration of 2.8 mM, with maximum OD690 of 0.150 after seven days of growth. Although the biomass yield of Synechococcus sp. MK568070 growth on WW3 followed the increase in initial NH4+ concentrations from 2 mM to 2.8 mM, there was a decrease in yield at maximum NH4+ concentration of 3.2 mM.
Salinity test in microwells was performed over Synechococcus sp. MK568070 and the results are presented on Figure 3. Synechococcus sp. MK568070 was incubated for a week in a standard growth medium with a range of salinity from 0 to 35 and OD690 was measured daily. High cell densities were reached in the range of salinities from 11 to 25, whereas salinities below 11 and above 25 inhibited cellular growth (Figure 3).
The highest biomass yield occurred at a salinity of 19, corresponding to ~1/2 of the common salinity in the surface waters of the Adriatic Sea. This enables us to consider diluting the heavily polluted, untreated refinery wastewater, normally having salinity values <1, with seawater, which in reality is easily available for industrial plants situated at the coast. Such a concept was tested in PBR3, and applied in PBR4 where the biochemical aspects of Synechococcus sp. MK568070 growth on WW were explored. In addition, the effect of higher CO2 inflow to the overall yield was tested by constant blowing of air/CO2 mixture in 97:3 (vol:vol) proportion.

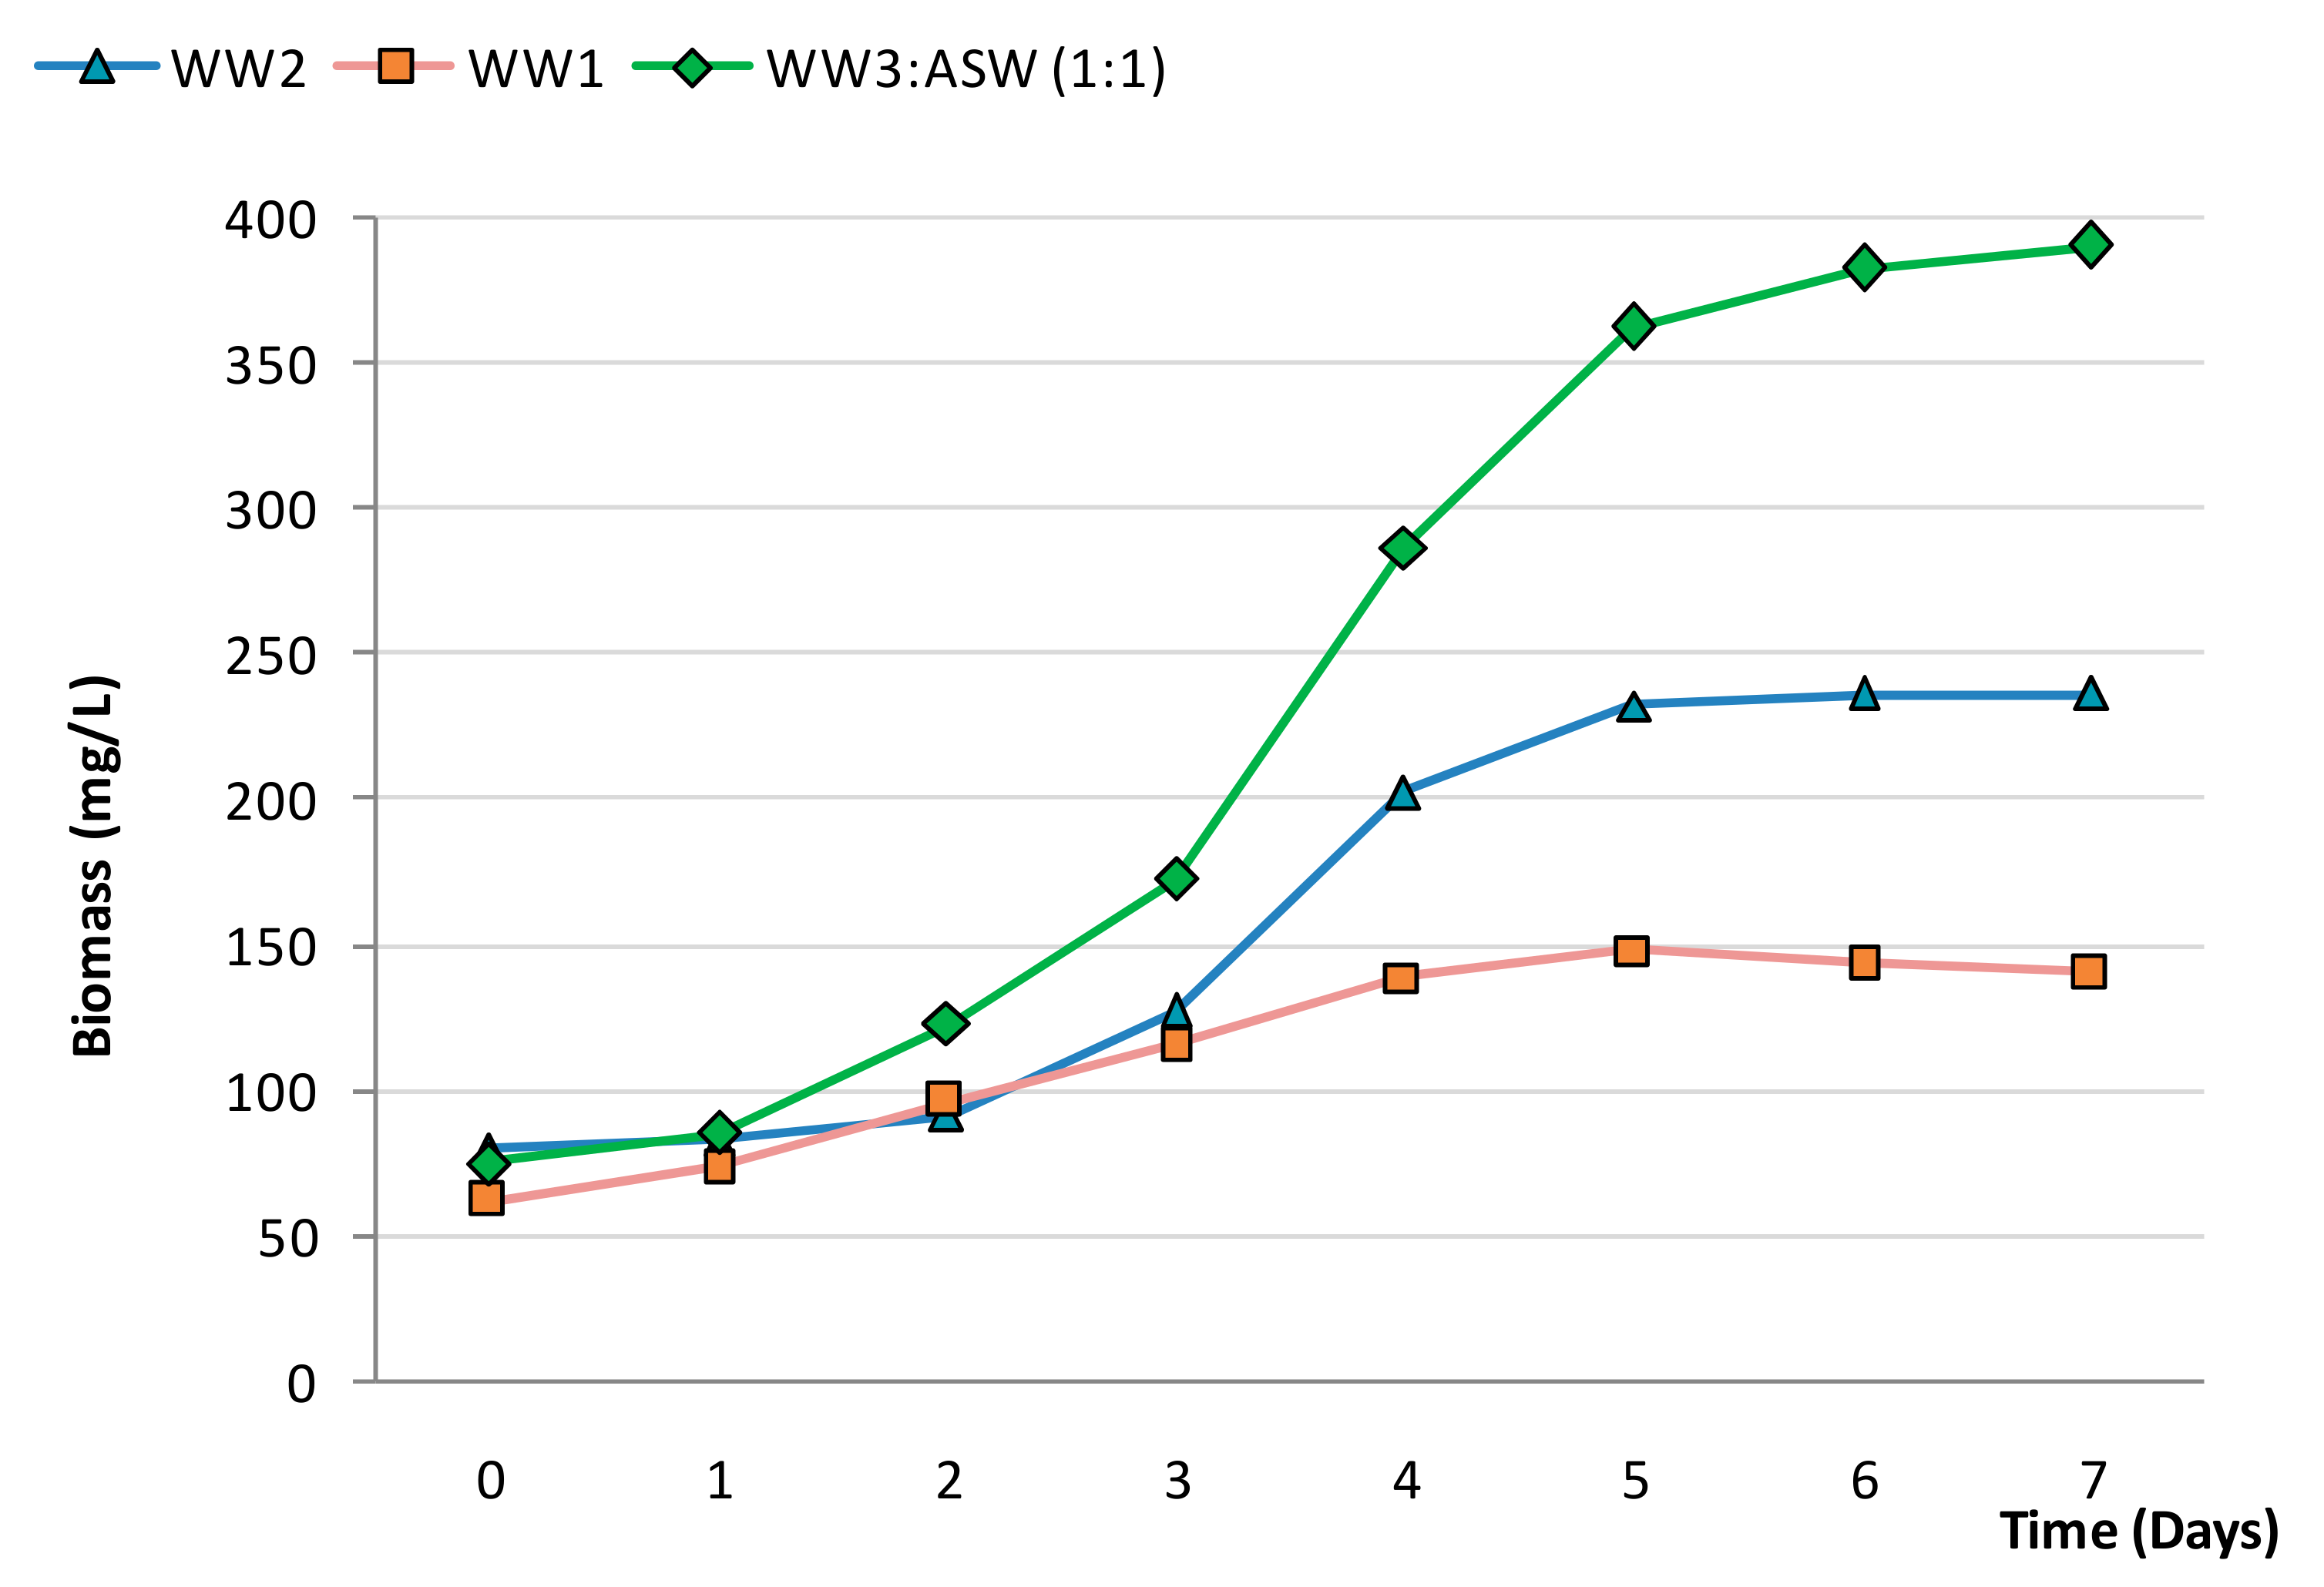
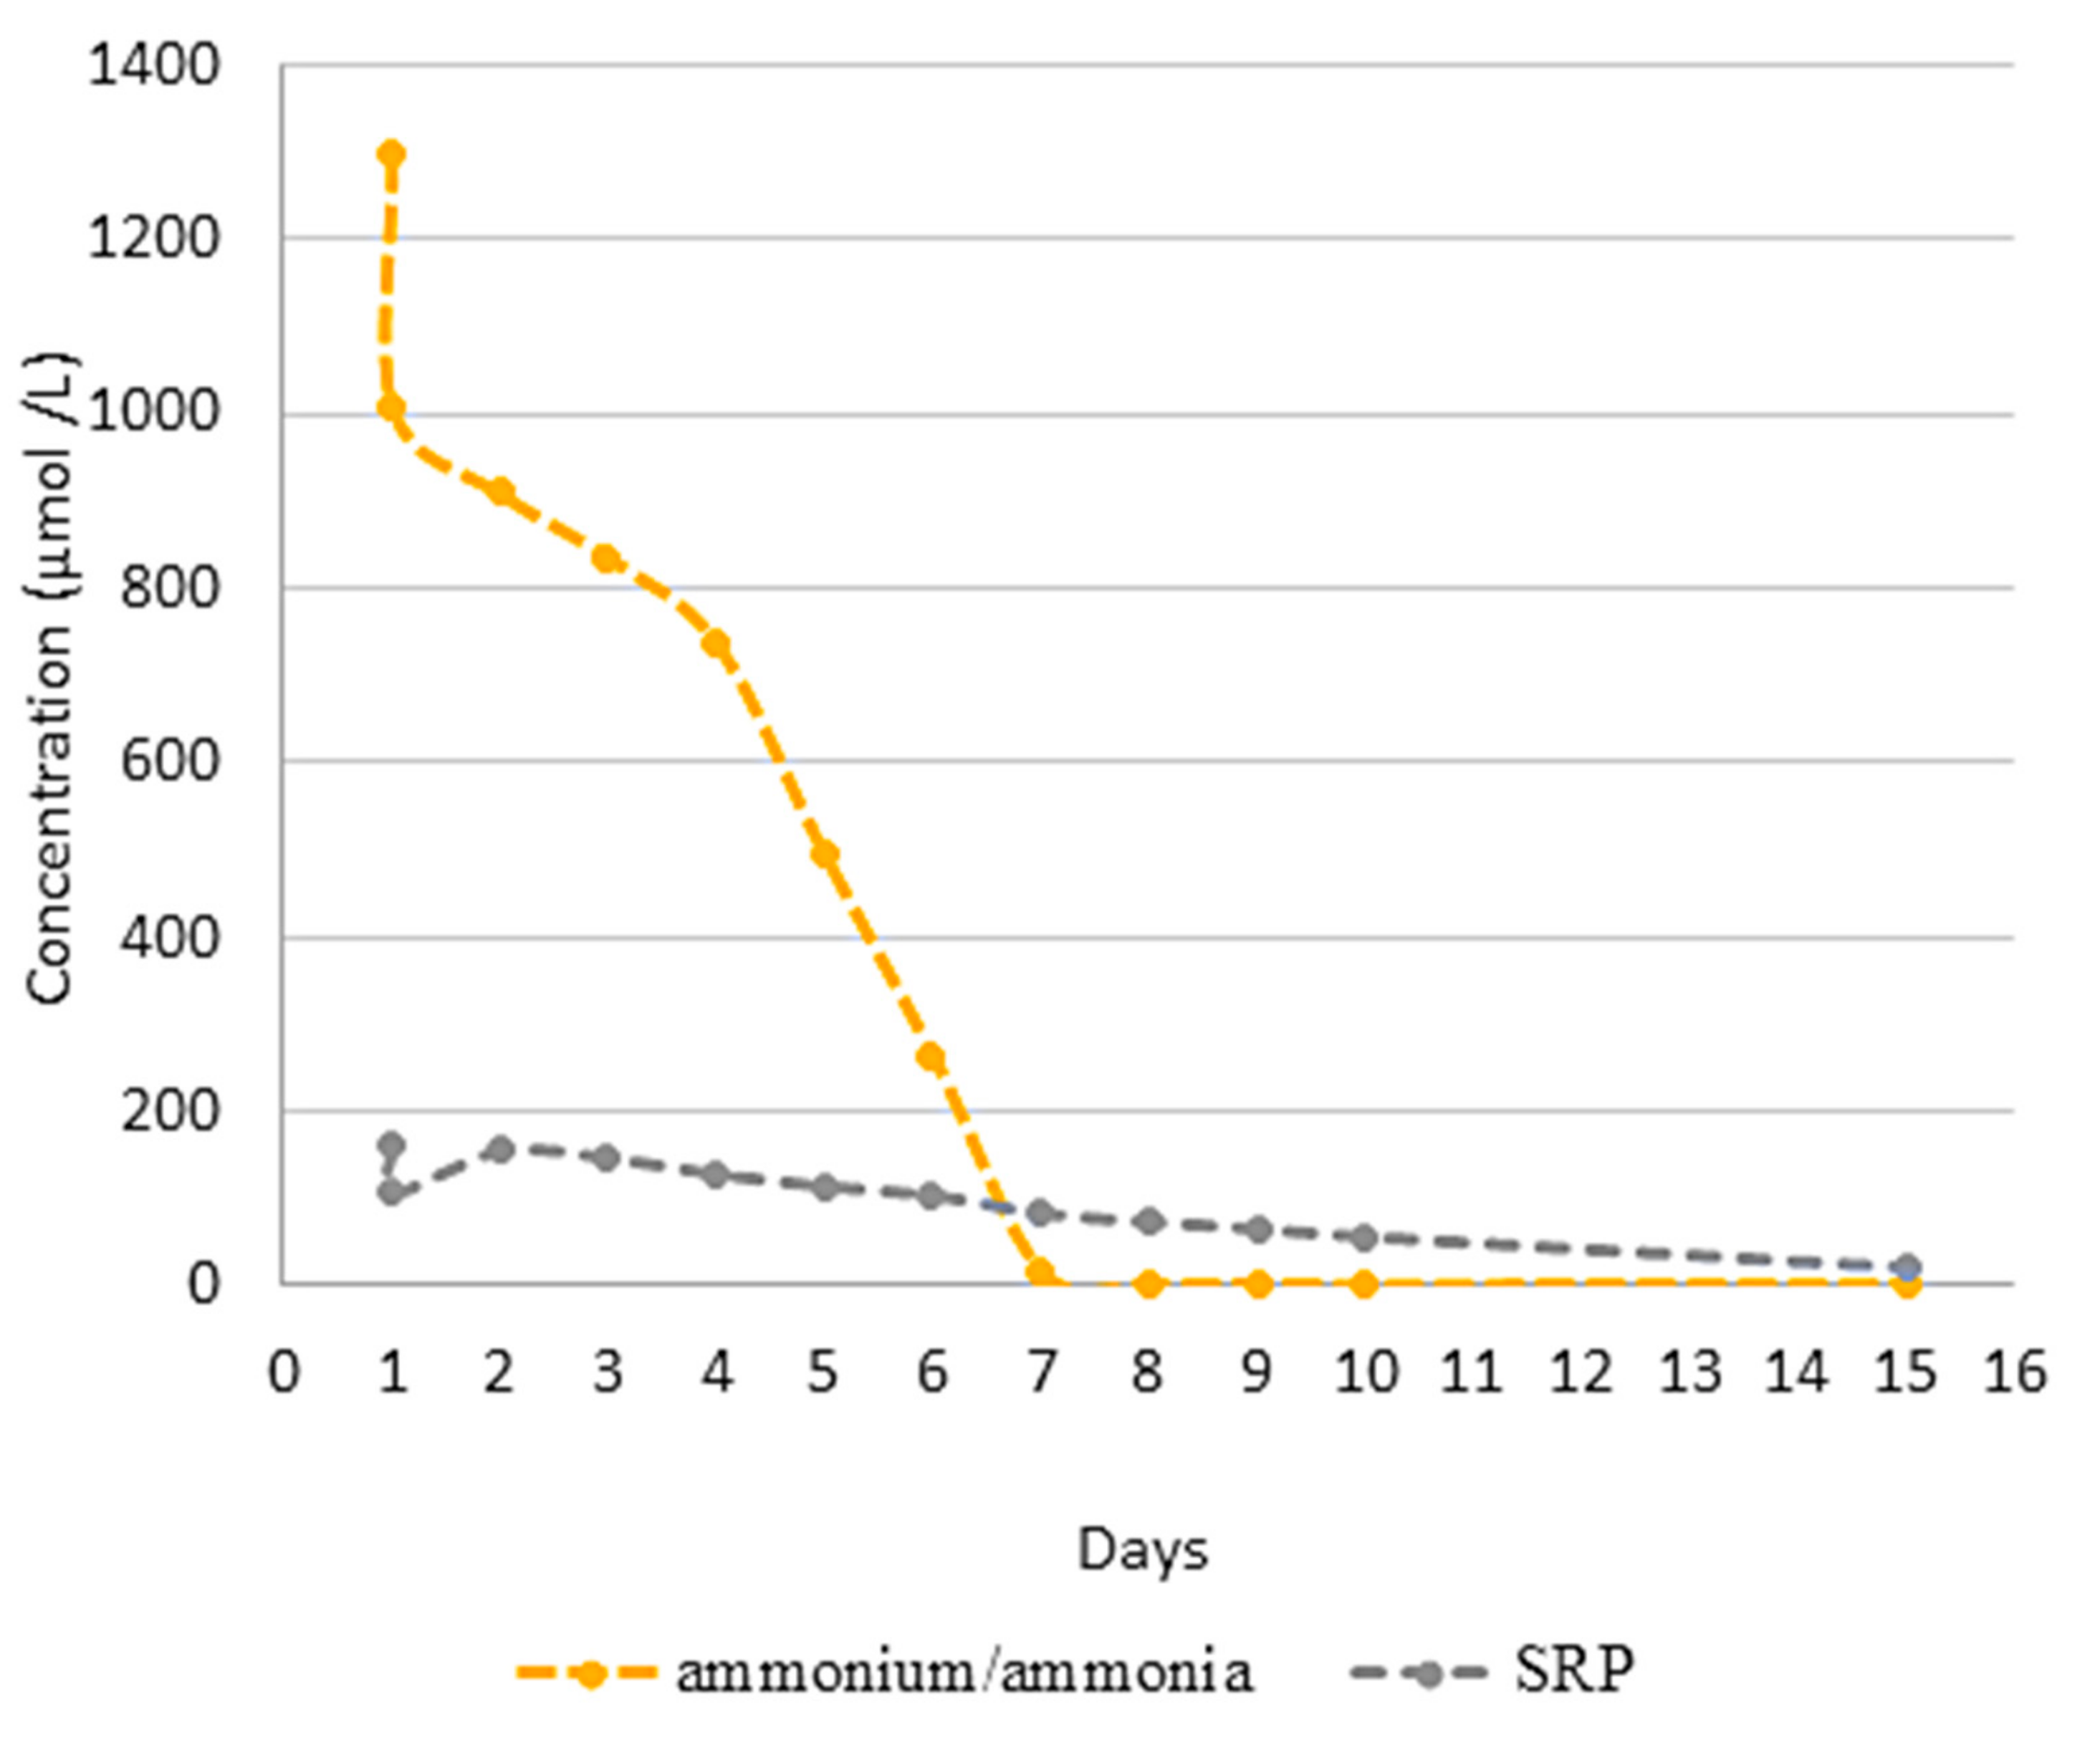
3.2. Effect of N-Source on Growth of Synechococcus sp. MK568070

The influence of N-source on growth performance and biomass yield of Synechococcus sp. (MK568070) was tested by growth in PBRs 1–3 under the controlled conditions in three different waste waters: WW1, WW2 and WW3 (diluted with ASW in 1:1 (v/v)).
The growth curves of experiments in PBRs 1–3 are presented in Figure 4. The lowest growth performance was achieved in WW1 containing predominantly NH4+ as a source of nitrogen with an initial DIN concentration of ≈0.8 mM (Table 1). Final biomass yield in WW1 was 152 mg/L of dry weight.
The wastewaters provided herein are sparse in phosphorous. In an attempt to satisfy the need for N and P by a costless source we used WW2 already containing some of the sanitary effluent. WW2 being richer in organic and inorganic phosphorous introduced as well significant amounts of NO3 into the cultivation medium. Although the final concentration of DIN 0.8 mM, was the same as in PBR1, the final biomass yield in PBR2 was 240 mg/L, substantially higher than in PBR1. Finally, the highest biomass yield 390 mg/L was obtained by growth on the WW3 (diluted with ASW) containing high concentration of NH4+ (1.3 mM).

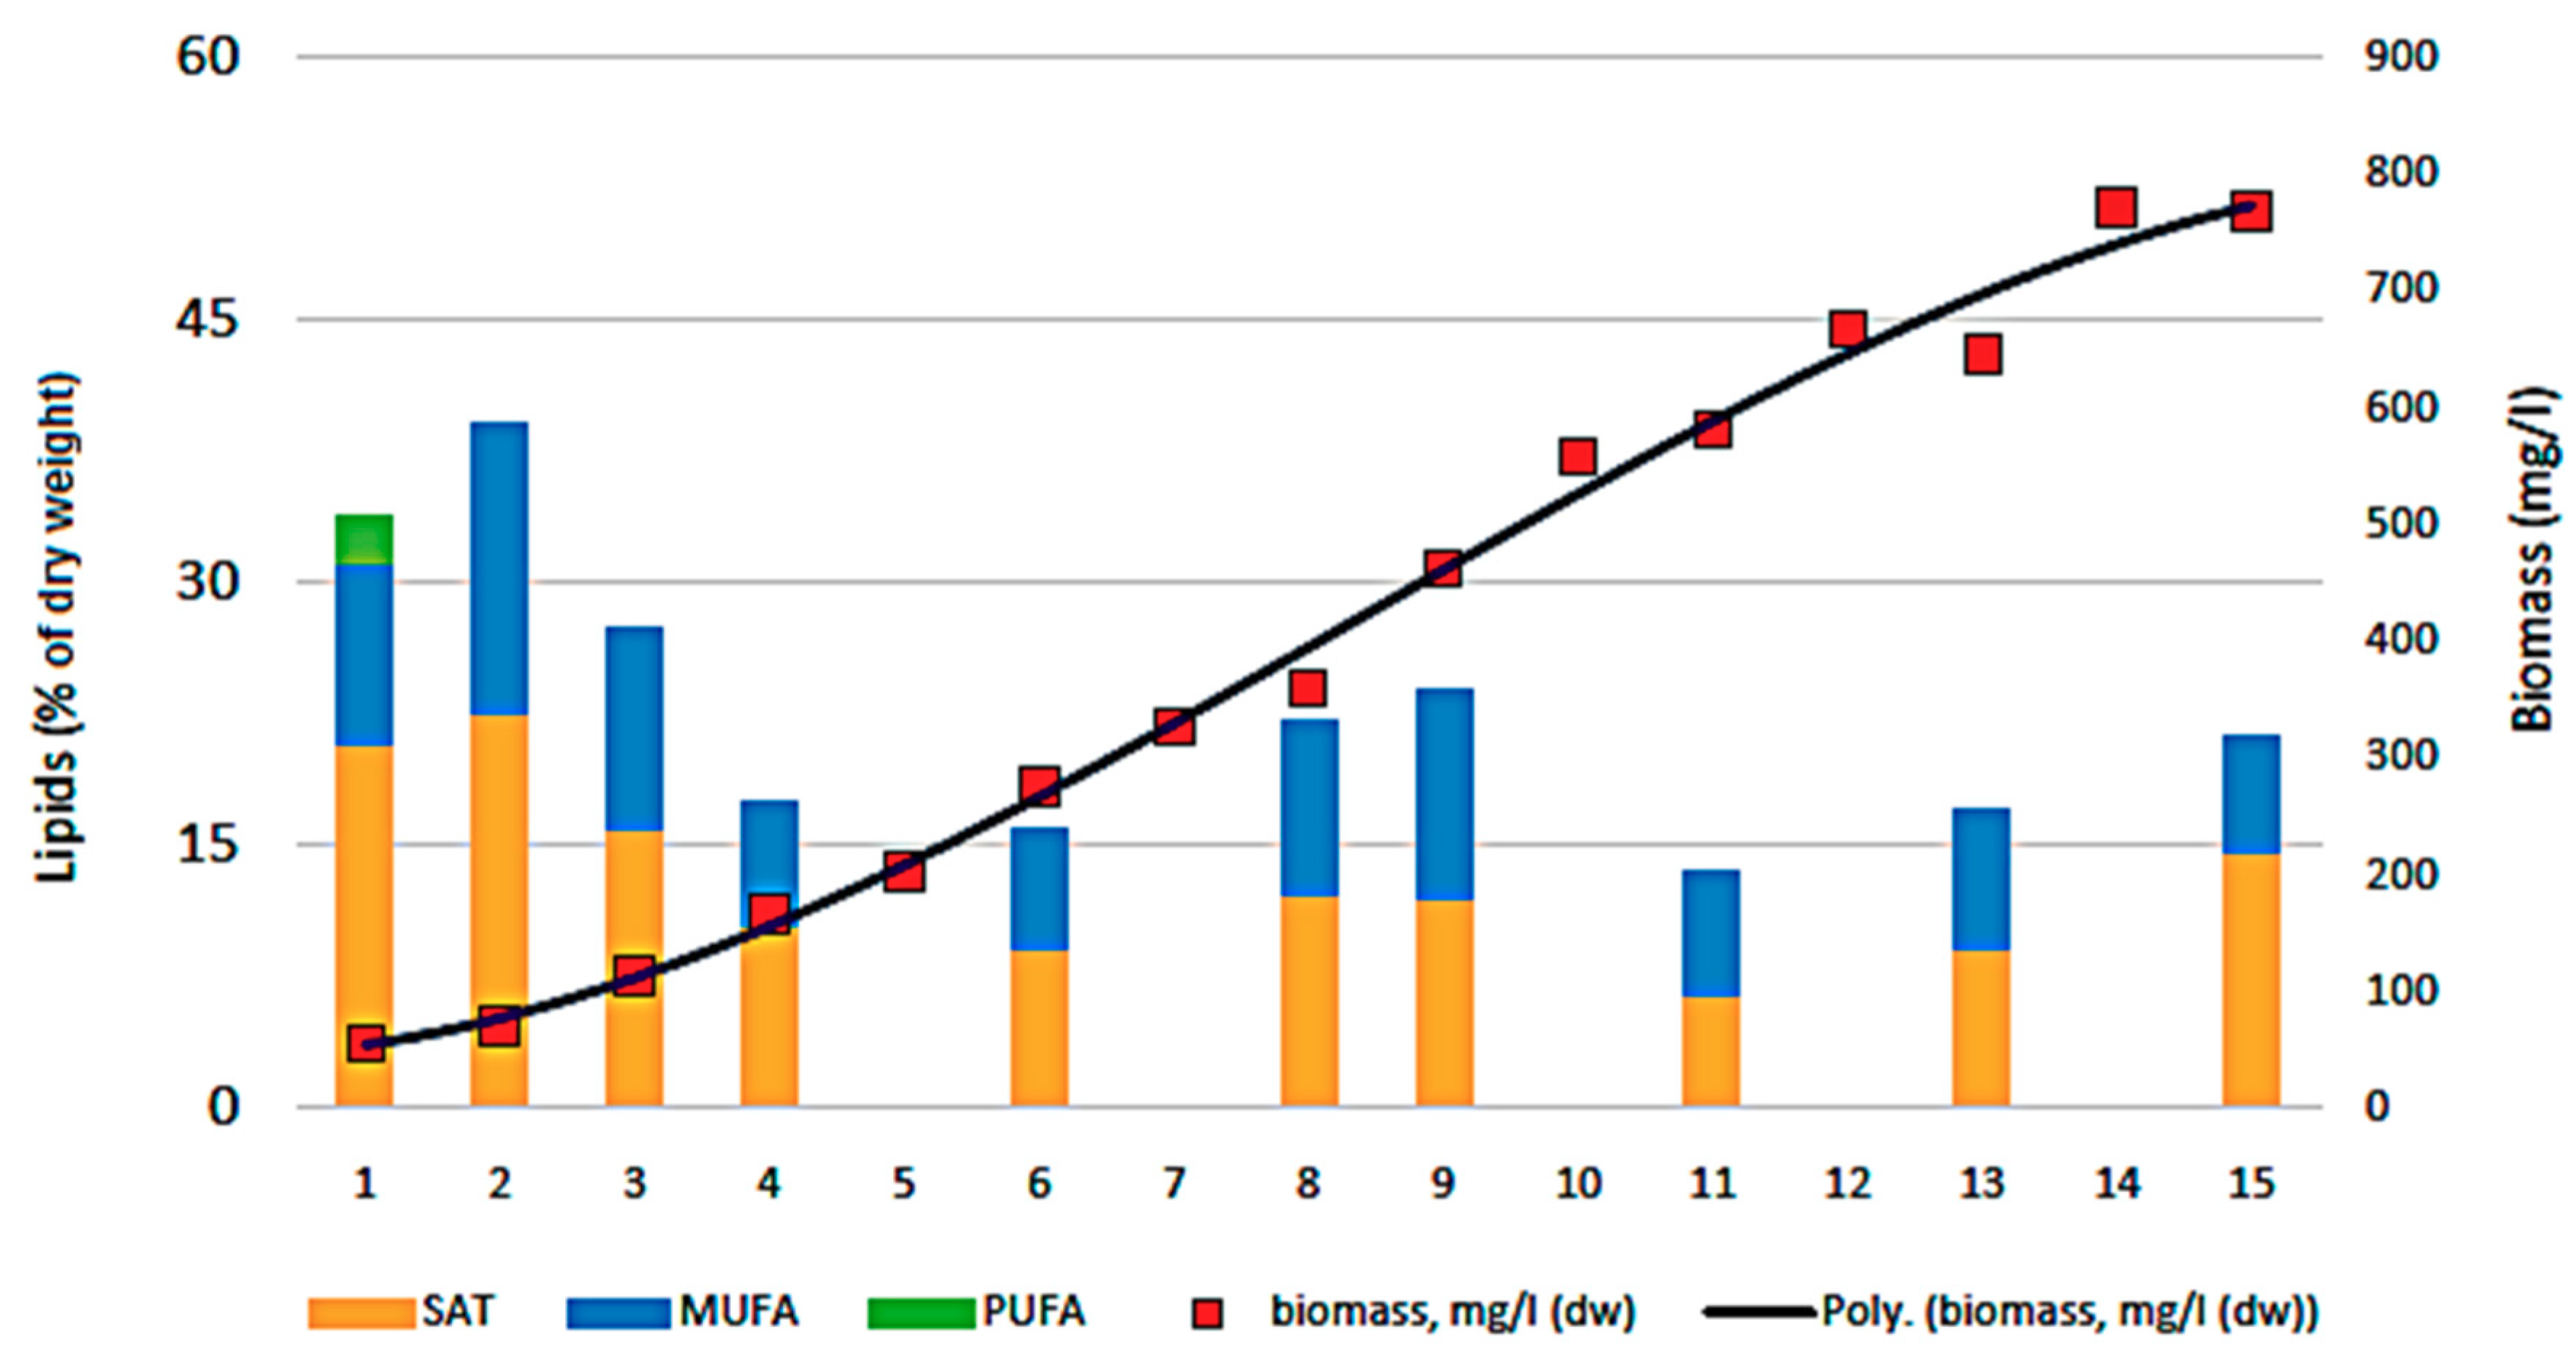
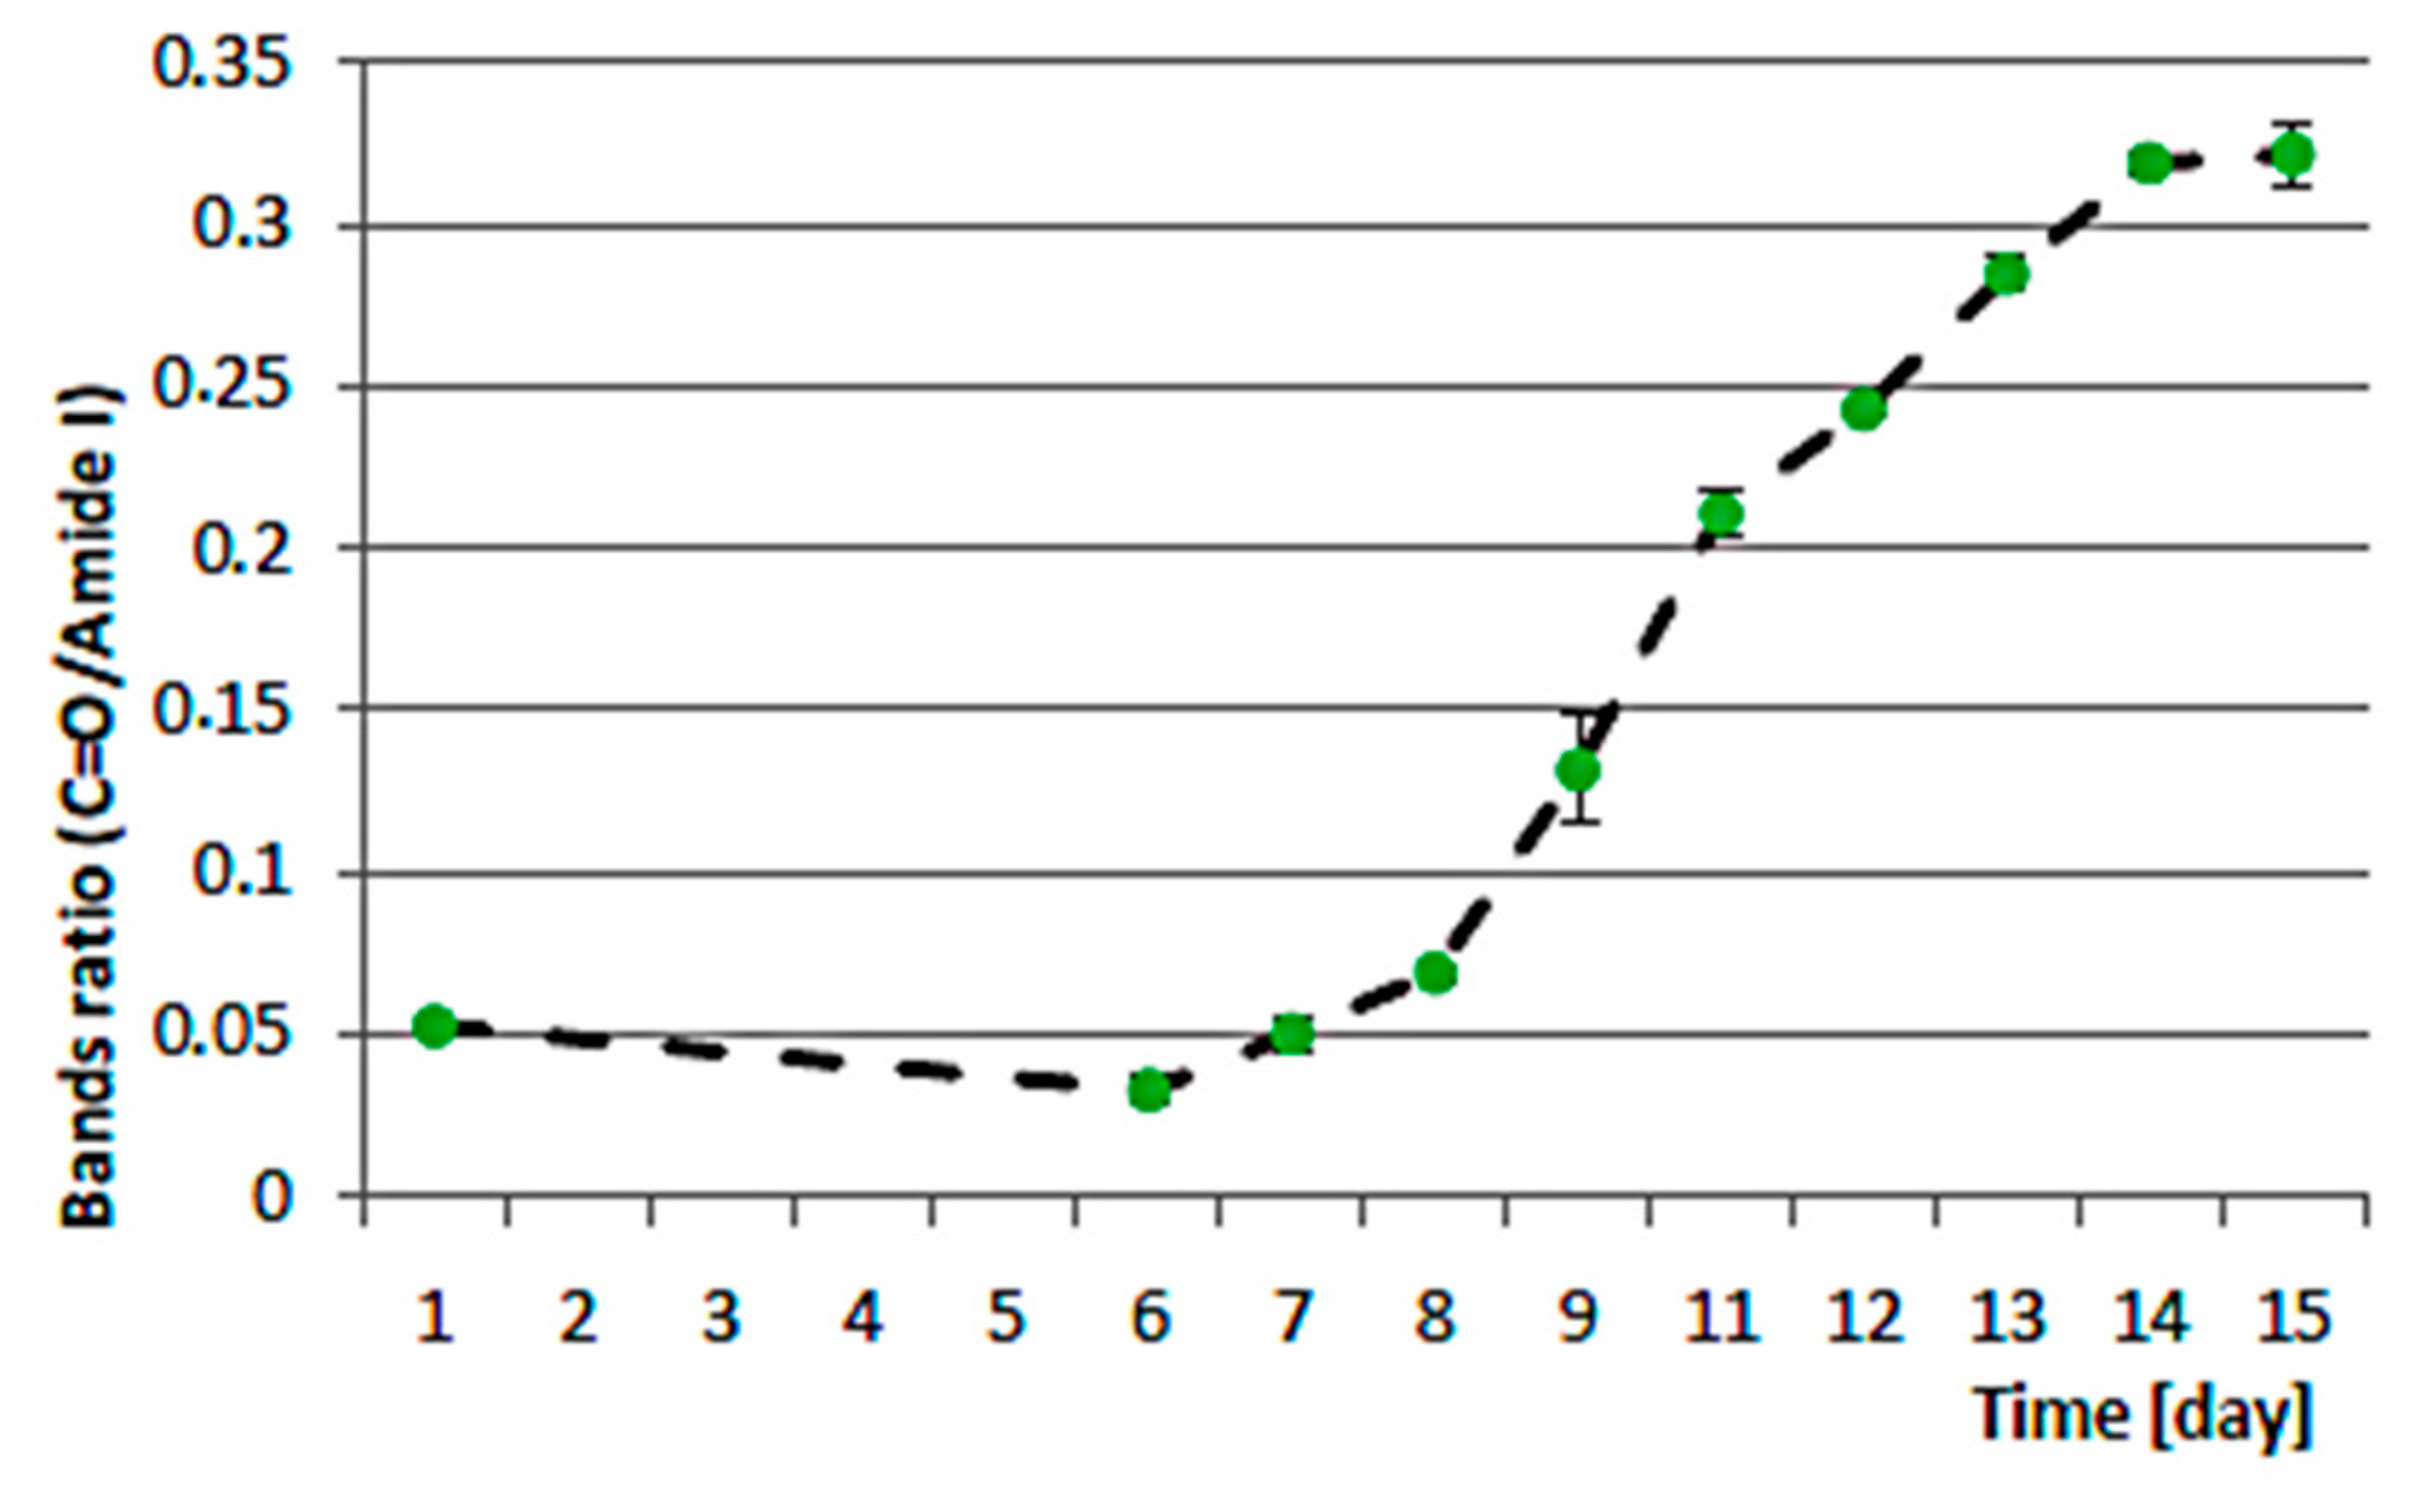
3.3. Biocheimcal Aspects of Synechococcus sp. MK568070 Growth on WW

In PBR4 Synechococcus sp. MK568070 was grown on WW3:ASW (1:1, vol/vol) at salinity 19. The optimum salinity for growth was determined based on the salinity tolerance findings (Figure 3). The initial concentration of NH4+ was 1.3 mM, DIN/DIP was set to 8 and 3% CO2 was continuously added through air/CO2 bubbling system. The nutrient uptake is represented in Figure 5. The majority of DIN (>99%) was depleted in seven days, while 20% of SRP remained unutilized by the end of experiment on day 15 (Figure 5). Synechococcus sp. MK568070 showed lower P-needs for the build up of biomass in respect to the initial experimental set point (N/P = 8), which resulted in higher residual concentration of SRP at day 15 (0.02 mmol L−1). During the first six days of the growth (day 1 to day 7) Synechococcus sp. MK568070 consumed 1.3 mmol DIN L−1 and 0.1 mmol SRP L−1, resulting in the average DIN/SRP uptake of 13. From day 7 towards the end of experiment the growth was N-limited.
The biomass yield and overall lipid productivity of the experimental culture grown in PBR4 are shown in Figure 6. The culture reached stationary phase after 14 days obtaining the biomass yield of 767 mg/L.
The structure of the fatty acid (FAME) profile of Synechococcus sp. MK568070 was analyzed and results are presented in Table 2. The FAME profile was dominated by C16 saturated and monounsaturated fatty acids, followed by C14 saturated and C18 monounsaturated FAME. The highest proportion of total lipids was achieved on the 2nd day of experiment by 41% of the dry weight. After the 2nd day, during the early exponential phase the contribution of lipids in the dry biomass was descending, whereas in the mid-exponential phase an increase in the lipid proportion was observed up to 24%. In the late exponential and stationary phase lipid content oscillated again between 14% and 16%. The final lipid content in the dry biomass was 21.4% in the stationary phase of the Synechococcus sp. MK568070 growth.
The most abundant fatty acid was C16:0 with a 43.04% mass fraction of total fatty acids at the end of the experiment in the stationary growth phase. Due to the high percentage of other saturated fatty acids (C14 and C18) profiles are characterized with an overall unsaturation index (UND) lower than 1. The lowest UND of 0.45 was observed at the end of the experiment. The proportion of summarized C16 FA maintained high relative values, with decreasing dynamics in the exponential phase of the experiment and then again increasing the proportion towards the end, finally reaching the final 66.06%.

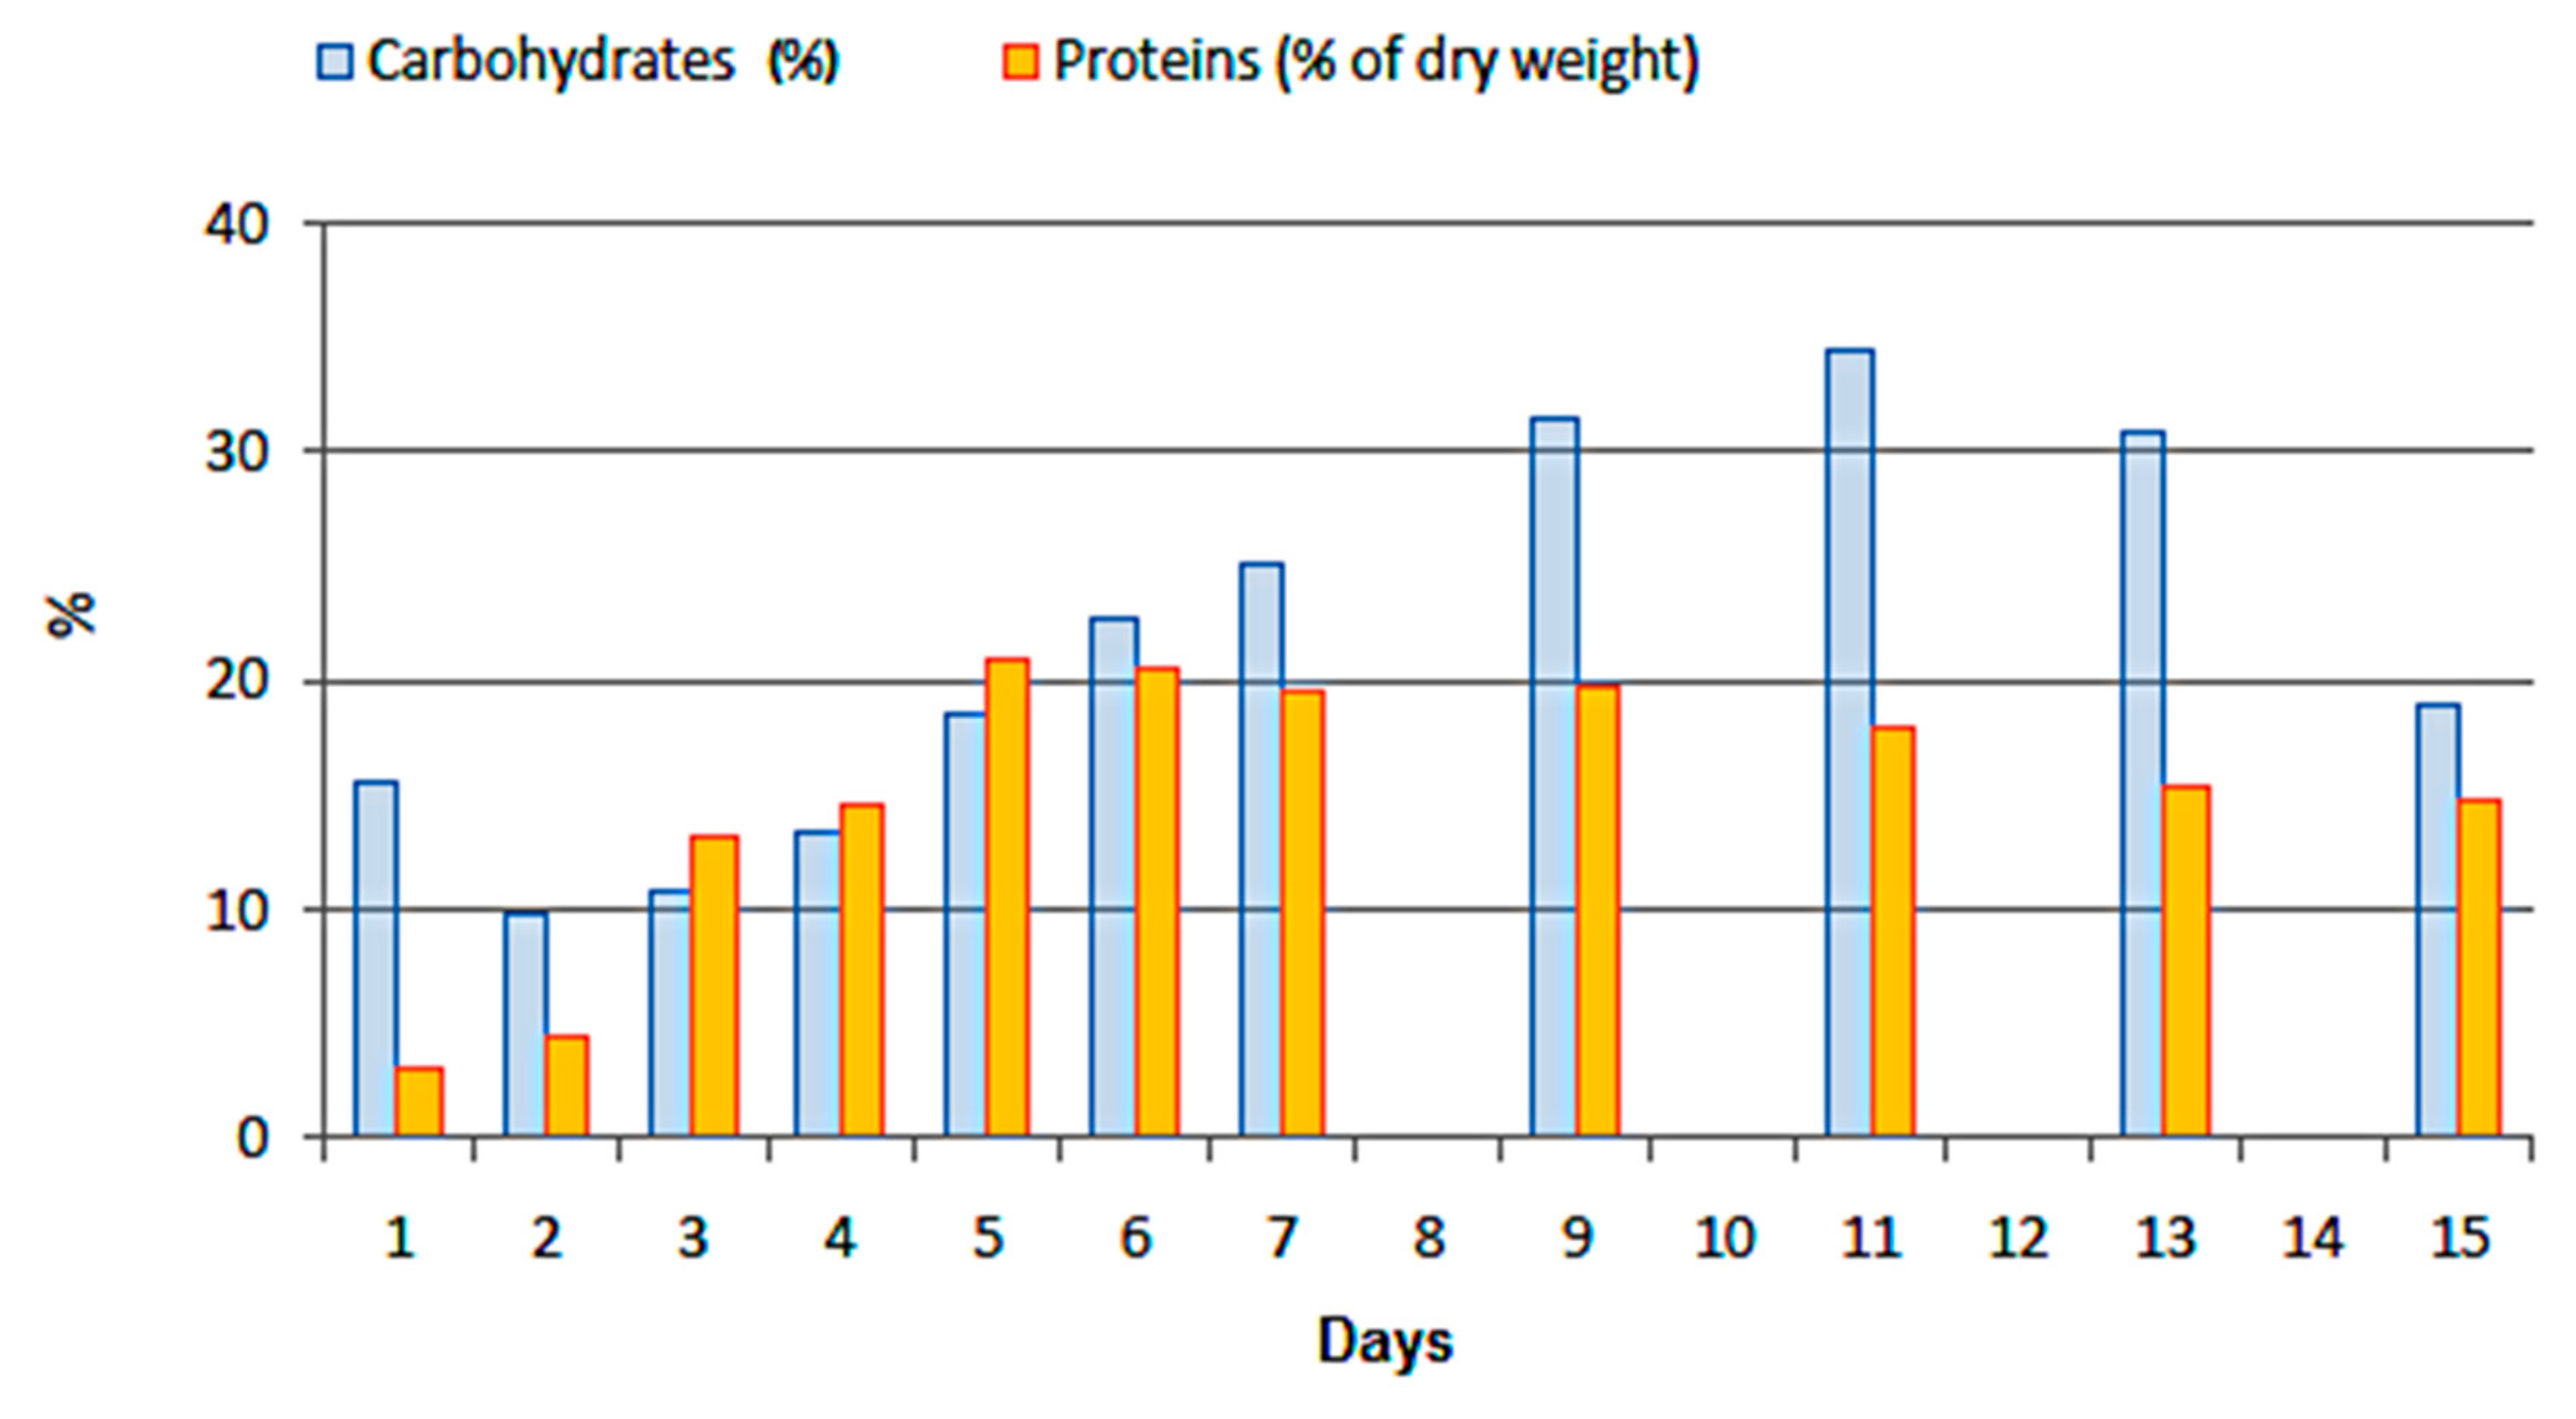
3.4. Carbohydrates and Proteins

Carbohydrate and protein content were measured daily during the first seven days of experiment, and later on every 2nd day. The results are presented in Figure 7.
Proteins percentage in dry biomass was observed to increase from 3% to 21% during the first six days of the experiment from 3% to 21% of the dry biomass. At the same time the NH4+ values were continuously declining from 1.3 mM to <0.01 mM. During the rest of the exponential phase protein content continued to slowly decrease until remaining at the constant average value of 15.1% towards the end of the experiment.
After the immediate decline upon inoculation, carbohydrate content was observed to continuously increase from 9.8% to 34.5% by the 11th day of experiment roughly corresponding to the end of the exponential growth. Towards the end of the experiment, the decline in carbohydrate to 18.9% occurred, whereas at the same point, the lipids, in particular saturated FAME, started to accumulate within the cells, as shown in Figure 5.
To evaluate the metabolic plasticity of Synechococcus sp. MK568070 and its response to stressing growth conditions, the FTIR analysis of the dry biomass was performed. Most of the absorption variation among the spectra was observed in the region 1200–1400 cm−1, at 1655 cm−1 and at 1745 cm−1. Major absorption bands in the IR spectra of the microalgae are presented in Table 3. The bands selected as discriminating tool between protein and lipid functional group abundance were: 1655 cm−1 band for Amid1 and at 1745 cm−1 for vibrational stretching of Carboxylic C=O ester bond. Although two regions, methyl and methylene at 2800–3000 cm−1, are commonly used to determine lipid content by FTIR [32,33], in this study we used the vibrational stretching of ester bond C=O at 1740 cm−1 because it is considered to be exclusively related to ester bonds of fatty acids and avoids overlapping with functional groups present in more than one compound within the microalgae, as recommended by Mayers Flynn and Shields [34].
The spectra were integrated and quantified and the abundance of Amid1 and Carboxylic functional groups were assessed, as proxies for protein and fatty acid, respectively. The ratio between Amid1 and Carboxylic group in Synechococcus sp. MK568070 during the course of the experiment is presented in Figure 8. The increase in proportion indicates accumulation of lipids with respect to proteins.
There was no significant change in (C=O/Amid I) ratio during active NH4+ consumption by Synechococcus sp. MK568070. After the 6th day, when majority of the DIN was sequestered from the wastewater, the ratio continuously increased during the exponential phase. The maximum (C=O/Amid I) value of 0.32 was achieved on the 14th day, when the culture reached the stationary phase.
As already reported for some oleaginous microalgae [30] the increase in the ratio reflects the structural changes in the fatty acid profile during the exponential phase. The protein content during the exponential phase remained almost constant, whereas lipid content varied much more (Figure 6). In the process of photosynthesis, a high proportion of protein is required for the energy bio-conversion process happening within the cells. This explains strong carbohydrate accumulation (Figure 6) and biosynthesis of lipids reflected in high unsaturation and chain elongation during the exponential phase (Table 2).

4. Discussion

Most of the efforts studying bioremediation of wastewaters by microalgae are focused on freshwater species, and a substantial part of strains capable of growing under saline conditions needs jet to be explored. The results of this study have demonstrated that Synechococcus sp. (MK568070), a cyanobacterium isolated from Adriatic coastal waters grows on industrial wastewater rich in ammonium, mercaptans, hydrocarbons and other potentially growth-inhibiting substances. Synechococcus sp. MK568070 has demonstrated high tolerance to NH4+ concentration and strong dependence of biomass growth on wastewater quality. Although strong affinity towards NH4+was determined, as already observed for Synechococcus species [36] the culture also grew well on the mixed source of nutrients, containing NH4+, NO3 and substantial amounts of organic phosphorus.
The studies on marine microalgae for wastewater remediation are rare because they are considered mostly metabolically adapted to the oligotrophic conditions and saline waters. However, Synechococcus sp. MK568070 demonstrated good culturability in a wide range of salinities, achieving the highest biomass yield when grown at salinity 19. The tests of ammonium tolerance, as well as the growth in PBR1-3 suggest that all the concentrations used in this study allow for further increase. Most recent studies on wastewater phycoremediation use NO3 as a source of N declaring optimum concentrations for lipid production to be 1.18–3.53 mM [37]. Since the nitrogen deficiency is the primary trigger of lipids accumulation, the optimum growth conditions are always a trade-off between high biomass and high lipid yield. In this sense, the initial nutrient concentrations and wastewater quality used for cultivation of Synechococcus sp. MK568070 were set up to support N-limited cellular growth but with suboptimal values for maximum biomass yield. Relying on the ability of Synechococcus sp. (MK568070) to grow on industrial wastewater in a wide range of NH4+ concentrations and salinity it can be considered a good candidate for bioremediation of industrial wastewater of different origin and characteristics.
Cyanobacteria have a high potential in degrading dissolved organic matter, including hydrocarbons, as well as in dealing with high concentrations of heavy metals. Therefore, we tested an indigenous marine Synechococcus strain from the Adriatic Sea regarding its growth potential and production of carbohydrates, proteins and most importantly lipids of the desired quality for biodiesel production during the process of remediation of oil refinery wastewater. Higher dry biomass yield, at the same concentration of nutrients, is possible in the case of more efficient dissolved organic matter usage. The Synechococcus sp. MK568070 has shown high consistency of biomass growth in relation to NH4+load and substantially higher proportion of lipids than most studied cyanobacteria [38,39]. Whereas the Pacific Synechococcus strains achieve lipid yield close to 11% of dry biomass weight, Synechococcus sp. (MK568070) demonstrated yield of 21.40% of dry weight. The produced biomass of 761 mg/L corresponds to the yields obtained in other studies for cyanobacteria grown on commercial freshwater medium. Patel et al. [40] have reported biomass yields close to 1 g/L for Synechococcus and Phormidium species, but under a different light regime, higher starting N-concentration and with a combined NH4+/NO3 nutrient source. However, they observed lipid proportions that were significantly lower than those determined in our study.
In general, applying saline conditions for cyanobacteria growth may bring a disadvantage of slower division rate. However, there are some benefits such as microbial health control, resilience to pathogenic bacteria or opportunistic autotrophic invasions, better accumulation of lipids and independence of fresh water resources. The salinity of 19 used in our research corresponds to brackish conditions and is chosen as optimum salinity for Synechococcus sp. (MK568070) biomass productivity.
The cyanobacteria have evolutionary developed adaptive mechanisms to the major environmental stressors such as salinity, temperature and light intensity, depending on their indigenous environment to facilitate carbon uptake mechanisms and provide undisturbed CO2 availability. Such metabolic plasticity enables enhanced photosynthesis and biomass productivity by additional carbon supply. Air pumping with addition of 2–5% of CO2 is one of the commonly used ways to increase carbon fixation, as well as the provision of organic carbon substrate for support of the mixotrophic growth [41]. As seen from the experiments in PBR2 and PBR4 effects of organic P and CO2 addition, respectively, have both positively impacted biomass productivity of Synechococcus sp. MK568070. This is in accordance with previous studies elucidating the sufficient carbon supply as a prerequisite for lipid biosynthesis under nitrogen stress conditions [37,42]. Moreover, Concas et al. [43] provided a mathematical model for metabolic adaptation of Chlorella vulgaris to 100% (v/v) of CO2.
Unicellular microalgae and cyanobacteria are quite often richer in lipids than filamentous species, known to produce large quantities of polysaccharides. Prokaryotes due to their small size, metabolic plasticity and resilience to rough environmental conditions are widely considered as good candidates for open-pond lipid production [40]. In addition to lipid total yield, the structure of the synthesized triglycerides is very important for biodiesel production. Most of the cyanobacteria have a fatty acid profile dominated by C14, C16 and C18 saturated and monounsaturated fatty acids. However, quite often they contain significant quantities of some essential polyunsaturated fatty acids such as C18 linoleic (18:2ω6) and α-linolenic (18:3ω3) acids whose production in some cases can reach up to 20% of the cellular dry weight [18]. The FAME profiles of Synechococcus sp. MK568070 contained mostly saturated and monounsaturated FAME. The PUFA (18:2 ω6) was present only in the inoculum. Higher proportion of shorter acyl chain, high degree of saturation in the stationary phase, UND as low as 0.45 and 66% of C16 and an absence of polyunsaturated FA provide good biofuel feedstock characteristics. In gaseous CO2 supplied systems, if the CO2 flux is too high, biosynthesis can be directed towards production of high amounts of carbohydrate, sometimes exceeding 60% of the dry biomass. Although the carbohydrate dynamics during Synechococcus sp. MK568070 growth in PBR4 shows high production, the maximum proportion does not exceed 34%. Moreover, the FTIR spectral analysis and (C=O/Amid I) ratio show continuously increasing proportion of carboxylic group in respect to proteins, confirming the prevalence of the lipid biosynthesis within the metabolic pathways during photosynthesis.
One of the advantages of using microalgae in the biofuel production is the possibility of wastewater treatment. In this study for the first time an insight is given on all energetically important groups of molecules synthesized by Synechococcus sp. MK568070 during its cultivation on the oil refinery wastewater. These kind of wastewaters are very demanding regarding their high content of pollutants, and the capability of any microalgae for remediation of such waters while producing a notable amount of biomass is of high interest from the perspective of the lowering risks of coastal water eutrophication and improvements in cost-efficiency of the blue economy. Therefore the nutrient removal efficiency is an important condition for both, the biomass productivity, and for the wastewater bioremediation. The NH4+ removal >99% in six days makes Synechococcus sp. MK568070 a very efficient species in bioremediation of wastewaters enriched with nitrogen. Efficient N-sequestration, metabolic plasticity and a high tolerance to a wide range of ammonium/ammonia concentrations open up the considerations for the genetic remodeling of its biochemical aspects [44]. In order to evaluate the suitability of Synechococcus sp. (MK568070) for biofuel production on the industrial scale, the metabolic mechanisms of lipid synthesis and growth kinetics should be explored in more detail. The potential of lipid accumulation, due to the functional photosynthesis even at the minimal cell quota of nutrients, is critical for the usage of excess industrial CO2 and its more cost-effective industrial transformation to biodiesel. To conclude, this study of biomass and lipid production by the Synechococcus sp. MK568070 when cultivated on oil refinery wastewater with excess CO2, provides useful data for further work in order to bring this species onto the industrial scale of biomass production and contributes to the findings for future prospects of wastewater bioremediation through algae cultivation.

Author Contributions

M.B., T.S., T.D. and S.G. designed the research. Formalization of methodology and data curation were perfprmed by M.B., E.H., A.B. and I.H., M.B. and A.B. performed analyses of lipids and FAME. A.B. performed protein, carbohydrate and FTIR spectroscopy analyses. I.H. was responsible for culturing of the tested species, start up of the experiments by setting up the PBRs’ conditions and SCADA parameters, all samplings and biomass measurements. E.H. was responsible for nutrient analyses. M.B. and T.S. were responsible for the isolation of the tested strain. I.P. was responsible for genetical identification of the tested strain. L.K. was responsible for providing wastewater samples, the data on the content of toxic substances in the used wastewaters as well as for coordination on the behalf of Ina plc. All authors participated in the writing, review and editing of the paper.

Funding

This research was funded under the program of Government of the Republic Croatia to encourage research and development activities in the area of climate change.

Acknowledgments

This work is fully supported by the Croatian Science Foundation under the project number PKP-06-2016-9081 (Assessment of Adriatic Algae Potential in Cogeneration Production of 3rd Generation Biofuel).

Conflicts of Interest

The authors declare no conflict of interest. The funders had no role in the design of the study; in the collection, analyses, or interpretation of data; in the writing of the manuscript, or in the decision to publish the results.

References

  1. Kuan, D.; Duff, S.; Posarac, D.; Bi, X. Growth optimization of Synechococcus elongatus PCC7942 in lab flasks and a 2-D photobioreactor. Can. J. Chem. Eng. 2015, 93, 640–647. [Google Scholar] [CrossRef]
  2. Santos-Merino, M.; Garcillán-Barcia, M.P.; De La Cruz, F. Engineering the fatty acid synthesis pathway in Synechococcus elongatus PCC 7942 improves omega-3 fatty acid production. Biotechnol. Biofuels 2018, 11, 239. [Google Scholar] [CrossRef]
  3. Safafar, H.; Hass, M.Z.; Møller, P.; Holdt, S.L.; Jacobsen, C. High EPA-Biomass from Nannochloropsissalina Cultivated in Flat-Panel Photo-Bioreactor on a Process Water-Enriched Growth Medium. Mar. Drugs 2016, 14, 144. [Google Scholar] [CrossRef]
  4. Eltgroth, M.L.; Watwood, R.L.; Wolfe, G.V. Production and cellular localization of neutral long-chain lipids in the haptophyte algae Isochrysisgalbana and Emilianiahuxley. J. Phycol. 2005, 41, 1000–1009. [Google Scholar] [CrossRef]
  5. Chen, X.; Li, Z.; He, N.; Zheng, Y.; Li, H.; Wang, H.; Wang, Y.; Lu, Y.; Li, Q.; Peng, Y. Nitrogen and phosphorus removal from anaerobically digested wastewater by microalgae cultured in a novel membrane photobioreactor. Biotechnol. Biofuels 2018, 11, 190. [Google Scholar] [CrossRef] [PubMed]
  6. Beacham, T.A.; Sweet, J.B.; Allen, M.J. Large scale cultivation of genetically modified microalgae: A new era for environmental risk assessment. Algal Res. 2017, 25, 90–100. [Google Scholar] [CrossRef]
  7. Collos, Y.; Harrison, P.J. Acclimation and toxicity of high ammonium concentrations to unicellular algae. Mar. Pollut. 2014, 80, 8–23. [Google Scholar] [CrossRef]
  8. Alcantara, C.; Dominguez, J.M.; Garcia, D.; Blanco, S.; Perez, R.; Garcia-Encina, P.A.; Munoz, R. Evaluation of wastewater treatment in a novel anoxic-aerobic algal-bacterial photobioreactor with biomass recycling through carbon and nitrogen mass balances. Bioresour. Technol. 2015, 191, 173–186. [Google Scholar] [CrossRef]
  9. Renuka, N.; Sood, A.; Prasanna, R.; Ahluwalia, A.S. Phycoremediation of wastewaters: A synergistic approach using microalgae for bioremediation and biomass generation. Int. J. Environ. Sci. Technol. 2015, 12, 1443–1460. [Google Scholar] [CrossRef]
  10. Silva-Benavides, A.M.; Torzillo, G. Nitrogen and phosphorus removal through laboratory batch cultures of microalgae Chlo- rella vulgaris and cyanobacterium Planktothrix isothrix grown as monoalgal and as co-cultures. J. Appl. Phycol. 2011, 24, 267–276. [Google Scholar] [CrossRef]
  11. El-Sheekh, M.M.; El-Shouny, W.A.; Osman, M.E.; El-Gammal, E.W. Growth and heavy metals removal efficiency of Nostoc muscorum and Anabaena subcylindrica in sewage and industrial wastewater effluents. Environ. Toxicol. Pharmacol. 2005, 19, 357–365. [Google Scholar] [CrossRef]
  12. Chinnasamy, S.; Bhatnagar, A.; Hunt, R.W.; Das, K. Microalgae cultivation in a wastewater dominated by carpet mill effluents for biofuel applications. Bioresour. Technol. 2010, 101, 3097–3105. [Google Scholar] [CrossRef]
  13. Schwarzenbach, R.P.; Escher, B.I.; Fenner, K.; Hofstetter, T.B.; Johnson, C.A.; Von Gunten, U.; Wehrli, B. The challenge of micropolutants in aquatic systems. Science 2016, 313, 1072–1077. [Google Scholar] [CrossRef]
  14. El-Sheekh, M.M.; Hamouda, R.A.; Nizam, A.A. Biodegradation of crude oil by Scenedesmus obliquus and Chlorella vulgaris growing under heterotrophic conditions. Int. Biodeterior. Biodegradation 2013, 82, 67–72. [Google Scholar] [CrossRef]
  15. Hu, Q.; Zeng, R.; Zhang, S.-X.; Yang, Z.-H.; Huang, H. Production of Microalgal Lipids as Biodiesel Feedstock with Fixation of CO2 by Chlorella vulgaris. Food Technol. Biotechnol. 2014, 52, 285–291. [Google Scholar]
  16. Islam, M.A.; Magnusson, M.; Brown, R.J.; Ayoko, G.A.; Nabi, M.N.; Heimann, K. Microalgal Species selection for Biodiesel Production Based on Fuel Properties Derived frmFattty Acid Profiles. Energies 2013, 6, 5676–5702. [Google Scholar] [CrossRef]
  17. Motwalli, O.; Essack, M.; Salhi, A.; Hanks, J.; Mijakovic, I.; Bajic, V.B. BioPS: System for screening and assessment of biofuel-production potential of cyanobacteria. PLoS ONE 2018, 13, e0202002. [Google Scholar] [CrossRef]
  18. Yoshino, T.; Kakunaka, N.; Liang, Y.; Ito, Y.; Maeda, Y.; Nomaguchi, T.; Matsunaga, T.; Tanaka, T. Production of ω3 fatty acids in marine cyanobacterium Synechococcus sp. strain NKBG 15041c via genetic engineering. Appl. Microbiol. Biotechnol. 2017, 101, 6899–6905. [Google Scholar] [CrossRef]
  19. Cardoso, S.M.; Carvalho, L.; Silva, P.; Rodrigues, M.; Pereira, O.; Pereira, L.; De Carvalho, L. Bioproducts from Seaweeds: A Review with Special Focus on the Iberian Peninsula. Org. Chem. 2014, 18, 896–917. [Google Scholar] [CrossRef]
  20. Tibocha-Bonilla, J.D.; Zuñiga, C.; Godoy-Silva, R.D.; Zengler, K. Advances in metabolic modelingof oleaginous microalgae. Biotechnol. Biofuels 2018, 11, 241. [Google Scholar] [CrossRef] [PubMed]
  21. Singh, S.C.; Sinha, R.P.; Häder, D.-P. Role of Lipids and Fatty Acids in Stress Tolerance in Cyanobacteria. Acta Protozool. 2002, 41, 297–308. [Google Scholar]
  22. Murphy, J.; Riley, J. A modified single solution method for the determination of phosphate in natural waters. Anal. Chim. Acta 1962, 27, 31–36. [Google Scholar] [CrossRef]
  23. Iglewicz, B.; Hoaglin, D.C. The ASQC Basic References in Quality Control: Statistical Techniques. In How to Detect and Handle Outliers; Mykytka, E.F., Ed.; ASQC Quality Press: Milwaukee, WI, USA, 1993; Volume 16, pp. 1–87. [Google Scholar]
  24. Bowen, C.E.; Bidwell, J.P. Ionization of Ammonia in Seawater: Effects of Temperature, pH, and Salinity. J. Fish. Res. Board Can. 1978, 35, 12–16. [Google Scholar]
  25. Parsons, T.R.; Maita, Y.; Lalli, C.M. A Manual of Chemical and Biological Methods for Seawater, Analysis; Pergamon Press: Elmsford, NY, USA, 1984; pp. 149–153. [Google Scholar]
  26. Ivančić, I.; Degobbis, D. An optimal manual procedure for ammonia analysis in natural waters by the indophenol blue method. Water Res. 1984, 18, 1143–1147. [Google Scholar] [CrossRef]
  27. Bligh, E.G.; Dyer, W.J. A rapid method for total lipid extraction and purification. Can. J. Biochem. Physiol. 1959, 37, 911–917. [Google Scholar] [CrossRef] [PubMed]
  28. Miller, L. Gas–liquid chromatography of cellular fatty acid as abacterial identification aid. HP Gas Chromatogr. Appl. Note 1985, 228, 37. [Google Scholar]
  29. Loewus, F.A. Improvement in Anthrone Method for Determination of Carbohydrates. Anal. Chem. 1952, 24, 219. [Google Scholar] [CrossRef]
  30. Safafar, H.; Nørregaard, P.U.; Ljubic, A.; Møller, P.; Holdt, S.L.; Jacobsen, C. Enhancement of Protein and Pigment Content in Two Chlorella Species Cultivated on Industrial Process Water. J. Mar. Sci. Eng. 2016, 4, 84. [Google Scholar] [CrossRef]
  31. Driver, T.; Bajhaiya, A.K.; Allwood, J.W.; Goodacre, R.; Pittman, J.K.; Dean, A.P. Metabolic responses of eukaryotic microalgae to environmental stress limit the ability of FT-IR spectroscopy for species identification. Algal Res. 2015, 11, 148–155. [Google Scholar] [CrossRef]
  32. Pistorius, A.M.; DeGrip, W.J.; Egorova-Zachernyuk, T.A.; Egorova-Zachernyuk, T.A. Monitoring of biomass composition from microbiological sources by means of FT-IR spectroscopy. Biotechnol. Bioeng. 2009, 103, 123–129. [Google Scholar] [CrossRef]
  33. Laurens, L.M.L.; Wolfrum, E.J. Feasibility of spectroscopic characterisation of algal lipids: Chemometric correlation of NIR and FTIR spectra with exogenous lipids in algal biomass. Bioenerg. Res. 2011, 4, 22–35. [Google Scholar] [CrossRef]
  34. Mayers, J.J.; Flynn, K.J.; Shields, R.J. Rapid determination of bulk microalgal biochemical composition by Fourier-Transform Infrared spectroscopy. Bioresour. Technol. 2013, 148, 215–220. [Google Scholar] [CrossRef] [Green Version]
  35. Giordano, M.; Kansiz, M.; Heraud, P.; Beardall, J.; Wood, B.; McNaughton, D. Fourier transform infrared spectroscopy as a novel tool to investigate changes in intracellular macromolecular pools in the marine microalgae Chaetocerosmuellerii (Bacillariophyceae). J. Phycol. 2001, 37, 271–279. [Google Scholar] [CrossRef]
  36. Hyenstrand, P.; Burkert, U.; Pettersson, A.; Blomqvist, P. Competition between the green alga Scenedesmusand the cyanobacterium Synechococcusunder different modes of inorganic nitrogen supply. Hydrobiologia 2000, 435, 91–98. [Google Scholar] [CrossRef]
  37. Wen, X.; Du, K.; Wang, Z.; Peng, X.; Luo, L.; Tao, H.; Xu, Y.; Zhang, D.; Geng, Y.; Li, Y. Effective cultivation of microalgae for biofuel production: A pilot scale evaluation of a novel oleaginous microalga Graesiella sp. WBG-1. Biotechnol. Biofuels 2016, 9, 123. [Google Scholar] [CrossRef] [PubMed]
  38. Sarmah, P.; Rout, J. Efficient biodegradation of low-density polyethylene by cyanobacteriaisolated from submerged polyethylene surface in domesticsewage water. Environ. Sci. Pollut. Res. 2018, 25, 33508–33520. [Google Scholar] [CrossRef] [PubMed]
  39. ZeaObando, C.; Linossier, I.; Dufosse, L.; Zubia, M.; Tunin-Ley, A.; Turquet, J.; Grondin, I.; Tremblay, R.; Fay, F.; Rehel, K. Fatty Acid Profiling of Tropical Microalgae and Cyanobacteria Strains Isolated From Southwest Indian Ocean Islands. J. Mar. Biol. Aquacult. 2017, 3, 1–14. [Google Scholar]
  40. Patel, V.K.; Sundaram, S.; Patel, A.K.; Kalra, A. Characterization of Seven Species of Cyanobacteria for High-Quality Biomass Production. Arab J. Sci. Eng. 2018, 43, 109–121. [Google Scholar] [CrossRef]
  41. De Farias Silva, C.; Sforza, E.; Bertucco, A. Enhancing Carbohydrate Productivity in Photosynthetic Microorganism Production: A Comparison between Cyanobacteria and Microalgae and the Effect of Cultivation Systems. In Advances in Feedstock Conversion Technologies for Alternative Fuels and Bioproducts; Hosseini, M., Ed.; Chapter 3; Woodhead Publishing: Cambridge, UK, 2019. [Google Scholar]
  42. Dillschneider, R.; Steinweg, C.; Rosello-Sastre, R.; Posten, C. Biofuels from microalgae: Photoconversion efficiency during lipid accumulation. Bioresour. Technol. 2013, 142, 647–654. [Google Scholar] [CrossRef] [PubMed]
  43. Concas, A.; Lutzu, G.A.; Pisu, M.; Cao, G. Experimental analysis and novel modeling of semi-batch photobioreactors operated with Chlorella vulgaris and fed with 100% (v/v) CO2. Chem. Eng. J. 2012, 213, 203–213. [Google Scholar] [CrossRef]
  44. Chi, X.; Yang, Q.; Zhao, F.; Qin, S.; Yang, Y.; Shen, J.; Lin, H. Comparative analysis of fatty acid desaturases in cyanobacterial genomes. Comp. Funct. Genom. 2008, 2008, 284508. [Google Scholar] [CrossRef]
Figure 1. A scheme of four photobioreactors (PBR). Temperature, air/CO2 bubbling, pH, light intensity and diurnal cycle are controlled by the supervisory control and data acquisition (SCADA) system.
Jmse 07 00164 g001
Figure 2. Ammonium tolerance of Synechococcus sp. (MK568070) tested in wastewater effluent containing 2–3.2 mM of NH4+.
Jmse 07 00164 g002
Figure 3. Salinity tolerance of Synechococcus sp. MK568070.
Jmse 07 00164 g003
Figure 4. Biomass growth of Synechococcus sp. MK568070 when cultured in different wastewaters: WW1 (c (DIN) = 0.8 mM), WW2 (c (DIN) = 0.8 mM) and WW3:ASW (1:1; c (DIN) = 1.3 mM).
Jmse 07 00164 g004
Figure 5. Change of ammonia/ammonium and SRP concentrations during the growth of Synechococcus sp. MK568070 on WW3:ASW (1:1) with adjusted DIN/SRP to 8.
Jmse 07 00164 g005
Figure 6. Biomass yield and fatty acid methyl esters (FAME) dynamics during Synechococcus sp. (MK568070) growth in PBR4.
Jmse 07 00164 g006
Figure 7. Cellular carbohydrates and protein dynamics in Synechococcus sp. MK568070 cultivated on the oil refinery wastewater.
Jmse 07 00164 g007
Figure 8. The relationship between protein (Amid1, v 1655 cm−1) and fatty acid (C=O carboxylic, v 1745 cm−1) during growth of Synechococcus sp. MK568070 in PBR4.
Jmse 07 00164 g008
Table 1. The composition of the oil refinery wastewaters used in the experiments.
Wastewater TypeNO2 (µM)NO3 (µM)NH4+/NH3 (mM)DIN (mM)SRP (mM)DOP (µM)DIN/SRP
WW12.25.10.80.80.11.868
WW223.7204.00.60.80.1618.156
WW30.14.52.52.50.0012.091897
Table 2. In the fatty acid profile during 15 days of experiment in Synechococcus sp. MK568070, proportion of saturated (SAT), monounsaturated (MUFA) and polyunsaturated (PUFA) fatty acids and the unsaturation index (UND).
Days of Experiment
1234689111315
C11:0 0.53 0.39 0.21
C12:0 0.21 0.340.290.22
C13:0
C14:10.33 0.810.710.540.480.580.590.59
C14:011.0819.9221.8321.3319.7819.6618.2216.7819.7313.26
C15:1
C15:0i/a 0.290.260.15
C15:00.80 0.640.530.440.380.590.610.361.23
C16:1c19.6931.9032.1231.8229.8829.4830.6529.3731.9121.27
C16:1t0.70 0.68 0.600.640.250.280.651.75
C16:040.1631.4428.6030.9229.5629.7525.1924.5927.4143.04
C17:0 i/a 0.45 0.440.520.580.51
C17:10.27 0.25 0.260.230.18
C17:01.71 1.030.850.750.791.011.100.632.51
C18:2(n-6)8.10
C18:1c8.588.496.547.2711.3313.0517.3820.6512.715.94
C18:1t 0.19 2.15
C18:06.913.643.733.613.363.273.593.572.948.77
C20:10.61
C20:00.59 0.28
SAT61.2555.0056.7557.7753.8954.6849.7547.7852.1668.82
MUFA30.1840.3940.4039.8042.3543.6549.1351.3146.0531.11
PUFA8.100.000.000.000.000.000.000.000.000.00
DETRIT2.770.002.361.381.181.622.672.781.843.74
C1411.4219.9222.6422.0420.3220.1418.8117.3720.3213.26
C1660.5563.3461.4062.7460.0459.8656.0954.2459.9766.06
C1823.5812.1210.2710.8814.6916.3220.9824.4015.6516.86
UND0.890.730.720.690.790.800.991.070.880.45
Table 3. Absorption bands in the IR spectra of the microalgae [34,35].
Wave Number (cm−1)Functional Group
3400–3200ν OH (water, alcohol), ν N-H (Amide A, proteins)
2960νasCH3, aliphatic stretching, methyl group
2930νas CH2, aliphatic stretching, methylene group
2850ν CH2, v CH3, methylene and methyl group
1745ν C=O, ester of lipids and fatty acids
1655ν C=O, Protein (Amide I)
1545δ N-H, ν C-N, Protein (Amide II)
1420–470δas CH2, δas CH3, aliphatic stretching, methyl and methylene group
1390δaCH2, CH2 CH3Proteins/Carboxylic groups
1200–900ν C-O-C Polysaccharides
1075 and 950ν Si-O, Silicate frustules
980–940P-O-P Polyphosphate

