The Snell’s Window Image for Remote Sensing of the Upper Sea Layer: Results of Practical Application


Abstract
:1. Introduction
2. Materials and Methods
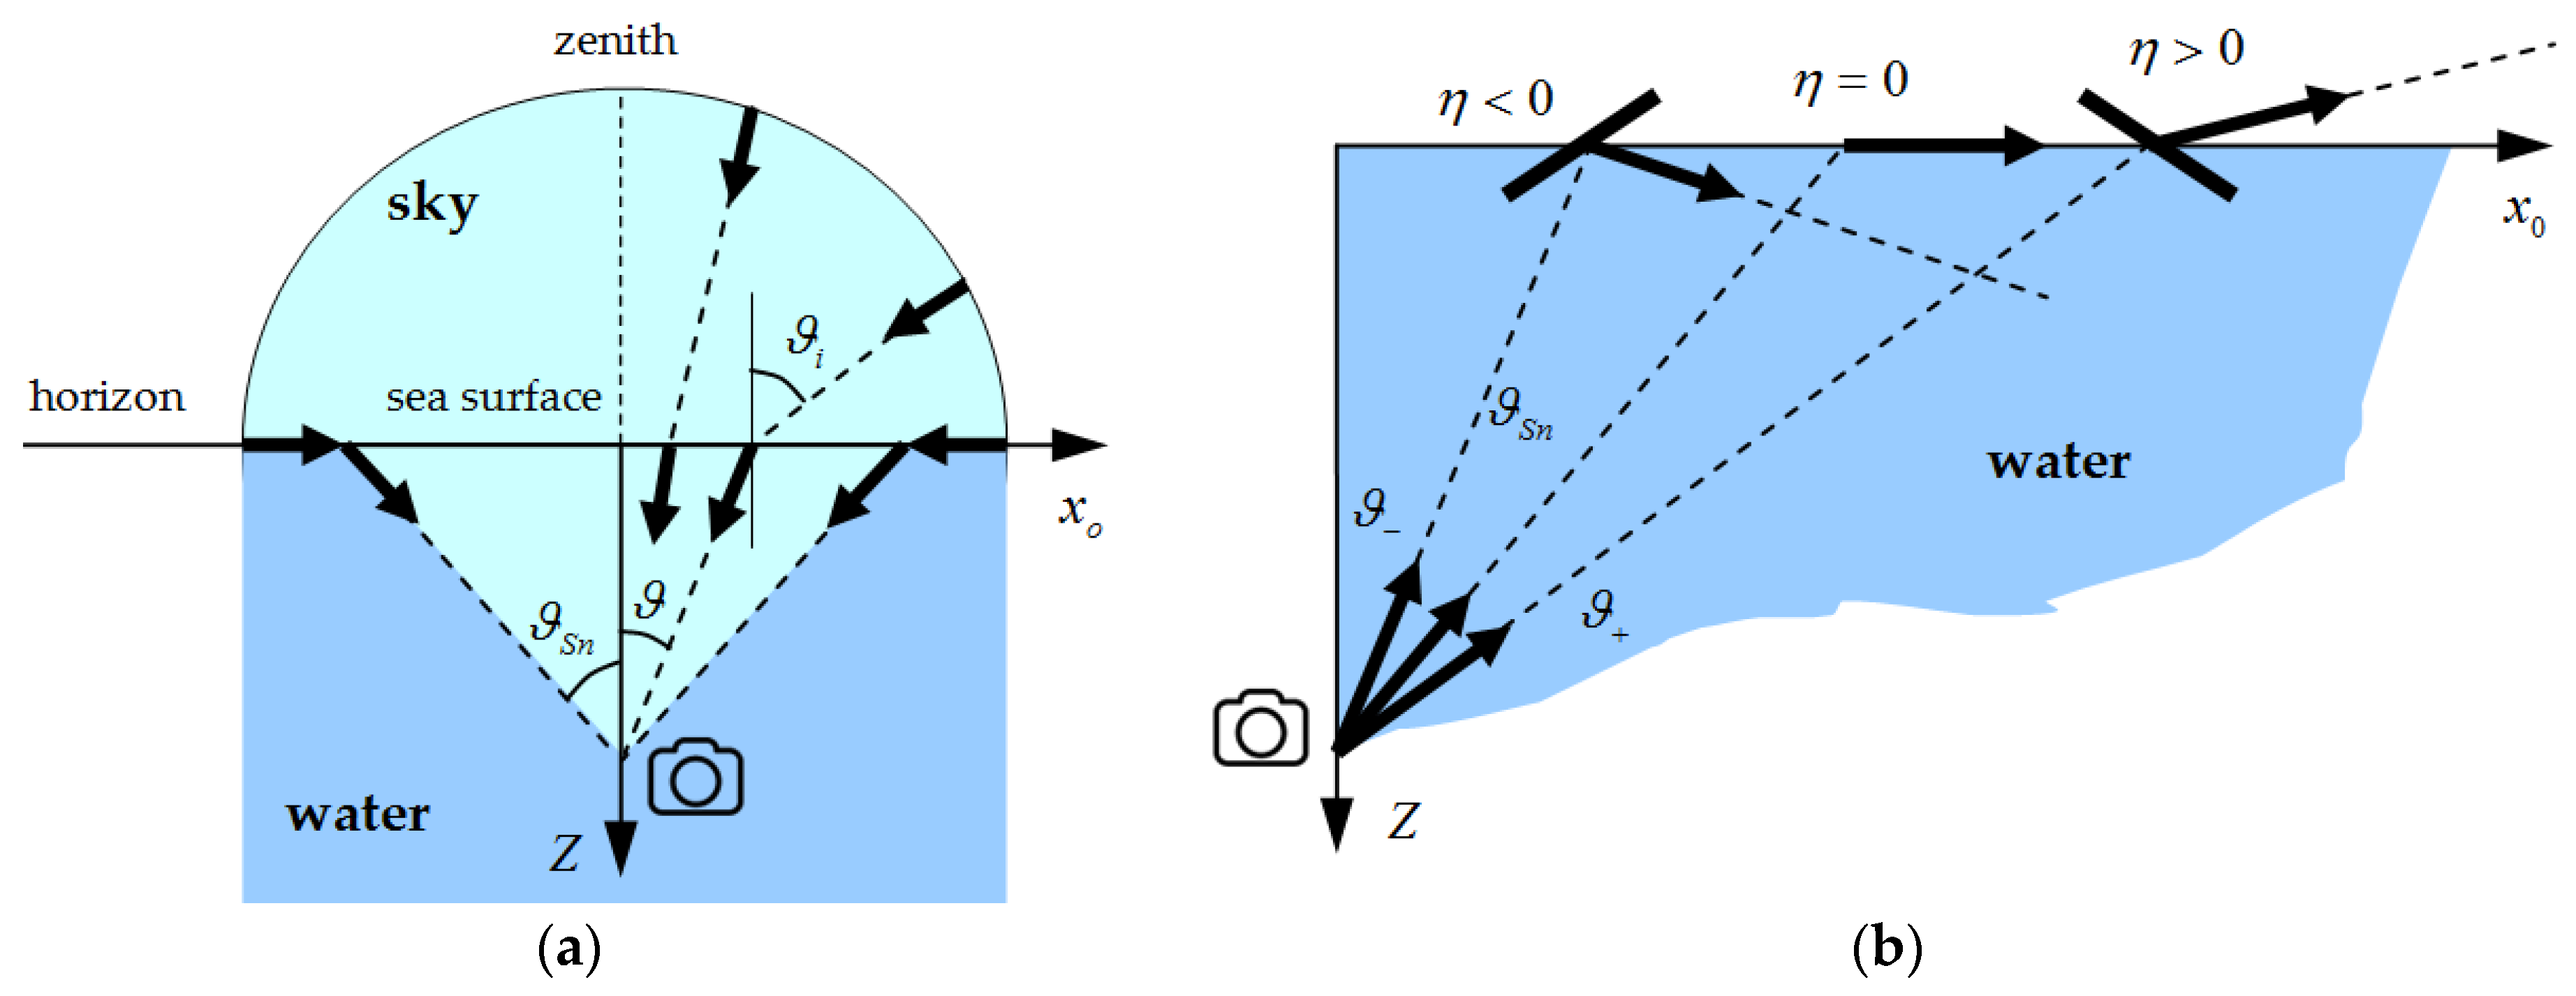
2.1. Analytical Model of the Instantaneous Snell’s Window Image Formed by Nonscaterred Light
2.2. Analytical Model of the Accumulated Snell’s Window Image Taking into Account Scattering Properties of Water
2.3. Algorithms for Solving Inverse Problems
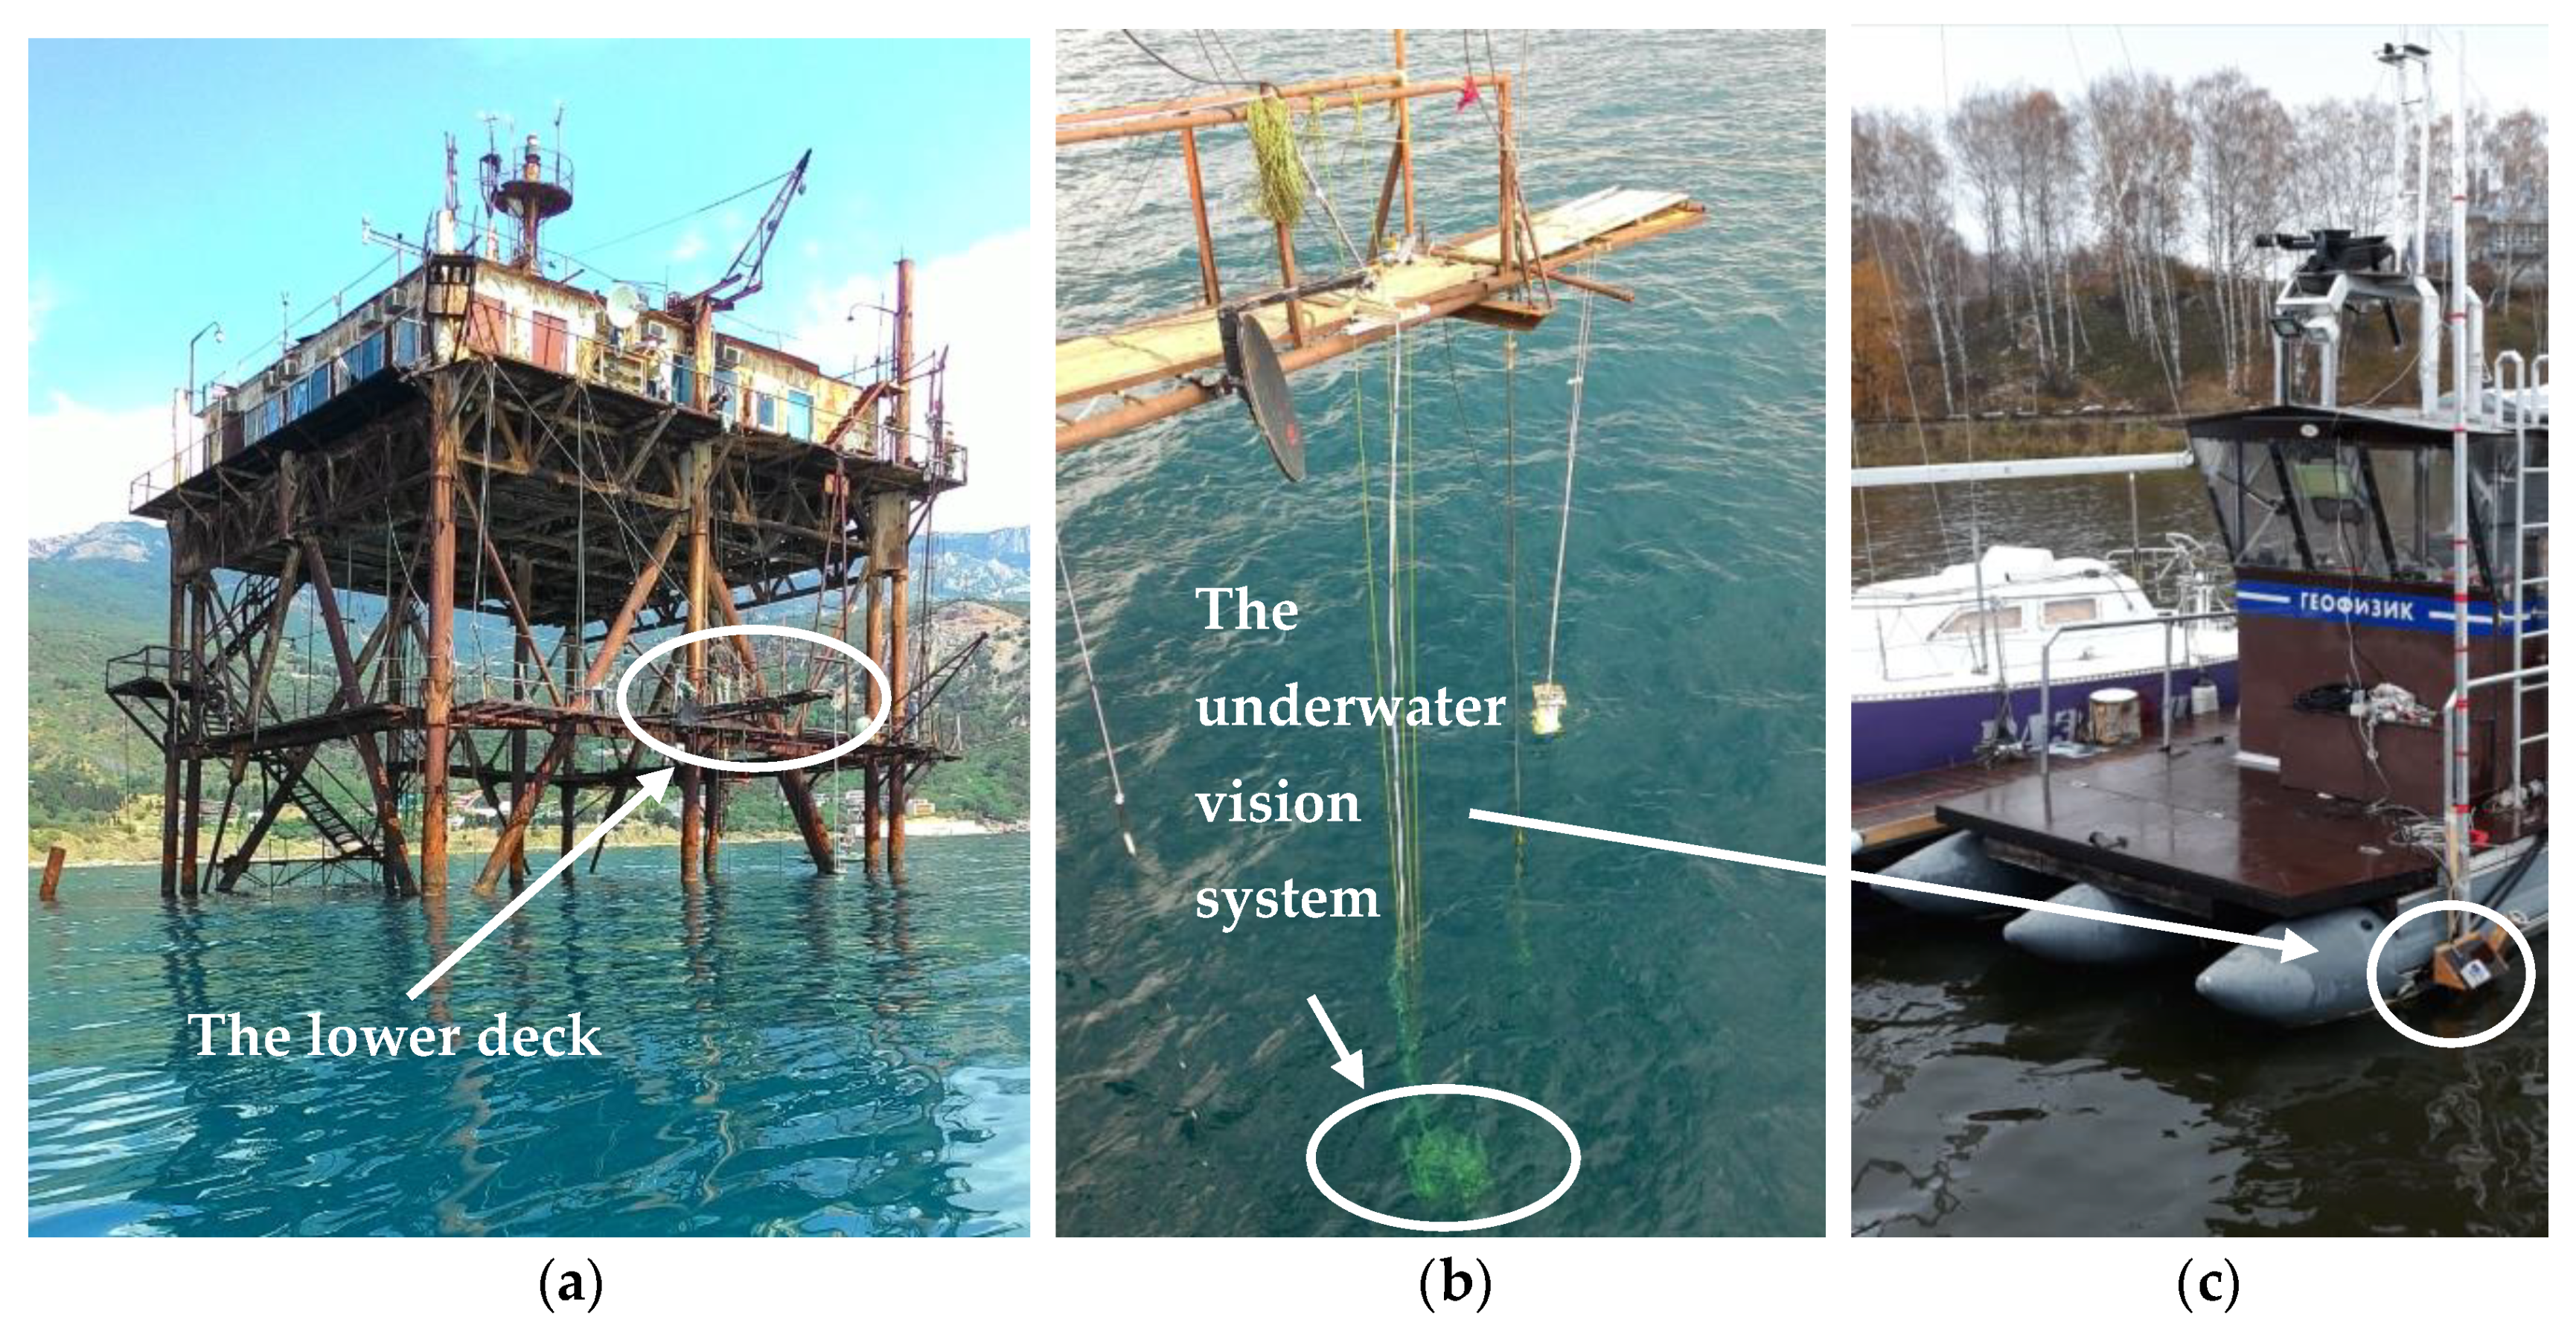
2.4. Experiment
2.4.1. The Black Sea Experiment
2.4.2. Gorky Reservoir Experiment
3. Results and Discussion
3.1. Selection of the Optimal Section of the Snell’s Window Image
3.2. Image Processing Technique
- 21 videos, recorded at seven depths in three color filters, were loaded into specially developed software. Each video was divided into frames and an array of frames with dimensions was formed, where and are resolutions along the Snell’s window image and across it, respectively, is the frame number of video according to depth , and each color filter, where is a number of color.
- Correct calculation of the statistical characteristics of the Snell’s window image could be performed only on the basis of data arrays of a uniform dimension. As each video had its own duration the following search procedure of video with minimum length was used:with the subsequent shortening of the original arrays to dimension , where .
- Then, cycle was started and ach frame was averaged in cross direction along the transverse coordinate . As a result, the array of accumulated radial cross section image of the Snell’s window was formed.
- For each accumulated radial cross section the search of the Snell’s window border was carried out by its sliding window smoothing with subsequent differentiation by :where index still corresponds to depth and —to number of color filter. In Equation (14) variable is derived from the number of arguments of initial function (see Equation (6)) in connection with its introduction to the corresponding index . Also the viewing angle is replaced to the pixel coordinate . Other remaining parameters are omitted for compact representation. The function minimum (14) corresponded to the Snell’s window border . This procedure was necessary, as the webcam was not rigidly fixed underwater and, as a result, was slowly rocking due to current and wind-wave action. The knowledge of the Snell’s window border coordinates made it possible to center each section relative to it.
- The location of the Snell’s window border in the left or right half of the image determined the distance to the image edge . Minimizing the array of coordinates of the Snell’s window border over all sections allowed to calculate the minimum value , and cut off all sections, reducing them to a single scale. . In other words, all the Snell’s window sections were limited to single scale images with a centered border of the Snell’s window. This allowed us to minimize the influence of camera rocking and ensure the Snell’s window imaging validity from all expeditions. In cases where camera rocking was significant due to long waves, the data was discarded.
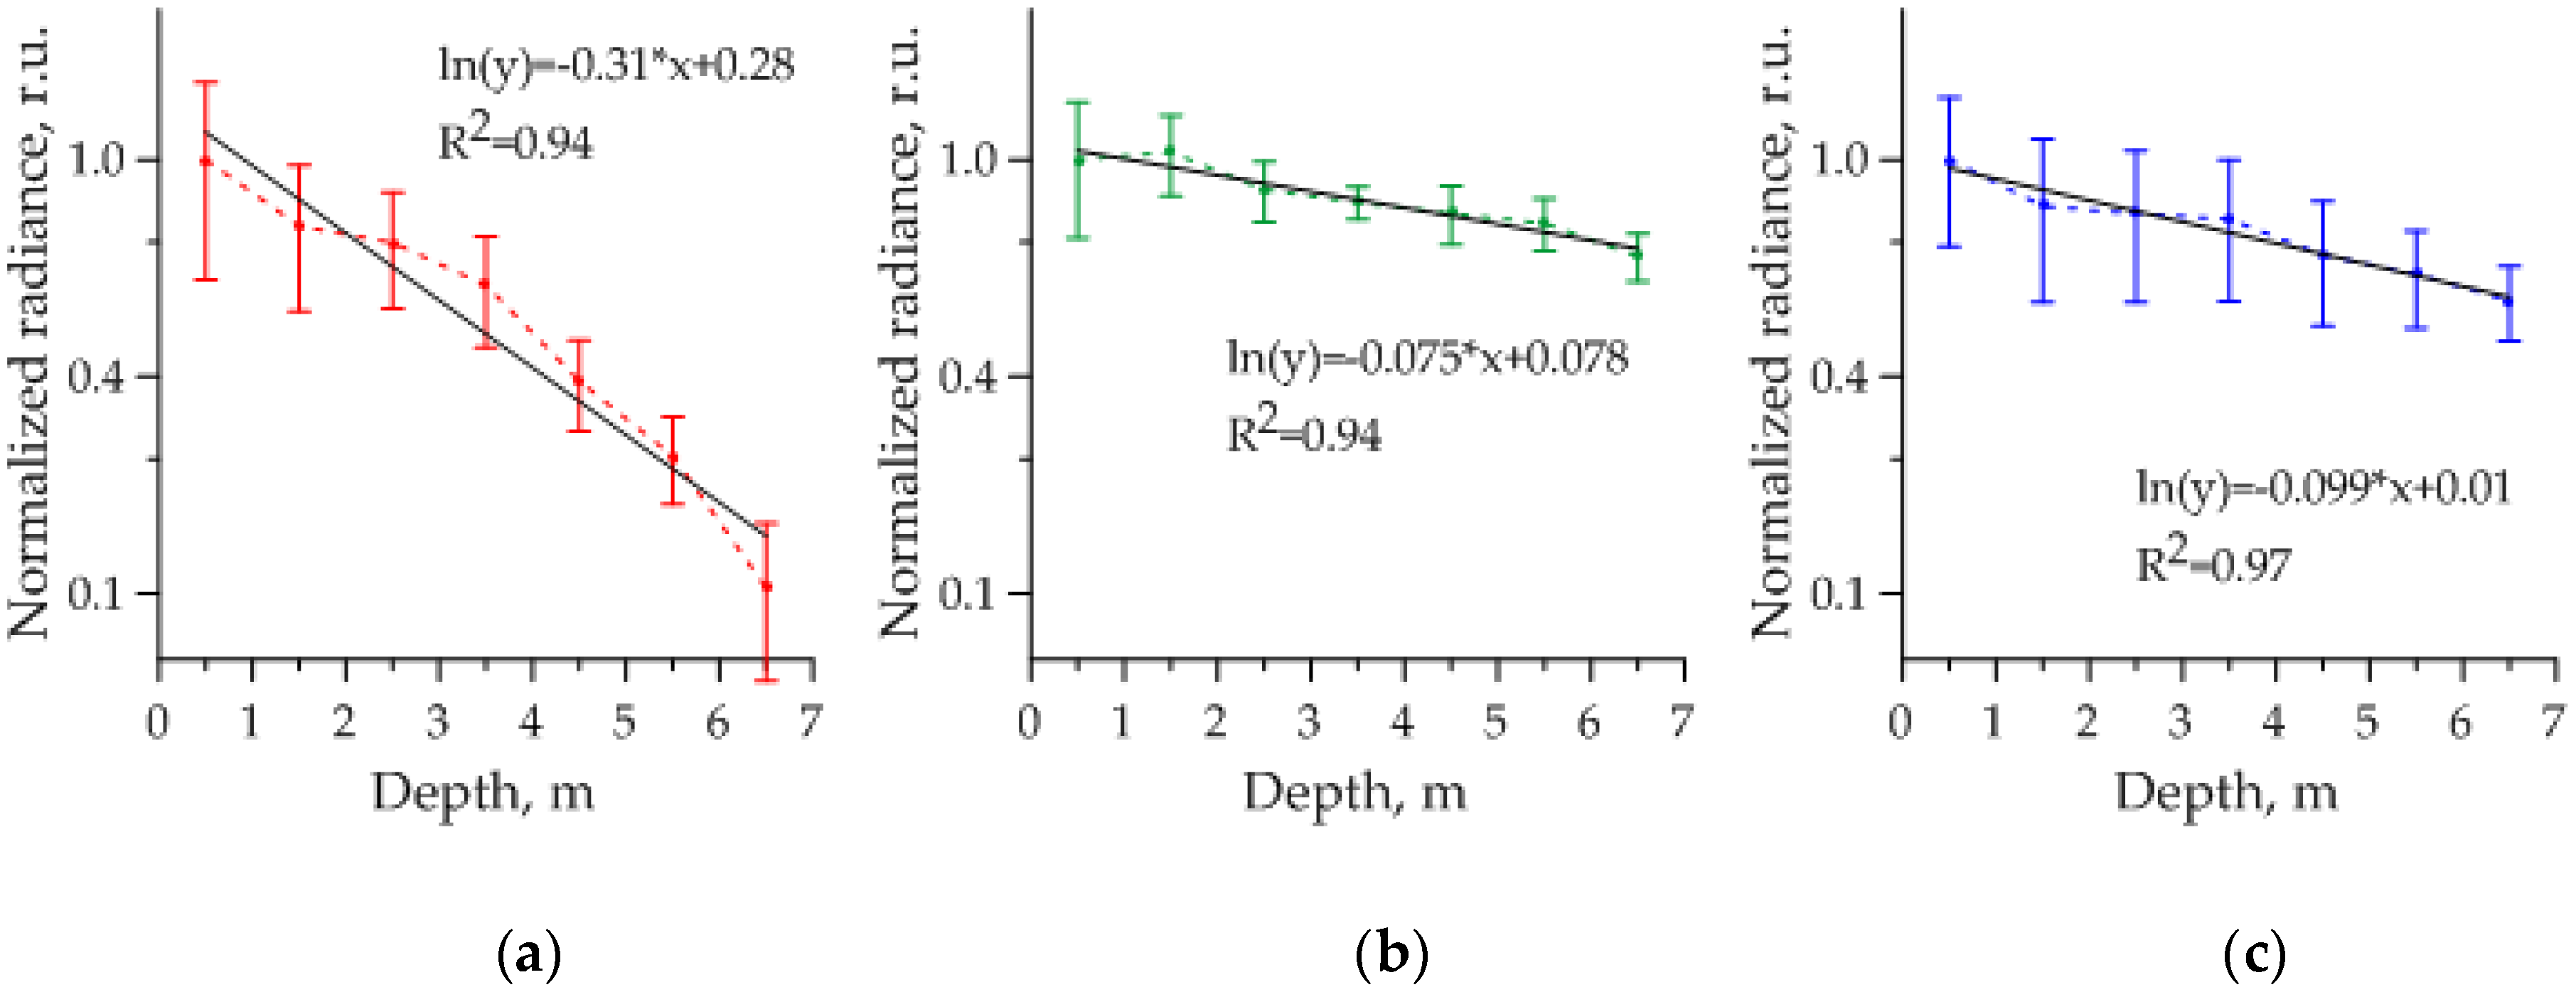
- The final step was the normalization of each section by radiance at first depth and pixel with coordinate = 10:
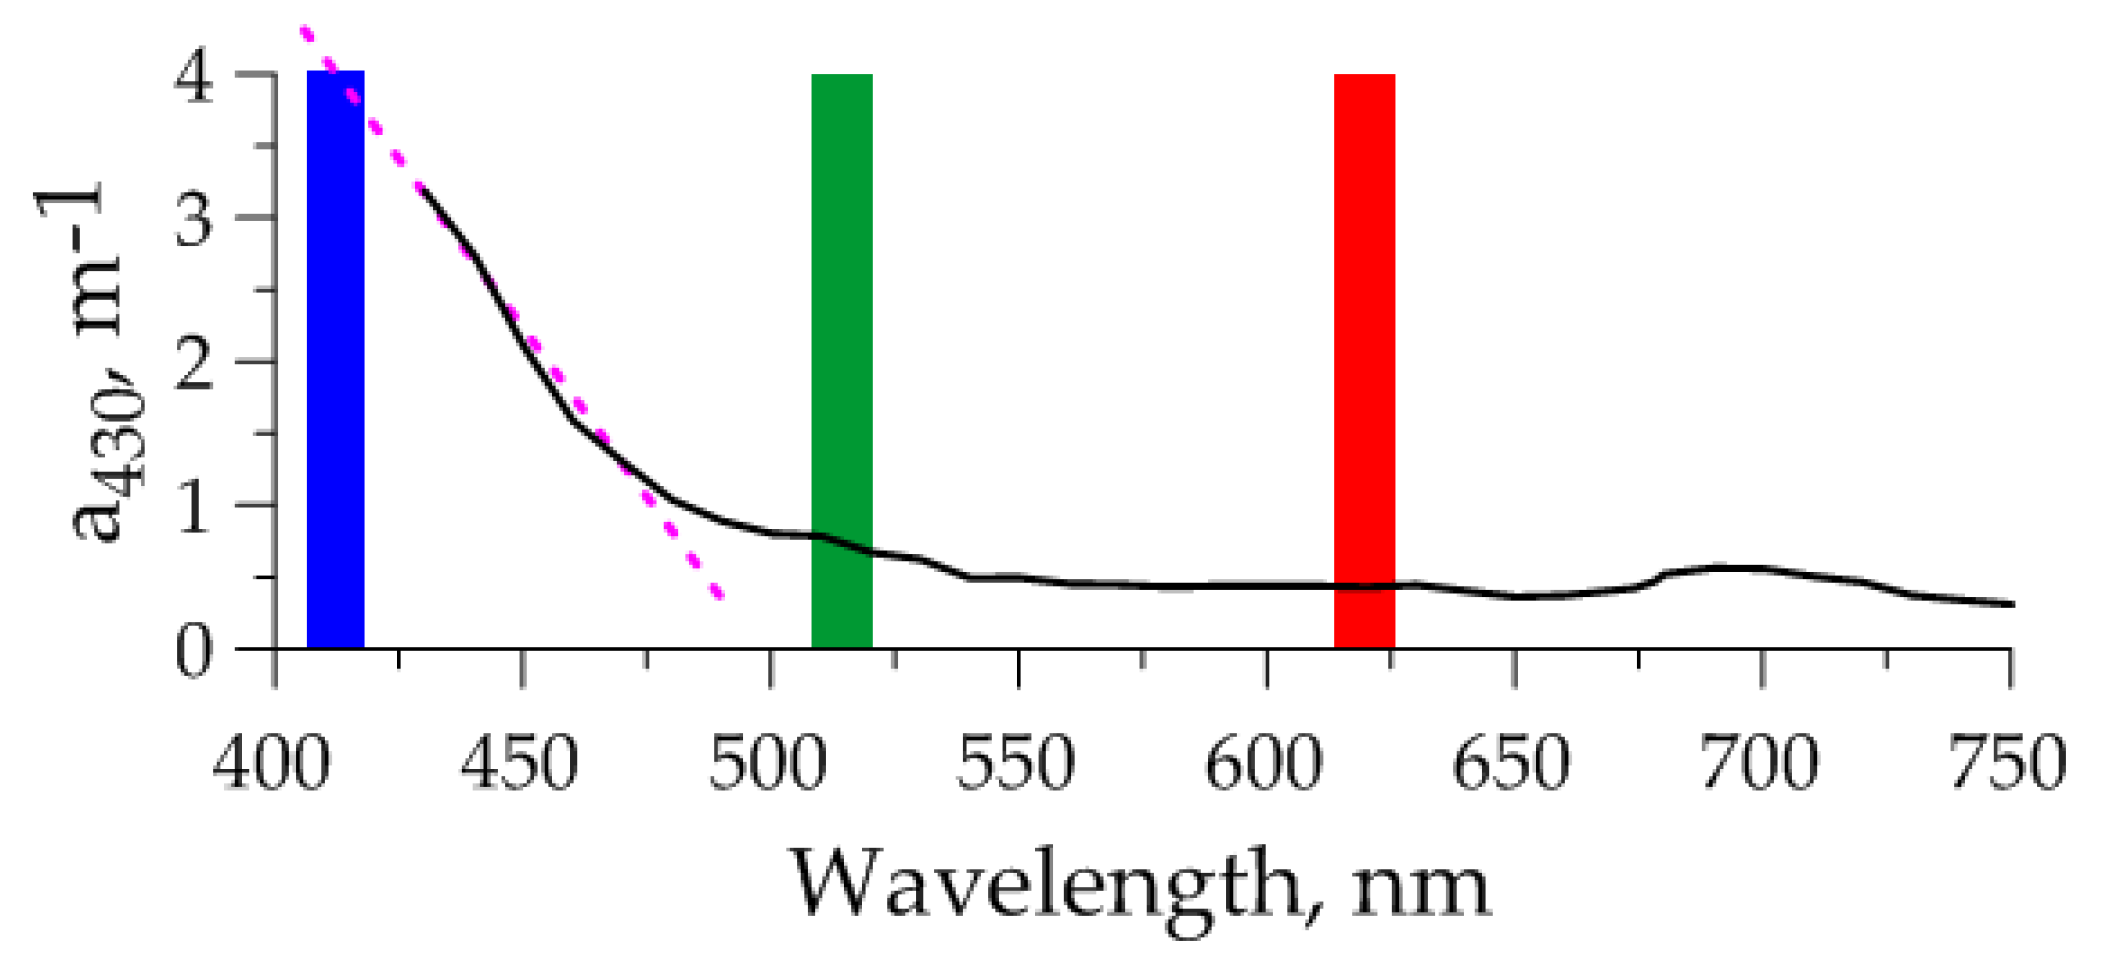
3.3. Determination of Absorption Coefficient
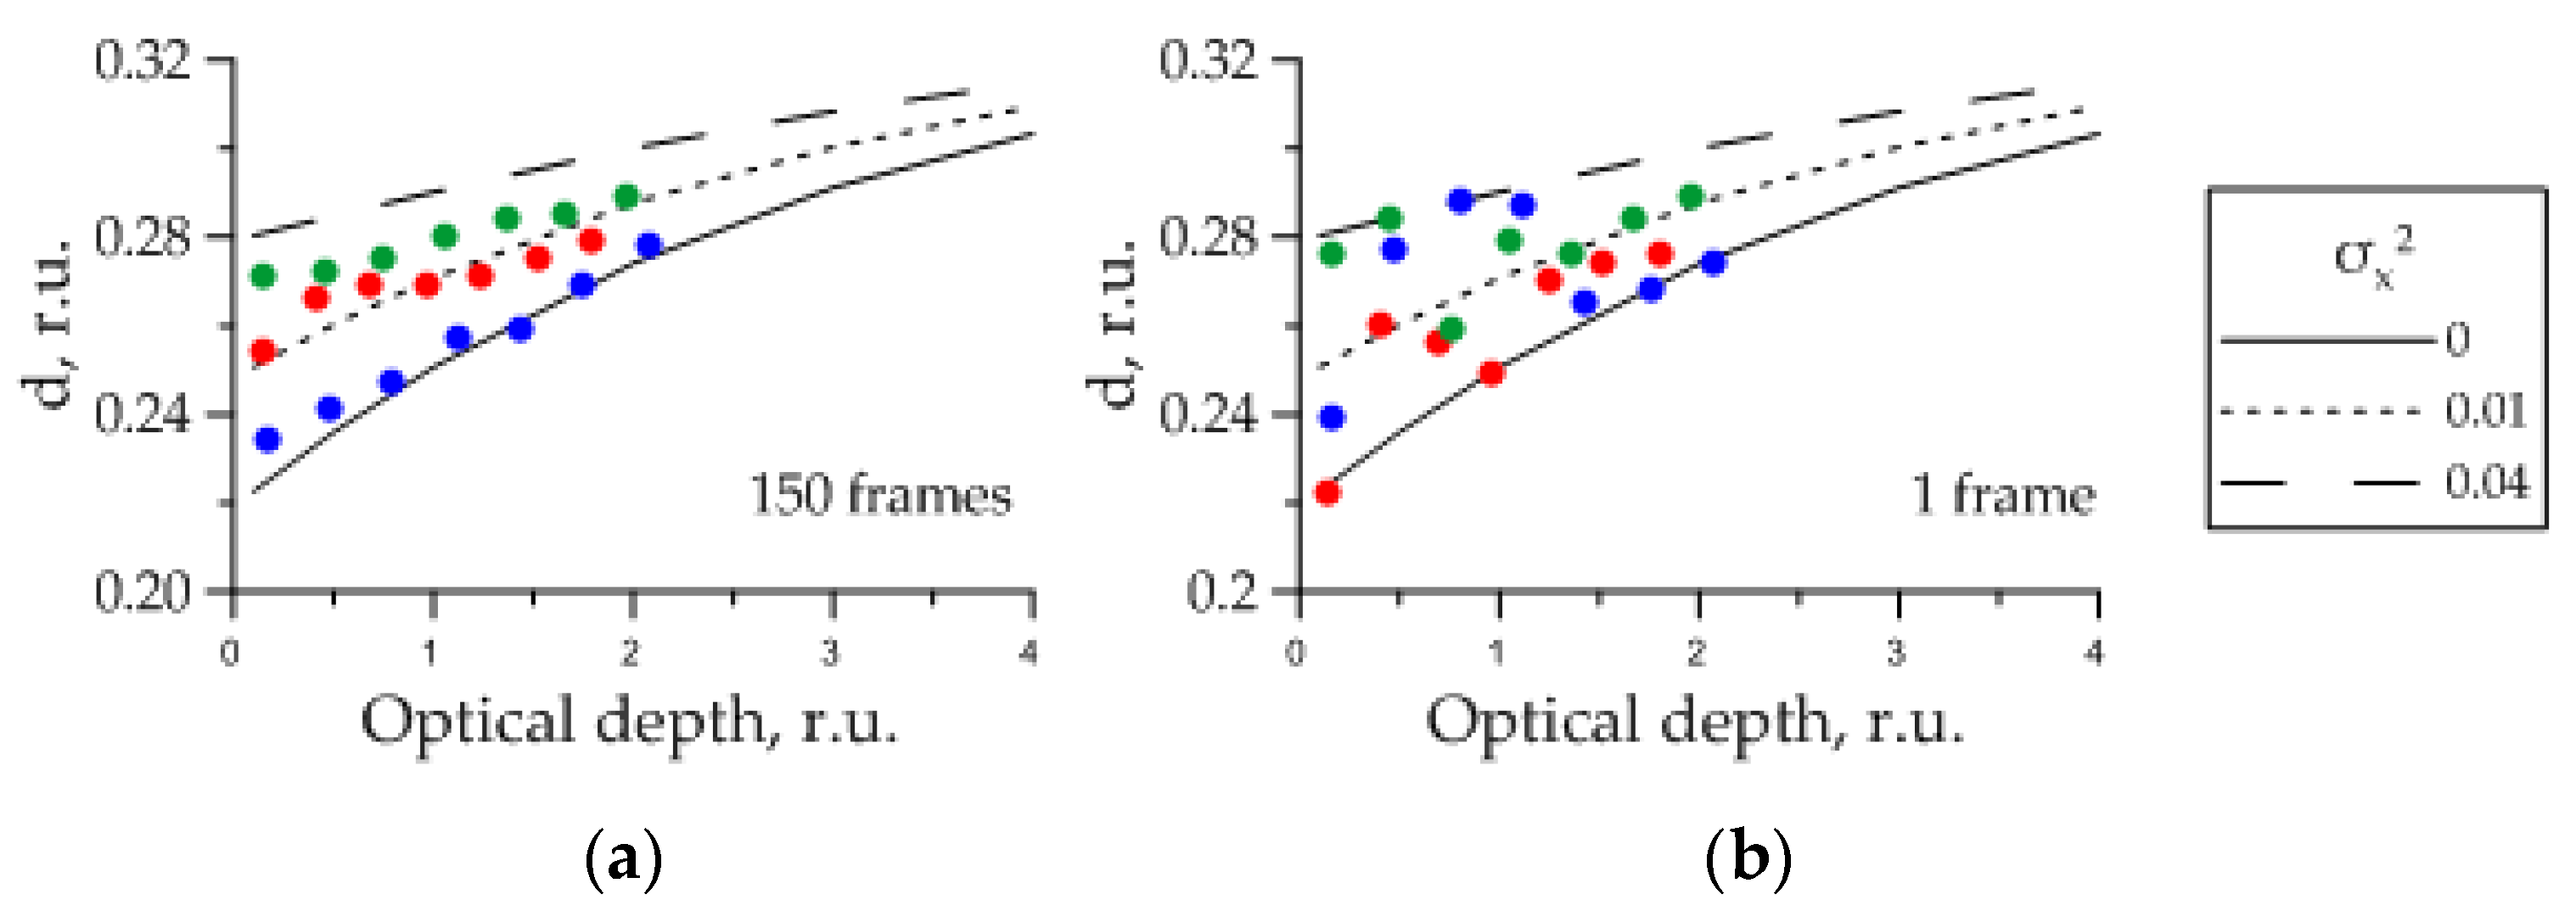
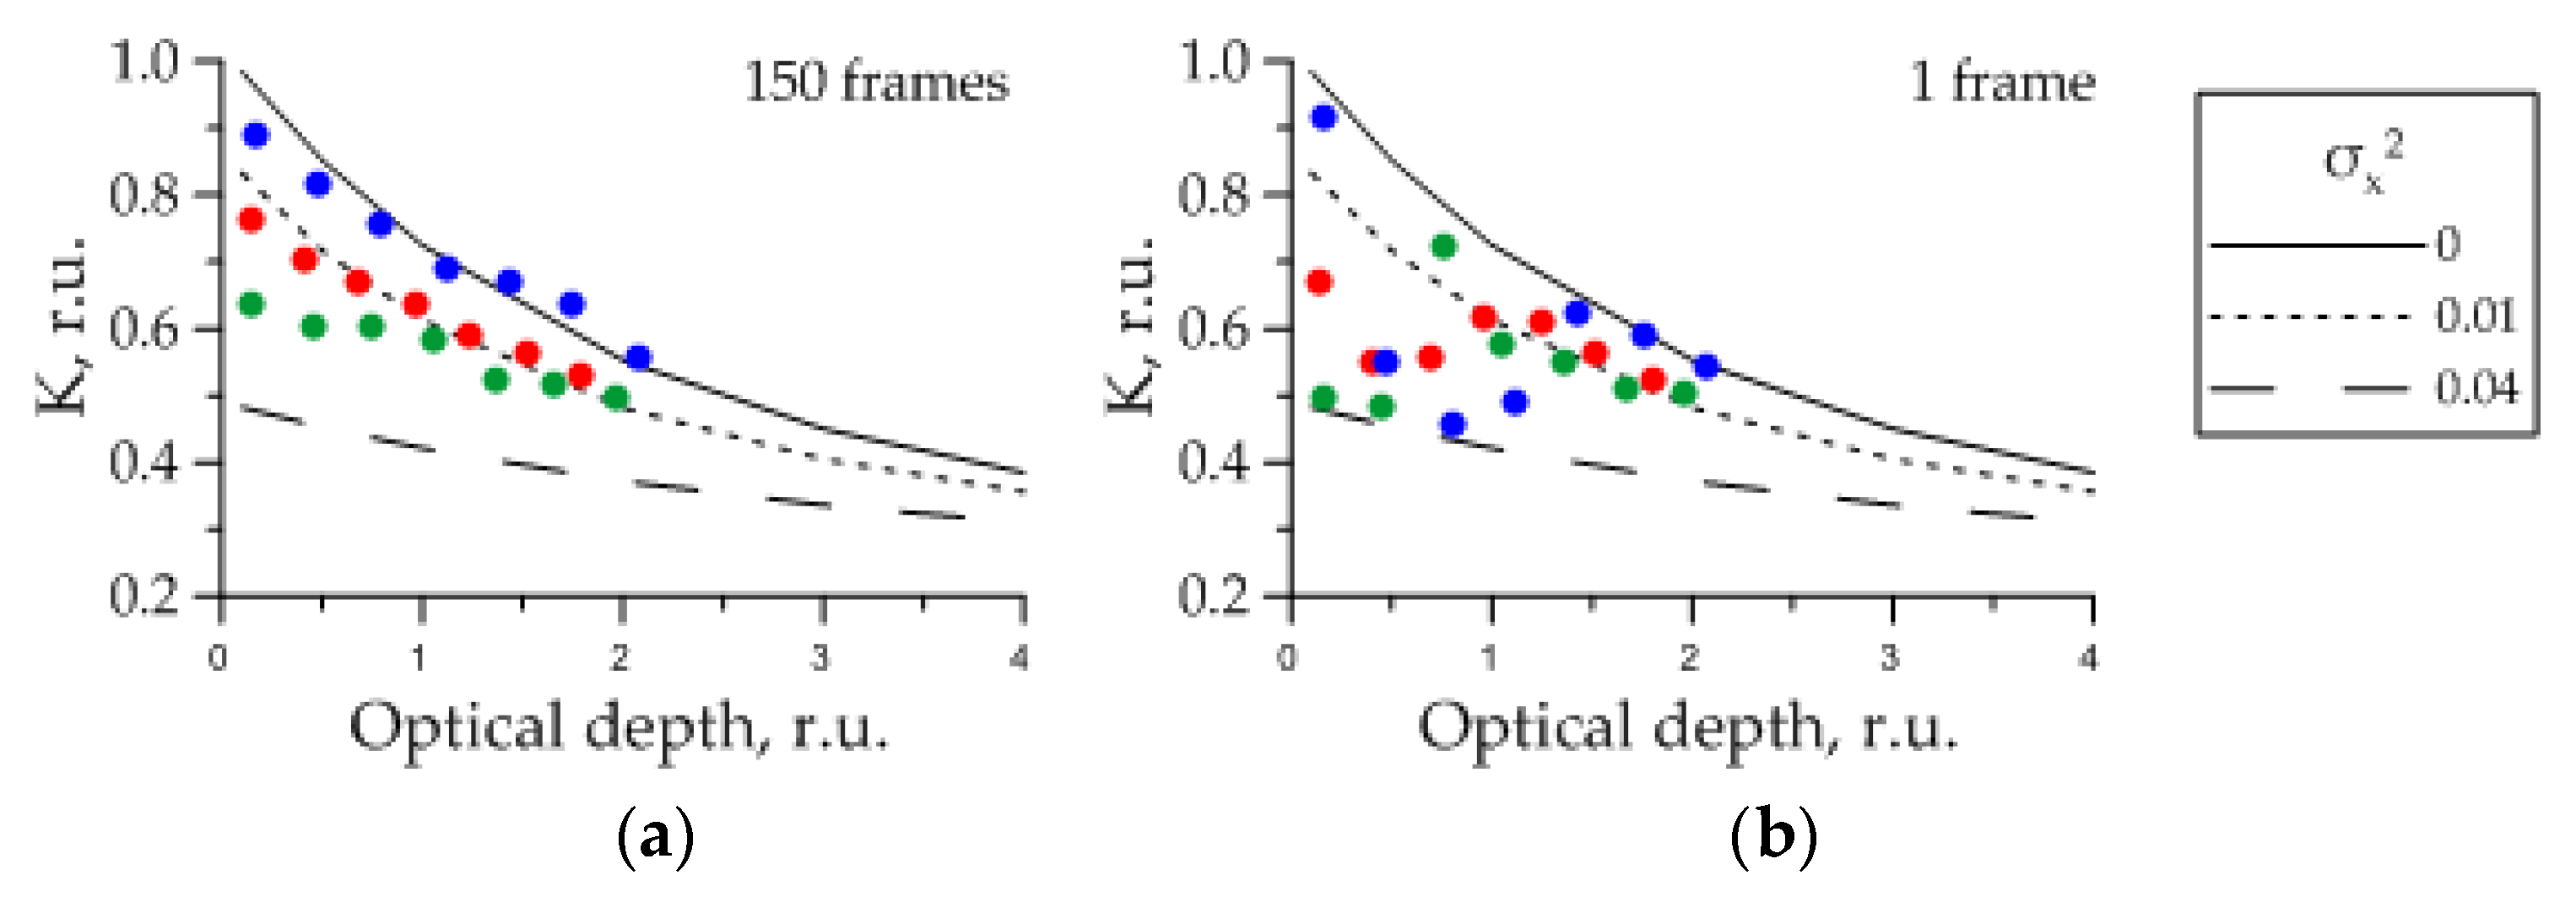
3.4. Determination of the Slope Variance and the Scattering Coefficient
4. Conclusions
Author Contributions
Funding
Acknowledgments
Conflicts of Interest
References
- Molkov, A.A.; Dolin, L.S. Underwater image of the sea surface as a source of wind wave information. IAP RAS Preprint 2010, 807, 26. [Google Scholar]
- Molkov, A.A.; Dolin, L.S. Determination of wind roughness characteristics based on an underwater image of the sea surface. Izv. Atmos. Ocean. Phys. 2012, 48, 552–564. [Google Scholar] [CrossRef]
- Lynch, D.K. Snell’s window in wavy water. Appl. Opt. 2015, 54, B8–B11. [Google Scholar] [CrossRef] [PubMed]
- Weber, V.L. Use of the phenomenon of total internal light reflection for diagnostics of sea wind waves. Radiophys. Quantum Electron. 2017, 60, 475–484. [Google Scholar] [CrossRef]
- Molkov, A.A.; Dolin, L.S.; Kapustin, I.A.; Sergievskaya, I.A.; Shomina, O.V. Underwater sky image as remote sensing instrument of sea roughness parameters and its variability. In Proceedings of the Remote Sensing of the Ocean, Sea Ice, Coastal Waters, and Large Water Regions 2016, Edinburgh International Conference Centre/Edinburgh, Scotland, UK, 26–29 September 2016; SPIE-International Society for Optics and Photonics: Bellingham, WA, USA, 2016; p. 999. [Google Scholar]
- Dolin, L.S. Determination of the optical properties of water from the Snell’s window image. In Proceedings of the XIII All-Russian Conference Applied Technologies of Hydroacoustics and Hydrophysics, Saint-Petersburg, Russia, 2016; P.P. Shirshov Institute of Oceanology of Russian Academy of Sciences: Moscow, Russia, 2016. [Google Scholar]
- Levin, I.M.; Kopelevich, O.V. Correlations between the inherent hydrooptical characteristics in the spectral range close to 550 nm. Oceanology 2007, 47, 344–349. [Google Scholar] [CrossRef]
- Dolin, L.S.; Molkov, A.A. A possibility of determining the optical properties of water from the Snell’s window image. Radiophys. Quantum Electron. 2017, 60, 12–23. [Google Scholar] [CrossRef]
- Molkov, A.A. An experimental study of the water optical properties based on an anomalously weak dependence of apparent radiance of the Snell’s window border on the water turbidity. Radiophys. Quantum Electron. 2018, 61, 12–23. [Google Scholar] [CrossRef]
- Molkov, A.A.; Dolin, L.S.; Leshev, G.V. Underwater sky image as a tool for estimating some inherent optical properties of eutrophic water. In Proceedings of the Remote Sensing of the Ocean, Sea Ice, Coastal Waters, and Large Water Regions 2018, ESTREL Congress Centre, Berlin, Germany, 10–13 September 2018; SPIE-International Society for Optics and Photonics: Bellingham, WA, USA, 2018; p. 10784. [Google Scholar]
- Dolin, L.S.; Levin, I.M. Theory of Underwater Vision; Hydrometeoizdat: Leningrad, Russia, 1991; pp. 17–33. [Google Scholar]
- Dolin, L.S. On the scattering of a light beam in a layer of a turbid medium. Radiophys. Quantum Electron. 1964, 7, 380–382. [Google Scholar]
- Latushkin, A.A. Multichannel Instrument of the Water Attenuation Coefficient for Conducting Oceanographic Sub-Satellite Studies. In Proceedings of the Control and Mechatronic Systems, Sevastopol, Ukraine, 16–19 April 2013; SevNTU: Sevastopol, Ukraine, 2013. [Google Scholar]
- Molkov, A.A.; Kapustin, I.A.; Shchegolkov, Y.B.; Vodeneeva, E.L.; Kalashnikov, I.N. On correlation between inherent optical properties at 650 nm, Secchi depth and blue-green algal abundance for Gorky Reservoir. Fundam. Prikl. Gidrofiz. 2018, 11, 26–33. [Google Scholar]
- Rvachev, V.P.; Sakhnovsky, M.Y. On the theory and application of an integral photometer for the study of objects with arbitrary indicatrices of scattering. Opt. Spectrosc. 1965, 18, 486–494. [Google Scholar]
- Mankovsky, V.I.; Soloviev, M.V.; Mankovskaya, E.V. Hydro-Optical Characteristics of the Black Sea; MHI NAS of Ukraine: Sevastopol, Ukraine, 2009; p. 92. [Google Scholar]
- Cox, C.; Munk, W. Measurements of the roughness of the sea surface from photographs of the sun glitter. J. Opt. Soc. Am. 1954, 44, 838–850. [Google Scholar] [CrossRef]
- Darula, S.; Kittler, R. A catalogue of fifteen sky luminance patterns between the CIE standard skies. In Publications-Commission Internationale de l Eclairage CIE, Proceedings of the 24th of the CIE Session, Warsaw, Poland, 24–30 June 1999; CIE: Vienna, Austria, 1999; p. 133. [Google Scholar]


| Symbols | Meaning |
|---|---|
| Angle of incident light | |
| Angle of refracted light | |
| Angle of observation of the Snell’s window border for a flat sea surface (angle of total internal reflection) | |
| Random angle less than | |
| Random angle more than | |
| Mean angle of distortion of the Snell’s window border | |
| Depth | |
| Thickness of the water layer | |
| Secchi depth | |
| Spatial coordinate of the water surface element | |
| Time | |
| Surface elevation | |
| Surface slope | |
| Slope variance | |
| Surface slope distribution function | |
| Refractive index of water | |
| Absorption coefficient of water | |
| Scattering coefficient of water | |
| Attenuation coefficient of water | |
| Attenuation coefficient of water at wavelength | |
| Wavelength | |
| Optical depth by scattering coefficient | |
| Angle of light scattering | |
| Phase function | |
| Variance of a single scattering angle | |
| Spectrum of the phase function | |
| Sinus of a local incident angle | |
| Fresnel reflection coefficient for non-polarized light | |
| Transmission coefficient | |
| Sky luminance distribution | |
| Radiance of instantaneous Snell’s window image formed by nonscattered light | |
| Radiance of accumulated Snell’s window image formed by nonscattered light | |
| Radiance of accumulated Snell’s window image obtained with taking into account multiple scattering and absorption in water | |
| Function describing influence of absorption on the Snell’s window image | |
| Radiance of accumulated Snell’s window image in hypothetical water medium without absorption | |
| Parameter of Snell’s window image describing distortion of its border | |
| Contrast of the Snell’s window image | |
| IOP | Inherent Optical Properties |
| Basin | Wind, m/s | Clouds, % | |||||
|---|---|---|---|---|---|---|---|
| The Black Sea | 0.372 ± 0.01 | 0.361 ± 0.008 | 0.567 ± 0.007 | 12 ± 0.5 | 0–6 ± 0.06 | ~0.01 | 10% |
| The Gorky Reservoir | - | 1.8 ± 0.02 | - | 2.5 ± 0.2 | 0–2 ± 0.02 | 0 | 100% |
| Sonde Data and Atlas Data | The Snell’s Window Image (1 Frame) | The Snell’s Window Image (150 Frames) | ||||||
|---|---|---|---|---|---|---|---|---|
| , m−1 | , m−1 | , m−1 | , m−1 | , m−1 | , m−1 | , m−1 | , m−1 | , m−1 |
| 0.12 ± 0.01 | 0.082 ± 0.01 | 0.2 ± 0.02 | 0.132 ± 0.045 | 0.071 ± 0.031 | 0.285 ± 0.047 | 0.099 ± 0.0091 | 0.075 ± 0.0089 | 0.31 ± 0.0341 |
| Laboratory Results | The Snell’s Window Image (1 Frame) | The Snell’s Window Image (150 Frames) | ||||||
|---|---|---|---|---|---|---|---|---|
| , m−1 | , m−1 | , m−1 | , m−1 | , m−1 | , m−1 | , m−1 | , m−1 | , m−1 |
| 3.610 ± 0.07 | 0.619 ± 0.012 | 0.357 ± 0.007 | 3.987 ± 1.19 | 0.763 ± 0.36 | 0.425 ± 0.19 | 3.626 ± 0.43 | 0.585 ± 0.047 | 0.390 ± 0.06 |
| Sonde Data and Atlas Data | The Snell’s Window Image (1 Frame) | The Snell’s Window Image (150 Frames) | ||||||
|---|---|---|---|---|---|---|---|---|
| , m−1 | , m−1 | , m−1 | , m−1 | , m−1 | , m−1 | , m−1 | , m−1 | , m−1 |
| 0.23 ± 0.11 | 0.288 ± 0.006 | 0.37 ± 0.12 | 0.297 ± 0.12 | 0.256 ± 0.081 | 0.192 ± 0.088 | 0.319 ± 0.042 | 0.302 ± 0.029 | 0.276 ± 0.025 |
| Turbidity Meter | The Snell’s Window Image (1 Frame) | The Snell’s Window Image (150 Frames) | ||||||
|---|---|---|---|---|---|---|---|---|
| , m−1 | , m−1 | , m−1 | , m−1 | , m−1 | , m−1 | , m−1 | , m−1 | , m−1 |
| - | 1.17 ± 0.03 | - | 2.28 ± 0.93 | 1.47 ± 0.47 | 1.69 ± 0.77 | 2.36 ± 0.17 | 1.03 ± 0.16 | 1.31 ± 0.17 |
© 2019 by the authors. Licensee MDPI, Basel, Switzerland. This article is an open access article distributed under the terms and conditions of the Creative Commons Attribution (CC BY) license (http://creativecommons.org/licenses/by/4.0/).
Share and Cite
Molkov, A.A.; Dolin, L.S. The Snell’s Window Image for Remote Sensing of the Upper Sea Layer: Results of Practical Application. J. Mar. Sci. Eng. 2019, 7, 70. https://doi.org/10.3390/jmse7030070
Molkov AA, Dolin LS. The Snell’s Window Image for Remote Sensing of the Upper Sea Layer: Results of Practical Application. Journal of Marine Science and Engineering. 2019; 7(3):70. https://doi.org/10.3390/jmse7030070
Chicago/Turabian StyleMolkov, Alexander A., and Lev S. Dolin. 2019. "The Snell’s Window Image for Remote Sensing of the Upper Sea Layer: Results of Practical Application" Journal of Marine Science and Engineering 7, no. 3: 70. https://doi.org/10.3390/jmse7030070
APA StyleMolkov, A. A., & Dolin, L. S. (2019). The Snell’s Window Image for Remote Sensing of the Upper Sea Layer: Results of Practical Application. Journal of Marine Science and Engineering, 7(3), 70. https://doi.org/10.3390/jmse7030070