Article

Study on Propulsion Performance by Varying Rake Distribution at the Propeller Tip

Department of Naval Architecture & Ocean Engineering, Pusan National University, Busan 46287, Korea
*
Author to whom correspondence should be addressed.
J. Mar. Sci. Eng. 2019, 7(11), 386; https://doi.org/10.3390/jmse7110386
Submission received: 26 September 2019 / Revised: 23 October 2019 / Accepted: 29 October 2019 / Published: 30 October 2019

Abstract

:
This study provides a comparison of propulsion performance, with a particular focus on efficiency, by varying rake distribution at the tips of propellers. Owing to increased attention to environmental pollution, there is a significant interest in reducing the energy efficiency design index (EEDI) and SOx emissions by improving the performance in the field of shipbuilding. The forward (Kappel) and backward tip rake propellers have been widely used to improve efficiency, as well as to reduce fluctuating pressure from the tip vortex cavitation. As there is almost no parametric and design research on tip rake propellers, this systematic parametric study was conducted to identify the optimal configuration by the potential code. For this performance comparison the KP505 (KCS propeller) was chosen as the reference propeller as the tips of that propeller have no rake. The model test and computational fluid dynamics (CFD) calculation confirmed the result by comparing the open water performances for the three optimally selected propellers (forward, backward, KP505). The differences of efficiency obtained from the potential analysis and the model test exhibit similar tendencies, but the result for the CFD is different. The difference would be investigated by changing the grid system around the tip as well as the turbulence model in the CFD analysis. An analysis of self-propulsion and pressure fluctuation is also expected to be conducted in the near future.

1. Introduction

Interest in fossil energy depletion and global warming has increased in recent years. The International Maritime Organization (IMO) has been applying indicators for energy efficiency to ships constructed after 2013. In particular, the energy efficiency design index (EEDI) represents the amount of carbon dioxide emitted during the transportation of 1ton of cargo per mile. Emissions will need to be reduced 30% by 2025, beginning with a 10% reduction in January 2013. As a result, research is continuing to improve hull form and propulsion systems to reduce EEDI worldwide. Propulsion system performance has been greatly improved by developing a compound propulsion system. The Compound propulsion system can be classified as pre device, main device, and post device. The pre-swirl stator and Mewis ducts are known to be more effective in pre device, and high performance special propellers, contra rotating propellers, and duct propellers are known to be effective as main devices. Although the performance varies depending on the ship types, the approximate energy reduction effect is about 3%–4%. In addition, twisted rudders, rudder bulbs, and fins are effective post devices. The performance of the rudder has been improved by modifying the shape of the rudder or by installing an additive such as a fin or bulb.
This study addresses the Kappel [1] propeller (forward type) and backward tip rake propeller, which are recently developed propeller concepts. Figure 1 shows the shape of Kappel and CLT propeller. The backward tip rake propeller is popularly being used with Korean ship companies. (Lee, et al., 2017) [2]. The present design concept of both forward and backward tip rake propellers came from the contracted loaded tip (CLT) propeller. The CLT idea originally came from winglets, which are widely used in aircraft. Winglets reduce the induced drag by weakening the vortex at the wing, leading to greater efficiency (Ha, et al., 2014) [3]. In other words, both propellers prevent the three-dimensional vortex effect by reducing fluctuating pressure changes at the wing tips. It should be noted that in the CLT propeller, contrary to the tip rake propeller, the end plates are unloaded and operate as barriers, preventing the cross flow of the pressure and suction side of the blades, with the finite load at the tip of the blade (G. Gennaro, et al., 2012) [4]. Although the CLT’s effect of weakening the tip vortex is probably better than that of the tip rake propeller, the Kappel and tip rake propellers have been more widely used than the CLTs due to the risk of cavitation in the corners and also loss with the end plate drag at high speeds.
While the Kappel and tip rake propellers have been widely used for more than 15 years, their performance and design is not well understood (Yamasaki, et al., 2013) [5]. A parametric study for optimal rake shape has been conducted here. The performance of the optimized propellers was verified by computational fluid dynamics (CFD) and model tests.
Pressure fluctuation issues from the propeller should also be investigated and compared to verify the performance of the tip rake propeller because it is more effectively used to reduce the aft hull surface pressure fluctuation induced by propellers. These studies are expected to be conducted in the near future.

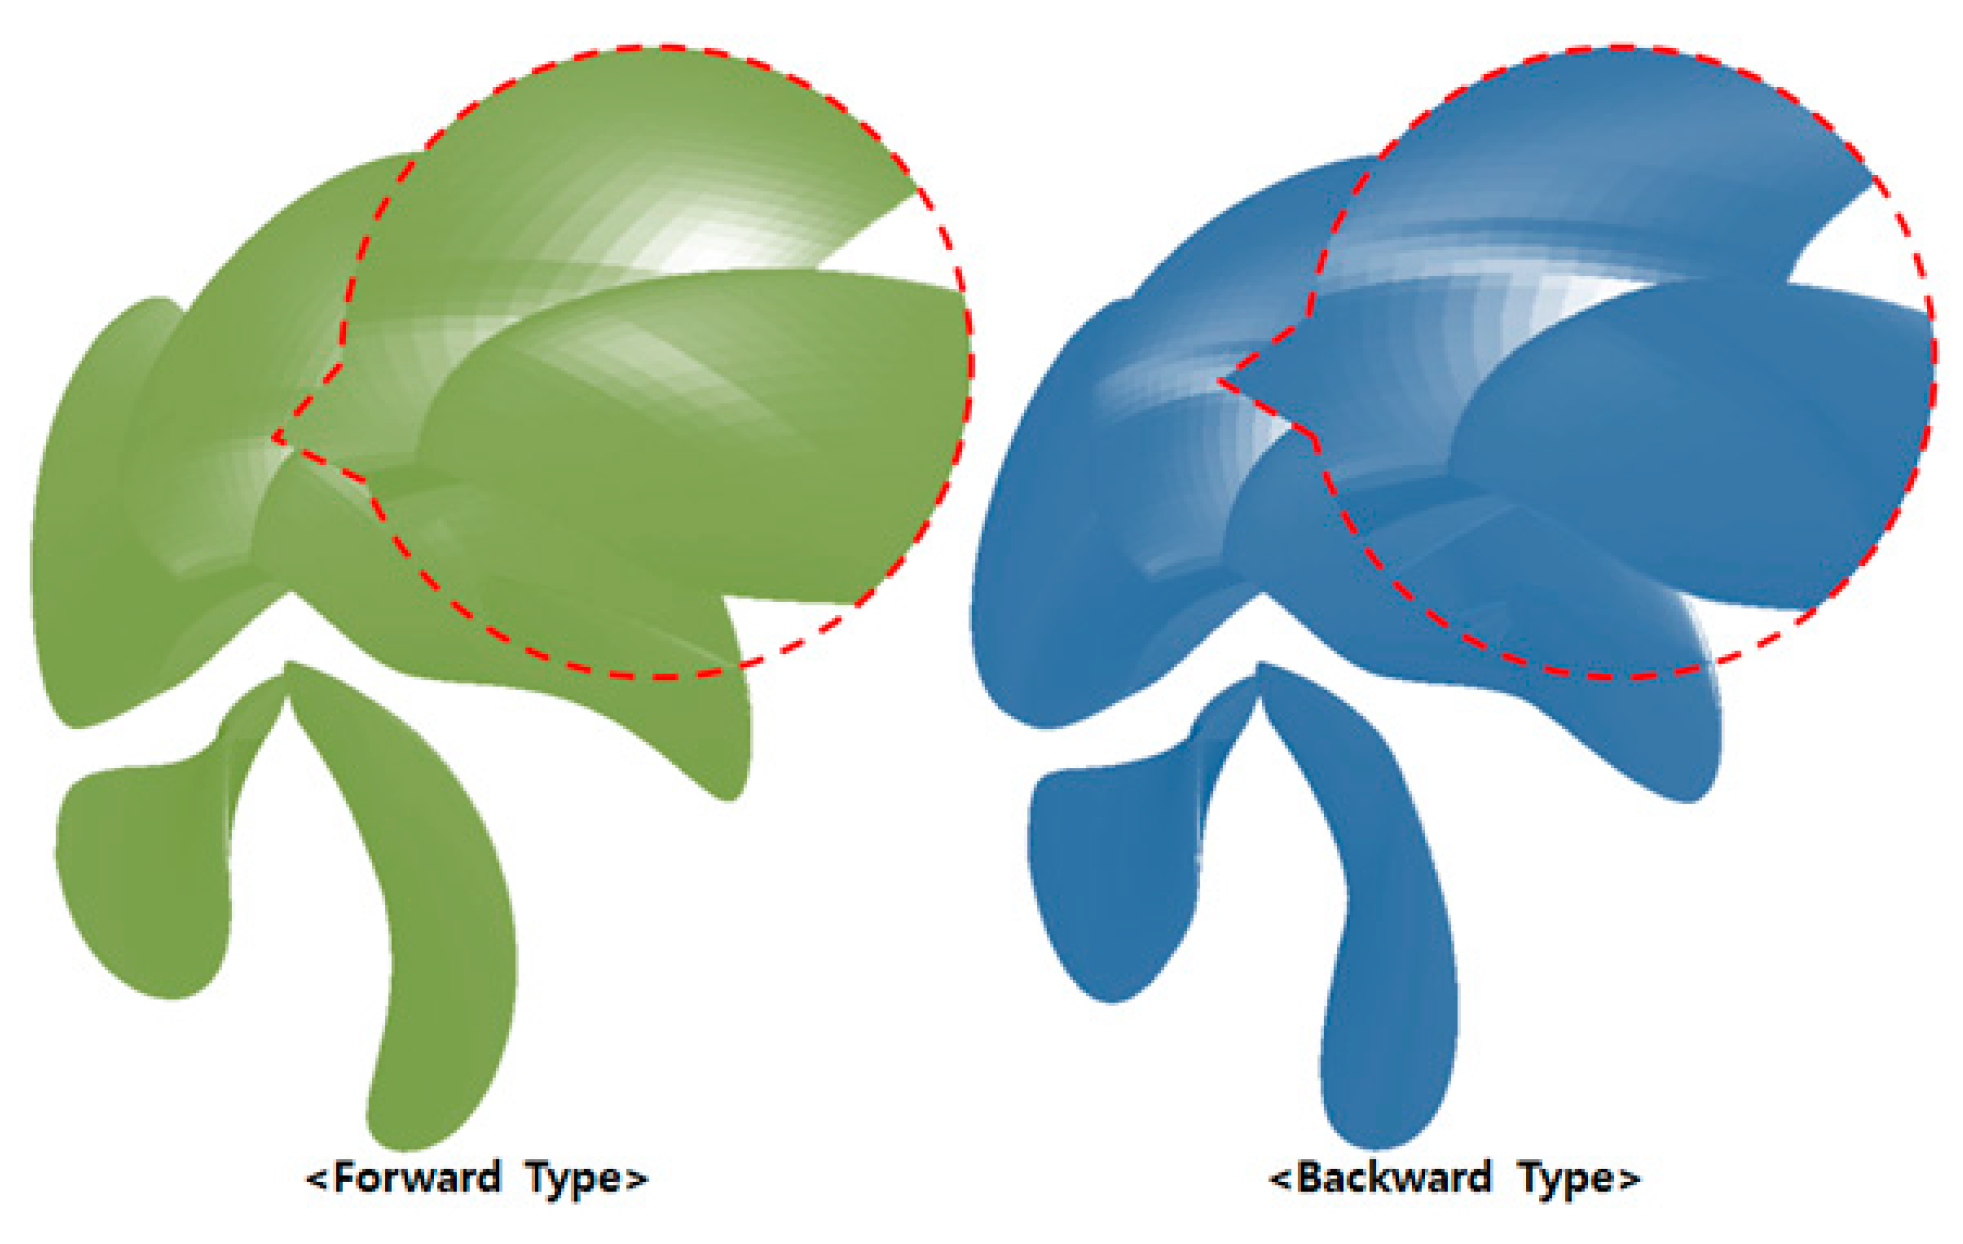
2. Study Methods of Tip Rake Propellers

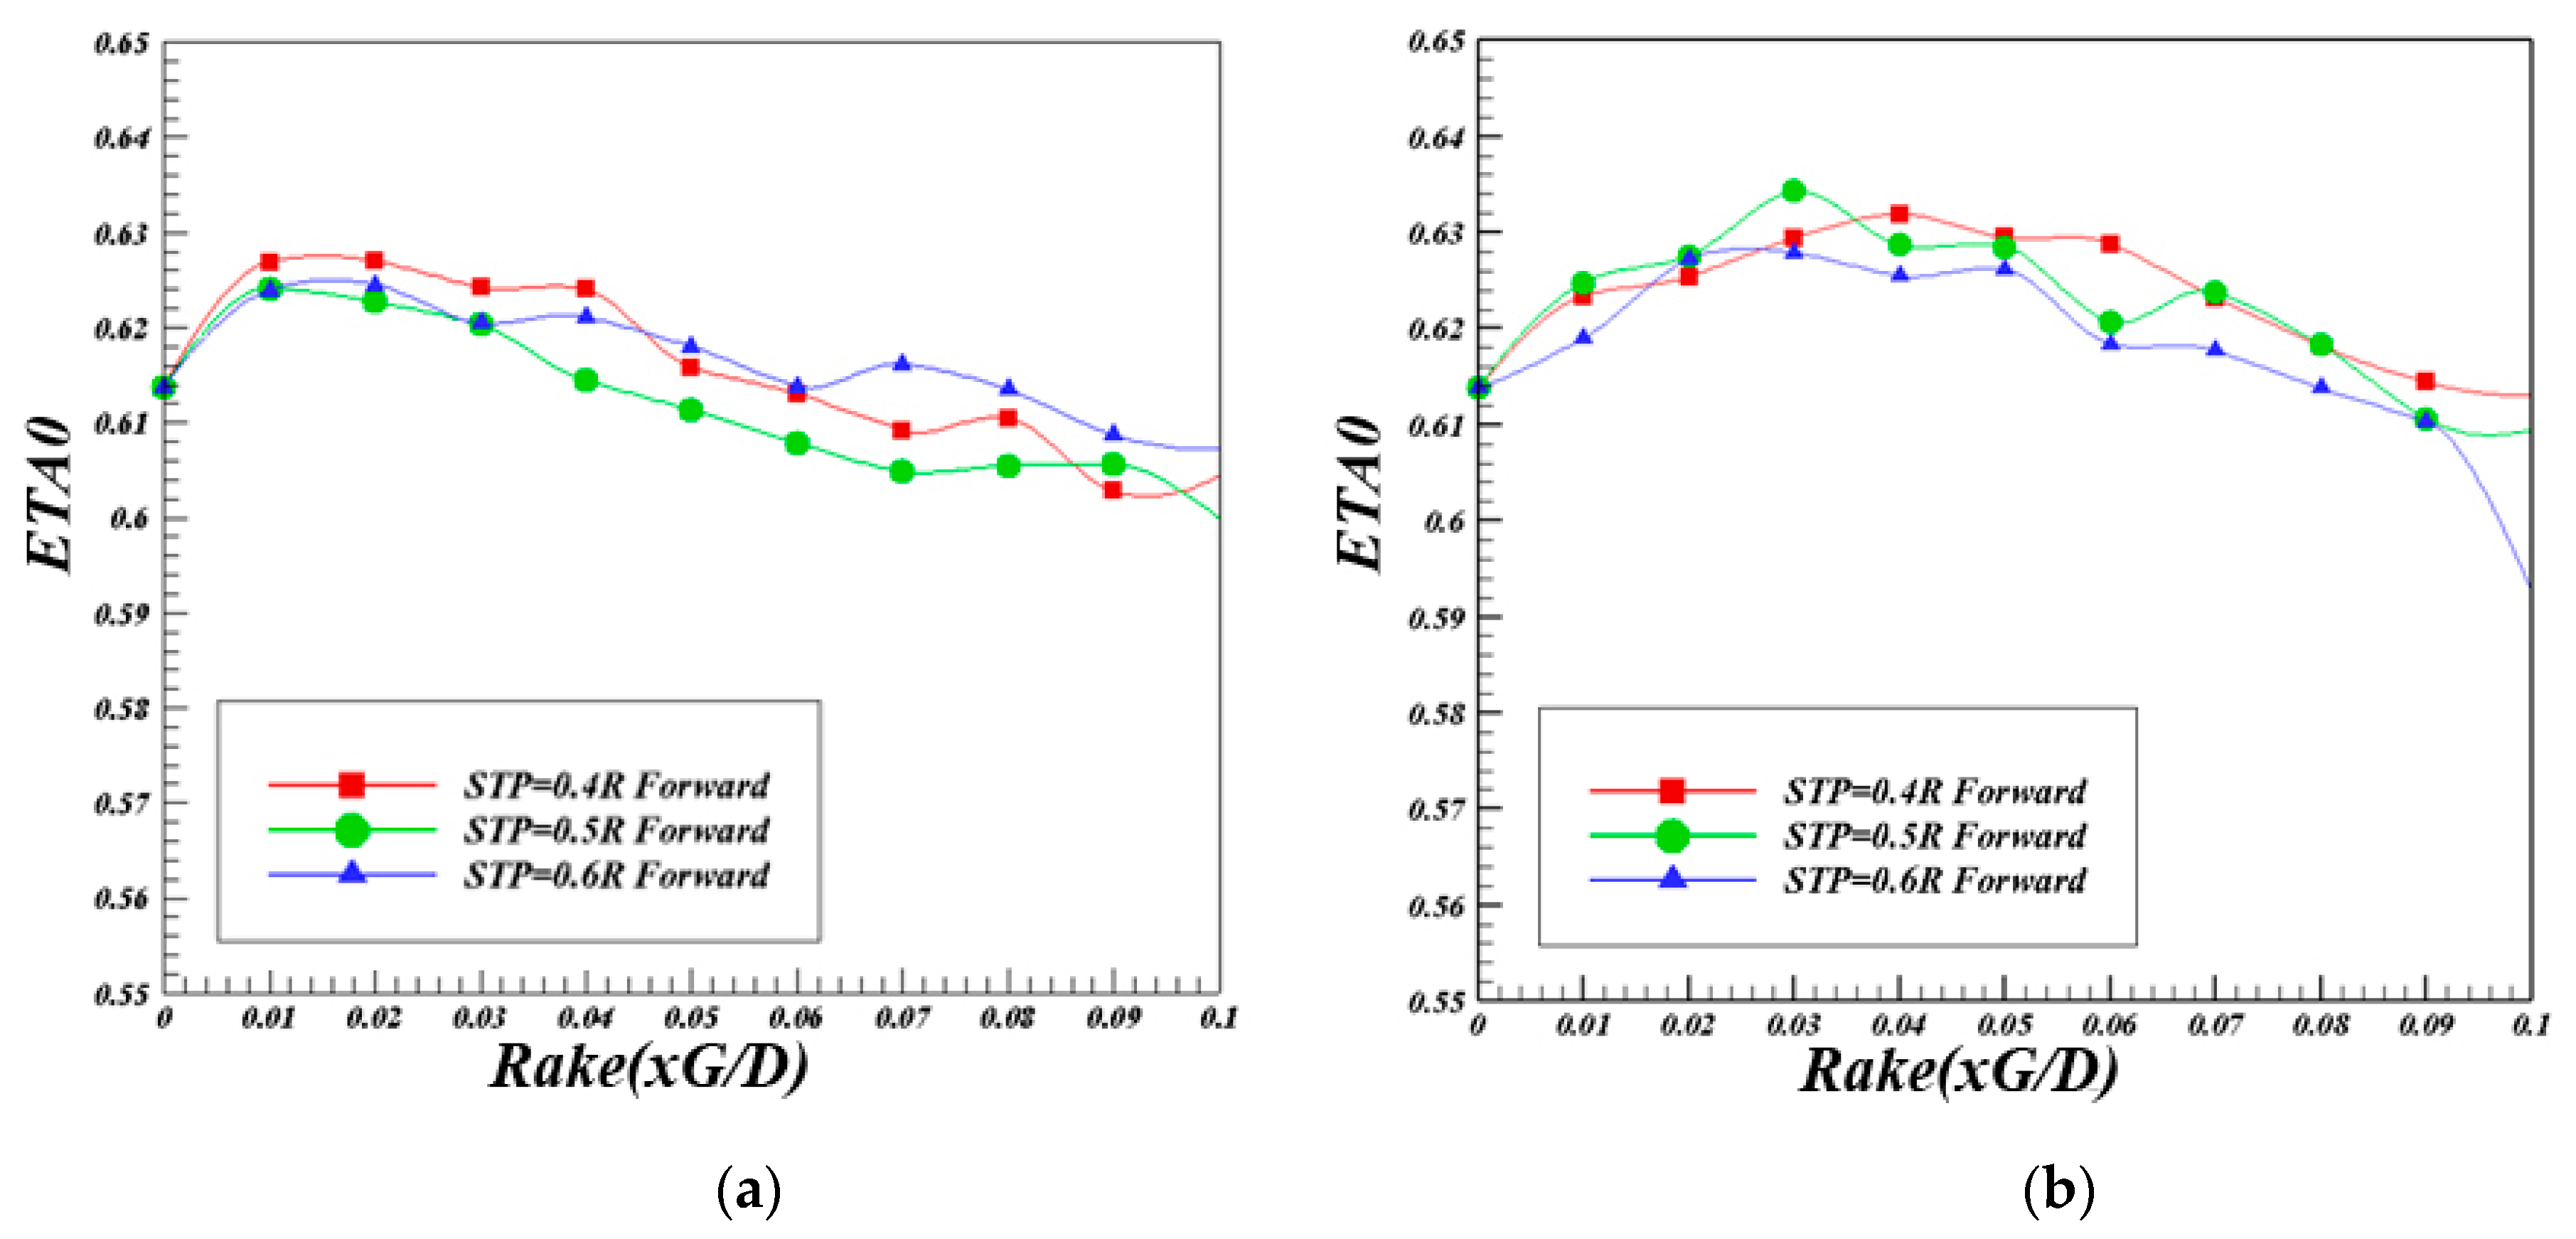
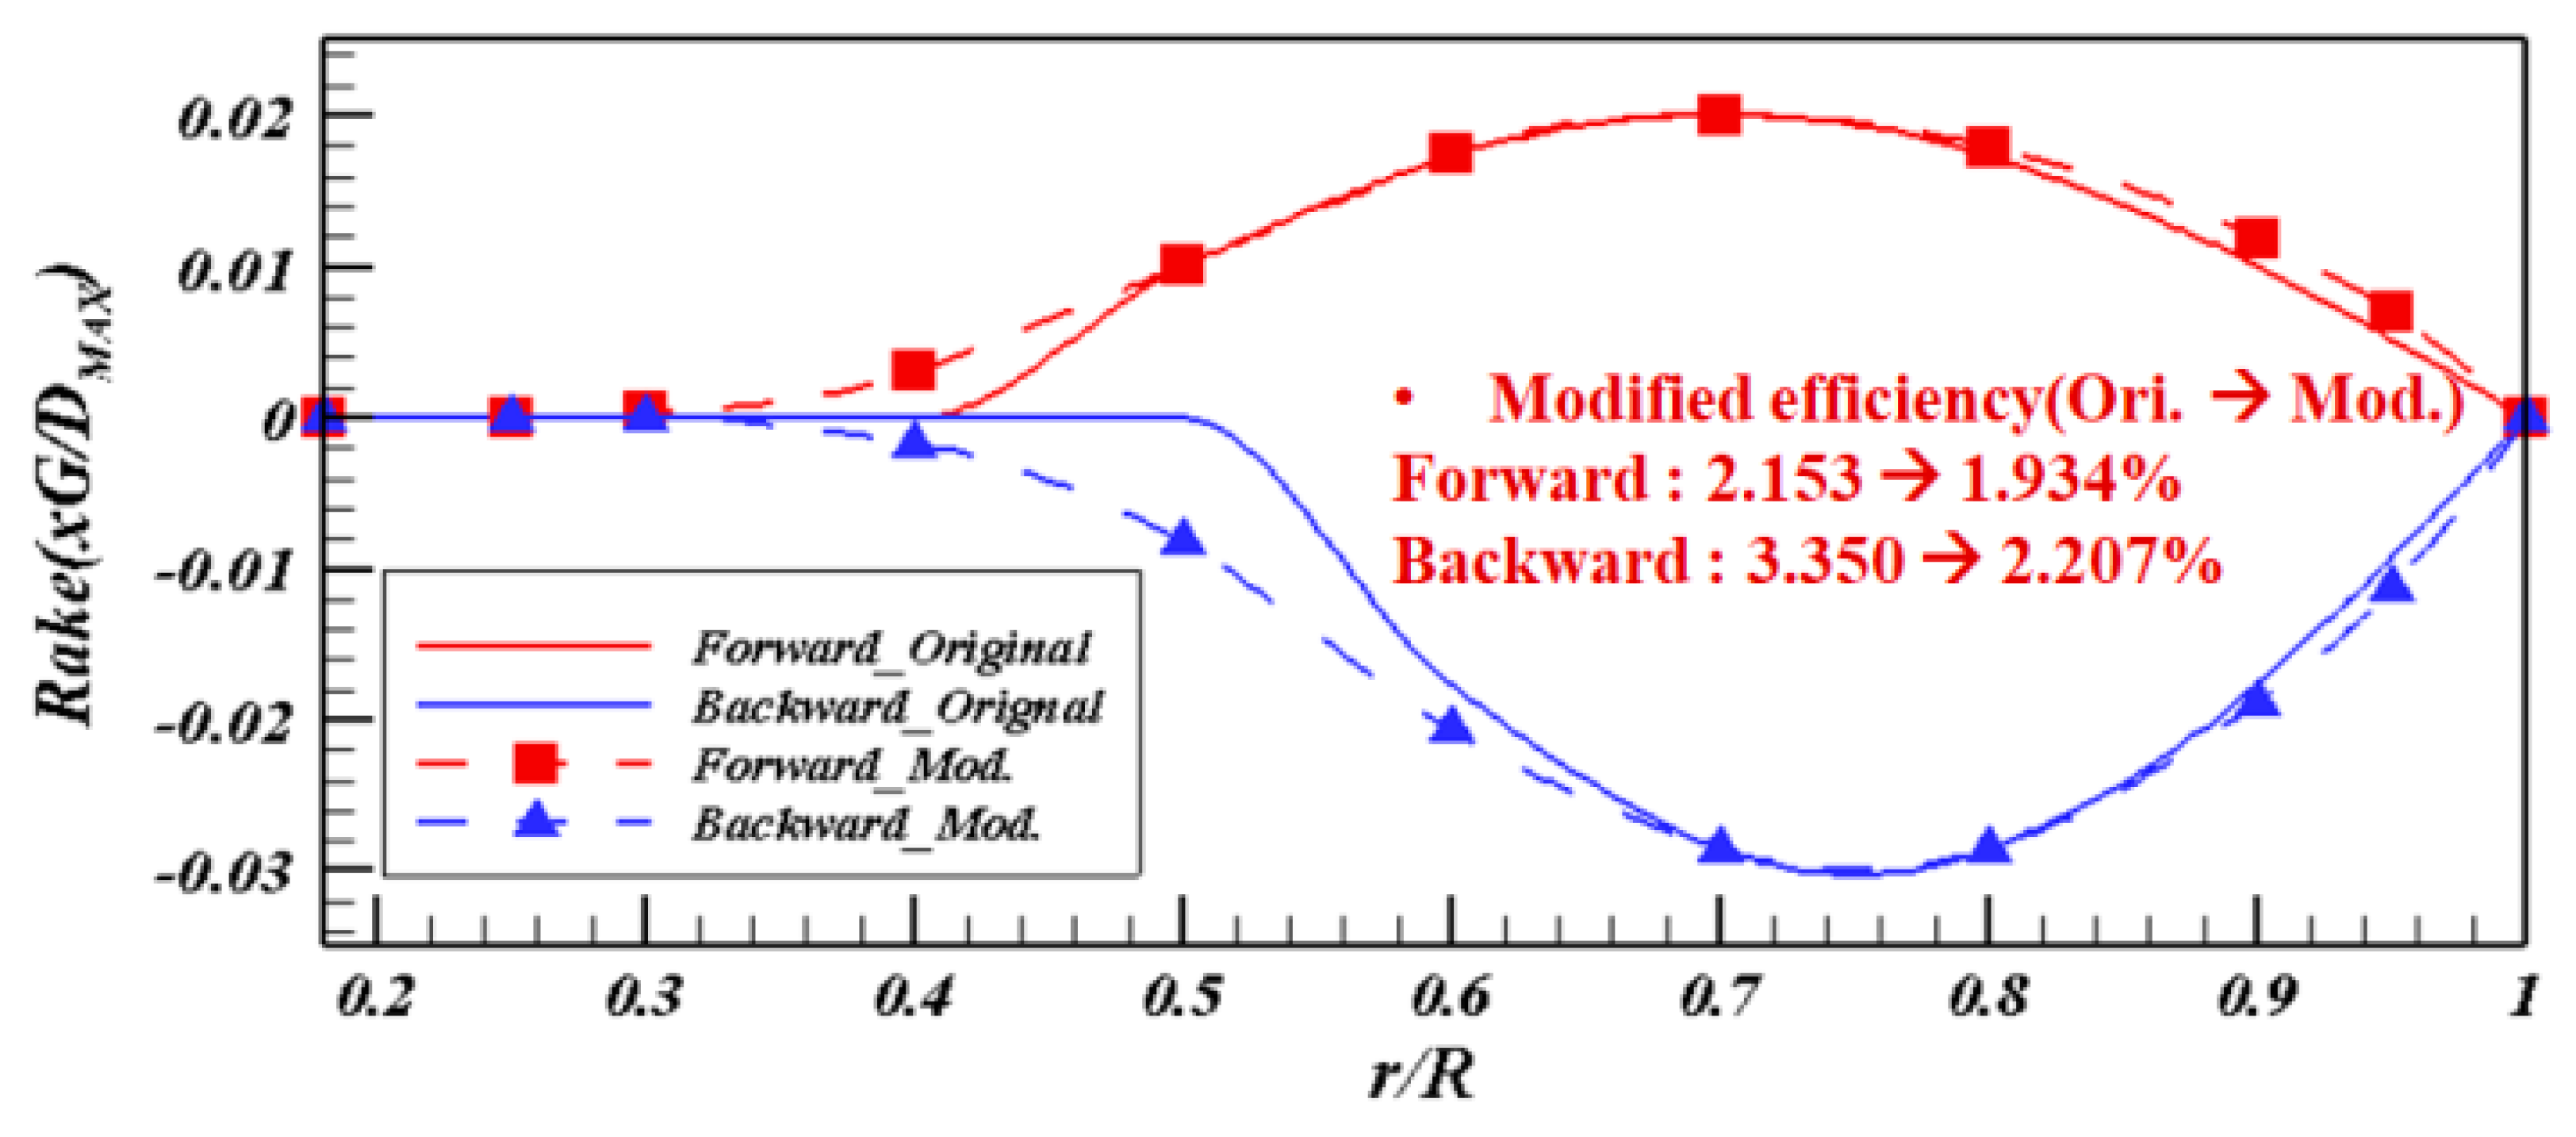
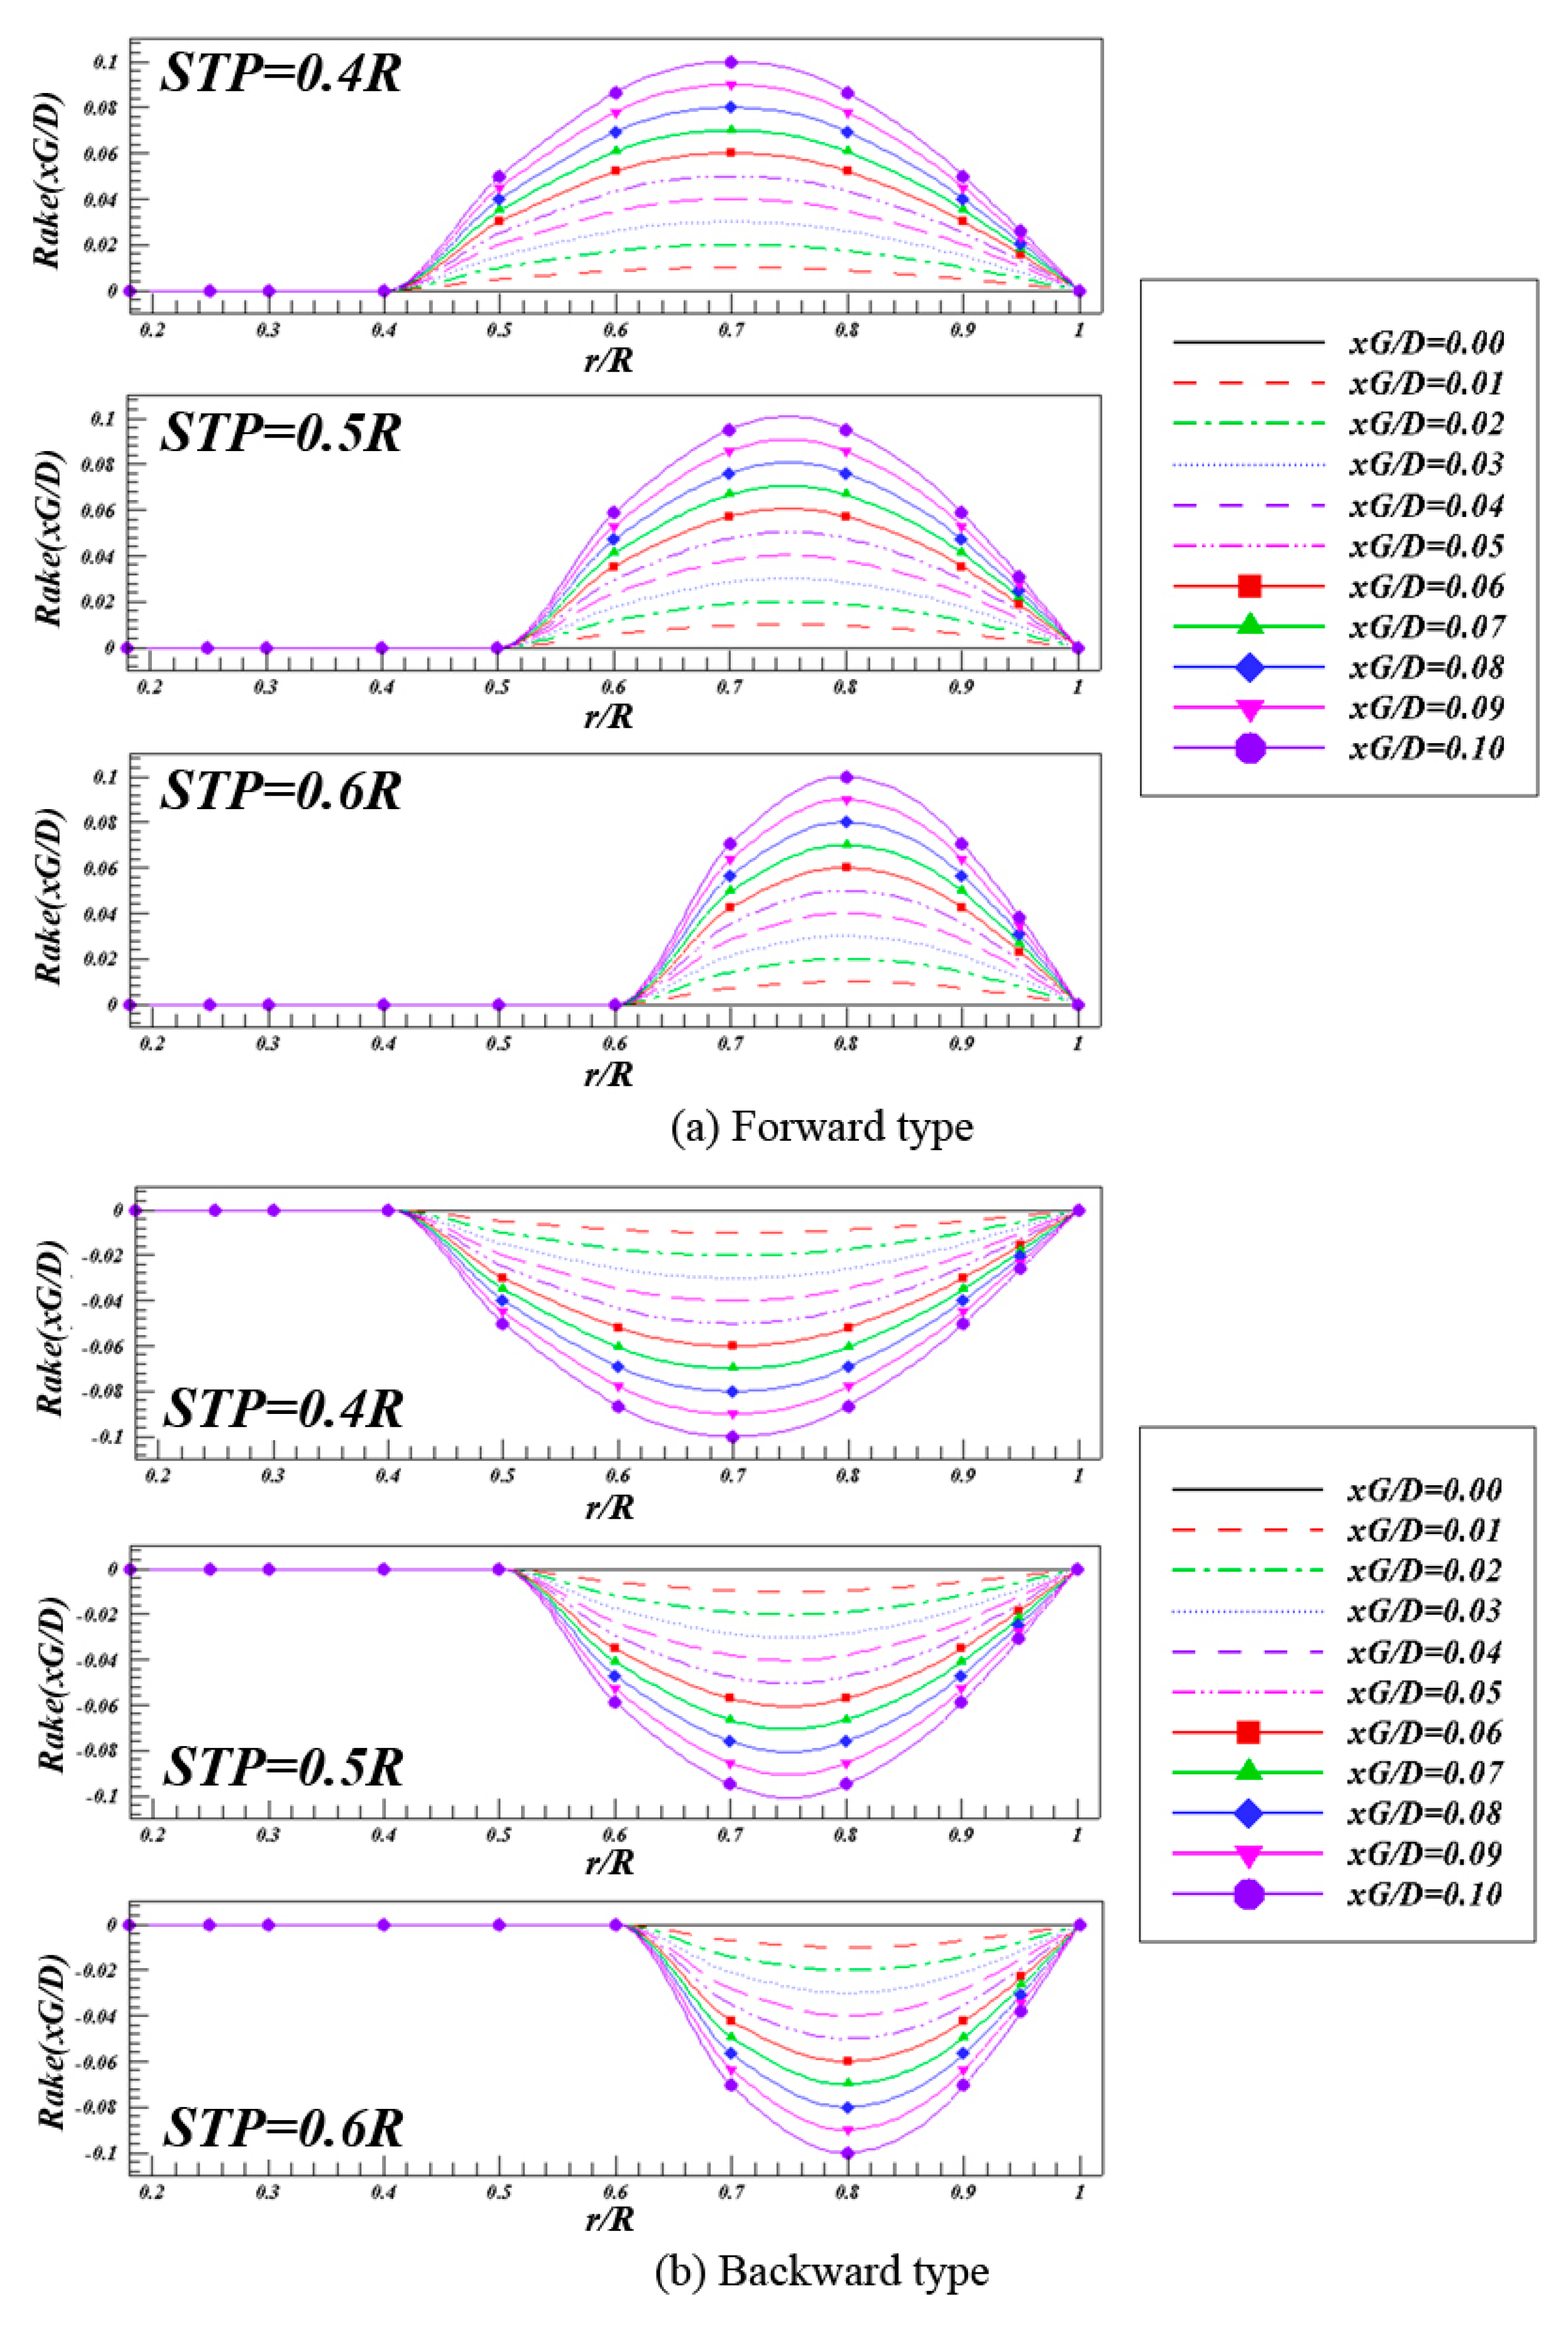
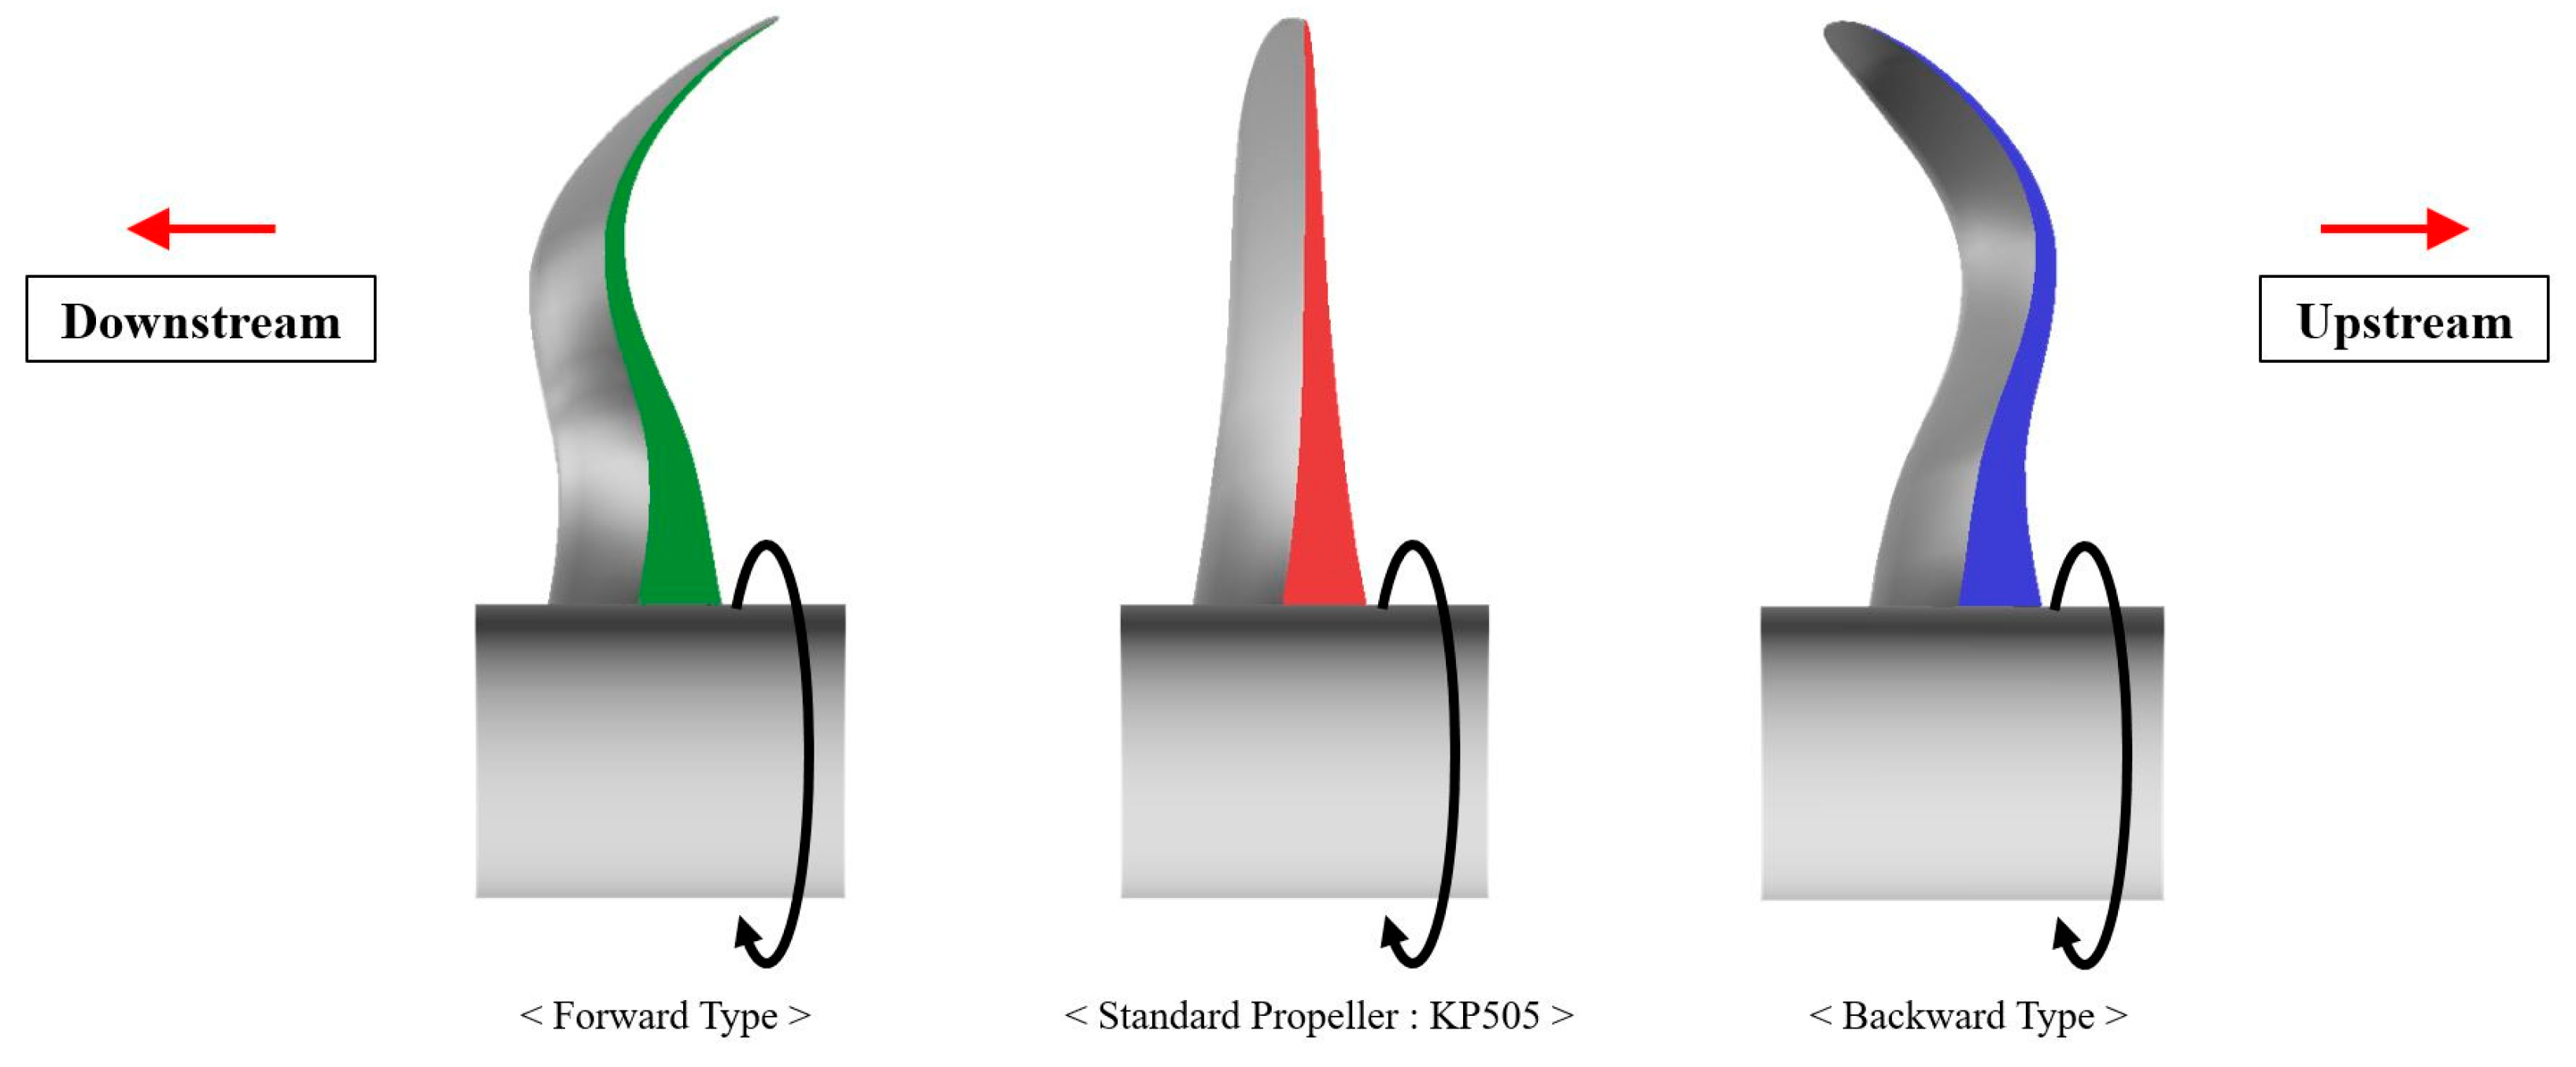
2.1. Design Based on Potential Analysis

The KP505 propeller, which was designed for the Korea Research Institute of Ships & Ocean engineering (KRISO) Container ship (KCS), was selected as the reference propeller. This propeller is widely used for academic and comparative purposes as its performance and geometry are readily available. The KP505 is appropriate for this comparative study because no radial rake was applied. Rake was applied to the reference propeller by altering the starting radii, the maximum rake size, and the rake application (backward and forward).
The starting points of the rake distribution were set as 0.4 R, 0.5 R, 0.6 R, and continuously increased by 0.1 R to the blade tip. If the starting point is less than 0.4 R or greater than 0.7 R, it is difficult to introduce the rake effect. The maximum rake variation was 1%–10% of the propeller diameter. If the rake variation is greater than 10%, the propeller acquires excessive curvature and very difficult to be smooth along radii. Figure 2 represents the radial distribution of the rake applied to a forward and backward propeller, respectively. The rake shape along the radius was designed as a sine curve. The side view of tip rake propellers is shown in Figure 3.
Numerical analysis of the propeller’s open water performance was performed using KPA4, a potential-based numerical analysis is commonly used in the study of open water propeller performance (Kim, et al., 1993; Kim and Lee, 2005) [6,7]. The KPA4 package was developed based on the vortex lattice method (VLM). The diameter of the model propeller for the propeller open water (POW) analysis was 250 mm and the propeller rotation speed was 16rps. The analysis was performed with J = 0.05 to J = 1.00 at an interval of 0.05. Finally, the geometry of the propellers is as shown in Table 1.
The computed POW efficiency was compared at KT/J2 = 0.4725 as shown in Figure 4. Based on these results, an optimal shape was selected for forward and backward propellers. The optimal rake for the backward propeller was STP = 0.4R and xG/D = 0.02 and was 2.15% greater than the reference propeller. The optimal rake for the forward propeller was STP = 0.5 R and xG/D = 0.03, and it was 3.35% greater than the reference propeller. After the optimal rake had been applied to the propeller, there were non-smooth surfaces during 3-D modeling. The observed discontinuity is shown in Figure 5. Therefore, the rake distribution was smoothed as shown in Figure 6. After the final modifications to the rake were applied, improvements of 1.9% and 2.2% by the forward and backward propellers, respectively, were obtained compared to the reference propeller, which is shown in Table 2.

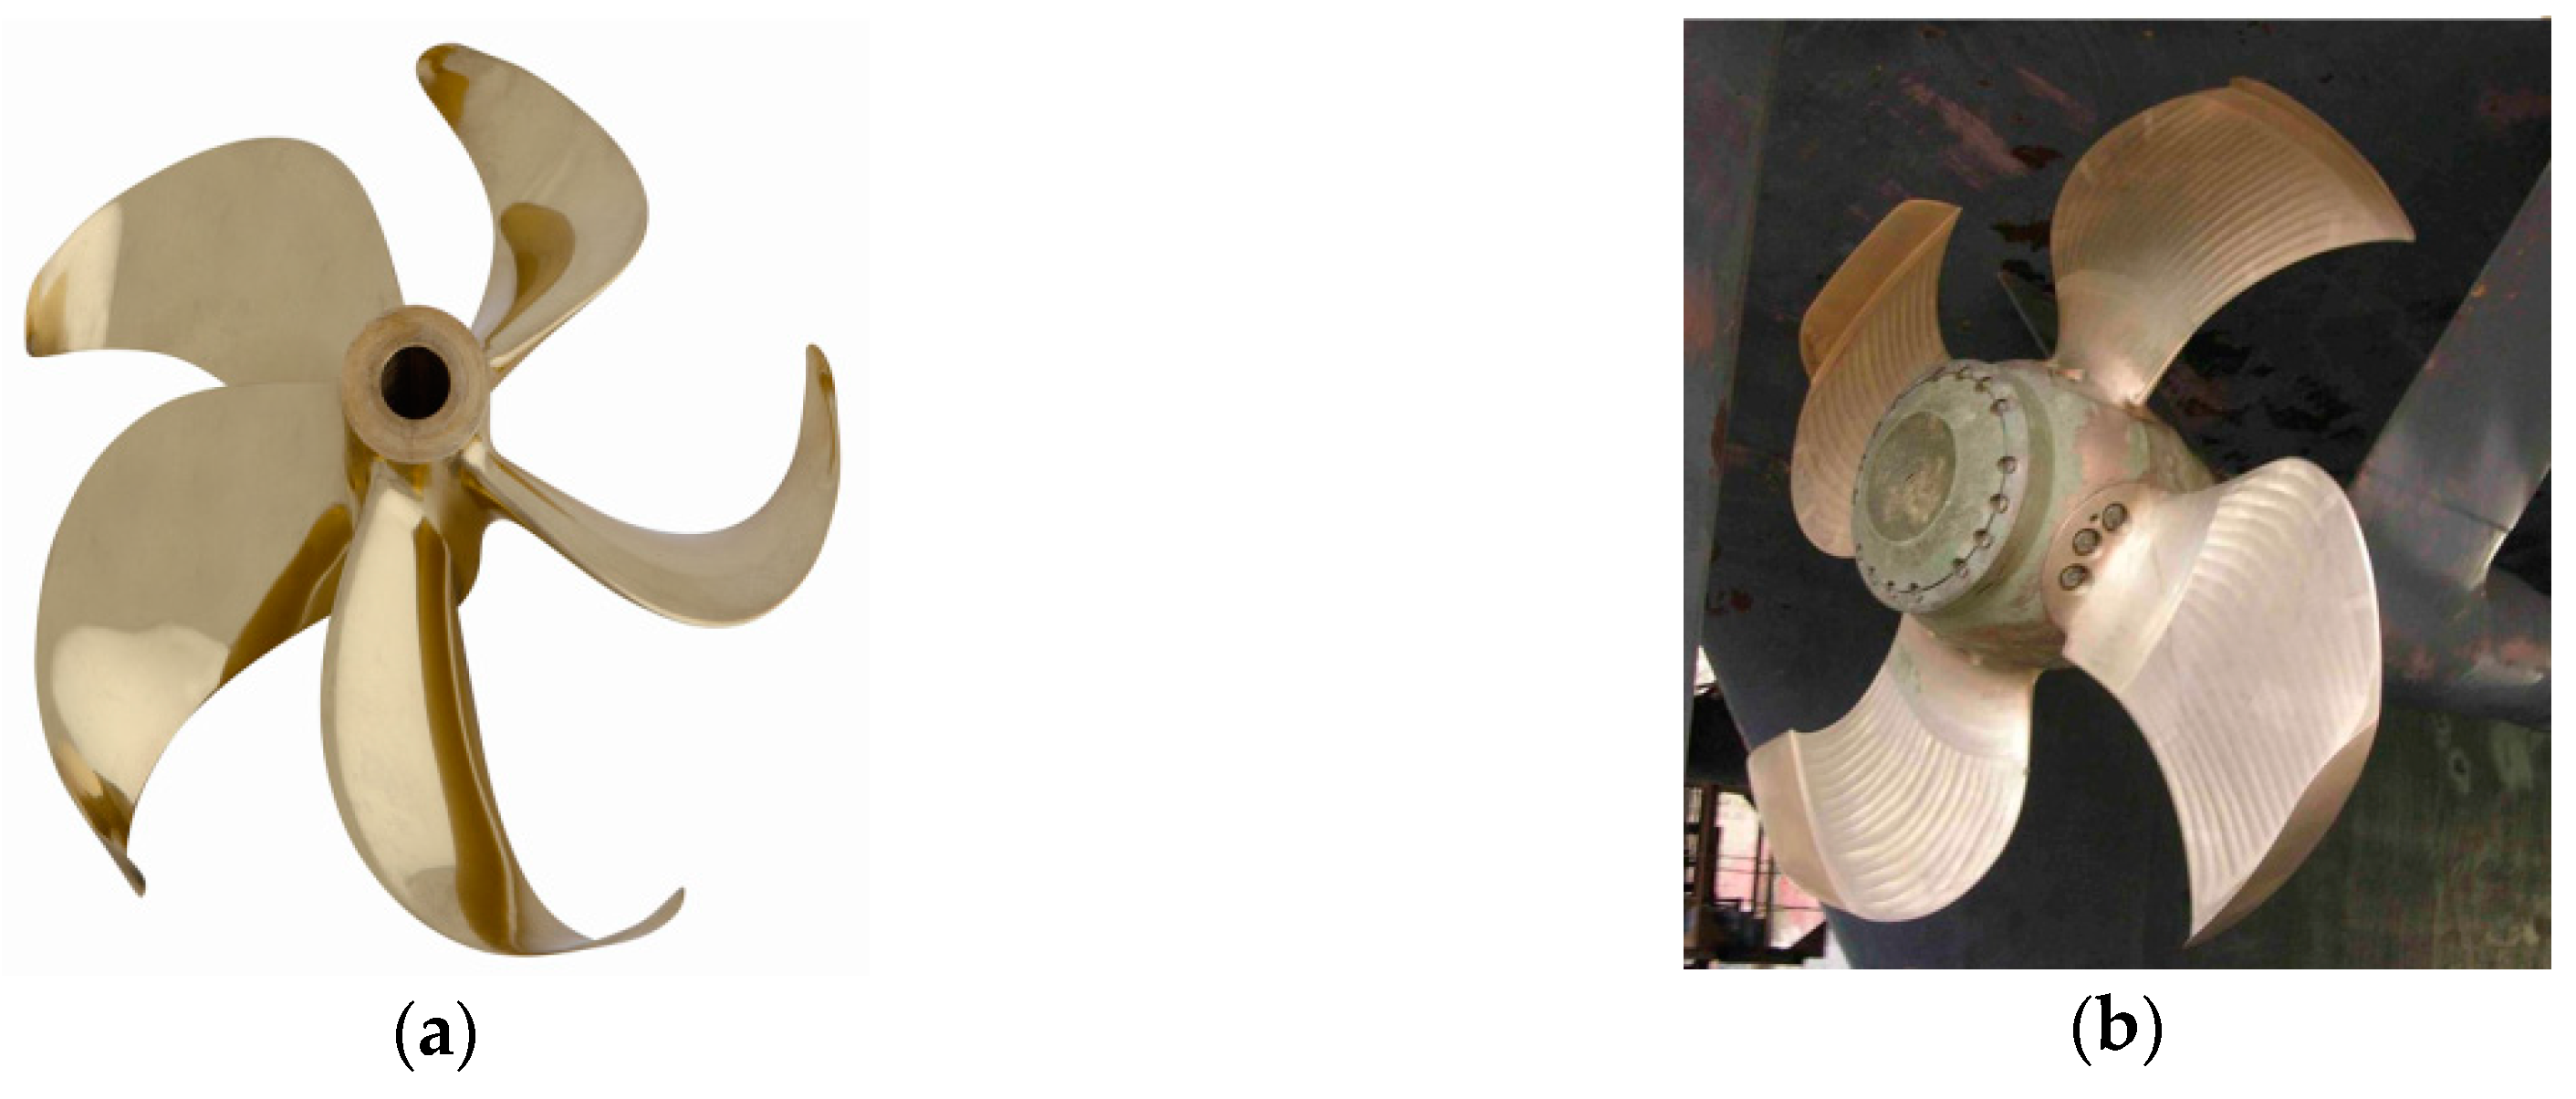
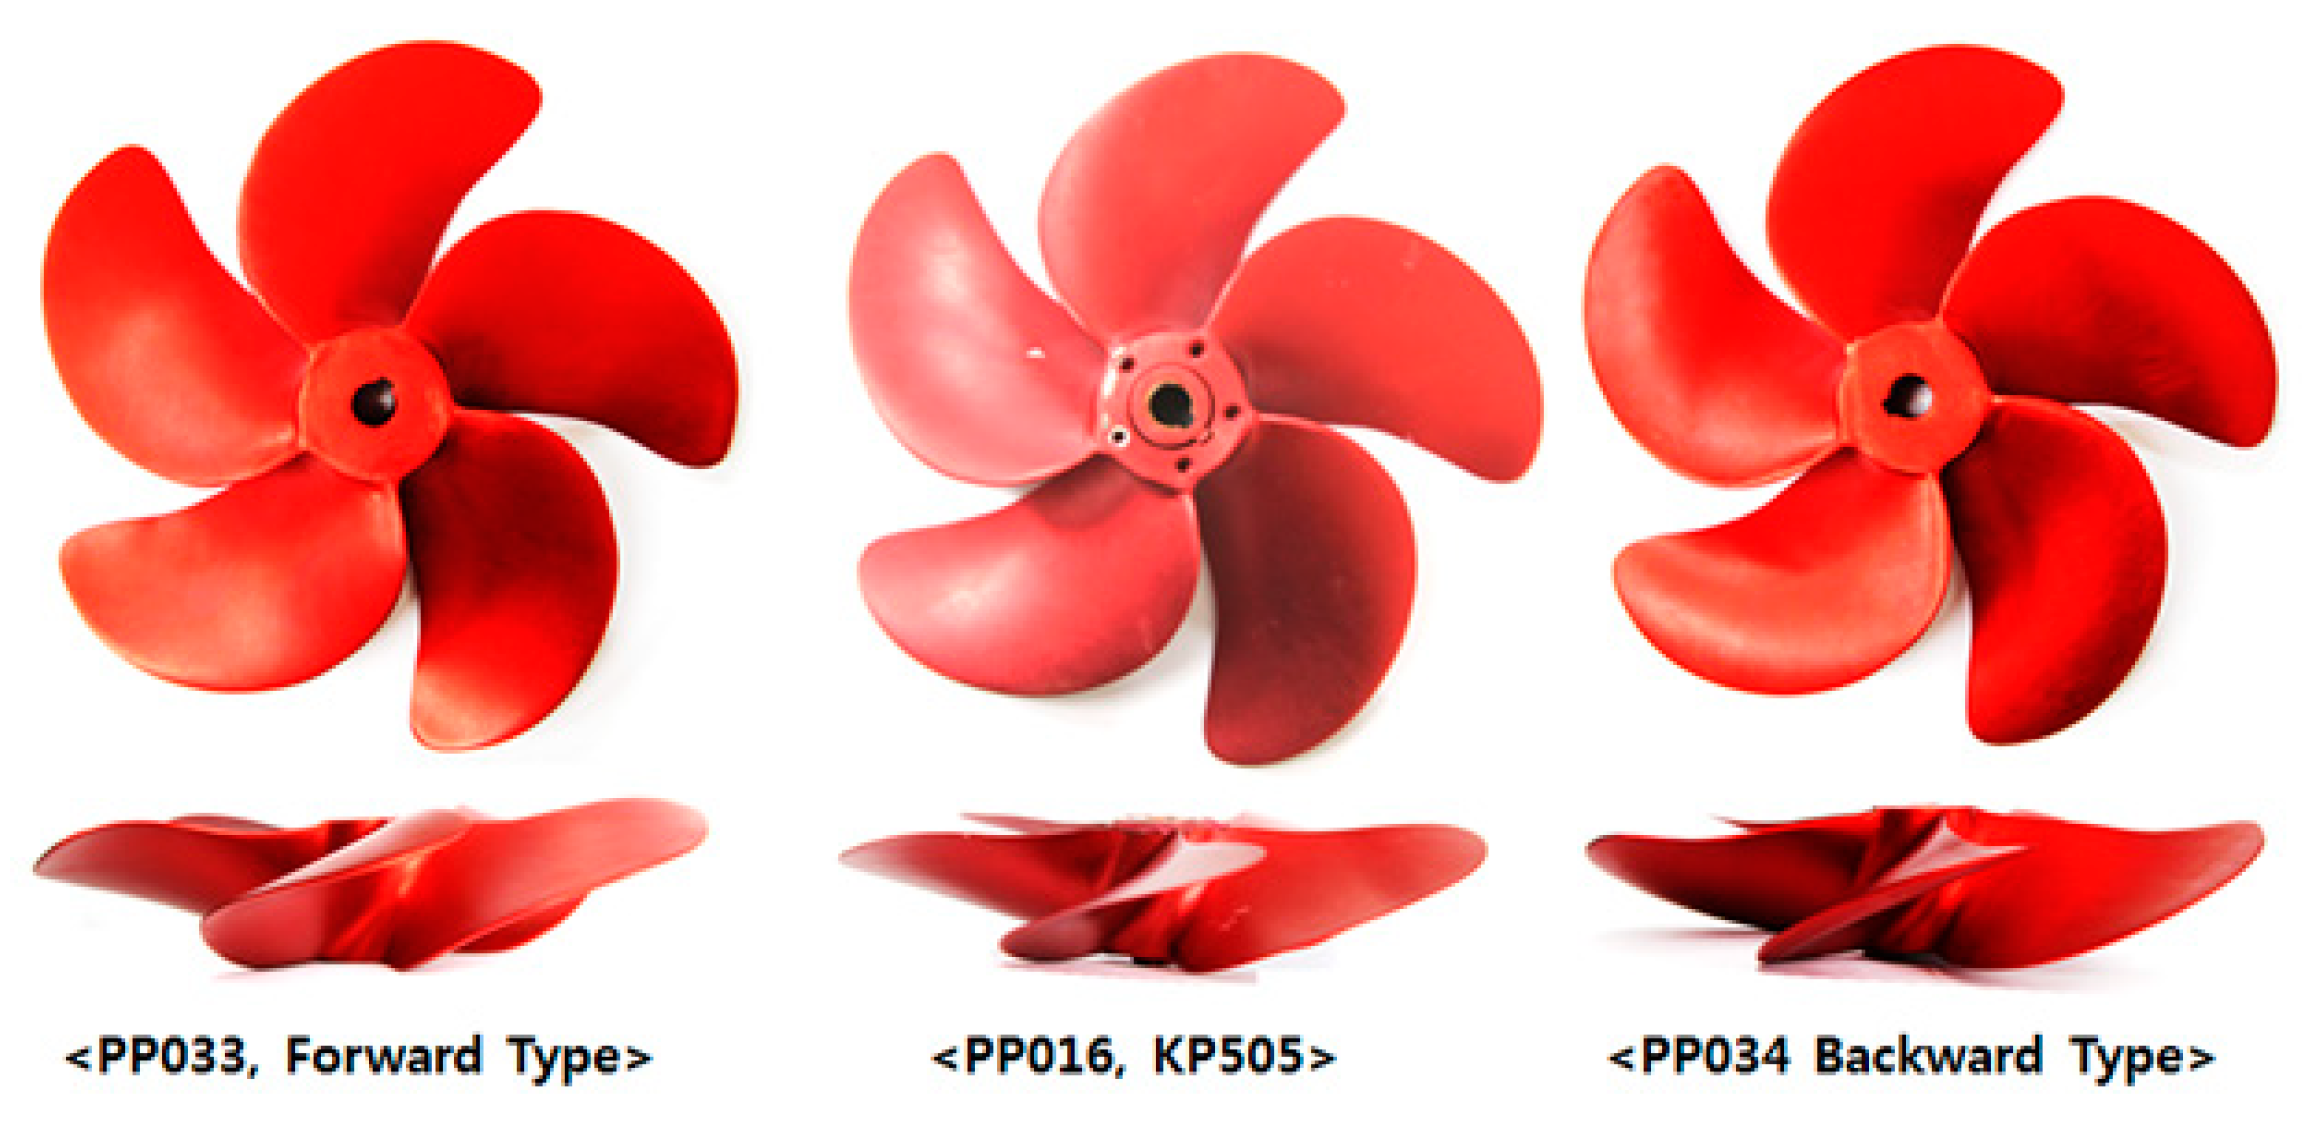
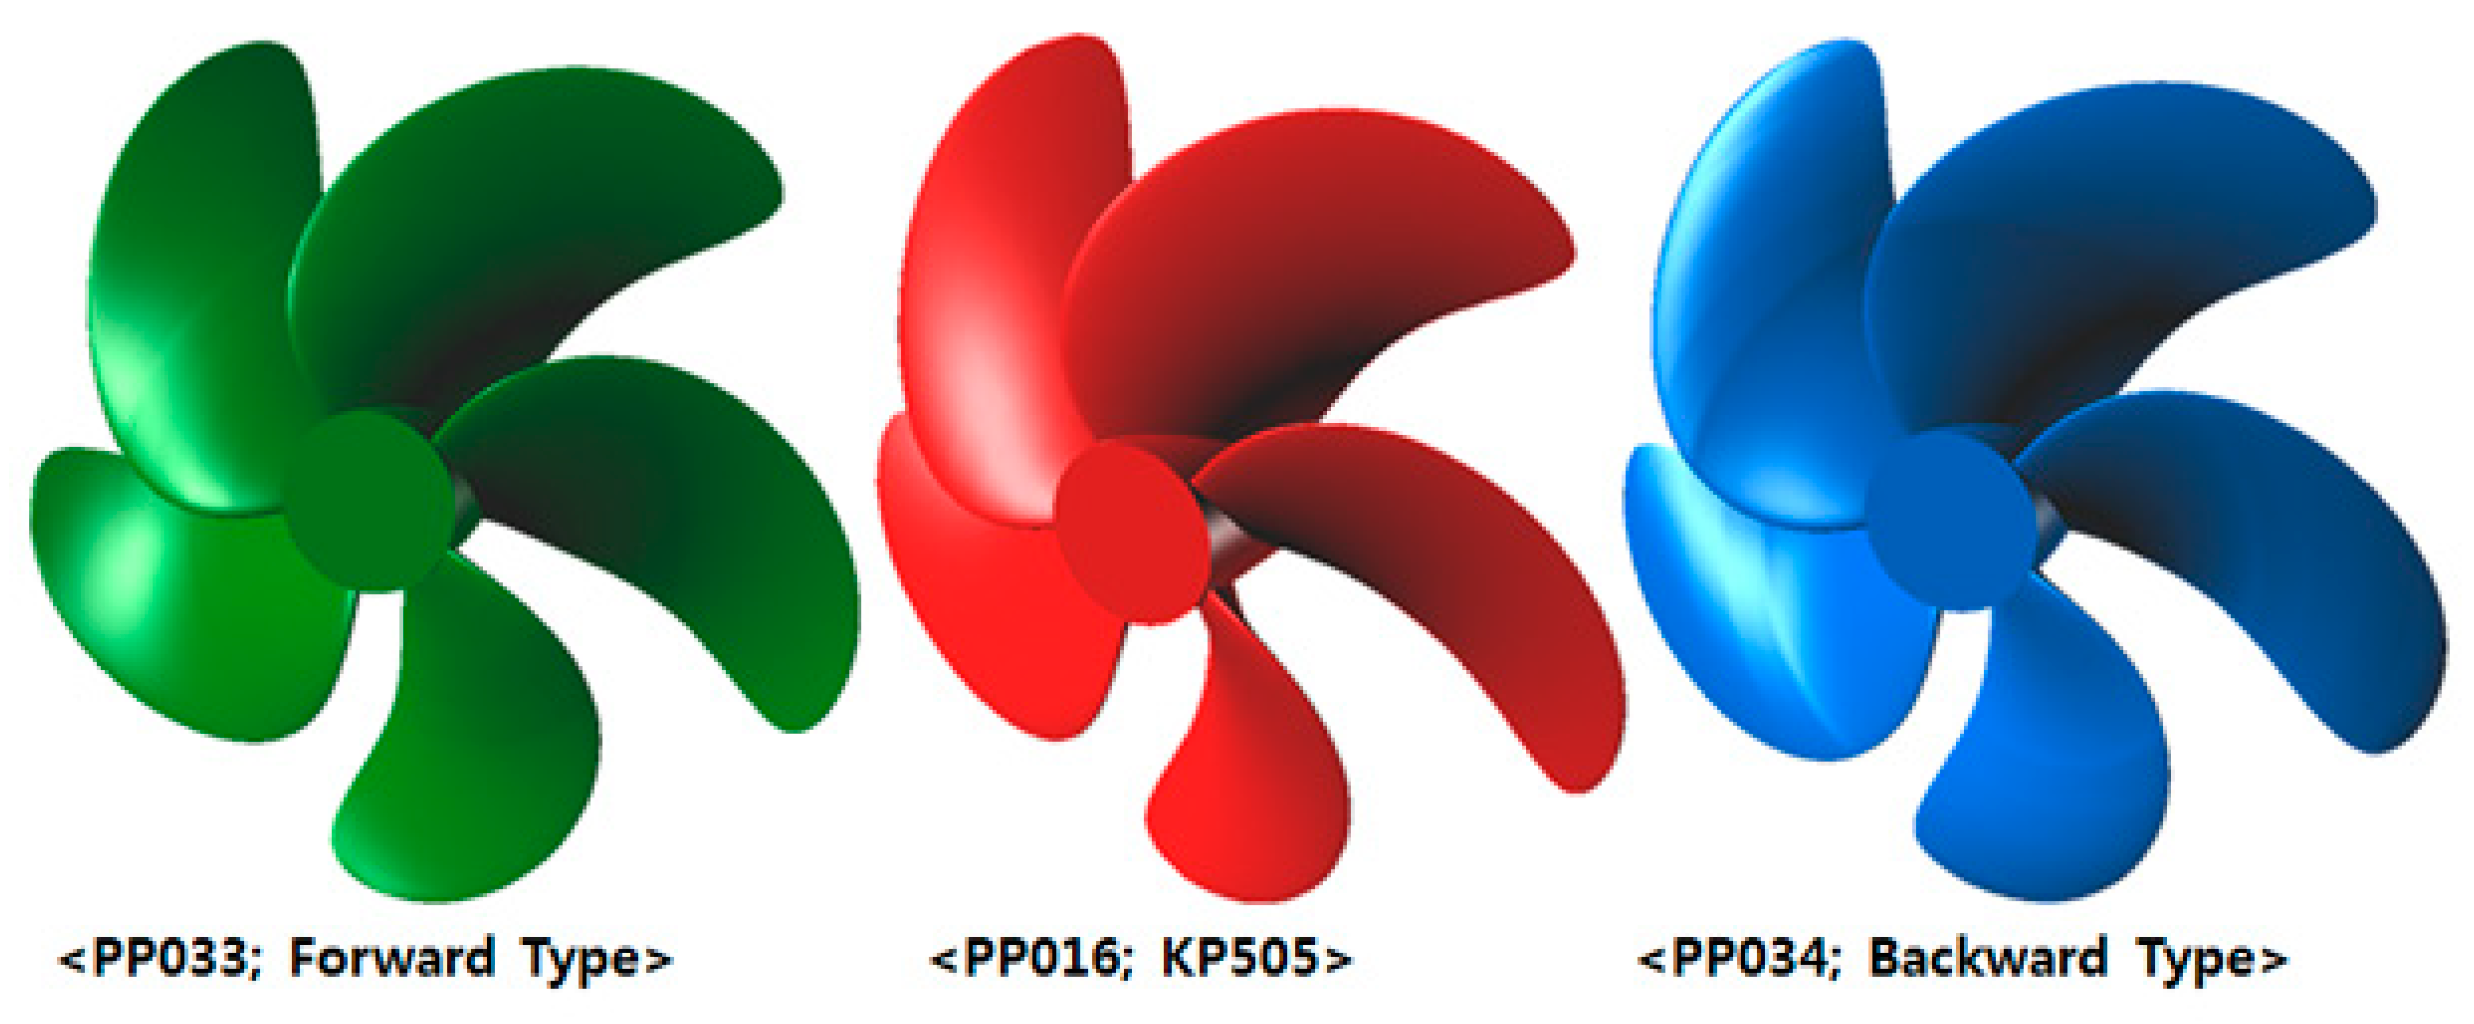
2.2. Tip Rake Propeller Model Test

The aluminum model of the reference propeller (PP016, KP505) and the optimally designed forward (PP033), and backward propellers (PP034) were manufactured for the model test shown in Figure 7. The propeller’s diameter is 0.2m. The propeller open water test was performed at intervals of 0.05 from J = 0.05–1.00. According to the International Towing Tank Conference (ITTC), the minimum Reynolds number for the POW test is 2 × 10⁵, however some cases, that may not be large enough (Kim, et al., 1985) [8]. In this study, the minimum Reynolds number is more than 5 × 10⁵ as shown in the Figure 8. The results of the self-propulsion test at the speed of 24 knots, which was conducted in the PNU towing tank, the target KT/J2=0.4725 was identified (Kwon, 2013) [9]. The open water efficiency of the three propellers is compared in Table 3 where the backward propeller is 1.28% greater and the forward propeller is 0.264% greater than the reference propeller (KP505) at the same point of KT/J2. The tendency of the efficiency gain is similar to the potential computation although there is little quantitative difference. Figure 9 shows a comparison with KP505 open water test results conducted by KRISO to verify reliability of PNU model test results. In the low J area, there was some difference in thrust and torque coefficients, but not much difference in open water efficiency with the KRISO results. The open water efficiency near target J (approximately 0.6) was almost identical to each other. Figure 10 shows the results of comparison of open water propeller efficiency based on experiments.

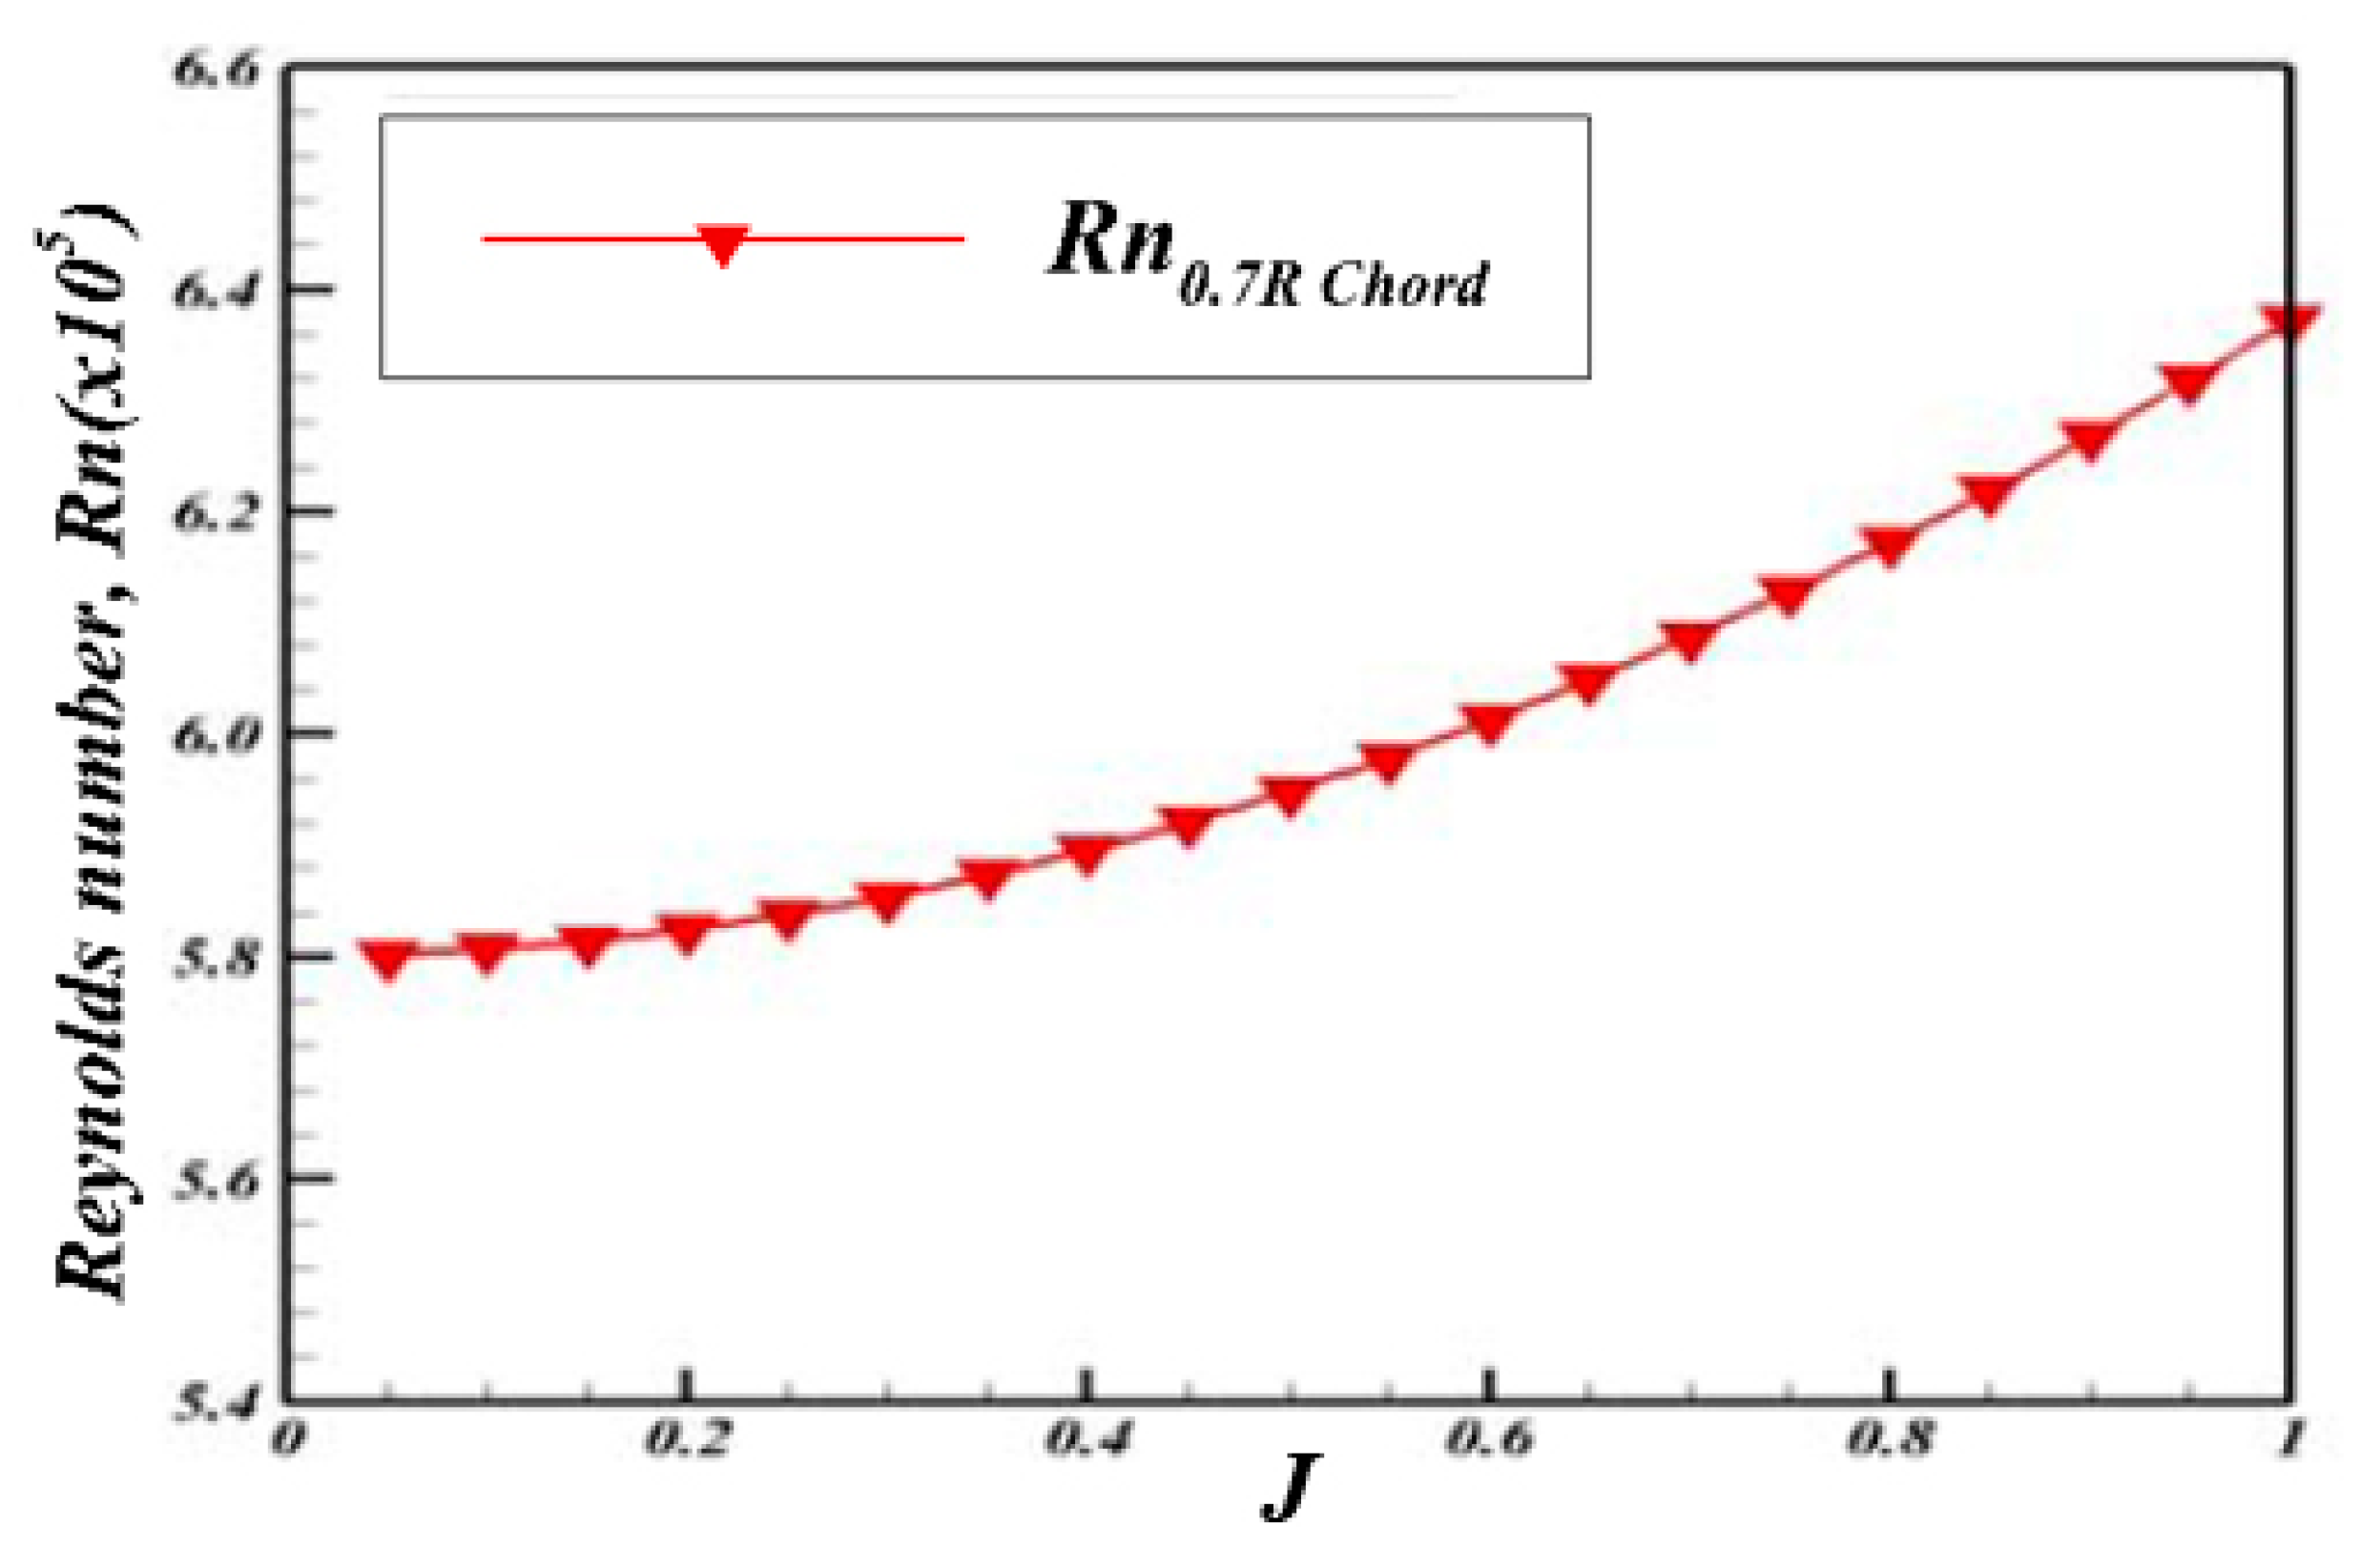
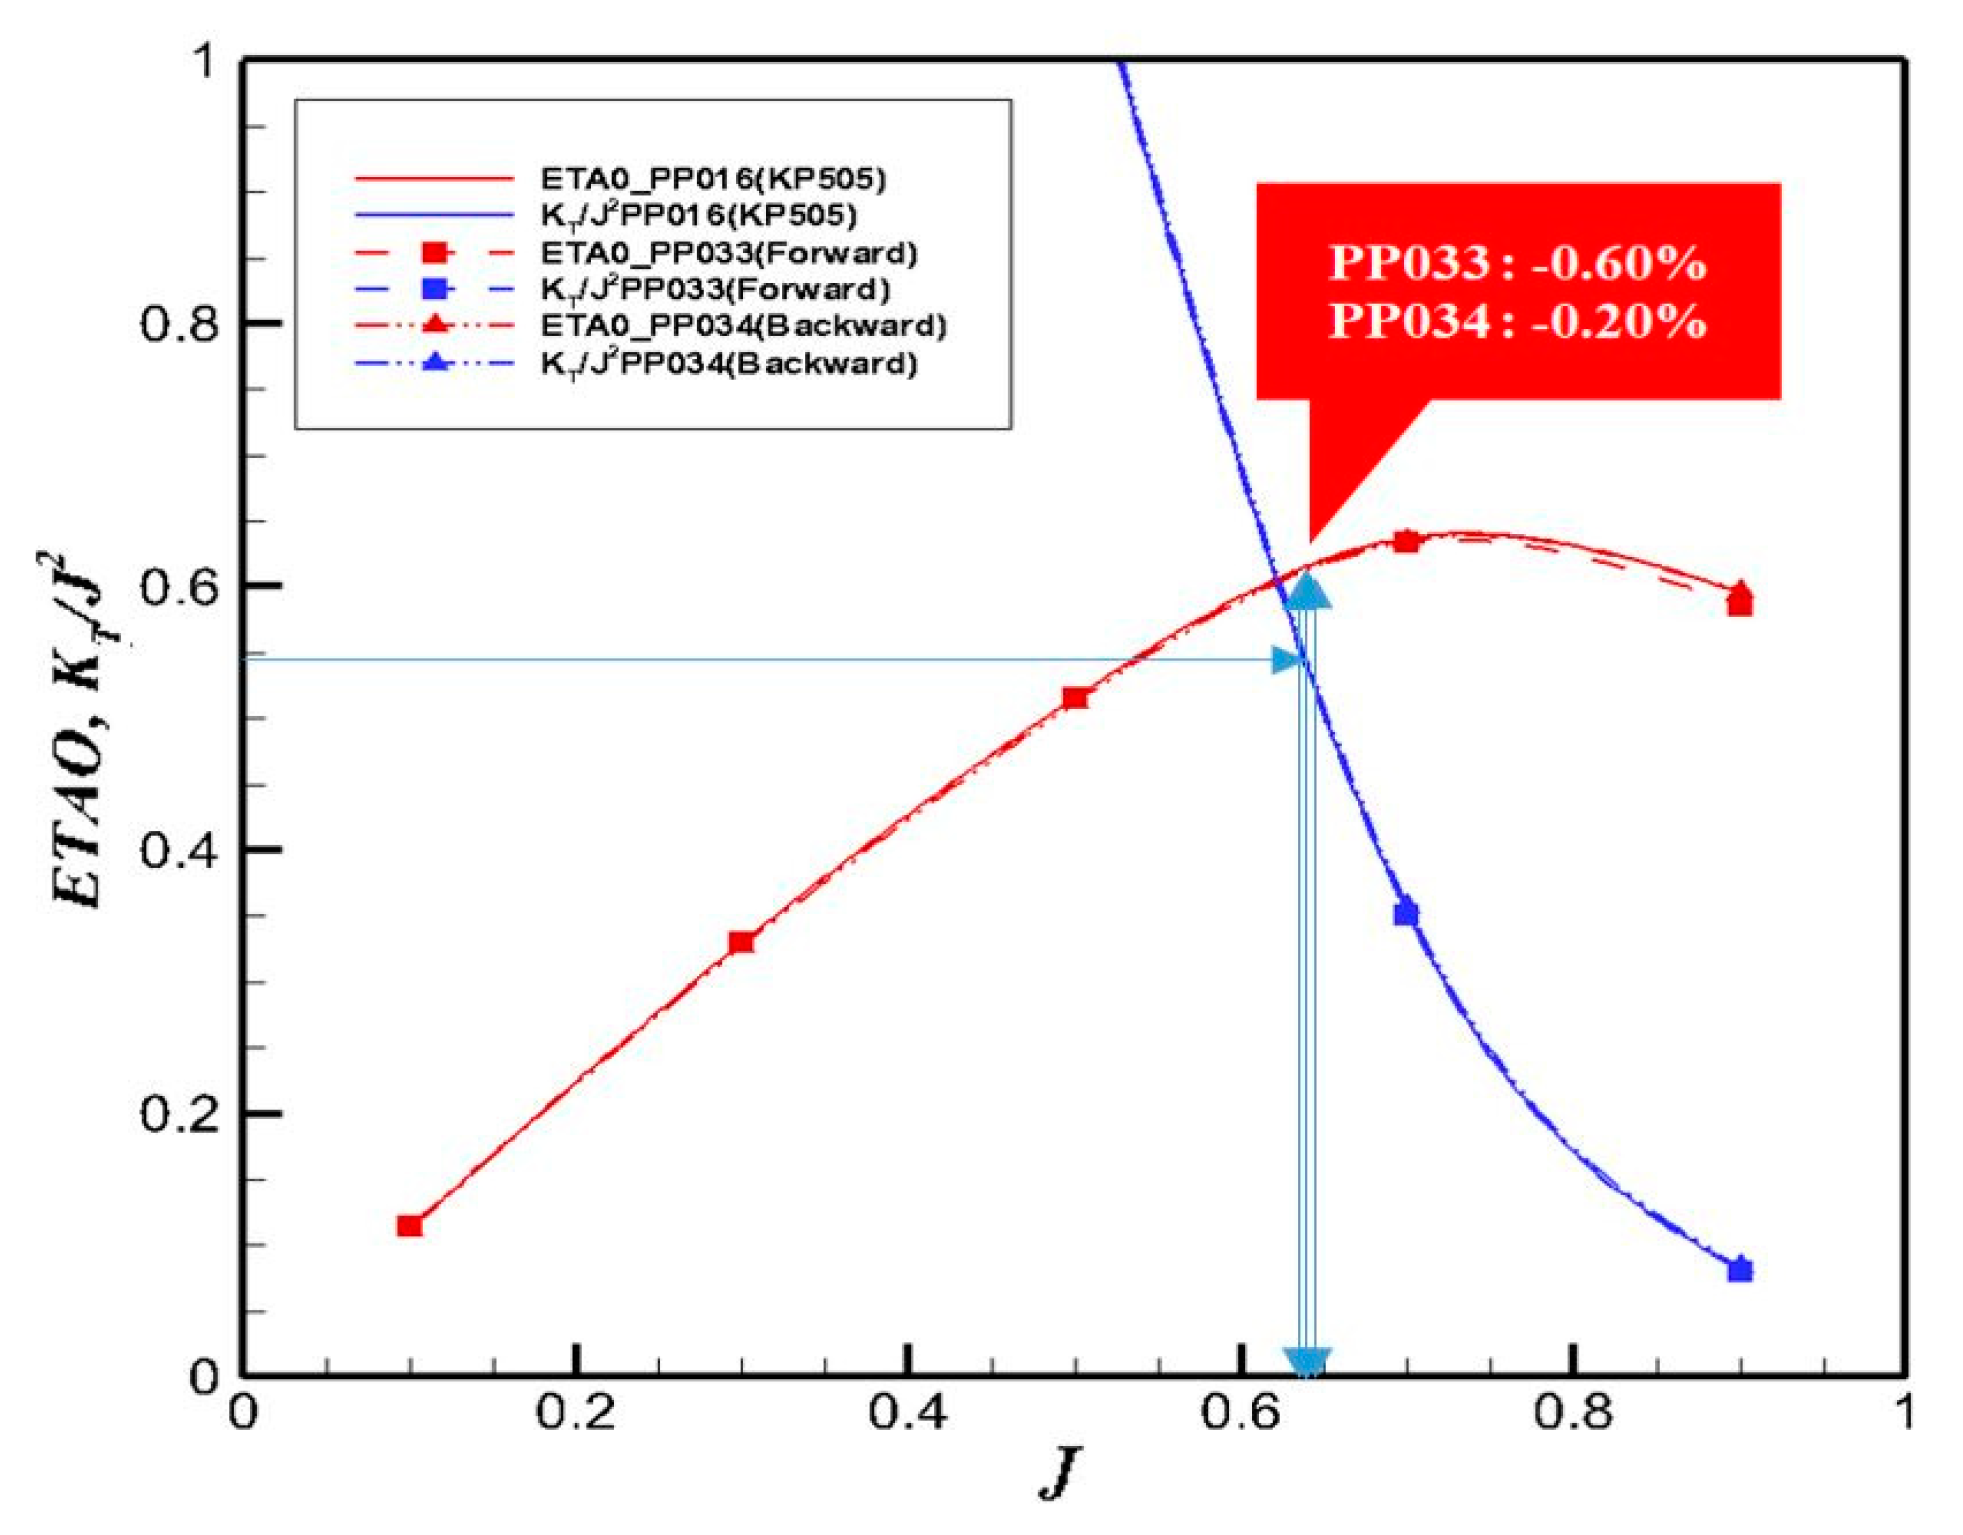
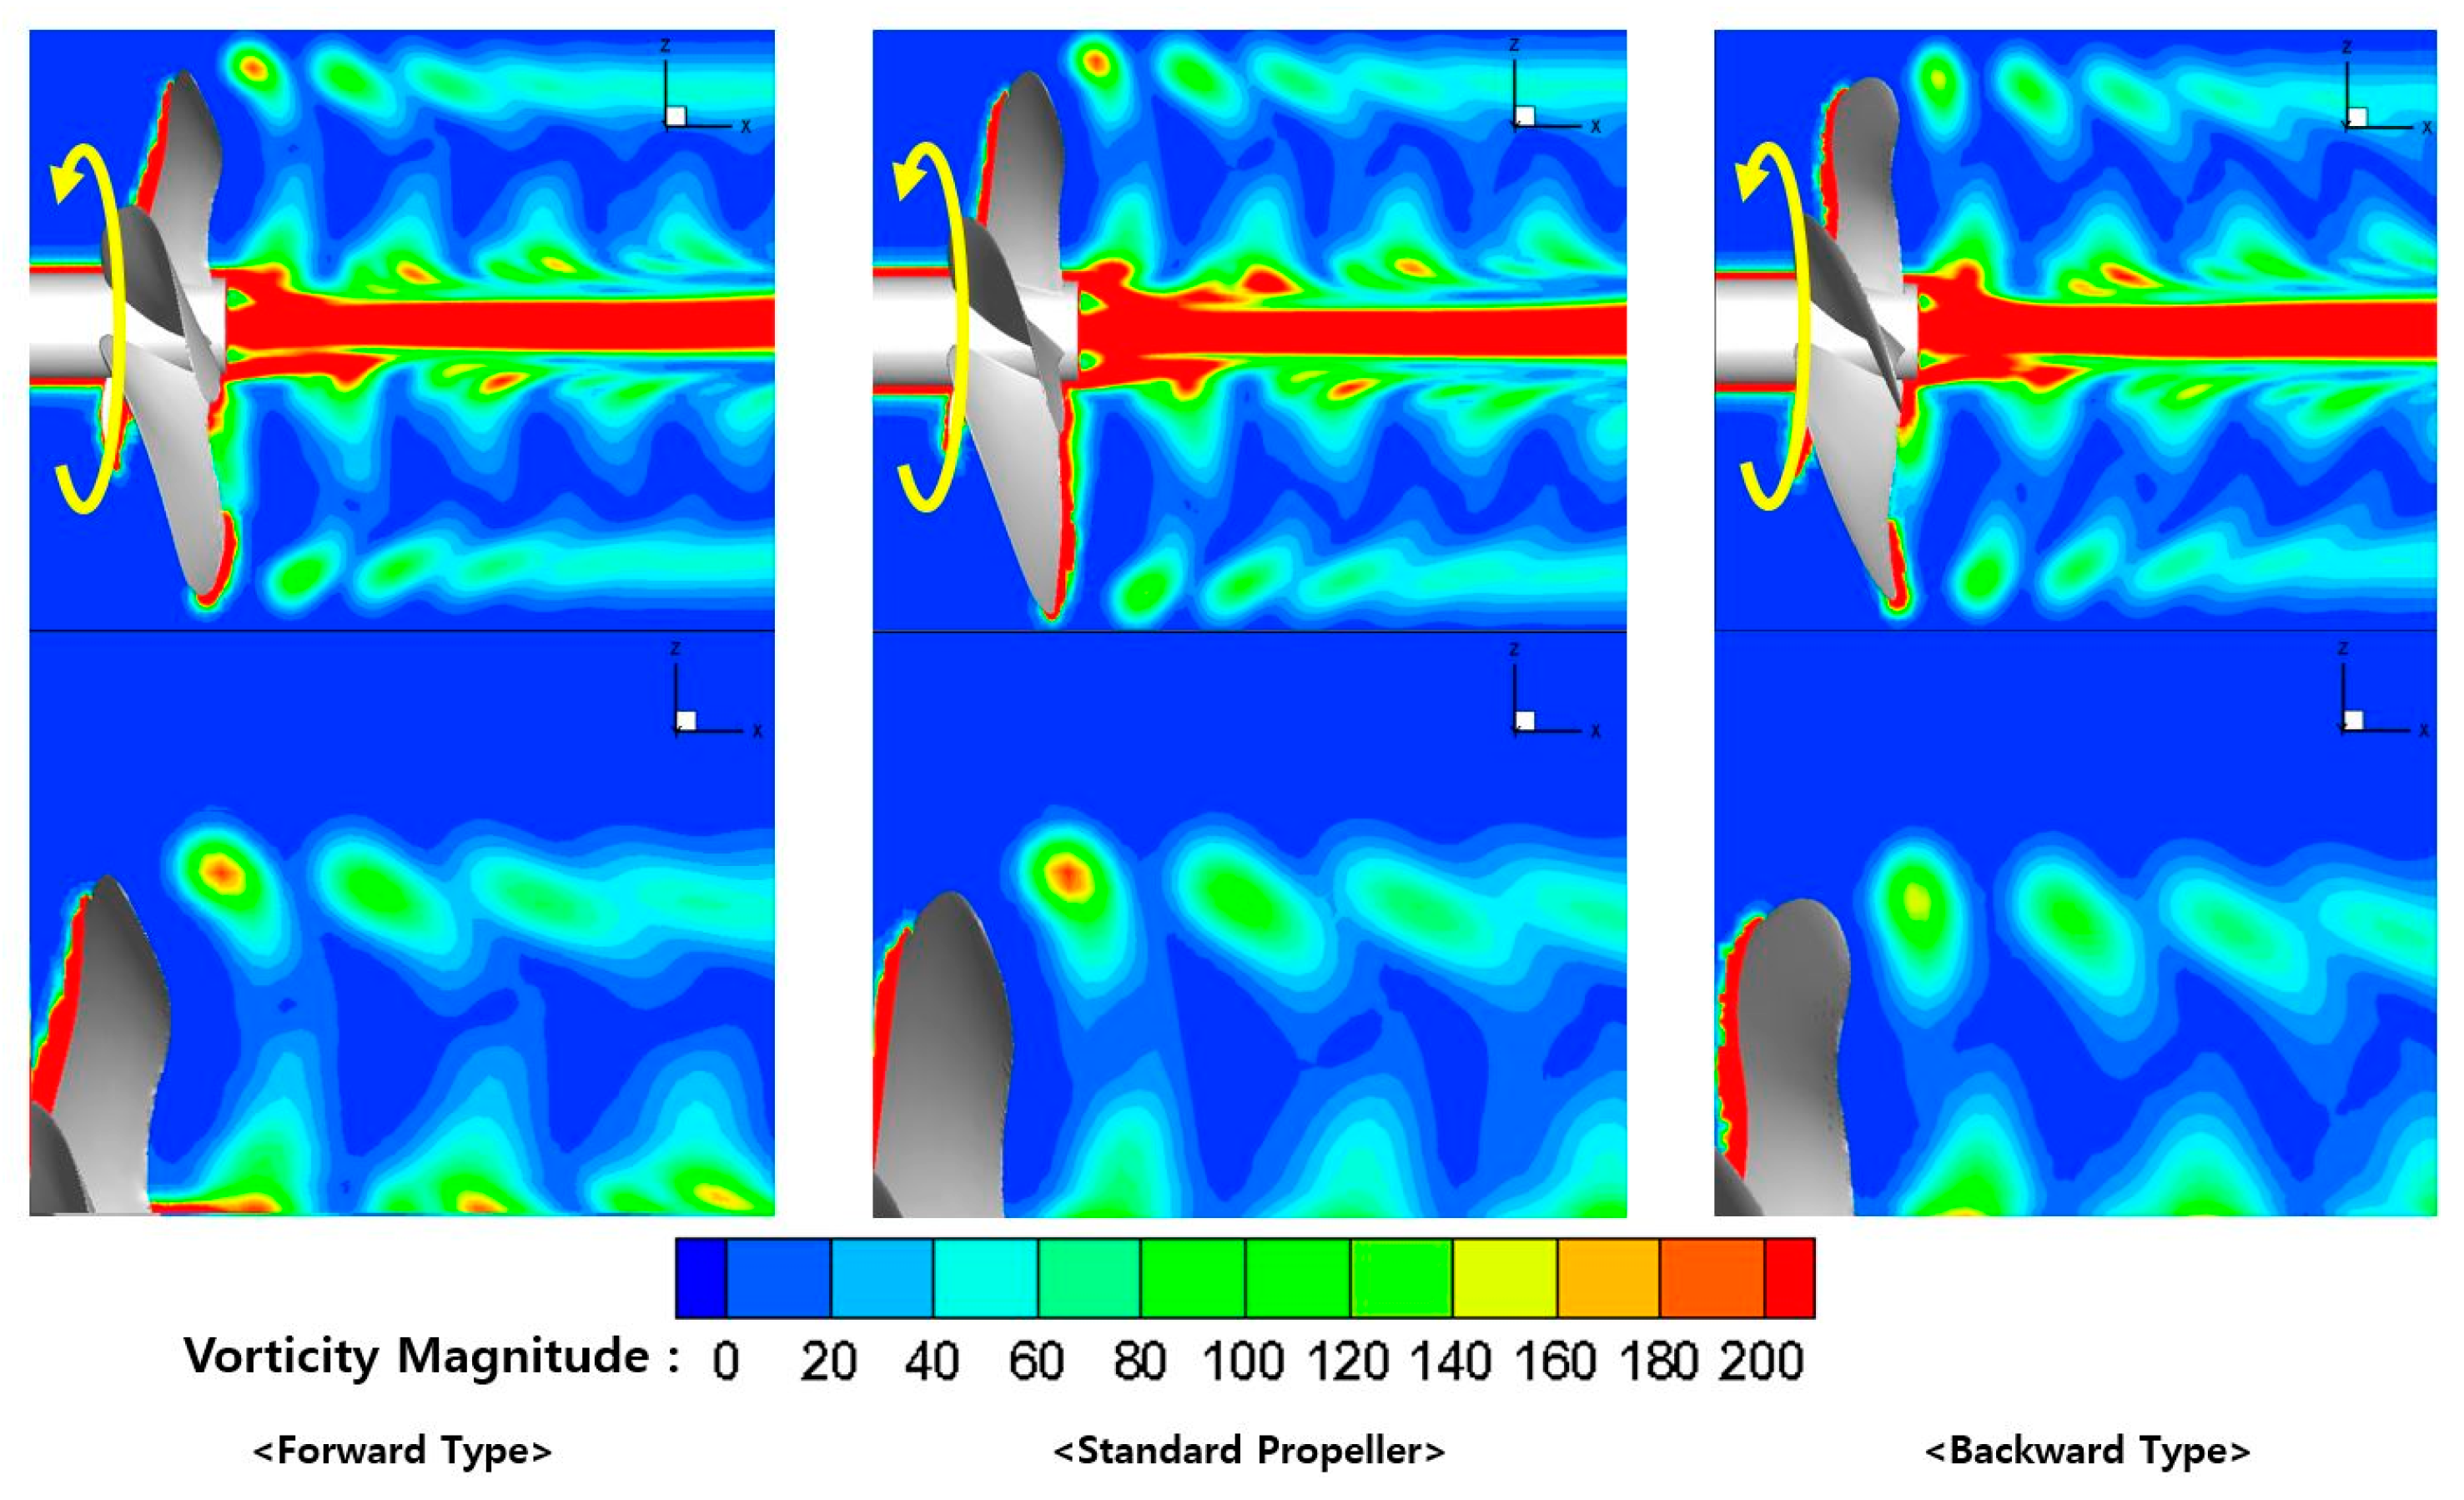
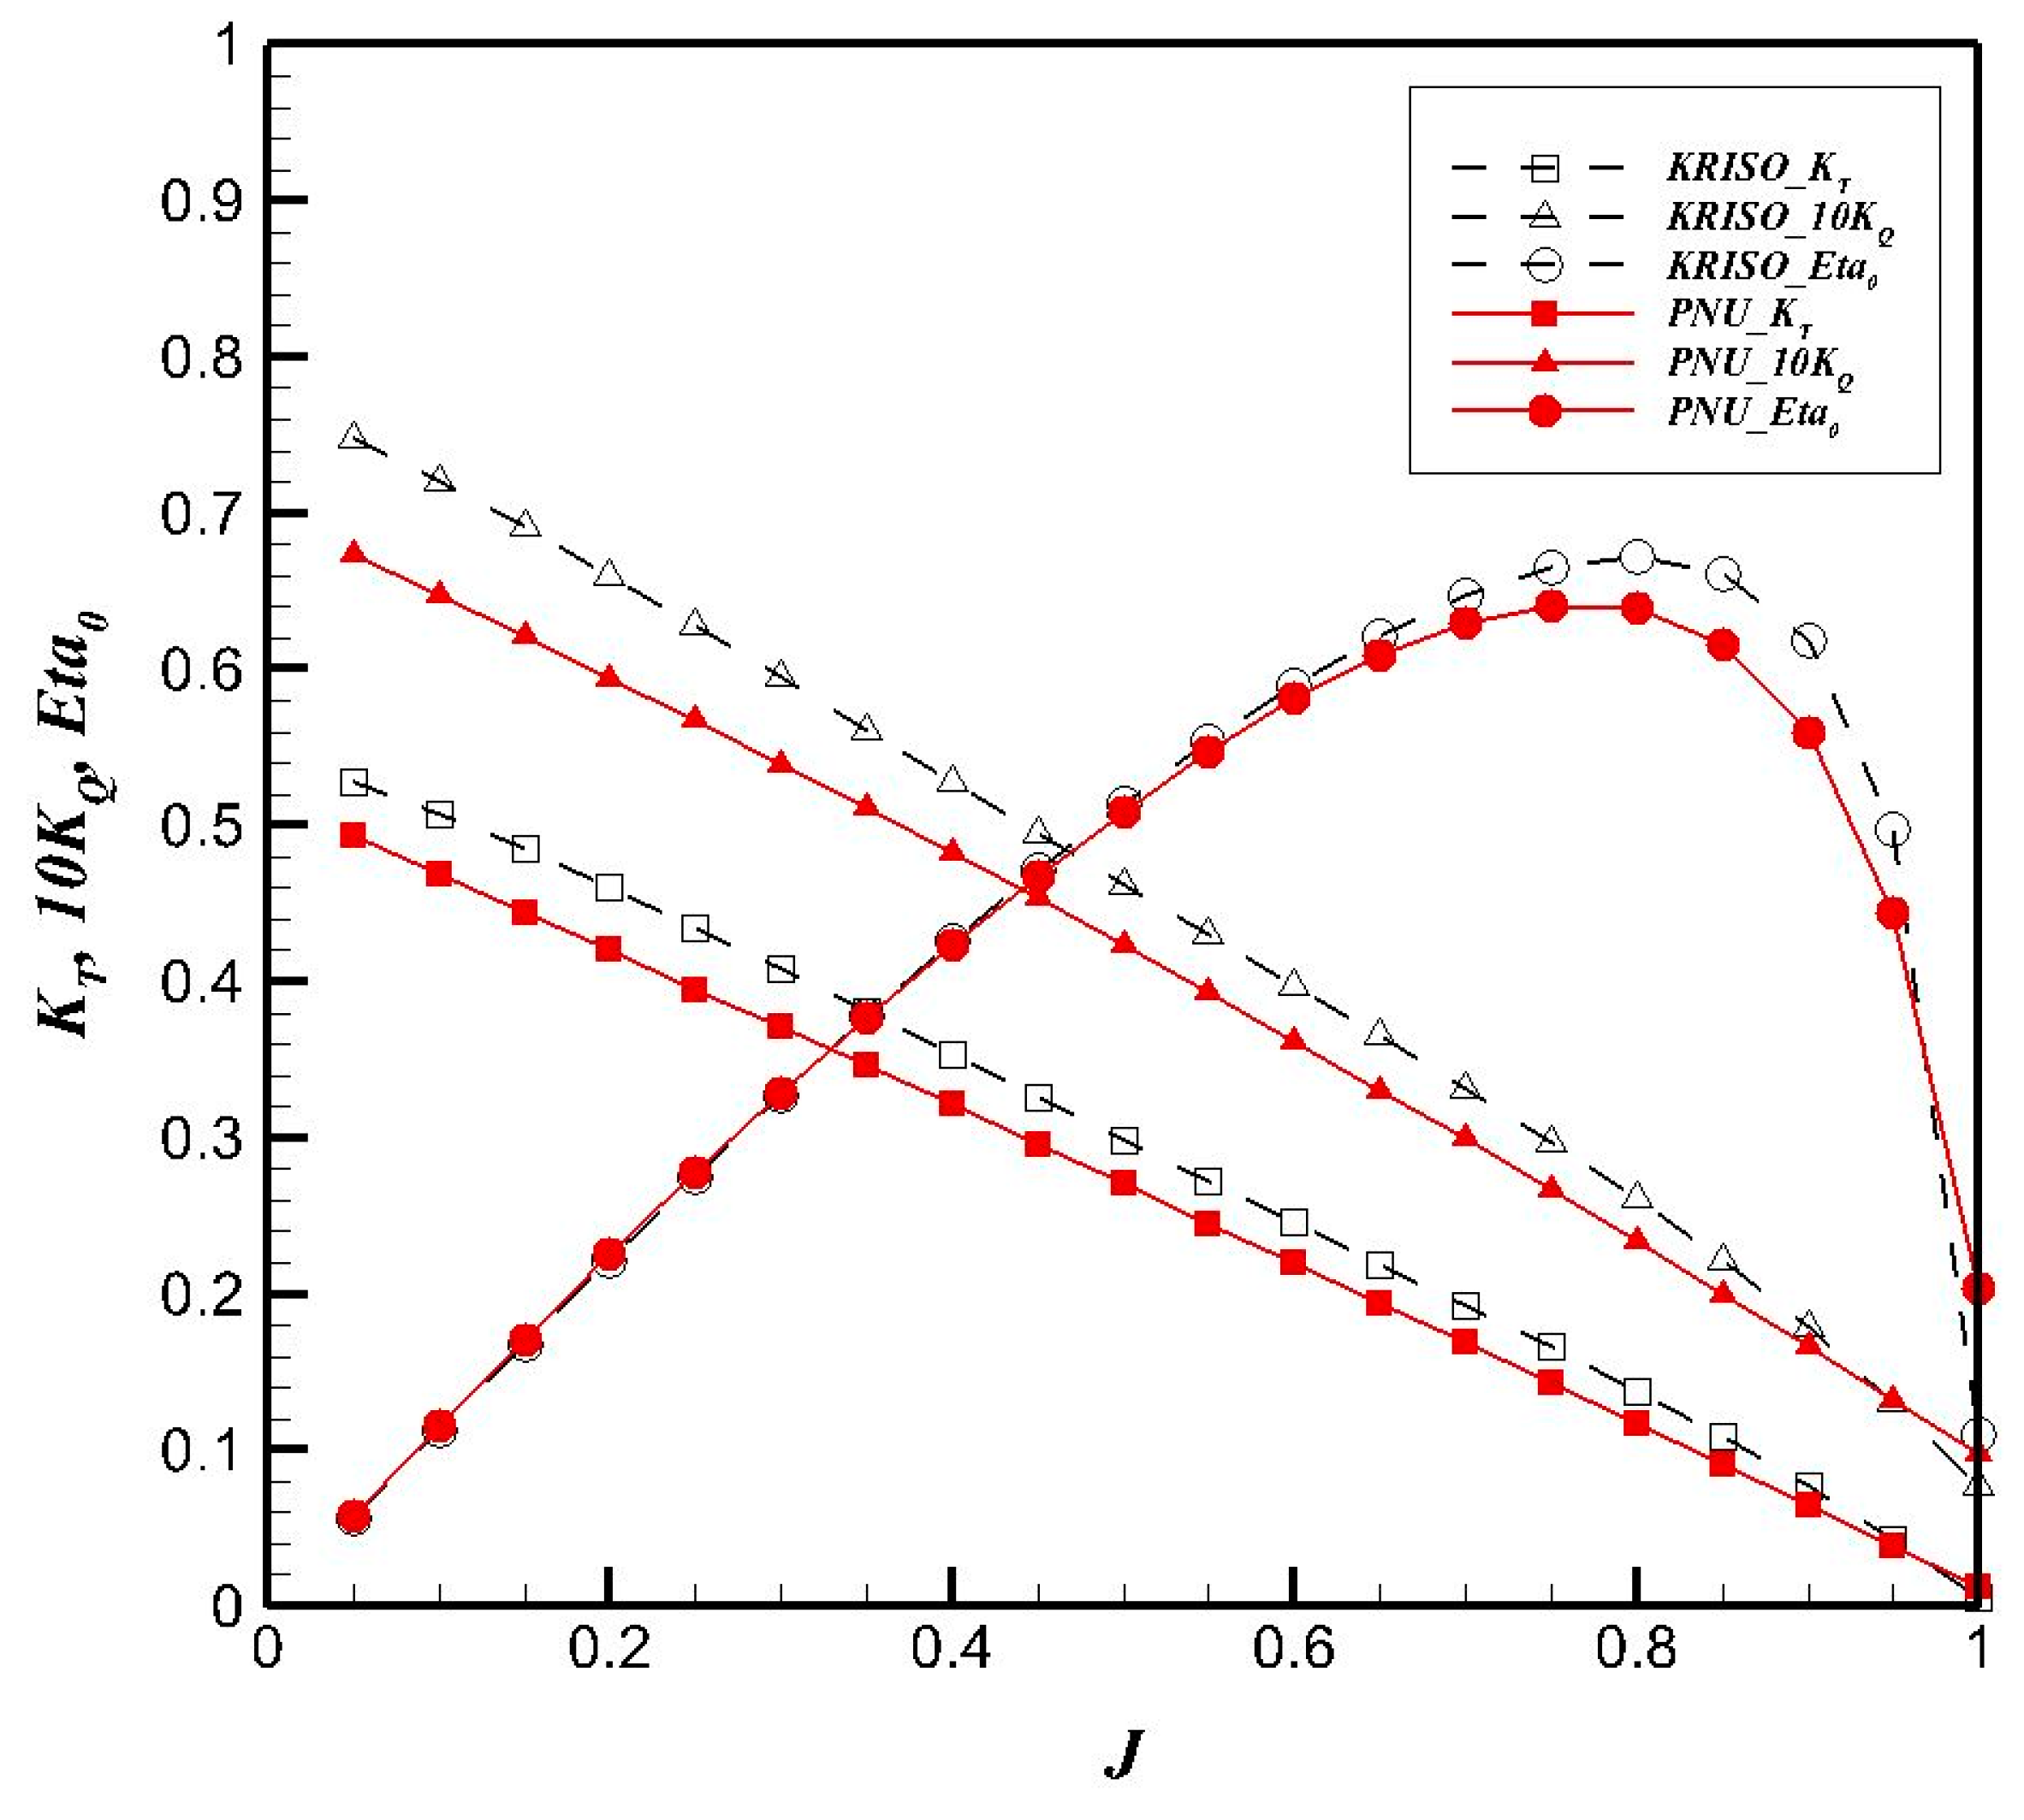
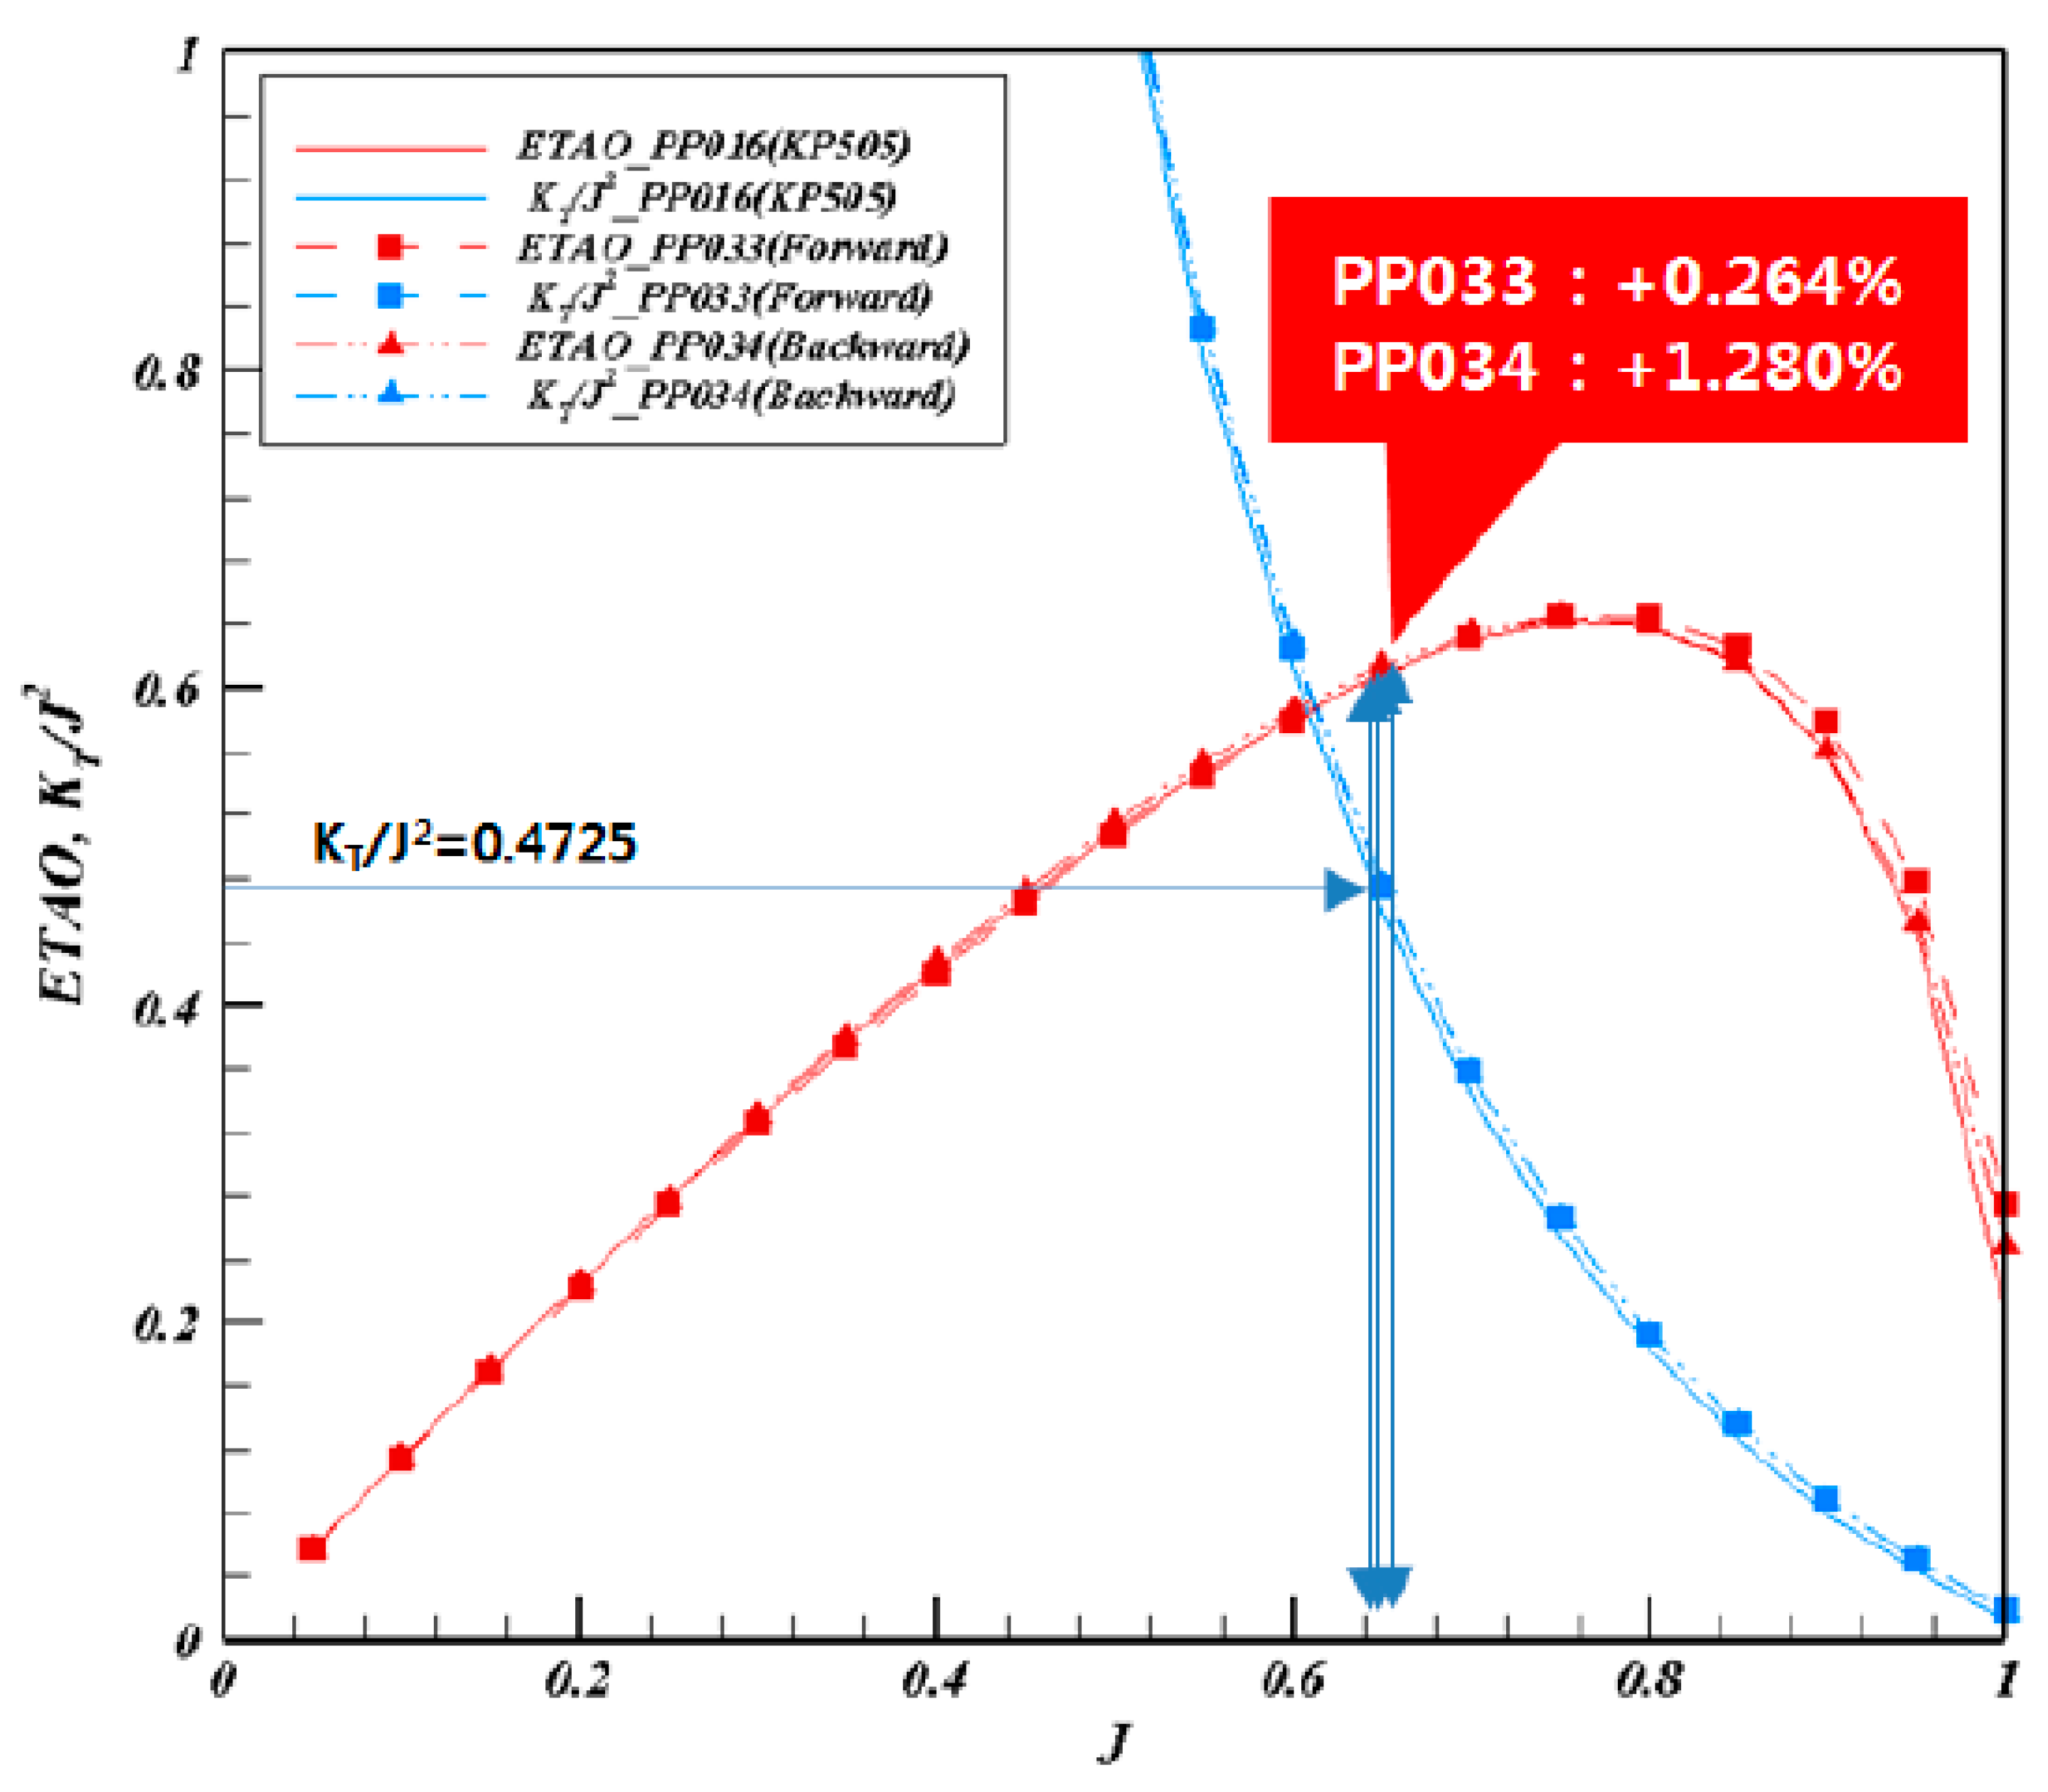
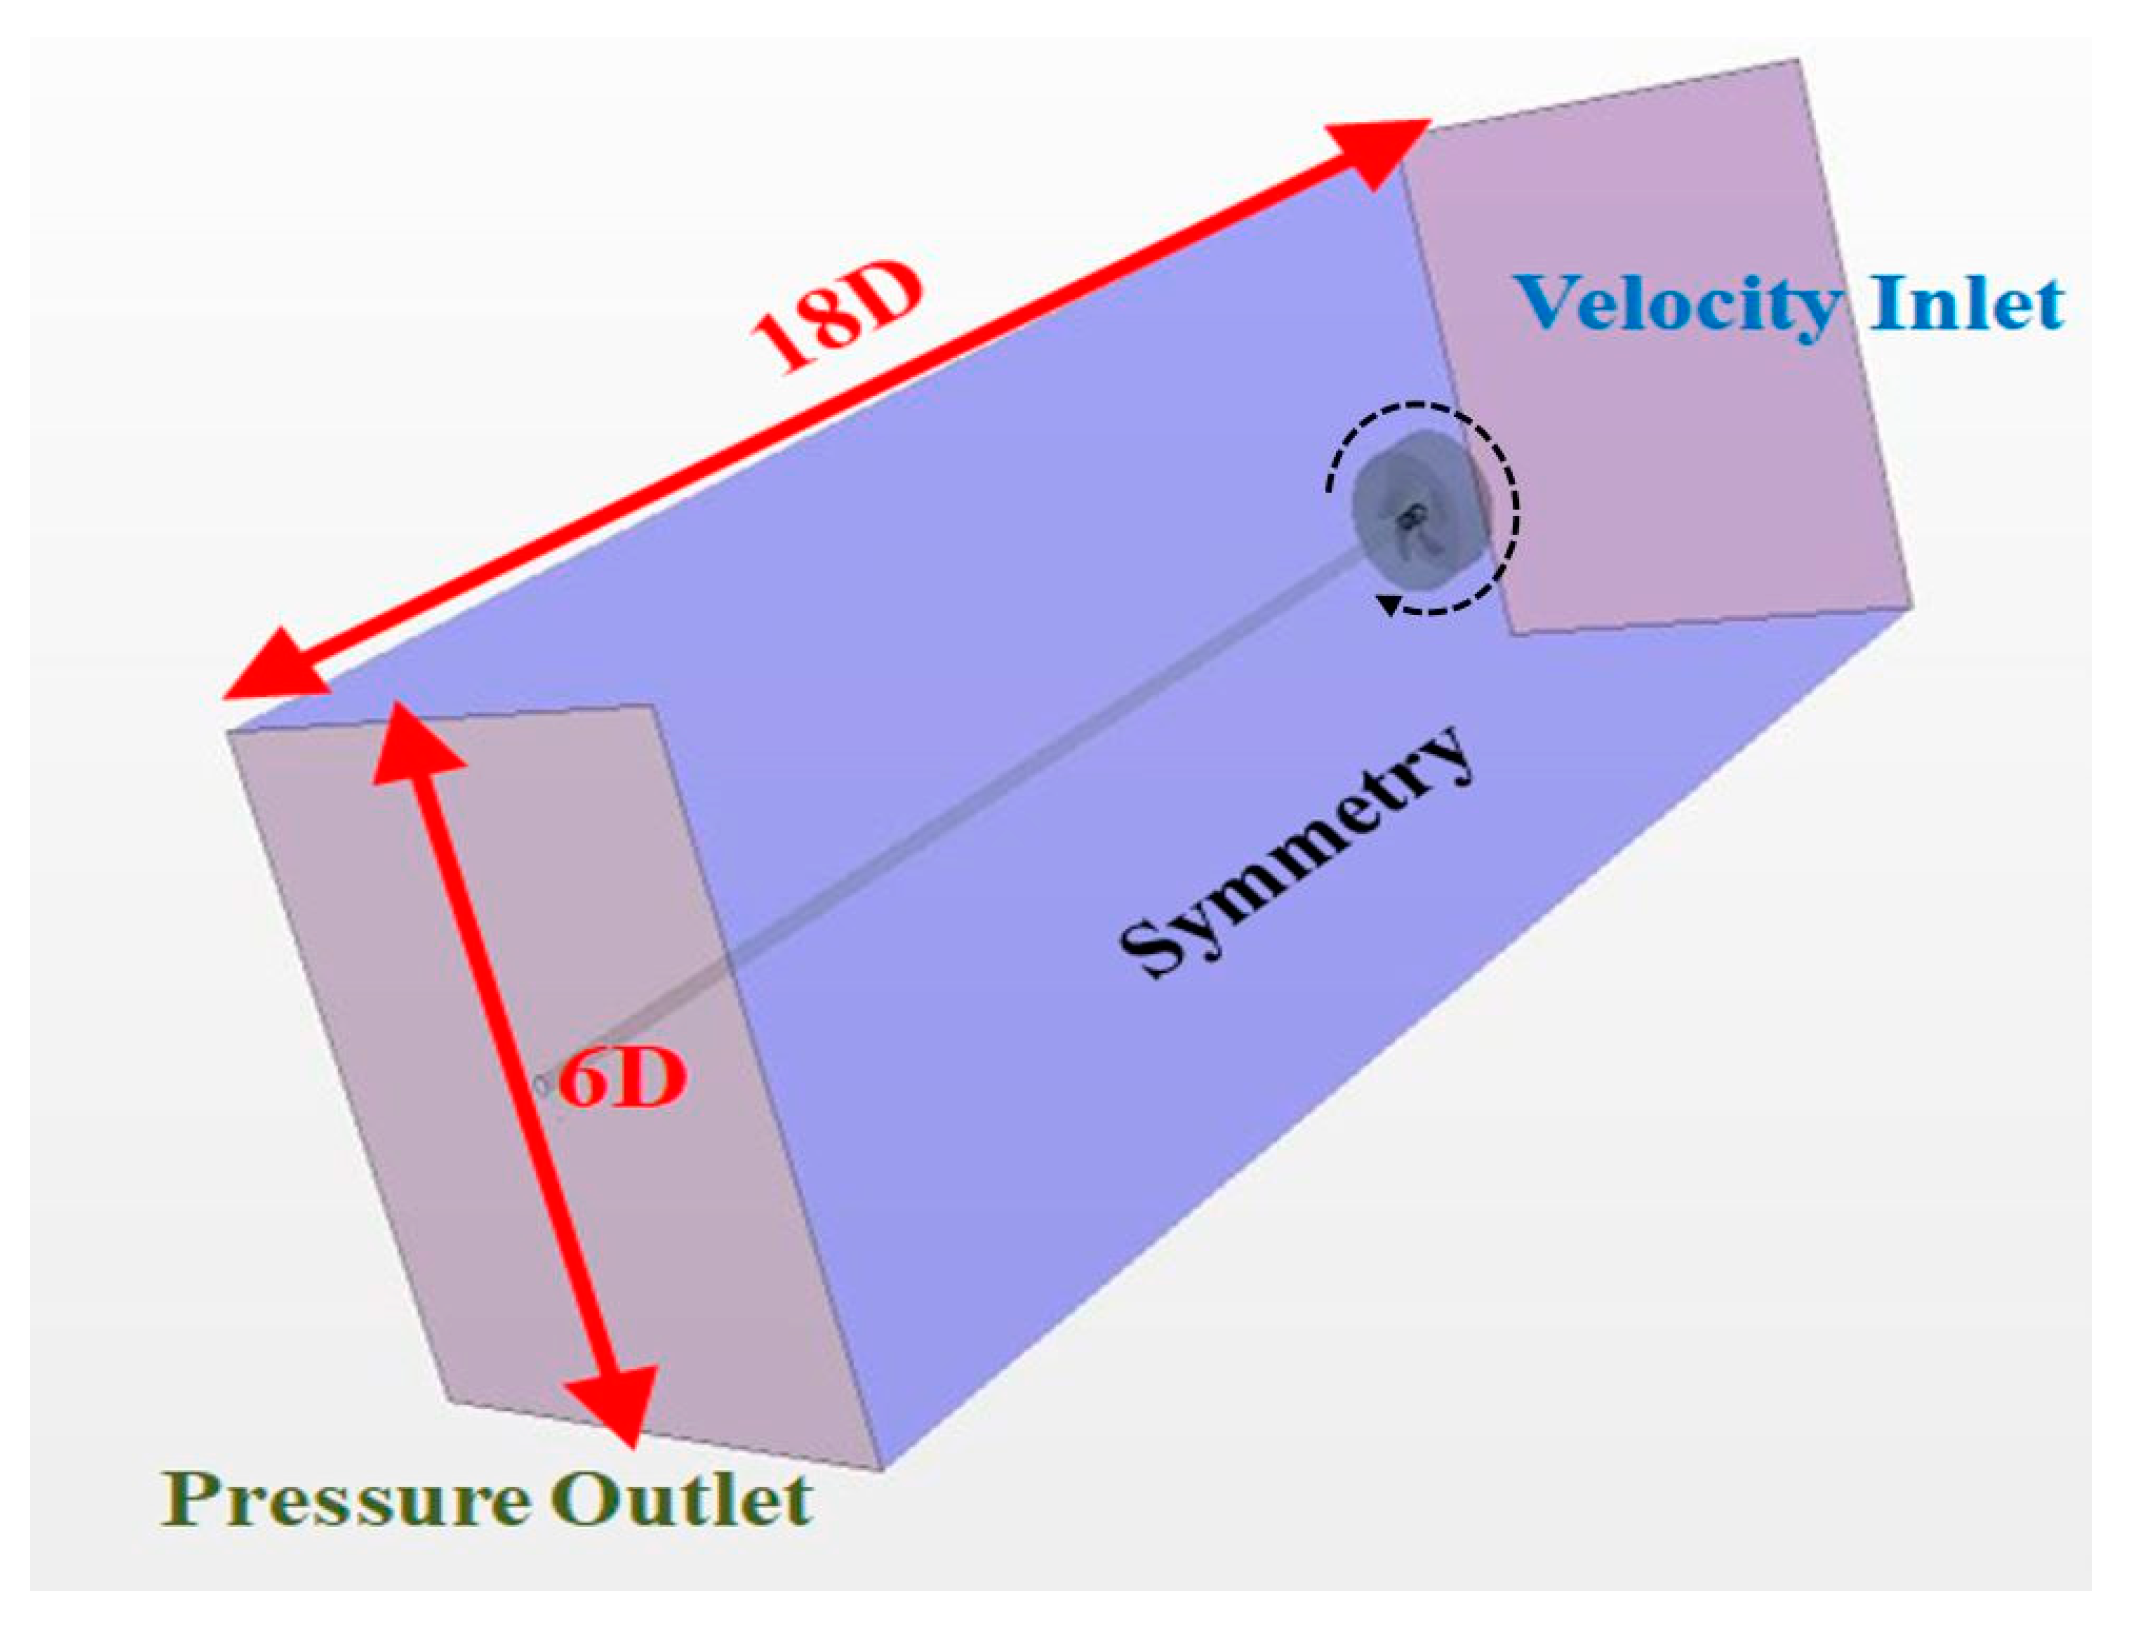
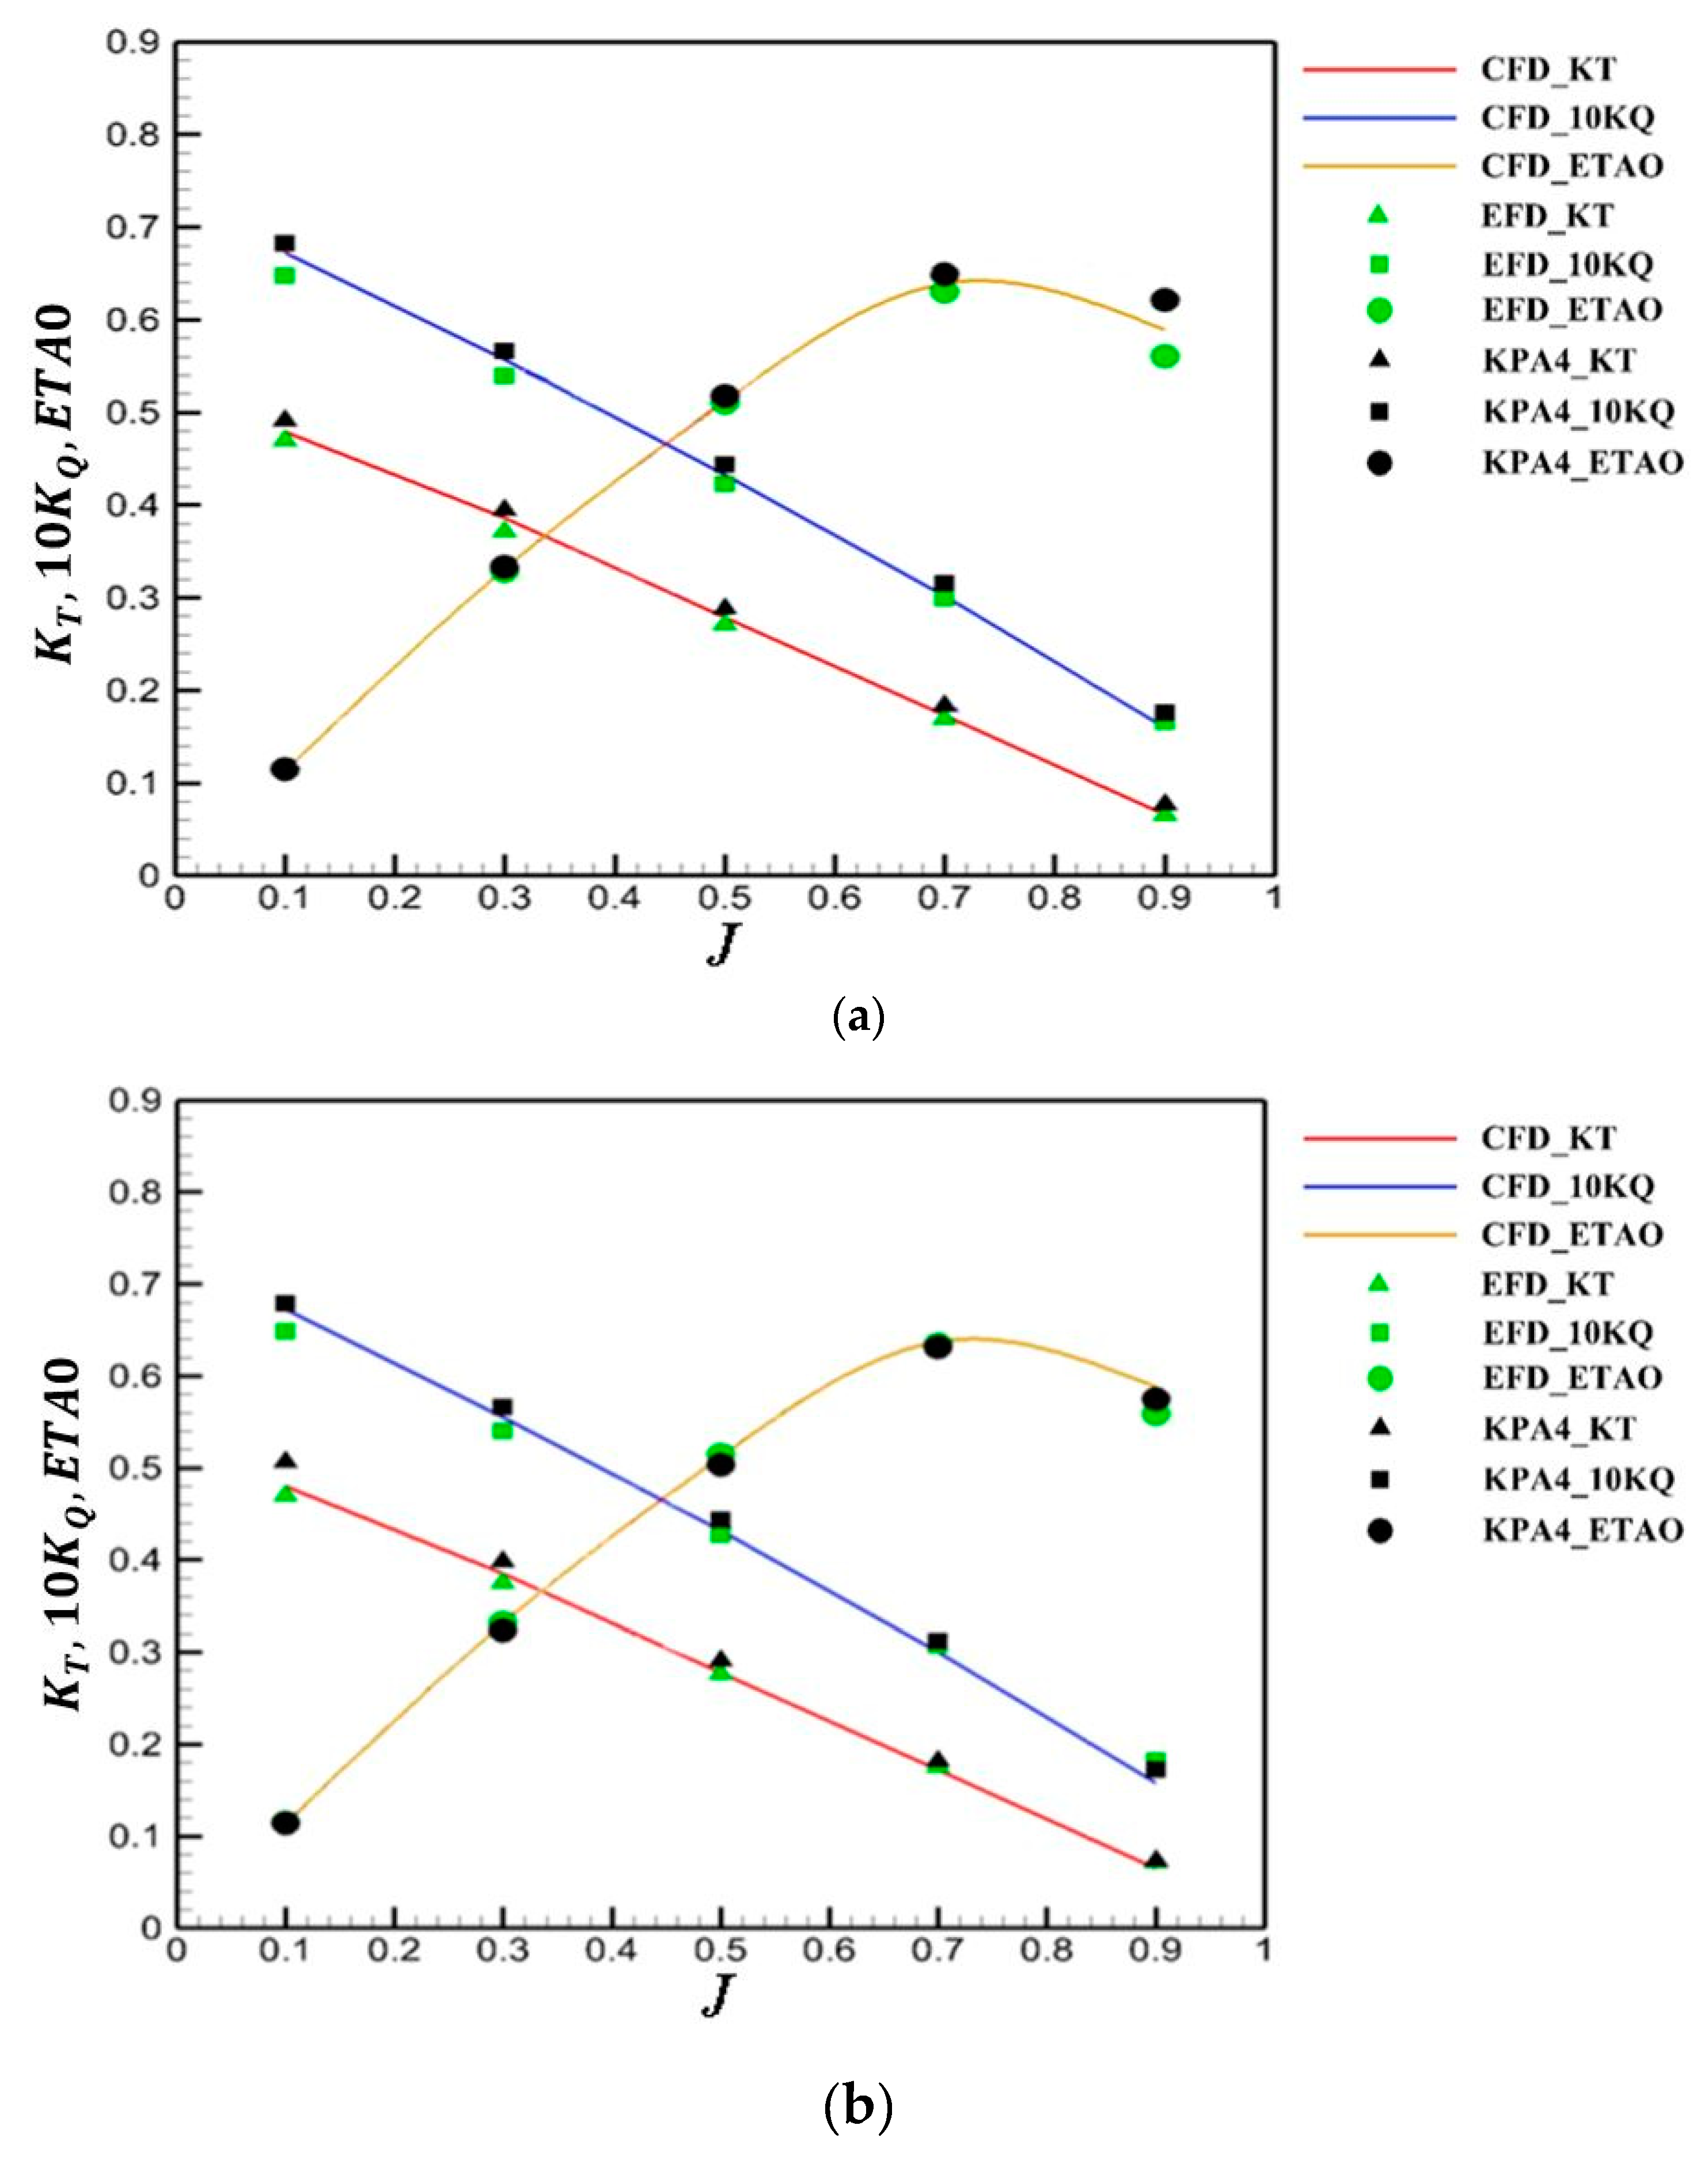
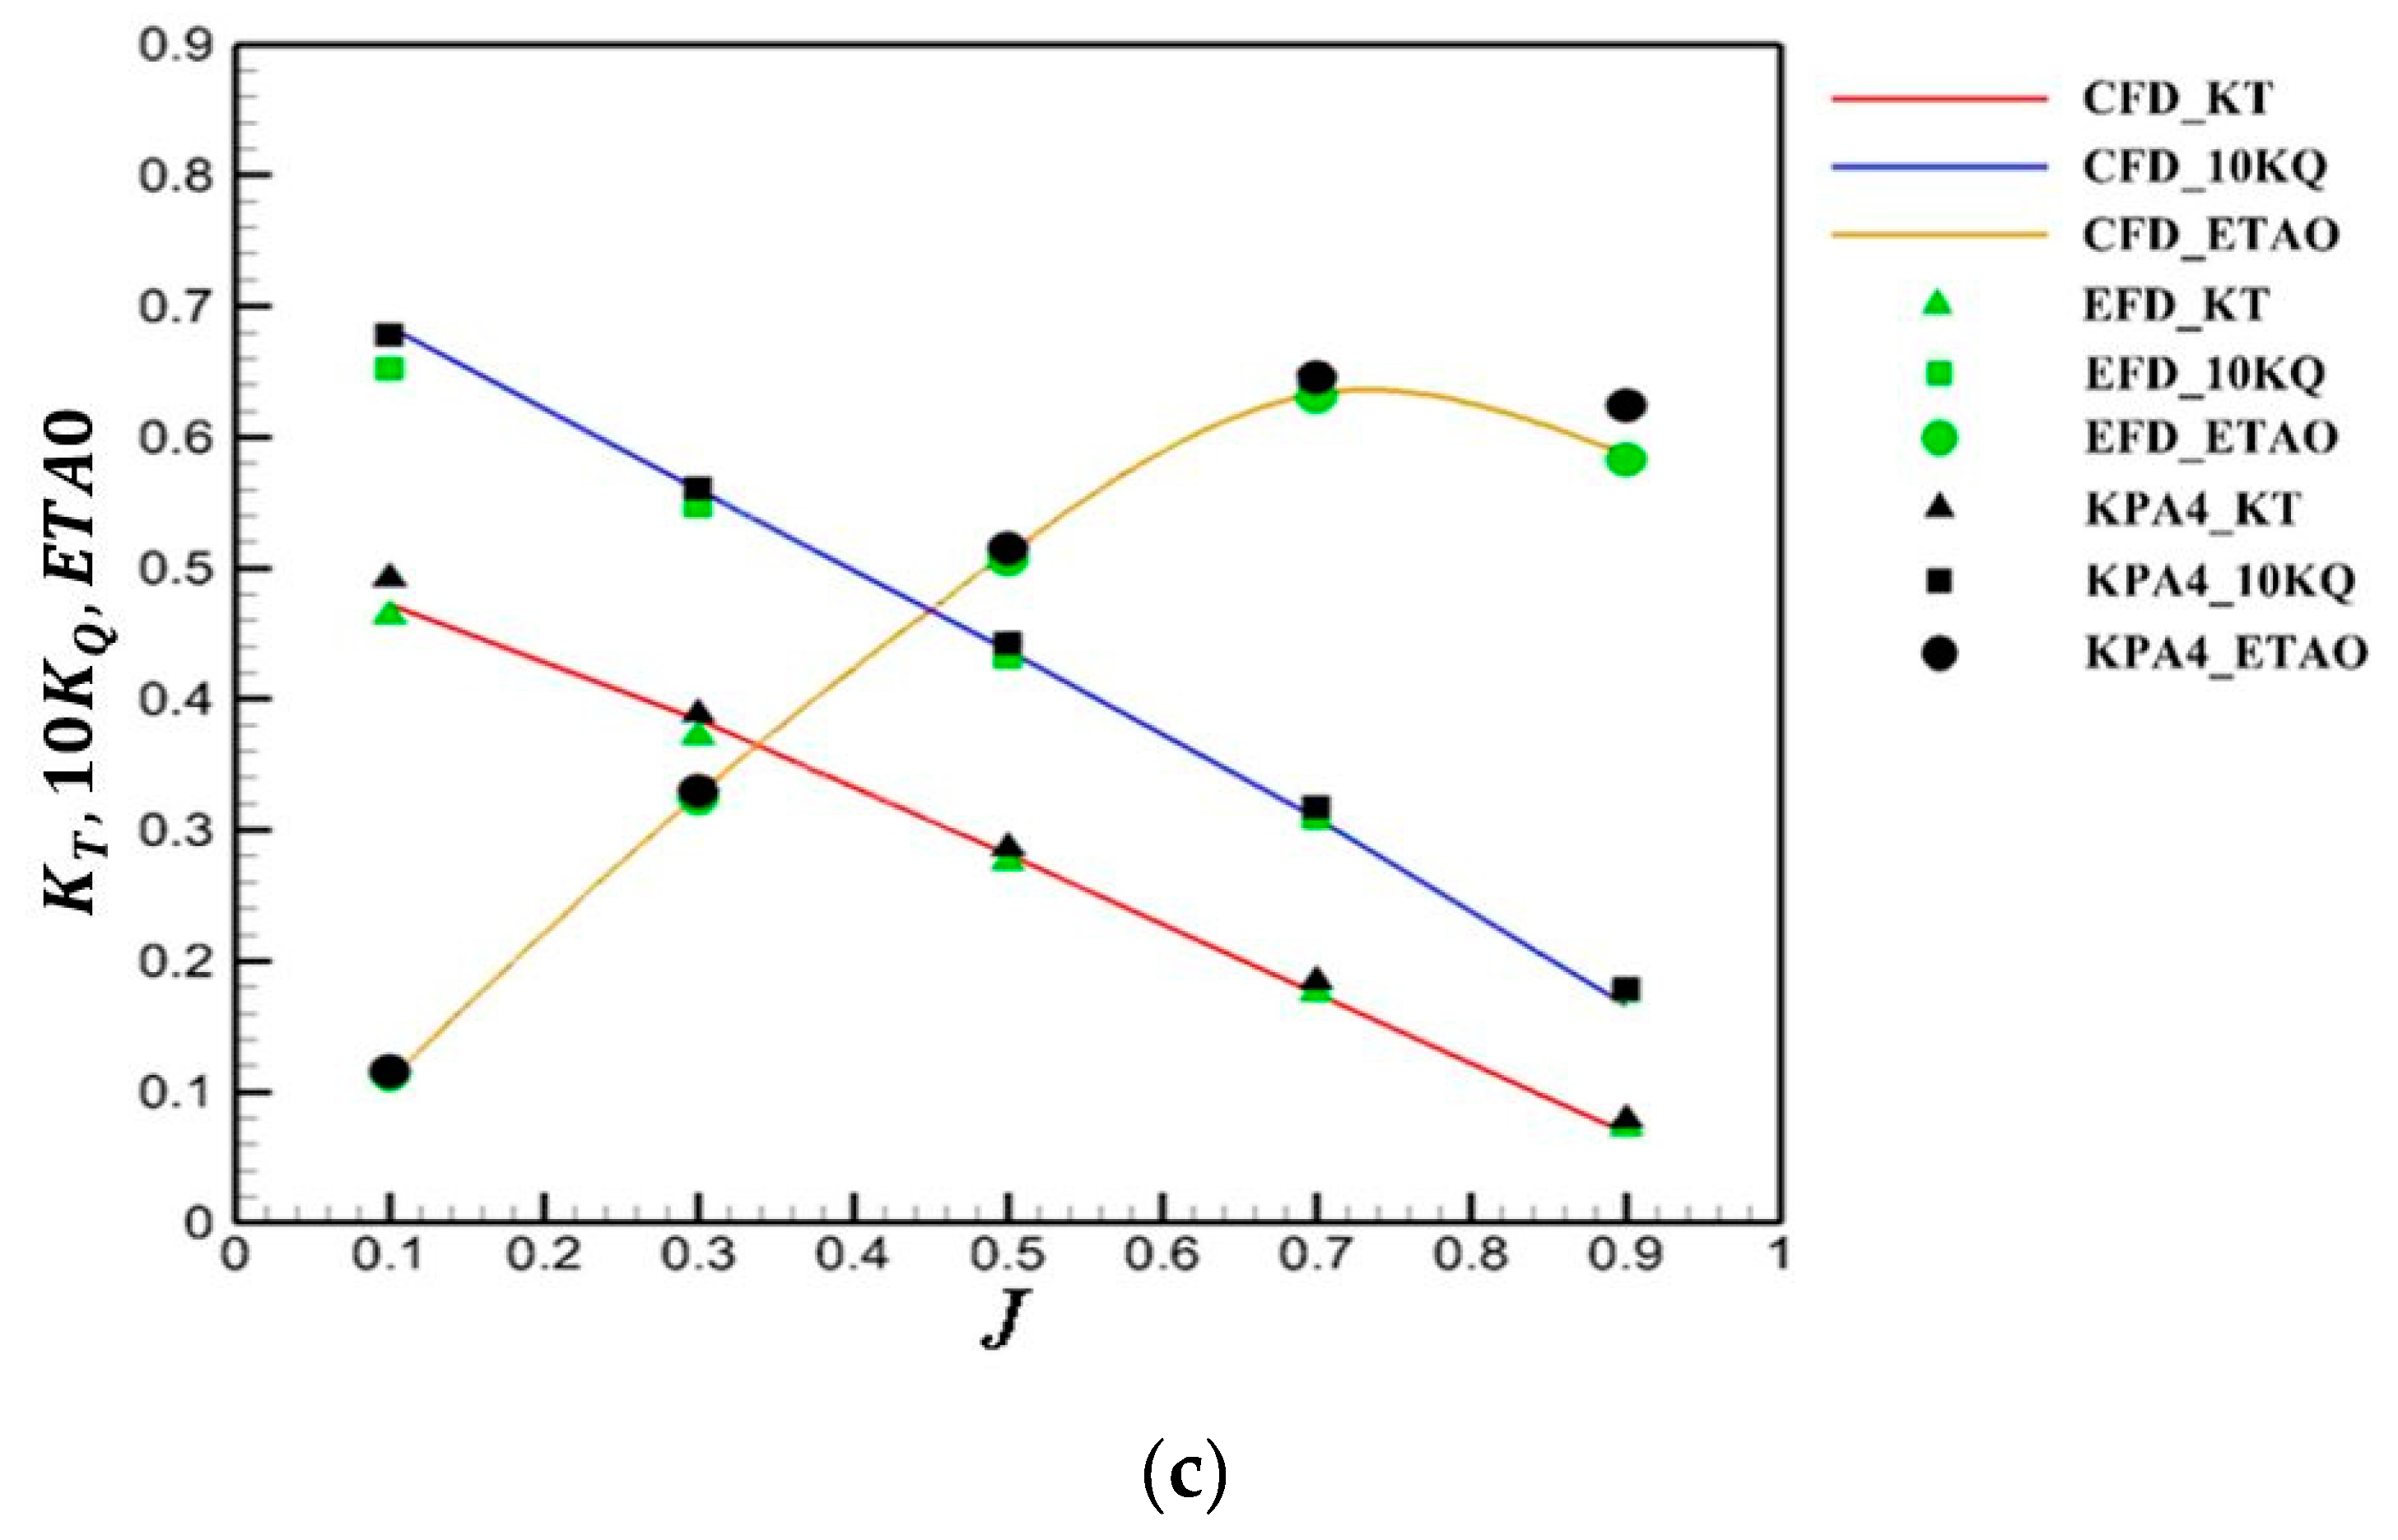
2.3. Numerical Analysis of Propeller Open Water Performance by Computational Fluid Dynamics (CFD)

Numerical analysis has been performed for the reference propeller PP016 (KP505) and the optimized forward and backward propellers, PP033 and PP034, respectively. The configurations of the propellers are shown in Figure 11. Local flow analysis of wing tip vortices was also carried out to investigate the hydrodynamic phenomena manifested by the application of rake at the wing tip (Park, et al., 2011; Baek, et al., 2014) [10,11]. For all propellers, the revolution speed was 16 rps, the same as the potential analysis case. An interval of 0.2 from J = 0.1–0.9 was used, and local flow investigation was performed at J = 0.7. Table 4 shows the POW performance of the 3 propellers in CFD analysis.
The analysis was performed using STAR CCM+, which is a commercial CFD program developed by CD-adapco. In the following equations,
u i x i = 0
( ρ u i ) t + ( ρ u i u j ) x i = p x i + x i ( ρ u i u j ¯ ) + x i [ μ ( u i x j + u j x i ) ]
xi, ui, ρ, and μ denote the rectangular coordinate system, the velocity component, pressure, density, and viscosity, respectively. The Reynolds stress term in Equation (2) is analyzed using a κ-ε model. The Semi-Implicit Method for Pressure Linked Equations (SIMPLE) was used for velocity, pressure, and ductility, and a second order differential method was applied for calculating convection and diffusion. The computation domain and boundary conditions considered in this study are shown in Figure 12. The motion of the flow analysis area was analyzed by the sliding mesh method, which is the same method used for the local flow analysis. The analysis conditions used for CFD are shown in Table 5.
The open water propeller efficiency of each propeller was compared at the same KT/J2 = 0.4725 as in the potential analysis study. The difference in open water propeller efficiency was 0.2% for the forward propeller (PP033) and 0.6% for the backward propeller (PP034) compared to the reference propeller (PP016, KP505). The results are summarized in Table 6 and Figure 13. The tendency of the computed results of the efficiency gain is different from the potential analysis and the experimental results. There is almost no quantitative difference among them. The results of the model test and potential analysis are thought to be more reliable, so it is necessary to investigate the reason for the different results. The denser grid around the tip might be necessary for capturing the tip vortex more accurately, and a parameter study of turbulence modeling might be also necessary. However, it might still be necessary to improve the present CFD analysis, the comparison of the tip vortices of the three propellers has been completed.
The vorticity magnitude is shown in Figure 14 where the backward propeller is a little weaker than the other two propellers. Although the total efficiency of the tip rake propeller is slightly worse, the backward tip rake might locally work better than the others.

3. Conclusions and Discussion

A parametric study on tip rake propellers has been completed based on the KP505, the KCS propeller, by varying the maximum size and starting rake radius. A potential based analysis code was used for the present parametric study. The optimally designed forward and backward propellers had an efficiency gain of 1.9% and 2.2%, respectively, over the reference propeller (KP505) in POW conditions. The three propellers (reference, backward, and forward) were tested in POW conditions to confirm their performances experimentally. The results are similar to the potential analysis where the propellers performed 1.3% (backward) and 0.3% (forward) better than the reference propeller, although the efficiency gain is somewhat less than during the potential analysis.
Lastly, the CFD analysis was applied to validate the performance of the three propellers. The computed results are different from the previous two cases (potential analysis and experimental test). There was efficiency loss compared to the reference propeller of −0.2% (forward) and −0.6% (backward). While there is some discrepancy in efficiency by the CFD analysis, the tip vortex flow was also investigated CFD. The tip vortex strength of the backward propeller was slightly less than those of the other two propellers (Figure 15), which is a similar result to the potential based analysis and the experimental test. More investigation into CFD analysis is expected by varying the grid system and turbulence modelling. Table 7 shows the open water propeller efficiency difference according to analysis method.
Future work extending from this study is expected to include the study of pressure fluctuations and noise from the tip vortex by changing the configuration of the tip shape so that tip rake is more effectively applied to reduce hull pressure fluctuations, especially for container ships.

Author Contributions

This paper is the result of collaborative teamwork. Project administration, Validation, Writing–original draft, Writing–review & editing, J.G.K.; Conceptualization, Supervision, M.C.K.; Visualization, H.U.K.; Investigation, I.R.S.

Funding

This work was supported by the National Research Foundation of Korea (NRF) grant funded by the Korea government (MSIT) through GCRC-SOP (No. 2011-0030013 and NRF-2019R1F1A1058080).

Conflicts of Interest

The authors declare no conflict of interest.

References

  1. Kappel, J.; Andersen, P. KAPPEL propeller development of a marine propeller with non-planar lifting surfaces. In Proceedings of the 24th Motor Ship Marine Propulsion Conference, Copenhagen, Denmark, 10–11 April 2002. [Google Scholar]
  2. Lee, J.H.; Kim, M.C.; Shin, Y.J.; Kang, J.G.; Jang, H.G. A study on performance of tip rake propeller in propeller open water condition. J. Soc. Nav. Archit. Korea 2017, 54, 10–17. [Google Scholar] [CrossRef]
  3. Ha, D.S.; Jeon, E.C.; Ahn, K.W.; Yeom, G.W. Aerodynamic analysis of various winglet shapes. In Proceedings of the Journal of the Korean Society of Mechanical Engineers 2014 Spring Conference, Busan, Korea, 15–16 May 2014; pp. 216–217. [Google Scholar]
  4. Gennaro, G.; Adalid, J.G. Improving the Propulsion Efficiency by Means of Contracted and Loaded Tip (CLT) Propellers; The Society of Naval Architects & Marine Engineers: Athens, Greece, 13 September 2012. [Google Scholar]
  5. Yamasaki, S.; Okazaki, A.; Mishima, T.; Kawanami, Y.; Yoshitaka, U. The effect of tip rakes on propeller induced pressure fluctuations first report: A practical formula to estimate the reduction rate of pressure fluctuations the application of backward tip rake. J. Jpn. Soc. Nav. Archit. Ocean Eng. 2013, 17, 9–17. [Google Scholar]
  6. Kim, M.G.; Lee, J.T.; Lee, C.S.; Seo, J.C. Prediction of steady performance of a propeller by using a potential-based panel method. J. Soc. Nav. Archit. Korea 1993, 30, 73–86. [Google Scholar]
  7. Kim, G.D.; Lee, C.S. Application of high order panel method for improvement of prediction of marine propeller performance. J. Soc. Nav. Archit. Korea 2005, 42, 113–123. [Google Scholar]
  8. Kim, K.S.; Lee, C.S. Influence of Reynolds Number on Propeller Open-Water Characteristics, Korea Inst. Mach. Mater. Rep. 1985.
  9. Kwon, J.I. A Study on Biased Asymmetric Pre-Swirl Stator for Container Ship. Master’s Thesis, Pusan National University, Busan, Korea, 2013. [Google Scholar]
  10. Park, S.H.; Seo, J.H.; Kim, D.H.; Rhee, S.H.; Kim, K.S. Numerical analysis of a tip vortex flow for propeller tip shapes. J. Soc. Nav. Archit. Korea 2011, 48, 501–508. [Google Scholar] [CrossRef]
  11. Baek, D.G.; Yoon, H.S.; Jung, J.H.; Kim, K.S.; Park, B.G. Effect of advance ration on the evolution of propeller wake. J. Soc. Nav. Archit. Korea 2014, 51, 1–7. [Google Scholar] [CrossRef]
Figure 1. (a) Kappel propeller, (b) Contracted Loaded Tip (CLT) Propeller.
Jmse 07 00386 g001
Figure 2. Rake distribution variability with radius: (a) Forward type, (b) Backward type.
Jmse 07 00386 g002
Figure 3. The side view of tip rake propellers.
Jmse 07 00386 g003
Figure 4. Comparison of open water propeller efficiency based on potential. (a) Forward propeller; (b) backward propeller.
Jmse 07 00386 g004
Figure 5. Discontinuity of the 3-dimensional configuration.
Jmse 07 00386 g005
Figure 6. Modified rake distribution variability with radius.
Jmse 07 00386 g006
Figure 7. Model propellers.
Jmse 07 00386 g007
Figure 8. Reynolds number of J during experimental tests.
Jmse 07 00386 g008
Figure 9. Comparison of model test results vs. KRISO.
Jmse 07 00386 g009
Figure 10. Comparison of open water propeller efficiency based on experiments.
Jmse 07 00386 g010
Figure 11. Three-dimensional modeling of the three selected propellers.
Jmse 07 00386 g011
Figure 12. Computational domain and boundary conditions.
Jmse 07 00386 g012
Figure 13. Comparison of open water propeller efficiency based on CFD.
Jmse 07 00386 g013
Figure 14. Vorticity magnitude (J = 0.7).
Jmse 07 00386 g014
Figure 15. Comparison of results according to analysis method. (a) Reference propeller (KP505); (b) backward propeller; (c) forward propeller.
Jmse 07 00386 g015aJmse 07 00386 g015b
Table 1. Propeller geometry of forward- and backward-type propellers.
r/RP/DRake (xG/D)Skew(°)C/Df0/CT0/D
ForwardBackward
0.180.83470.00000.0000−4.720.23130.02840.0459
0.250.89120.00000.0000−6.980.26180.02960.0407
0.300.92690.00040.0000−7.820.28090.02950.0371
0.400.97830.0031−0.0017−7.740.31380.02680.0305
0.501.00790.0101−0.0082−5.560.34030.02200.0246
0.601.01300.0174−0.0206−1.500.35730.01730.0195
0.700.99670.0200−0.02854.110.35900.01400.0149
0.800.95660.0180−0.028510.480.33760.01200.0107
0.900.90060.0119−0.018917.170.27970.01040.0069
0.950.86830.0070−0.011320.630.22250.01010.0053
1.000.83310.00000.000024.180.00018.70000.0037
Table 2. Comparison of open water propeller efficiency based on potential.
the Type of PropellersPP016 (KP505)PP033 (Forward)PP034 (Backward)
J0.6590.6620.661
η00.6140.6260.627
Diff.(%)-1.9342.207
Table 3. Comparison of open water propeller efficiency based on experiments.
the Type of PropellersPP016 (KP505)PP033 (Forward)PP034 (Backward)
J0.6460.6510.651
η00.6070.6080.614
Diff.(%)-0.2641.280
Table 4. The propeller open water (POW) performance of the 3 propellers.
JKT10KQETAO
0.10.4790.6720.113
0.30.3860.5580.330
0.50.2790.4310.516
0.70.1730.3030.637
0.90.0660.1600.596
(a) Reference propeller (KP505)
JKT10KQETAO
0.10.4720.6680.112
0.30.3840.5610.327
0.50.2810.4360.512
0.70.1750.3080.635
0.90.0680.1640.597
(b) Forward propeller
JKT10KQETAO
0.10.4800.6720.114
0.30.3850.5570.330
0.50.2780.4290.515
0.70.1720.3020.633
0.90.0650.1580.586
(c) Backward propeller
Table 5. Computational fluid dynamics (CFD) analysis conditions.
ProgramStar CCM+ (Ver. 9.04)
Governing equationReynolds Averaged Navier Stokes (RANS) equation
DiscretizationCell centered FVM
Turbulence modelRealizable κ-ε model
Velocity-pressure couplingSIMPLE algorithm
Rotation methodSliding interface moving mesh
Cell number1,600,000
Table 6. Comparison of open water propeller efficiency based on CFD.
The Type of PropellersPP016 (KP505)PP033 (Forward)PP034 (Backward)
J0.6690.6700.668
η00.6180.6170.614
Diff.(%)-−0.2−0.6
Table 7. Open water propeller efficiency difference according to analysis method compared to the results of the reference propeller.
Potential AnalysisModel TestCFD Analysis
Forward+1.9%+0.3%−0.2%
Backward+2.2%+1.3%−0.6%

