Article

The Effectiveness of Adaptive Beach Protection Methods under Wind Application

1
Department of Civil Engineering and Catholic Kwandong University, Gangneung 25601, Korea
2
Coast & Ocean Technology Research Institute, Seoul 08584, Korea
*
Author to whom correspondence should be addressed.
J. Mar. Sci. Eng. 2019, 7(11), 385; https://doi.org/10.3390/jmse7110385
Submission received: 23 September 2019 / Revised: 27 October 2019 / Accepted: 28 October 2019 / Published: 30 October 2019
(This article belongs to the Section Coastal Engineering)

Abstract

:
A physical model test was carried out to evaluate a measure of reducing sediment transport in a condition of erosive wave incidence. The erosion trend was analyzed in a beach profile consisting of 0.1 mm sand, and a scenario in which 1 mm and 5 mm materials were applied to the erosion section was conducted. The effects of beach nourishment profiles with different sand diameters were verified by comparing the results when the submerged breakwater was installed. In addition, because high waves are usually accompanied with strong wind, to determine the wind effect, morphological change was examined under waves only and the coexistence of waves and wind together. The experimental results showed that sediment transport around the shoreline decreased in a condition of nourishment with 1 mm grains, and the total amount of morphological change was similar to the case in which the submerged breakwater was installed. The results illustrated that a change in wind velocity increased the wave energy density, as well as the range of morphological change.

1. Introduction

The coastline is an important location for protecting the land from high waves, as well as for providing a recreation function for leisure and other amenities. It also maintains the ecological environment by degrading marine pollutants [1,2]. The loss of sand has occurred continuously at beaches for various reasons, such as the frequency increase of high waves, occurrence of abnormal climate caused by global warming, and imbalances in the sediment budget produced by artificial structures. Accordingly, the issue of serious beach erosion is one that confronts the whole world [3,4]. Issues like sediment transport and erosion have been discussed by many researchers, but the existence of many coasts in the world is still threatened by rises in sea levels and beach erosion, which are causing a reduction and inundation of the total land area [5]. To reduce the occurrence of these situations, many types of countermeasures are being applied; such measures can be comprehensively classified into structural and non-structural measures. Structural measures, which involve methods for effectively controlling sediment transport caused by waves and currents in a coastal region, can be classified into the hard-type method, soft-type method, and hybrid method applying both approaches simultaneously. In the hard-type method, a hard structure is installed in a nearshore area, such as a submerged breakwater, jetty, groin, or headland, thereby inducing the blockage or reduction of waves and currents in the target area and protecting the surrounding coast at the same time. However, this approach involves an enormous expense, a long construction period, and the need to carry out a detailed examination in advance to prevent against secondary damage that may occur after installation [6,7,8,9,10,11]. It also has a disadvantage in that it cannot respond actively to changes in the natural environment, such as sea level rise or external forces. The soft-type method includes artificial reefs, beach nourishment, and vegetation schemes. However, these methods have disadvantages including issues related to lack of permanence, maintenance requirements, and the fact that the period after construction is limited. These phenomena are determined by the surrounding coast’s environmental conditions. In addition, extremely limited vegetation species can be applied, and vegetation methods cannot be adapted in a region with large range of tidal variation. However, the soft-type method has advantages in that it exhibits a short construction period, low cost, and easy maintenance compared with the hard-type method. It is also eco-friendly, and there is a low probability of secondary damage occurring. Moreover, it is easier to actively respond to changes in the coastal environment with the soft-type method [12,13]. Recently, the soft-type application of nourishment has been carried out more extensively than the hard-type method has. In the case of normal sand nourishment, the aim is to maintain the shape of the target coast, but beach reshaping could occur repeatedly, so nourishment with a larger grain size is applied more frequently. Nourishment has advantages, including a long preservation period and easy maintenance. According to a previous experiment [14] and in regions where gravel nourishment has been applied, a coast with a certain width and area can be maintained [15,16,17].
Waves and currents can be considered the most important external force to be understood in the investigation regarding the mechanism of sediment transport or the reasons for erosion and the establishment of beach erosion countermeasures. Waves are classified into erosive waves and accretive waves by analyzing wave observation data and compiling and applying the statistics of the frequency of occurrence at the target coast; various situations can be predicted through simulations. The empirical formulas suggested by many researchers are currently being used and applied to the analysis of morphological changes. As mentioned above, increasing research results have recently been published based on the soft-type method. As can be seen from the observation data, nourishment with gravel has the effect of reducing the sediment transport [5,16,17,18]. In the work of [13], the researchers examined topographical variation by applying a drainage system with sand nourishment and a submerged breakwater in a physical model test. Moreover, in the literature [14,19,20], sediment transport was reviewed according to variations in particle sizes when nourishment was applied. These research initiatives were conducted under circumstances when only wave action was considered. However, as can be seen from the observational data, high waves are accompanied by strong winds. In particular, the approach of a typhoon can be considered as a good example, and cases of significant morphological change occurring at coasts affected by typhoons must be considered. Therefore, it is necessary to analyze the phenomenon of erosion according to the incident wave and review morphological change by accounting for the wind factor to carry out research that properly assesses the mechanism of sediment transport; the findings of such research can be used for establishing a mitigation plan. Nevertheless, wind-based research is limited to the measurement of waves overtopping discharge or aeolian transport [21], and most studies—especially model tests—have been carried out on the morphological change with waves. In the field, strong wind velocity is observed when a high wave occurs, so the results of an experiment carried out in conditions where waves and wind coexist will be highly similar to the real-world phenomenon. The goal of this research was to assess the influence of wave action with wind variation on morphological change by reproducing the occurrence of a high wave run-up and large-scale sediment transport in the foreshore in circumstances where a high wave hit the coast. A further goal was comparing the erosion and accretion trend between conditions with and without wind. In addition, the nourishment method based on the results of the literature [13,14,19], representing a typical soft-type method, was applied to examine appropriate measures to reduce a large degree of morphological change when it occurs on a natural coast. A submerged breakwater [13,22,23,24,25,26], which is one among various hard-type methods, was installed, and the trend of sediment transport was compared and analyzed to verify its effectiveness.

2. Movable Hydraulic Model Experiment

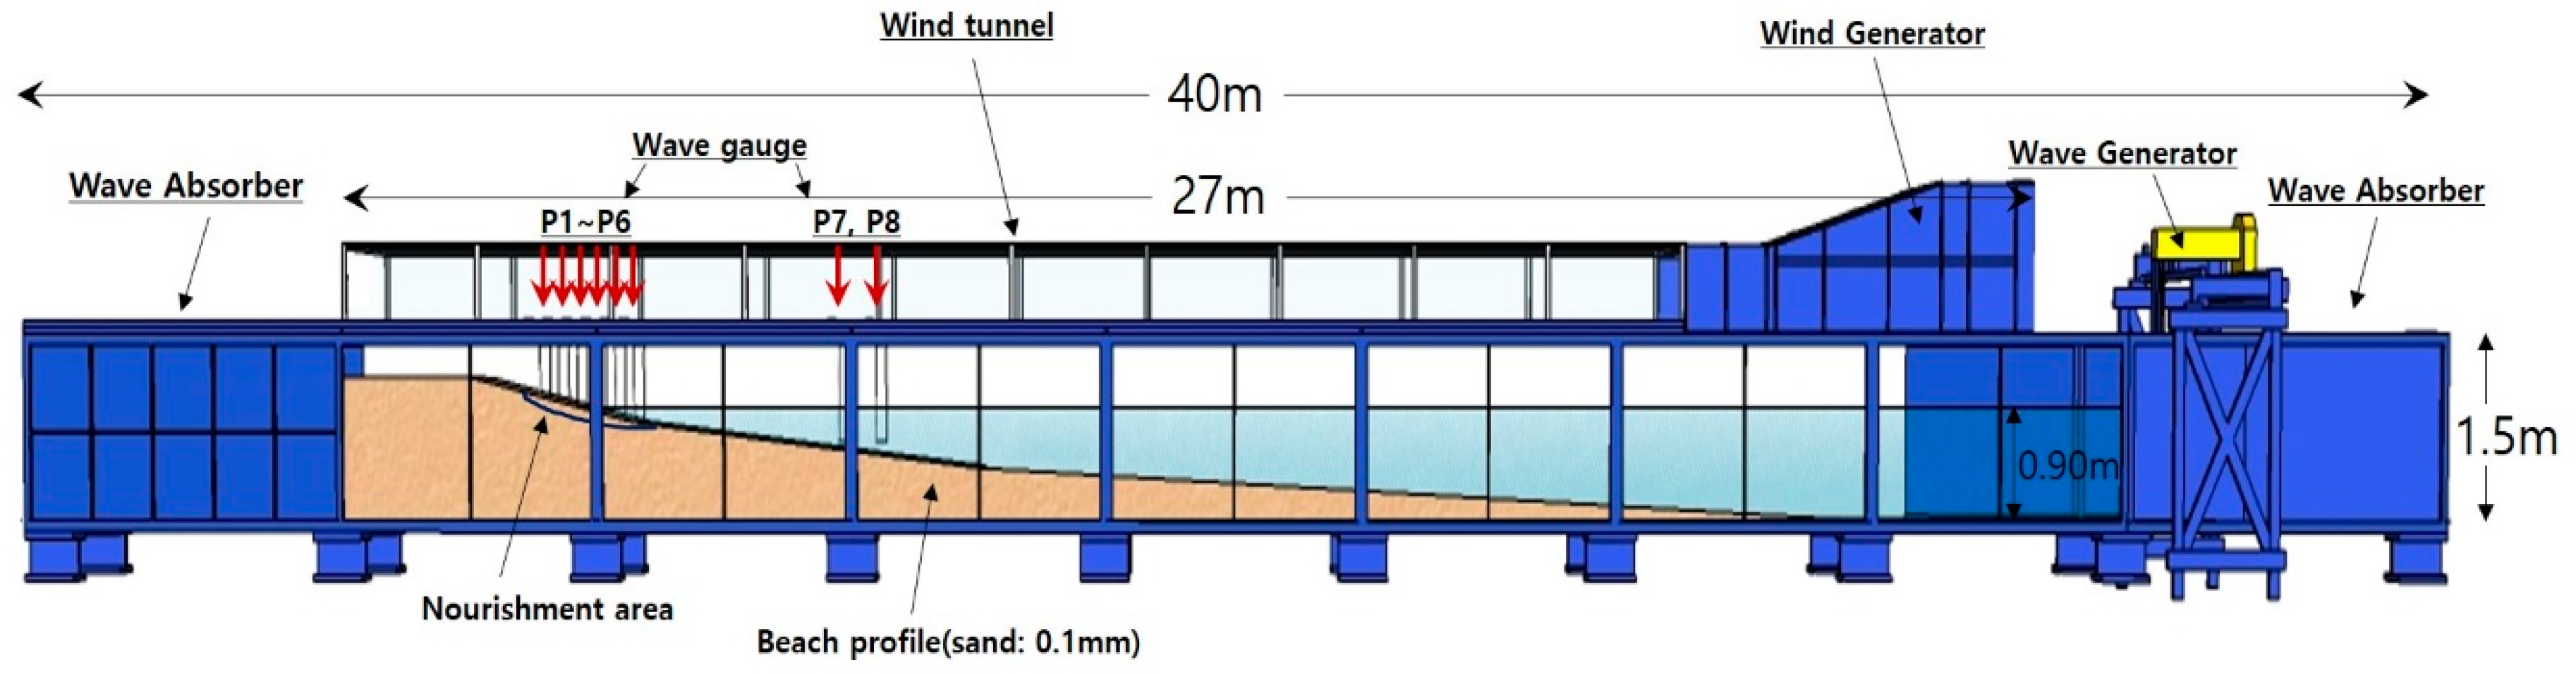
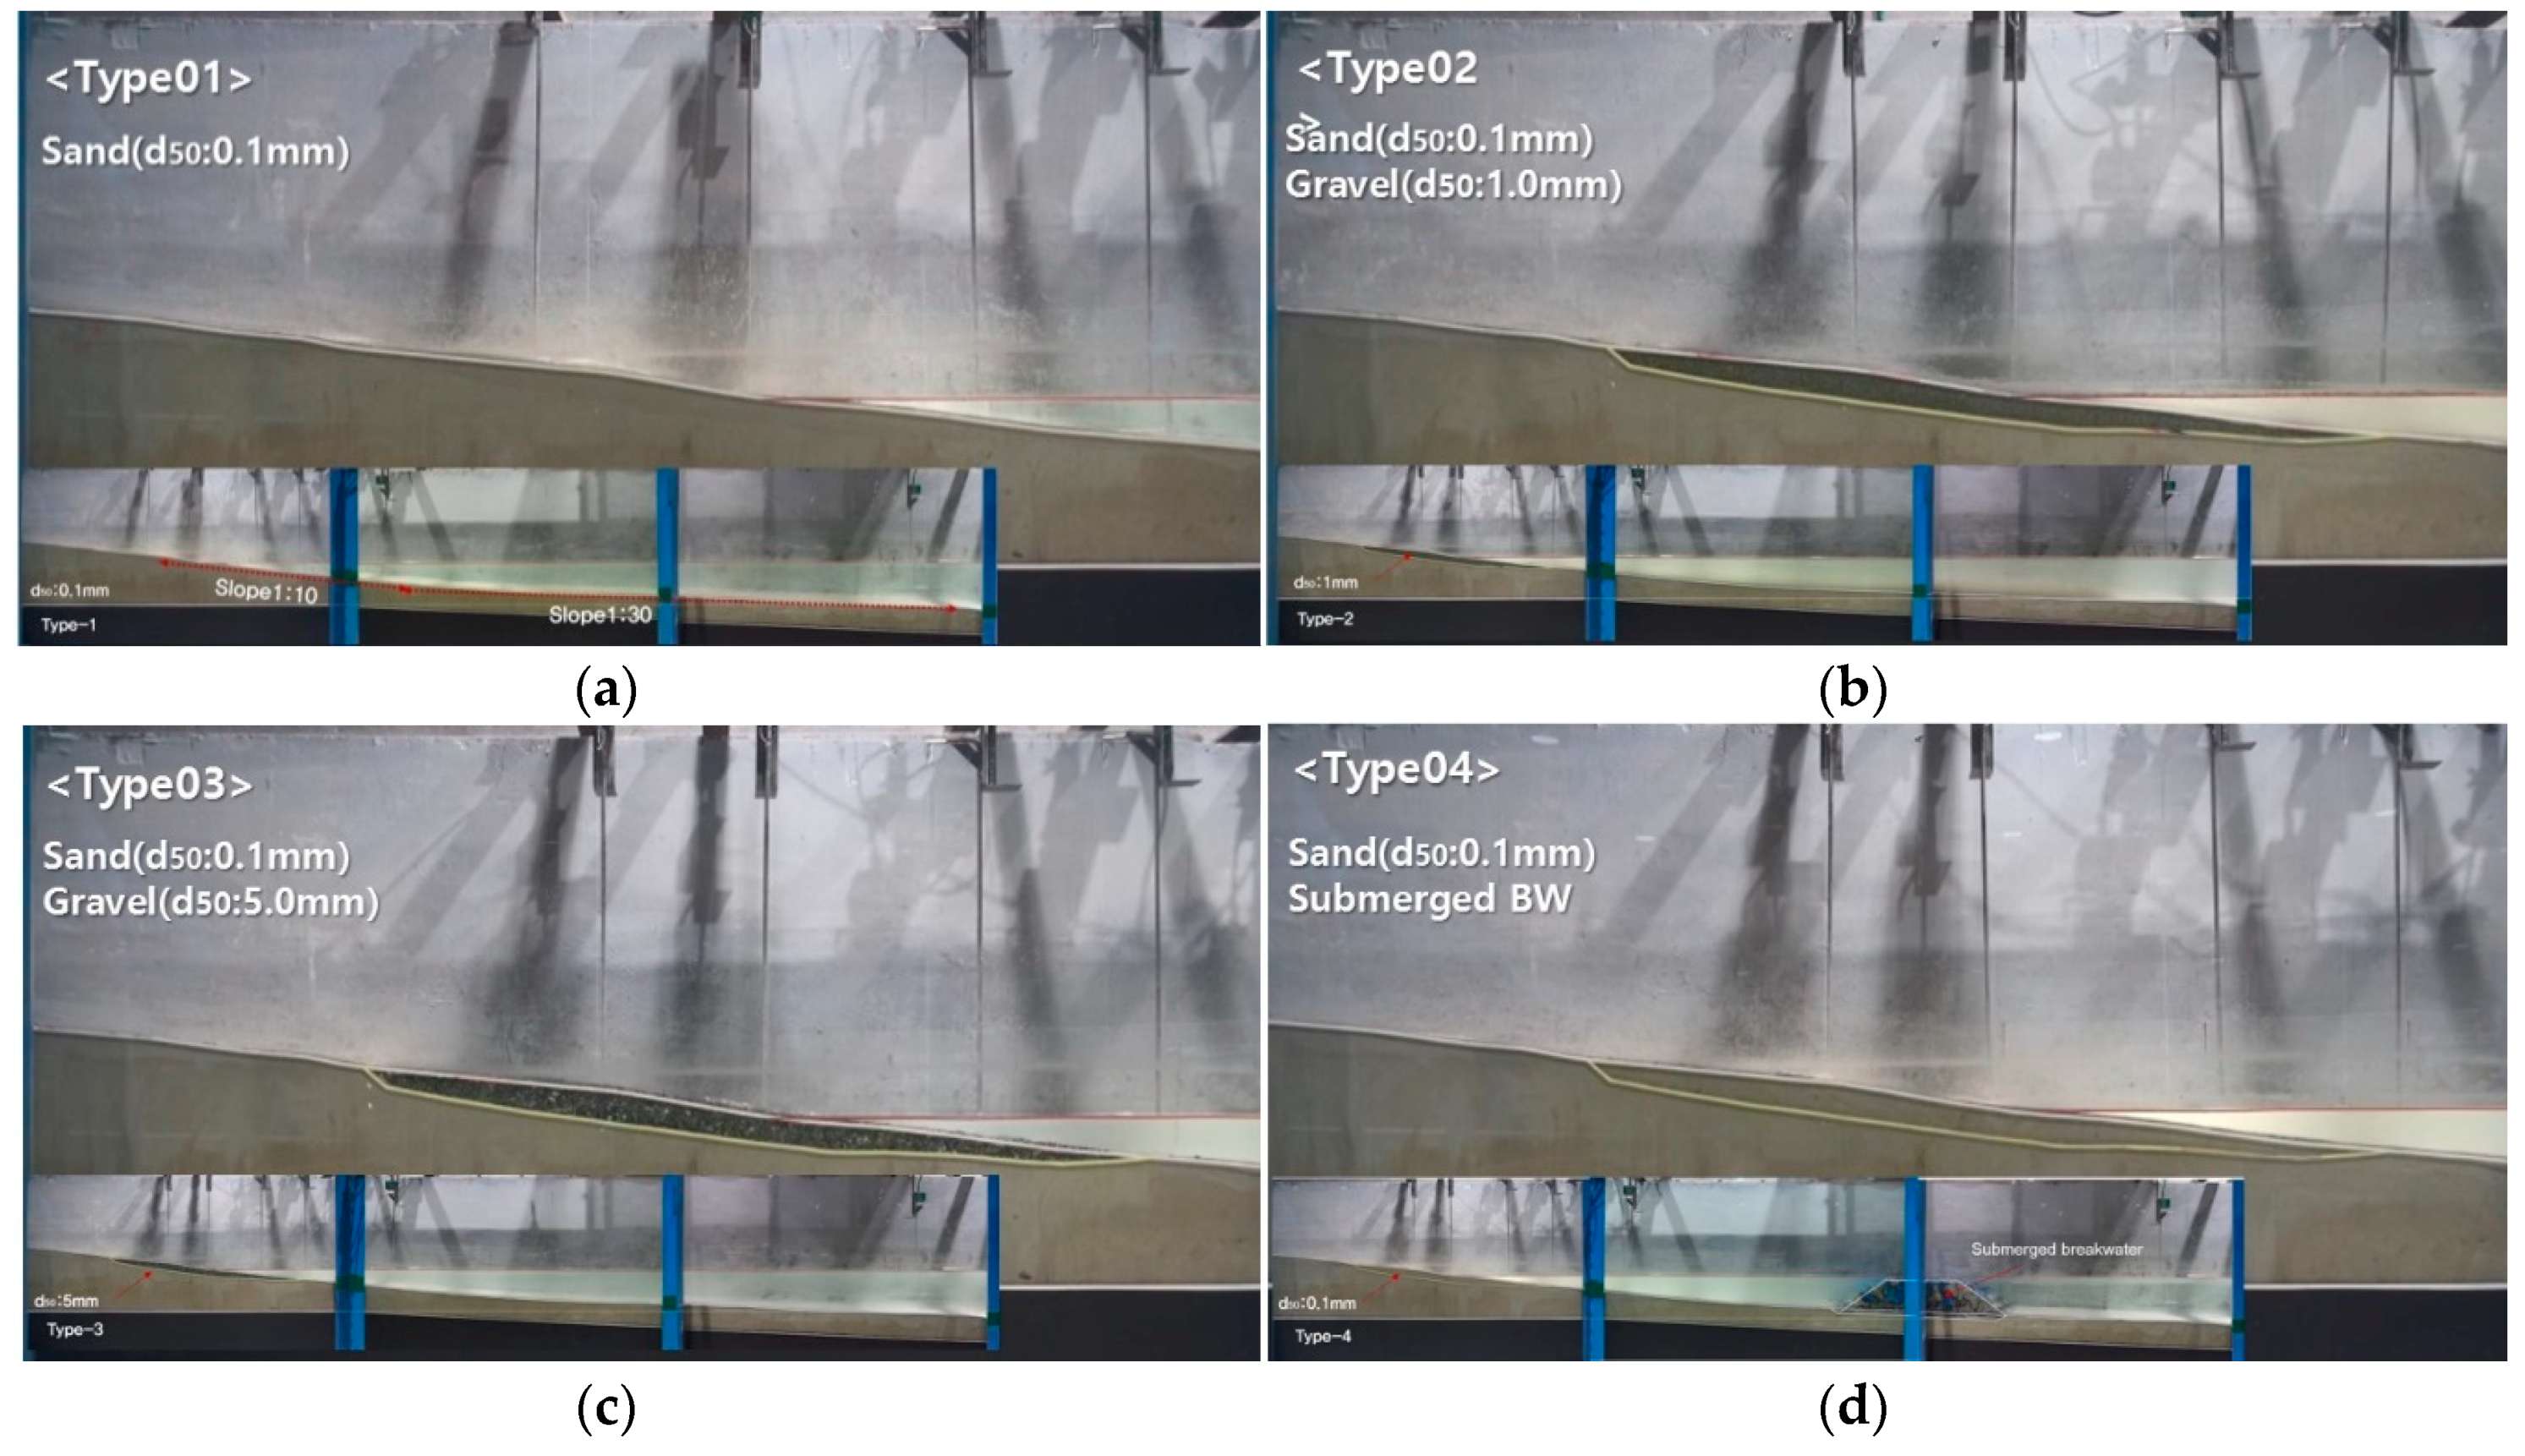
2.1. Experimental Setup
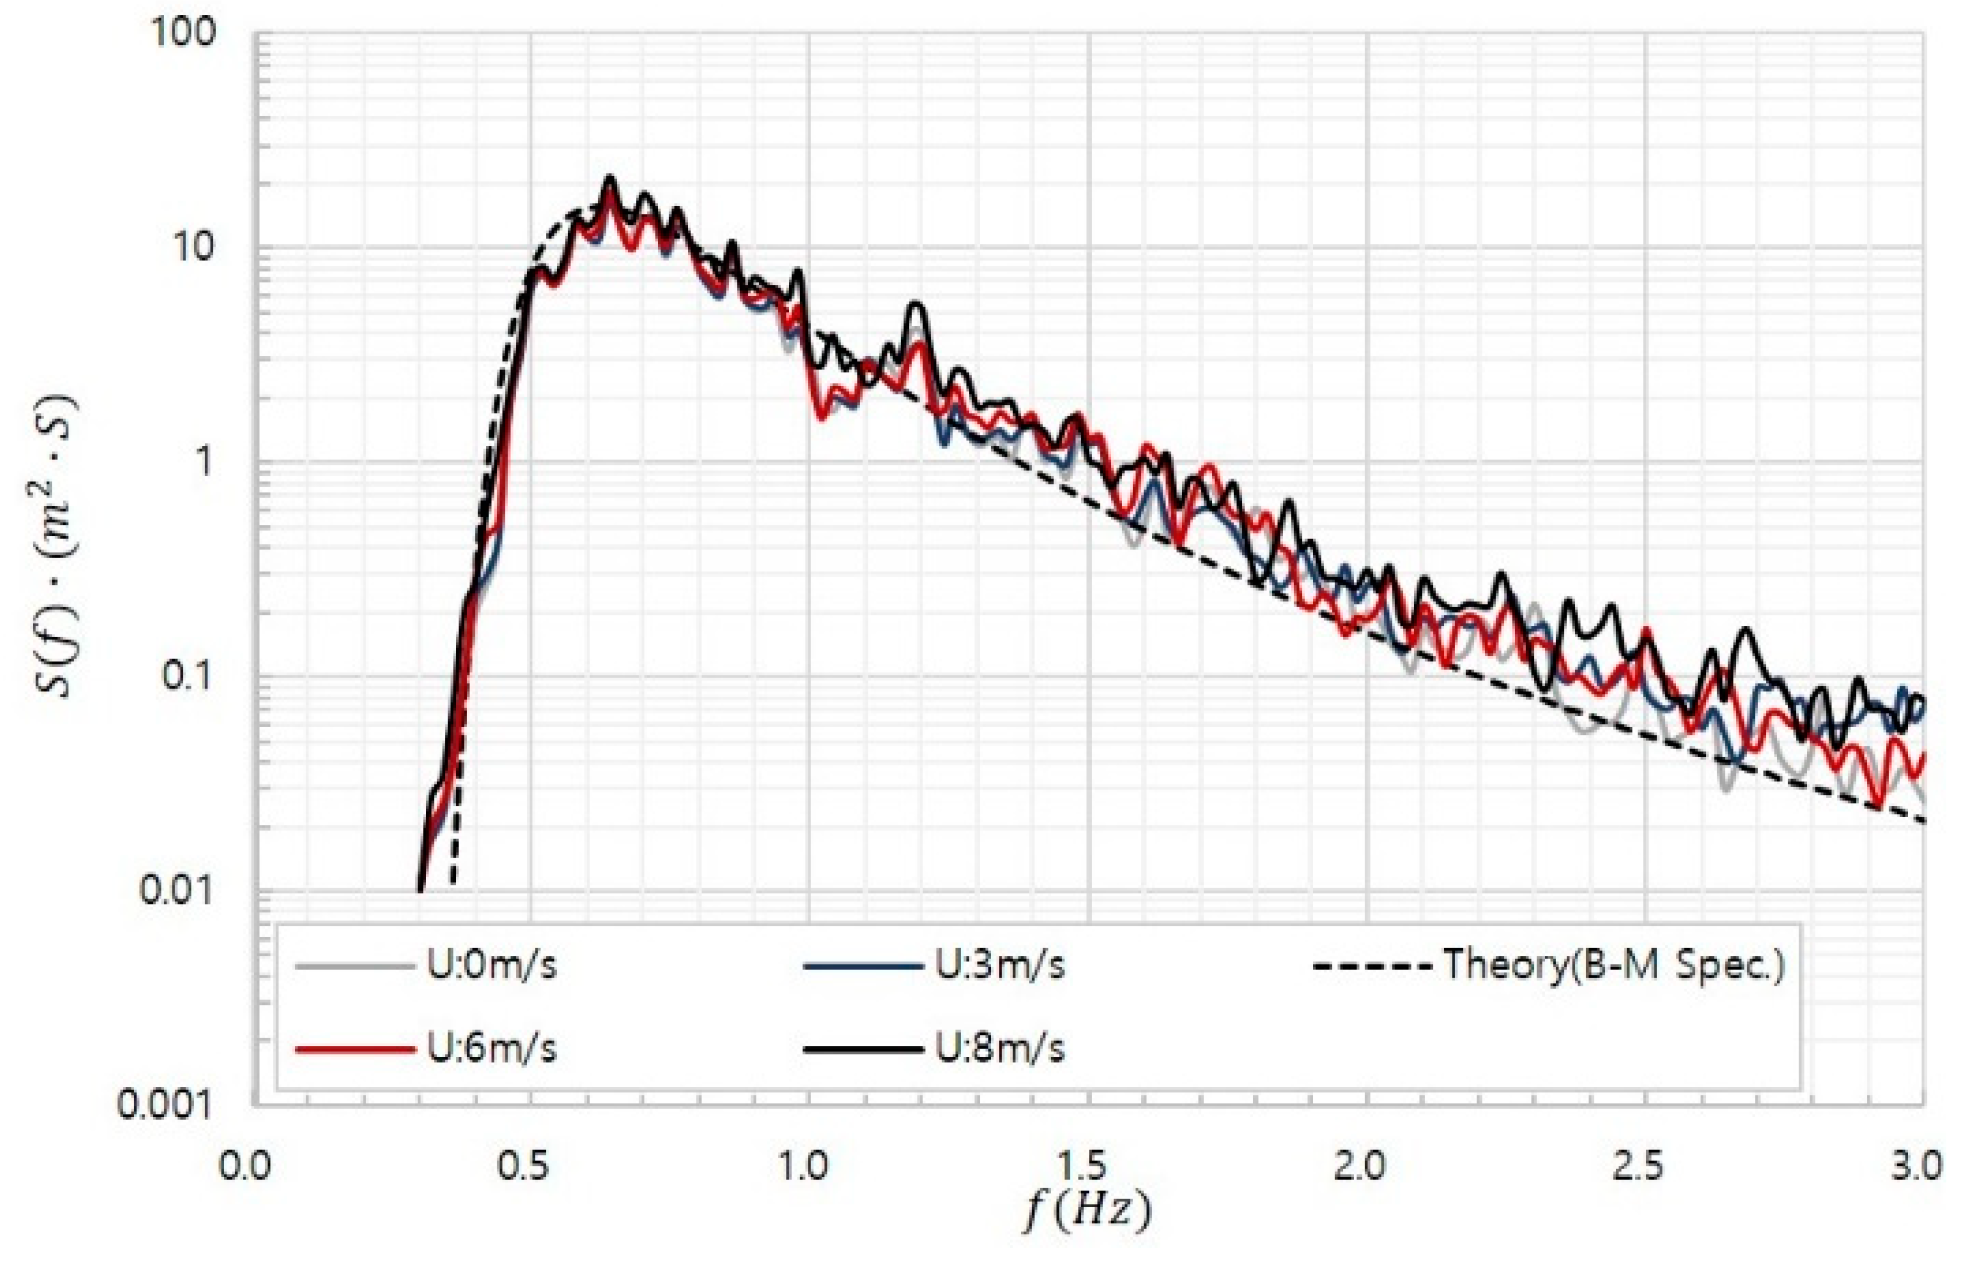
In this study, a two-dimensional physical model test was conducted to evaluate beach deformation according to external force changes and beach erosion countermeasures. The wave flume was 40 m long, 1.5 m high, and 1.0 m wide, and a wind tunnel was installed at the top of the wave operation system to reproduce a situation involving the coexistence of a maximum wind velocity of 20 m/s and a maximum wave height of 0.5 m. When a wave is created in a closed water tank, seiche or resonance phenomena may be generated owing to the grouping effect of wave reflection, standing waves, or low-frequency waves [27,28]. Porous wave-absorbing materials were installed on both ends of the water tank in this experiment to prevent such phenomena, and external factors that could occur in the wave tank were controlled using the wave-absorbing system. In the wave flume, a wave gauge is attached on the wave generating panel. If the wave is increased more than the target wave signal, the wave generating panel reduces the wave height and period to fit the signal during the test. As shown in Figure 1, it was intended to evaluate morphological changes according to different grain sizes by setting the nourishment section on an eroded area. The measurement of beach profile evolution was conducted at 0.5 h intervals for the first 0.5 h and 1 h intervals until a total of 4.5 h.
For the determination of a wave signal, erosive waves were selected after applying various empirical formulas. Preliminary tests were performed to judge whether the waves were proper for the sediment transport test. It was confirmed that the sand movement reached a quasi-equilibrium state at the end of the test (4.5 h). Various empirical formulas were suggested by the authors of [29,30,31,32,33] for the standard regarding the erosive and accretional beaches, and the experiment was carried out after evaluating the existence of erosion based on the empirical formulas suggested by the works of [31,32], which are summarized as follows:
F0 = H0/(Vt × T).
Here, F0 is the Dean number, H0 is the deep water wave, Vt is the fall velocity, and T is the wave period. When F0 < 1, accretion occurs, and when F0 > 1, erosion occurs [31].
In Formula (2),
C = H0/L0× (tanβ)0.27×(d50/L0)−0.67,
where C is the non-dimensional coefficient that determines erosion or accretion, H0 is the deep water wave height, L0 is the deep water wavelength, tanβ is the beach slope, and d50 is the median grain size. In this formula, accretion occurs when C < 4, accretion and erosion occur repeatedly in the section of 4 ≤ C ≤ 8, and erosion occurs when C > 9 for the model experimental conditions [32]. In addition to the above formula, the morphological change characteristics are evaluated using the mobility number (3) and Shields parameter (4) [34], which indicate the non-dimensional bottom friction stress:
ψ = ( A ω ) 2 / ( s 1 ) gd ,
θ = τ ^ / ρ ( s 1 ) gd = 0.5 f w ψ .
Here, ψ is mobility number, A is the water particle semi-excursion, ω is the radian frequency, τ ^ is the peak bed shear stress under waves, d is the grain diameter, and fw is the wave friction factor. At this time, the wave applied to the formulas was a wave with a high approach frequency selected by analyzing the long-term wave monitoring data [35], and three wave periods caused erosion, as presented in Table 1. However, the preliminary experiment was conducted to prevent a situation in which most sediment transport occurred at the beginning of wave generation or the equilibrium state was reached before the experiment was finished. As a result, it was confirmed that the quasi-equilibrium state was reached according to continuous occurrence of sediment transport in the condition of Case B, so Case B was selected as the experimental wave.
The wind was generated in parallel with the water surface within a range to avoid affecting the formation of a wind wave as much as possible. According to an experiment carried out previously, windblown sand may be generated on the coast when the wind velocity is 10 m/s or higher [21]. In this experiment, wind velocities of 0, 3, 6, and 8 m/s were applied to verify the effect of wind velocity change at the upper part of still water level and intensity change, such as the occurrence position of a surf zone and wave runup on sediment transport in the condition of offshore water depth of 0.9 m. A 1:10 sea-bottom slope for the section of 0–2.7 m and 1:30 sea-bottom slope for the section of 2.7–8.0 m were configured among the total reproduction range of 8 m for the profile to create erosive conditions, and the beach was reproduced with well-sorted 0.1 mm fine sand. At this time, preventing sand from being blown by wind at the section the wave did not reach owing to wave runup was included in the design. Nourishment was applied to the 110 cm section around the shoreline in the erosion range reproduced through the preliminary experiment. Median sand grain sizes of 0.1 mm and 1 mm and 5 mm crushed gravel were used as nourishment materials (Figure 2). The measured fall velocities of materials were 0.0084, 0.098, and 0.23 m/s, respectively. In addition, the submerged breakwater, which did not interrupt the landscape, was also installed away from the coast and reduced high waves in front of the coastal area. It was applied along with 0.1 mm sand in the experiment.
Many studies have shown that the morphological change was directly affected depending on the detached distance, crest width, crest depth, porosity, and shape of the submerged breakwater [22,23,24,25]. In this study, 2.6 m for detached distance from the shoreline, 0.5 m for crest width, 0.02 m for crest depth, and 1:2 for the front and rear breakwater slopes were selected, and Tetrapod (T.T.P.)—the generally used wave dissipation block—was placed in the regular manner with two layers.

2.2. Calibration

This study aimed to evaluate the effect of wind on wave propagation and wave runup, and the distribution of vertical wind velocity on the shoreline was measured before reproducing the beach profile to control the phenomena according to an increase in wind velocity (Figure 3). A digital anemometer was used for measuring the wind velocity, and it was measured at 15 positions at 5 cm intervals based on the shoreline. The experimental results showed that the wind velocity at the bottom of the shoreline decreased slightly and the wind velocity at the top of the shoreline increased. A wind velocity deviation within a range of ± 0.2 m/s occurred based on the shoreline, but it was judged that this would not affect the execution of the experiment significantly. Next, measurement was taken in conditions where only the water level was reproduced to evaluate the variation of wave energy density according to the wind velocity change when a wave is propagated. The experimental result revealed that a similar value was obtained based on the value of 0 m/s when it was accompanied by 3 m/s wind velocity, and short-term components increased as the wind velocity changed to 6–8 m/s. It is judged that such a trend resulted from the formation of an increased surf and swash zone owing to the continuous effect of wind, although the inertial force increased as the wave and kinetic energy on the surface of the water increased in proportion to the intensity of wind, creating a breaking wave in the form of a plunging wave and dispersing energy. In this experiment, eight capacitive wave gauges were installed and the wave deformation characteristics were measured to assess changes in wave height when beach deformation occurred and waves were propagated according to sediment transport. This study sought to evaluate the wave height change according to the shoreline regression and occurrence of wave runup on P1 and P2, and wave deformation according to morphological change in front of the shoreline was measured on P3–P6. P7 and P8 were installed in the open ocean to verify wave actions at a position where they were relatively deep in the water. It was judged that there would be no significant difference in the result between the condition of the coexistence of wave and wind and a change in the wind velocity and the propagation condition of only wave if the breaking wave was excluded, so the experiment was conducted based on the conditions evaluated above. It is thought that various uncertainties may exist in relation to such phenomena, because the spatial distribution for wind to reach the coast in the water tank is different from that of the real ocean. However, considering the observation result, indicating that high waves are accompanied by strong wind and sediment transport occurring on the coast simultaneously, it is thought that if the topography, wave, and wind are reproduced around the shoreline, a qualitative result could be obtained even if the scale effect issue occurs.

3. Experimental Results

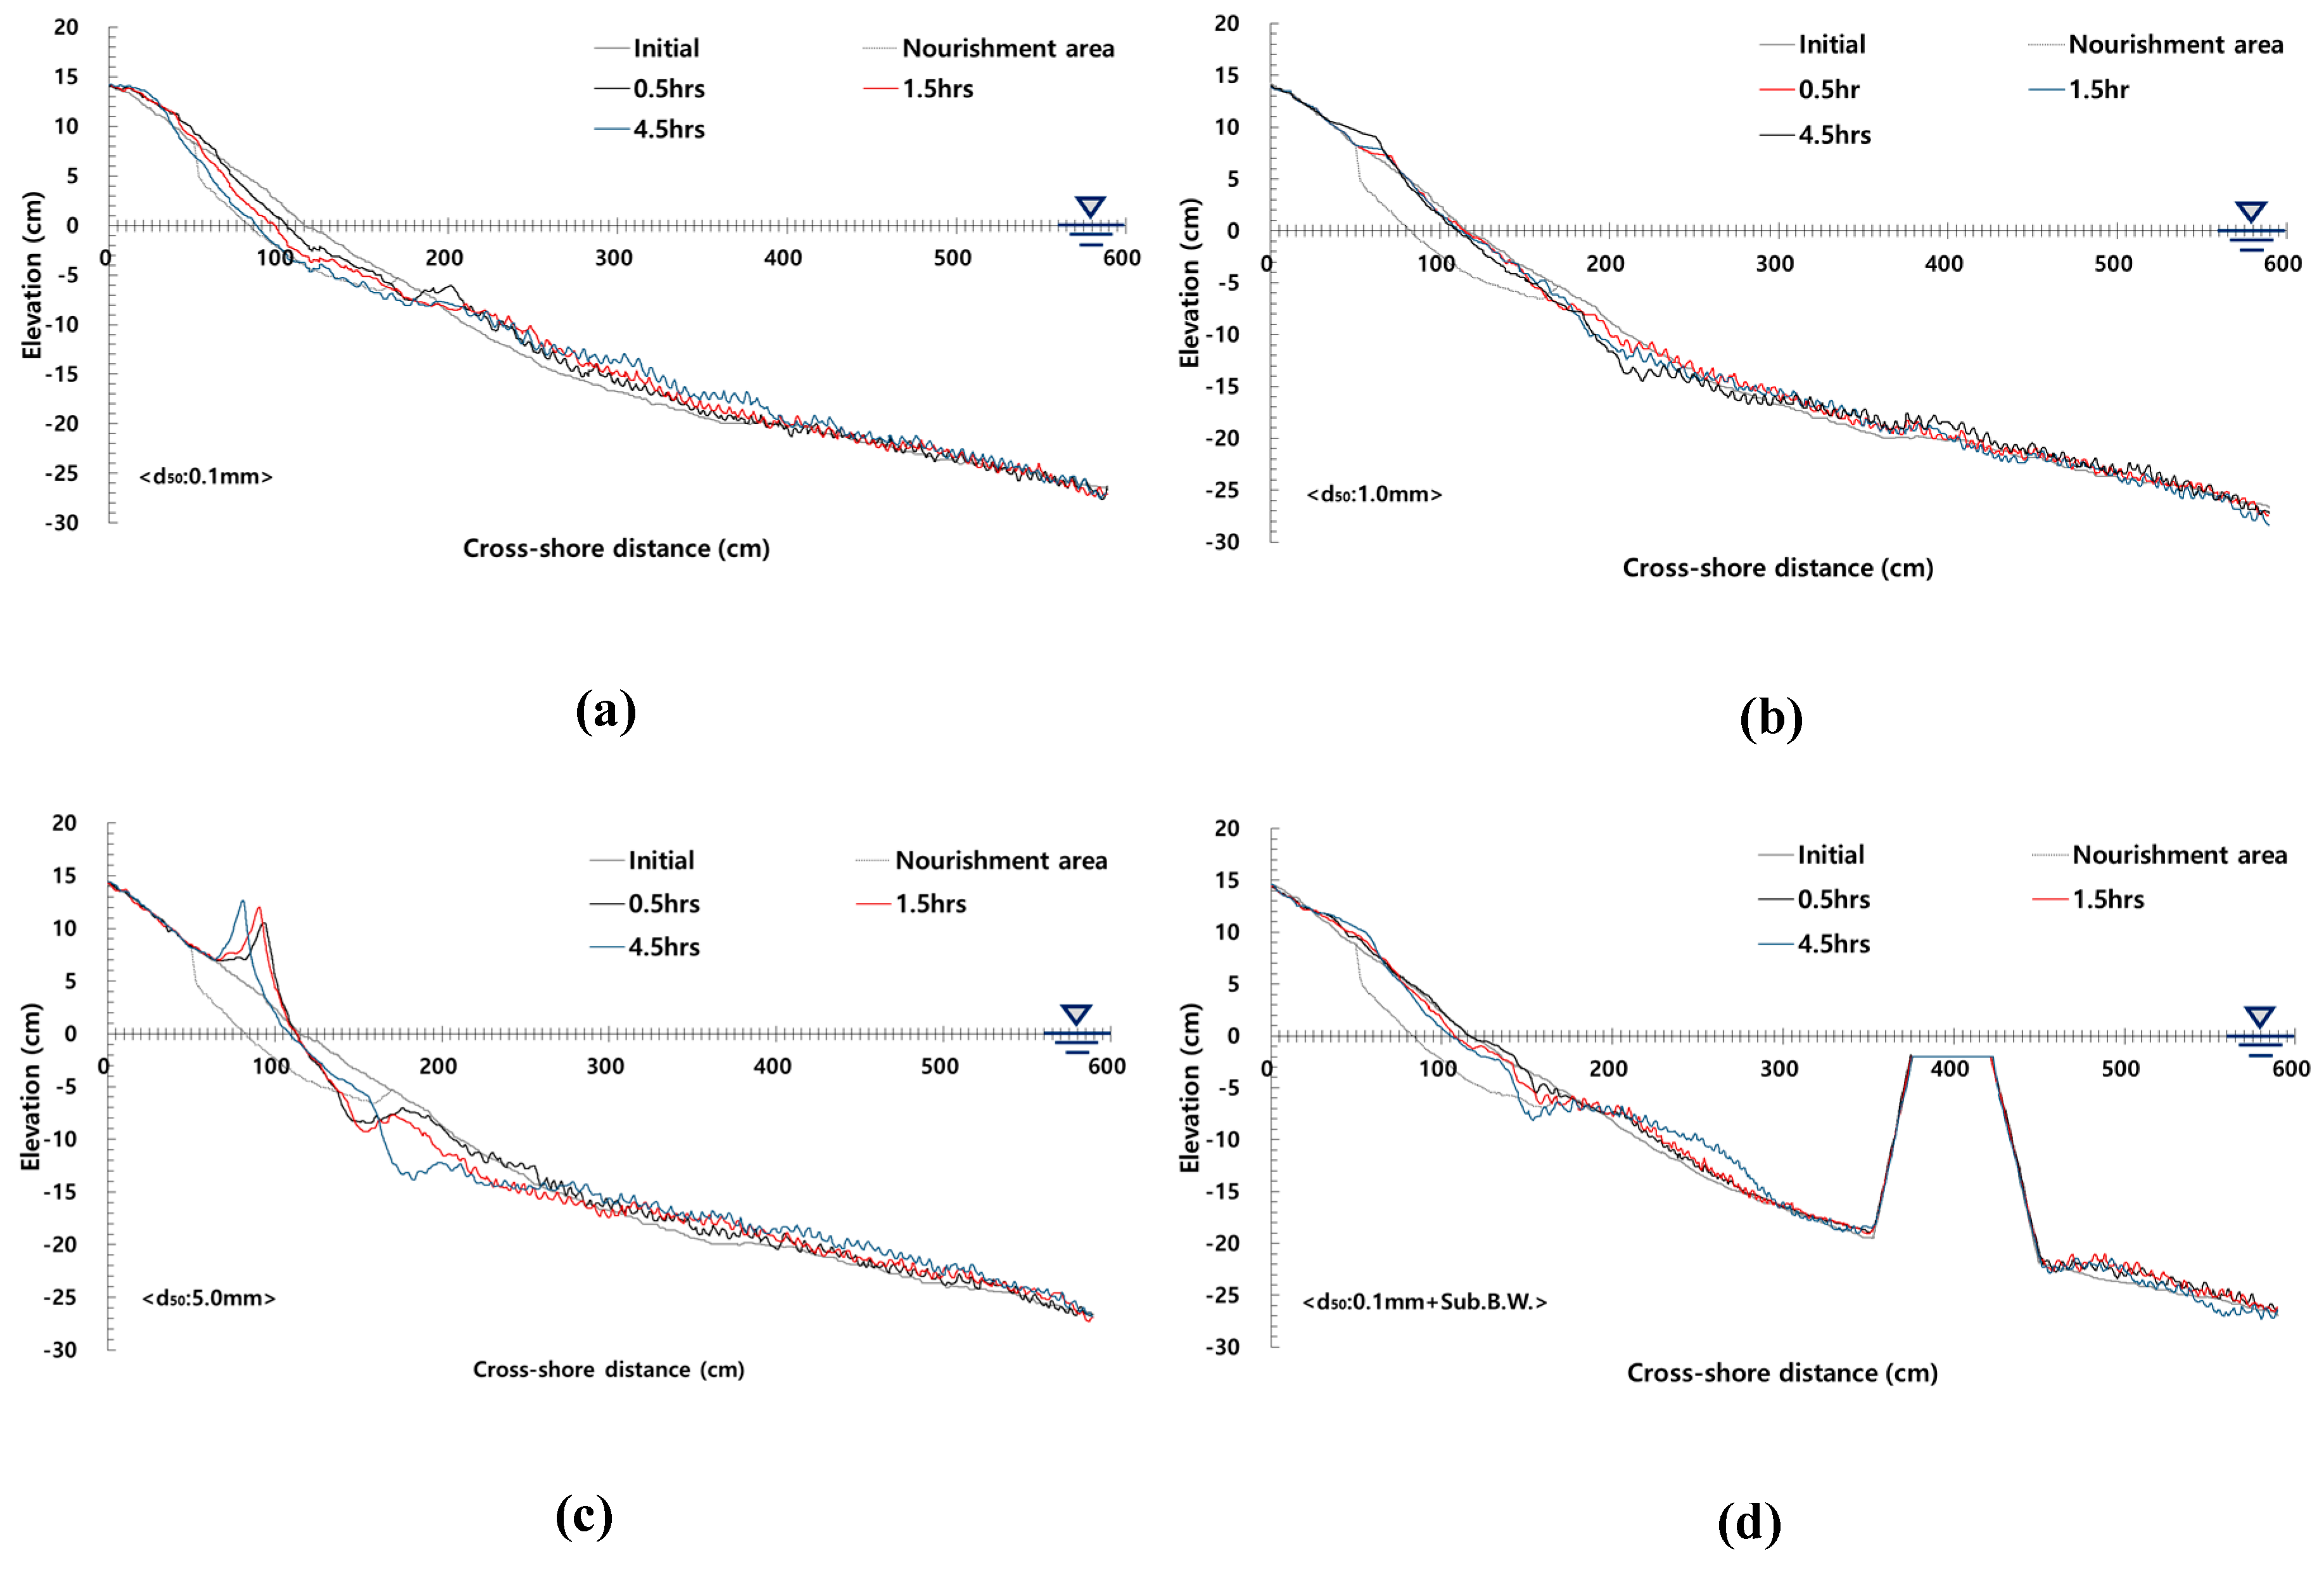
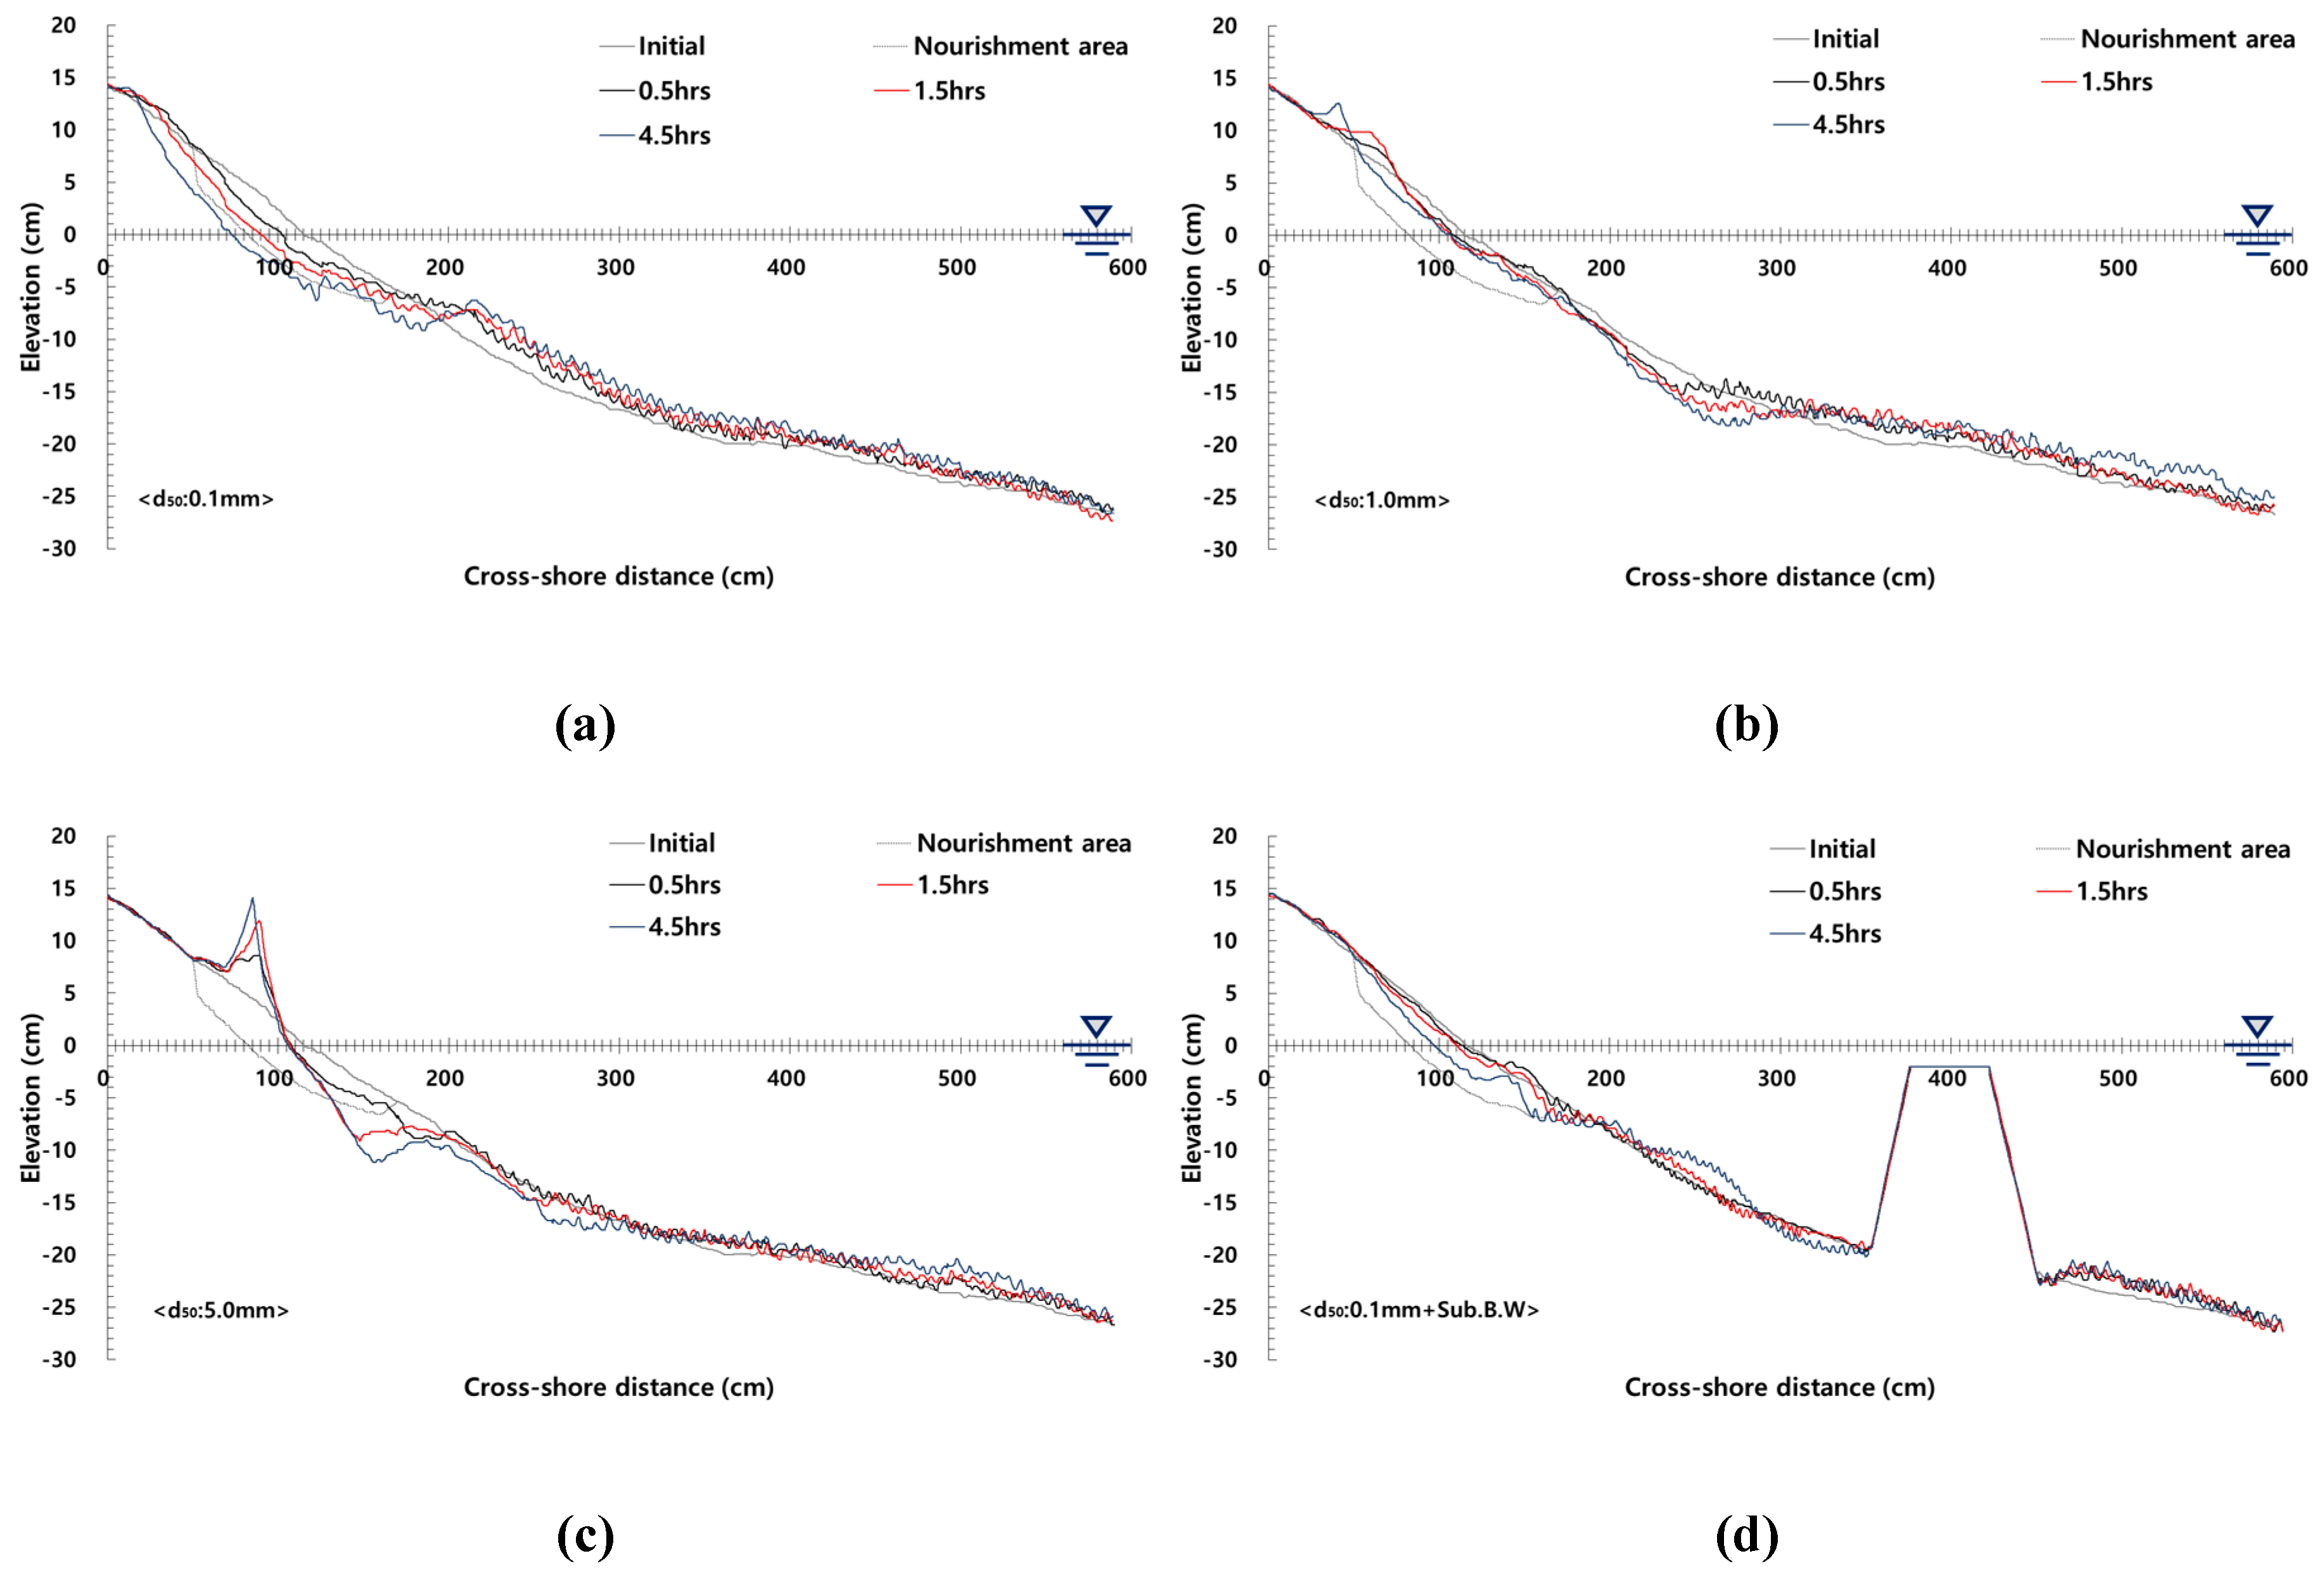
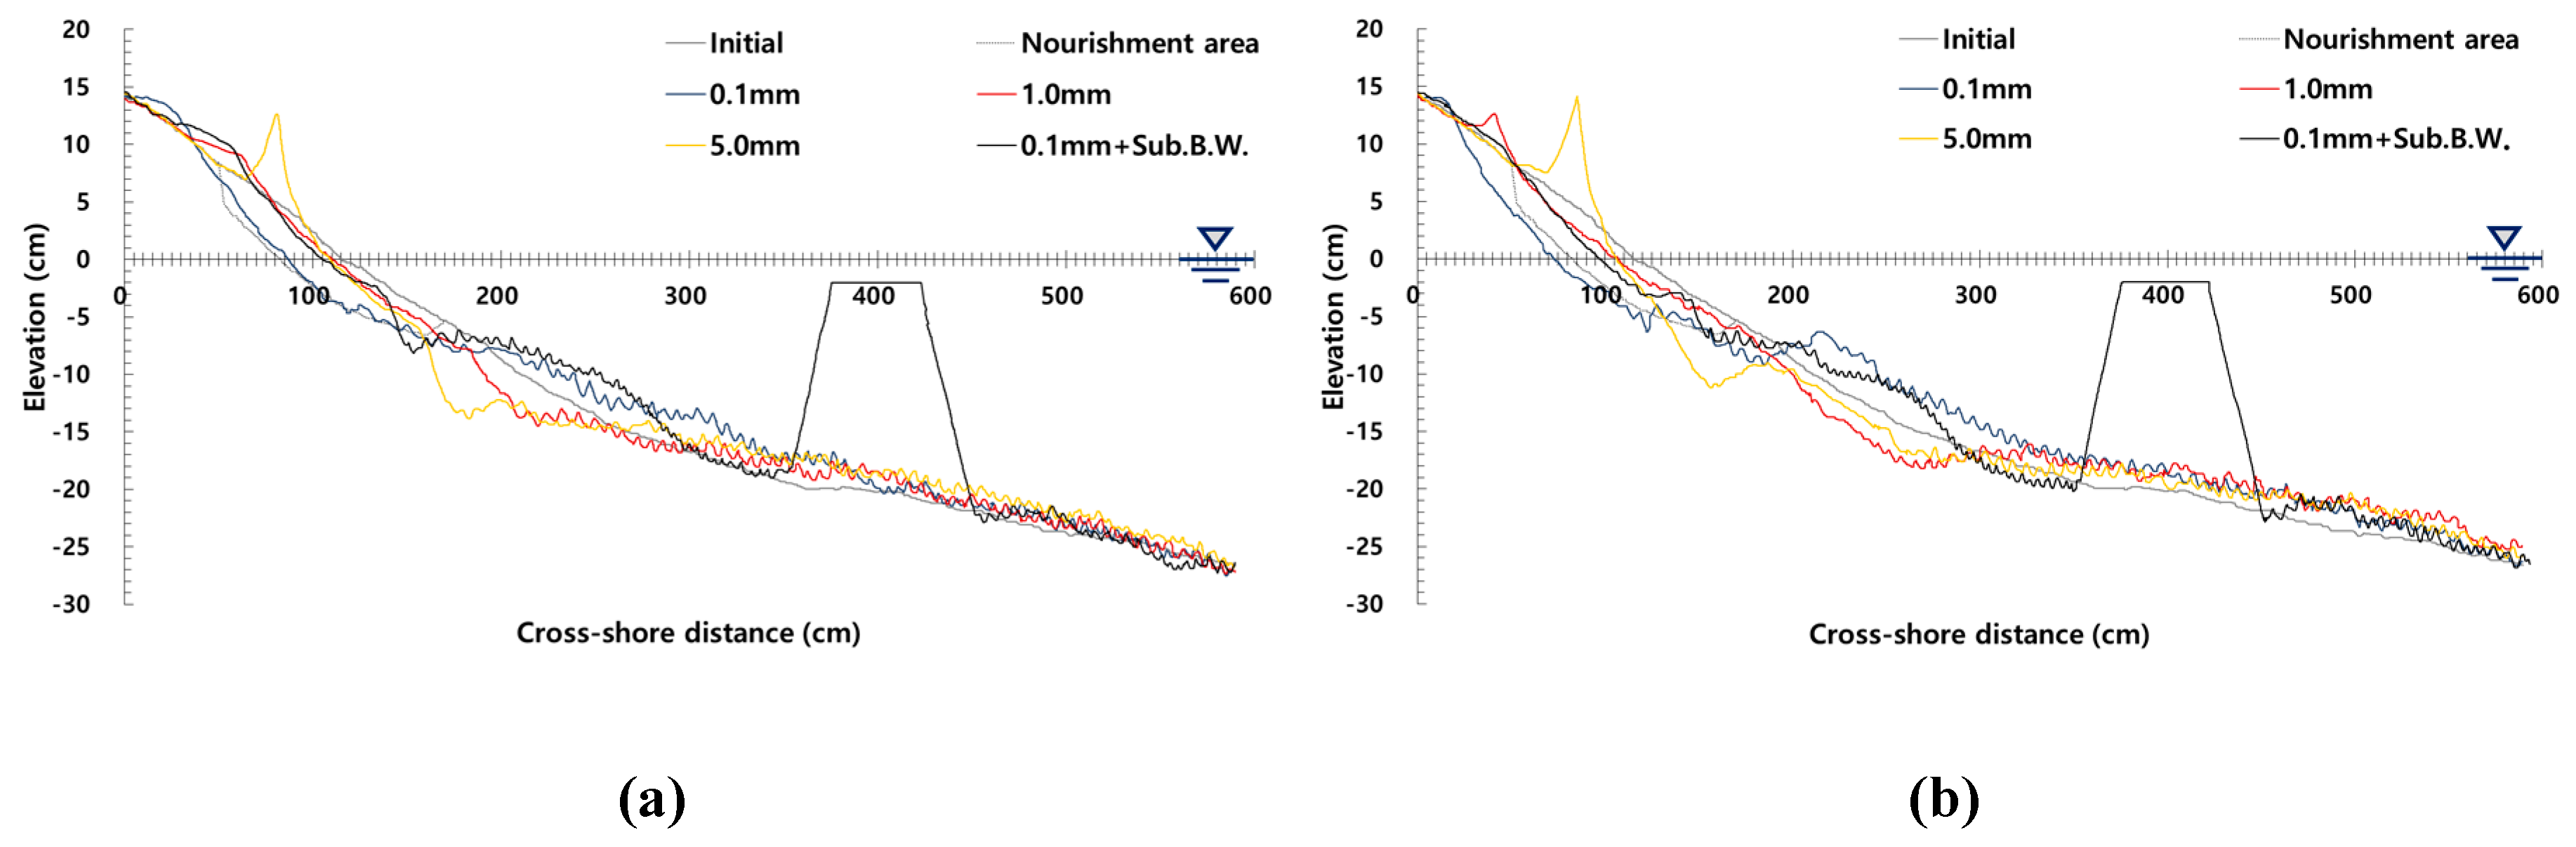
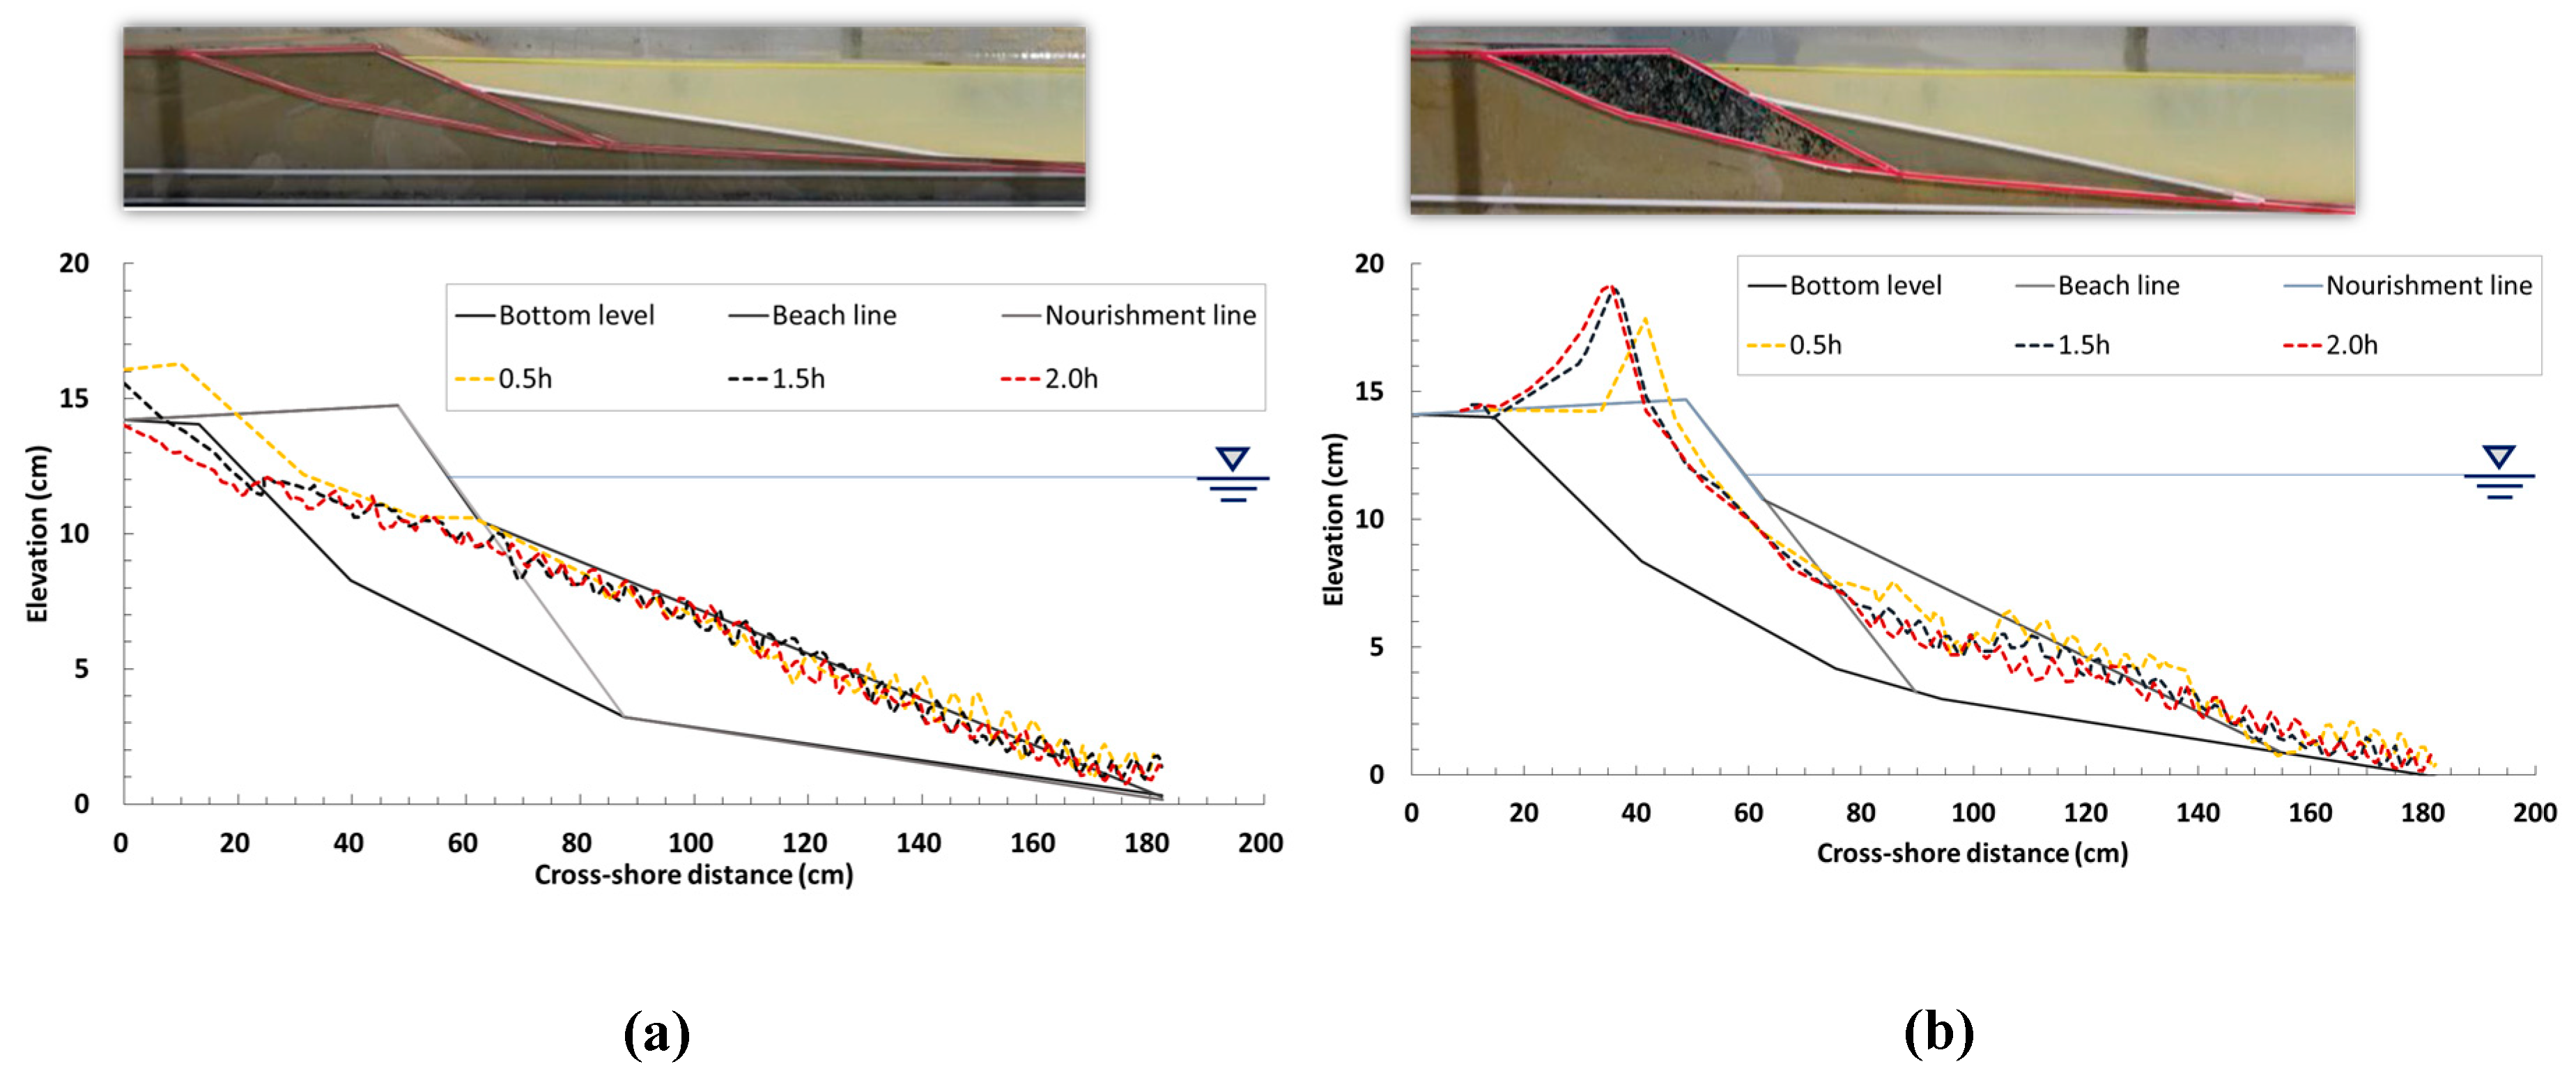
3.1. Morphological Change

In this study, the experimental result for Case B is summarized, showing moderate findings among all the test cases. In addition, the conditions of wind velocities of 0 and 8 m/s, where a clear difference occurred according to wind change, are illustrated. The results of the morphological change after 0.5 h, 1.5 h, and 4.5 h measured at the center of the water tank are shown in Figure 4 and Figure 5. For the whole beach profile consisting of 0.1 mm sand in the no wind (U = 0 m/s) condition, the erosion occurred around the shoreline in proportion to the duration of the incident wave, and eroded sand was transported to the seaside. For the result after 4.5 h and when a quasi-equilibrium state was reached, the shoreline retreated approximately 30 cm from the initial topographical conditions and loss of sand occurred in a wide area from the foreshore to the backshore. Meanwhile, transported sand formed a sandbar at a position 2 m away from the shoreline of the final profile. If the erosion section was replaced with 1 mm sand, an extremely small morphological change occurred in the foreshore area. Eroded sand near the shoreline was transported landward, forming a dune, and drift sand in the foreshore below the water surface was transported to the offshore by 4 m, forming a bar. The shoreline retreated by approximately 5 cm at the end of the wave duration. Especially, a significantly lower amount of morphological change occurred in comparison with the 0.1 mm sand profile. The 0.1 mm sand was transported by the wave runup and rundown after the sea bottom was suspended instantaneously by the breaking wave. However, the gravel with d50 1 mm was suspended instantaneously when a wave broke near the shoreline, while sediment transport decreased, as this is less affected by uprush and downrush owing to the fast fall in velocity. However, wave runup was accelerated when it returned to the seaside, and a strong undertow owing to rundown affected the deposit (0.1 mm) located at the boundary of the nourishment section, creating scouring over a wide range. When the grain size was replaced with 5 mm gravel, a dune with a large amount of gravel was created at the beginning part of the wave action; its magnitude increased and it was transported to the rear side as time passed, creating a steep front slope. Unlike 0.1 and 1 mm sand, 5 mm gravel was transported gradually to the leeside by impact, without being suspended, although the wave applied direct impact to the particles, and overlapped particles were deposited in the nearshore area owing to friction and accretion (cohesion), rather than being transported to the leeside continuously. Large-scale accretion occurred from the shoreline to the land side after the last 4.5 h, and the shoreline retreated by approximately 5 cm from the coast. In the foreshore section under sea level, the wave rundown was accelerated by a steep slope, creating undertow owing to a strong runup phenomenon, and sand transported by the strong undertow was deposited at a position of 300–600 cm, forming a sandbar. When comparing the above phenomena with the submerged breakwater installation condition, gradual sediment transport occurred near the shoreline because of waves, and the shoreline retreated by 10 cm at the end of the wave generation. A sand dune was formed in the backshore, and erosion occurred in the foreshore according to the formation of a surf zone. Transported sand formed a thick sandbar in the range of 200–300 cm (x direction), and the overall range of morphological change decreased significantly in comparison with the condition of 0.1 mm.
A large amount of sediment transport occurred from the beginning part of the experiment under the 0.1 mm profile condition in circumstances where there was an accompanying 8 m/s of wind shown as Figure 5, and sand was transported over a wide area, exceeding the nourishment section at the end of the wave duration. The erosion range was mostly from the backshore to the position of 200 cm, and the shoreline retreated by 45 cm. Transported sand formed an approximately 5 cm high thick sandbar at the position of 200 cm as the x distance. The result of the experiment with a 1 mm material size revealed that the range of morphological change occurred at the beginning of the wave action owing to the effect of wave energy by the wind effect, which increased in proportion to the duration of the wave, and a sand dune forming on the backshore. The shoreline retreated by 10 cm, and less sediment transport occurred from the shoreline to the position of 200 cm in the foreshore owing to the effect of replaced particles. Large-scale scouring occurred as a result of the effect of a strong undertow after 200 cm, and scoured sand was transported to the seaside, forming a sandbar. The result of the experiment with 5 mm gravel showed that a large-scale gravel dune was formed from the part adjacent to the shoreline to the point of the nourishment section (x: 50 cm), and the dune size increased in proportion to the wave duration, while the front slope became steep. When the experiment ended, an approximately 10 cm high gravel dune was formed, and the shoreline retreated by 10 cm. Scouring occurred over a wide range owing to a strong downrush in the foreshore, and up to 9 cm of scour depth was formed at the position of 155 cm. In addition, the loss of sand occurred up to the position of 300 cm (X distance), and the transported sand accumulated at the seaside. When a submerged breakwater was installed on a sandy beach, the range of initial morphological change was not large, but sediment transport occurred based on the foreshore section at the end of the test. The range of morphological change in the foreshore area was larger, although sediment transport also occurred at the upper part of the shoreline owing to the effect of wind. This happened because the wave energy, diminished by the submerged breakwater, was being developed because of an increase of the x-direction component by the wind; then, the wave energy broke in front of the shoreline, and the intensity of the wave runup decreased as a result of dispersed wave energy. Transported sand was deposited to the seaside, and some of it was transported into the submerged breakwater.

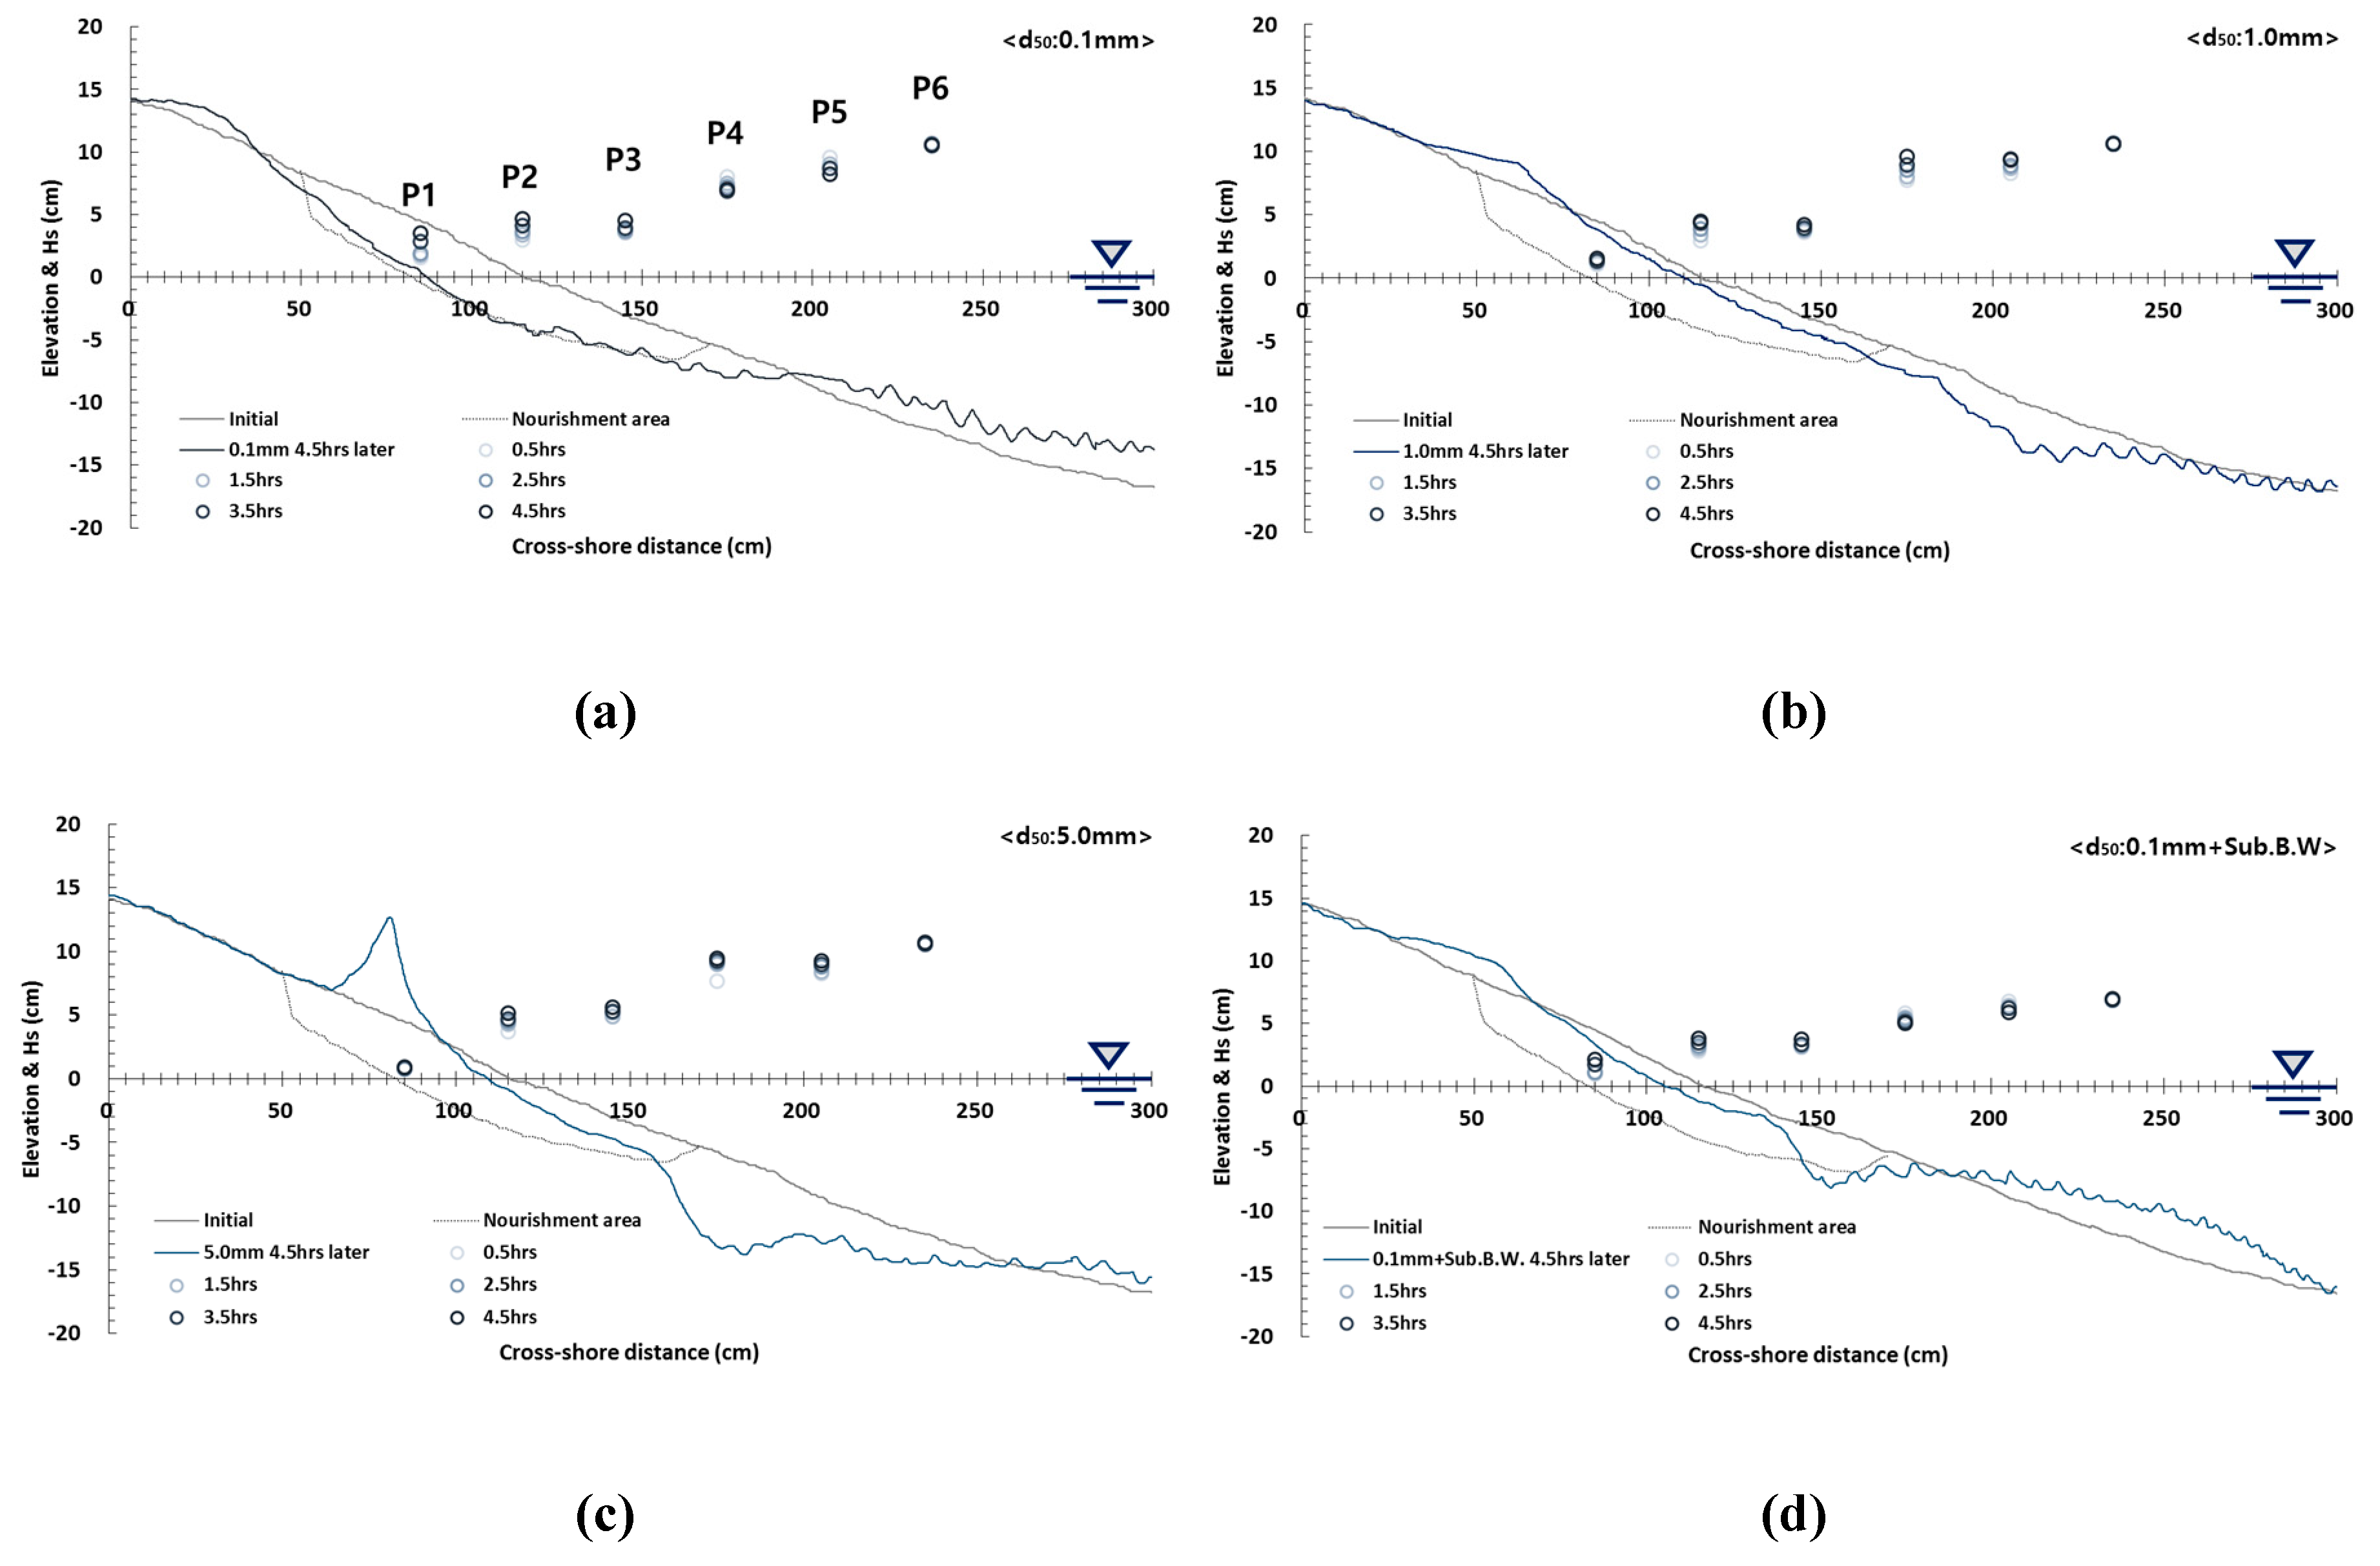
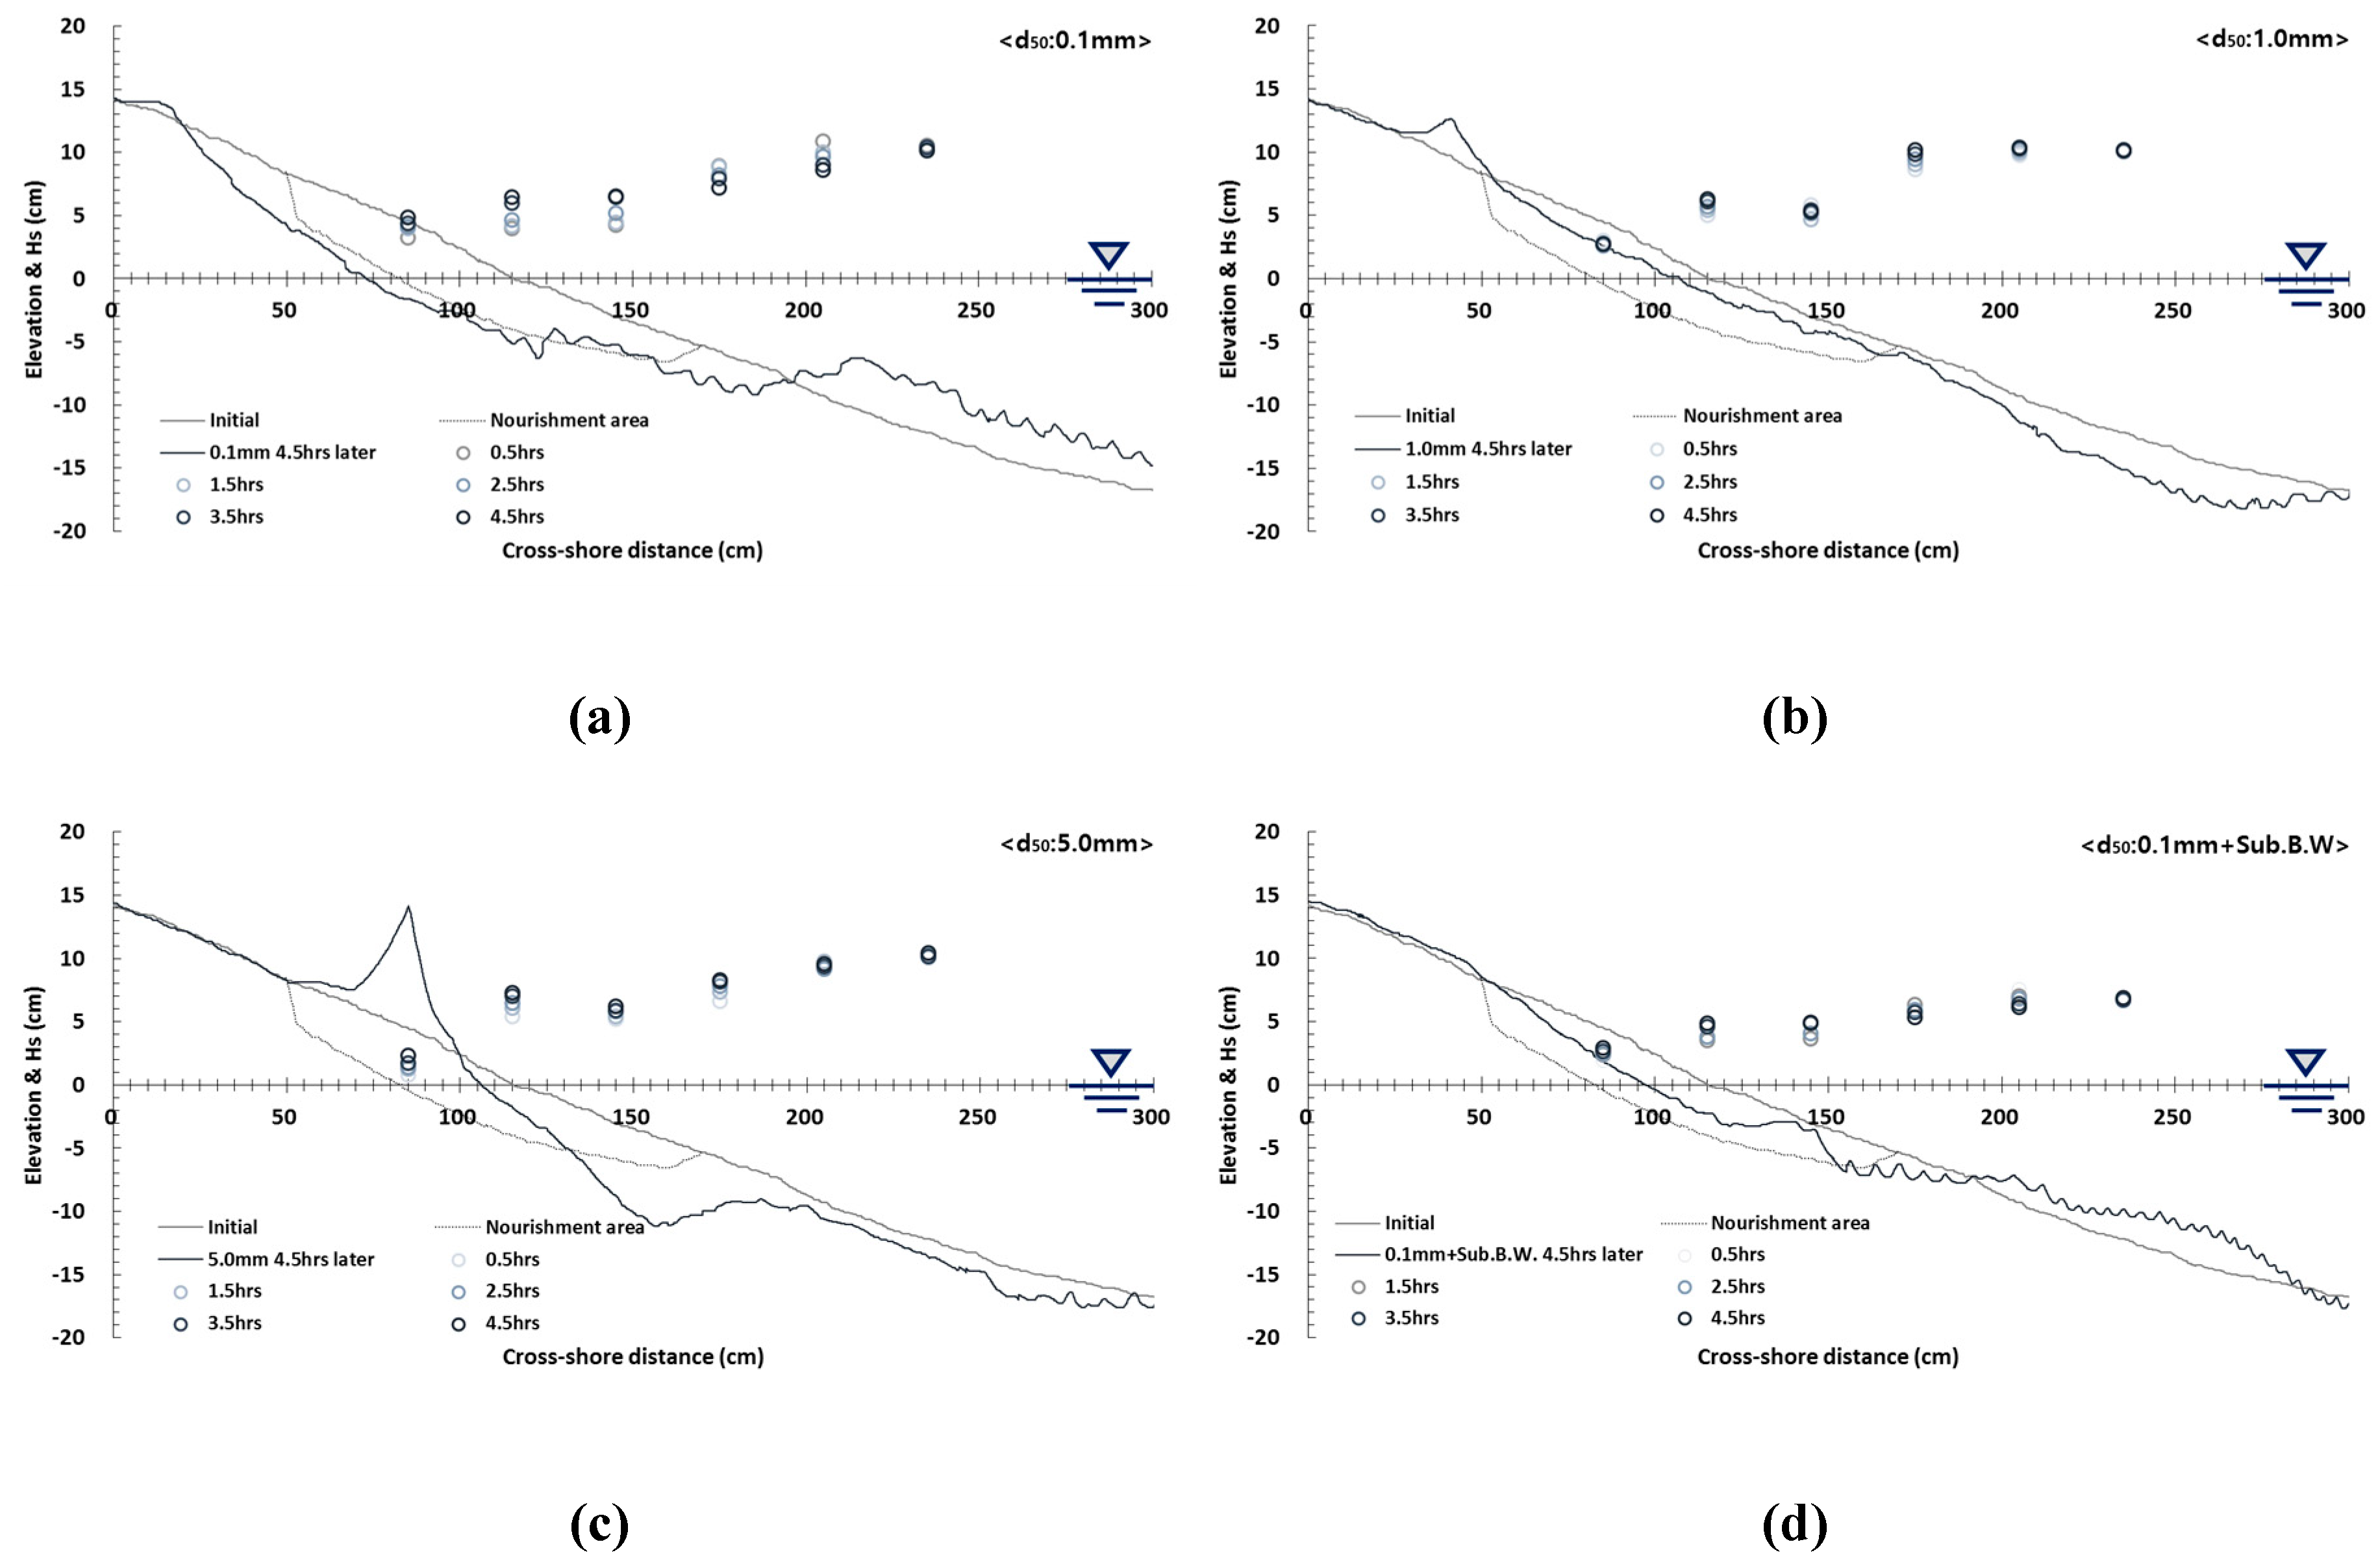
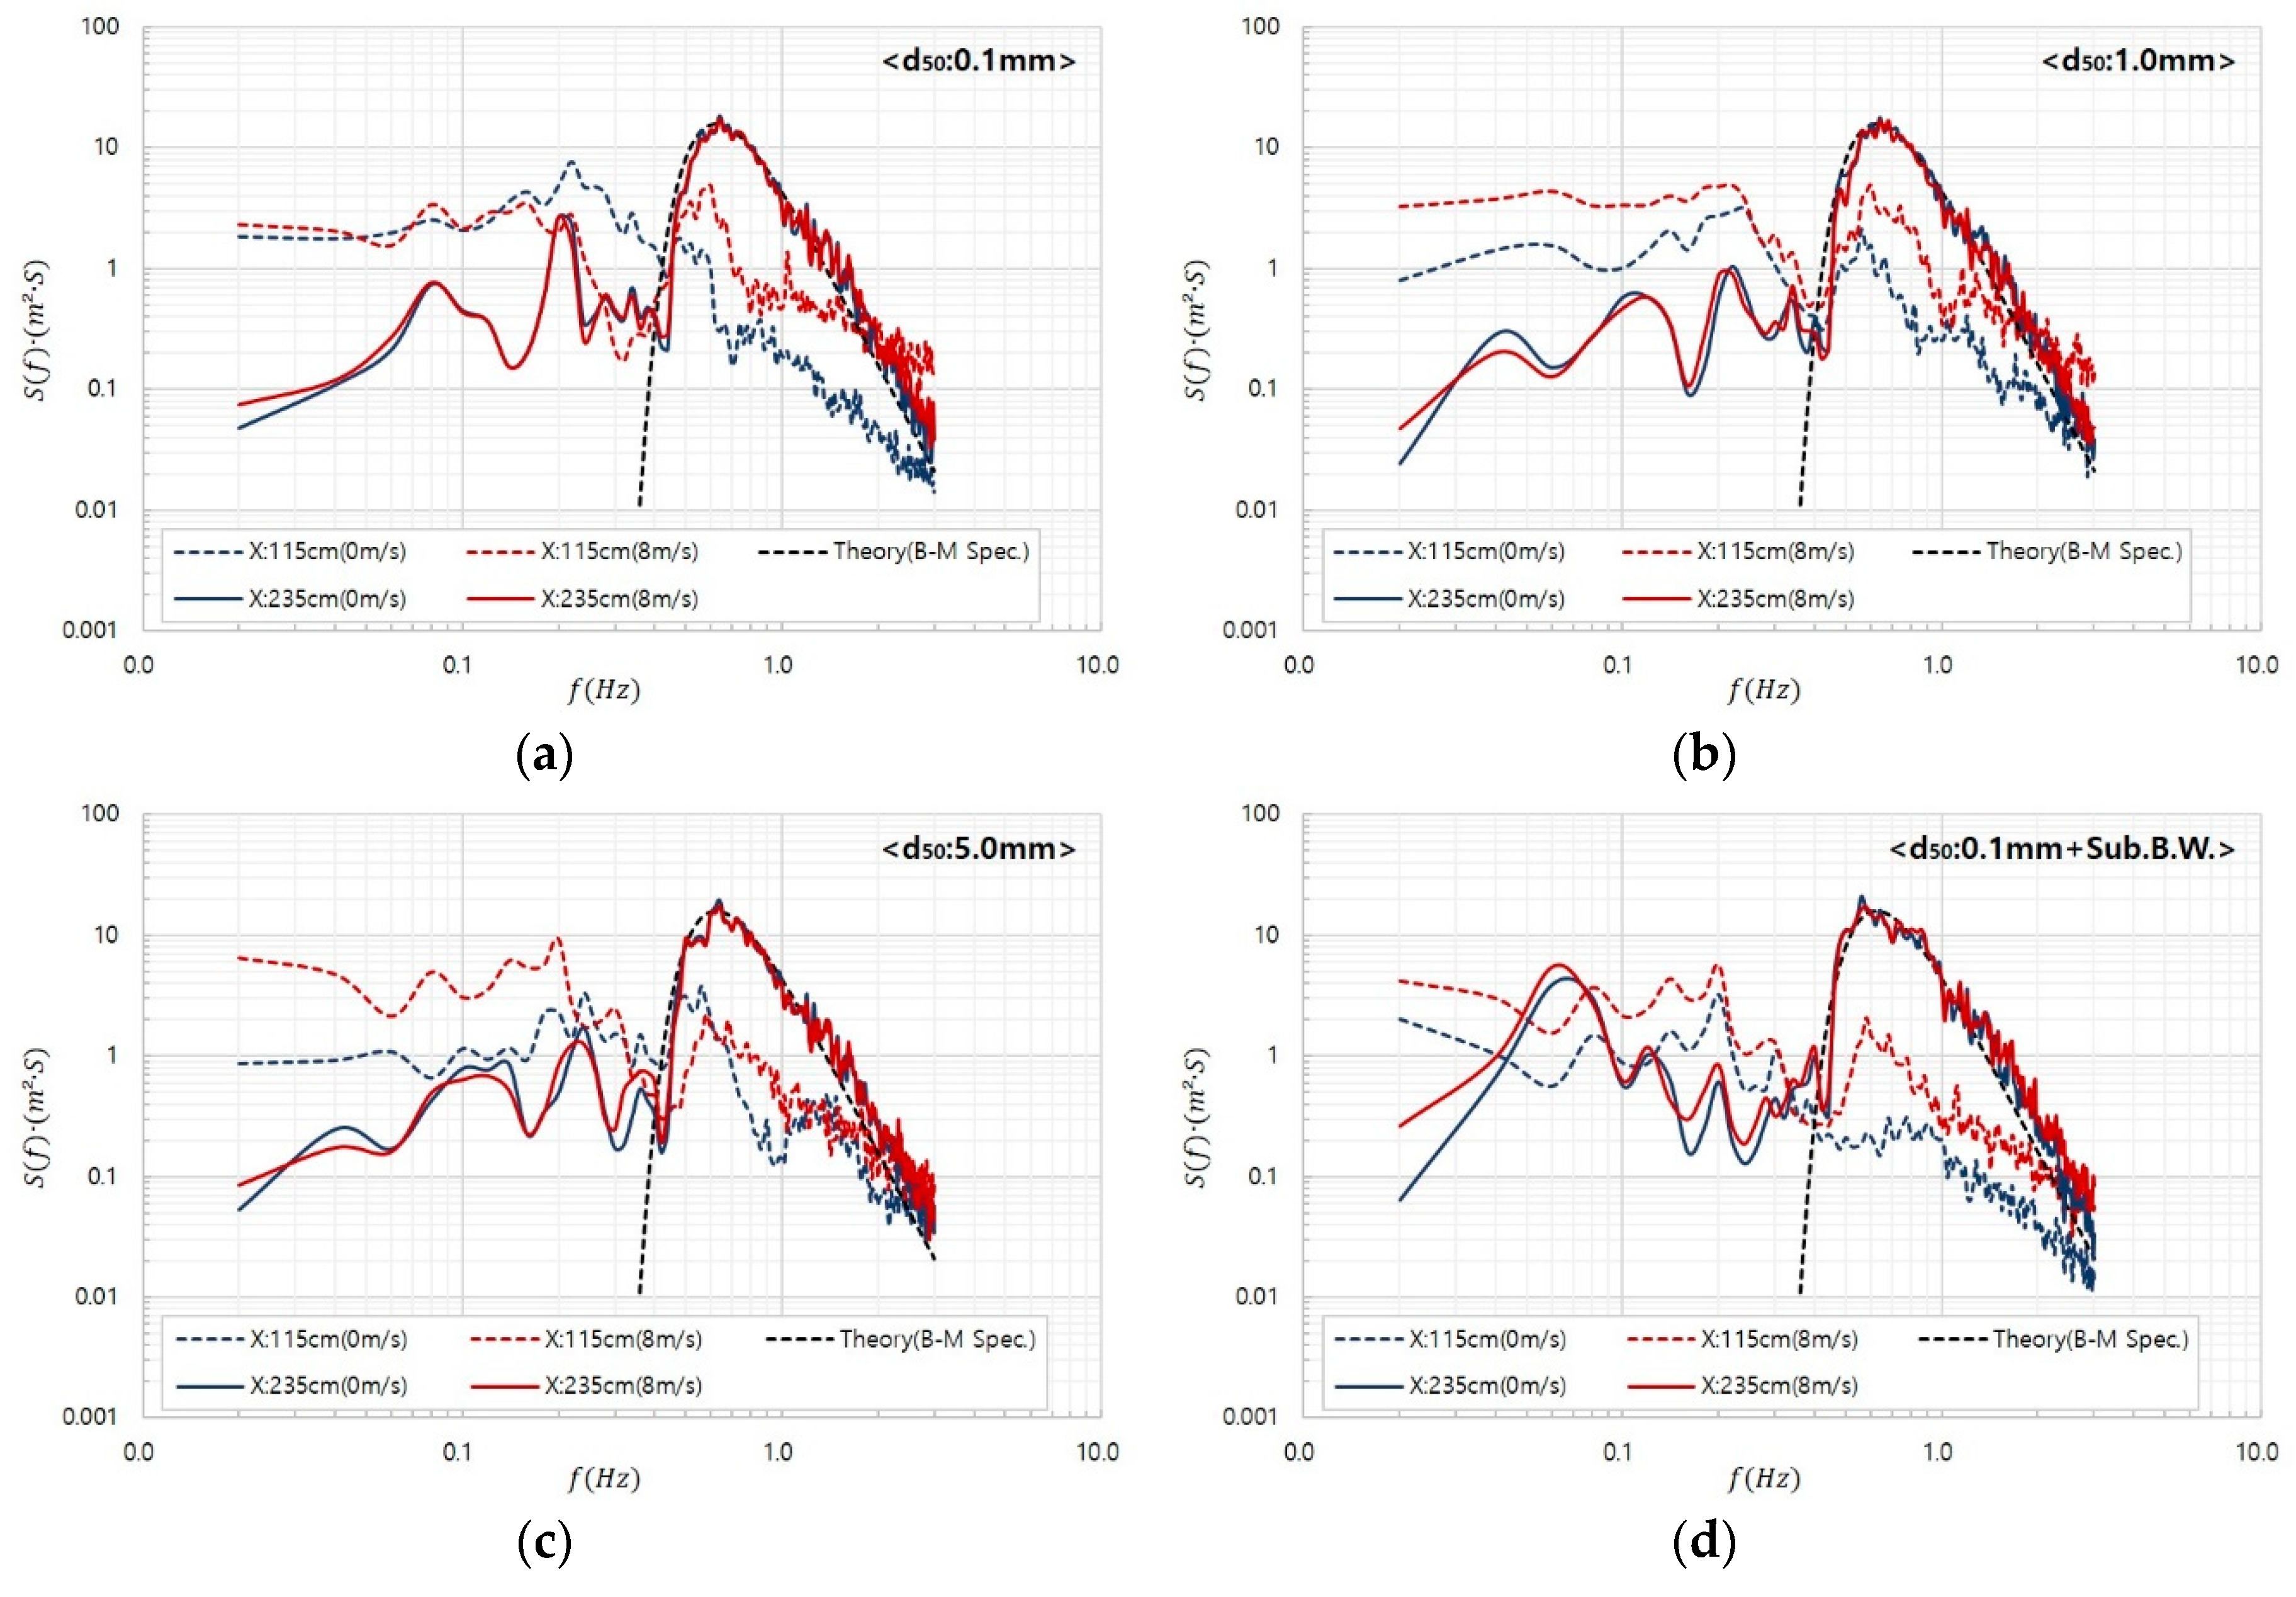
3.2. Wave Deformation

An assessment was conducted on wave variation that took place when sediment transport occurred according to the profile condition and changes in wind velocity. Wave height data were collected from eight positions, and the results of P1–P6, located on the foreshore, were summarized. The wave height was measured with the same time intervals during the test, and the results (Figure 6 and Figure 7) were obtained at the first 15 min of each time step. The measurements were taken at 20 Hz sampling rates, and a significant wave height value was presented using 16,384 sampling data. In addition, the final morphological change results were displayed together to understand the wave height change more easily.
As illustrated in the upper panel of Figure 6, the experimental result of the profile consisting of 0.1 mm sand showed that waves approaching from the offshore to the nearshore decreased gradually in proportion to the water depth decrease. The change in wave height at the position located at the seaside (x: 235) was extremely small, and wave fluctuation increased to the landside with the time duration. At the position of 200 cm, a sandbar was visible and breaking waves occurred in the section within 150 cm. Changes in the water depth occurred at the section of x: 90–190 cm because of large-scale sediment transport. Thus, the wave height generated increased up to 120% on P1 when it was compared between initial and 4.5 h data. Changes in wave height are affected by changes at the sea bottom where the measurement position is, but the wave height at a certain position is more affected by the topography in front of the measurement area rather than the topography at this certain position. In addition, the wave height is the value at the beginning of each test interval and the topography result is the value at the end of the tests, so the time difference should be considered when analyzing the correlation between the wave height and topography result. For the profile consisting of 1 mm sand particles, a constant wave height appeared at the position located closest to the seaside as time passed. The result showed that a change in the water depth did not significantly affect the wave deformation, and the wave deformation increased from the position of 230 cm, where morphological change occurred in a significant manner. The wave height change also decreased from the position of 150 cm as the section where sediment transport decreased, and the wave height changed by a small amount in the water level near the shoreline owing to the formation of breaking, reflected, and multiple waves. The wave runup appeared dominantly at the innermost position (x: 85 cm), and the wave height increased up to 51% on P2 according to an increase in water depth at the section of 150–220 cm, where a large amount of sediment transport occurred. As illustrated in the lower panel of Figure 6, in the condition in which 5 mm crushed gravel was applied, the wave propagated while maintaining a constant phase according to changes in water depth until the position of 160 cm. A breaking wave occurred at the position of x: 150 cm, where the water depth changed rapidly. A significant change in wave height occurred at the front of a rubble dune up to 38% on P2 in proportion to the (P2, P3) dune formation and change in water depth. However, waves did not reach the position of P1 directly, and changes in the water level according to changes in the internal water level were measured. In the condition in which the submerged breakwater was installed, a constant wave height appeared up to the position of 150 cm owing to sediment transport, as the wave reduced by the submerged breakwater was less affected by the topography when it propagated to the coast. However, changes in wave height increased near the shoreline up to 108% on P1 as a result of the direct influence of morphological change.
In the circumstance in which there was an accompanying 8 m/s wind, a significant change in water depth occurred at the 0.1 mm sand profile owing to sediment transport. As illustrated in the upper panel of Figure 7, no change in wave height occurred at the position of P6 located on the offshore side, but wave deformation occurred up to 48% on P1 as the water depth decreased at the position of 210 cm, where the sandbar was formed, and the wave energy increased as the wind force increased in proportion to changes in water depth at the section within 180 cm where the wave broke or right before the wave broke. In the condition with 1 mm sand, the variation of wave height occurred up to 26% on P2 at the section of 100–180 cm, where the water depth changed rapidly according to the morphological change. Relatively small wave variation of about 10.5% occurred at the position of x: 85 cm, which was affected by wave runup as time passed. The change in water depth was not significant under the 1 mm profile condition, because the range of morphological change was small. The range of wave height change also decreased accordingly. As illustrated in the lower panel of Figure 7, for the profile where the crushed gravel with 5 mm was applied, changes in wave height occurred up to 35% on P2 owing to the effect of water depth change according to the occurrence of morphological change. The wave height increased in the section rear side of x: 200 cm, where the change of water depth occurred on a relatively smaller scale as sediment transport was in progress, and, in particular, the wave height change was the greatest at the position of x: 115 cm in front of the shoreline. The water surface displacement value at x: 85 cm located in the riprap dune increased as a consequence of the reduction of the water level in the foreshore and the transfer of wave energy by wind, and such a result was an outcome of a change in the water level inside the riprap layer. In the case of the profile where the submerged breakwater was installed, wave deformation occurred as a result of a change in water depth and the effect of wind in proportion to the time duration of the wave action; this deformation was the largest at the position of 115 cm up to 48% on P1. However, a constant water depth change was measured at the position of x: 85 cm that was affected by wave runup.

4. Data Analysis and Discussion

4.1. Morphological Change

In this section, the objective is verifying how much a change in wind velocity influenced each profile condition using the sediment transport experiment results. For the profile featuring 0.1 mm sand, as shown in Figure 8, a large degree of morphological change occurred in the foreshore and backshore, regardless of the presence of wind, and accretion started to occur after the erosion section (x: 195 cm). However, when wind accompanied the wave, seawater reached the end of the backshore owing to the development of wave runup, and the erosion area increased. Eroded sand was transported to the offshore side, forming a thick sandbar. For the 0.1 mm profile, a similar erosion trend appeared, regardless of the coexistence of wind, and the erosion range increased under the condition of 8 m/s, where the external force increased. Wind increased the range of the swash zone as a result of wave breaking-point change and accelerated the wave propagated to the coast after wave breaking. At this time, asymmetric wave skewness formed, and a morphological change occurred from the foreshore to the backshore [36,37]. According to the result of previous research [38], more sediment transport occurs when the skewness of flow in the shape of asymmetric saw teeth propagated to the coast is accelerated, and the same phenomenon appeared in this experiment. Another reason for the increase in the sediment transport range due to the action of wind was that the boundary layer of a wave propagated in the direction of the coast after breaking is accelerated by a half cycle, and this takes less time than the deceleration time by the loss of energy, such as friction; furthermore, the shear strength also increased in proportion to an increase in the vertical components of the flow velocity [39,40,41].
When the nourishment section was replaced with 1 mm sand, the overall sediment transport trend decreased, but the erosion in the land direction in the shoreline increased as a result of a strong wave runup phenomenon caused by the wind. Moreover, a sand dune with a steep front slope was formed in the backshore. In addition, the undertow caused by strong wave rundown created strong scouring on the ocean floor; as the wave runup phenomenon became stronger, the downrush phenomenon also increased. Scouring occurred over a wide area under circumstances where the wind coexisted with the wave. In the case in which the nourishment section was replaced with 5 mm crushed gravel, a large-scale gravel dune formed in the backshore area and strong scouring occurred in the foreshore. When the wind was present in this case, the size of the dune increased and the front breakwater slope also increased, as shown in Figure 9. In addition, the slope from the dune crest to the foreshore where scouring occurred became steep when there was an accompanying wind. However, if there was no wind, only 5 mm gravels in the foreshore were partially transported to the rear, forming a dune. The remaining gravels stayed in place so that a constant slope was maintained at the section of x: 105–155 cm, and rapid scouring occurred from the boundary region (x: 168 cm) where material and sand encountered one another. However, with accompanying wind, gravels that were present previously were transported to the rear of the shoreline. The bottom was eroded in proportion to the amount of sediment transported, so that the range of morphological change was different. In particular, when the undertow was accelerated by the effect of wind, sediment transport occurred in more areas. It is known that topography in a stair-like structure formed at a position of 150–200 cm occurs in natural coasts as a result of the approach of typhoons or high waves with a steep wave slope [42]. Therefore, a morphological change similar to the situation at the time of a storm occurred at the front of the 5 mm nourishment section. Under circumstances where the submerged breakwater was installed, the energy of the wave developed from the offshore side was reduced primarily by the submerged breakwater. The morphological change in the shoreline was significantly reduced in comparison with the profile condition consisting only of fine sand. However, as the wind became stronger, an increase in the magnitude of the wave breaker and wave runup phenomenon expanded the erosion area.
The comparison result of the profile form according to the same external force condition showed that, when only the wave was applied, the smallest range of morphological change occurred when the submerged breakwater was installed and the condition with a 1 mm grain size was employed. However, the smallest morphological change under the 1 mm condition occurred from the backshore to the section where nourishment was applied (x: 0–170 cm). When there was accompanying wind in such circumstances, a small degree of morphological change occurred when the submerged breakwater was installed in combination with the 1 mm grain size profile. This profile was advantageous for controlling sediment transport near the shoreline.

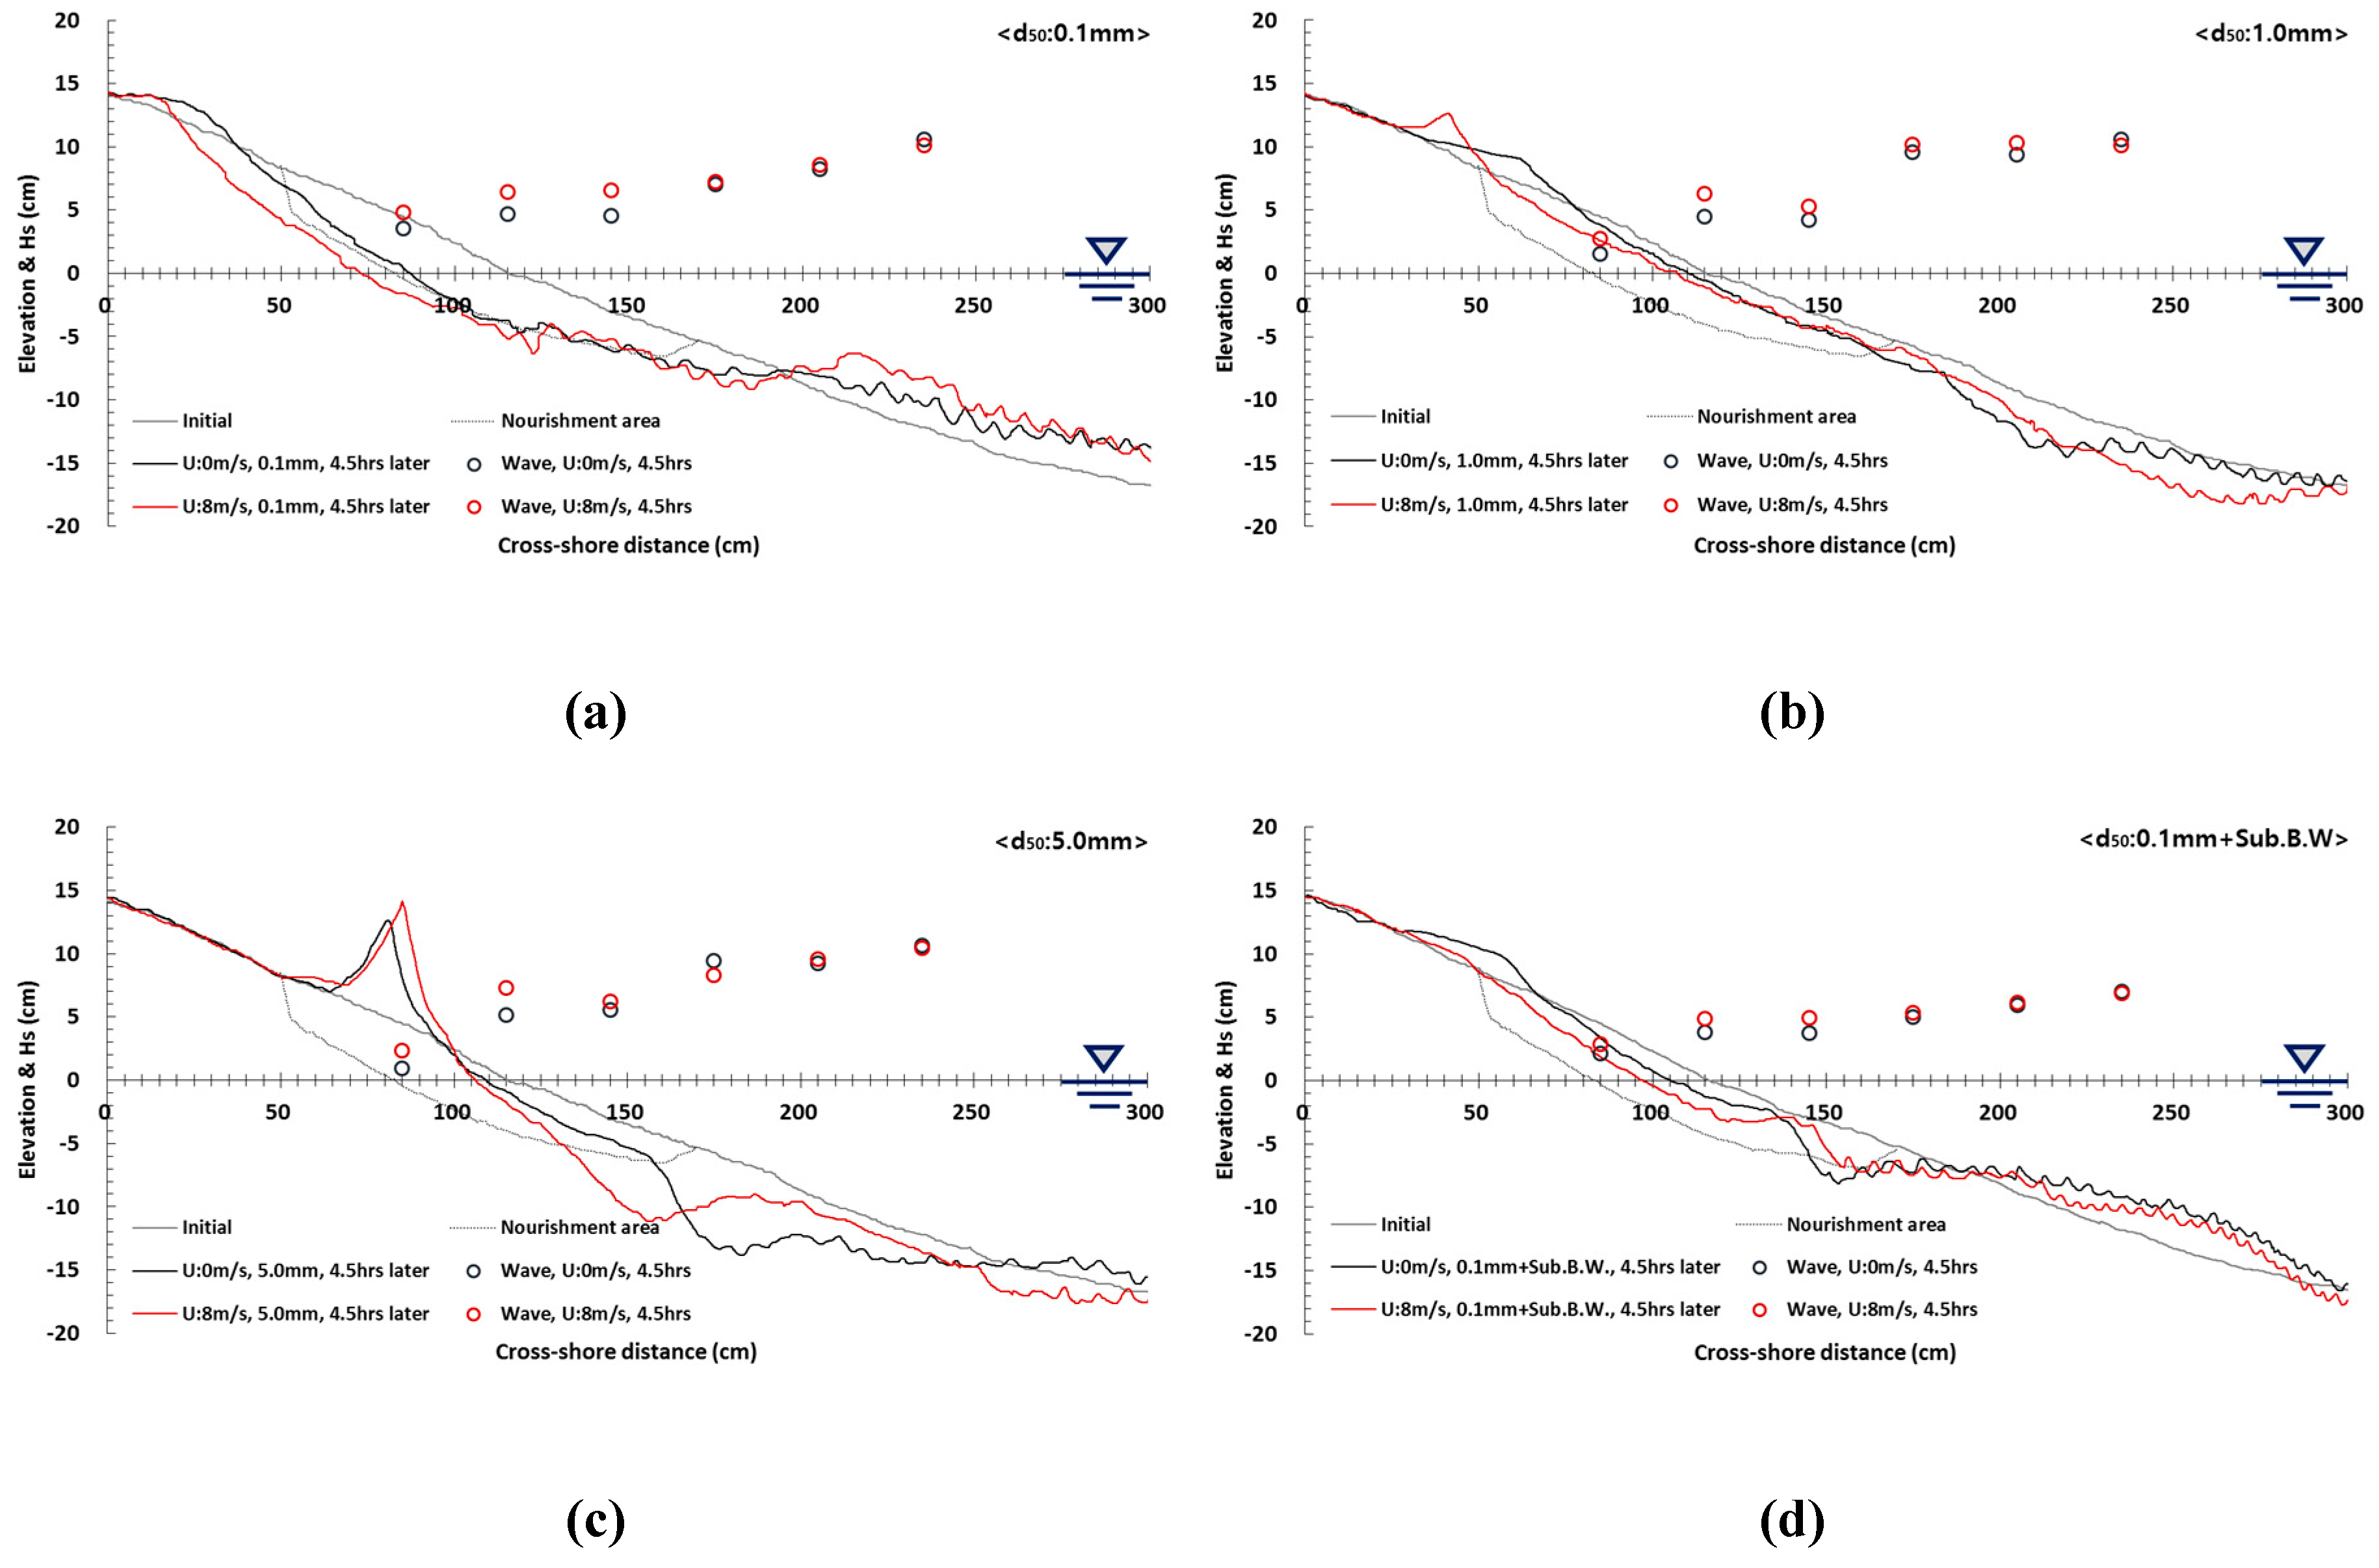
4.2. Wave Deformation

In the experiment, the surf zone moved toward the offshore and the swash zone broadened when the wind velocity increased. The height of wave runup increased in the coast because the wind energy and wave motion applied in parallel to the water surface was stronger after the surf zone. As shown in the morphological change experiment in Figure 10, the wave characteristics were also different because different erosion and accretion trends appeared according to the profile condition change. For the profile consisting of 0.1 mm sand, a similar value appeared at the position of P6 (x: 235 cm), regardless of wind velocity, as shown in the wave height measurement result. When compared with the wave signal set before installing the profile, the formula and measurement result at the position of P6 showed almost the same result, but after the beach profile was installed, the long-term components increased as a result of the effects of wave reflection, breaking, and standing waves. A breaking wave did not occur in such a phenomenon, and the change in energy density due to the effect of wind velocity was small in the area with a sufficient water level for wave propagation; however, the result measured near the shoreline (x: 115 cm) showed that the short-term components decreased as a result of the effect of shoaling and breaking waves, while the low-frequency area increased. The comparison result of wind velocity change showed that stronger wave deformation occurred near the shoreline, and the short-term components increased in particular. In the condition where 1 mm sand was deployed, the wave height at the position of P6 was constant regardless of the wind velocity change, and the overall energy density at the position of P2 near the shoreline increased in comparison with the condition in which only the wave was applied. Here, we can understand that the low-frequency wave is created by the overlapping of the short wave or short wave and long wave within the range of the surf zone [43].
The spectral distribution analysis result when the 5 mm grain size was applied showed that constant energy density was formed at the position of P6 regardless of the wind velocity change. Regarding the wave characteristics in the shoreline, a value of 1.0 Hz or higher showed a similar trend, but the long-term components increased significantly in the area of 0.2 Hz or less. If the submerged breakwater was installed, a change in the energy density according to wind velocity change at the position of P6, which corresponded to the outer side of the foreshore, was very small when the wave reduced by the submerged breakwater was propagated to the coast. However, the short- and long-term components increased at the P2 position. An increase in energy density indicated the growth of energy applied to the coast, and significant sediment transport occurred in proportion to the growth of energy.

4.3. Literature Comparison

As mentioned in the previous section, studies using submerged breakwater and nourishment have been carried out by many researchers and are currently being conducted under various conditions. In order to demonstrate the objectivity of the experimental results described so far, we are to compare one of the results of several recent studies as an example in this section. In the work of [44], the beach nourishment method was examined through a physical model test. Figure 1 shows the results for sand nourishment of d50 0.16 mm and gravel nourishment of d50 5 mm, which are similar to the conditions performed in this experiment. The results of [44] cannot be quantitatively compared because the experimental conditions such as indent waves, beach profile, and range of beach nourishment are different from those of this paper. However, the experimental results for a similar particle size can be compared qualitatively. Figure 11a shows that the nourishment section is made of sand and the erosion range due to wave activity gradually increases. Figure 11b shows that erosion occurs at the beginning of the experiment, but large-scale accretion occurs on the rear side of the shore line after a certain period of time. The results of [44] show a similar tendency to those of this experiment. If wind is considered, the erosion trend is expected to increase further. In addition, there are many related documents, but they were omitted because the comparison with the research results analyzed in this paper lacks cohesion.

5. Conclusions

The trend of morphological change was verified by applying nourishment, which is one of the typical soft-type methods, to a coast where erosion occurred, and the characteristics of each profile were analyzed by comparing the findings with the results of the submerged breakwater method, which is applied in the field more frequently as a hard-type structure. In addition, the effect of wind intensity change on morphological change when an erosive wave approached the coast was evaluated at the same time. In circumstances where only the wave existed, the erosion increased under the 0.1 mm sand profile in proportion to the wave generation time. In particular, large-scale loss of sand occurred over a wide range from the position of x: 200 cm where waves broke to the backshore area, and a sandbar was formed up to the position of x: 200–400 cm to the seaside. When d50: 1 mm sand was applied to the eroded section based on the shoreline, the sediment transport decreased significantly. This is because the sediment transport caused by wave action was restricted by a fast fall in velocity, and wave runup and rundown did not affect the sediment transport significantly. With regard to the 5 mm material, no suspension or traction due to waves occurred, and when the wave was applied to the material directly, the material was transported to the rear by a momentary impact, but the material accumulated from the position within x: 100 cm, forming a steep rubble dune. When the submerged breakwater was installed, sediment transport decreased because of the effect of wave energy being decreased in comparison with the 0.1 mm profile, and the total amount of sediment transport was similar to the condition with 1 mm material application.
When there was an accompanying wind velocity of 8 m/s, the erosion trend in most profiles was similar to the situation in the case of 0 m/s, but a difference was revealed in that the erosion range was expanded. In the case of the 0.1 mm profile condition, the erosion occurred in most of the backshore area owing to strong wave runup, and in the case of the 1 and 5 mm profile conditions, the undertow developed by the strong rundown phenomenon created large-scale scouring near the boundary between the nourishment section and existing sandy ground. Although a submerged breakwater was installed, the erosion range also increased owing to the effect of increased wave energy caused by wind. The profile with 1 mm and submerged breakwater installation showed the smallest range of sediment transport. On the basis of the wave data collected from the positions of P2 and P6, a clear wave change according to the change in wind velocity did not appear at P6, where no breaking wave or wave deformation occurred in the experiment. However, complicated flows, such as breaking waves, reflection, and standing waves, occurred at P2 on the shoreline, and the overall energy density increased in conditions where wind was applied, although the overall energy density could vary according to the morphological conditions. To summarize the above experimental results, if nourishment is selected for the purposes of reducing erosion, a 1 mm particle size is advantageous for sediment transport, but an increase in the grain size, such as with the 5 mm condition, does not produce greater reductions in sediment transport. In addition, an increase in the magnitude of wind velocity produces a greater range in morphological change. It is deemed appropriate that situations where waves and wind coexist should be considered when establishing measures to reduce erosion in the future.

Author Contributions

K.-T.S., writing—original draft preparation; K.-H.K., review and editing; J.-H.P., formal analysis.

Funding

This research received no external funding.

Acknowledgments

The authors thank Hyun-Dong Kim for support in the data comparison.

Conflicts of Interest

The authors declare no conflict of interest.

References

  1. Luttenberger, L.R. Environmental value of beaches for the local community and tourists. In Proceedings of the 22th Biennial International Congress Tourism & Hospitality Industry 2014: Trends in Tourism and Hospitality Management, Opatija, Croatia, 8–9 May 2014; pp. 121–130. [Google Scholar]
  2. Landry, C.E.; Keeler, A.G. An economic evaluation of beach erosion management alternative. Mar. Resour. Econ. 2003, 18, 105–127. [Google Scholar] [CrossRef]
  3. Luijendijk, A.; Hagenaars, G.; Ranasinghe, R.; Baart, F.; Donchyts, G.; Aarninkhof, S. The State of the World’s Beaches. Sci. Rep. 2018, 8, 6641. [Google Scholar] [CrossRef]
  4. Giardino, A.; Schrijvershof, R.; Nederhoff, C.M.; de Vroeg, H.; Brière, C.; Tonnon, P.K.; Caires, S.; Walstra, D.J.; Sosa, J.; van Verseveld, W.; et al. A quantitative assessment of human interventions and climate change on the West African sediment budget. Ocean Coast. Manag. 2018, 156, 249–265. [Google Scholar] [CrossRef]
  5. Onaka, S.; Ichikawa, S.; Izumi, M.; Uda, T.; Hirano, J.; Sawada, H. Effectiveness of Gravel Beach Nourishment on Pacific Island. In Proceedings of the 9th International Conference on APAC, Manila, Philippines; 2017; pp. 651–662. [Google Scholar]
  6. Tsvetanov, T.G.; Shah, F.A. The economic value of delaying adaptation to sea-level rise: An application to coastal properties in Connecticut. Clim. Chang. 2013, 121, 177–193. [Google Scholar] [CrossRef] [Green Version]
  7. Ruol, P.; Martinelli, L.; Favaretto, C. Vulnerability analysis of the Venetian littoral and adopted mitigation strategy. Water 2018, 10, 984. [Google Scholar] [CrossRef]
  8. Pasquali, D.; Di Risio, M.; De Girolamo, P. A simplified real time method to forecast semi-enclosed basins storm surge. Estuar. Coast. Shelf Sci. 2015, 165, 61–69. [Google Scholar] [CrossRef]
  9. Zhao, H.Y.; Liang, Z.D.; Jeng, S.D.; Zhu, J.F.; Guo, Z.; Chen, W.Y. Numerical investigation of dynamic soil response around a submerged rubble mound breakwater. Ocean Eng. 2018, 156, 406–423. [Google Scholar] [CrossRef]
  10. Celli, D.; Li, Y.; Ong, M.C.; Di Risio, M. The role of submerged berms on the momentary liquefaction around conventional rubble mound breakwaters. Appl. Ocean Res. 2019, 85, 1–11. [Google Scholar] [CrossRef]
  11. Pasquali, D.; Bruno, M.F.; Celli, D.; Damiani, L.; Di Risio, M. A simplified hindcast method for the estimation of extreme storm surge events in semi-enclosed basins. Appl. Ocean Res. 2019, 85, 45–52. [Google Scholar] [CrossRef]
  12. Becker, A.; Taylor, M.D.; Folpp, H.; Lowry, M.B. Managing the development of artificial reef systems: The need for quantitative goals. Fish 2018, 19, 740–752. [Google Scholar] [CrossRef]
  13. Saponieri, A.; Valentini, N.; Risio, M.D.; Pasquali, D.; Damiani, L. Laboratory Investigation on the Evolution of a Sandy Beach Nourishment Protected by a Mixed Soft–Hard System. Water 2018, 10, 1171. [Google Scholar] [CrossRef]
  14. Kim, K.H.; Agnes, Y.W. Study on Alternatives of Sand Placement Method for Beach Nourishment Project. J. Civ. Eng. 2012, 16, 478–485. [Google Scholar] [CrossRef]
  15. Pagan, J.I.; Lopez, M.; Lopez, I.; Tenza-Abril, A.J.; Aragones, L. Study of the evolution of gravel beaches nourished with sand. Sci. Total Environ. 2018, 626, 87–95. [Google Scholar] [CrossRef] [PubMed]
  16. Grottoli, E.; Bertoni, D.; Ciavola, P. Shore- and medium-term response to storms on three mediterranean coarse-graind beaches. Geomorphology 2017, 295, 738–748. [Google Scholar] [CrossRef]
  17. Karunarathna, H.; Horrillo-Caraballo, J.M.; Ranasinghe, R.; Short, A.D.; Reeve, D.E. An analysis of the cross-shore beach morphodynamics of a sandy and a composite gravel beach. Mar. Geol. 2012, 299–302, 33–42. [Google Scholar] [CrossRef]
  18. Roman-Sierra, J.; Munoz-Perez, J.; Navarro-Pons, M. Beach nourishment effects on sand porosity variability. Coast. Eng. 2014, 83, 221–232. [Google Scholar] [CrossRef] [Green Version]
  19. Frandsen, J.; Tremblay, O.; Berube, F. Beach nourishment project: Large scale flume experiments—Evaluation of cobble-gravel-sand beaches. Tech. Rep. 2015. [Google Scholar] [CrossRef]
  20. Grasso, F.; Michallet, H.; Barthélemy, E. Experimental simulation of shore face nourishments under storm events: A morphological, hydrodynamic, and sediment grain size analysis. Coast. Eng. 2011, 58, 184–193. [Google Scholar] [CrossRef]
  21. Lindell, J.; Fredriksson, C.; Hanson, H. Impacct of dune vegetation on wave and wind erosion: A case study at Angelholm beach, south Sweden. J. Water Manag. Res. 2017, 73, 39–48. [Google Scholar]
  22. Kim, K.H.; Shim, K.T.; Shin, B.S. Morphological Change near Artificial Reefs as a Beach Erosion. J. Coast. Res. 2016, 75, 403–407. [Google Scholar] [CrossRef]
  23. Seabrook, S.R.; Hall, K.R. Wave transmission at submerged rubblemound breakwater. In Proceedings of the 26th International Conference on Coastal Engineering, Copenhagen, Denmark, 22–26 June 1998; pp. 2000–2013. [Google Scholar]
  24. Kramer, M.; Zanuttigh, B.; van der Meer, J.W.; Vidal, C.; Gironella, F.X. Laboratory experiments on low-crested breakwaters. Coast. Eng. 2005, 52, 867–885. [Google Scholar] [CrossRef]
  25. Kim, K.H.; Shim, K.T. A Study on Characteristics of Current and Sediment Transport around Permeability Artificial Reefs. In Proceedings of the 28th International Ocean and Polar Engineering Conference, Sapporo, Japan, 10–15 June 2018; pp. 1314–1319. [Google Scholar]
  26. Di Risio, M.; Lisi, I.; Beltrami, G.M.; De Girolamo, P. Physical modeling of the cross-shore short-term evolution of protected and unprotected beach nourishments. Ocean Eng. 2010, 37, 777–789. [Google Scholar] [CrossRef]
  27. Haller, M.C.; Dalrymple, R.A. Rip current instabilities. J. Fluid Mech. 2001, 433, 161–192. [Google Scholar] [CrossRef] [Green Version]
  28. Watson, G.; Barnes, T.C.D.; Peregrine, D.H. The generation of low-frequency waves by a single wave group incident on a beach. Coast. Eng. 1994, 1995, 776–790. [Google Scholar]
  29. Iwagaki, Y.; Noda, H. Laboratory study of scale effects in two-dimensional beach processes. Coast. Eng. Proc. 1963, 8, 194–210. [Google Scholar] [CrossRef]
  30. Nayak, I.V. Equilibrium profiles of model beaches. In Proceedings of the 12th Conference on Coastal Engineering, Washington, DC, USA, 13–18 September 1970; pp. 1321–1340. [Google Scholar]
  31. Dean, R.G. Heuristic models of sand transport in the surf zone. In Proceedings of the Conference on Engineering Dynamics in the Surf Zone; Institution of Engineers: Sydney, Australia, 1973; pp. 208–214. [Google Scholar]
  32. Sunamura, T.; Horikawa, K. Two-dimensional beach transformation due to waves. In Proceedings of the 14th Conference on Coastal Engineering, Copenhagen, Denmark, 24–28 June 1974; pp. 920–938. [Google Scholar]
  33. Hattori, M.; Kawamata, R. Onshore-offshore transport and beach profile change. In Proceedings of the 17th Conference on Coastal Engineering, Sydney, Australia, 23–28 March 1980; pp. 254–255. [Google Scholar]
  34. Wright, L.D.; Short, A.D. Morphodynamic variability of surf zones and beaches: A synthesis. Mar. Geol. 1984, 56, 93–118. [Google Scholar] [CrossRef]
  35. Kim, K.H.; Shin, B.S.; Shim, K.T. Investigation of Coastal Environment Change using Wave Measurement Sensors and Geographical Laser Scanner. J. Sens. 2019, 2019, 3754972. [Google Scholar] [CrossRef]
  36. King, D.B. Studies in Oscillatory Flow Bedload Sediment Transport. Ph.D. Thesis, The University of California, San Diego, CA, USA, 1991. [Google Scholar]
  37. Ruessink, B.G.; Ramaekers, G.; van Rijn, L.C. On the parameterization of the free-stream non-linear wave orbital motion in nearshore morphodynamic models. Coast. Eng. 2012, 65, 56–63. [Google Scholar] [CrossRef]
  38. Ruessink, B.G.; Michallet, H.; Abreu, T.; Sancho, F.; Van Der A, D.A.; Van Der Werf, J.J.; Silva, P.A. Observations of velocities, sand concentrations, and fluxes under velocity-asymmetric oscillatory flows. Geophys. Res. 2011, 116, C03004. [Google Scholar] [CrossRef]
  39. Van der A, D.A.; O’Donoghue, T.; Ribberink, J.S. Measurements of sheet flow transport in acceleration-skewed oscillatory flow and comparison with practical formulations. Coast. Eng. 2010, 57, 331–342. [Google Scholar] [CrossRef]
  40. Nielsen, P. Coastal Bottom Boundary Layers and Sediment Transport; World Scientific: Singapore, 1992. [Google Scholar]
  41. Fuhrman, D.R.; Fredsøe, J.; Sumer, B.M. Bed slope effects on turbulent wave boundary layers: 2. Comparison with skewness, asymmetry, and other effects. J. Geophys. Res. 2009, 114, C03025. [Google Scholar] [CrossRef]
  42. Grasso, F.; Michallet, H.; Barthelemy, E.; Certain, R. Physical modeling of intermediate cross-shore beach morphology: Transients and equilibrium states. J. Geophys. Res. 2009, 114, C09001. [Google Scholar] [CrossRef]
  43. Mase, H. Frequency down-shift on swash oscillations compared to incident waves. J. Hydraul. Res. 1995, 33, 397–411. [Google Scholar] [CrossRef]
  44. Kim, H.D.; Aoki, S.; Kim, K.H.; Sohn, J.H. Effectiveness of eco-friendly design options in pacific island nations. In Proceedings of the 10th International Conference on Asian and Pacific Coasts, Hanoi, Vietnam, 25–28 September 2019; pp. 885–889. [Google Scholar]
Figure 1. Experimental setup condition with wind–wave flume.
Jmse 07 00385 g001
Figure 2. Beach profiles. (a) Sand (d50: 0.1 mm), (b) Sand (d50: 0.1 mm), Gravel (d50: 1 mm), (c) Sand (d50: 0.1 mm), Gravel (d50: 5 mm), (d) Sand (d50: 0.1 mm), Submerged BW
Jmse 07 00385 g002
Figure 3. Wave spectrum with wind velocity variation before beach profile installation.
Jmse 07 00385 g003
Figure 4. Beach profile evolution with wind velocity; U: 0 m/s : (a) d50, 0.1 mm, (b) d50, 1 mm, (c) d50, 5 mm, (d) d50, 0.1 mm + Sub. B.W.
Jmse 07 00385 g004
Figure 5. Beach profile evolution with wind velocity; U: 8 m/s : (a) d50, 0.1 mm, (b) d50, 1 mm, (c) d50, 5 mm, (d) d50, 0.1 mm + Sub. B.W.
Jmse 07 00385 g005
Figure 6. Wave deformation distribution with wind velocity; U: 0 m/s : (a) d50, 0.1 mm, (b) d50, 1 mm, (c) d50, 5 mm, (d) d50, 0.1 mm + Sub. B.W.
Jmse 07 00385 g006
Figure 7. Wave deformation distribution with wind velocity; U: 8 m/s : (a) d50, 0.1 mm, (b) d50, 1 mm, (c) d50, 5 mm, (d) d50, 0.1 mm + Sub. B.W.
Jmse 07 00385 g007
Figure 8. Comparison between beach profile evolution and wave distribution after 4.5 h. (a) d50, 0.1 mm, (b) d50, 1 mm, (c) d50, 5 mm, (d) d50, 0.1 mm + Sub. B.W.
Jmse 07 00385 g008
Figure 9. Comparison between sediment transport results and beach profile types. (a) Wind velocity 0 m/s, (b) Wind velocity 8 m/s.
Jmse 07 00385 g009
Figure 10. Wave spectrum analysis on beach profile variation. (a) d50, 0.1 mm, (b) d50, 1.0 mm, (c) d50, 5.0 mm, (d) d50, 0.1 mm + Sub. B.W.
Jmse 07 00385 g010
Figure 11. Experiment result of literature review; (a) d50: 0.16 mm, (b) d50: 5 mm.
Jmse 07 00385 g011
Table 1. Test Conditions.
CaseWater Depth
(m)
Hs
(m)
Ts
(sec)
Wind
(m/s)
Nourished Area
(d50, mm)
Interval
(h)
SlopeCF0Ψθ
Case A0.90.081.130
3
6
8
Type 1: 0.1
Type 2: 1.0
Type 3: 5.0
Type 4: 0.1
0.5
~
4.5
1/10
(foreshore)
1/30
(offshore)
16.6
3.5,
1.2
8.43
072
0.31
122.4
12.2
2.5
0.48
0.11
0.05
Case B0.90.11.4117.9
3.8,
1.3
8.44
0.72
0.31
122.8
12.3
2.5
0.45
0.10
0.05
Case C0.90.121.7019.0
4.1,
1.4
8.40
0.72
0.31
121.7
12.2
2.4
0.42
0.09
0.04

