Article

Analysis of Vortex-Induced Vibrations in a Test Production Riser Subjected to Internal Multiphase Flow


1
State Key Laboratory of Offshore Natural Gas Hydrates, Beijing 100028, China
2
National Key Laboratory of Oil and Gas Reservoir Geology and Exploitation, Southwest Petroleum University, Chengdu 610500, China
*
Author to whom correspondence should be addressed.
J. Mar. Sci. Eng. 2026, 14(9), 785; https://doi.org/10.3390/jmse14090785
Submission received: 20 March 2026 / Revised: 17 April 2026 / Accepted: 19 April 2026 / Published: 24 April 2026

Abstract

The natural gas hydrate production riser is the main passage for offshore hydrate production and transport. Its safe operation directly affects the production process. However, current hydrate production methods cannot avoid hydrate decomposition and formation inside the pipe. Hydrate phase change causes internal multiphase flow. Together with the external ocean current, it leads to more complex nonlinear vibration of the riser. Based on China’s gas hydrate trial production in the Shenhu area of the South China Sea, this study establishes a dynamic model of a production riser. The model considers hydrate phase change inside the pipe and vortex-induced vibration. It is solved using the Newmark-β method, and its validity is confirmed by CFD simulations. The results show that, under the combined action of ocean currents and internal multiphase flow, the riser exhibits a clear multi-frequency response in vortex-induced vibration. Its spatial trajectory is highly irregular. Specifically, hydrate phase change increases internal gas content and gas slippage, elevating fluid velocity. This reduces the riser’s structural stiffness and effective tension, altering the VIV response. In addition, lower top tension and higher slurry density, flow rate, and outlet backpressure delay hydrate decomposition. These factors also reduce the effective tension along the riser and increase its in-line deformation.

1. Introduction

The exploration and development of offshore oil and gas resources is a major part of the global energy strategy. Natural gas hydrate is regarded as one of the most important replacement resources for conventional oil and gas. It has also become an important direction for offshore oil and gas development [1,2]. The natural gas hydrate production riser is the key conduit for offshore hydrate production and transport. The safe operation of the riser system directly affects the progress of hydrate production. However, existing production methods cannot avoid hydrate dissociation and formation inside the pipeline. Therefore, the riser is subjected not only to external ocean currents, but also to the internal multiphase flow generated by the dissociation of solid hydrate [3,4]. Under the coupled effects of internal multiphase flow and complex external ocean currents, the vibration and deformation of the riser become more complicated [5].
Vortex-induced vibration (VIV) of marine risers is a key factor in deepwater riser design. The earliest understanding and study of VIV can be traced back to fifteenth-century Europe. Through experimental observation, Leonardo da Vinci [6] found that flow past a cylinder could produce a clear vortex-induced vibration phenomenon. VIV directly affects the force and safety analysis of risers. Since then, it has received extensive attention from many researchers. Previous studies have mainly focused on numerical simulation of VIV, experimental investigation of VIV, numerical prediction models for VIV, fatigue prediction and assessment, and vibration suppression [7,8,9,10]. Apango et al. [11] carried out a three-dimensional multibody study of a deepwater riser system and analyzed its static and dynamic characteristics under different platform motions. Kim and O’Reilly [12] established a nonlinear theoretical dynamic model for a deepwater riser while considering hydrodynamic drag and internal fluid transport. Gu et al. [13] developed a riser dynamic model under coupled internal and external flow based on the Euler-Bernoulli beam theory, and solved it using a finite-difference scheme and the generalized integral transform method. Liang and Lou [14] established a VIV equation for a marine riser with internal flow involving hydrate phase change and investigated the influence of multiphase internal flow on riser response. Lou and Liang [15] developed a mechanical model of a riser with internal multiphase flow generated by hydrate phase-change dissociation and solved it using the finite-difference method.
During offshore oil and gas production, internal multiphase flow can significantly change the dynamic characteristics of a riser system. For this reason, the dynamic response of marine risers under the coupled effects of internal flow and external vortex-induced vibration (VIV) has attracted much attention in recent years. Many researchers have studied this complex problem through theoretical modeling and response analysis. Leklong et al. [16] derived the nonlinear equations of motion of a marine riser under ocean-current loading based on Hamilton’s principle. They also examined the dynamic response of the riser under excitation from a top floating body. Kaewunruen et al. [17] developed a nonlinear theoretical model that considers the coupling between axial and transverse vibrations. They quantitatively assessed the effects of bending stiffness, top tension, and internal flow velocity on the system. Dai, Meng et al. [18,19] used a fourth-order Galerkin method to study how the transition of internal flow velocity from subcritical to supercritical conditions affects the vortex-induced vibration characteristics of the pipe.
With regard to the specific mechanism by which internal flow affects riser response, many numerical and experimental studies have confirmed the importance of internal flow effects. In terms of static and dynamic characteristics, Monprapussorn et al. [20] examined the frequency response of a riser. Duan et al. [21,22] systematically demonstrated, using a 3D FEM-DVM coupled model and time-domain methods, that internal flow can increase the maximum CF RMS displacement by 26.8% and amplify the IL mean deflection from 3.9D to 8.2D. In terms of vibration amplitude and instability, Yamamoto et al. [23] employed a DVM-FEM approach to reveal the transition of vortex shedding from 2S to 2P modes. Guo et al. [24] further showed through physical flume tests that increasing internal flow velocity significantly elevated the CF strain amplitude from 30 με to 110 με. Additionally, extending to gas–liquid two-phase flow, Zhu et al. [25] utilized high-speed imaging to identify second-order mode dominance at gas-liquid ratios of 0.5–1.83. Li et al. [26] applied the Generalized Integral Transform Technique to define the instability boundaries. Despite these advancements, the existing literature largely overlooks the transient effects of hydrate phase change during production. Therefore, this paper based on a hydrate test production riser based on the Shenhu trial-production scenario and establish a more application-oriented coupled nonlinear model that simultaneously includes hydrate dissociation, nonequilibrium gas–liquid flow evolution, depth-dependent effective tension, external shear-current loading, and wake-oscillator-induced vortex vibration. Based on this framework, we further clarify how top tension, slurry density, flow rate, and outlet backpressure affect hydrate dissociation location, gas holdup, sectional tension, and the multi-frequency in-line/cross-flow response of the riser. Therefore, the contribution of this work is not simply the inclusion of hydrate phase transition itself, but the development of a more comprehensive production-riser model and the systematic identification of the corresponding operating-parameter effects.
In summary, although much progress has been made in the study of vortex-induced vibration of marine risers and their coupled response to internal and external flows, most existing studies focus on conventional single-phase flow or stable gas–liquid two-phase internal flow. For natural gas hydrate production, studies on the coupled effects of hydrate phase change inside the pipe and external ocean loads are still limited. In particular, the dynamic response and large-deformation behavior of risers under the combined effects of hydrate phase change and complex ocean currents remain unclear.
Therefore, based on the Shenhu trial-production scenario and establish a more application-oriented coupled nonlinear model that simultaneously includes hydrate dissociation, nonequilibrium gas–liquid flow evolution, depth-dependent effective tension, external shear-current loading, and wake-oscillator-induced vortex vibration. Based on this framework, we further clarify how top tension, slurry density, flow rate, and outlet backpressure affect hydrate dissociation location, gas holdup, sectional tension, and the multi-frequency in-line/cross-flow response of the riser. Therefore, the contribution of this work is not simply the inclusion of hydrate phase transition itself, but the development of a more comprehensive production-riser model and the systematic identification of the corresponding operating-parameter effects.

2. Model Development

2.1. Model Derivation

2.1.1. Dynamic Model of the Hydrate Production Riser

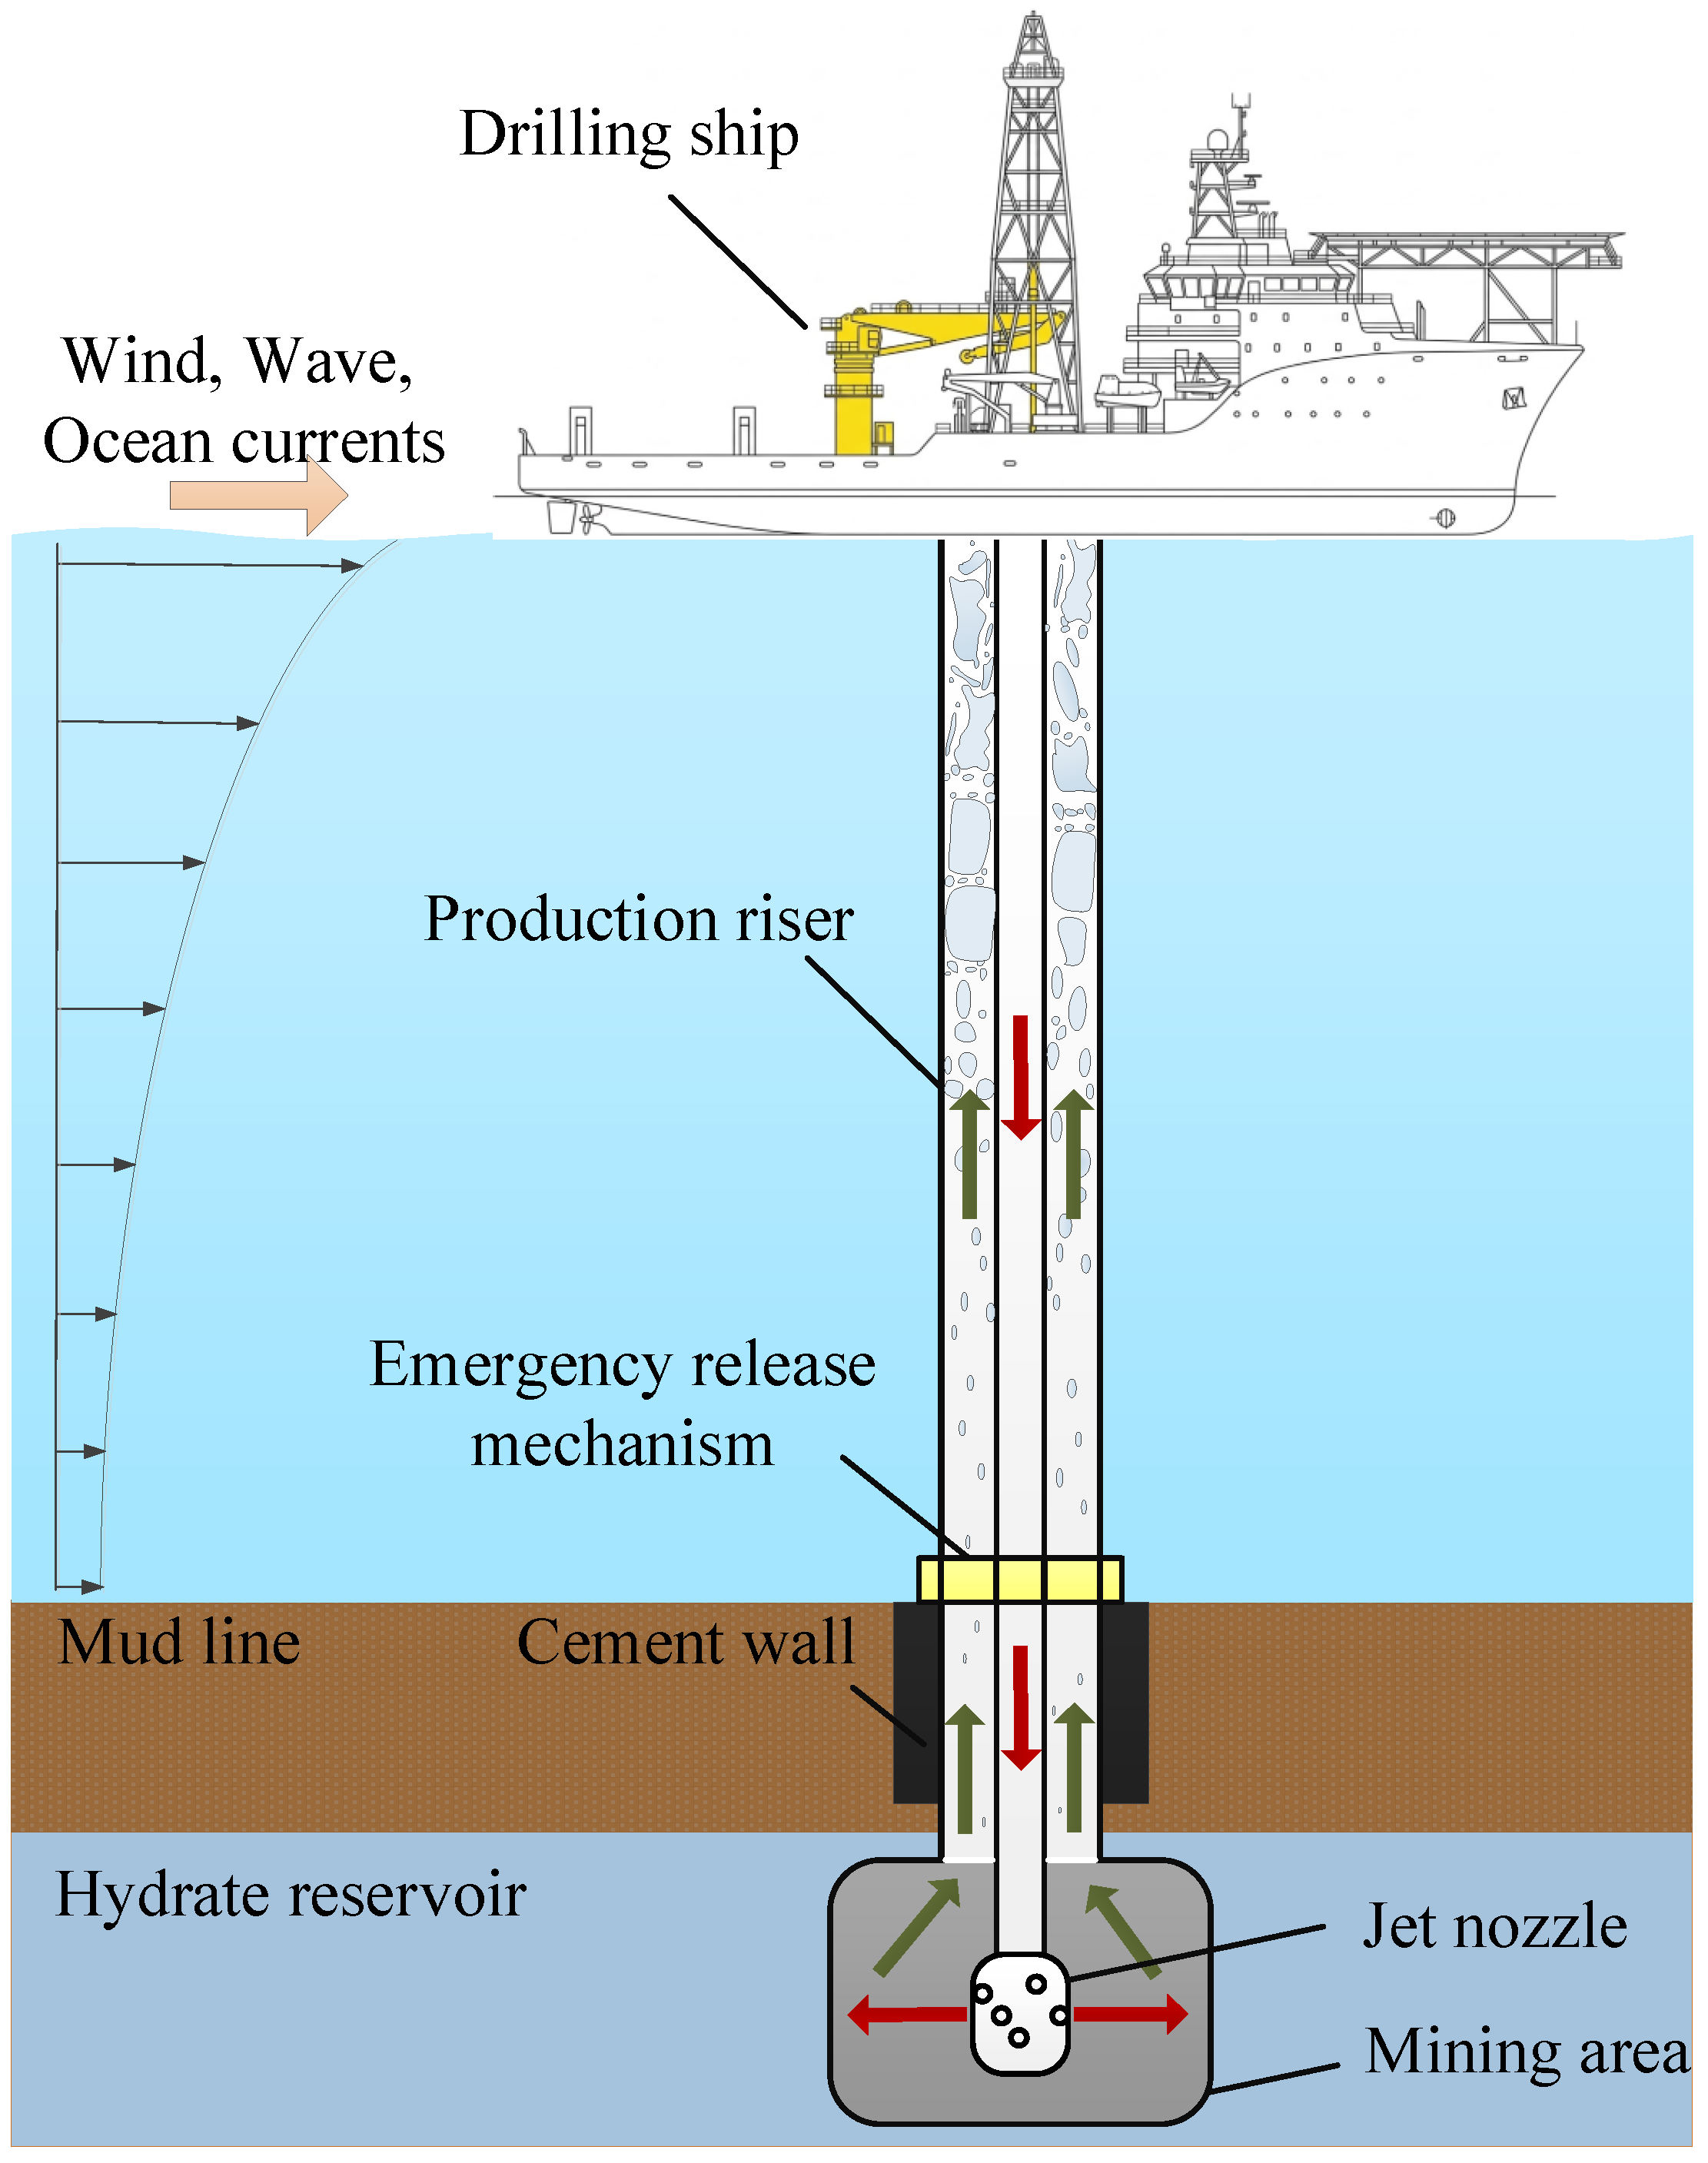
The natural gas hydrate production riser is the key conduit for transporting hydrate-bearing fluids. It is also one of the most vulnerable parts of the offshore platform system. China has successfully carried out natural gas hydrate trial production in the Shenhu area of the South China Sea. During the trial, riserless drilling and drill-pipe cementing were adopted. Coiled tubing was run inside the drill pipe. After the hydrate was broken up by jetting at the bottom, the fluid containing natural gas hydrate particles flowed back from the sealed space to the surface platform. Natural gas hydrate production aims to keep the in situ reservoir as undisturbed as possible. However, as the fluid rises through the annulus, the pressure in the pipe decreases continuously and the temperature increases gradually. Under these conditions, the hydrate gradually dissociates inside the production riser and releases a large amount of gas. This process forms a complex nonequilibrium multiphase flow in the pipe. A schematic of the natural gas hydrate trial production process in the Shenhu area of the South China Sea is shown in Figure 1.
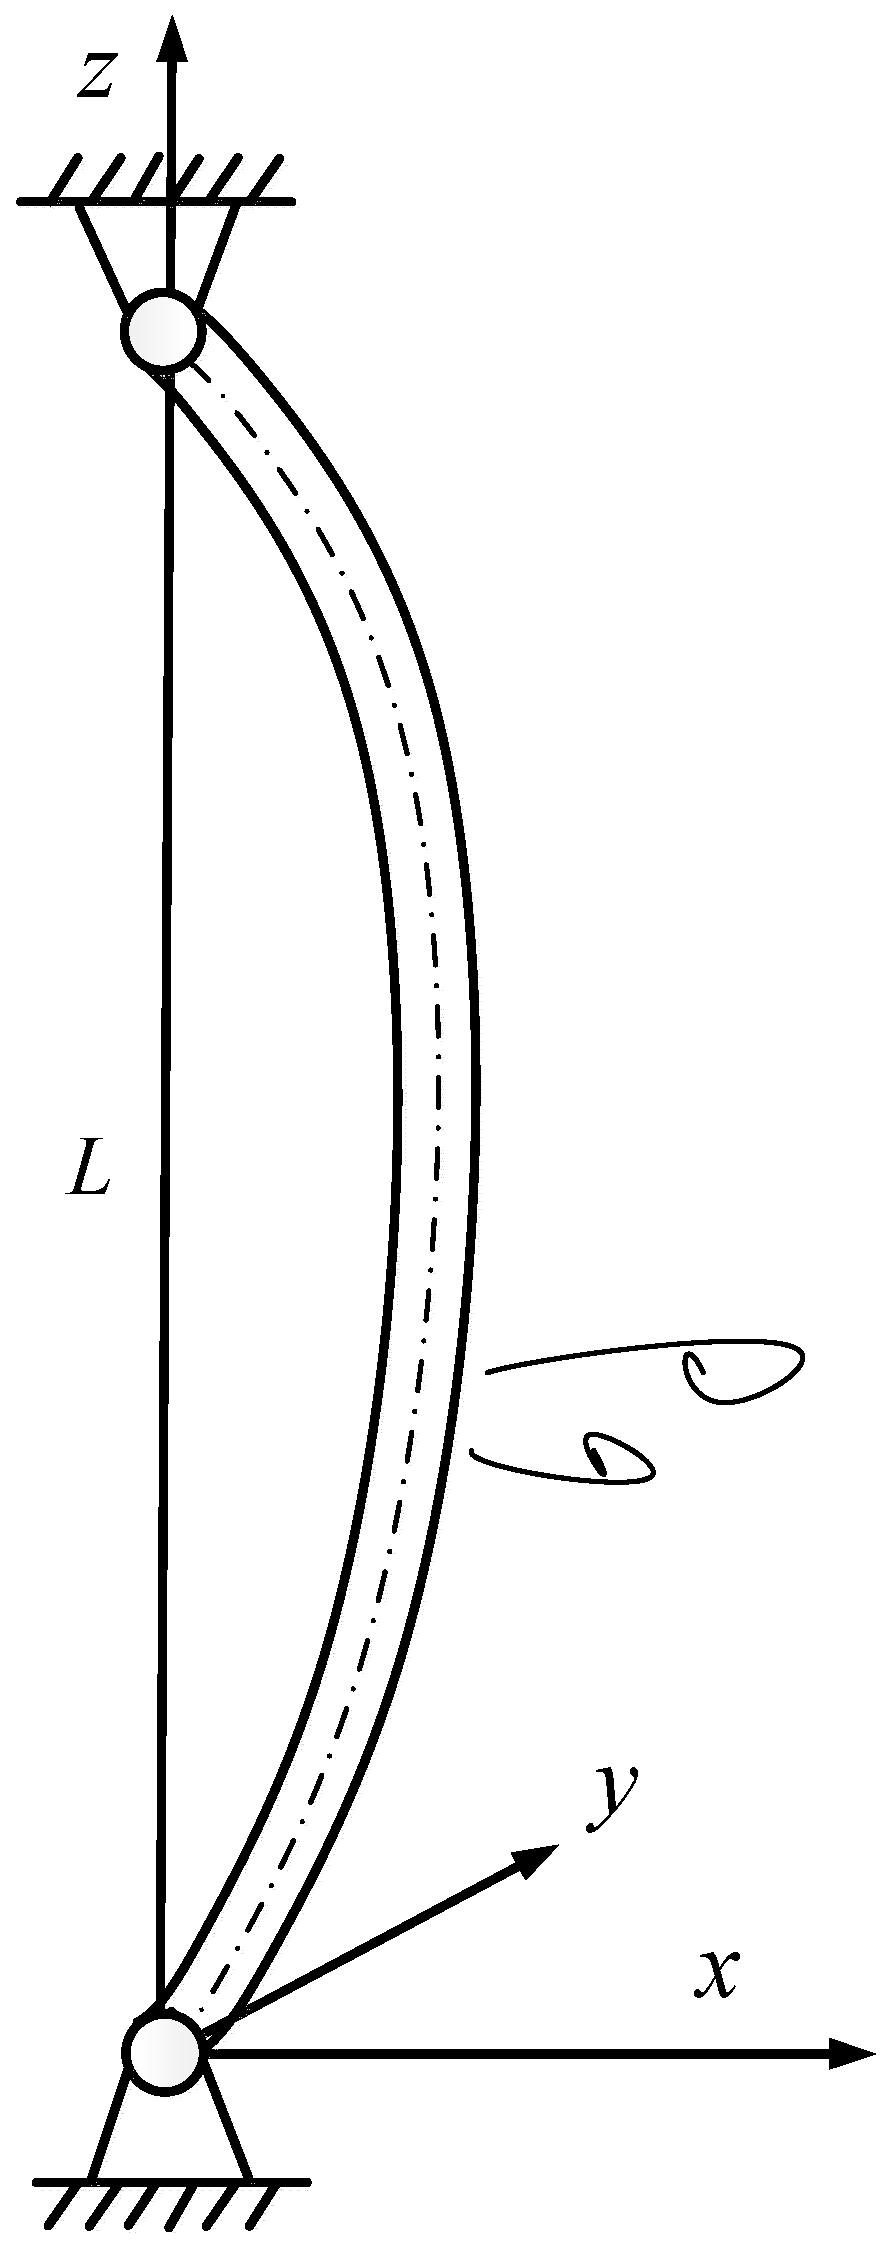
Neglecting the coiled tubing inside the riser, the natural gas hydrate trial production riser is subjected to marine environmental loads. Because it has a large length-to-diameter ratio, it can be modeled as a thin-walled beam. During hydrate transport in the trial production riser, changes in temperature and pressure cause hydrate dissociation and gas release, which leads to a complex multiphase flow inside the pipe. The riser can therefore be further simplified as a pipe conveying internal multiphase flow with hinged supports at both ends. When the riser is exposed to a transverse ocean current, it undergoes large bending deformation. Meanwhile, vortex shedding occurs as seawater flows past the cylindrical pipe and generates vortex-induced forces, which in turn excite vortex-induced vibration of the riser. A mechanical model of the hydrate trial production riser is established by taking the x-axis along the current direction, the y-axis perpendicular to the current direction, and the z-axis upward from the seabed, as shown in Figure 2.
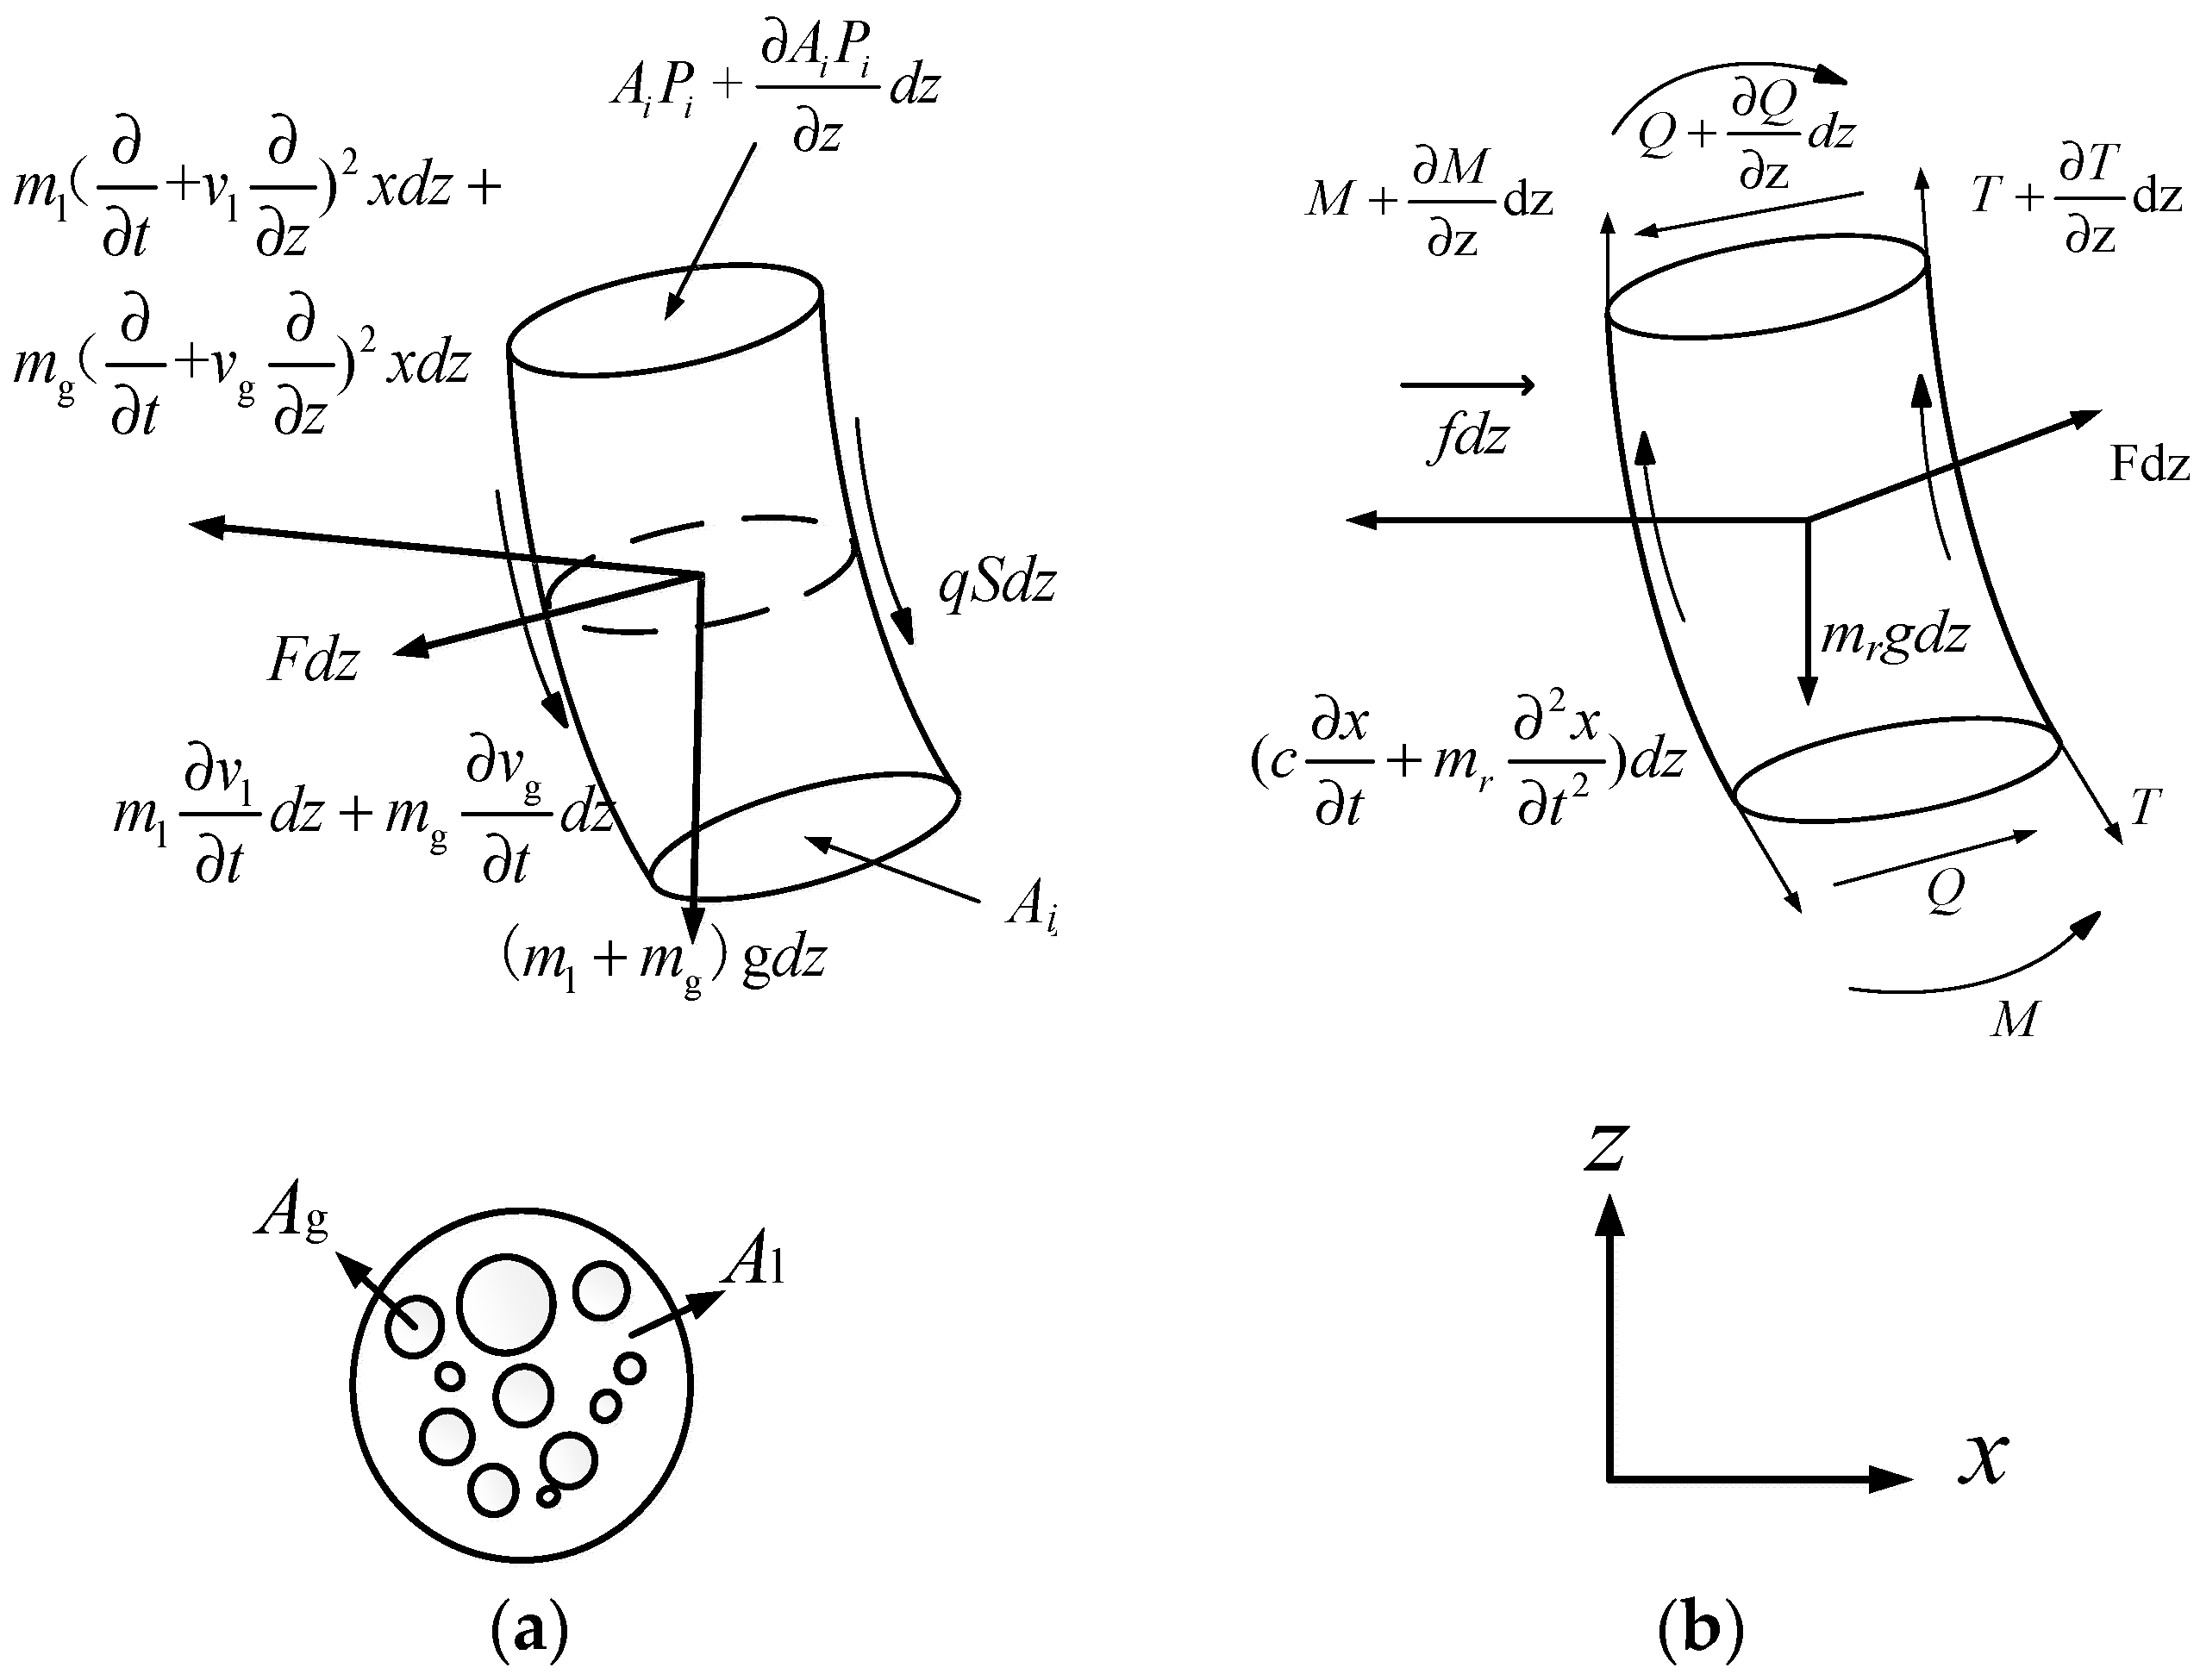
The bending deformation of the hydrate trial production riser is assumed to satisfy the plane-section assumption in mechanics of materials. A riser element and an internal fluid element are selected, as shown in Figure 3. The following assumptions are made:
  • The riser is elastic and obeys Hooke’s law.
  • The riser is simplified as a beam, and the axial shear force is neglected.
  • The hydrate in the slurry entering the bottom of the riser is assumed to be undissociated.
  • After hydrate dissociation, the internal flow in the riser is simplified as gas–liquid two-phase flow.
  • The solid particles are uniformly distributed in the liquid phase.
Figure 3. Force analysis of an infinitesimal segment of the hydrate trial production riser: (a) free-body diagram of the internal fluid element, (b) free-body diagram of the riser element.
Jmse 14 00785 g003
A i P i + A i P i z d z is the internal pressure acting on the upper surface of the fluid element; m l ( t + v l z ) 2 x d z + m g ( t + v g z ) 2 x d z is the inertial force caused by the axial acceleration of the pipe and fluid; m l v l t d z + m g v g t d z is the unsteady momentum change rate of the system in the axial direction; ( m l + m g ) g d z is the total gravity of the fluid element segment; Ag and Al are the cross-sectional areas of the gas phase and liquid phase, respectively; M + M z dz is the bending moment acting on the upper surface of the element; Q + Q z d z is the shear force on the upper surface of the element; T + T z dz is the axial tension on the upper surface of the element; ( c x t + m r 2 x t 2 ) d z is the sum of the damping force and inertial force acting on the element; mrgdz is the gravity of the element; fdz is the external load acting on the element; Fdz is the transverse external force per unit length.
Based on the force analysis of the two-phase flow fluid element inside the riser and the trial production riser element, the force balance equations in the x-direction are established separately.
For the multiphase-flow fluid element inside the riser, the force balance equation in the x-direction is:
m l t + v l z 2 + m g t + v g z 2 x F q S x z z A i P i x z = 0 ,
where m l and m g is represent the mass of the liquid and gas phases in the multiphase fluid within the riser, respectively; v l and v g denote the respective flow velocities of the liquid and gas phases; x is the transverse displacement of the riser in the inline direction; F represents the transverse interaction force exerted by the riser wall on the internal fluid element in the inline direction; q S is the gravity of the fluid per unit length; A i is the internal cross-sectional area of the riser; P i denotes the internal pressure of the fluid within the pipe.
For the infinitesimal element of the trial production riser, the force balance equation in the x-direction is:
c x t m r 2 x t 2 + F + q S x z + Q z + z T x z + z A e P e x z + f y = 0 ,
where c represents the structural damping coefficient of the riser; m r is the mass per unit length of the riser; Q denotes the shear force on the cross-section of the riser; T is the effective tension acting on the riser; A e represents the external cross-sectional area of the riser; P e is the hydrostatic pressure exerted by the surrounding seawater; f y denotes the external hydrodynamic force exerted by the marine environment per unit length of the riser.
The shear force Q and bending moment M can be expressed as:
Q = E I d 3 y d z 3 ,
M = E I 2 x z 2 ,
where E represents the modulus of elasticity of the riser material; I is the moment of inertia of the riser cross-section; M denotes the internal bending moment generated across the internal section of the beam to resist bending.
By combining Equations (1)–(4), the vibration equations of the trial production riser in the x- and y-directions can be obtained, while accounting for the dissociation of internal hydrate into two-phase flow:
m υ + m a + m i υ ¨ x + c υ ˙ x + 2 m i V υ ˙ x + m i V 2 υ x T e υ x + E I υ x = F D ,
m υ + m a + m i υ ¨ y + c υ ˙ y + 2 m i V υ ˙ y + m i V 2 υ y T e υ y + E I υ y = F L ,
where m υ represents the mass per unit length of the riser; m a is the added mass; m i is the mass of the internal fluid; V denotes the flow velocity of the internal fluid; υ ¨ x   υ ˙ x and υ x represent the displacement, velocity, and acceleration of the riser in the inline direction, respectively; T e is the effective tension of the riser; υ x denotes the elastic restoring force resisting bending in the inline direction; F D is the drag force. υ ¨ y   υ ˙ y and υ y represent the displacement, velocity, and acceleration in the cross-flow direction, respectively; υ y is the elastic restoring force resisting bending in the cross-flow direction; F L is the lift force.
At the same time, both the self-weight of the riser and the weight of the internal fluid should be considered. Therefore, the effective tension along the riser varies with depth [14]. The sectional tension T = T(z) can be expressed as:
T ( z ) = T top g z l m r + m l + m g ρ w π 4 D 0 2 d z ,
where T top is the Top tension (N), ρ w is the seawater density (kg/m3), and D 0 is the outer diameter of the riser (m).

2.1.2. Multiphase Flow Model for Hydrate Dissociation

During natural gas hydrate trial production, hydrate inside the riser undergoes phase change and dissociation, causing the internal flow to become multiphase. If the solid particles are assumed to be uniformly distributed in the liquid phase, the solid and liquid phases can be treated together as a homogeneous fluid. Under this assumption, the multiphase flow inside the riser can be simplified as a gas–liquid two-phase flow model. The two-phase flow model considering hydrate dissociation is given as follows [27]:
The continuity equation for the gas phase in the hydrate trial production riser is:
( ρ g v g E g A ) z + ( ρ g E g A ) t = A x g r H
The continuity equation for the liquid phase in the hydrate trial production riser is:
( ρ l v l E l A ) z + ( ρ l E l A ) t = A x g r H ,
where ρ is the density of the gas/liquid phase (kg/m3), v is the velocity of the gas/liquid phase (m/s), E the volume fraction of the gas/liquid phase (/), A is the cross-sectional area inside the pipe (m2), x g is the mass fraction of natural gas contained in the hydrate (/), r H is the hydrate dissociation rate (m3/s).
According to the conservation of momentum, the mixture momentum equation for the internal fluid is established as:
t ( ρ l v l E l + ρ g v g E g ) + P z + F r z + z ( ρ l v l 2 E l + ρ g v g 2 E g ) + ( ρ l E l + ρ g E g ) g = 0
Based on the law of energy conservation and taking into account the heat absorption during hydrate dissociation, the energy equation for the fluid in the pipe is derived as:
t ρ g E g C pg T a A + ρ l E l C l T a A + A r H · Δ H H M H w g C pg T a z + w l C l T a z = 2 A T T a ,
A = 1 2 π d U a ,
where P is the pressure (Pa), F is the frictional resistance (Pa), C is the specific heat capacity of the gas/liquid phase (J · kg−1 · °C−1), T a is the temperature inside the pipe (°C), T is the seawater temperature (°C), U a is the overall heat transfer coefficient (/).
The hydrate dissociation rate in the trial production riser can be calculated using the classical model proposed by Kim et al. [28]:
r H = k A s P eq exp 1 Δ E R T 1 P g P eq ,
where P eg is the hydrate phase-equilibrium pressure, which can be calculated from the empirical equation proposed by Dzyuba and Zektser [29]:
P eq = e T 264.9661 9.6339
During hydrate trial production, the pressure inside the pipe changes with water depth, fluid mass, and fluid velocity. The pressure drop inside the pipe can be expressed as:
d p d z = ρ l + ρ g g + 2 f x v l 2 ρ l + v g 2 ρ g D 0 D i + ρ l v l d v l d z + ρ g v g d v g d z
The masses of the gas and liquid phases in the riser can be written as:
m g = ρ g A g = ρ g E g A m l = ρ l A l = ρ l E l A ,
where k is the hydrate dissociation rate constant (/), A s is the total dissociation area of hydrate (m2), P g is the gas-phase pressure (Pa), Δ E is the activation energy for hydrate thermal dissociation (J), P eq is the hydrate phase-equilibrium pressure (Pa), f x is the flow friction factor (/), D 0 is the outer diameter of the hydrate trial production riser (m), D i is the inner diameter of the hydrate trial production riser (m).
The remaining auxiliary equations are calculated using the classical model proposed by Hasan et al. [30], which has been widely applied in the petroleum industry.

2.1.3. Fluid-Force Model

In this study, a shear-current profile is used in the fluid-force model to represent the ocean-current load, which better reflects actual conditions. The fluid-force loads acting on the riser in the x- and y-directions are expressed as follows.
F x = 1 2 ρ w U c 2 D 0 C ¯ d ρ w U c D 0 C ¯ d υ x t + 1 2 ρ w U c 2 D 0 C D ,
F y = 1 2 ρ w U c D 0 C ¯ d υ y t + 1 2 ρ w U c 2 D 0 C L ,
where C ¯ d is the steady drag coefficient, which is taken as 1.2, whereas the fluctuating drag coefficient C D and fluctuating lift coefficient C L are determined from the wake oscillator variables.

2.1.4. Wake Oscillator Model

The coupling terms in the wake oscillator model are described using the nonlinear van der Pol equation. The dimensionless wake oscillator equations are written as follows:
q ¨ x + ε x ω s q x 2 1 q ˙ x + 2 ω s 2 q x = A x D 0 υ ¨ x
q ¨ y + ε y ω s q y 2 1 q ˙ y + 2 ω s 2 q y = A y D 0 υ ¨ y
The vortex shedding frequency ω s is determined by the external ocean current velocity and can be expressed as:
ω s = 2 π S t U c υ ˙ x D 0 ,
where q x is the dimensionless wake oscillator variable in the in-line direction, q y is the dimensionless wake oscillator variable in the cross-flow direction, S t is the Strouhal number, which is generally taken as 0.2, ε x is taken as 1.2, ε y is taken as 0.3, A x is taken as 48, A y is taken as 12.
The fluctuating drag coefficient C D and fluctuating lift coefficient C L can be expressed in terms of the wake oscillator variables q x and q y , respectively, as:
C D = C d q x 2
C L = C l q y 2

2.2. Coupled Dynamic Equations with Hydrate Phase Change Inside the Pipe

By combining the equations presented in Section 2.1, the nonlinear dynamic governing equations for the hydrate trial production riser, with hydrate phase change inside the pipe taken into account, are obtained as follows:
m υ ¨ x + c + 2 c υ ˙ x + 2 m i V υ ˙ x + E I υ x T e υ x + m i V 2 υ x = 1 2 ρ w U c 2 D 0 C ¯ d + 1 2 ρ w U c 2 D 0 C d q x 2 m υ ¨ y + c + c υ ˙ y + 2 m i V υ ˙ y + E I υ y T e υ y + m i V 2 υ y = 1 2 ρ w U c 2 D 0 C l q y 2 q ¨ x + ε x ω s q x 2 1 q ˙ x + 2 ω s 2 q x = A x D 0 υ ¨ x q ¨ y + ε y ω s q y 2 1 q ˙ y + 2 ω s 2 q y = A y D 0 υ ¨ y

2.3. Boundary Conditions

The hydrate trial production riser is assumed to be simply supported at both ends. Therefore, the boundary conditions are given by:
υ x 0 , t = 0 ; 2 υ x 0 , t 2 z = 0 υ y 0 , t = 0 ; 2 υ y 0 , t 2 z = 0 υ x L , t = 0 ; 2 υ x L , t 2 z = 0 υ y L , t = 0 ; 2 υ y L , t 2 z = 0

3. Solution of the Dynamic Model with Hydrate Phase Change Inside the Pipe

3.1. Model Discretization and Matrix Formulation

Equation (24), which governs the hydrate production riser, is solved using the finite difference method. The classical equation of motion in structural dynamics is written as follows [31]:
M u + C u + K u = f
where M , C , and K are the mass, damping, and stiffness matrices, respectively; {f} is the external load vector; and u , u and u are the acceleration, velocity, and displacement vectors, respectively.
The hydrate production riser model is discretized into N elements using Hermite cubic interpolation. Assuming that each hydrate trial production riser element has the same length, l , its shape functions are expressed as the following polynomials:
N 1 = 1 3 z 2 / l 2 + 2 z 3 / l 3 N 2 = z 2 z 2 / l + z 3 / l 2 N 3 = 3 z 2 / l 2 2 z 3 / l 3 N 4 = z 2 / l + z 3 / l 2
Discretization of the vortex-induced vibration equation of the hydrate trial production riser yields the mass, damping, and stiffness matrices in structural dynamics.
The element mass matrix is expressed as:
M e = 0 l N i ( m r + m g + m l ) N j d z = l N i m N j d z
The element damping matrix is expressed as:
C e = 0 l N i ( 2 m g v g + 2 m l v l ) N j z d z + 0 l N i c + c N j d z
The element stiffness matrix is expressed as:
K e = K e 1 + K e 2 + K e 3 + K e 4
K e 1 = E I 0 l 2 N i z 2 T 2 N j z 2 d z K e 2 = 0 l N i z T m g v g 2 + m l v l 2 T N j z d z K e 3 = 0 l N i z T m r g + m g + m l 2 m e g z N j z d z K e 4 = 0 l m r g + m g + m l 2 m e g N j z d z
The element mass matrix M e , element damping matrix C e , and element stiffness matrix K e are transformed from the local coordinate system to the global coordinate system and then substituted into Equation (26) for solution. Here T denotes the transformation matrix:
M = T T M e T C = T T C e T K = T T K e T

3.2. Solution Method

In this study, the Newmark-β method is used to solve the dynamic matrix equation of the hydrate production riser, Equation (26). Time is discretized using the Lagrange mean value theorem. With the displacement, velocity, and acceleration at the initial time t 0 given, the displacement, velocity, and acceleration at the next time t i are obtained iteratively by combining the effective stiffness matrix with the effective load vector. The specific solution procedure is as follows.
  • Initial calculation and basic data preparation.
    • Select an appropriate time step Δ t , determine the values of β and γ , and calculate the following integration constants:
      γ 0.5 ,   β = 0.25 0.5 + γ 2
      a 0 = 1 β Δ t 2 ;   a 1 = γ β Δ t ;   a 2 = 1 β Δ t ;   a 3 = 1 2 β 1 ;   a 4 = γ β 1 ;   a 5 = Δ t 2 γ β 2 ;   a 6 = Δ t 1 γ ;   a 7 = γ Δ t
    • Specify the initial motion variables u ¨ 0 , u ˙ 0 and u 0 .
  • Assemble the mass matrix M , damping matrix C , and stiffness matrix K .
  • Form the effective stiffness matrix K .
    K = K + 1 β Δ t 2 M + γ β Δ t C
  • Calculate the effective load at time t i + 1 .
    P ^ i + 1 = P i + 1 + M a 0 u t + a 2 u ˙ t + a 3 u ¨ t   + C a 1 u t + a 4 u ˙ t + a 5 u ¨ t
  • Calculate the displacement at time t i + 1 .
    K ^ u t + 1 = P ^ t + 1
  • Calculate the acceleration and velocity at time t i + 1 .
    u ¨ t + 1 = a 0 u t + 1 u a 2 u ˙ t a 3 u ¨ t u ˙ t + 1 = u ˙ t + a 6 u ¨ t + a 7 u ¨ t + 1
The parameters γ and β are the most important factors affecting the accuracy and convergence of the Newmark-β method. When γ = 0.5 the method has second-order accuracy. Therefore, γ = 0.5 and 0 β 0.25 are usually adopted.
The convergence condition of the Newmark-β method is:
Δ t 1 π 2 1 γ 2 β T n
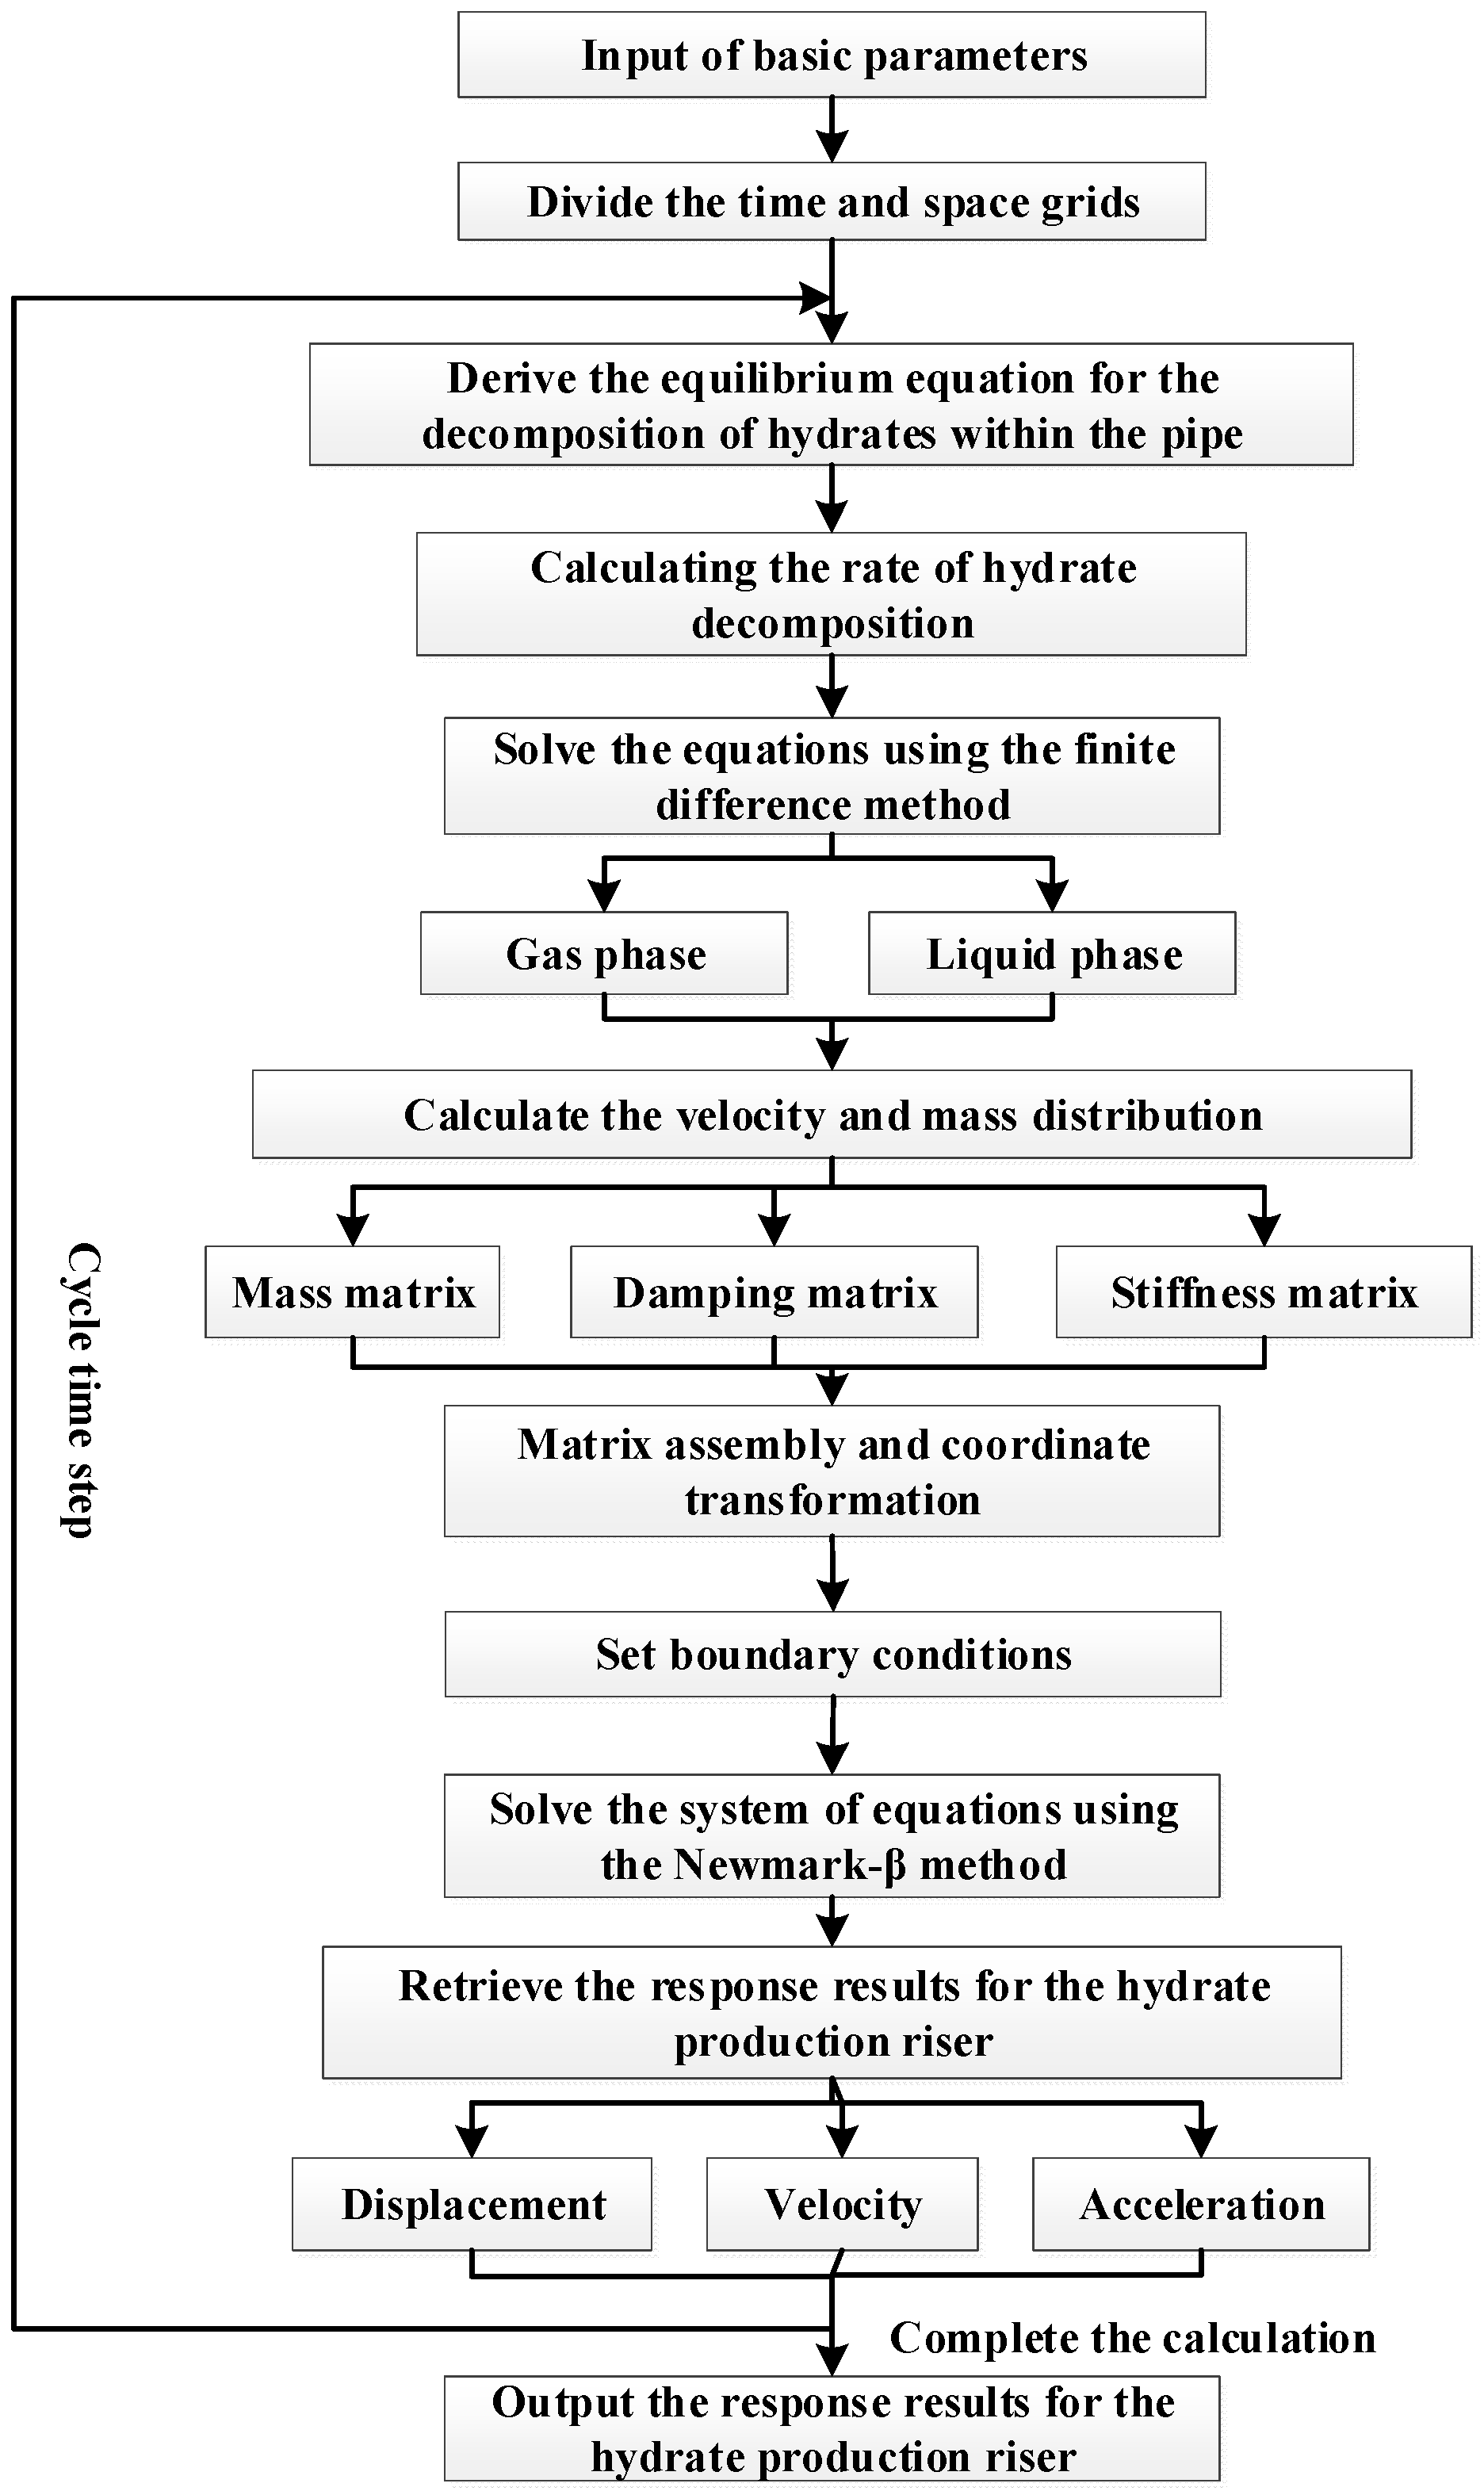
When γ = 0.5 and β = 0.25 the step-by-step integration scheme becomes the average constant acceleration method. The solution flowchart is shown in Figure 4.

3.3. Numerical Solution of the Wake Oscillator Model

The wake oscillator model is solved using the fourth-order Runge–Kutta method. The wake oscillator equations are first reduced in order, and the second-order vibration equations are rewritten as a system of first-order differential equations, as follows:
q ˙ x = c x c ˙ x = A x D 0 υ ¨ x 2 ω s 2 q x ε x ω s q x 2 1 c x q ˙ y = c y c ˙ y = A y D 0 υ ¨ y ω s 2 q y ε y ω s q y 2 1 c y
During the vibration analysis of the hydrate trial production riser, a consistent time step is used. The wake oscillator model is coupled with the riser governing equations and solved iteratively. The time-history responses of the riser displacement in the in-line and cross-flow directions are then obtained. Fast Fourier transform is further applied to the displacement time histories to determine the corresponding frequency responses.

4. Model Validation

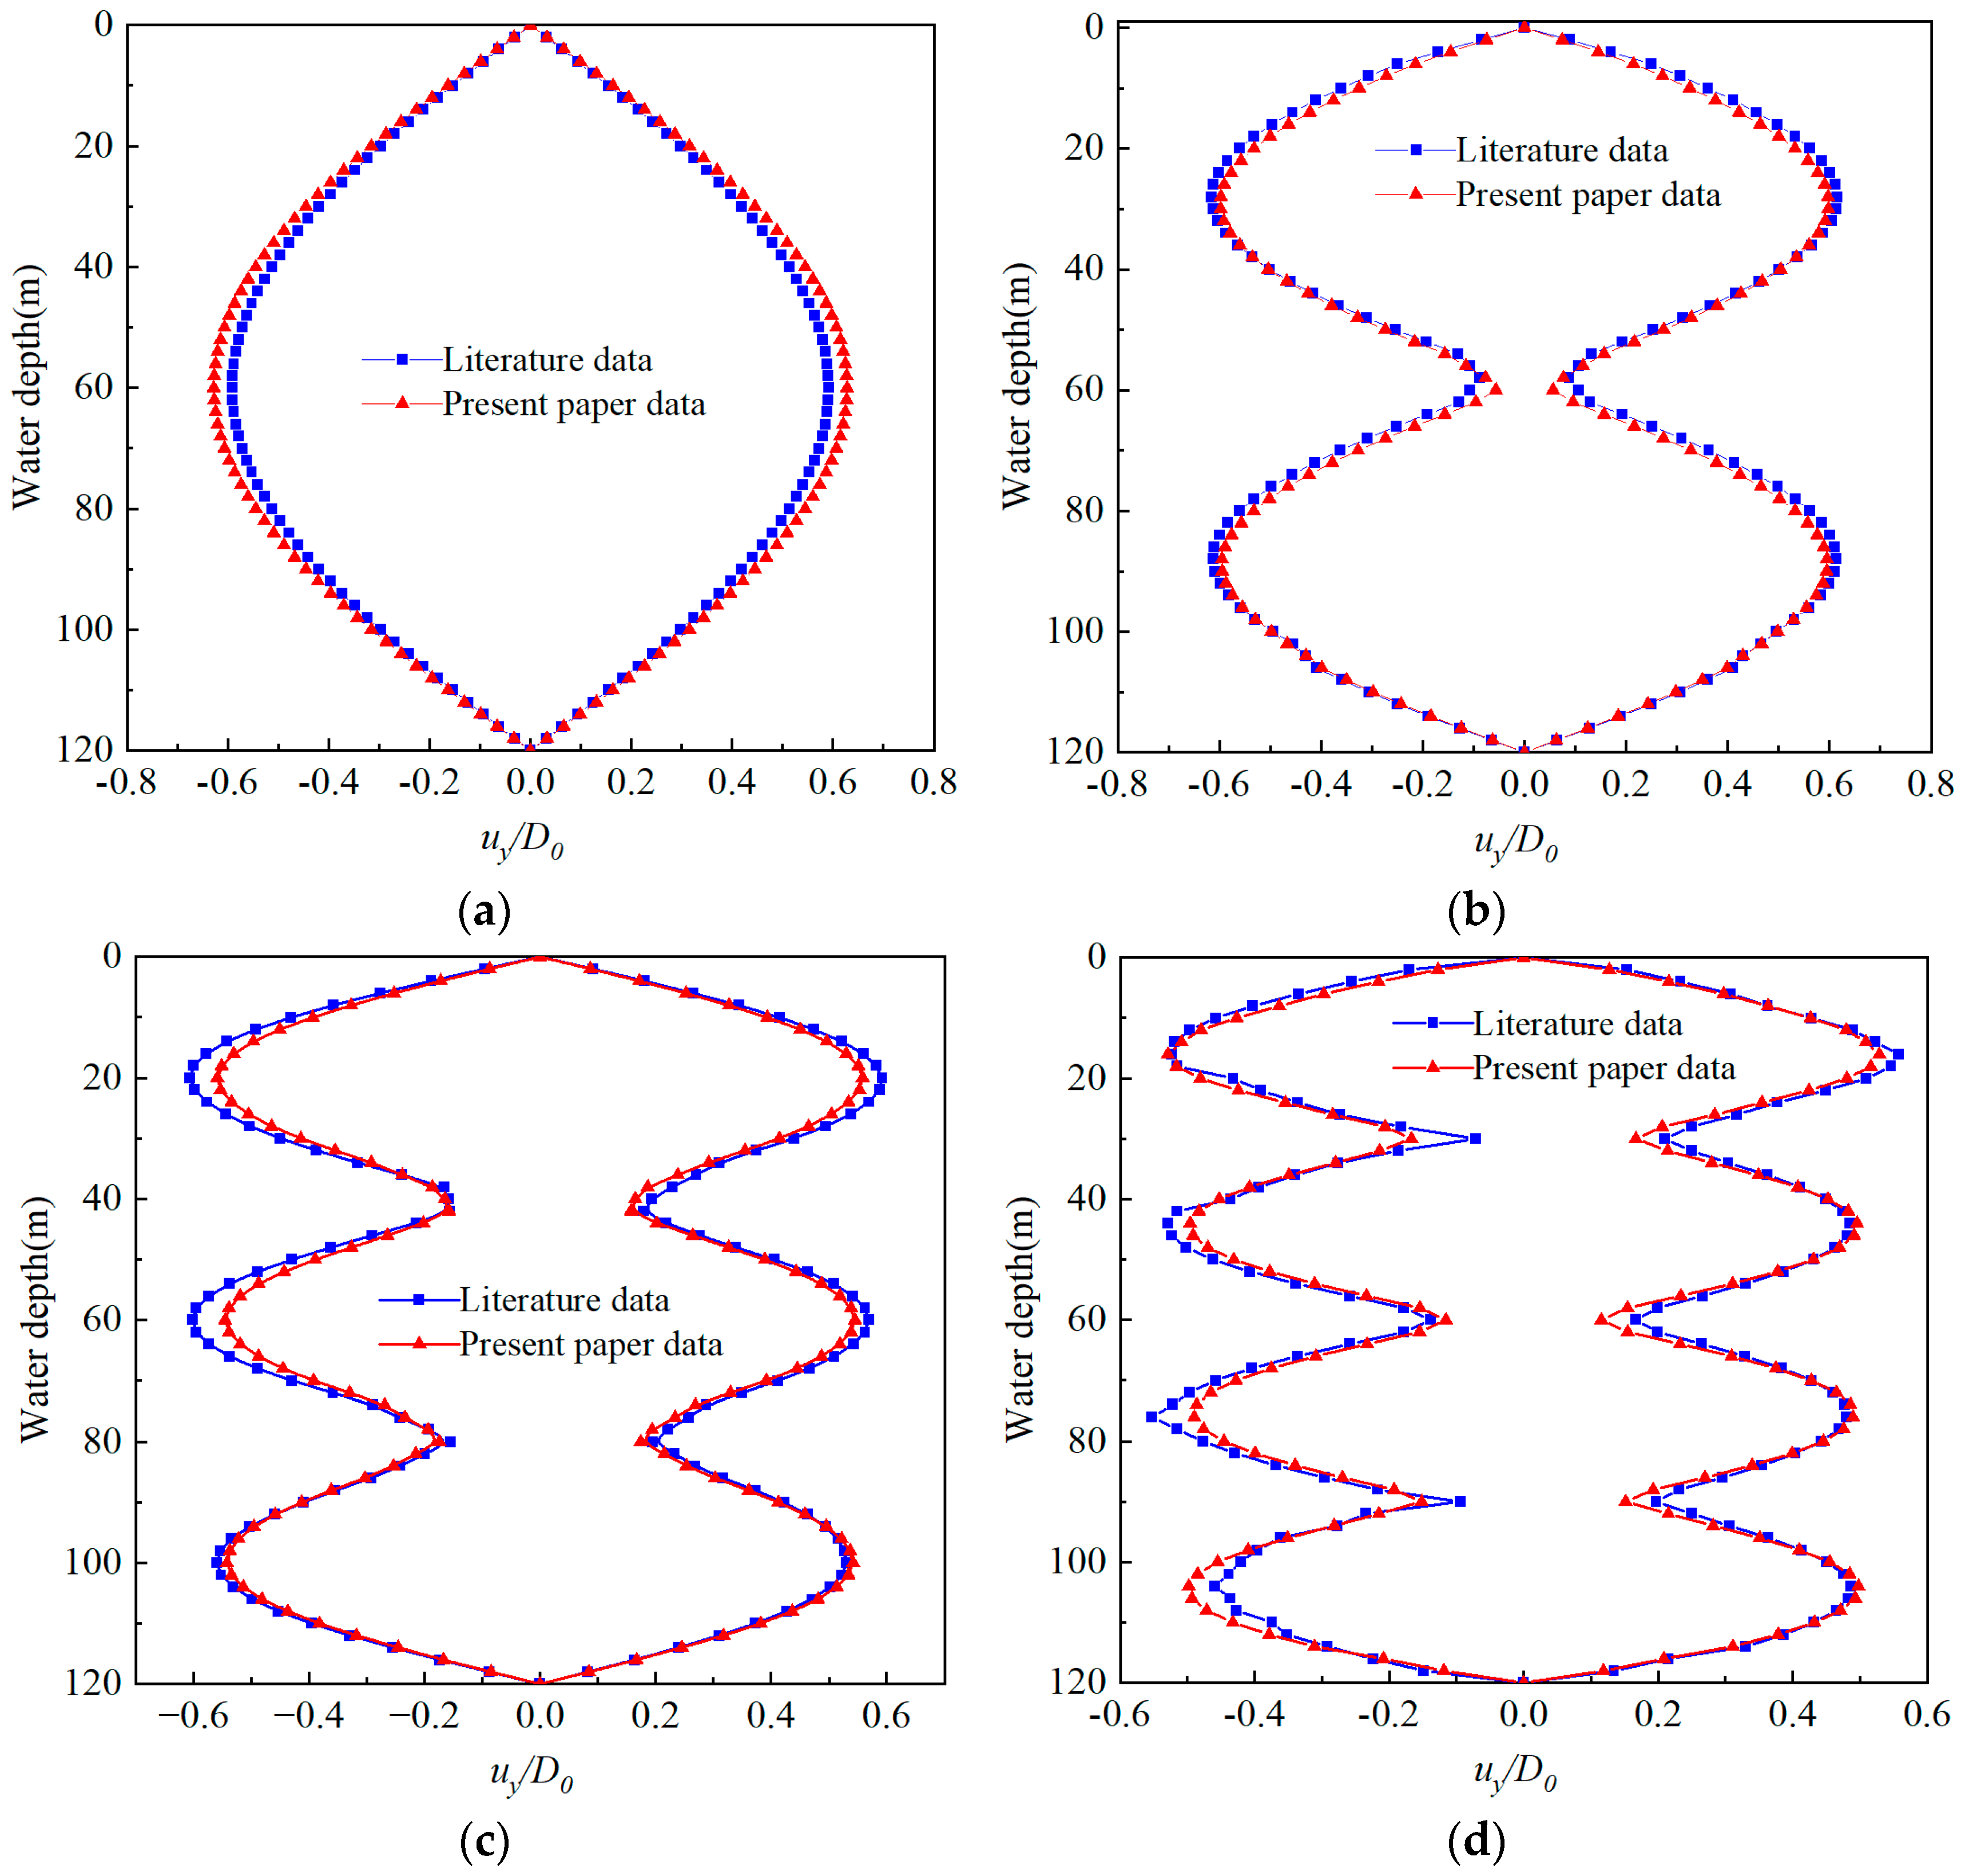
The dynamic model of the hydrate trial production riser and the coupled wake oscillator model developed in this study are validated by comparison with the CFD simulation results reported by Yamamoto et al. [23]. The basic parameters are as follows: water depth, 100 m; pipe length, 120 m; inner diameter, 0.2116 m; outer diameter, 0.25 m; pipe elastic modulus, 210 GPa; and top tension, 200 kN. The densities of the riser, seawater, and internal fluid are 7700 kg/m3, 1025 kg/m3, and 800 kg/m3, respectively.
Figure 5 compares the cross-flow (CF) vortex-induced vibration (VIV) displacement envelopes of the riser under different uniform current velocities. The calculated mode shapes are in close agreement with the simulation results of Yamamoto et al. [23], and the displacement amplitudes also match well. These results demonstrate the effectiveness and reliability of the proposed coupled model in predicting the vortex-induced vibration response of the riser.

5. Nonequilibrium Multiphase Flow in the Hydrate Trial Production Riser

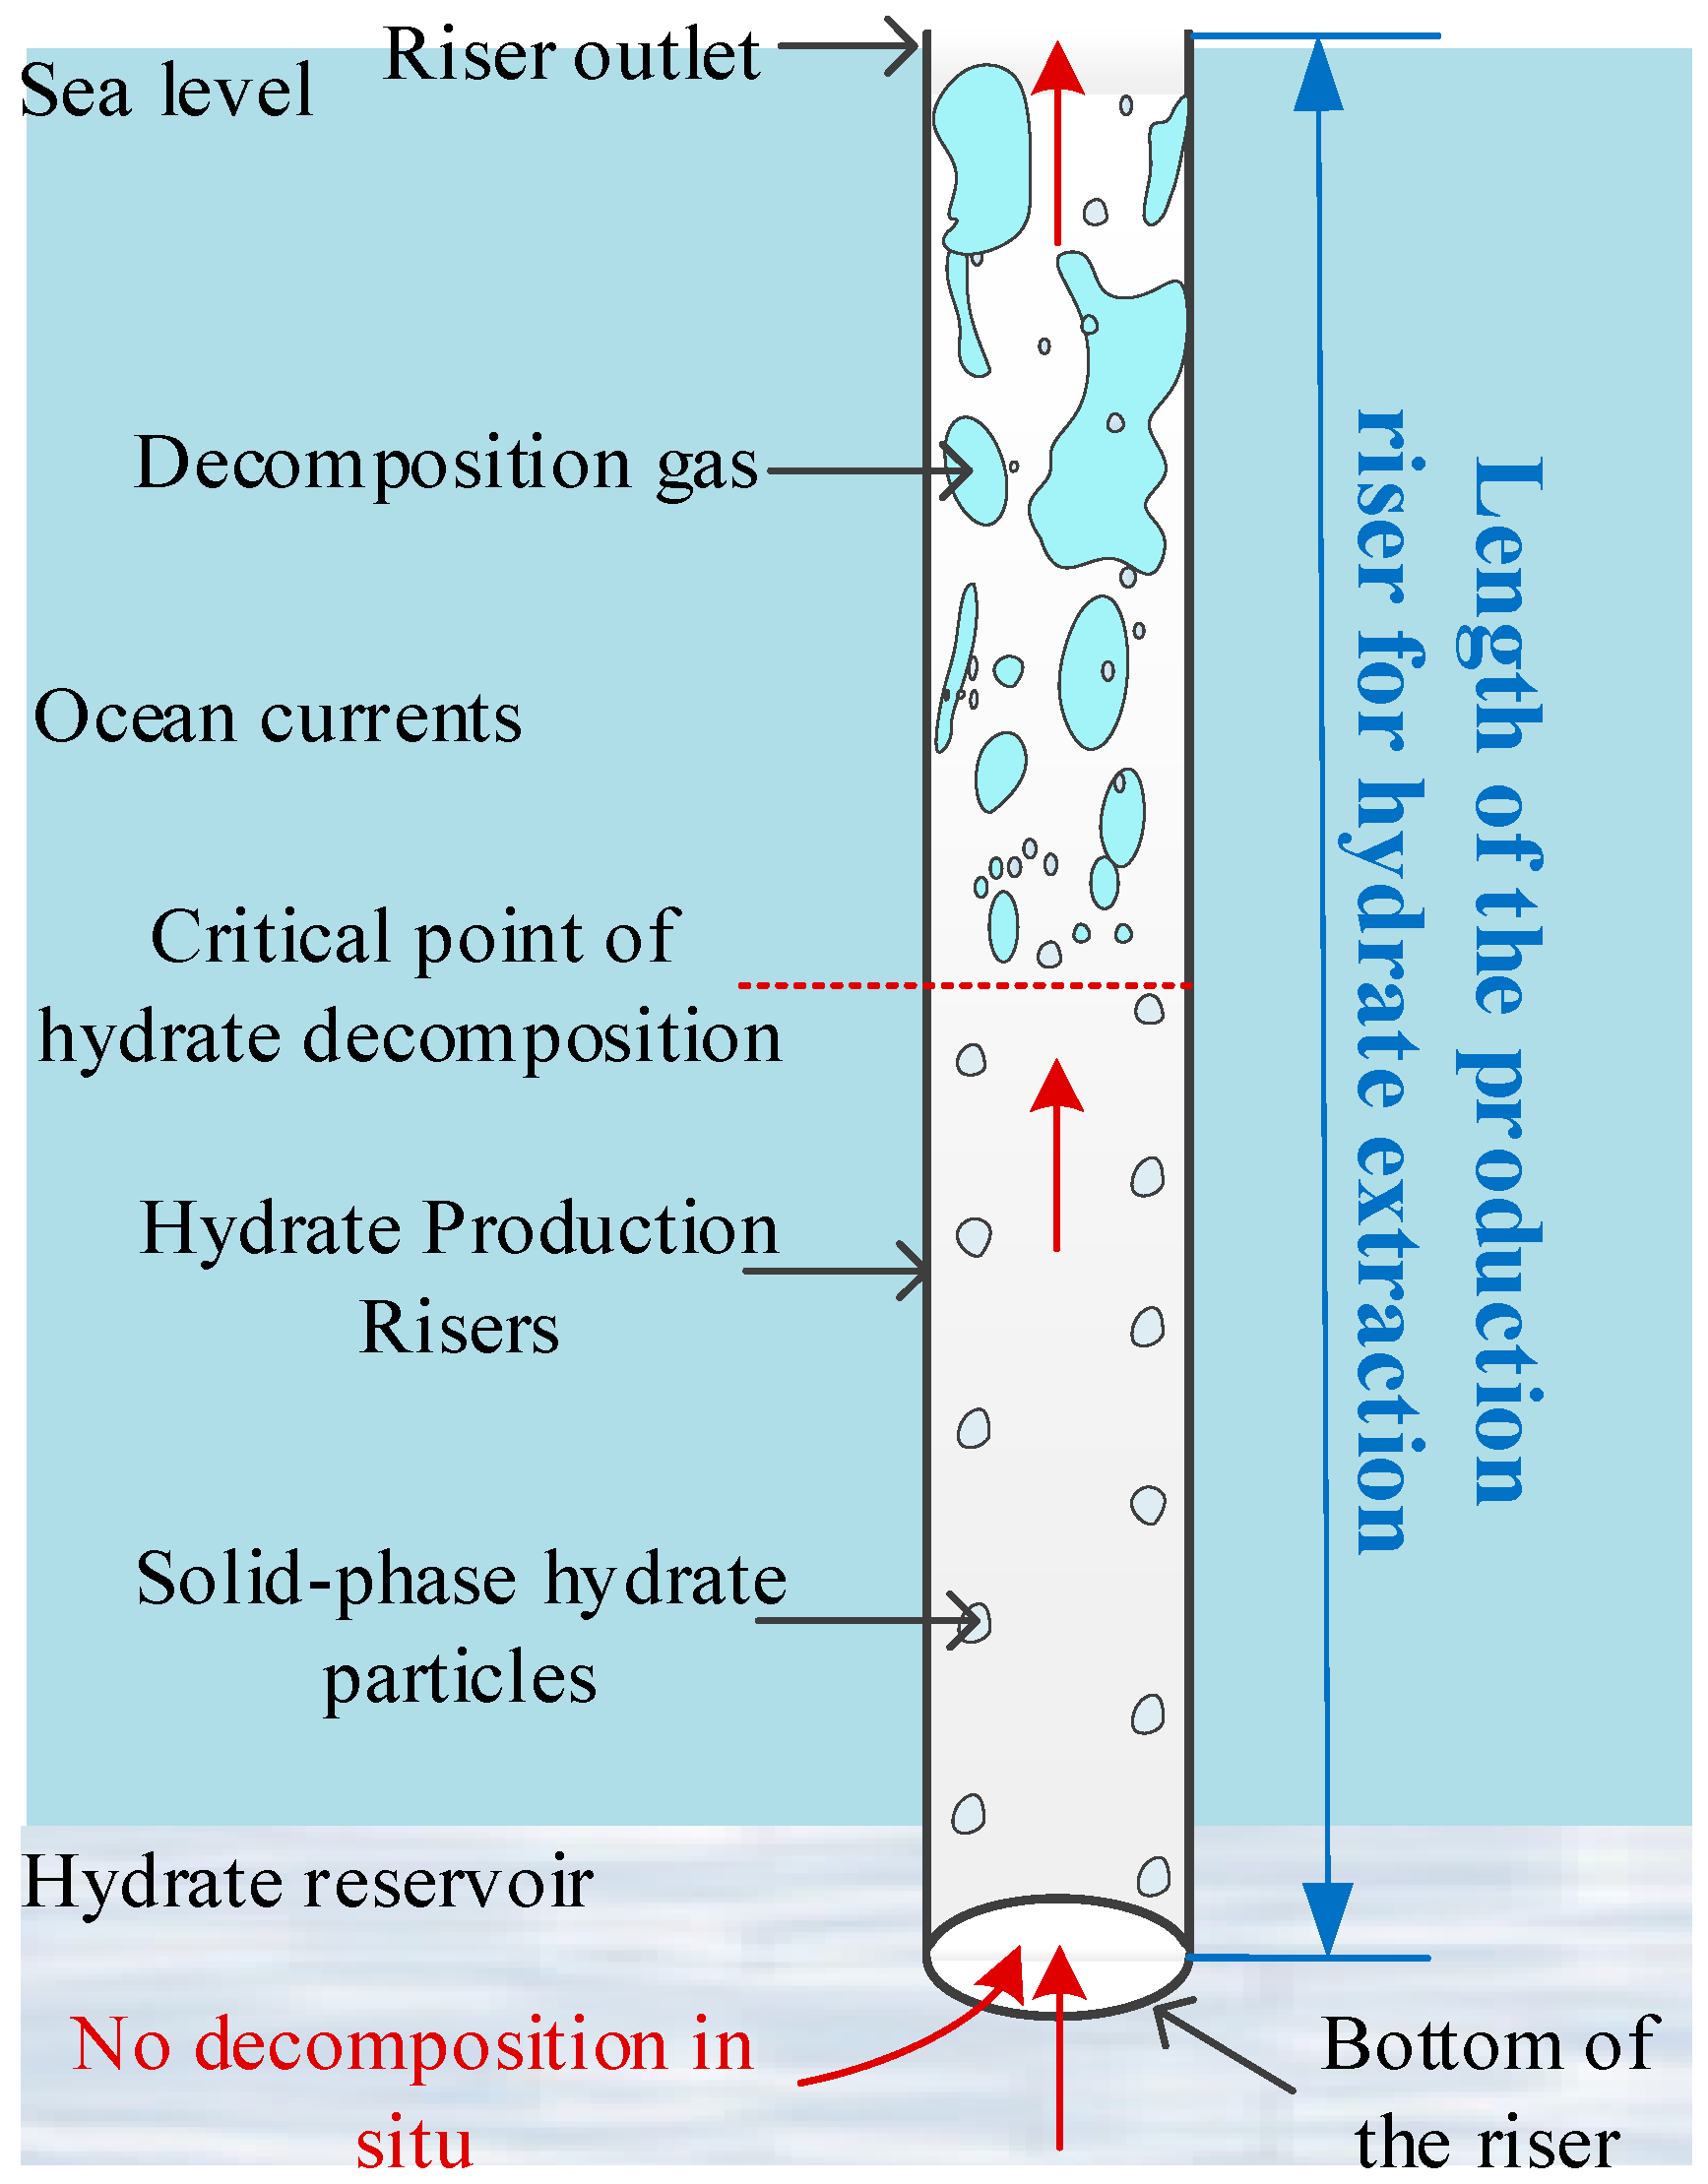
Solid hydrate particles inside the hydrate trial production riser are influenced by temperature and pressure. After reaching the critical dissociation position, they gradually dissociate into gas, and a complex nonequilibrium multiphase flow develops inside the riser. This process makes the vibration and deformation of the riser more complicated. If the bending deformation exceeds the strength limit of the riser, structural failure may occur and lead to safety accidents. A schematic of the nonequilibrium multiphase flow inside the natural gas hydrate trial production riser is shown in Figure 6.
Based on the trial production case in the Shenhu area of the South China Sea, this study investigates the dynamic behavior of a hydrate trial production riser. The riser is subjected to both marine environmental loads and internal hydrate multiphase flow. The flow behavior caused by hydrate phase change and dissociation inside the pipe is also considered. The mechanical response and vortex-induced vibration characteristics of the riser are systematically analyzed under different top tensions, slurry densities, flow rates, and outlet backpressures, while considering the effect of self-weight. The basic parameters of the hydrate trial production riser are listed in Table 1.

5.1. Effect of Top Tension on Riser Dynamics

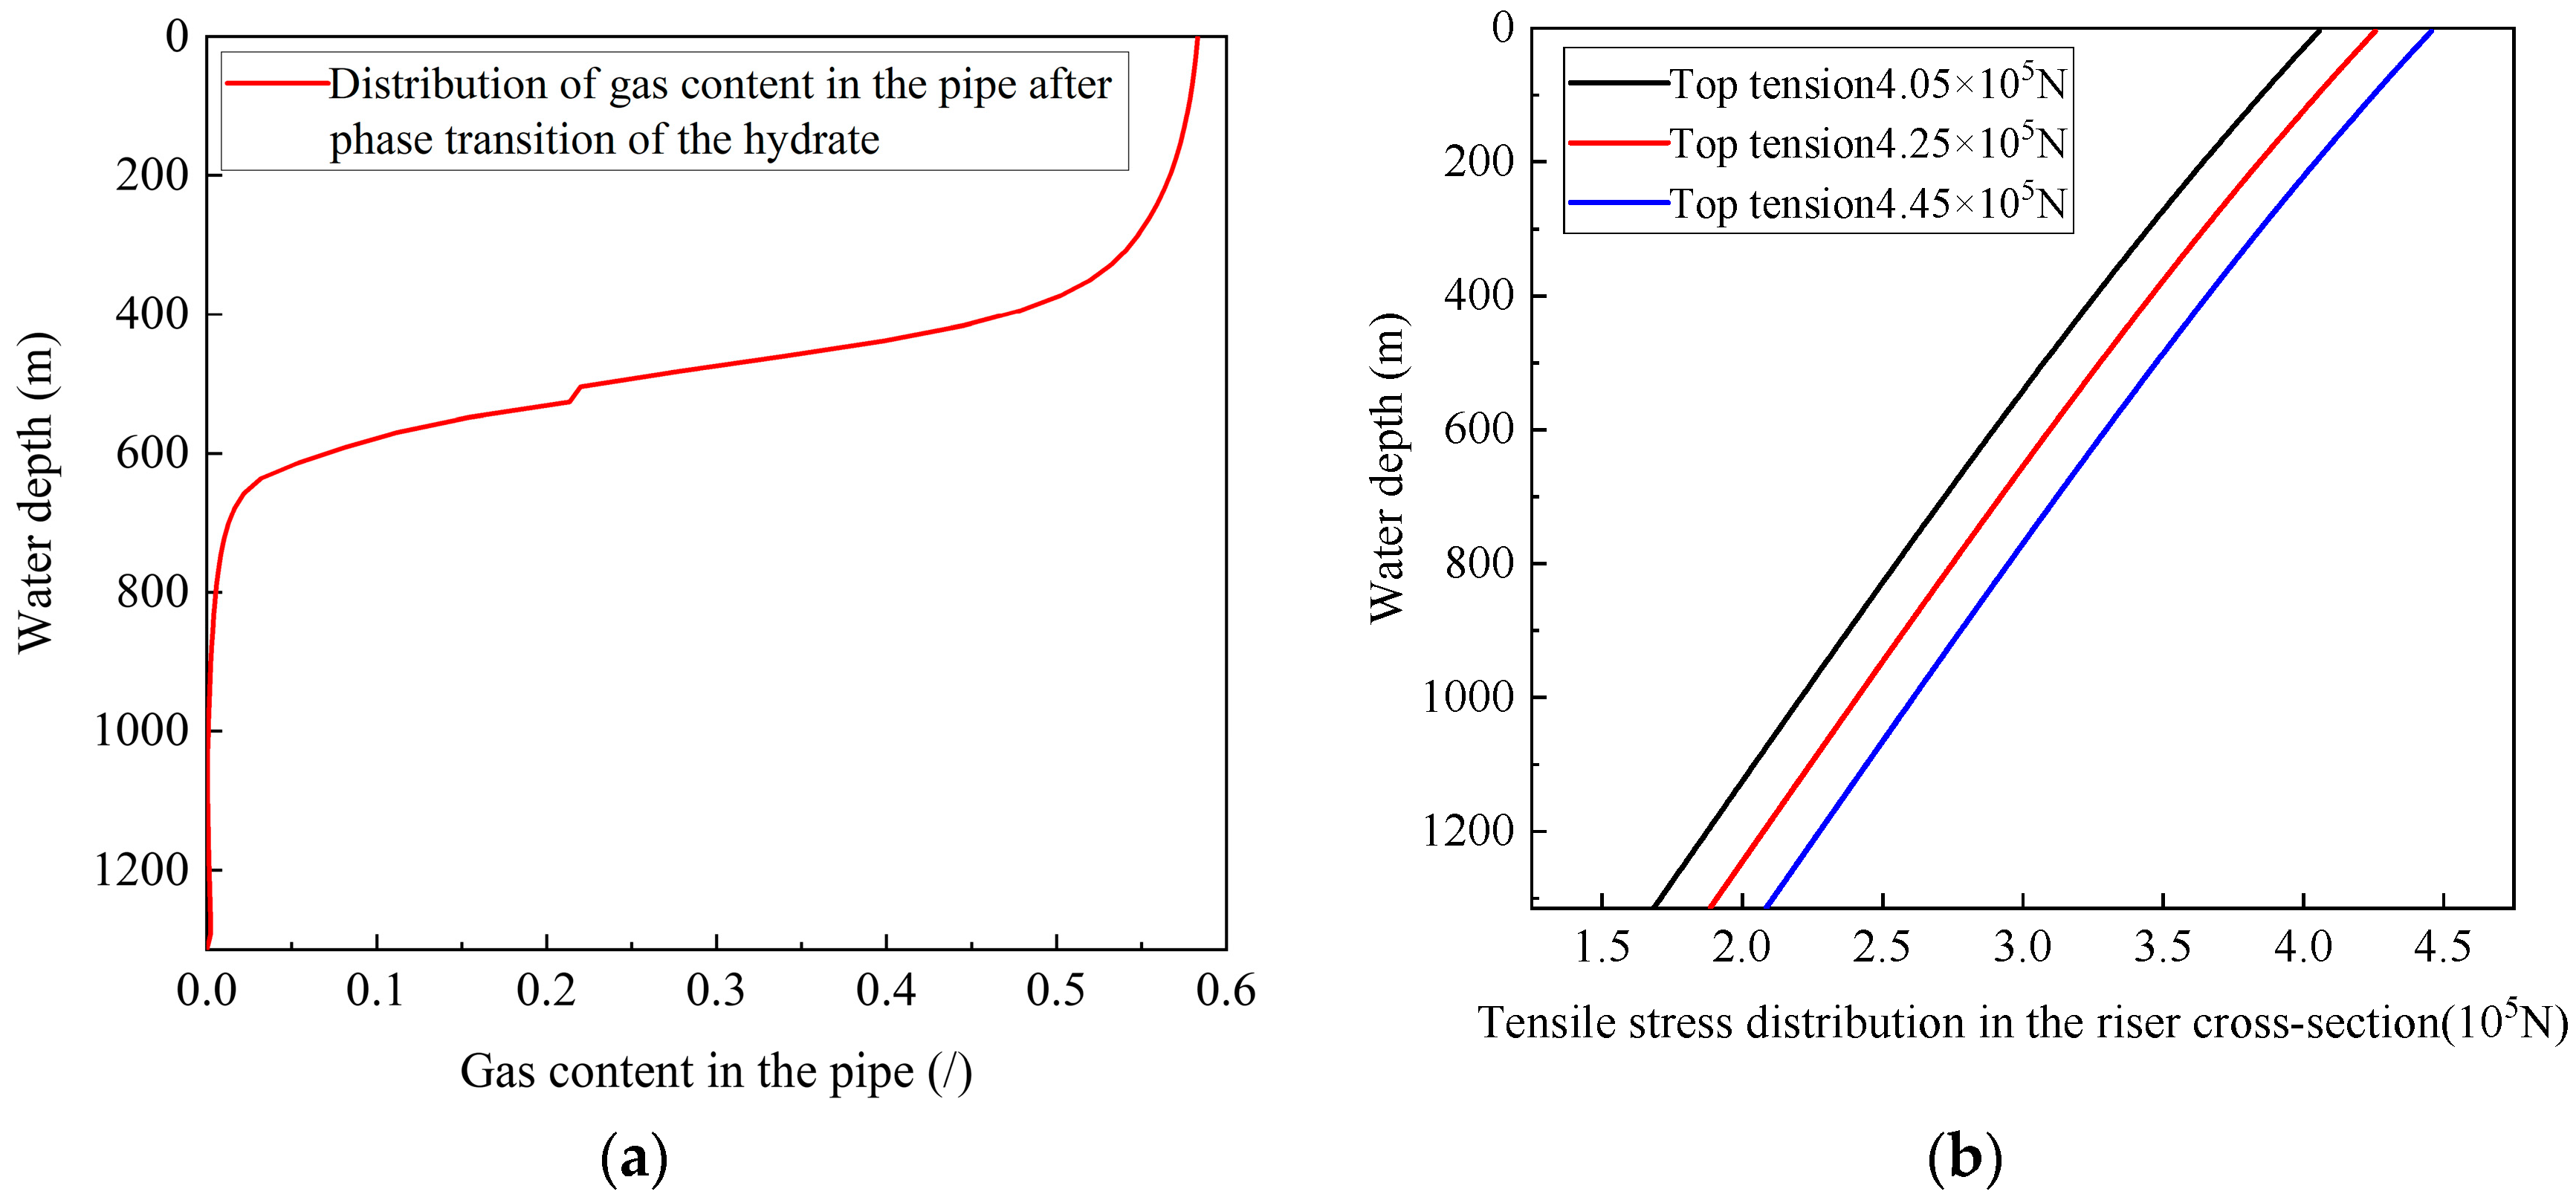
Figure 7 shows the gas holdup distribution in the riser after hydrate phase change and the sectional tension distribution of the hydrate trial production riser under different top tensions. Figure 7a shows that, during trial production, the fluid carrying solid hydrate begins to dissociate at about 800 m below the sea surface. As it rises further, the gas holdup in the riser increases gradually and reaches its maximum near the sea surface. Figure 7b shows that the sectional tension decreases with water depth and increases with top tension.
This behavior is related to the thermodynamic conditions of natural gas hydrate. Solid hydrate exists under the low-temperature and high-pressure conditions of the seabed. As the slurry carrying hydrate particles rises toward the sea surface, the pressure inside the riser decreases and the surrounding seawater temperature increases. When the dissociation conditions are reached, the hydrate begins to dissociate and releases a large amount of gas, forming a complex nonequilibrium flow inside the pipe. Because no buoyancy modules are installed on the riser, the sectional tension along its length is controlled by both the top tension and the weight of the production riser system. Under the same operating conditions, increasing the top tension significantly increases the sectional tension along the riser.
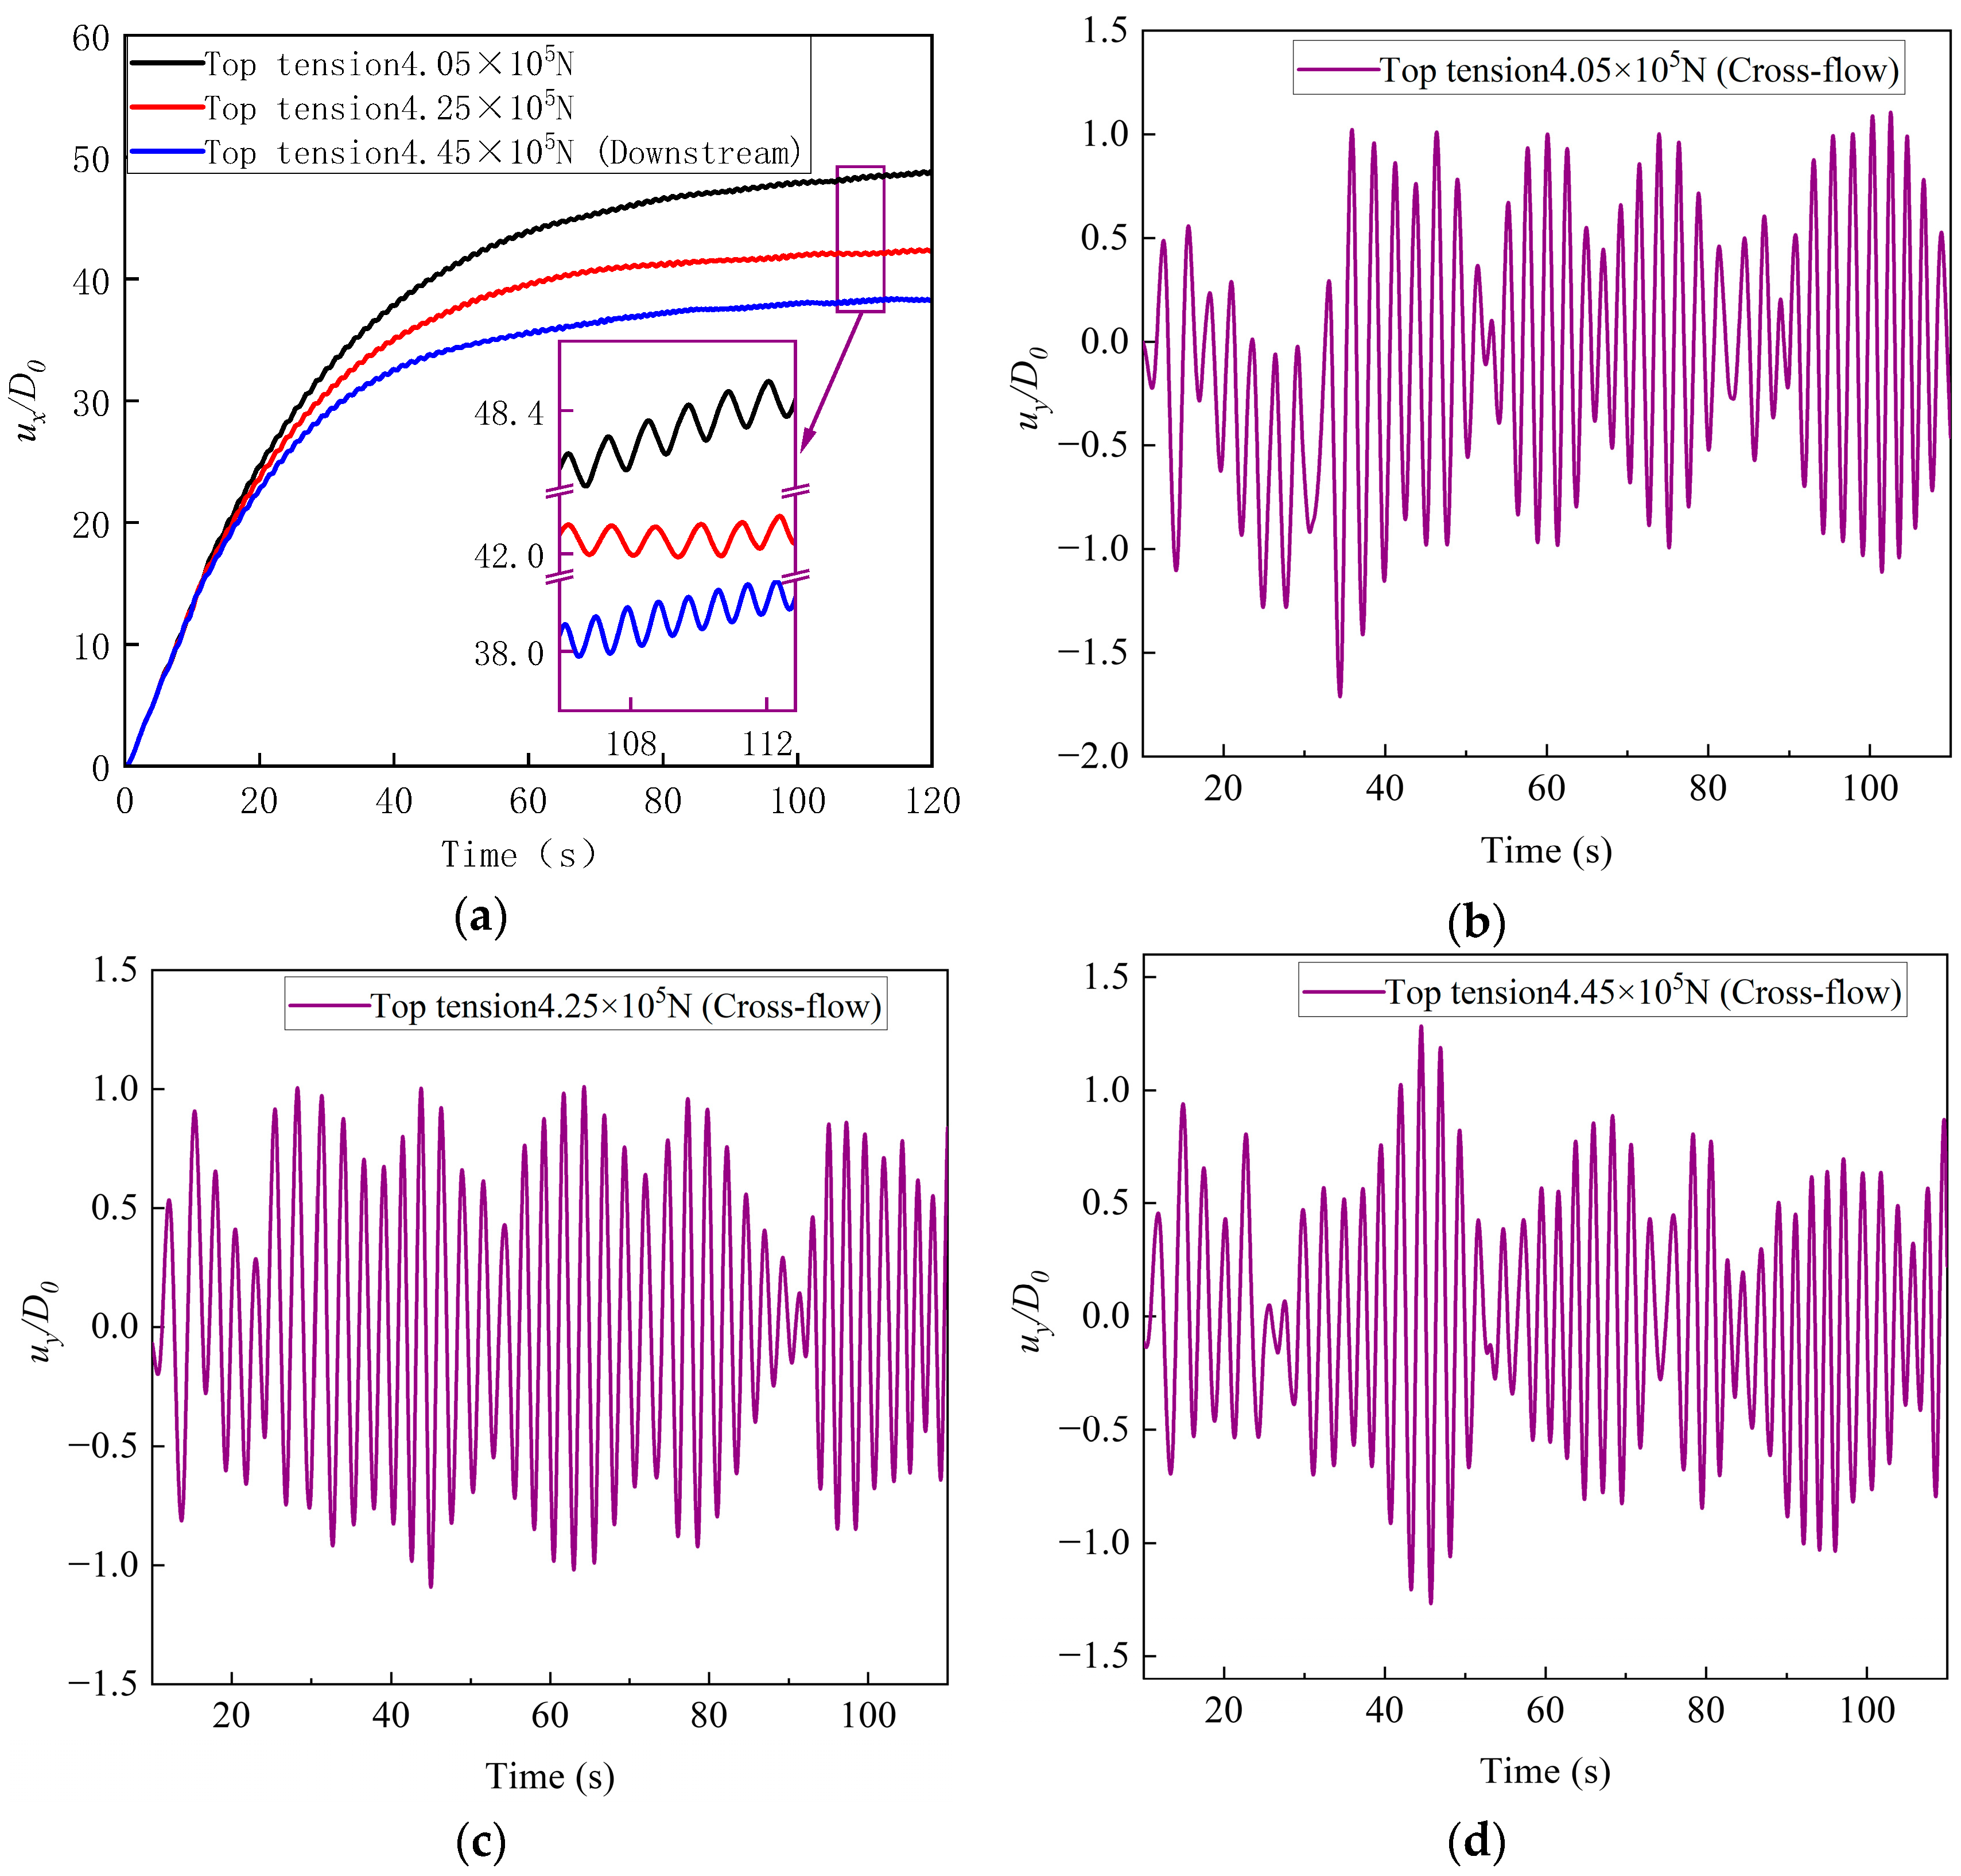
Figure 8 shows the time-history curves of the in-line and cross-flow displacements at the middle section of the hydrate trial production riser under different top tensions. As shown in (a), the in-line displacement of the riser increases from its initial position to the equilibrium position, while maintaining a periodic vortex-induced vibration response throughout the process. As the applied top tension increases, the maximum offset decreases, and the time required to reach equilibrium becomes shorter.
This is because the top tension has a strong effect on the riser’s resistance to deformation. A higher top tension is equivalent to greater additional stiffness. This improves the riser’s ability to resist deformation. As a result, under the same internal and external flow conditions, both deformation and vibration are reduced. Therefore, increasing the top tension appropriately can reduce the in-line bending deformation and vibration of the riser.
As shown in Figure 8b–d, the cross-flow displacement time-history curves of the hydrate trial production riser remain periodic under different top tensions as time evolves. However, the strain time-history curves are more complex, and the vibration becomes more irregular. This is because, during hydrate dissociation inside the riser, the mass, velocity, and sectional tension of the internal fluid change continuously. As a result, the natural frequency and mode shape of the riser also vary continuously, which leads to stronger nonlinear behavior.
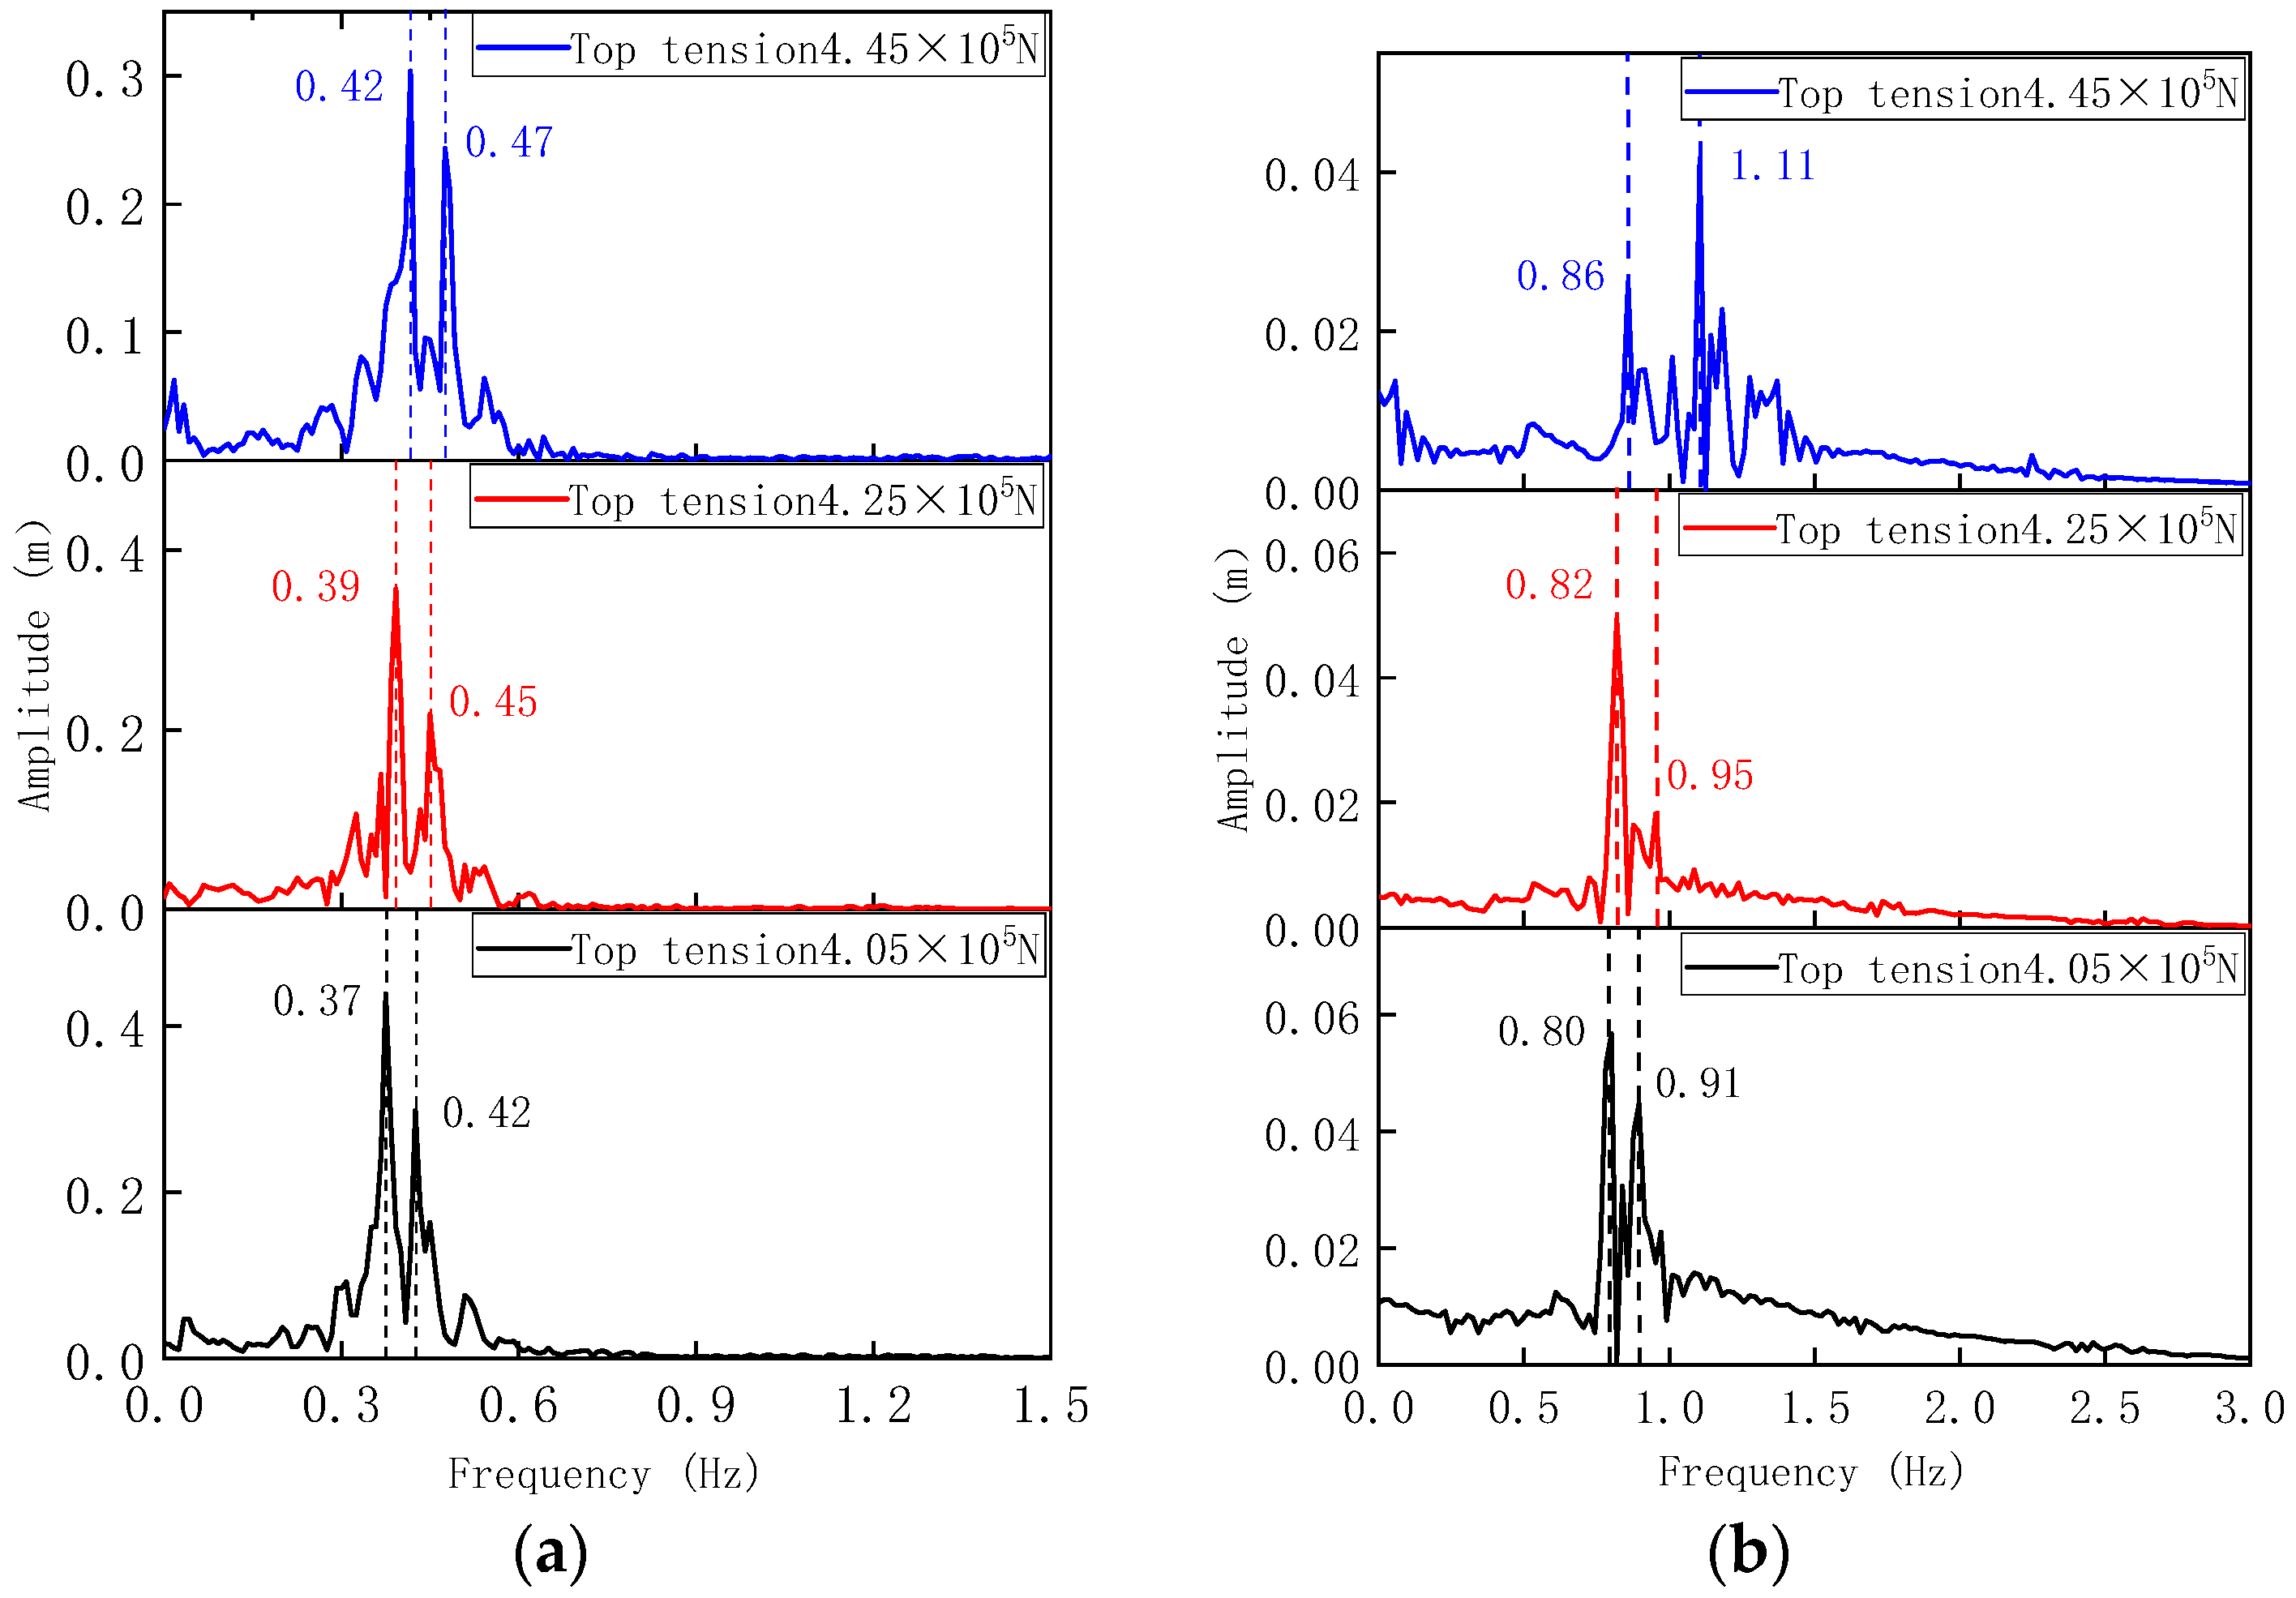
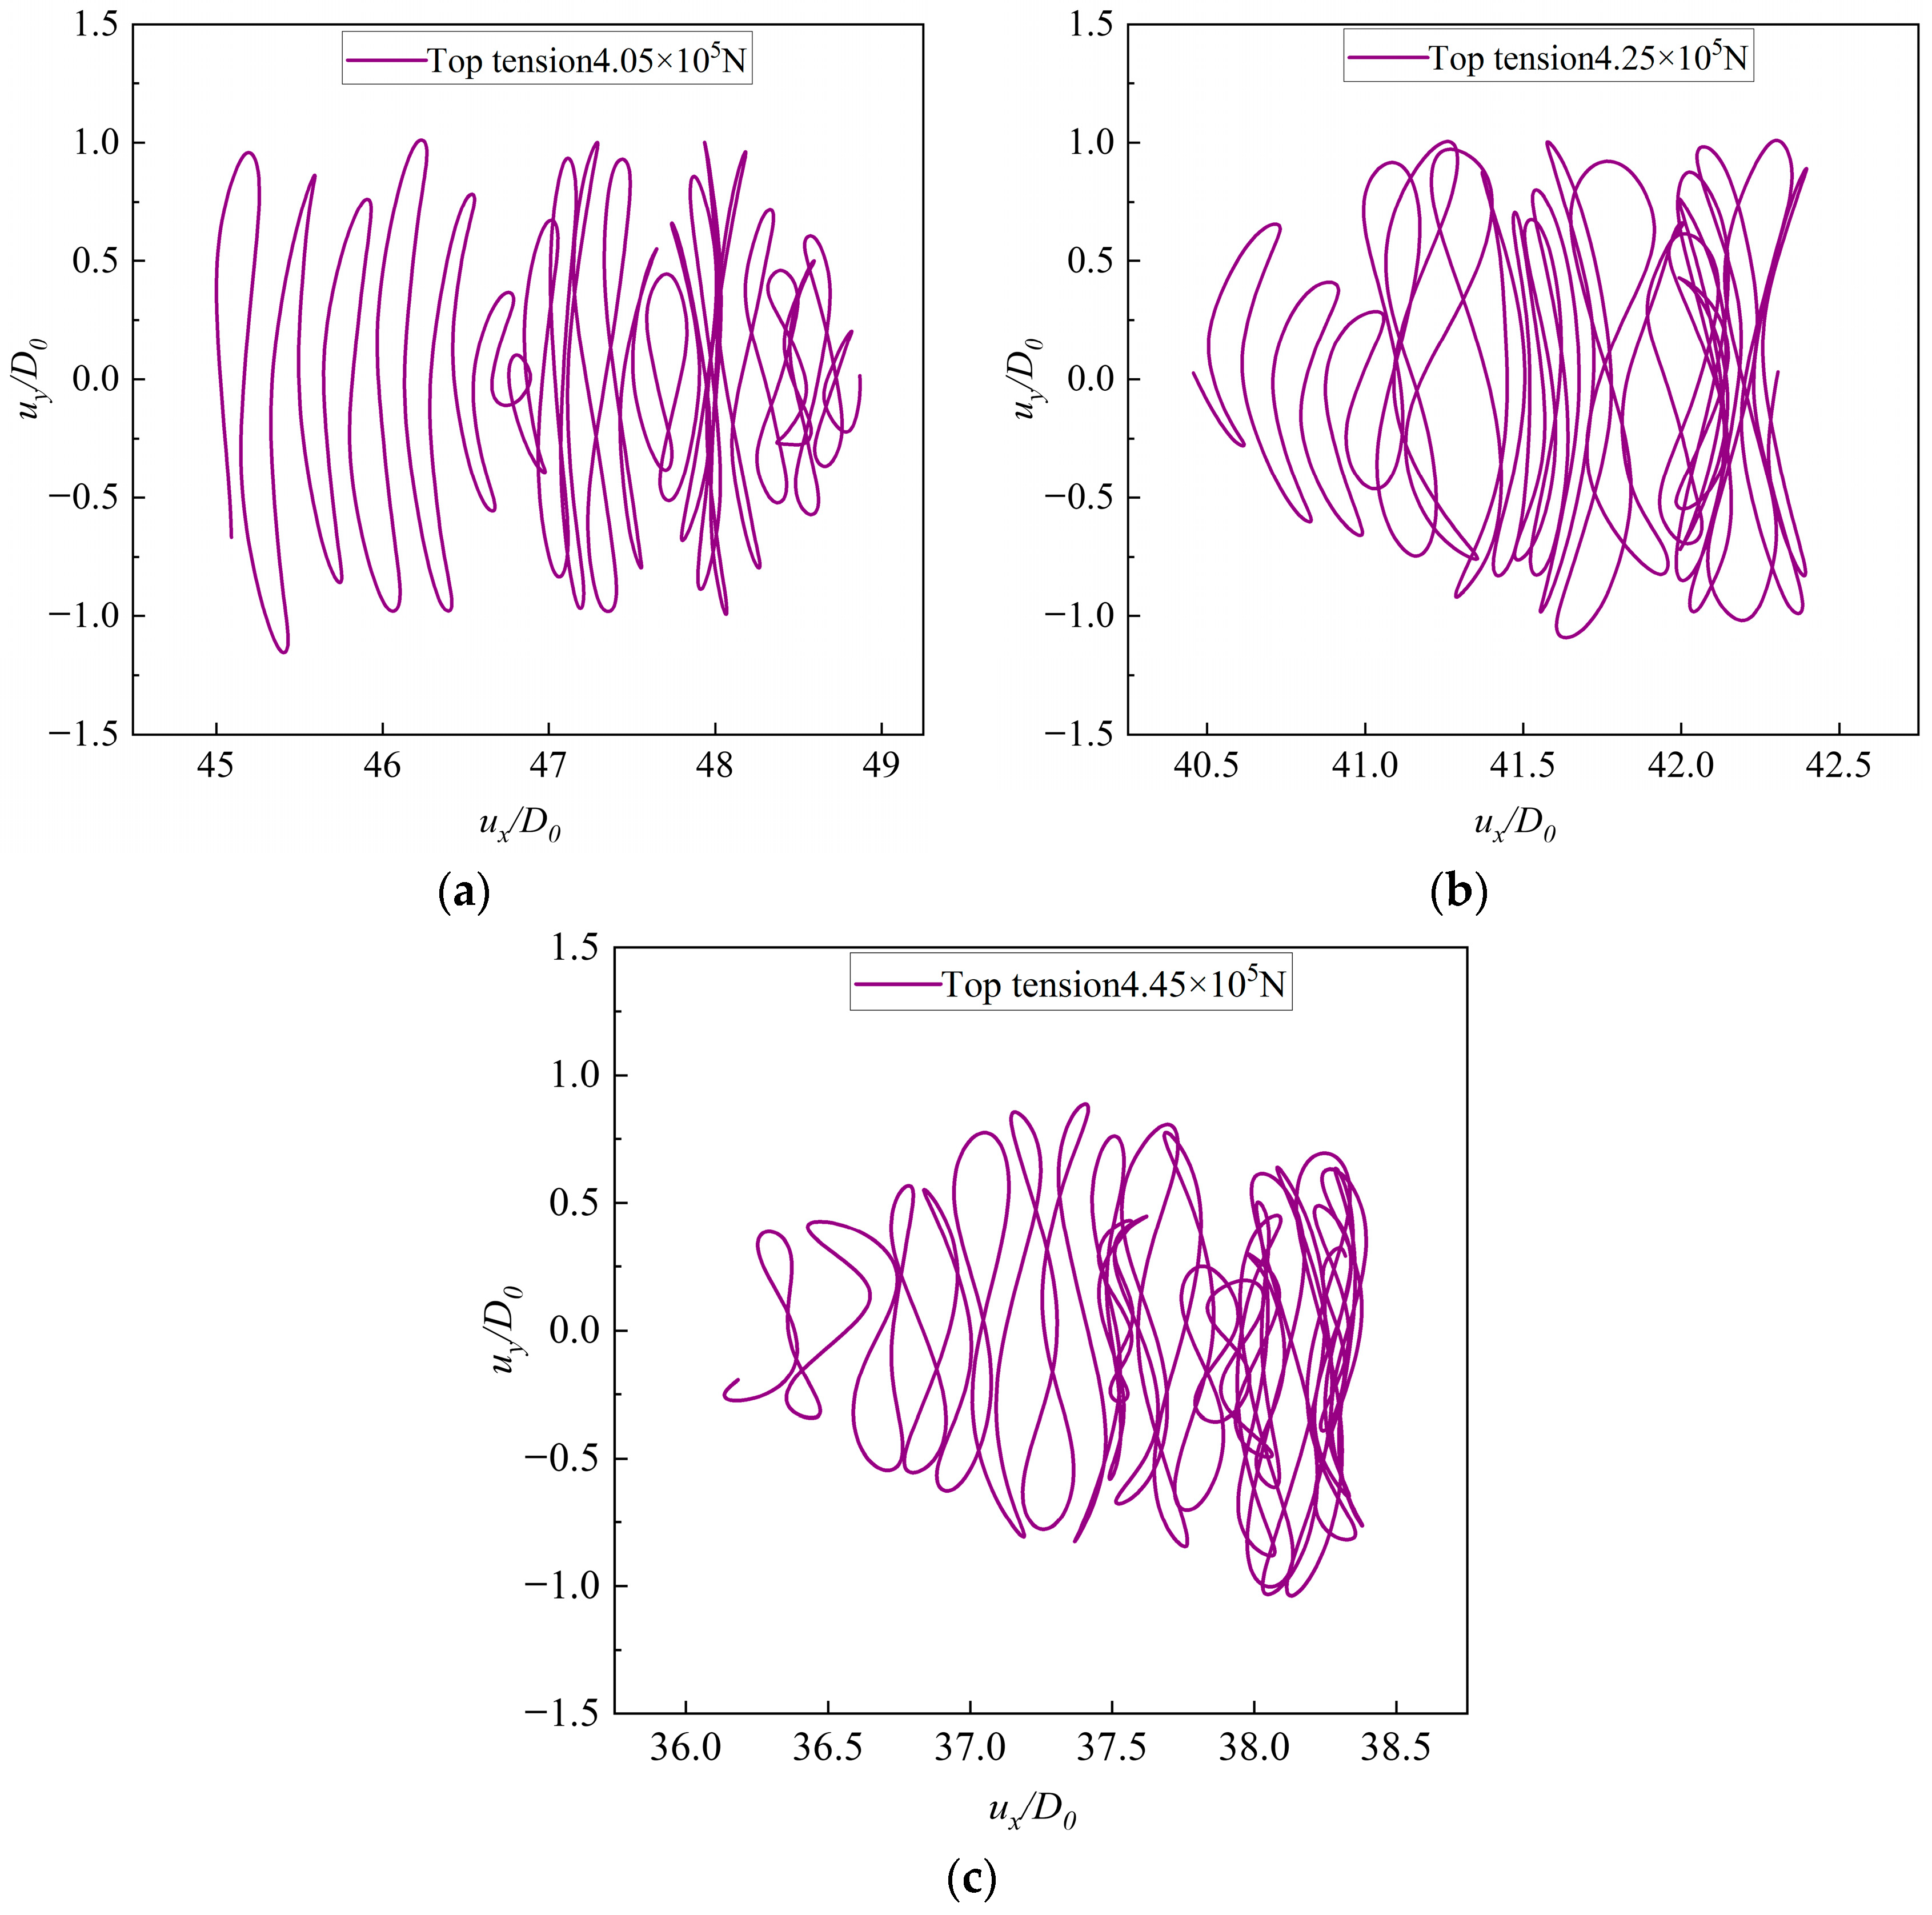
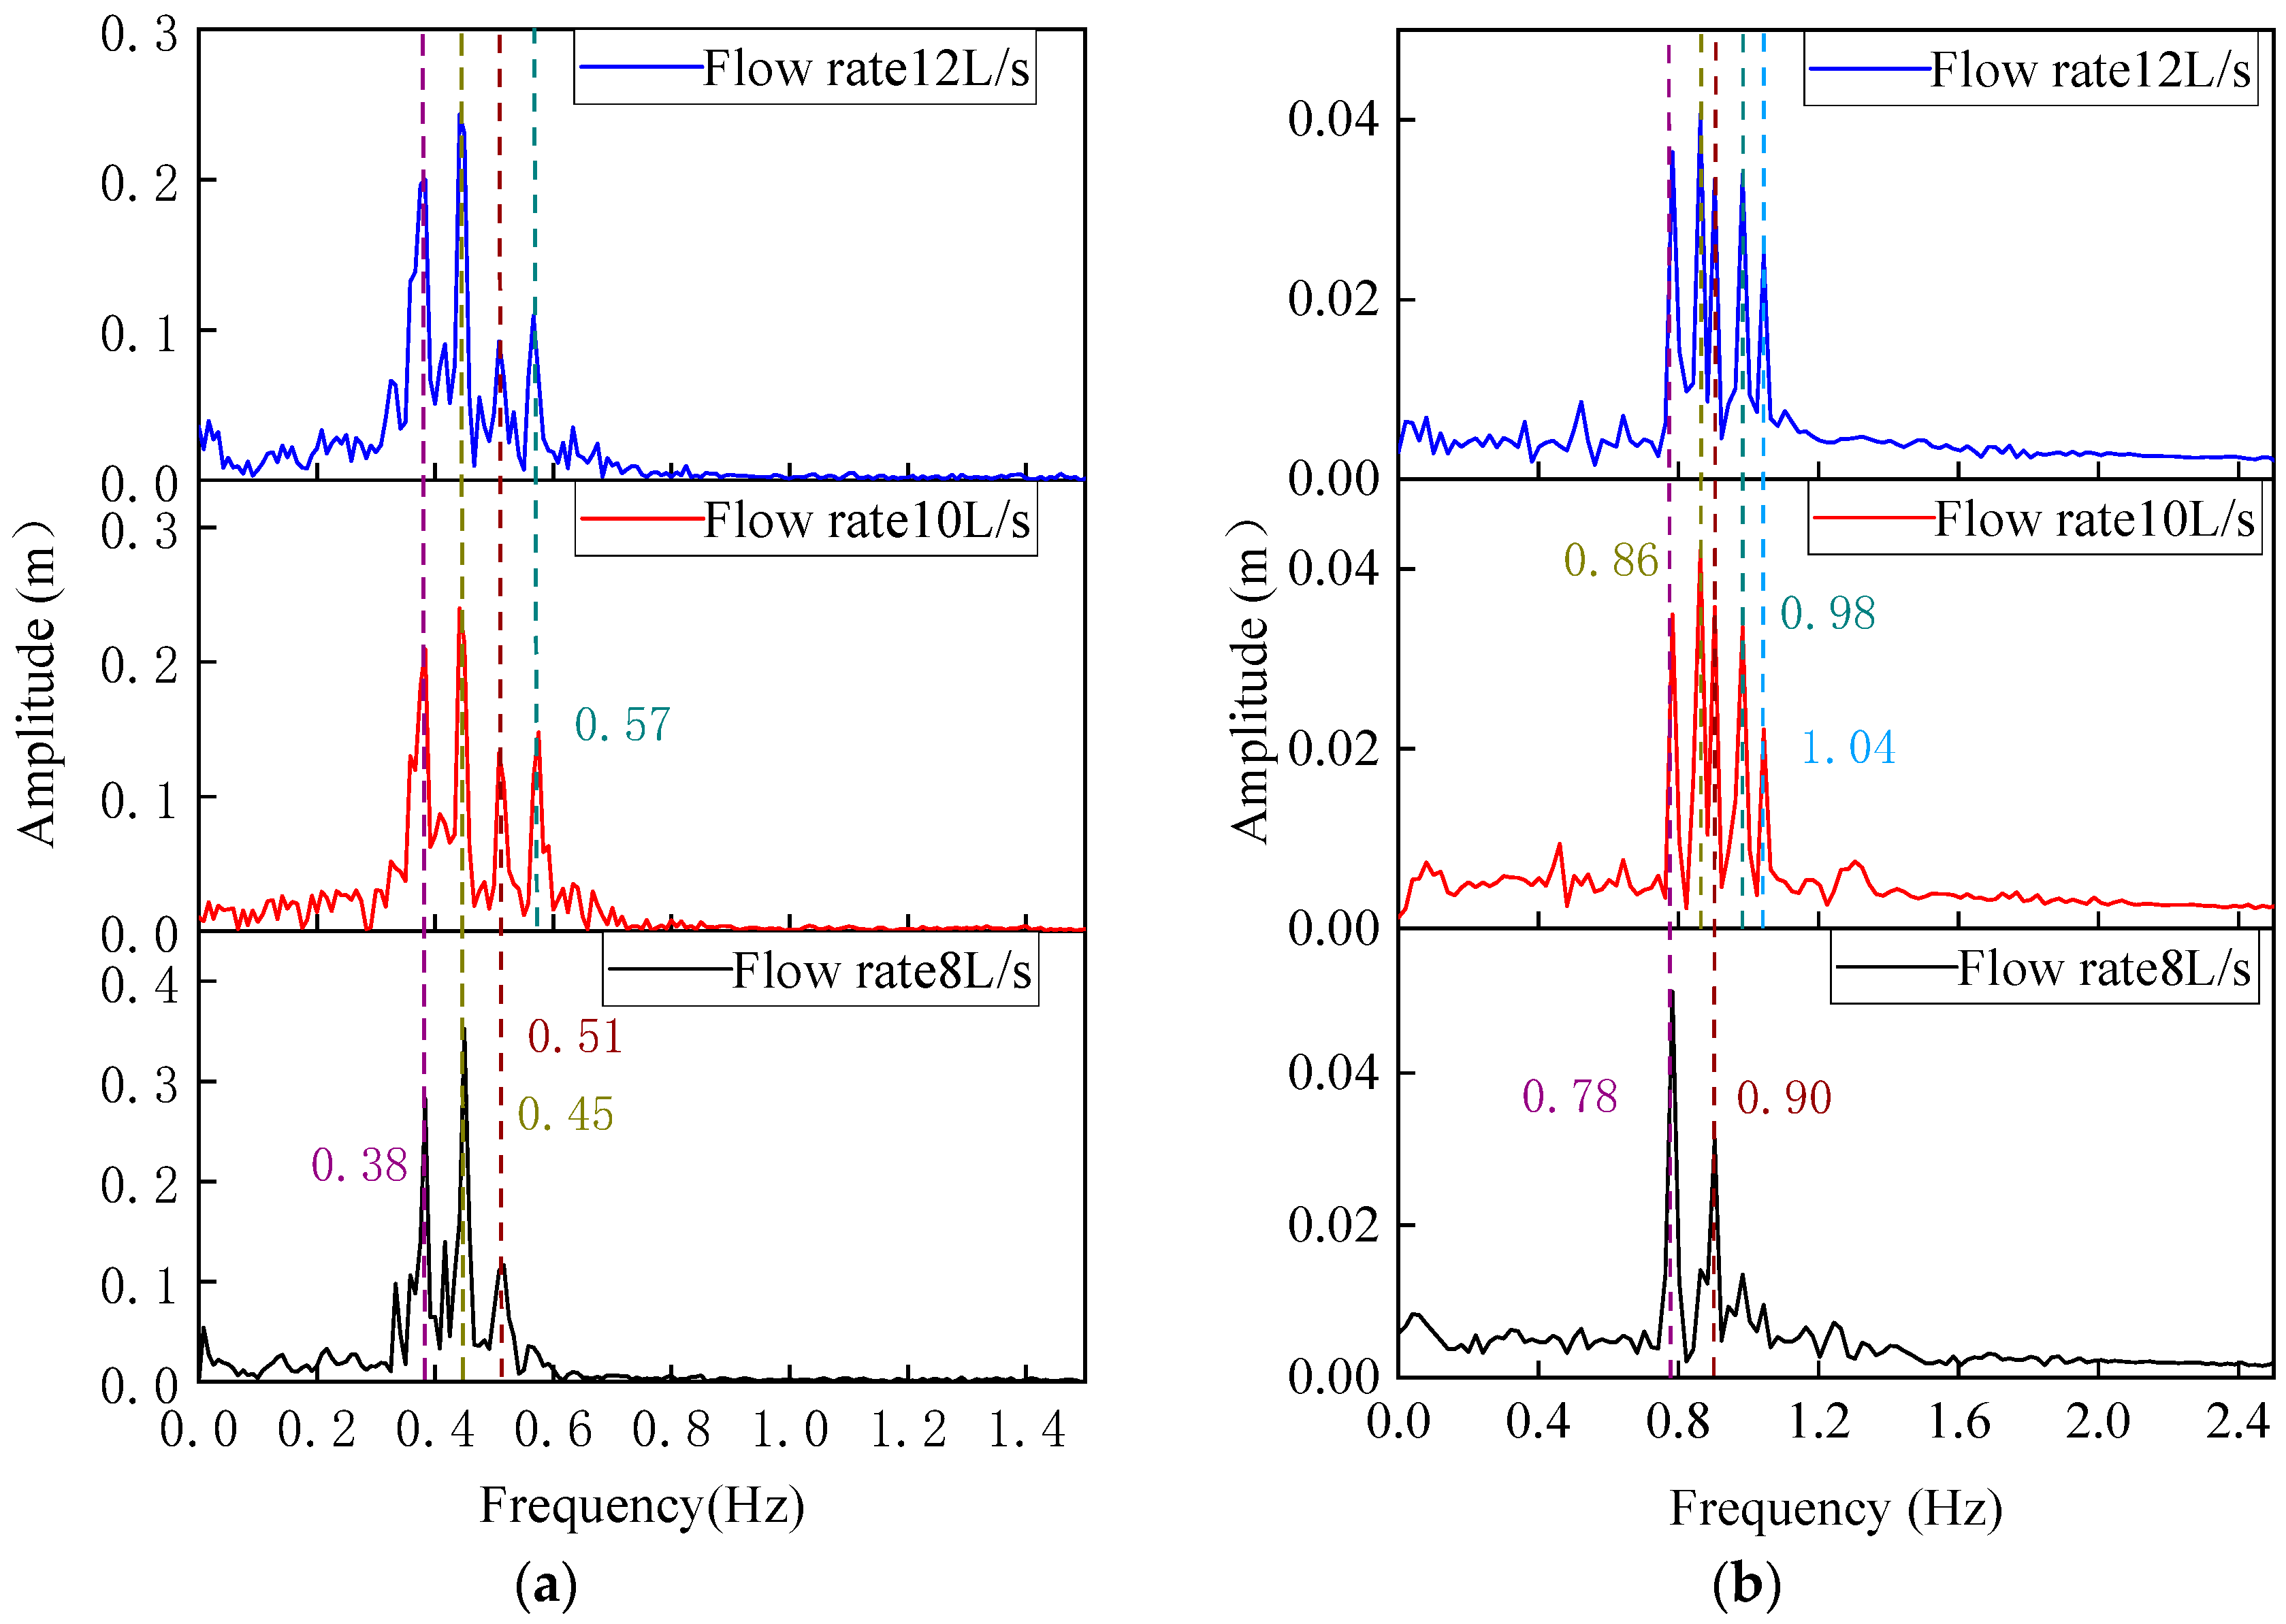
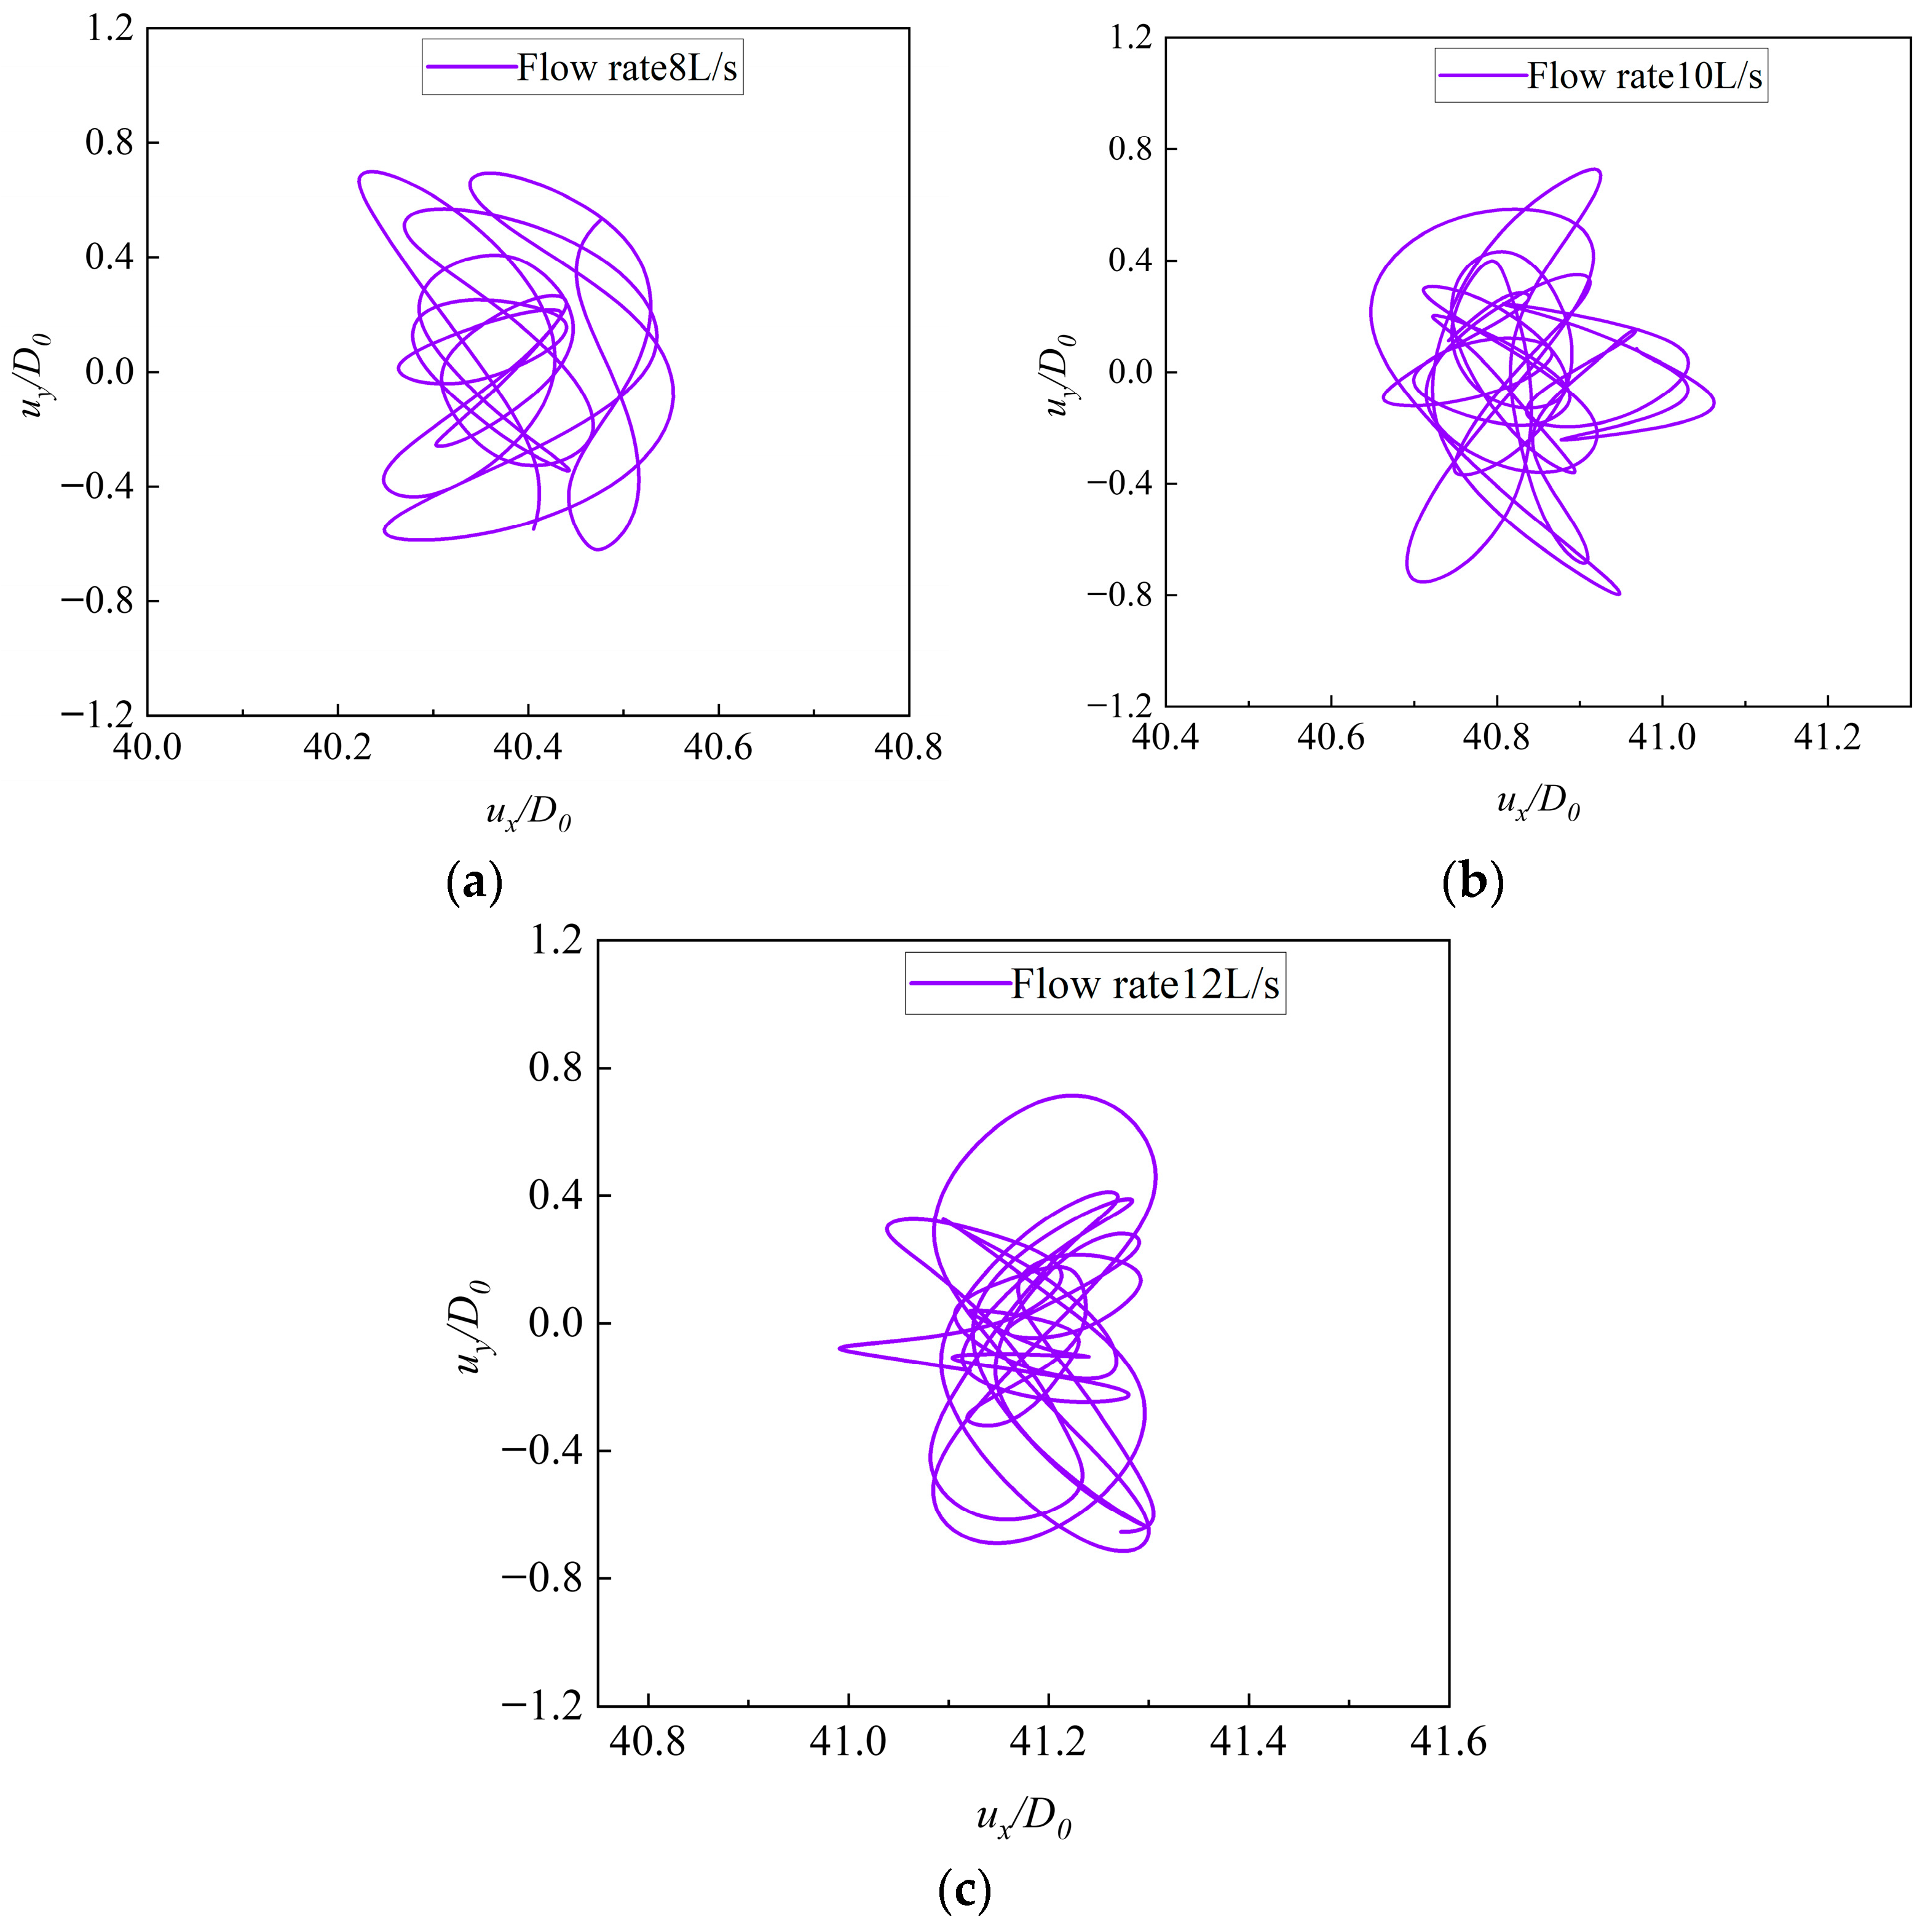
Figure 9 and Figure 10 present the vibration amplitude-frequency spectra and motion trajectories of the middle section of the hydrate trial production riser under different top tensions. The deviation of the frequency ratio is a direct consequence of the internal hydrate phase change dynamics. Traditionally, VIV exhibits a stable 1:2 frequency ratio between the cross-flow and in-line responses during the lock-in regime. However, the dissociation of hydrates introduces a highly non-equilibrium multiphase flow. The generation of gas significantly reduces the local fluid mixture density and accelerates the internal flow velocity due to the gas slippage effect. These transient internal variations dynamically alter the riser’s instantaneous mass and effective structural stiffness. As a result, the natural frequencies of the riser continuously fluctuate in both time and space. Because the structural natural frequencies are no longer constant, the system fails to maintain a stable resonance with the relatively periodic external vortex shedding frequency. This transient mismatch fundamentally breaks the classical 1:2 frequency locking, driving the severe deviation in the frequency ratio and ultimately causing the chaotic spatial trajectories observed in the hydrate production riser.

5.2. Effect of Slurry Density on Riser Dynamics

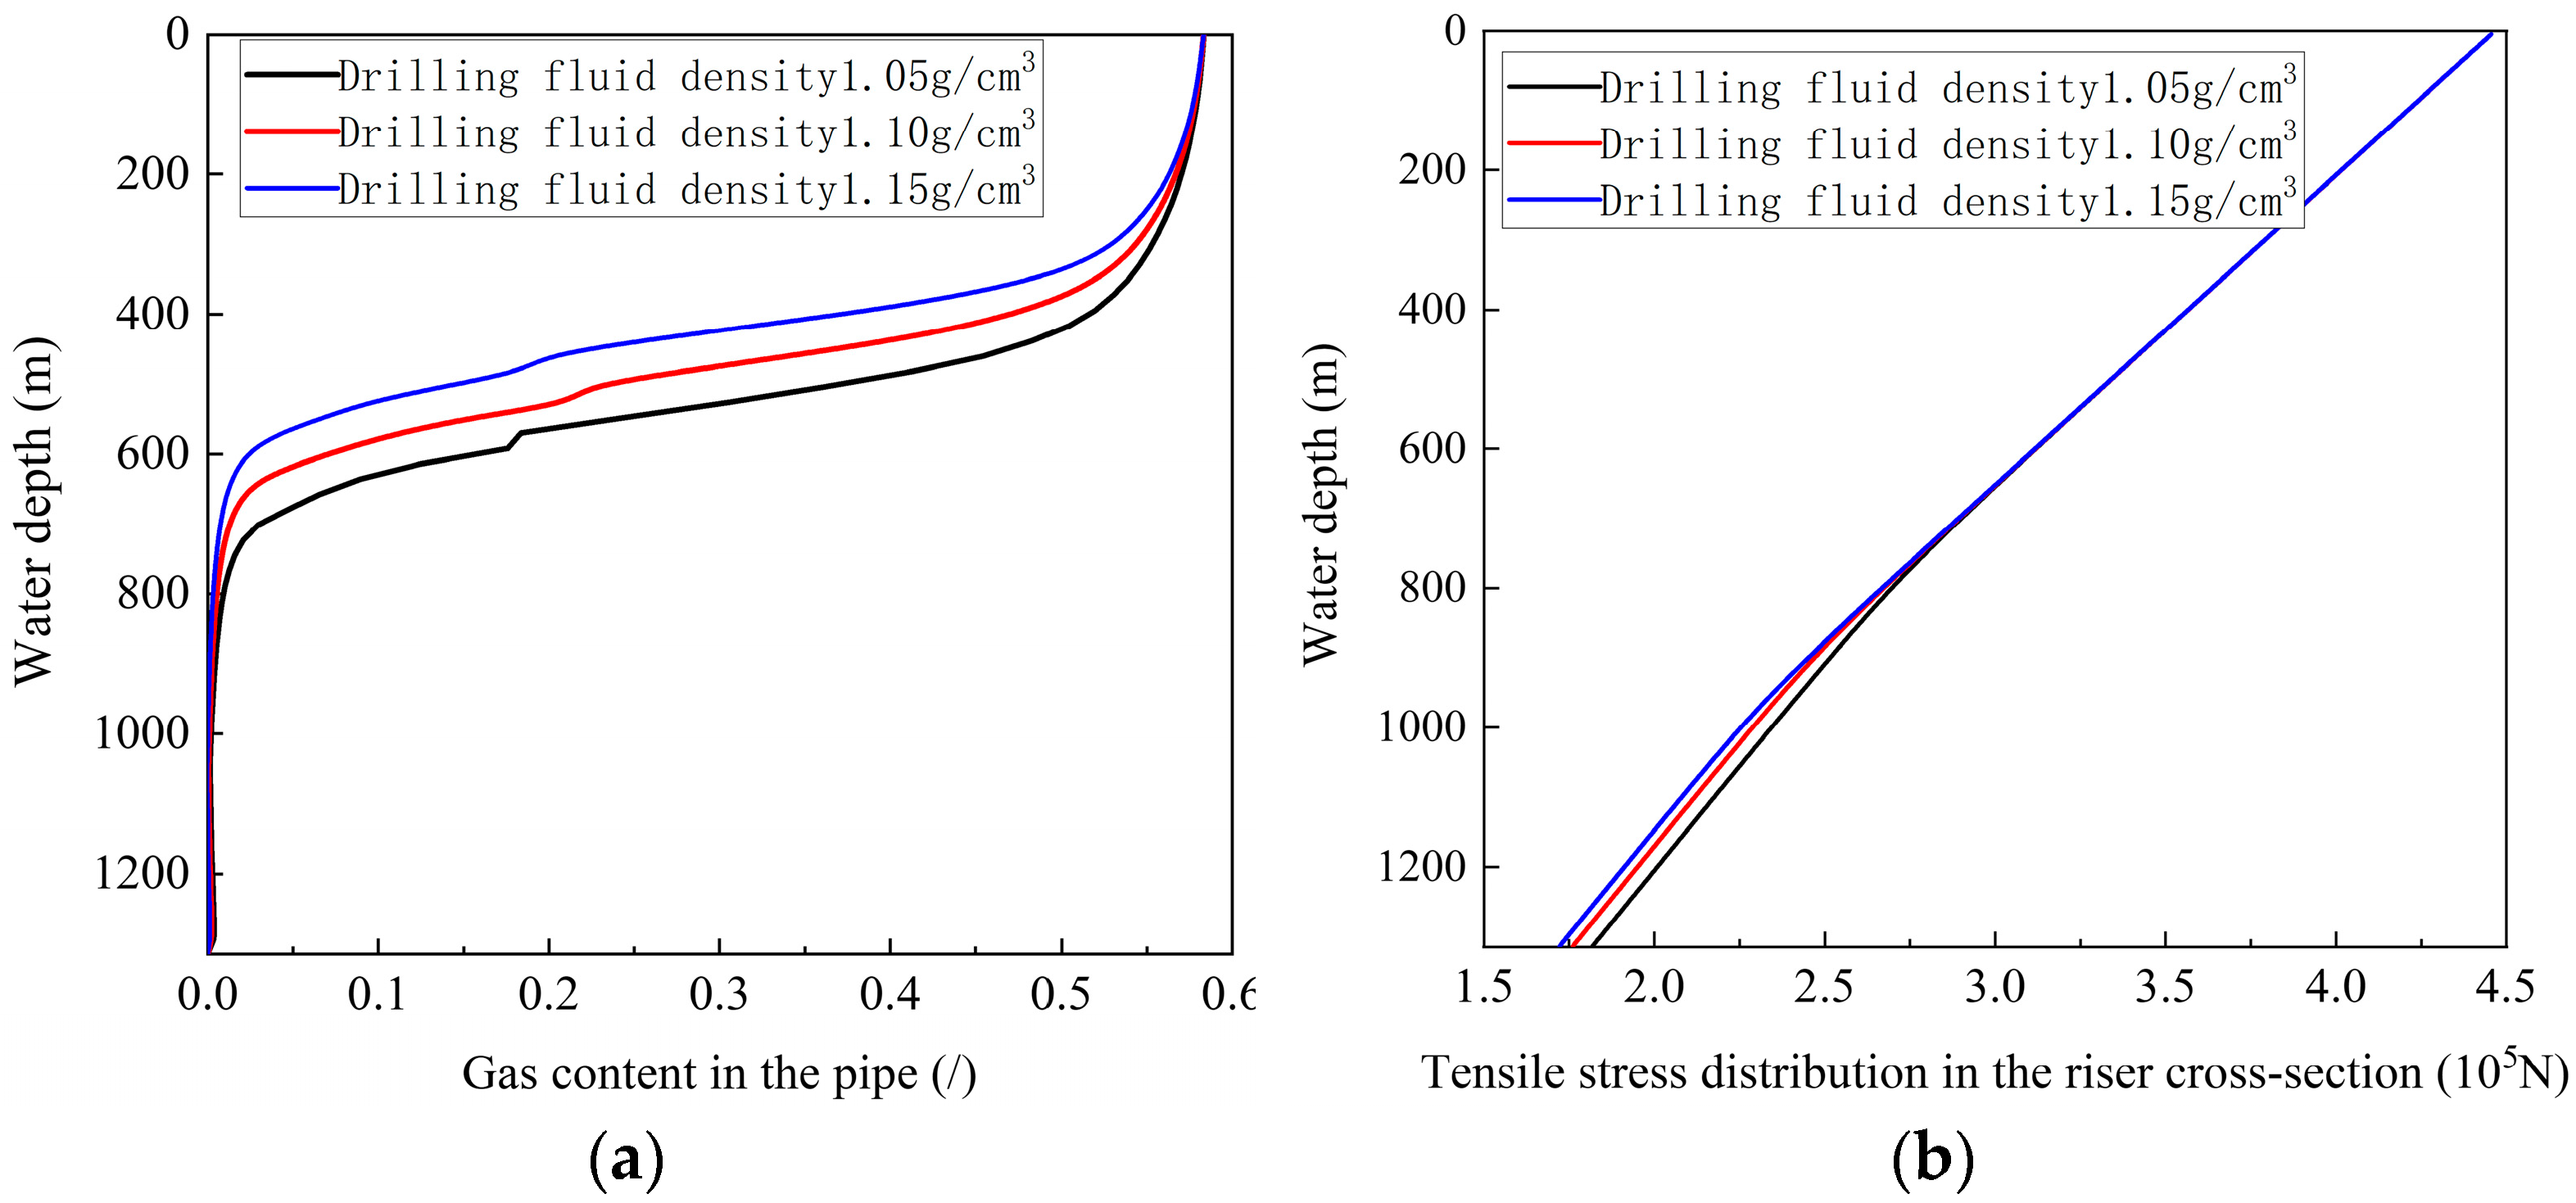
Figure 11 presents the gas holdup and sectional tension distributions of the hydrate trial production riser under different slurry densities. Figure 11a shows that hydrate dissociation occurs earlier when the slurry density is lower. Figure 11b shows that, below 800 m water depth, the sectional tension decreases markedly with increasing slurry density.
This is because hydrate starts to dissociate and release a large amount of gas when the liquid-column pressure inside the riser drops to the critical dissociation pressure. Lower slurry density causes a lower internal pressure. Therefore, the hydrate reaches the critical pressure-equilibrium condition earlier, dissociates sooner, and produces a higher gas holdup. A higher gas holdup reduces the effective mass of the internal fluid and the total weight of the riser system. As a result, the effective sectional tension of the riser increases [32].
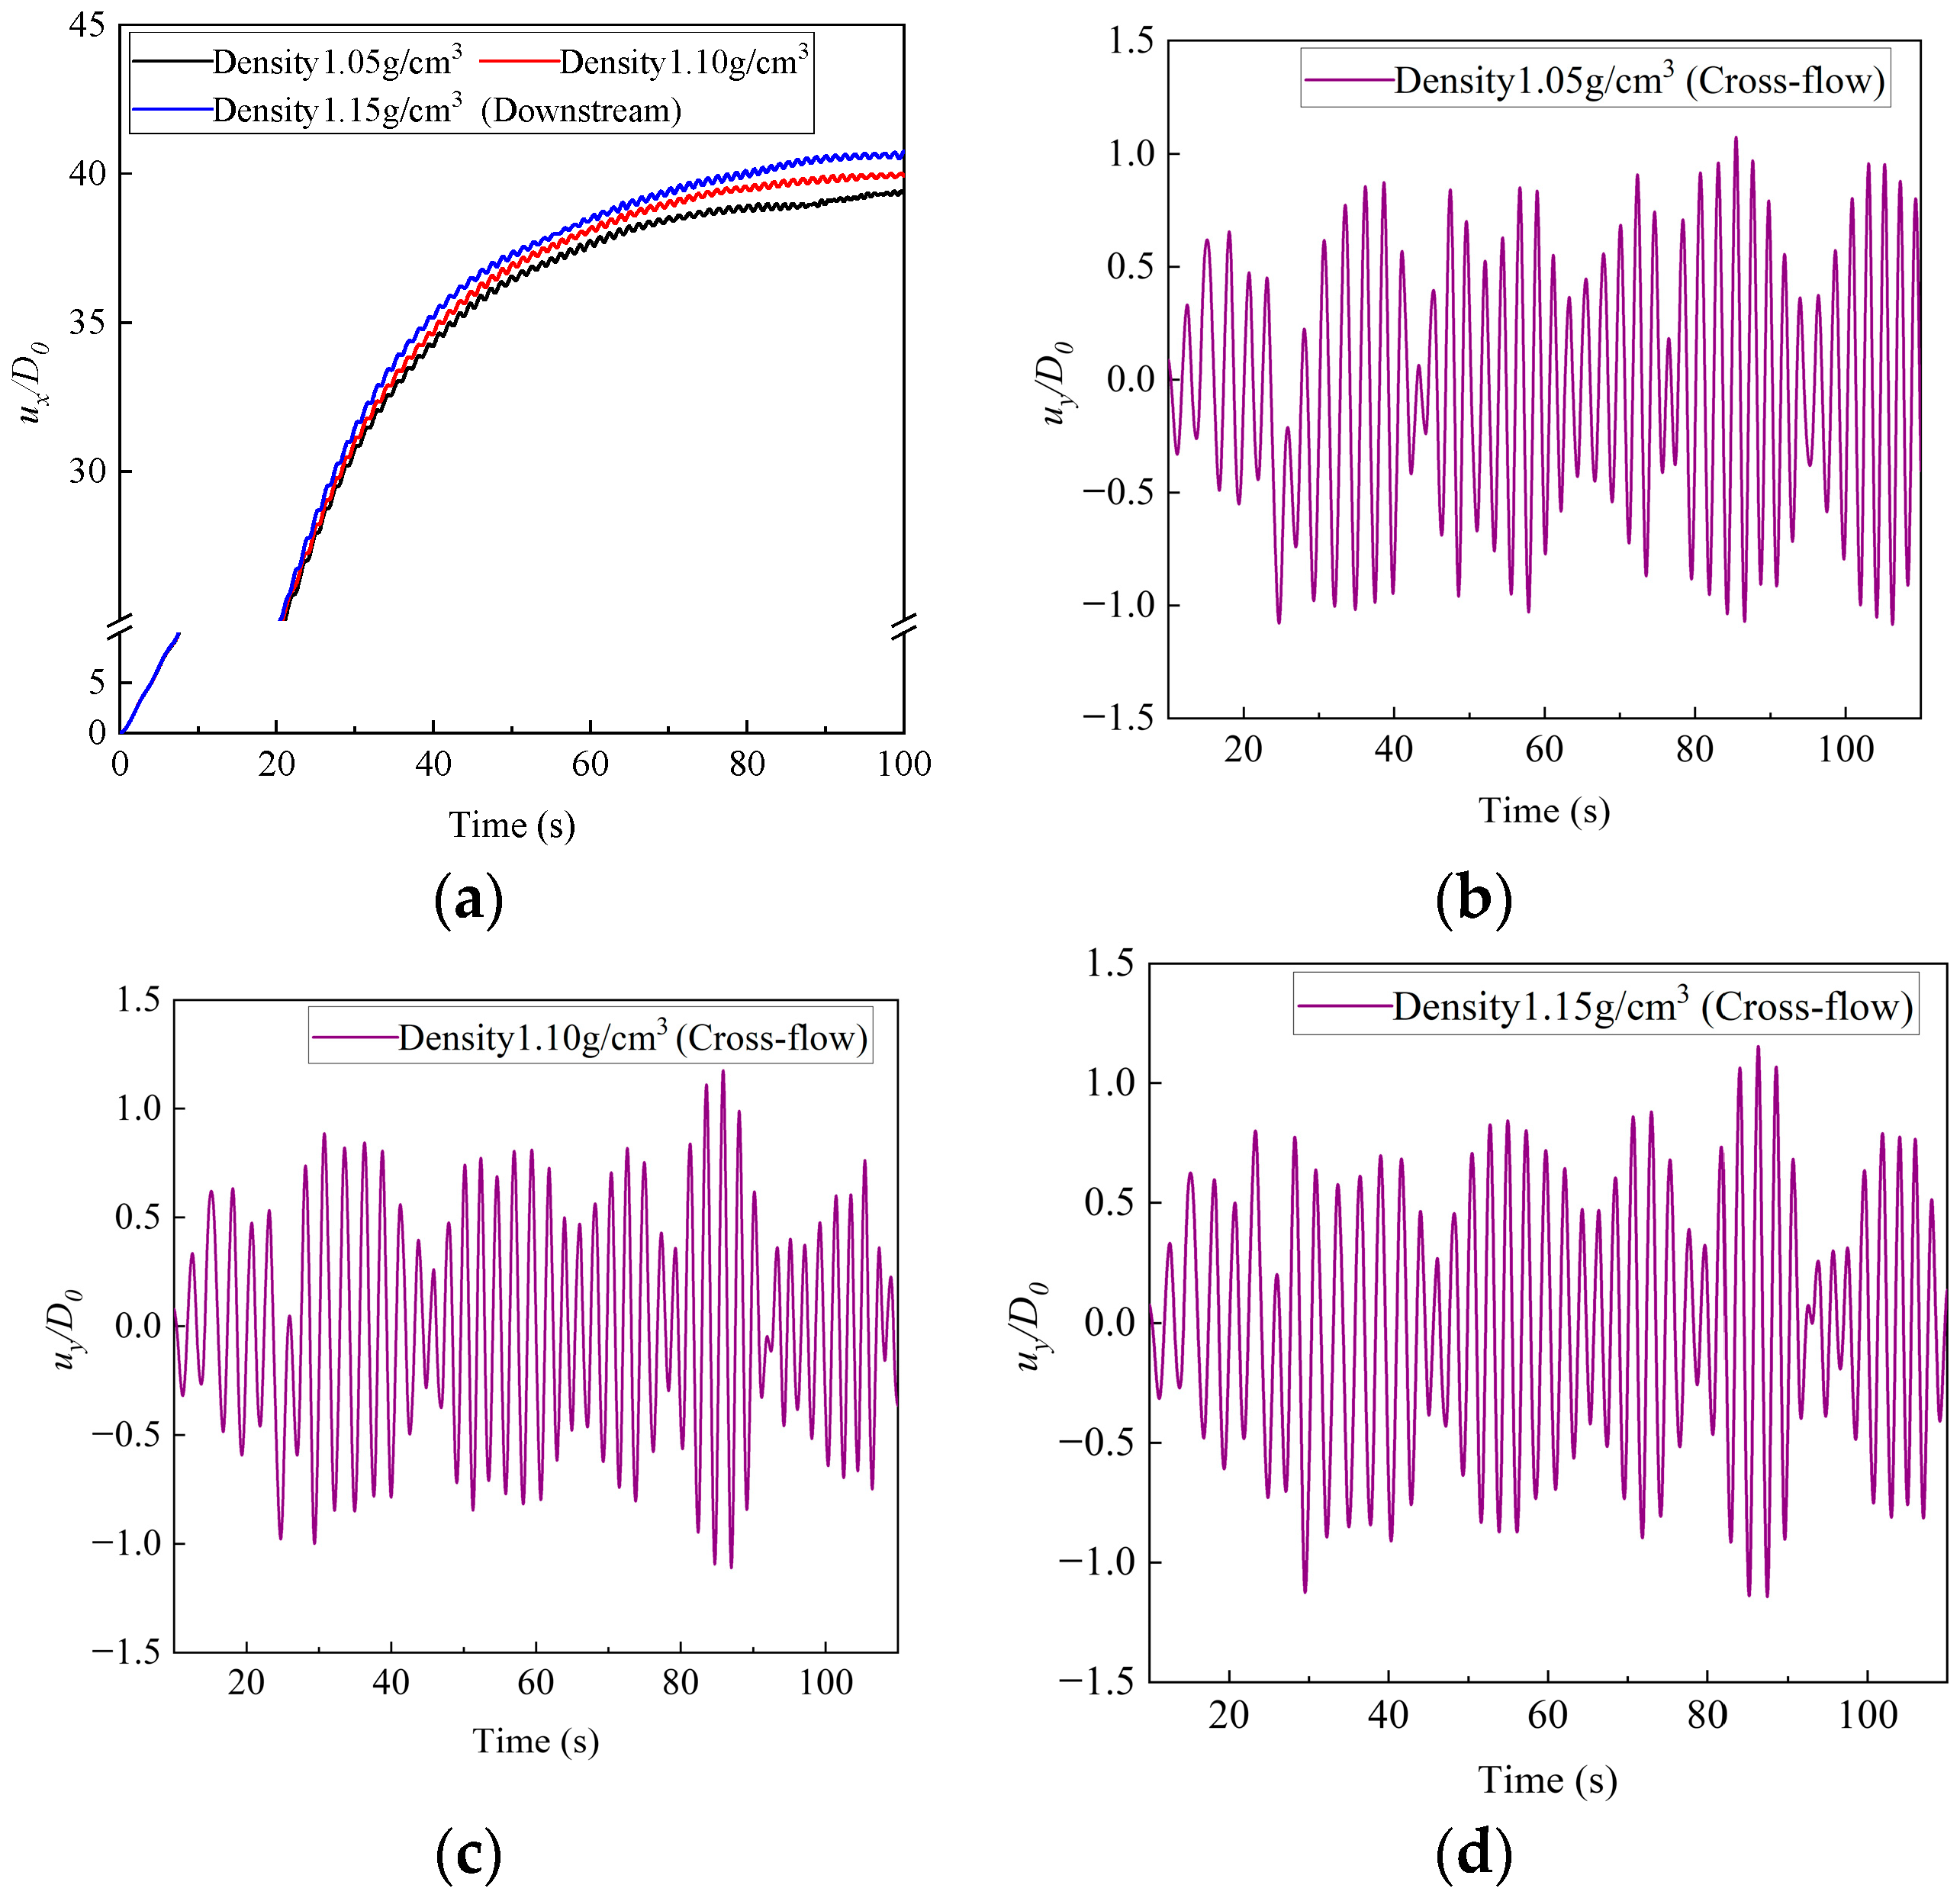
Figure 12 shows the time-history curves of the in-line and cross-flow displacements at the middle section of the hydrate trial production riser under different slurry densities. As shown in (a), the riser starts to vibrate from the initial static state in the in-line direction. Its displacement gradually increases until it reaches the equilibrium position. It then continues to exhibit small-amplitude periodic vibration. In addition, as the slurry density inside the pipe increases, the in-line offset of the riser center from its initial position becomes larger.
As shown in Figure 12b–d, the cross-flow displacement time-history curves at the middle section of the hydrate trial production riser are generally similar under different slurry densities. However, the vibration amplitude changes markedly, because the riser is subjected to the combined effects of multiple response frequencies. Overall, the slurry density inside the pipe affects the large in-line deformation of the hydrate trial production riser to some extent, but its influence on vortex-induced vibration is relatively small.
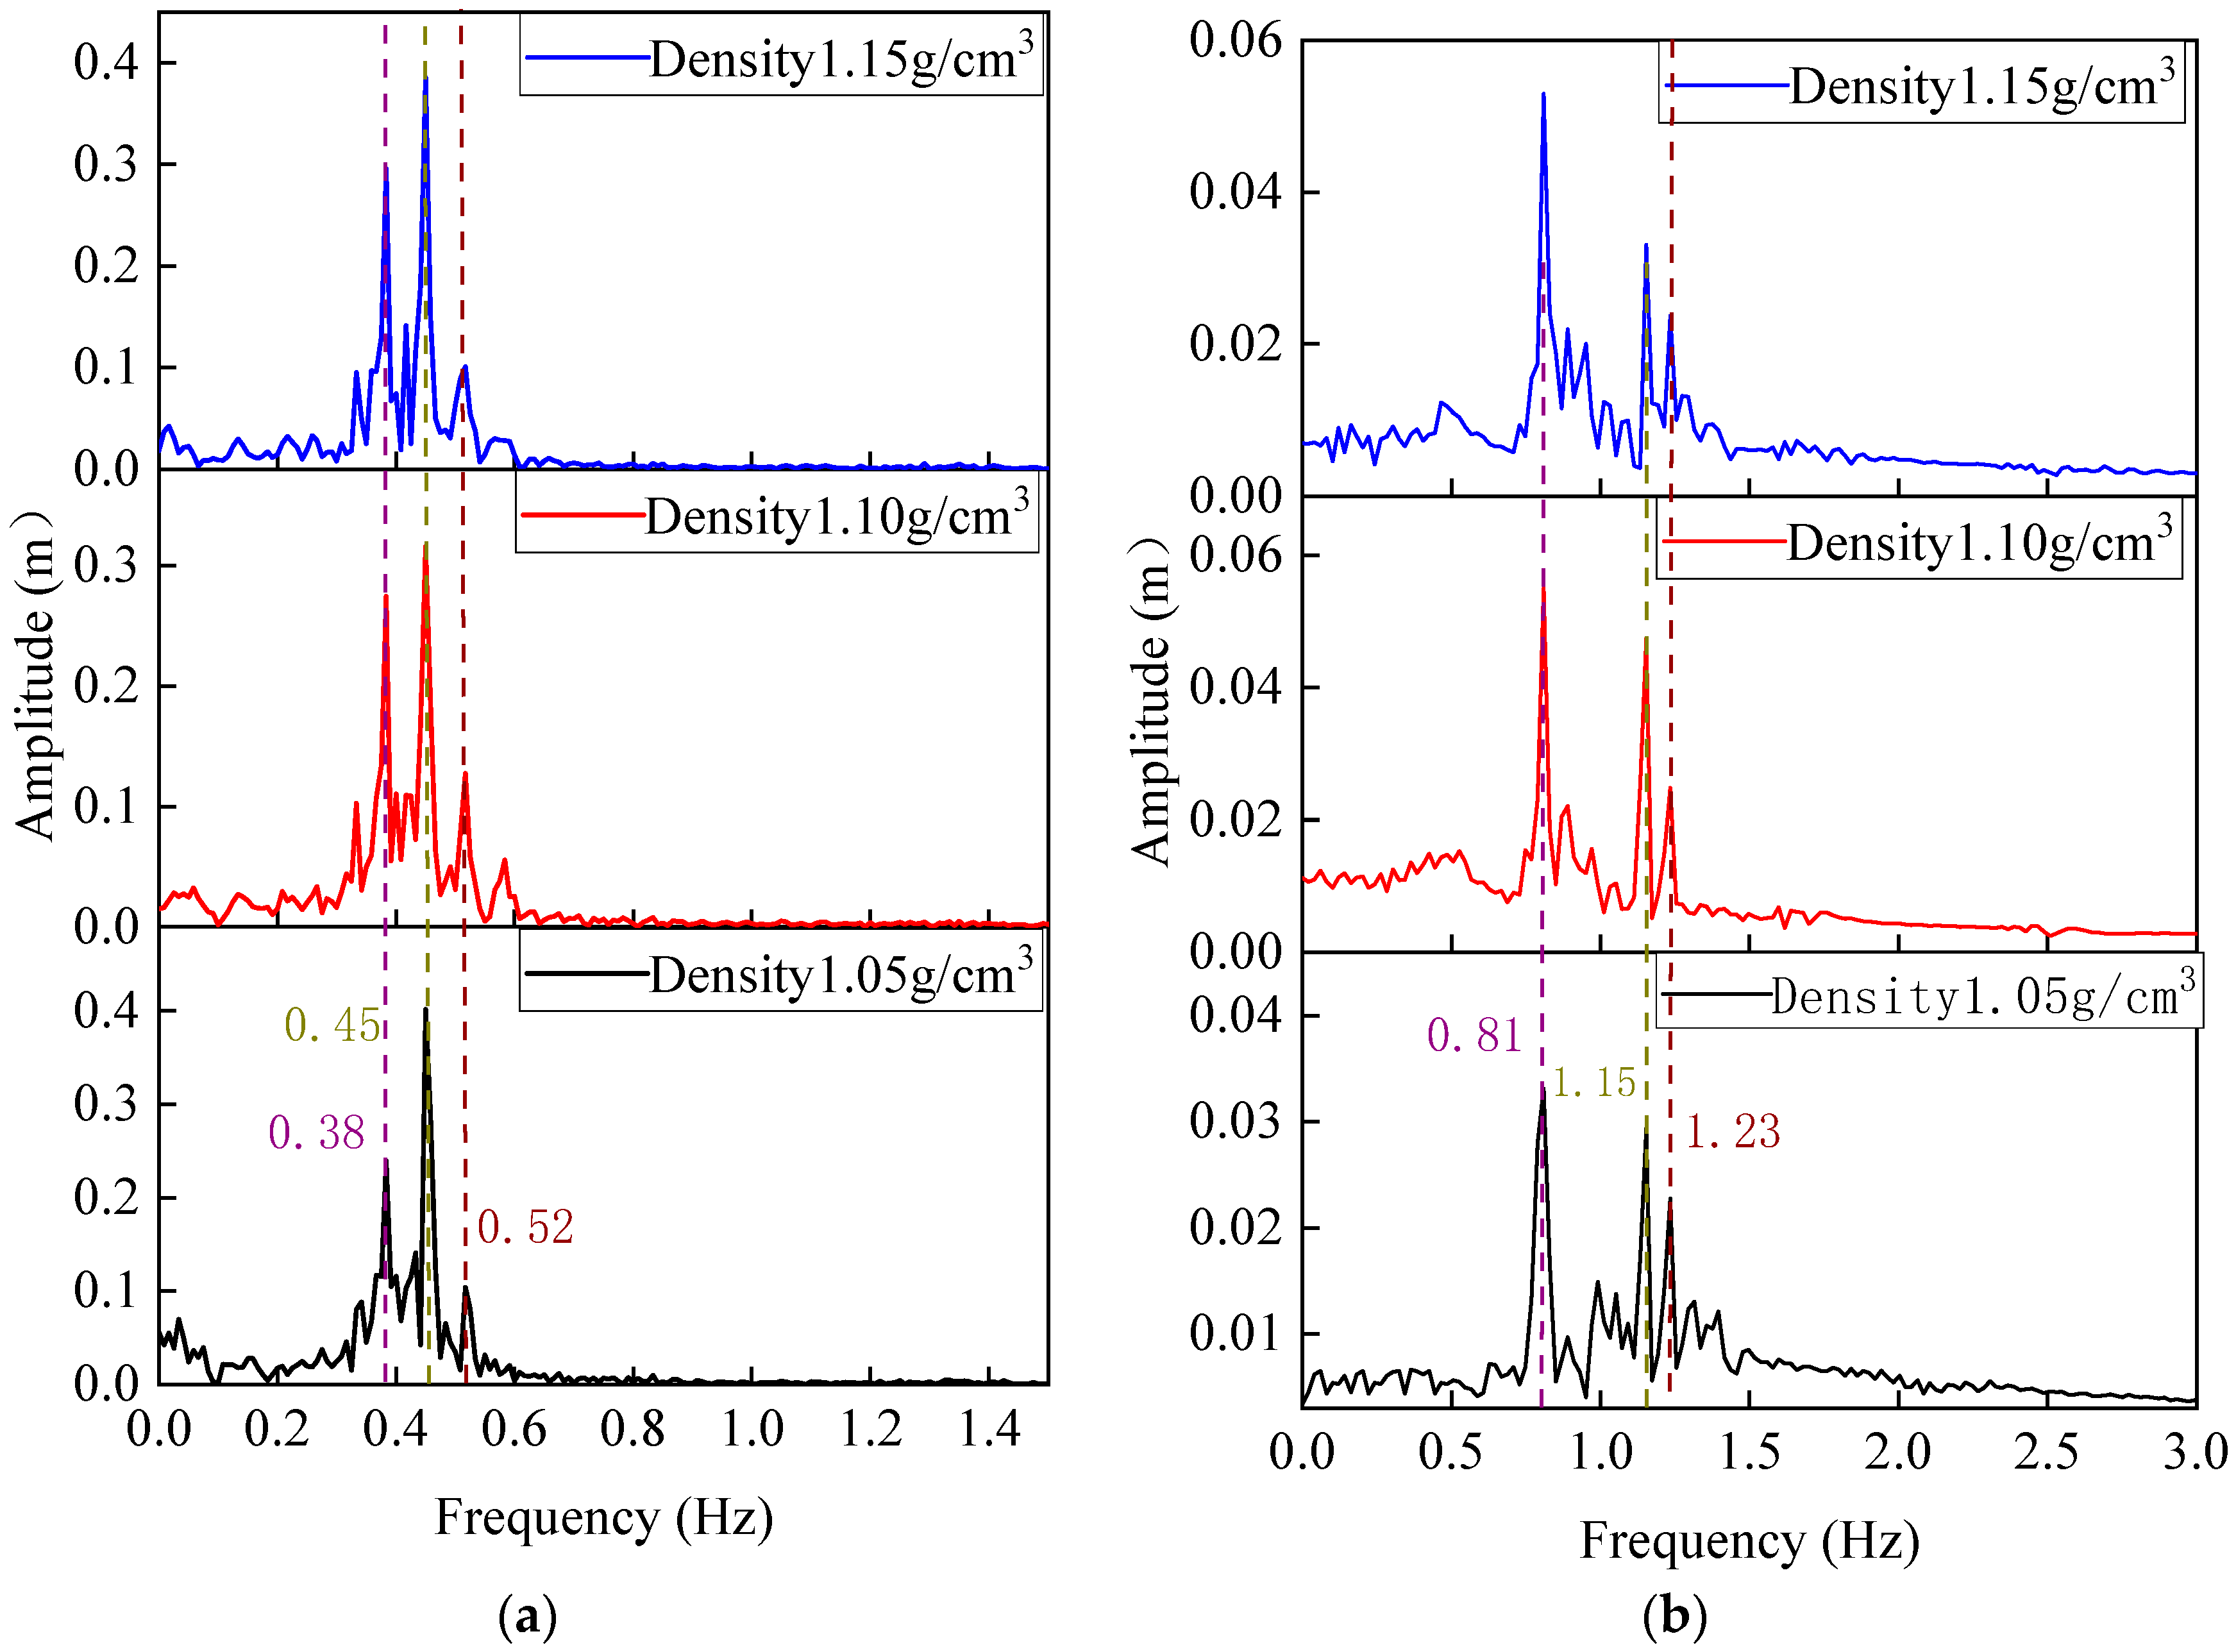
Figure 13 and Figure 14 show the vibration amplitude-frequency spectra and motion trajectories, respectively, of the middle section of the trial production riser under different slurry densities. As shown in Figure 13, the vibration frequency in the in-line direction is higher than that in the cross-flow direction. The response frequencies in both directions remain the same under different slurry densities. In the cross-flow direction, the hydrate trial production riser is influenced not only by the dominant frequency of 0.45 Hz, but also by frequencies of 0.38 Hz and 0.52 Hz. In the in-line direction, the riser is affected by the dominant frequency of 0.81 Hz and by the secondary frequencies of 1.15 Hz and 1.23 Hz. This is because fluid dissociation inside the riser changes both the distributed mass of the riser system and the velocity of the internal fluid. As a result, the riser vibration enters multiple modal ranges. This leads to multimodal competition and makes the vibration response and mode shapes more complex.
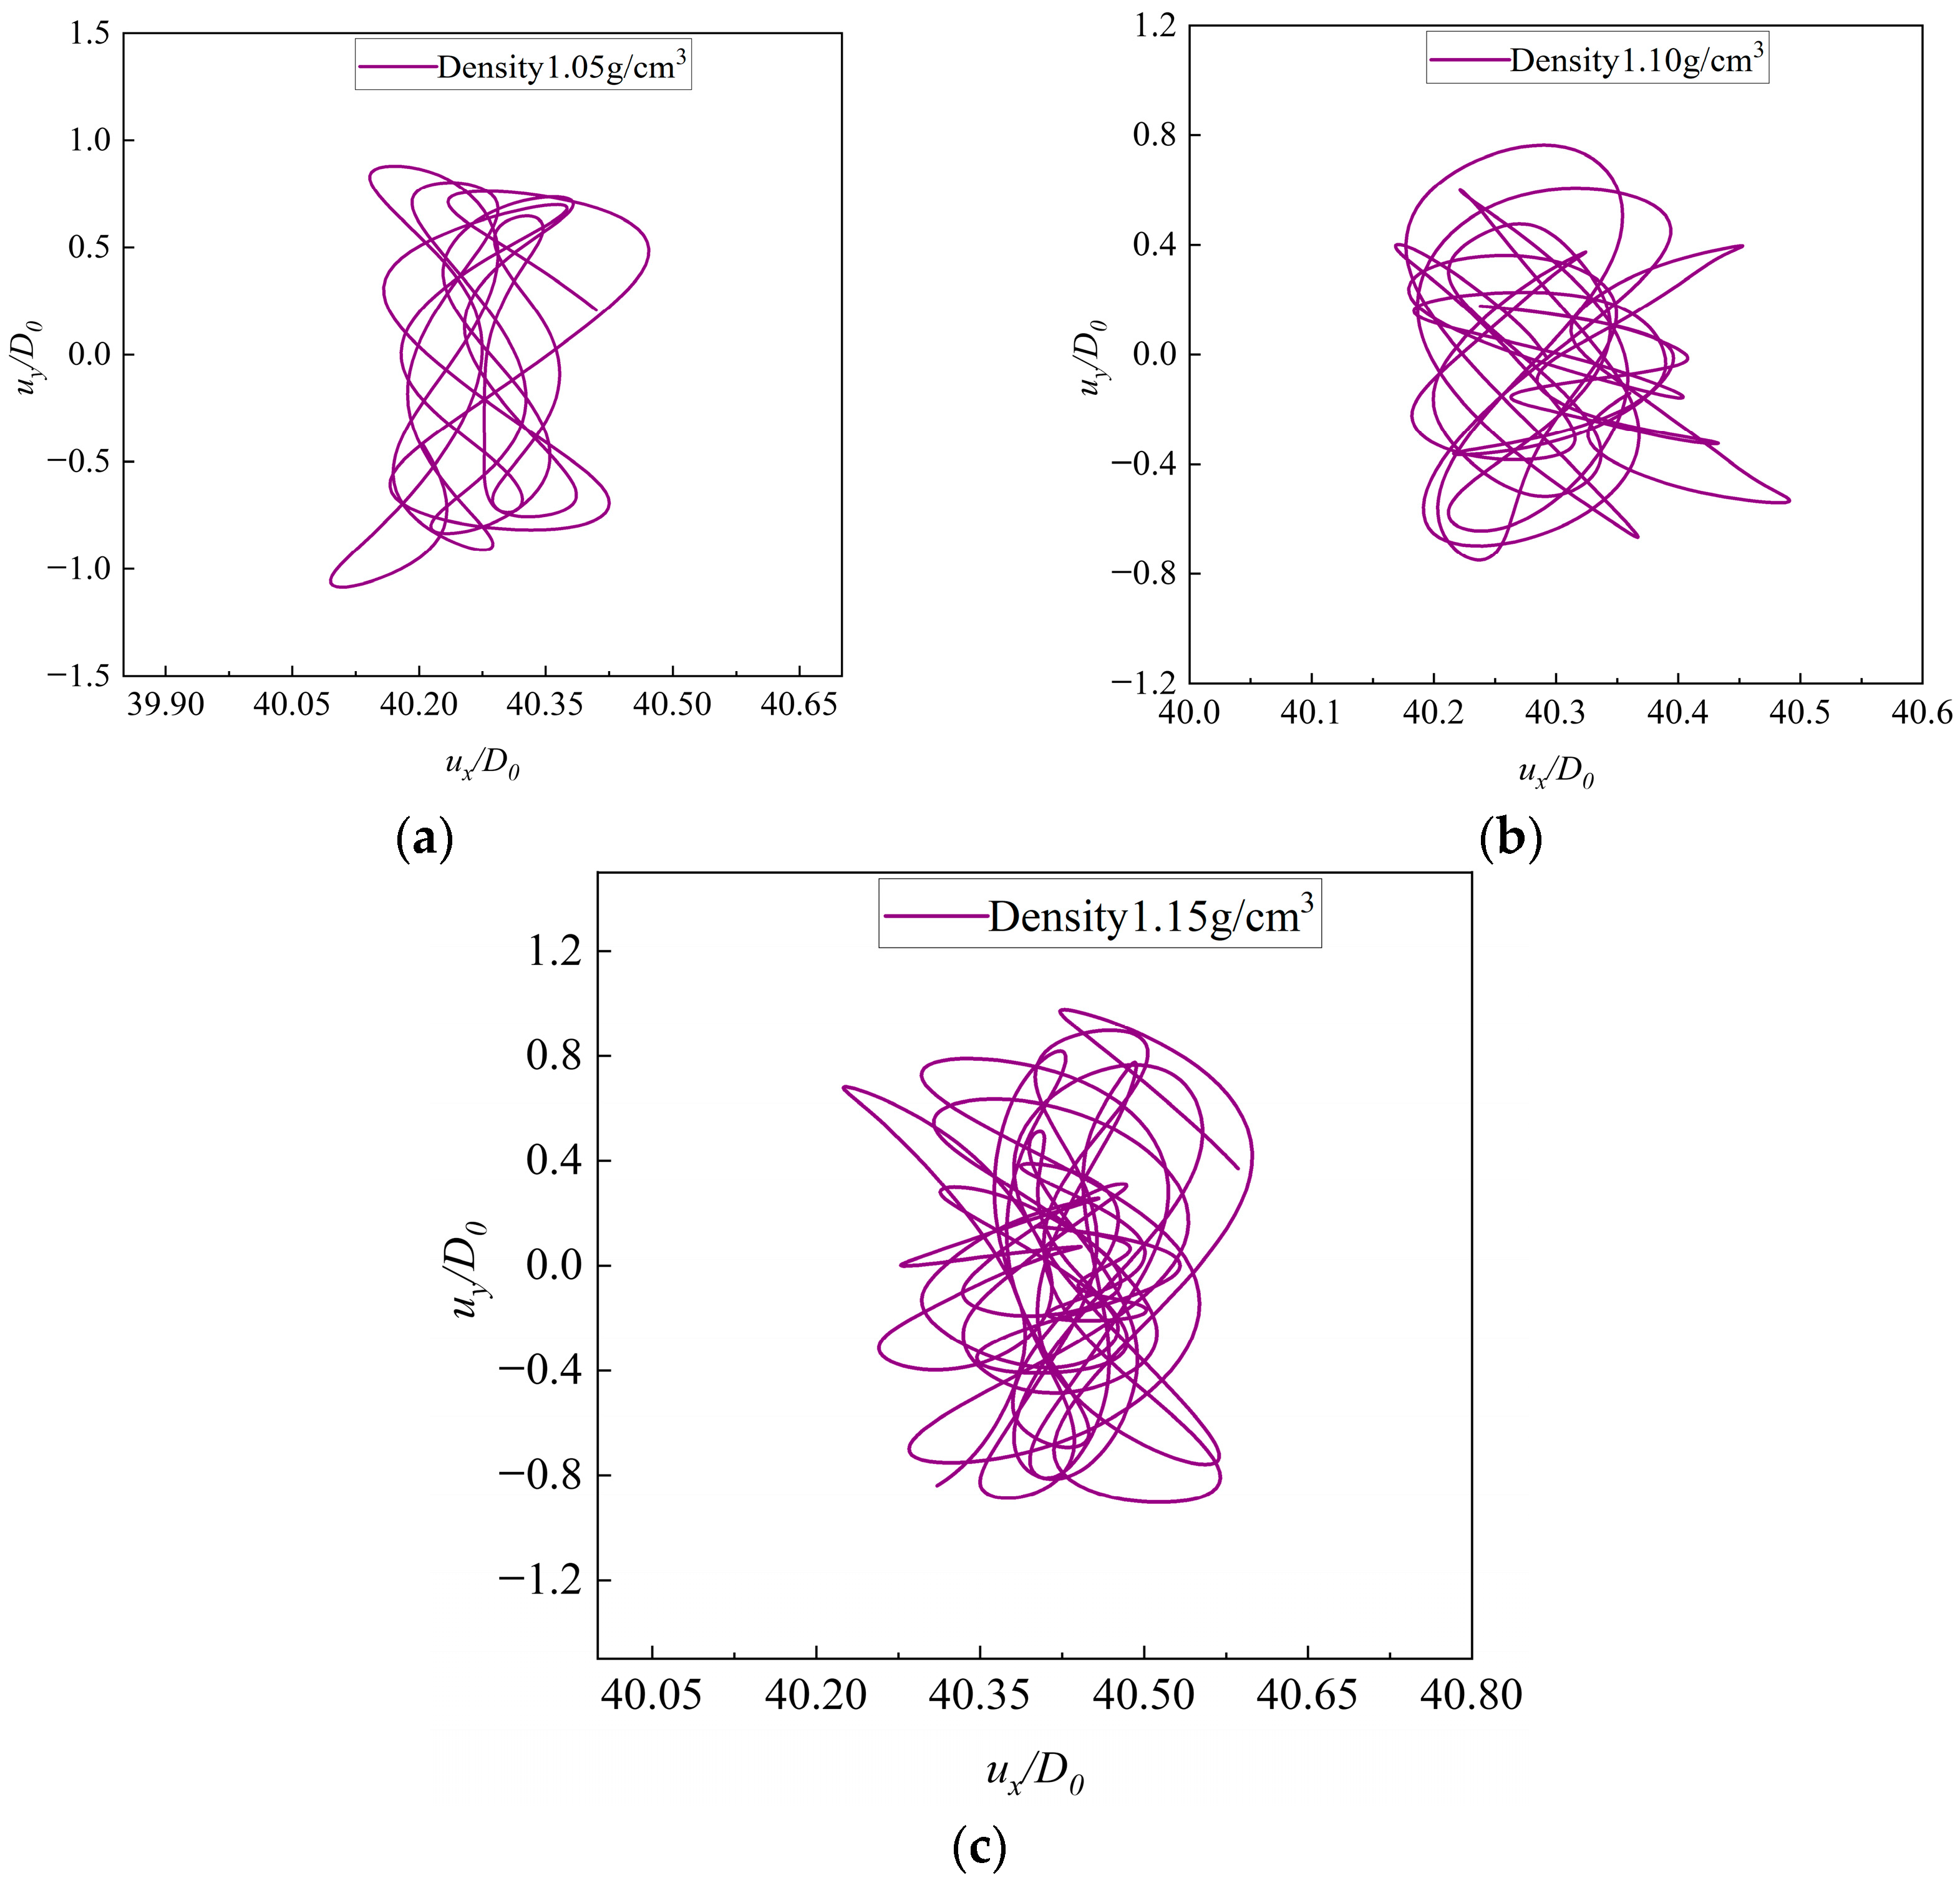
As shown in Figure 14, the combined vibrations in the in-line and cross-flow directions make the motion trajectory of the riser highly irregular. This is because both directions exhibit multi-frequency responses, and the response frequencies do not have a linear relationship with one another. In addition, the cross-flow amplitude is much larger than the in-line amplitude. This is similar to the amplitude relationship observed in conventional marine risers.

5.3. Effect of Slurry Flow Rate on Riser Dynamics

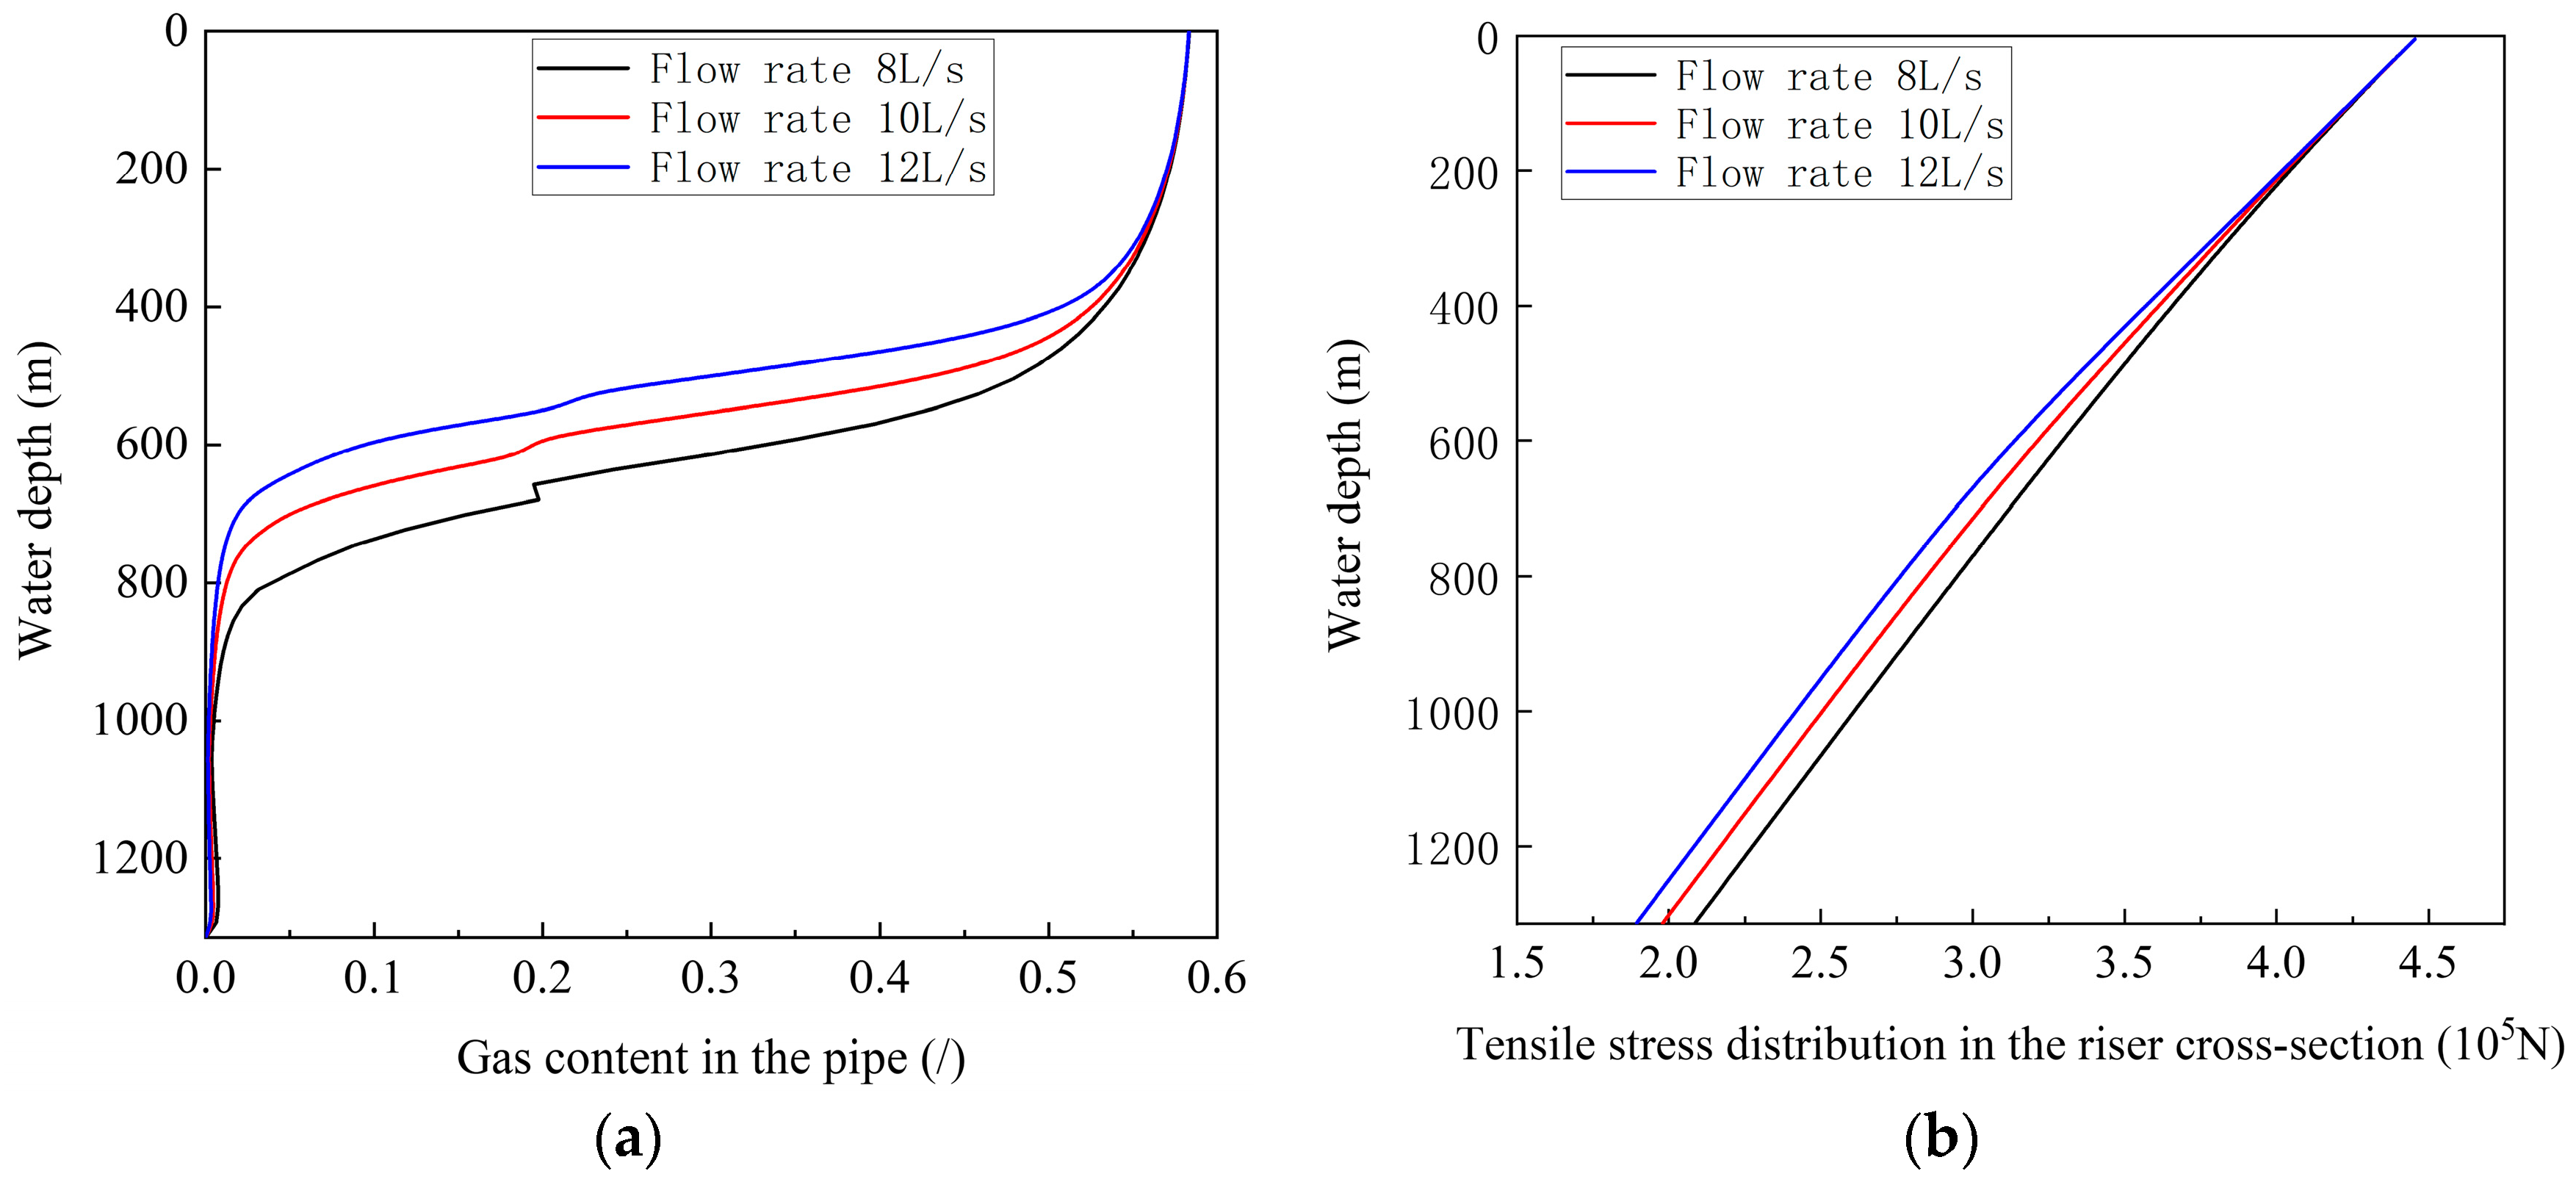
Figure 15 shows the gas holdup distribution inside the riser and the sectional tension distribution of the hydrate trial production riser under different slurry flow rates. As shown in (a), as the slurry flow rate increases, the position where hydrate starts to dissociate moves upward. In other words, hydrate dissociation occurs later. As shown in (b), the sectional tension along the riser decreases as the slurry flow rate increases.
This is because a higher slurry flow rate leads to a higher liquid velocity inside the pipe. The residence time of hydrate in the riser is then reduced, and the heat-transfer time with the surrounding seawater becomes shorter. As a result, hydrate dissociation inside the riser is delayed. Moreover, when the dissociation location is farther from the seabed, liquid occupies more space inside the pipe. This increases the overall buoyancy of the riser system, decreases its net weight, and reduces the sectional tension.
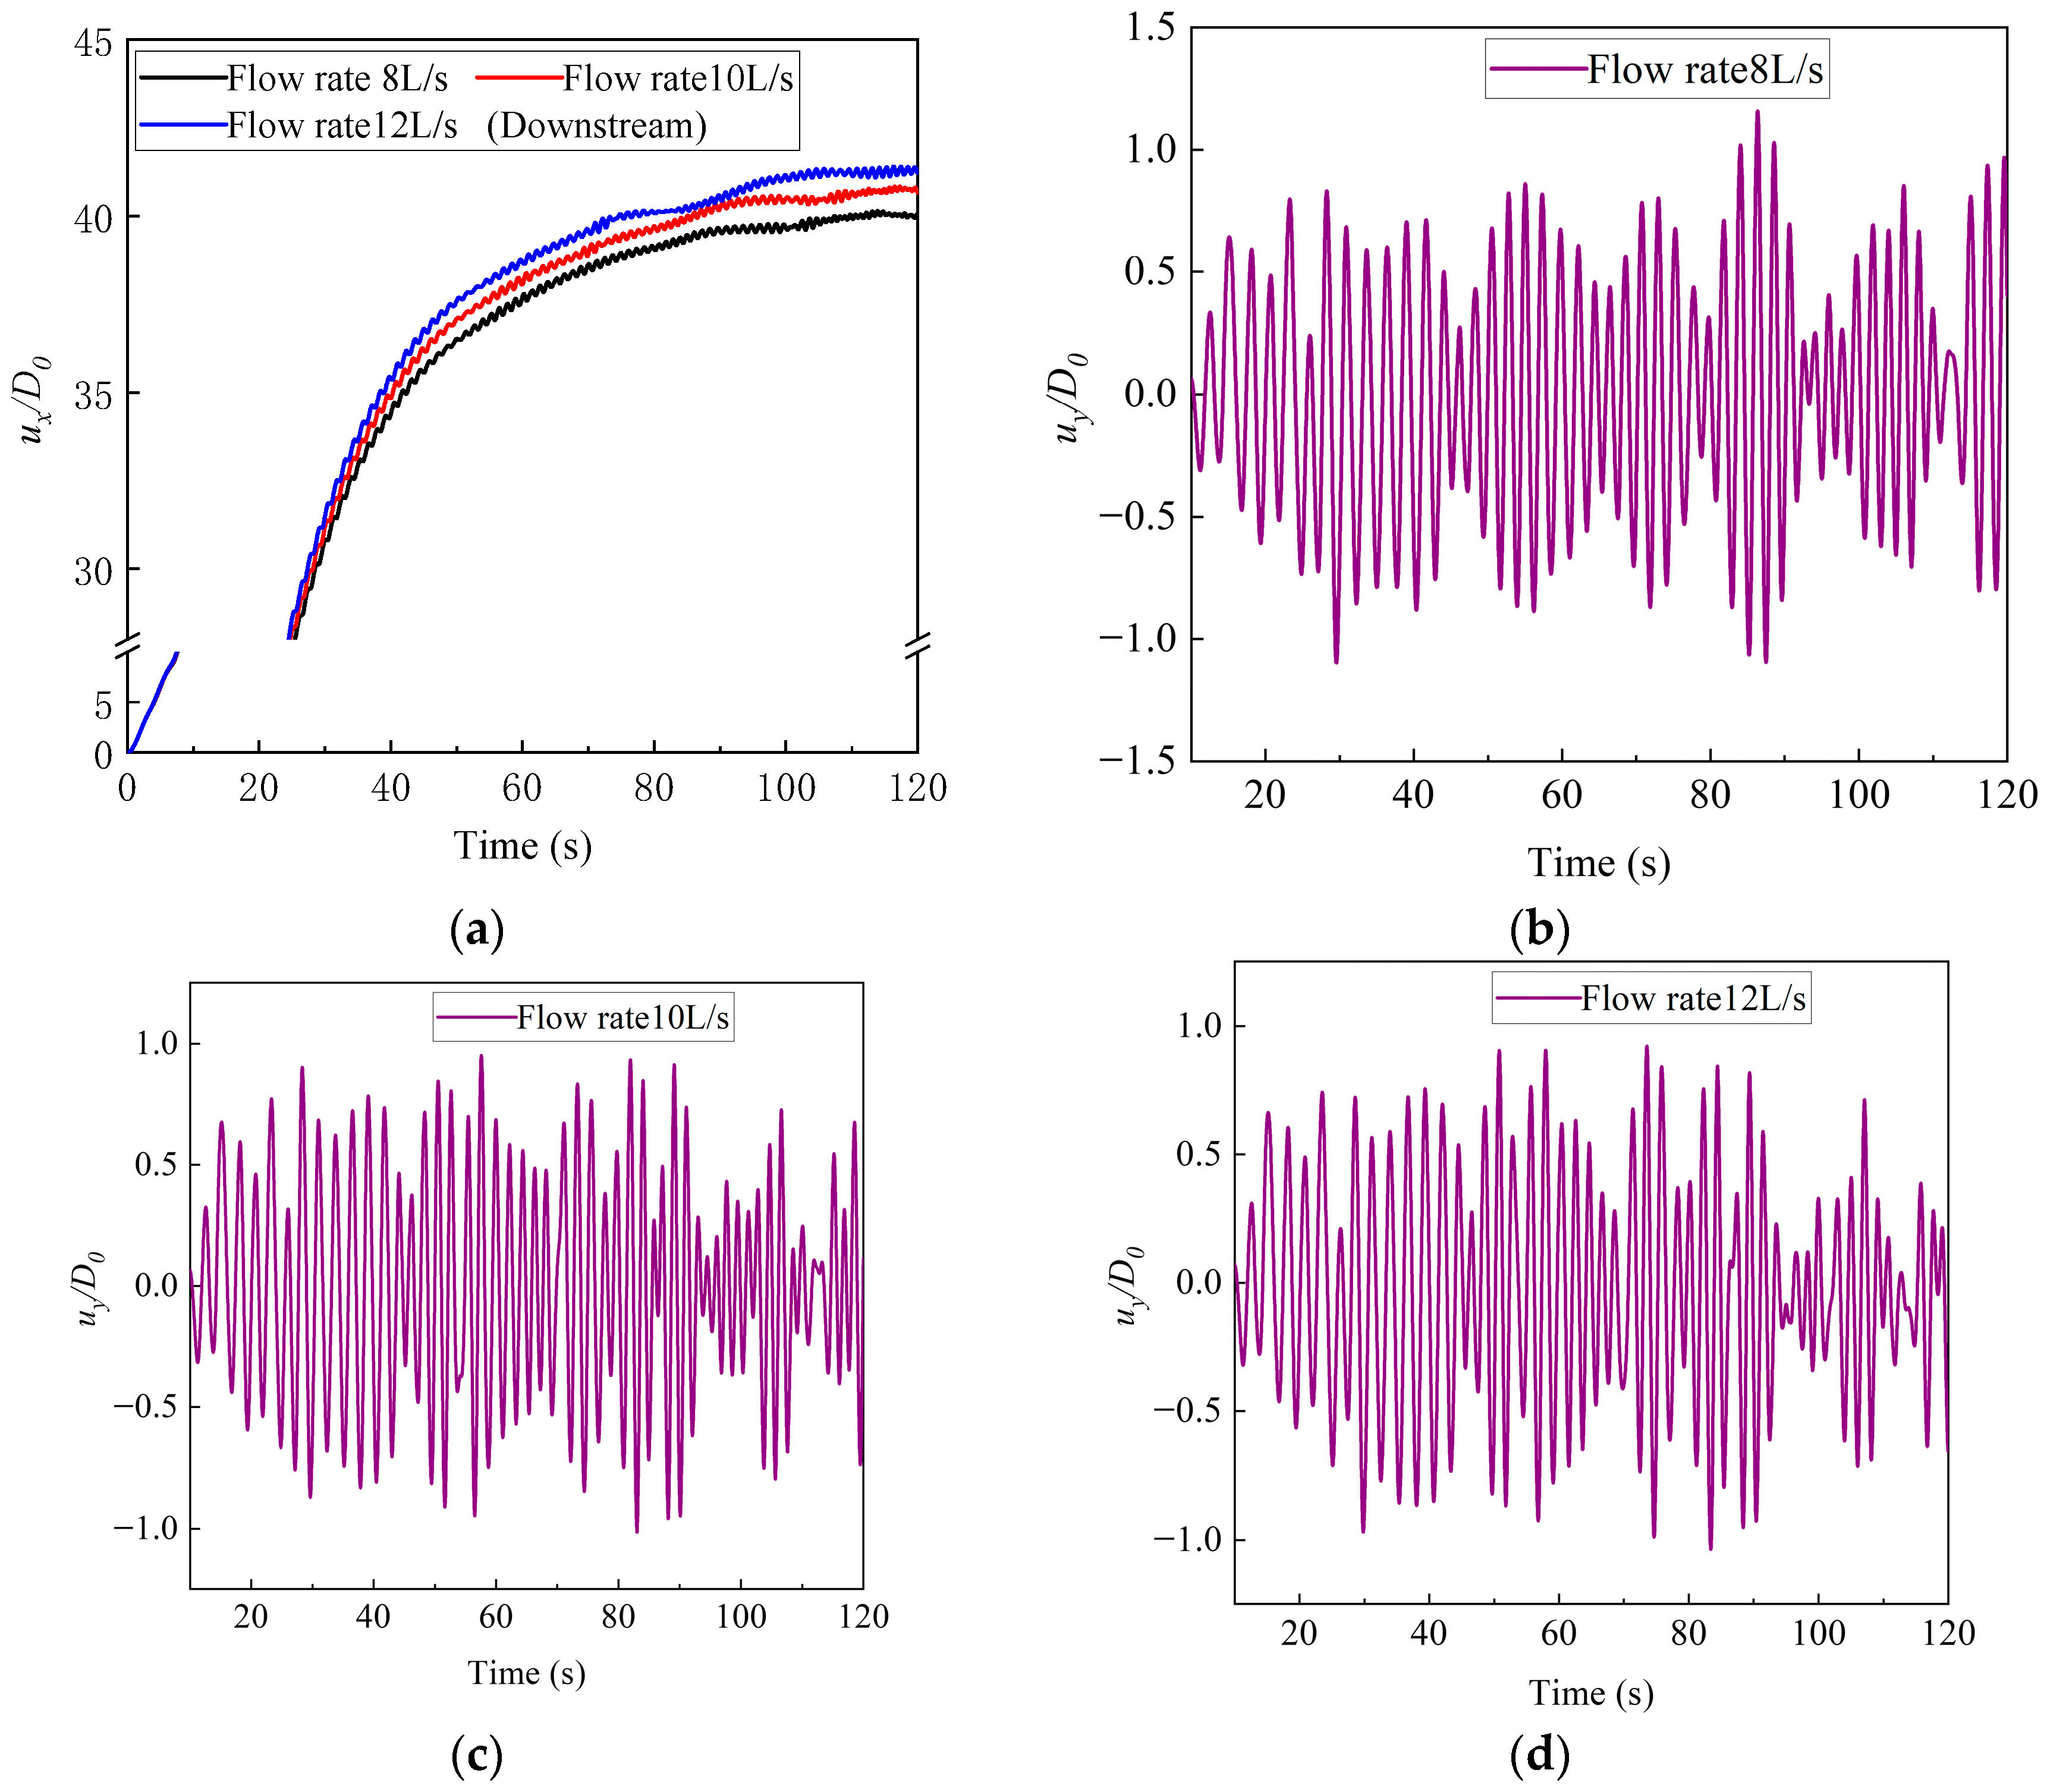
Figure 16 shows the time histories of the in-line and cross-flow displacements at the middle section of the hydrate trial production riser under different slurry flow rates. Figure 16a shows that the in-line vibration increases with increasing slurry flow rate, while vortex-induced vibration persists throughout the response. Figure 16b–d show that the cross-flow amplitude varies continuously as the internal flow rate increases. This is because a higher flow rate increases the velocity of the gas–liquid mixture inside the riser and strengthens its impact on the inner wall, making the vibration more complex.
Figure 17 and Figure 18 show the vibration amplitude-frequency spectra and motion trajectories, respectively, of the middle section of the riser under different slurry flow rates. As shown in Figure 17a, multiple response frequencies appear in the cross-flow direction. As the slurry flow rate increases, the response frequencies tend to become higher and more numerous. The cross-flow spectrum shows that the vibration energy is mainly concentrated near 0.38 Hz, 0.45 Hz, 0.51 Hz, and 0.57 Hz, while the dominant frequency remains 0.45 Hz.
As shown in Figure 17b, when the flow rate is 8 L/s, the dominant frequency in the in-line direction is 0.78 Hz. A secondary frequency of 0.90 Hz is also observed. As the flow rate increases, the dominant in-line frequency shifts to 0.86 Hz. Higher-frequency responses also appear at 0.98 Hz and 1.04 Hz. This is because the internal flow in the riser is a complex nonequilibrium multiphase flow. A higher slurry flow rate leads to greater fluid kinetic and potential energy. This strengthens the competition among adjacent vibration modes of the riser. As a result, several nearby frequencies respond at the same time, which makes the spatial motion trajectory of the riser highly complex.

5.4. Effect of Outlet Backpressure on Riser Dynamics

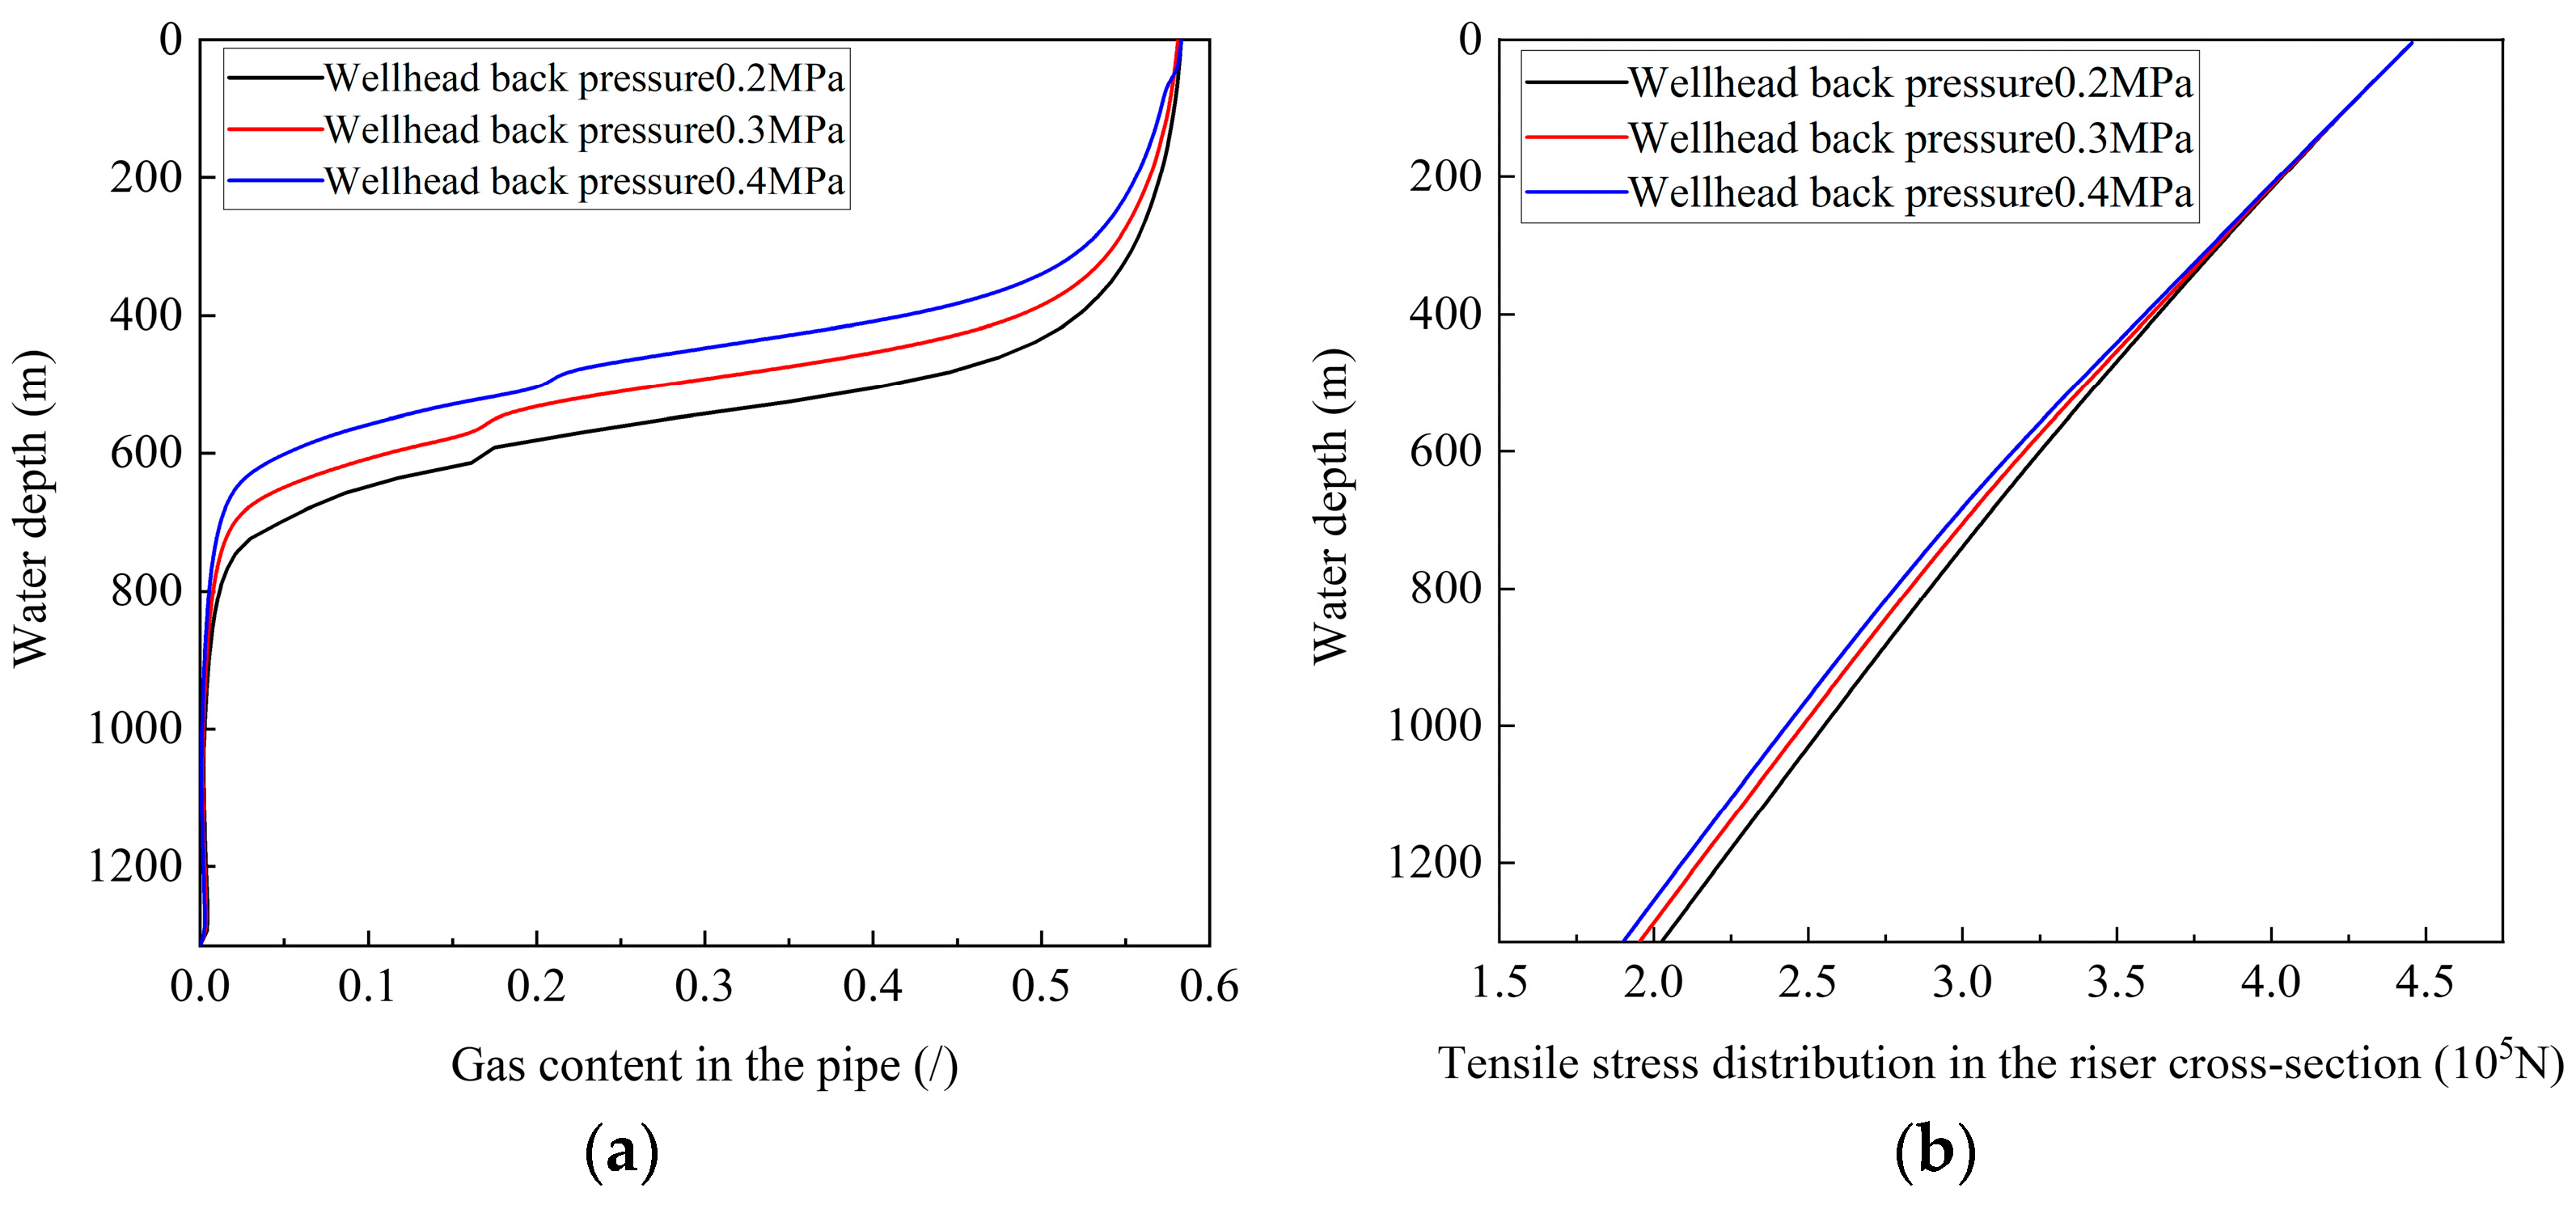
Figure 19 shows the gas holdup and sectional tension distributions of the riser under different outlet backpressures. As the outlet backpressure increases, the position where hydrate begins to dissociate moves upward, and the sectional tension along the riser decreases. This is because a higher outlet pressure raises the pressure along the pipe and makes it harder for hydrate to reach phase equilibrium. Meanwhile, less hydrate dissociates, so the liquid volume fraction in the riser increases. This increases the overall buoyancy of the system, reduces the net weight, and lowers the sectional tension.
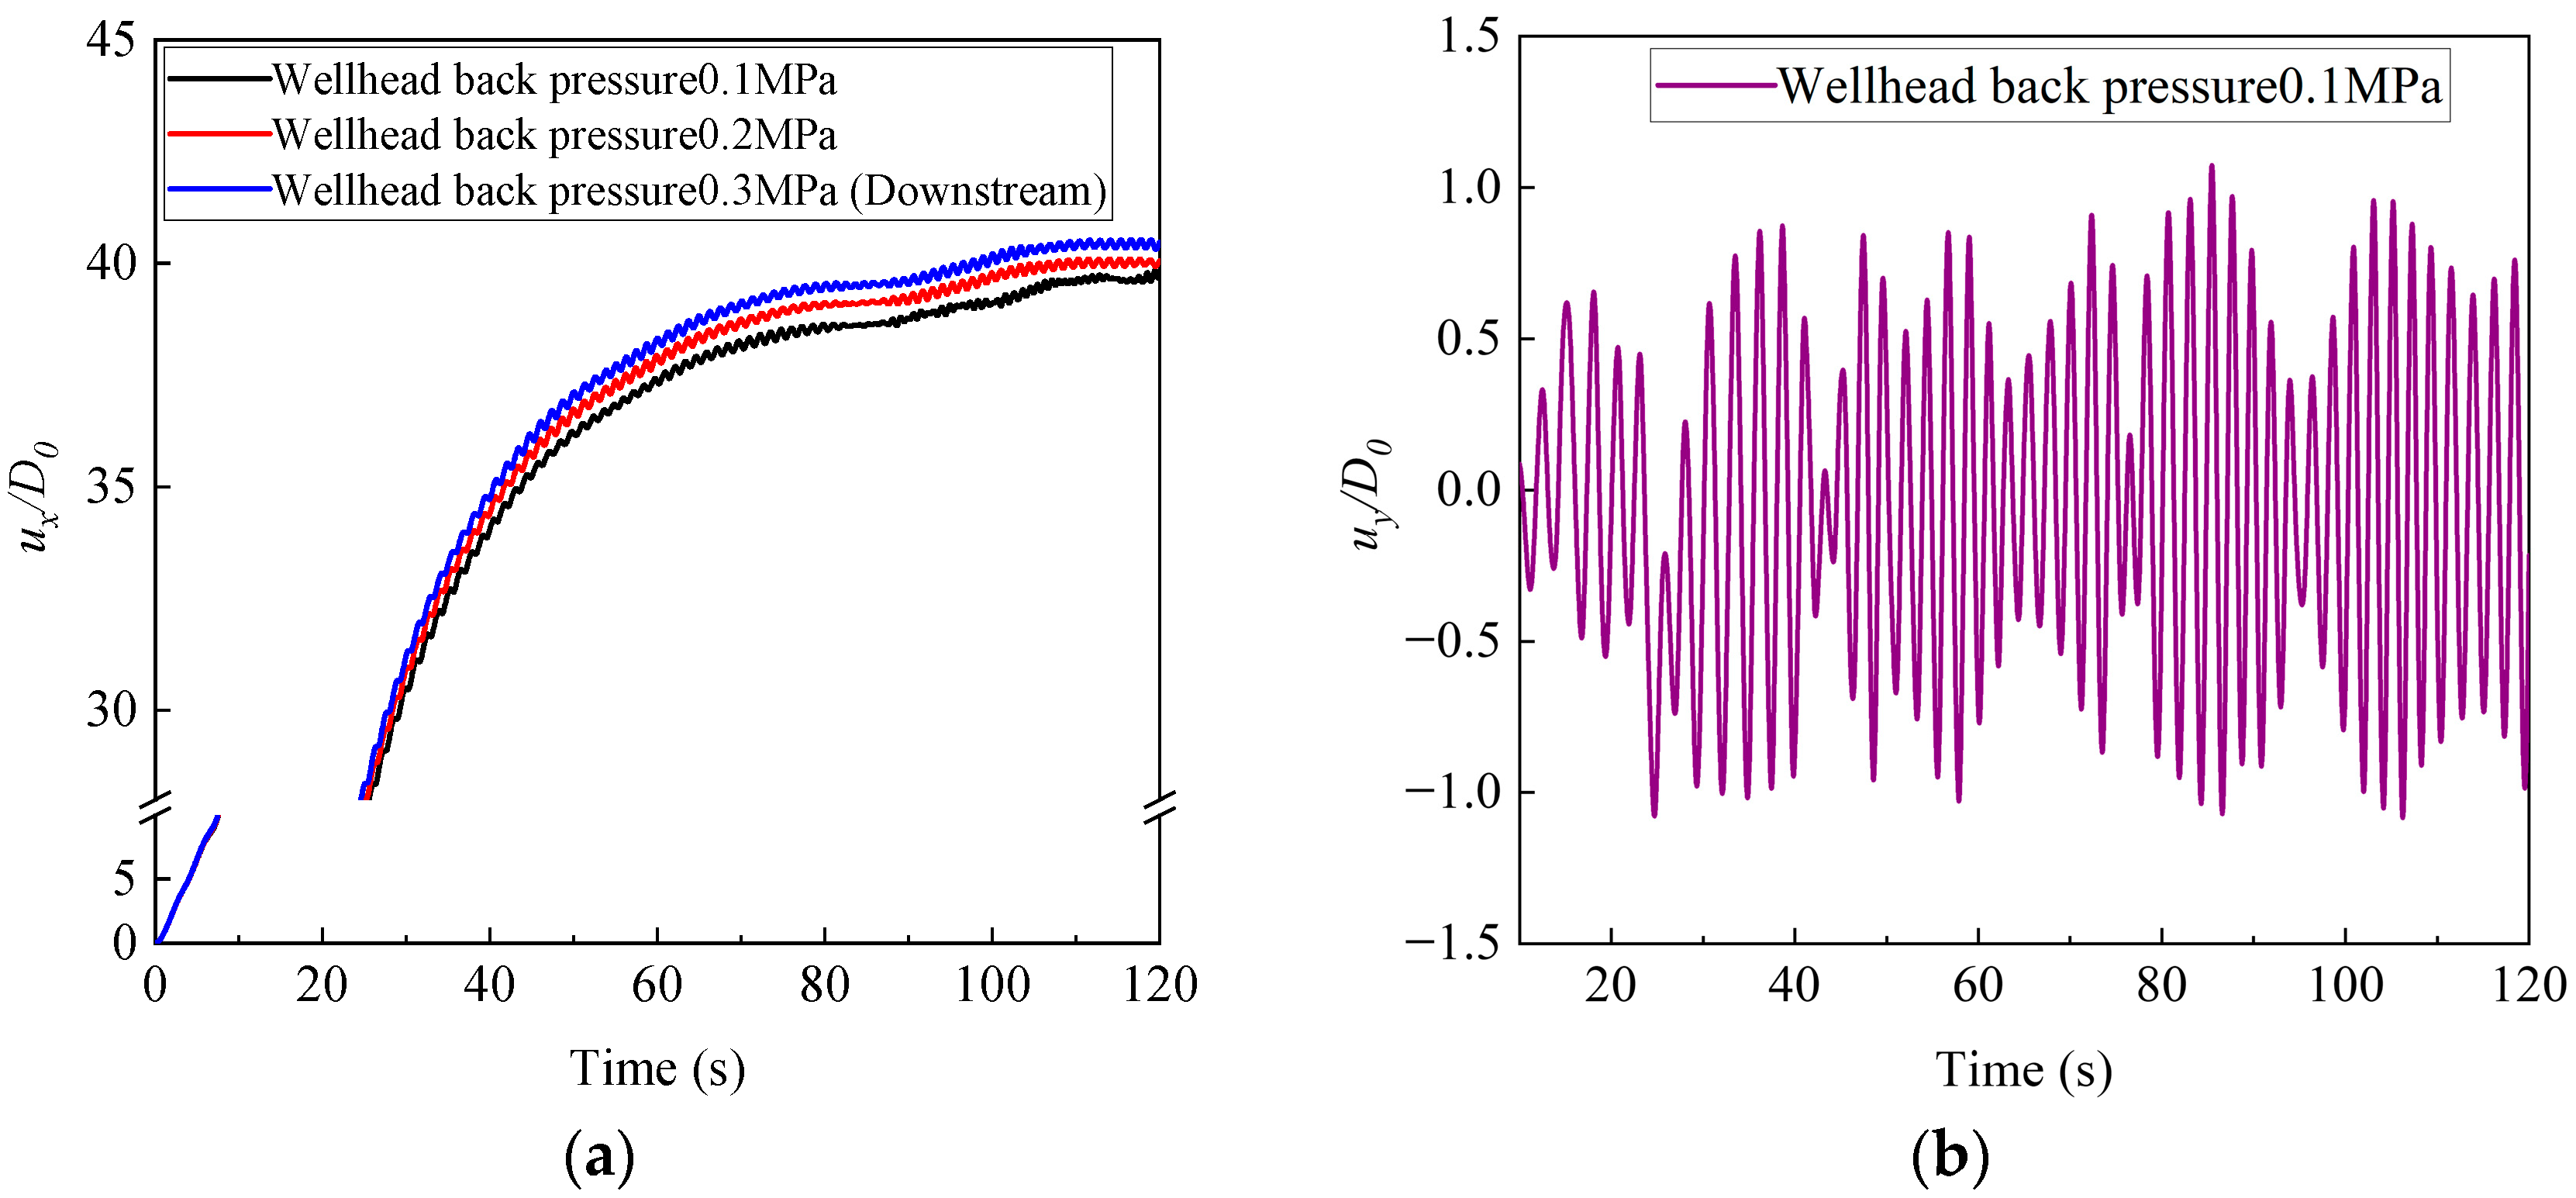
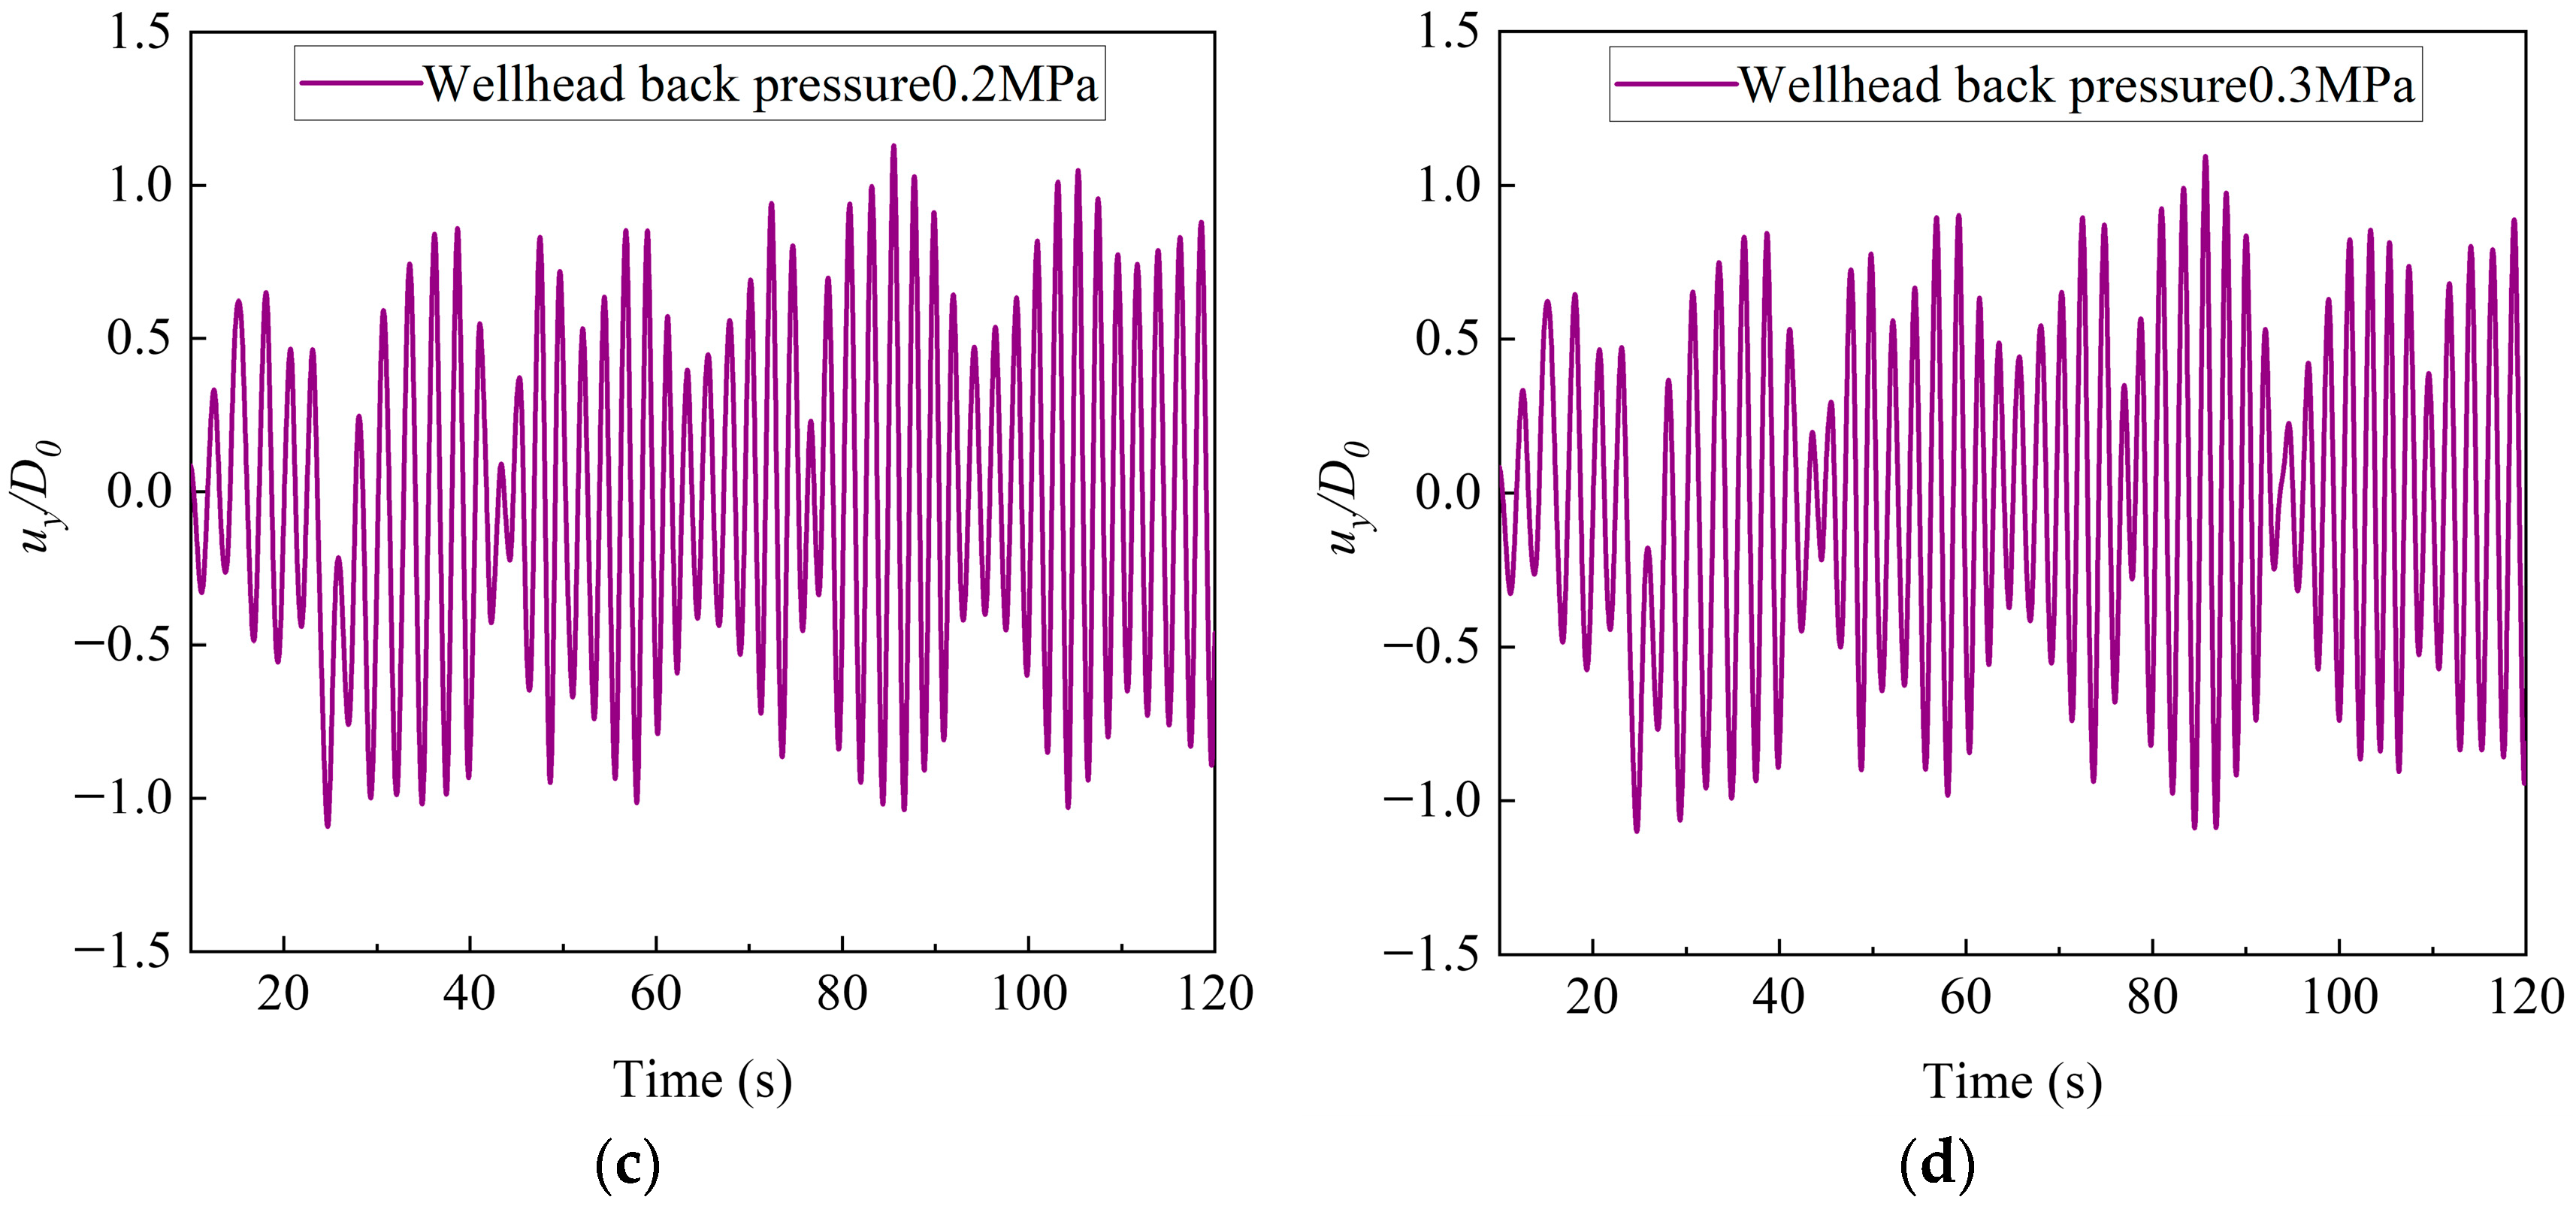
Figure 20 shows the time histories of the in-line and cross-flow displacements at the middle section of the riser under different outlet backpressures. Figure 20a shows that the in-line vibration displacement increases gradually with increasing outlet backpressure, while the riser continues to exhibit small-amplitude vibration. Figure 20b–d show that outlet backpressure has little influence on the cross-flow vibration of the riser, and the changes in amplitude and frequency are not significant.
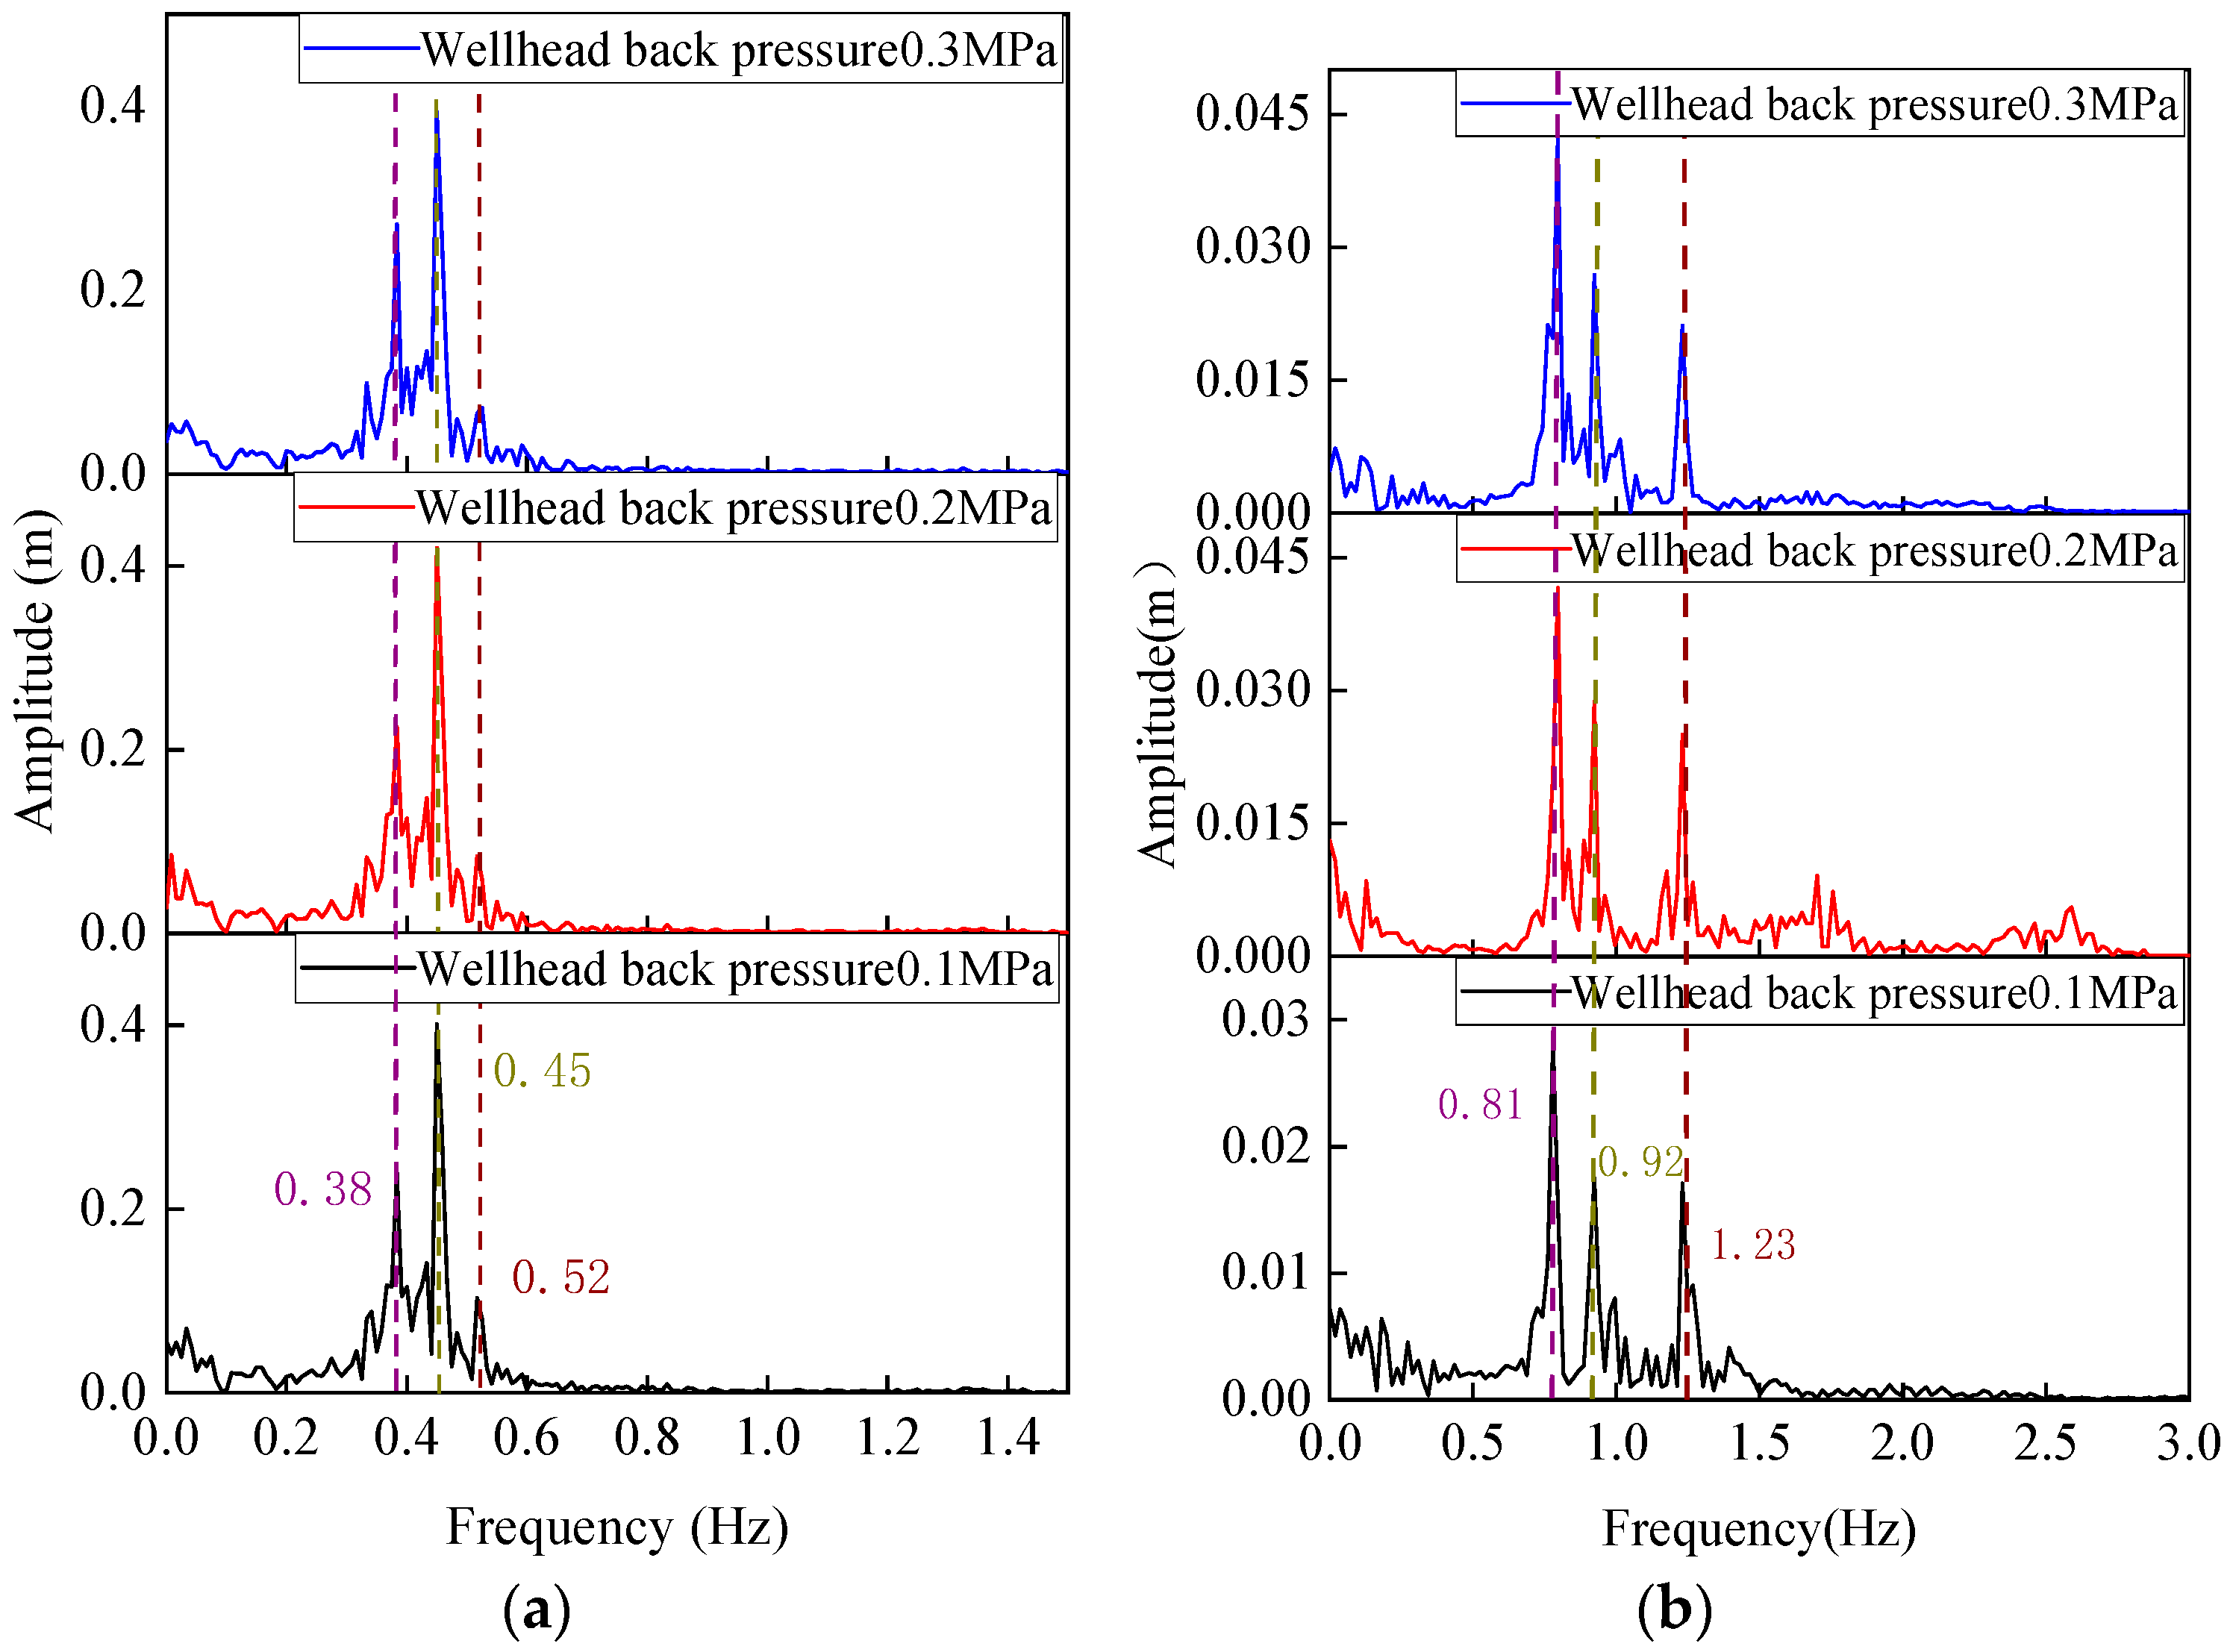
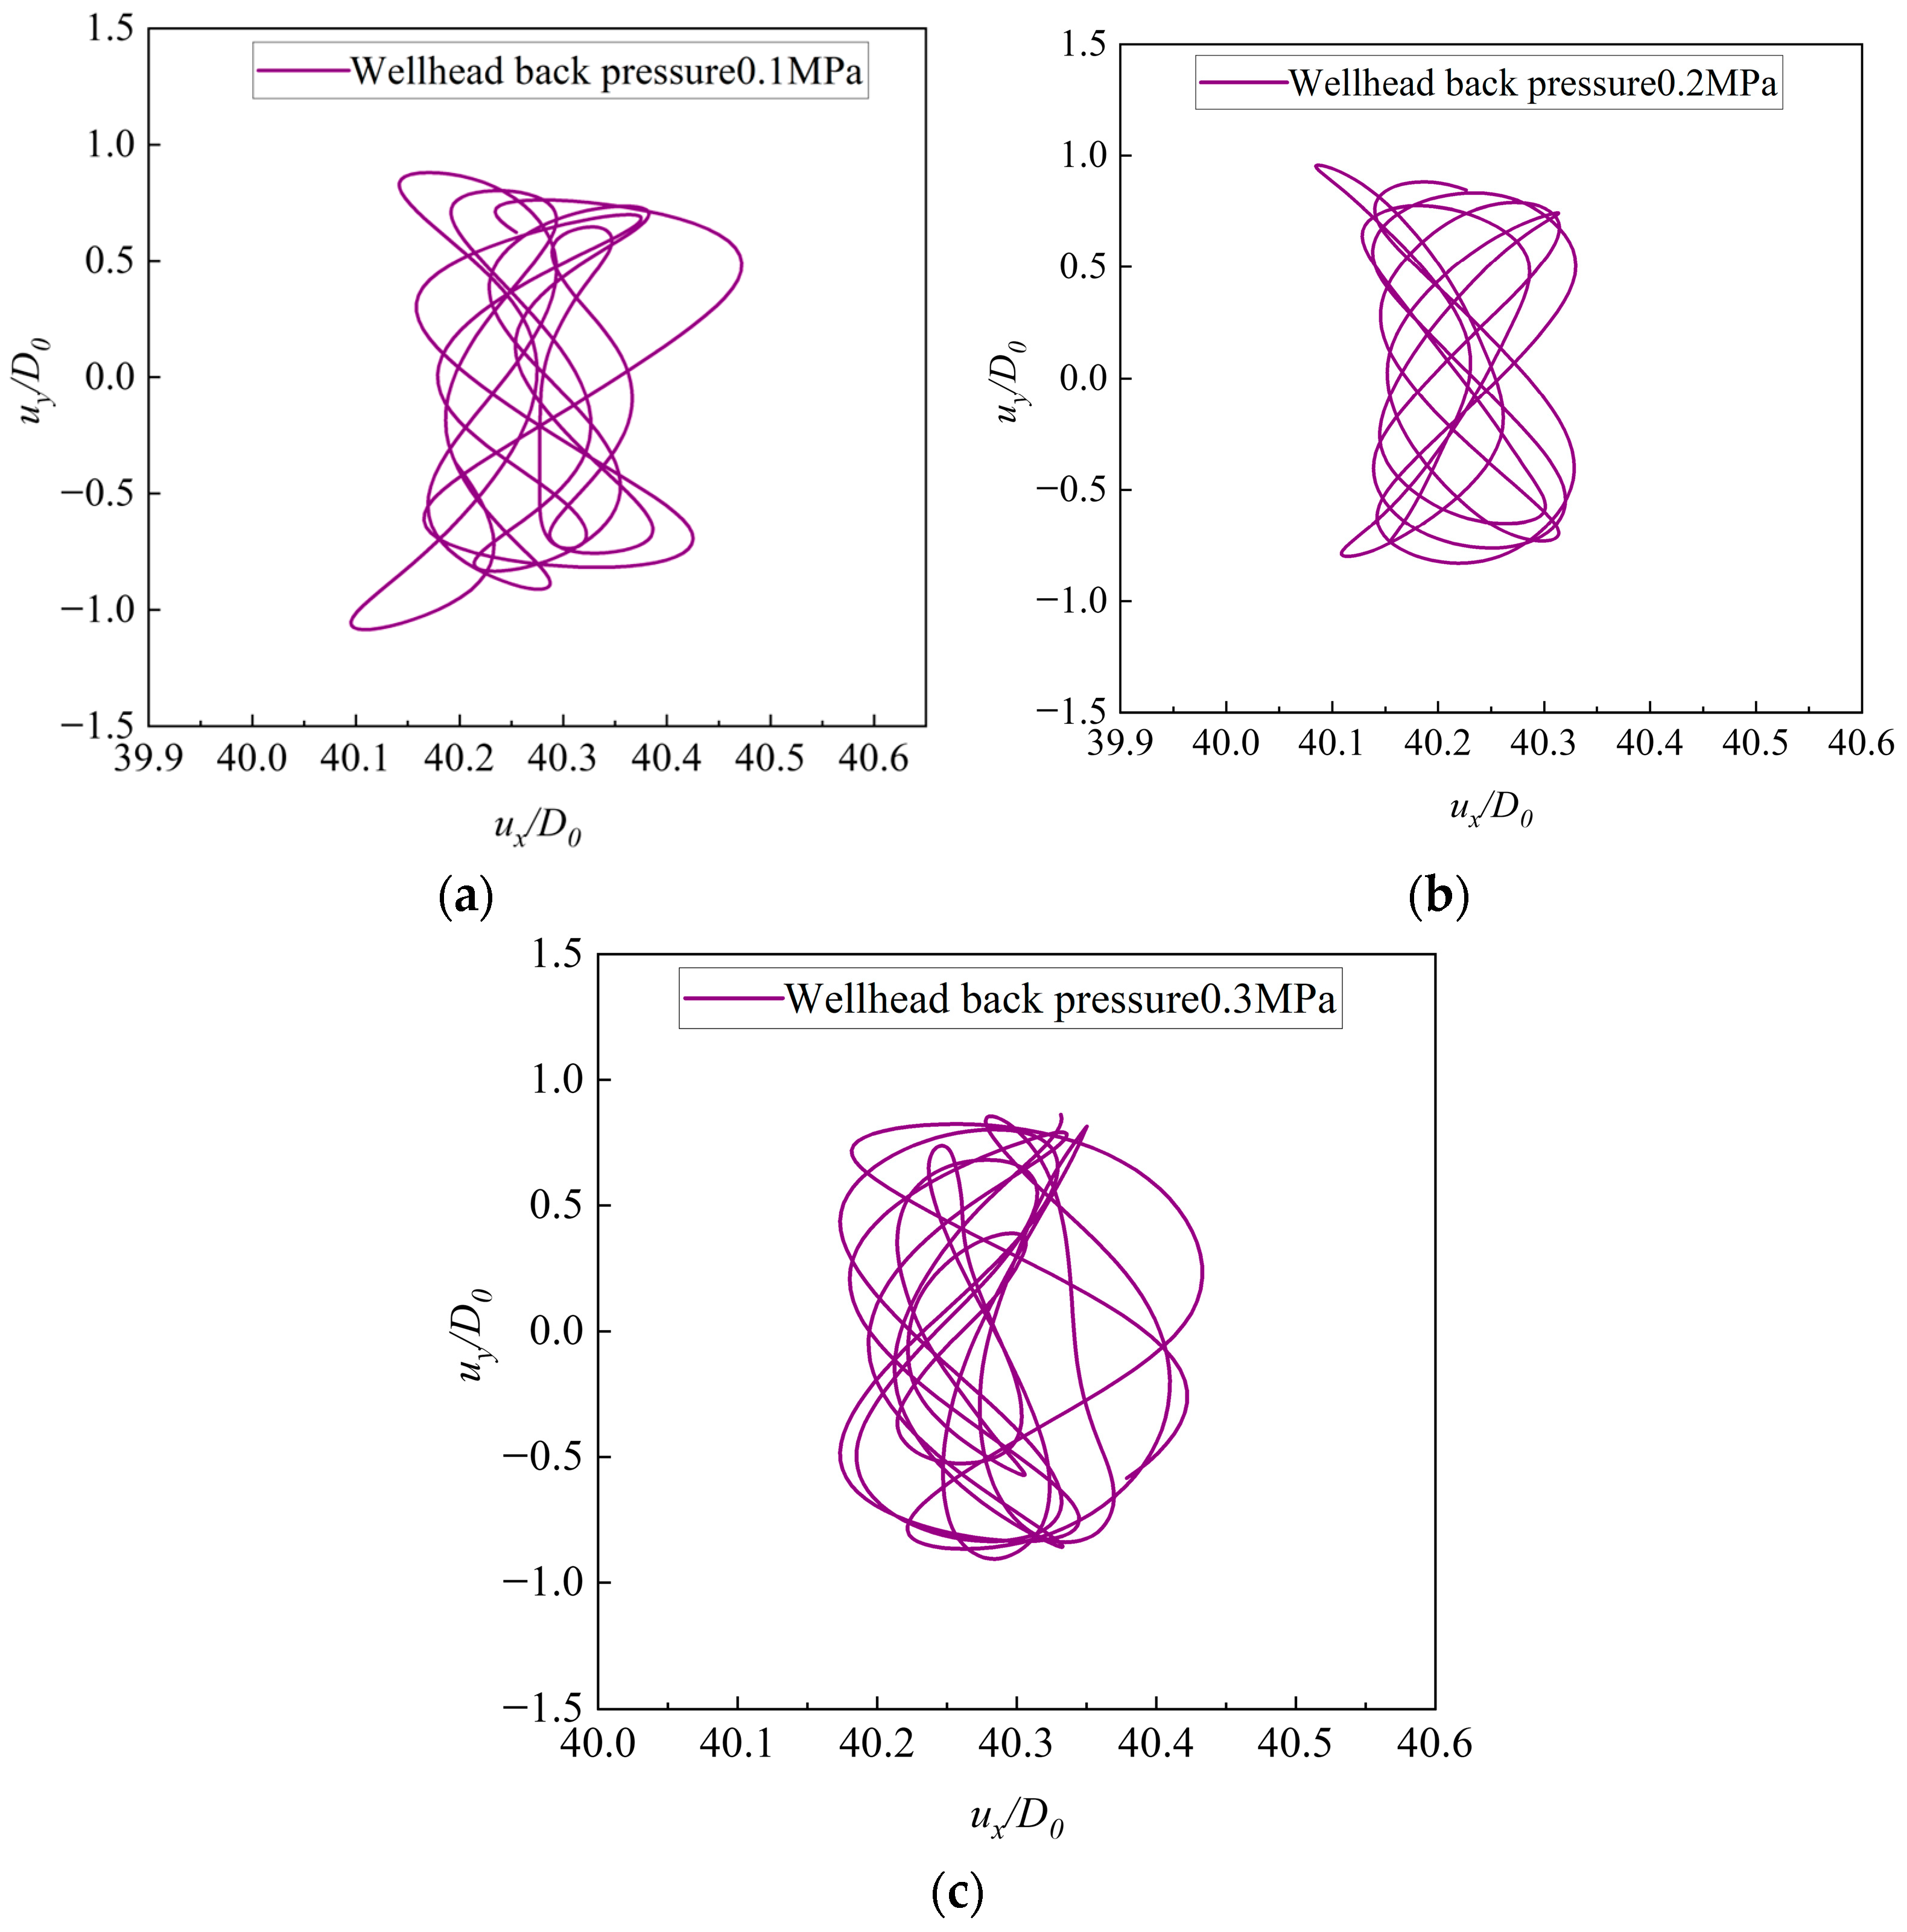
Figure 21 and Figure 22 present the vibration amplitude-frequency spectra and motion trajectories, respectively, for the middle section of the riser under different outlet backpressures. Figure 21 shows that the dominant cross-flow response frequency is 0.45 Hz, with secondary frequencies at 0.38 Hz and 0.52 Hz. In the in-line direction, the dominant response frequency is 0.81 Hz, with secondary frequencies at 0.92 Hz and 1.23 Hz. Figure 22 shows that the motion trajectories at the riser center differ under different outlet backpressures. This reflects the combined effect of multi-frequency vibration responses in both the cross-flow and in-line directions under multiple interacting factors.

6. Conclusions

This study establishes a more comprehensive nonlinear coupled framework that simultaneously considers hydrate dissociation, nonequilibrium internal multiphase flow, depth-varying effective tension, external shear-current loading, and wake-oscillator-based vortex-induced vibration. Based on this model, we further reveal the multi-frequency coupled response of the riser and clarify how top tension, slurry density, flow rate, and outlet backpressure influence hydrate dissociation, sectional tension, and riser deformation.
(1)
Based on the natural gas hydrate trial production case in the Shenhu area of the South China Sea, this study establishes a nonlinear dynamic model that considers hydrate phase change and dissociation inside the pipe, multiphase flow evolution, external ocean-current loading, and vortex shedding. The model provides a theoretical basis for analyzing the mechanical response and vortex-induced vibration characteristics of the production riser.
(2)
During hydrate production, as the slurry density, flow rate, and outlet backpressure inside the riser increase, the location where hydrate begins to dissociate moves upward. At the same time, the gas holdup decreases and the effective sectional tension is reduced.
(3)
Under the combined effects of complex ocean currents and the nonequilibrium internal multiphase flow generated by hydrate phase change and dissociation, the vortex-induced vibration of the production riser transitions from a conventional harmonic response to a strongly coupled multi-frequency excitation. Neither the cross-flow nor the in-line response is characterized by a single frequency. Instead, both exhibit severe mode competition and broadband multi-frequency coupled vibration. Consequently, the dynamic phase decoupling between the two directions continuously disrupts their synchronization. As a result, the motion trajectory of the riser no longer shows a simple figure-eight pattern but breaks down into highly irregular and chaotic motions.
(4)
The dynamic response of the riser varies markedly with operating conditions. Increasing the top tension raises the dominant vibration frequency and enhances the riser’s resistance to deformation. Increasing the slurry flow rate tends to induce higher-frequency vibration responses. By contrast, slurry density and outlet backpressure have relatively limited effects on the vortex-induced vibration frequency. Therefore, the vibration response of the trial production riser can be improved by properly increasing the top tension and controlling the slurry density, flow rate, and outlet backpressure.

Author Contributions

Q.F.: Conceptualization, Investigation, Methodology, Software, Formal analysis, Validation, Writing—Original draft, Writing-Review & Editing, Supervision, Visualization, Data Curation; L.M.: Conceptualization, Methodology, Software, Formal analysis, Investigation, Writing—Original draft, Validation, Writing—Review & Editing, Visualization; Y.C.: Conceptualization, Methodology, Software, Formal analysis, Investigation, Validation, Writing-Review & Editing, Visualization; R.Q.: Methodology, Software, Formal analysis, Validation, Writing-Review & Editing, Visualization; J.Z.: Methodology, Validation, Writing-Review & Editing, Visualization. All authors have read and agreed to the published version of the manuscript.

Funding

The authors gratefully acknowledge the financial support from the National Key Laboratory of Offshore Natural Gas Hydrates Open Fund Project (No. CCL2024RCPS0277KQN). The authors wish to thank the editor for their time and effort to provide feedback on our manuscript, and the reviewers for their careful, unbiased, and constructive comments.

Data Availability Statement

The data presented in this study are available on request from the corresponding author.

Conflicts of Interest

The authors declare no conflicts of interest. The funders had no role in the design of the study; in the collection, analyses, or interpretation of data; in the writing of the manuscript; or in the decision to publish the results.

References

  1. Kaiser, M.J. Offshore oil and gas records circa 2020. Ships Offshore Struct. 2022, 17, 205–241. [Google Scholar] [CrossRef]
  2. Vidal, P.d.C.J.; González, M.O.A.; de Vasconcelos, R.M.; de Melo, D.C.; de Oliveira Ferreira, P.; Sampaio, P.G.V.; da Silva, D.R. Decommissioning of offshore oil and gas platforms: A systematic literature review of factors involved in the process. Ocean Eng. 2022, 255, 111428. [Google Scholar] [CrossRef]
  3. Acheampong, T.; Kemp, A.G. Health, safety and environmental (HSE) regulation and outcomes in the offshore oil and gas industry: Performance review of trends in the United Kingdom Continental Shelf. Saf. Sci. 2022, 148, 105634. [Google Scholar] [CrossRef]
  4. Guo, X.; Yang, J.; Li, X.; Liu, X.; Li, Y. Three-phase flow induced vibration characteristics for mining riser in deep-sea natural gas hydrate extraction. Phys. Fluids 2025, 37, 023329. [Google Scholar] [CrossRef]
  5. Guo, X.; Lv, J.; Li, Y.; Ren, Y.; Hu, N.; Song, Y. Machine-learning model of nonlinear vibration prediction for mining riser used into deep-sea hydrate exploitation based on CLR-ZOA-RF. Nonlinear Dyn. 2025, 113, 19103–19124. [Google Scholar] [CrossRef]
  6. Nguyen, V.-T.; Nguyen, H.H. Detached eddy simulations of flow induced vibrations of circular cylinders at high Reynolds numbers. J. Fluids Struct. 2016, 63, 103–119. [Google Scholar] [CrossRef]
  7. Liao, W.; Huang, Z.; Sun, H.; Huang, X.; Gu, Y.; Chen, W.; Zhang, Z.; Kan, J. Numerical investigation of cylinder vortex-induced vibration with downstream plate for vibration suppression and energy harvesting. Energy 2023, 281, 128264. [Google Scholar] [CrossRef]
  8. Ma, X.; Li, Z.; Zhang, H.; Zhou, S. Dynamic modeling and analysis of a tristable vortex-induced vibration energy harvester. Mech. Syst. Signal Process. 2023, 187, 109924. [Google Scholar] [CrossRef]
  9. Fang, S.; Du, H.; Yan, T.; Chen, K.; Li, Z.; Ma, X.; Lai, Z.; Zhou, S. Theoretical and experimental investigation on the advantages of auxetic nonlinear vortex-induced vibration energy harvesting. Appl. Energy 2024, 356, 122395. [Google Scholar] [CrossRef]
  10. Yang, Q.; Li, C.; Guo, K.; Shan, W.; Huang, S. Experimental study of the vortex-induced vibration of a circular cylinder considering coupling effect in along-and across-wind direction. Phys. Fluids 2024, 36, 035162. [Google Scholar] [CrossRef]
  11. Apango, F.; Snedden, J.W.; Daigle, H.; Yurchenko, I.A. Analysis of hydrocarbon under-filled and water-filled Miocene deepwater reservoirs, eastern Mexico offshore. Mar. Pet. Geol. 2021, 131, 105158. [Google Scholar] [CrossRef]
  12. Kim, H.-T.; O’Reilly, O.M. Instability of catenary-type flexible risers conveying fluid in subsea environments. Ocean Eng. 2019, 173, 98–115. [Google Scholar] [CrossRef]
  13. Gu, J.; Ma, T.; Chen, L.; Jia, J.; Kang, K. Dynamic analysis of deepwater risers conveying two-phase flow under vortex-induced vibration. J. Braz. Soc. Mech. Sci. Eng. 2021, 43, 188. [Google Scholar] [CrossRef]
  14. Liang, W.; Lou, M. Numerical simulation of vortex-induced vibration of a marine riser with a multiphase internal flow considering hydrate phase transition. Ocean Eng. 2020, 216, 107758. [Google Scholar] [CrossRef]
  15. Lou, M.; Liang, W. Effect of multiphase internal flows considering hydrate phase transitions on the streamwise oscillation of marine risers. Ocean Eng. 2020, 197, 106905. [Google Scholar] [CrossRef]
  16. Leklong, J.; Chucheepsakul, S.; Kaewunruen, S. Dynamic responses of marine risers/pipes transporting fluid subject to top end excitations. In Proceedings of the ISOPE Pacific/Asia Offshore Mechanics Symposium, Bangkok, Thailand, 10–14 November 2008. [Google Scholar]
  17. Kaewunruen, S.; Chiravatchradej, J.; Chucheepsakul, S. Nonlinear free vibrations of marine risers/pipes transporting fluid. Ocean Eng. 2005, 32, 417–440. [Google Scholar] [CrossRef]
  18. Dai, H.L.; Wang, L.; Qian, Q.; Ni, Q. Vortex-induced vibrations of pipes conveying fluid in the subcritical and supercritical regimes. J. Fluids Struct. 2013, 39, 322–334. [Google Scholar] [CrossRef]
  19. Meng, S.H.; Zhang, X.Q.; Che, C.D.; Zhang, W. Cross-flow vortex-induced vibration of a flexible riser transporting an internal flow from subcritical to supercritical. Ocean Eng. 2017, 139, 74–84. [Google Scholar] [CrossRef]
  20. Monprapussorn, T.; Athisakul, C.; Chucheepsakul, S. Nonlinear vibrations of an extensible flexible marine riser carrying a pulsatile flow. J. Appl. Mech.-Trans. ASME 2007, 74, 754–769. [Google Scholar] [CrossRef]
  21. Duan, J.L.; Chen, K.; You, Y.X.; Li, J. Numerical investigation of vortex-induced vibration of a riser with internal flow. Appl. Ocean. Res. 2018, 72, 110–121. [Google Scholar] [CrossRef]
  22. Duan, J.L.; Zhou, J.F.; You, Y.X.; Wang, X. Time-domain analysis of vortex-induced vibration of a flexible mining riser transporting flow with various velocities and densities. Ocean Eng. 2021, 220, 108427. [Google Scholar] [CrossRef]
  23. Yamamoto, C.T.; Meneghini, J.R.; Saltara, F.; Fregonesi, R.A.; Ferrari, J.A. Numerical simulations of vortex-induced vibration on flexible cylinders. J. Fluids Struct. 2004, 19, 467–489. [Google Scholar] [CrossRef]
  24. Guo, H.Y.; Lou, M. Effect on internal flow on vortex induced vibration of risers. J. Fluids Struct. 2008, 24, 496–504. [Google Scholar] [CrossRef]
  25. Zhu, H.J.; Gao, Y.; Zhao, H.L. Experimental investigation on the flow-induced vibration of a free-hanging flexible riser by internal unstable hydrodynamic slug flow. Ocean Eng. 2018, 164, 488–507. [Google Scholar] [CrossRef]
  26. Li, F.Q.; An, C.; Duan, M.L.; Su, J. Combined damping model for dynamics and stability of a pipe conveying two-phase flow. Ocean Eng. 2020, 195, 106683. [Google Scholar] [CrossRef]
  27. Wang, Z.Y.; Sun, B.J. Deepwater gas kick simulation with consideration of the gas hydrate phase transition. J. Hydrodyn. 2014, 26, 94–103. [Google Scholar] [CrossRef]
  28. Kim, H.C.; Bishnoi, P.R.; Heidemann, R.A.; Rizvi, S. Kinetics of methane hydrate decomposition. Chem. Eng. Sci. 1987, 42, 1645–1653. [Google Scholar] [CrossRef]
  29. Dzyuba, A.V.; Zektser, I.S. Variations in submarine groundwater runoff as a possible cause of decomposition of marine methane-hydrates in the Artcic. Water Resour. 2013, 40, 74–83. [Google Scholar] [CrossRef]
  30. Hasan, A.R.; Kabir, C.S. A study of multiphase flow behavior in vertical wells. SPE Prod. Eng. 1988, 3, 263–272. [Google Scholar] [CrossRef]
  31. Wilson, J.F. Dynamics of Offshore Structures; John Wiley & Sons Press: Hoboken, NJ, USA, 2003. [Google Scholar]
  32. Zeng, S.; Mao, L.J.; Liu, Q.Y.; Wang, G.; Li, J. Study on mechanical properties of natural gas hydrate production riser considering hydrate phase transition and marine environmental loads. Ocean Eng. 2021, 235, 109456. [Google Scholar] [CrossRef]
Figure 1. Schematic of the natural gas hydrate trial production system.
Jmse 14 00785 g001
Figure 2. Simplified physical model of the natural gas hydrate trial production riser.
Jmse 14 00785 g002
Figure 4. Flowchart for solving the dynamic model of the hydrate trial production riser.
Jmse 14 00785 g004
Figure 5. Validation of the riser cross-flow displacement envelopes under different uniform current velocities, (a) 0.23 m/s, (b) 0.38 m/s, (c) 0.54 m/s, (d) 0.85 m/s.
Jmse 14 00785 g005
Figure 6. Schematic of nonequilibrium multiphase flow in the natural gas hydrate trial production riser.
Jmse 14 00785 g006
Figure 7. Gas holdup in the hydrate trial production riser and sectional tension distribution of the riser under different top tensions: (a) gas holdup; (b) sectional tension distribution.
Jmse 14 00785 g007
Figure 8. In-line and cross-flow displacement time histories at the middle section of the hydrate trial production riser under different top tensions: (a) in-line; (b) cross-flow, T = 4.05 × 10⁵ N; (c) cross-flow, T = 4.25 × 10⁵ N; (d) cross-flow, T = 4.45 × 10⁵ N.
Jmse 14 00785 g008
Figure 9. Amplitude-frequency spectra of vibration at the middle section of the hydrate trial production riser under different top tensions: (a) cross-flow; (b) in-line.
Jmse 14 00785 g009
Figure 10. Motion trajectories at the middle section of the hydrate trial production riser under different top tensions: (a) 4.05 × 10⁵ N; (b) 4.25 × 10⁵ N; (c) 4.5 × 10⁵ N.
Jmse 14 00785 g010
Figure 11. Gas holdup in the riser and sectional tension distribution of the hydrate trial production riser under different slurry densities: (a) gas holdup; (b) sectional tension.
Jmse 14 00785 g011
Figure 12. Time histories of the in-line and cross-flow displacements at the middle section of the hydrate trial production riser under different slurry densities: (a) in-line; (b) cross-flow, ρ = 1.05 g/cm3; (c) cross-flow, ρ = 1.10 g/cm3; (d) cross-flow, ρ = 1.15 g/cm3.
Jmse 14 00785 g012
Figure 13. Vibration amplitude-frequency spectra at the middle section of the hydrate trial production riser under different slurry densities: (a) cross-flow; (b) in-line.
Jmse 14 00785 g013
Figure 14. Motion trajectories of the middle section of the hydrate trial production riser under different slurry densities: (a) ρ = 1.05 g/cm3; (b) ρ = 1.10 g/cm3; (c) ρ = 1.15 g/cm3.
Jmse 14 00785 g014
Figure 15. Gas holdup and sectional tension distributions of the hydrate trial production riser under different slurry flow rates: (a) gas holdup, (b) sectional tension distribution.
Jmse 14 00785 g015
Figure 16. Time histories of the in-line and cross-flow displacements at the middle section of the hydrate trial production riser under different slurry flow rates: (a) in-line; (b) cross-flow, flow rate = 8 L/s; (c) cross-flow, flow rate = 10 L/s; (d) cross-flow, flow rate = 12 L/s.
Jmse 14 00785 g016
Figure 17. Vibration amplitude-frequency spectra at the middle section of the hydrate trial production riser under different slurry flow rates: (a) cross-flow; (b) in-line.
Jmse 14 00785 g017
Figure 18. Motion trajectories at the middle section of the hydrate trial production riser under different slurry flow rates: (a) slurry flow rate = 8 L/s; (b) slurry flow rate = 10 L/s; (c) slurry flow rate = 12 L/s.
Jmse 14 00785 g018
Figure 19. Gas holdup and sectional tension distributions of the hydrate trial production riser under different outlet backpressures: (a) gas holdup; (b) sectional tension distribution.
Jmse 14 00785 g019
Figure 20. Time histories of the in-line and cross-flow displacements at the middle section of the hydrate trial production riser under different outlet backpressures: (a) in-line; (b) cross-flow, outlet backpressure = 0.1 MPa; (c) cross-flow, outlet backpressure = 0.2 MPa; (d) cross-flow, outlet backpressure = 0.3 MPa.
Jmse 14 00785 g020aJmse 14 00785 g020b
Figure 21. Vibration amplitude-frequency spectra at the middle section of the hydrate trial production riser under different outlet backpressures: (a) cross-flow, (b) in-line.
Jmse 14 00785 g021
Figure 22. Motion trajectories at the middle section of the hydrate trial production riser under different outlet backpressures: (a) outlet backpressure = 0.1 MPa; (b) outlet backpressure = 0.2 MPa; (c) outlet backpressure = 0.3 MPa.
Jmse 14 00785 g022
Table 1. Basic parameters of the hydrate trial production riser during trial production.
Basic ParametersValueUnits
Riser length L1315m
Outer diameter of the riser D0168.27mm
Inner diameter of the riser Di146.27mm
Top tension T4.05 × 105N
Density of the riser material ρv7850Kg/m3
Seawater density ρw1.025g/cm3
Elastic modulus of the riser E210GPa
Density of the jetting slurry ρi1.1g/cm3
Surface current velocity Ub0.5m/s
Outlet backpressure of the riser P0.2MPa
Flow rate of the slurry inside the riser Q8L/s
Disclaimer/Publisher’s Note: The statements, opinions and data contained in all publications are solely those of the individual author(s) and contributor(s) and not of MDPI and/or the editor(s). MDPI and/or the editor(s) disclaim responsibility for any injury to people or property resulting from any ideas, methods, instructions or products referred to in the content.