Article

Investigation into Fishtailing Effect of Oil Tankers Moored at Pile-Founded Column Single-Point Mooring (SPM) Systems

1
School of Naval Architecture, Dalian University of Technology, Dalian 116024, China
2
Offshore Oil Engineering Co., Ltd., Tianjin 222000, China
*
Author to whom correspondence should be addressed.
J. Mar. Sci. Eng. 2026, 14(9), 770; https://doi.org/10.3390/jmse14090770
Submission received: 12 March 2026 / Revised: 17 April 2026 / Accepted: 18 April 2026 / Published: 22 April 2026
(This article belongs to the Special Issue Floating Offshore Structures: Hydrodynamic Analysis and Design)

Abstract

Targeting the “Fishtailing Effect” associated with shallow-water, pile-founded column single point mooring (SPM) systems, this study investigates the vessel’s motion characteristics under multiple operational scenarios using a numerical calculation method validated by model tests. A refined classification of combined wind, wave, and current conditions was conducted. The study examines the vessel’s sway and mooring line tension response under both collinear and non-collinear combinations of these environmental forces. Furthermore, methods for suppressing vessel motion were explored. The results indicate that vessel motion leading to the “Fishtailing Effect” is more prone to occur under collinear wind, wave, and current conditions. Wave and wind energy can, to some extent, mitigate the vessel motion. When the current speed exceeds a certain critical threshold, the extreme values of the mooring forces on the swaying vessel undergo an abrupt change. Applying a stern tug force and reducing the mooring line length are both effective in decreasing the vessel motion range and the tension in the mooring lines. The findings shed light on the fishtailing-effect characteristics of tankers moored at pile-founded column SPM systems, providing a valuable reference for the safety and stability design of such mooring systems.

1. Introduction

As global offshore oil and gas development extends toward nearshore waters, shallow-water oilfield exploitation has gradually become a key priority in the energy strategies of many countries. As a critical facility for offshore oil and gas handling and transportation, the Single-Point Mooring (SPM) system enables moored vessels to rotate freely through 360° via its unique “weathervaning” effect, keeping the vessels oriented toward the direction with the minimum combined environmental loads from wind, waves and currents [1]. Thanks to its strong adaptability to complex marine environments, the SPM system has been widely used in offshore oil/gas terminals, floating production systems and offshore offloading operations, and has become an indispensable core facility in marine engineering [2].
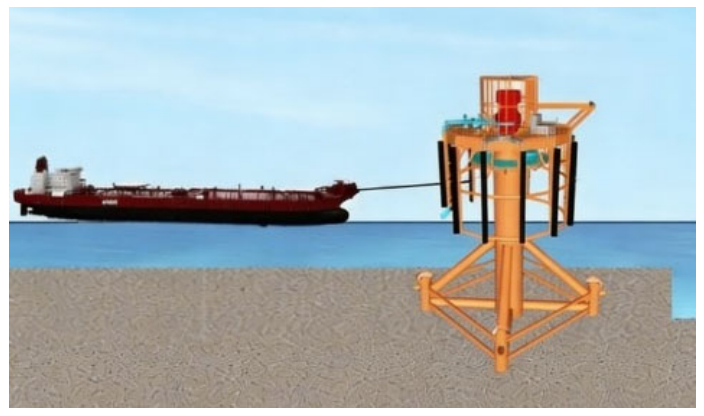
To address this, CNOOC innovatively proposed a Pile-founded Column Offloading Single-Point Mooring system (Figure 1) for developing oil and gas resources in the shallow waters of the South China Sea. The upper part of this SPM features an independent column turntable structure, while the subsea section consists of a 20 m × 20 m four-skirt-pile foundation. These two sections are connected via a main bearing. A 610 mm diameter fluid swivel connects to the crude oil pipeline, enabling continuous crude oil offloading from the tanker as it weathervanes around the SPM [3].
The fishtailing effect is one of the key dynamic characteristics of single-point mooring systems. Under this mooring configuration, tankers subjected to environmental loads are prone to experience large-amplitude oscillations dominated by sway and yaw motions—a phenomenon known as the fishtailing effect. This effect can induce significantly increased dynamic loads on the mooring system, posing a serious safety threat to the SPM. Consequently, it has become a critical issue requiring urgent resolution in both engineering design and safety operations.
Lee and Choi [4] estimated the hydrodynamic coefficients using a three-dimensional singularity distribution method based on potential theory and described the mooring lines and hawsers using elastic catenary equations. By linearizing the equations of motion, they analyzed the influence of parameters such as mooring system position and mooring stiffness on system stability, revealing the mechanism behind the “fishtailing motion” limit cycle phenomenon. A. Fitriadhy et al. [5] employed a Computational Fluid Dynamics (CFD) method, based on the RANS equations and the VOF model, to simulate the course stability of a towing system. The study analyzed the effects of towline length and tow-point position on the sway and yaw motions of a barge. The results indicated that increasing the tow-point position significantly enhanced the course stability of the towed ship, reducing sway and yaw amplitudes by 2.27 and 3.28 times, respectively. However, increasing the towline length had a limited effect on improving stability. Huo et al. [6] investigated the fishtailing oscillation phenomenon of single-point moored vessels in shallow water. Based on stability theory and nonlinear time-domain simulation methods, they systematically studied the dynamic stability of the mooring system under the actions of wind, waves, and currents. Using AQWA 2020 software for analysis, they obtained the extreme value characteristics of vessel motion responses and mooring line tensions, and explored the influences of factors such as wind speed, current velocity, wave frequency, cable dynamic response, and the number of hawsers. Xuan et al. [7] conducted a numerical simulation study addressing the issues of tanker fishtailing motion, buoy contact, and hawser pull-back force in a Catenary Anchor Leg Mooring (CALM) system. The research established a dual-spring hydrodynamic response model for the “anchor chain-buoy” and “hawser-tanker” components, and employed time-domain coupled simulation to analyze the system’s motion response under various environmental conditions. The results indicated that without a pull-back force, the tanker was prone to fishtailing motion. However, applying an 800 kN pull-back force along the ship’s centerline effectively suppressed yaw motion, maintained a safe distance between the tanker and the buoy, prevented buoy contact, and significantly reduced the peak loads on the mooring lines. Gu, M [8] research indicates that large-amplitude oscillations of a tanker in the horizontal plane can cause the mooring lines of a CALM system to experience periodic tension–slackening–retensioning cycles. The study shows that under such conditions, the maximum tension in the mooring lines can increase by more than 50% compared to a stable state, which is considered a primary cause of sudden mooring line failure in CALM systems. Zhou et al. [9] analyzed the causes and environmental sensitivity of the “fishtailing effect” on a CALM tanker using numerical methods, summarizing the influencing factors on the mooring line tension of the system. However, the limited number of overall operational scenarios considered reduces the broad applicability of the findings. Sun et al. [10], addressing the “fishtailing effect” of a certain catenary SPM tanker system, employed a combined approach of experimental analysis and numerical simulation. They identified the phenomenon of potentially extreme tanker response loads under relatively mild sea states and innovatively discussed the influence of fairlead spacing on the “fishtailing effect,” offering significant guidance for practical engineering design. Ge et al. [11] focusing on the “fishtailing effect” in CALM systems, conducted a mutually validating analysis using stability theory and time-domain simulation methods. They concluded that the stability analysis prediction method is quicker and more convenient, and found that the fishtailing oscillation weakens when the relative angles between wind, waves, and currents increase to a certain degree. Huang et al. [12] pioneered the exploration of how different mooring line materials affect the stability of towed systems in ocean wind environments; Ju et al. [7] focused on catenary SPM tankers, analyzing the coupled effect of the fishtailing phenomenon and tug-applied forces; Brotons et al. [13] in predicting the yaw motion of SPM vessels, initially found a discrepancy between numerical simulations of the fishtailing effect and model test results. However, after calibrating the tests by introducing a damping term, the numerical predictions and calibrated data achieved good mutual verification; Paton et al. [14], conducting a nonlinear study on an FPSO system in the Gulf of Mexico at an 800 m water depth under steady marine conditions, not only identified the existence of bifurcation instability within the fishtailing effect but also emphasized its inherently unpredictable nature.
Huang et al. [15] investigated the “fishtailing effect” of SPM vessels under wind and current loads through model experiments and eigenvalue analysis based on static equilibrium, also analyzing the likelihood of the “fishtailing effect” occurring in shallow water. Hollyhead et al. [16], through 1:40-scale model experiments, systematically studied the influence of mooring parameters (such as mooring line length, buoy shape, and size) on the motion of a lifeboat under SPM. The results showed that fishtailing motion is primarily characterized by significant sway and yaw, with a trajectory resembling a double pendulum. Shortening the mooring line length can reduce the sway velocity, and the presence of a buoy (especially larger buoys) can decrease the vessel’s motion amplitude, although buoy shape has an insignificant effect. This study highlighted that buoy size affects the motion response by altering vortex-shedding patterns, providing an experimental basis for optimizing mooring design. Li et al. [17], through field observations and CFD simulations, revealed the critical role of viscous effects in buoy fishtailing motion. Field data indicated periodic swinging of the buoy under constant current velocity. CFD simulations based on the RANS equations and the SST turbulence model identified vortex shedding as the main cause. The study also found that waves had a minor influence on the sway motion, while current velocity was the dominant factor. This outcome emphasized the necessity of considering fluid viscosity in motion prediction, offering theoretical support for data calibration and trajectory forecasting. Pistani et al. [18], through experiments in a bidirectional wave flume, analyzed the motion response of an FPSO under combined swell and wind waves. The experiments found that fishtailing motion intensified when wave directions were non-collinear, and the vessel’s yaw motion coupled with low-frequency drift. The study pointed out that traditional unidirectional wave models might underestimate the motion response, necessitating consideration of multi-directional wave superposition effects in design. Halliwell and Harris [19] conducted a model test study on a fixed tanker in a CALM system. The results showed that the fixed tanker model in a CALM system could also exhibit the fishtailing effects in regular waves. Furthermore, the period of the fishtailing motion was significantly longer than the wave period. The model tests also indicated that the occurrence of fishtailing motion in the tanker model was highly correlated with the combination of wave period and wave amplitude. Zainuddin et al. [20] investigated the instability of the fishtail effect in the FPSO docking system for MRE tensioners. Zhang et al. [21] conducted a model test to investigate the effects of load conditions, wave parameters, cable length and stiffness on the motion responses of a single-point moored shuttle oil tanker. Jiang et al. [22] compared different types of single-point mooring systems and analyzed the differences in the stability of the horizontal movement of oil tankers in these various single-point mooring systems. Osborne et al. [23] conducted research on the response of single-point mooring in a strong current and weak-wave environment. They compared numerical analysis with model tests in terms of mooring loads and the ship’s heading.
Chen et al. [24], focusing on the “fishtailing” motion of SPM systems, employed theoretical analysis, using the Hopf bifurcation algorithm to study tanker motion. This approach demonstrated some operational scenarios difficult to achieve experimentally, significantly advancing research in this field. Fan et al. [25] utilized the Absolute Nodal Coordinate Formulation (ANCF) and a nonlinear viscoelastic model to study the dynamic response of a CALM system with segmented mooring lines (polyester–steel combination). The study also introduced the rainflow-counting method and the Miner–Palmgren rule to assess fatigue life, finding that the cyclic loads induced by fishtailing motion were the primary cause of fatigue damage. This model provides a high-fidelity simulation tool for optimizing deepwater mooring systems. Ma [26], for a floating wind turbine SPM system, developed a quasi-static linearized model based on the GINIE and SIMA platforms to reasonably estimate the fishtailing effect, and systematically evaluated the influence of parameters such as line length and stiffness; the Simos et al. [27], using a combined approach of theoretical analysis and experimental assessment, confirmed the consistency between the theoretical model and the measured fishtailing effect in tests conducted under rigid-hawser conditions. Aghamohammadi et al. [28] conducted a study on the fishtail effect of single-point moored oil tankers in a laboratory water channel. Morandini et al. [29] utilized numerical simulations and model tests to study the external transportation operation of the single-point mooring system, and proposed the relative heading, fish tail effect, cable tension and azimuth angle as the limiting conditions. As demonstrated by Mohapatra et al. [30], mooring stiffness, wave–current incident angle, and current speed are critical factors that affect the motion response of moored floating structures. Increasing mooring stiffness can effectively reduce the displacement of floating structures, and their hydroelastic response is mainly controlled by bending stress. These conclusions provide useful references for analyzing the motion characteristics and optimizing the mooring system of single-point mooring ships.
Currently, research on the fishtailing effect in SPM systems primarily focuses on the level of phenomenological characterization. The existing literature has not yet undertaken a systematic exploration of the fishtailing effect under the complex coupled action of wind, waves, and currents. Therefore, based on actual engineering projects, this paper conducts research on the fishtail effect of single-point mooring from the following aspects: (1) conducting model tests to verify the numerical calculation method, ensuring the correctness of the numerical calculation model; (2) studying the ship’s fishtail effect under the simultaneous action of wind, waves and currents, analyzing the movement of the hull and the response of the cable tension under different wind speeds and current speeds; (3) investigating the response of the hull’s fishtail effect when the wind and current form 15° and 30° angles with the waves; and (4) based on the working conditions where the oil tanker exhibits the fishtail effect, conducting research on the inhibitory effects of two methods, cable length and tail towing, on the ship’s oscillation.

2. Establishment and Verification of Numerical Calculation Models

2.1. Model Test

This experiment was conducted in the comprehensive water tank of the Key Laboratory of Coastal and Engineering at Dalian University of Technology. The effective dimensions of the water tank are 40 m × 40 m× 1 m, with a maximum working water depth of 0.7 m. A pusher-type wave-making machine was installed on one side of the tank, and a wave-dissipating sponge was installed on the other side to minimize wave reflection and ensure more accurate experimental results. The wind load was generated by freely movable fans, and the wind speed and direction under the test conditions were simulated by adjusting the rotation frequency and direction of the fans. For ocean currents, an ocean current simulation system composed of axial flow pumps, return channels, and guide plates was used. Axial flow pumps and outflow ports were arranged on both sides of the tank, and the power of the axial flow pumps and the closure of the guide plates were adjusted to simulate the size and direction of the flow field during the experiment.
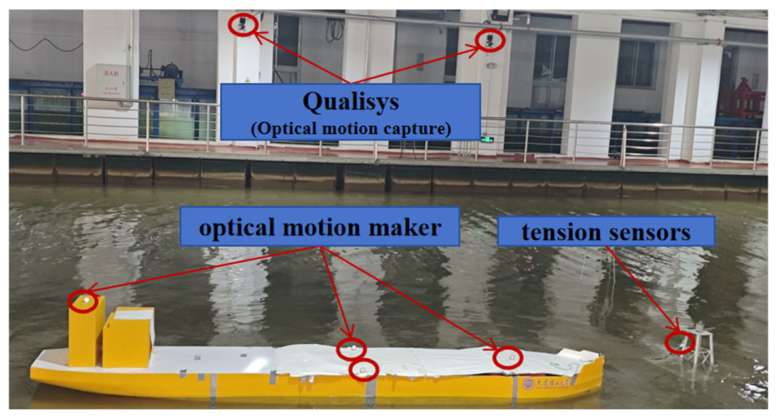
The main measuring instruments used in the experiment included wave–height meters, current meters, wind-speed meters, tension sensors, and motion capture systems.
The mooring force was measured using a tension sensor developed by Yangzhou Kedom, with an accuracy of 0.05%. The current meter used was a Nortek small-wind three-dimensional point current meter. The motion trajectory was captured using the Qualisys three-dimensional motion acquisition and analysis system developed in Germany, with a measurement error of less than 0.3 mm, which can accurately capture the trajectory of high-speed moving objects. The instrument layout is shown in Figure 2.
The ship hull model and the jacket model were fabricated based on the Froude number similarity. The model scale was 1:50. The detailed parameters of the model and the prototype are shown in Table 1.
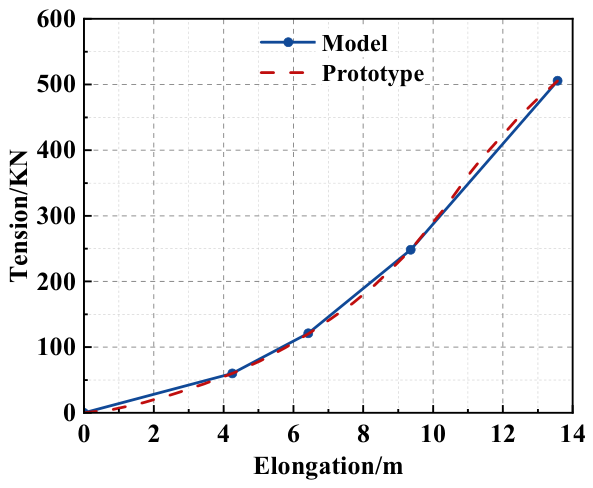
In the experiment, the mooring cables were simulated using springs and inelastic ropes. Springs with different stiffnesses and lengths were used to simulate the mechanical properties of the cables, while the inelastic ropes were employed to ensure the geometric similarity between the prototype and the model. The simulation results for the cables are shown in Figure 3.
This paper presents the detailed parameters of the experimental conditions (prototype) for the numerical calculations, as shown in Table 2.
H S , T P , and γ represent the significant wave height, spectral peak period, and spectral peak factor, Vcurrent and Vwind represent the flow velocity and wind speed, respectively. DC indicates that both the wind and the current are in the 180° direction. Hwater represents the water depth. The irregular waves required for simulation are modeled using the JONSWAP spectrum, as shown in Equations (1) and (2) [31], with the spectral peak factor γ confirm set to 1:
S ( f ) = β H S 2 T P ( 4 ) f ( 5 ) e x p [ 1.25 ( f / f p ) ( 4 ) ] γ e x p [ ( f f p ) 2 / 2 σ 2 f p 2 ]
β = 5 16 ( 1.15 + 0.1688 γ 0.925 ( 1.909 + γ ) ) ( 1 ) ( 1.094 0.1915 l n γ )
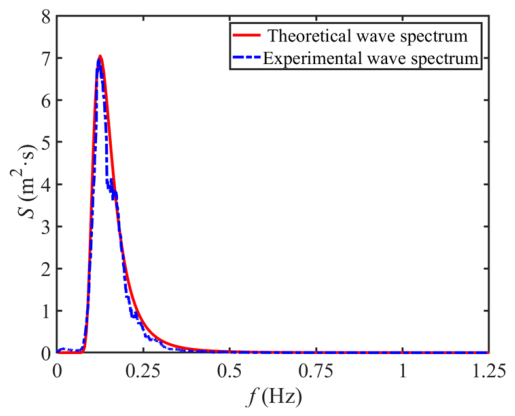
The comparison of theoretical spectra and experimental spectra is shown in Figure 4. As can be seen from the figure, the two sets of spectra fit well.
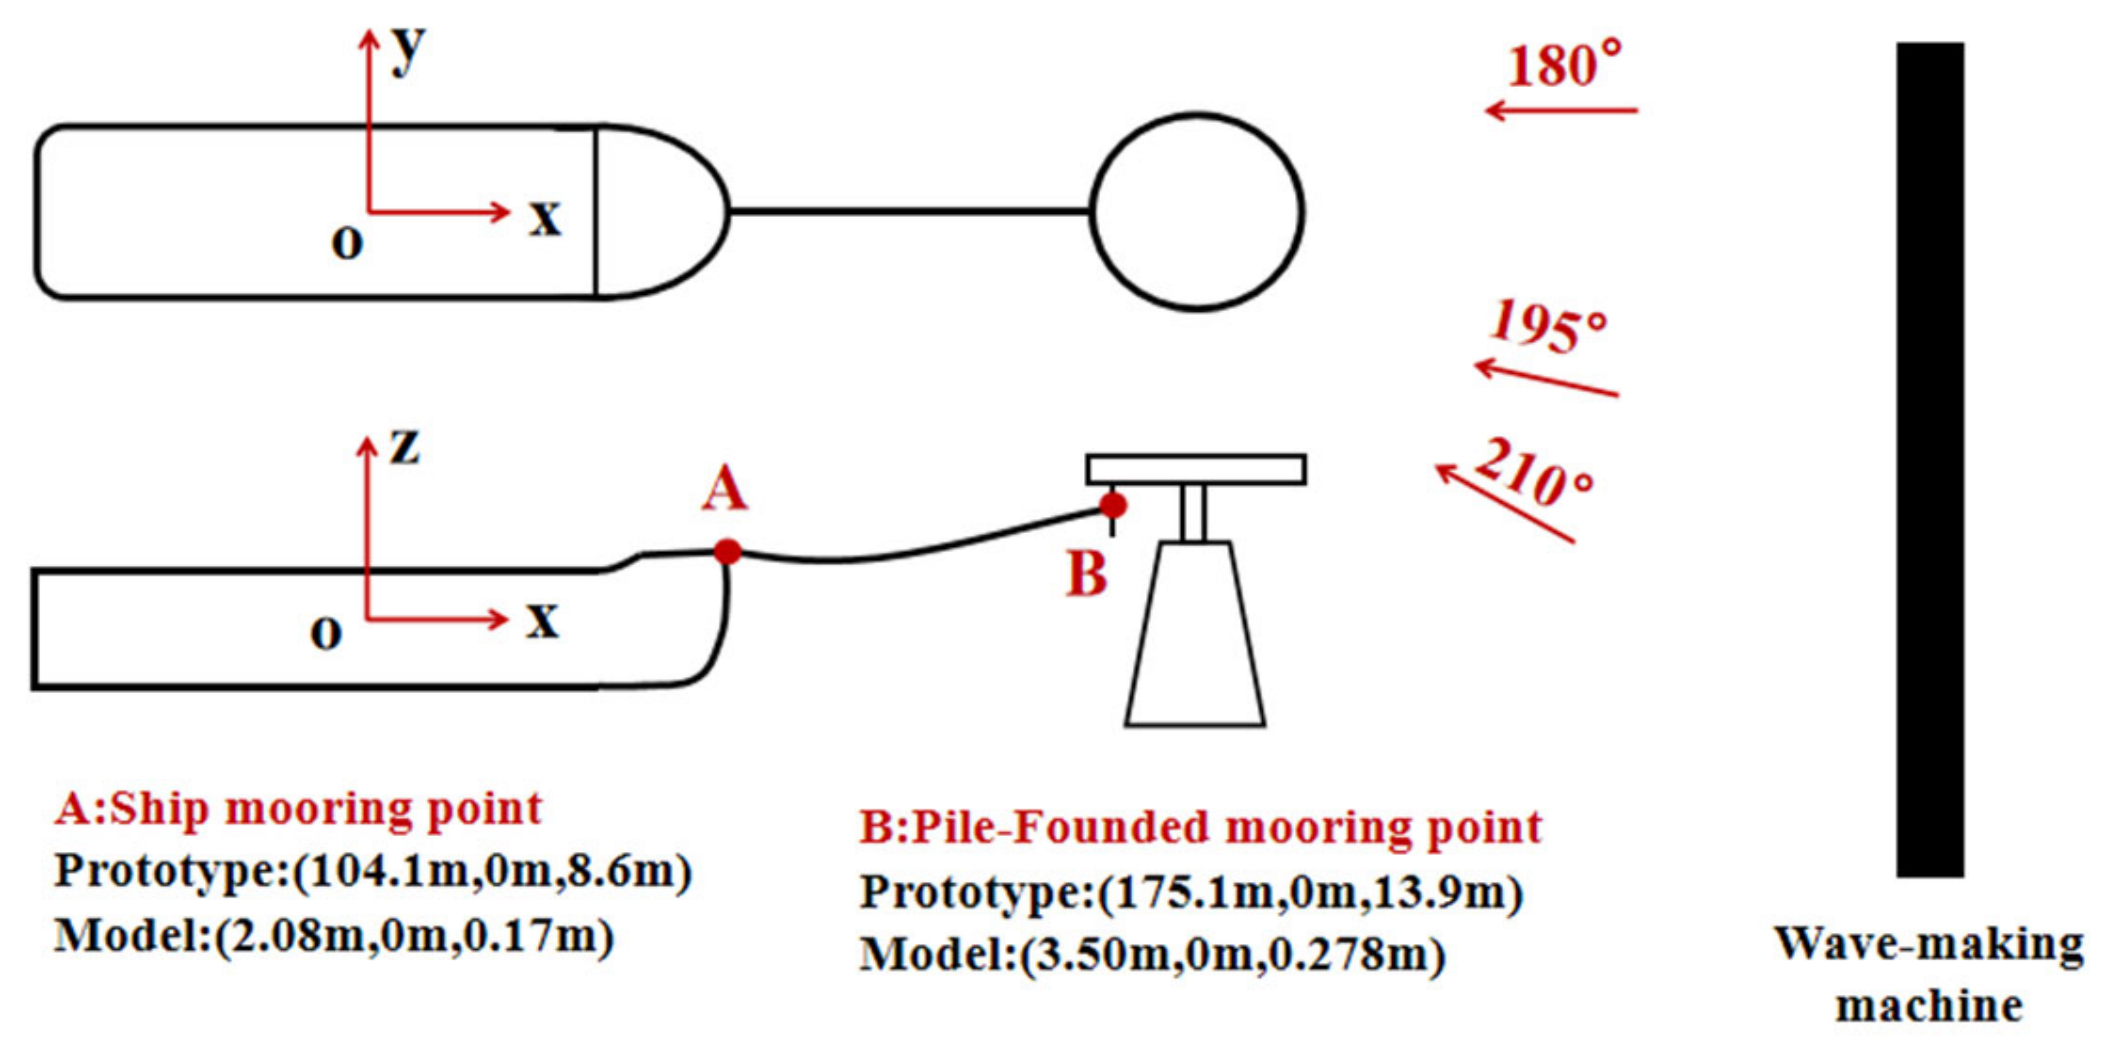
Taking the center of gravity of the ship as the origin, the coordinates of the mooring points on the ship and the mooring points of the pile-foundation pipe structure under the original scale are shown in Figure 5. After the model is arranged according to the positions in the figure, the flow generation system is activated to monitor the flow velocity information in real time. When the flow velocity stabilizes, the wind generation system is activated and maintained for a period of time. The wave generator is started to generate the irregular waves required by the model. One minute after the irregular waves reach the model, the measurement of various data begins. The sampling frequency of the ship’s movement and the tension in the cables is 100 Hz, and the data collection lasts for 26 min, corresponding to approximately 3 h for the prototype. Each test is repeated three times.

2.2. Numerical Calculation Model

In this paper, the water dynamic potential flow software AQWA is used to conduct numerical calculations on the motion of the prototype hull and the forces on the mooring lines. Within the potential flow framework, the fluid motion in the computational domain is described by a time-dependent velocity potential Φ(x,y,z,t) [32]. For an incompressible and irrotational flow, the governing equation reduces to the Laplace equation in the fluid domain:
2 Φ = 2 Φ 2 x 2 + 2 Φ 2 y 2 + 2 Φ 2 z 2 = 0
The velocity potential satisfies the boundary conditions on the body surface, the seabed, and the free surface [33]. Following the classical formulation, the total potential is decomposed into incident, diffraction, and radiation components [34]. Based on the solved potentials, hydrodynamic coefficients such as added mass, radiation damping, and wave excitation coefficients are obtained, along with the response amplitude operators (RAOs).
For six degrees of freedom, proceeding as in [35], the equation of motion of the free-floating structure is defined in the frequency domain and for unitary wave amplitude as:
M + A ( ω ) X ¨ + B ( ω ) X ˙ + K X = F W ( ω )
where M is a matrix of masses for the floating structure, and its diagonal is composed of 6 × 6 matrices of masses. The matrix K is the hydrostatic stiffness matrix, and it is determined similarly to the mass matrix, for a floating structure and 6 DOF. A ( ω ) and B ( ω ) are the added mass and radiation damping matrices respectively that are composed of k × k matrices of 6 × 6 size of added masses and radiation damping. The vector K denotes the displacement, from which it follows that X ˙ and X ¨ are its first- and second-time derivatives, respectively. Lastly, F W ( ω ) is the vector of wave excitation forces for the floating structure (details can be referred to in [36]). Once AQWA, in the frequency domain, acquires the hydrodynamic coefficients (wave excitation force, added mass, and radiation damping) to solve the previously presented equations, the system can also be simulated in the time domain by assuming linear wave theory. The system of differential equations applied in the time domain can be summarized in an equation [37]:
( M + A ) x ¨ ( t ) + ( K + K E ) x ( t ) = f W ( t ) + f E ( t ) + f C ( t )
where the structural mass matrix is represented by M and the fluid added mass matrix at infinite frequency is represented by A . The equation includes the additional stiffness matrix, K E , due to the connections between the bodies. Displacement as a function of time is denoted by x ( t ) , and similarly, in the frequency domain, its first- and second-time derivatives are represented by one and two dots above the variable. The forces acting are the wave excitation force, f W ( t ) , external forces such as those provided by the mooring, f E ( t ) , and the so-called convolution forces, f C ( t ) (see [38] for more details).
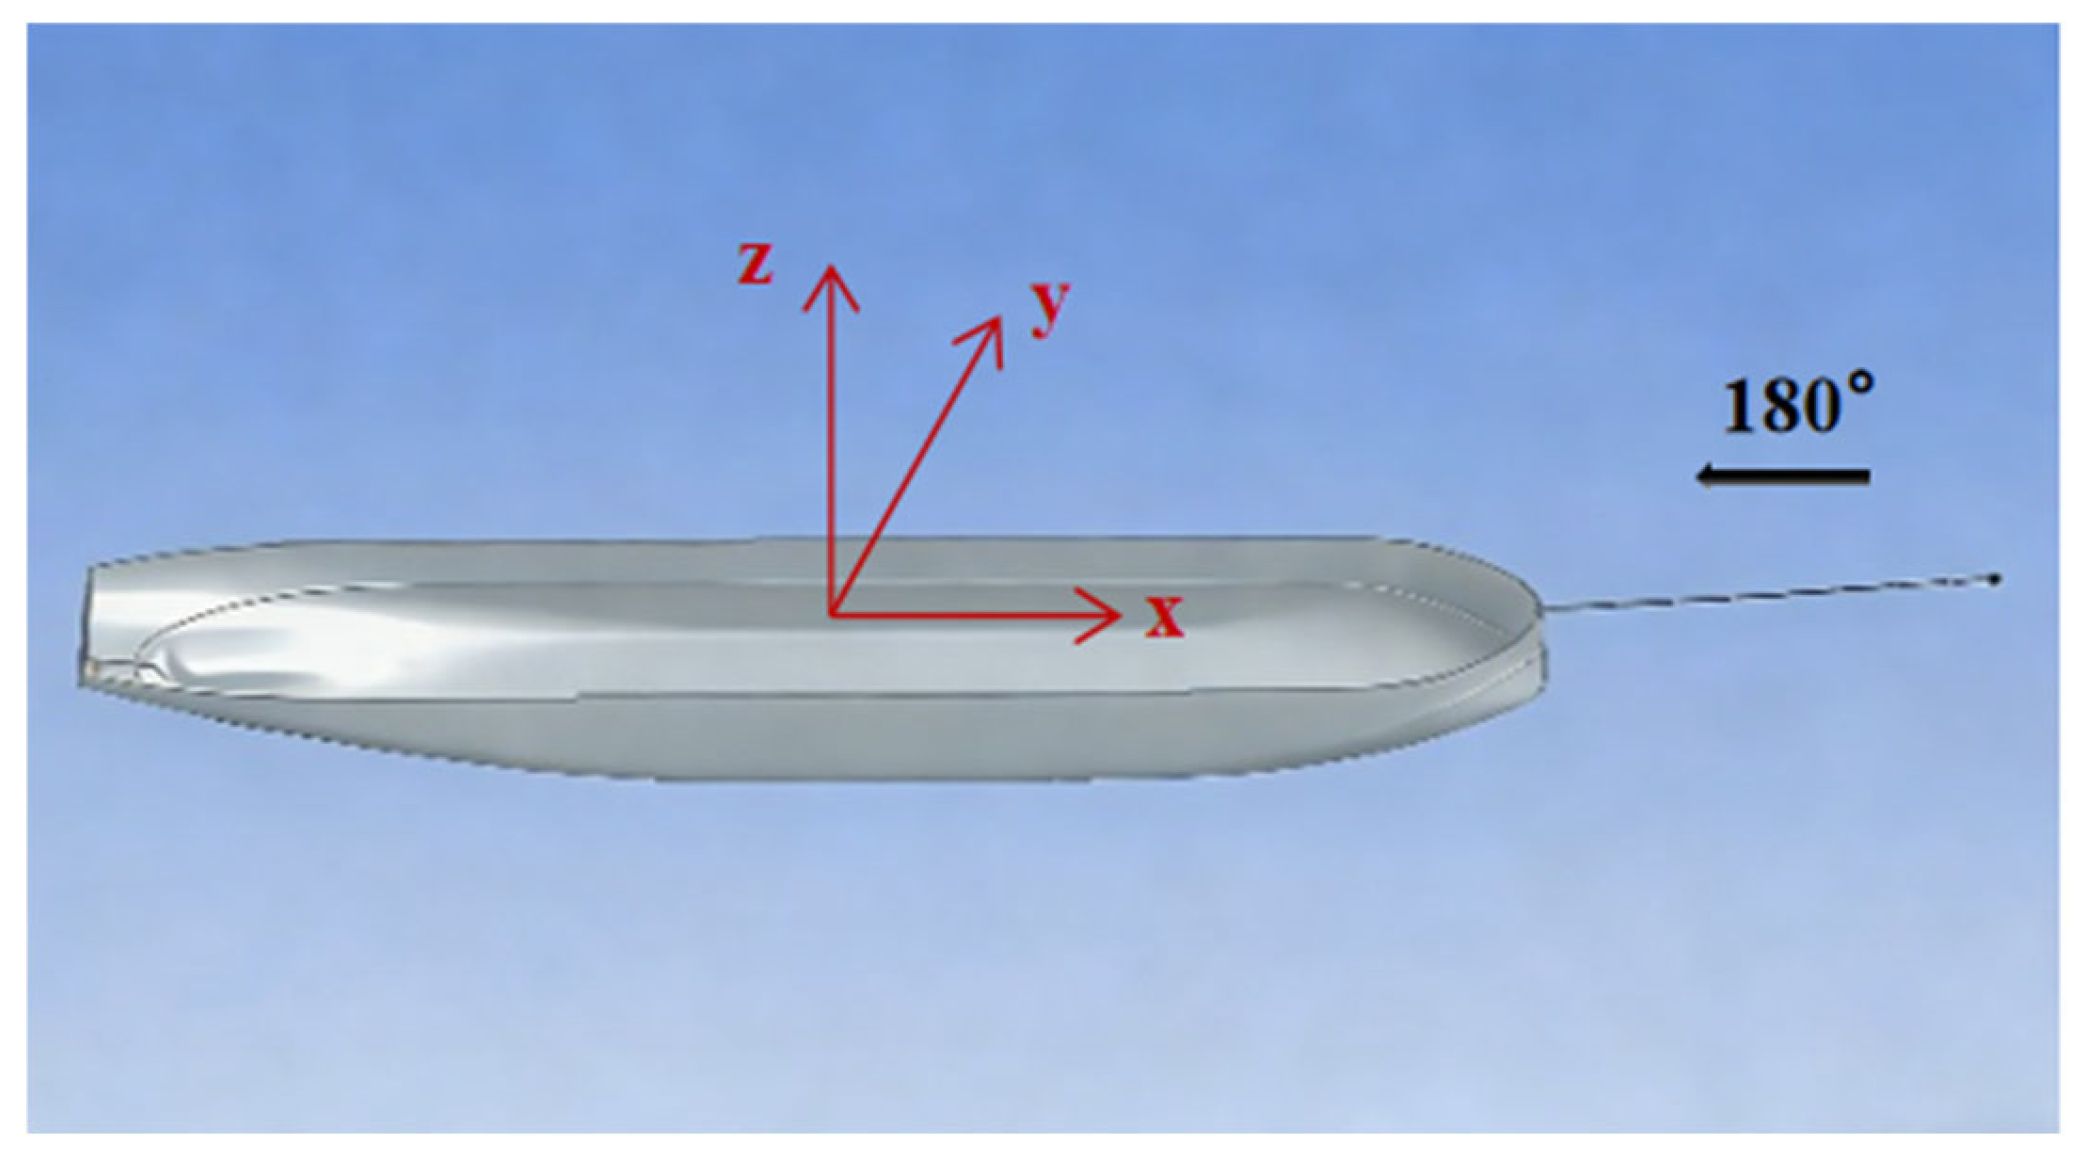
The calculation model is shown in Figure 6.
The relevant environmental parameters can be found in Table 2, the dimensions of the ship model can be found in Table 1, and the positions of the mooring points are based on the coordinates of the original mooring points shown in Figure 5. The relevant parameters of the numerical calculation model are presented in Table 3.
The reference diagram for the cable rigidity is shown in Figure 3, and the relevant material information is presented in Table 4.
Since the numerical values were calculated using potential flow software, the effect of fluid viscosity was ignored. In this paper, a static water free attenuation test was conducted in combination. After adding correction damping to the numerical model, the free attenuation calculation under the same conditions as the test was carried out. By comparing the attenuation curves, the damping correction value applied to the ship model was determined. The damping correction values for the model are shown in Table 5:

2.3. Comparison and Verification of Numerical Models with Model Tests

The test results under the combined action of 180° co-directional wind, waves and currents were transformed into corresponding values at the prototype scale using the Froude number similarity and were compared with the calculation results of the numerical model. The corresponding environmental parameters are shown in Table 2.
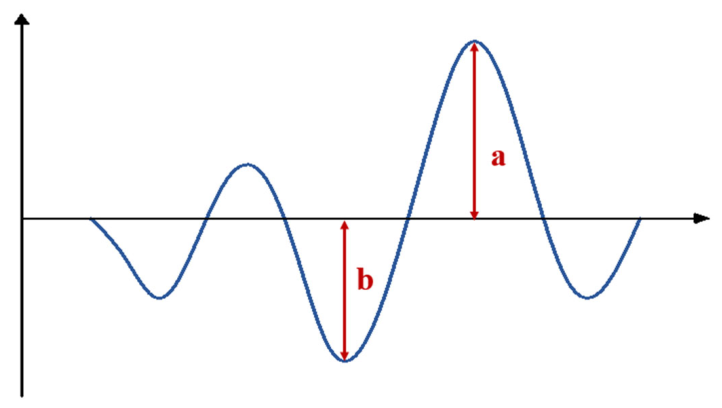
In the comparison and analysis of the test and numerical results, the zero-crossing method was used to conduct time-domain analysis of the ship to obtain statistical information on the ship’s motion response, as shown in Figure 7. The zero-to-peak standard was used to statistically determine the maximum value in the entire time-domain results, with significant peaks, significant troughs and standard deviations as comparisons. “a” represents the peak value of the wave, and “b” represents the trough value of the wave. The maximum value is defined as the maximum value of a in the entire calculation time sequence (maximum), the minimum value is the minimum value in b (minimum),the significant peak is the average value of the largest values in the first one-third (sig-peak), and the significant trough is the average value of the b values in the first one-third (sig-trough), the standard deviation (std) was also calculated. Through the comparison of these four motion statistical values, the accuracy of the numerical calculation method was verified. For the mooring lines, as they are only subjected to tension and there is no negative value situation. Therefore, when analyzing the mooring force statistics, only the average value, maximum value, standard deviation and significant peak (sig-peak) value are statistically analyzed.
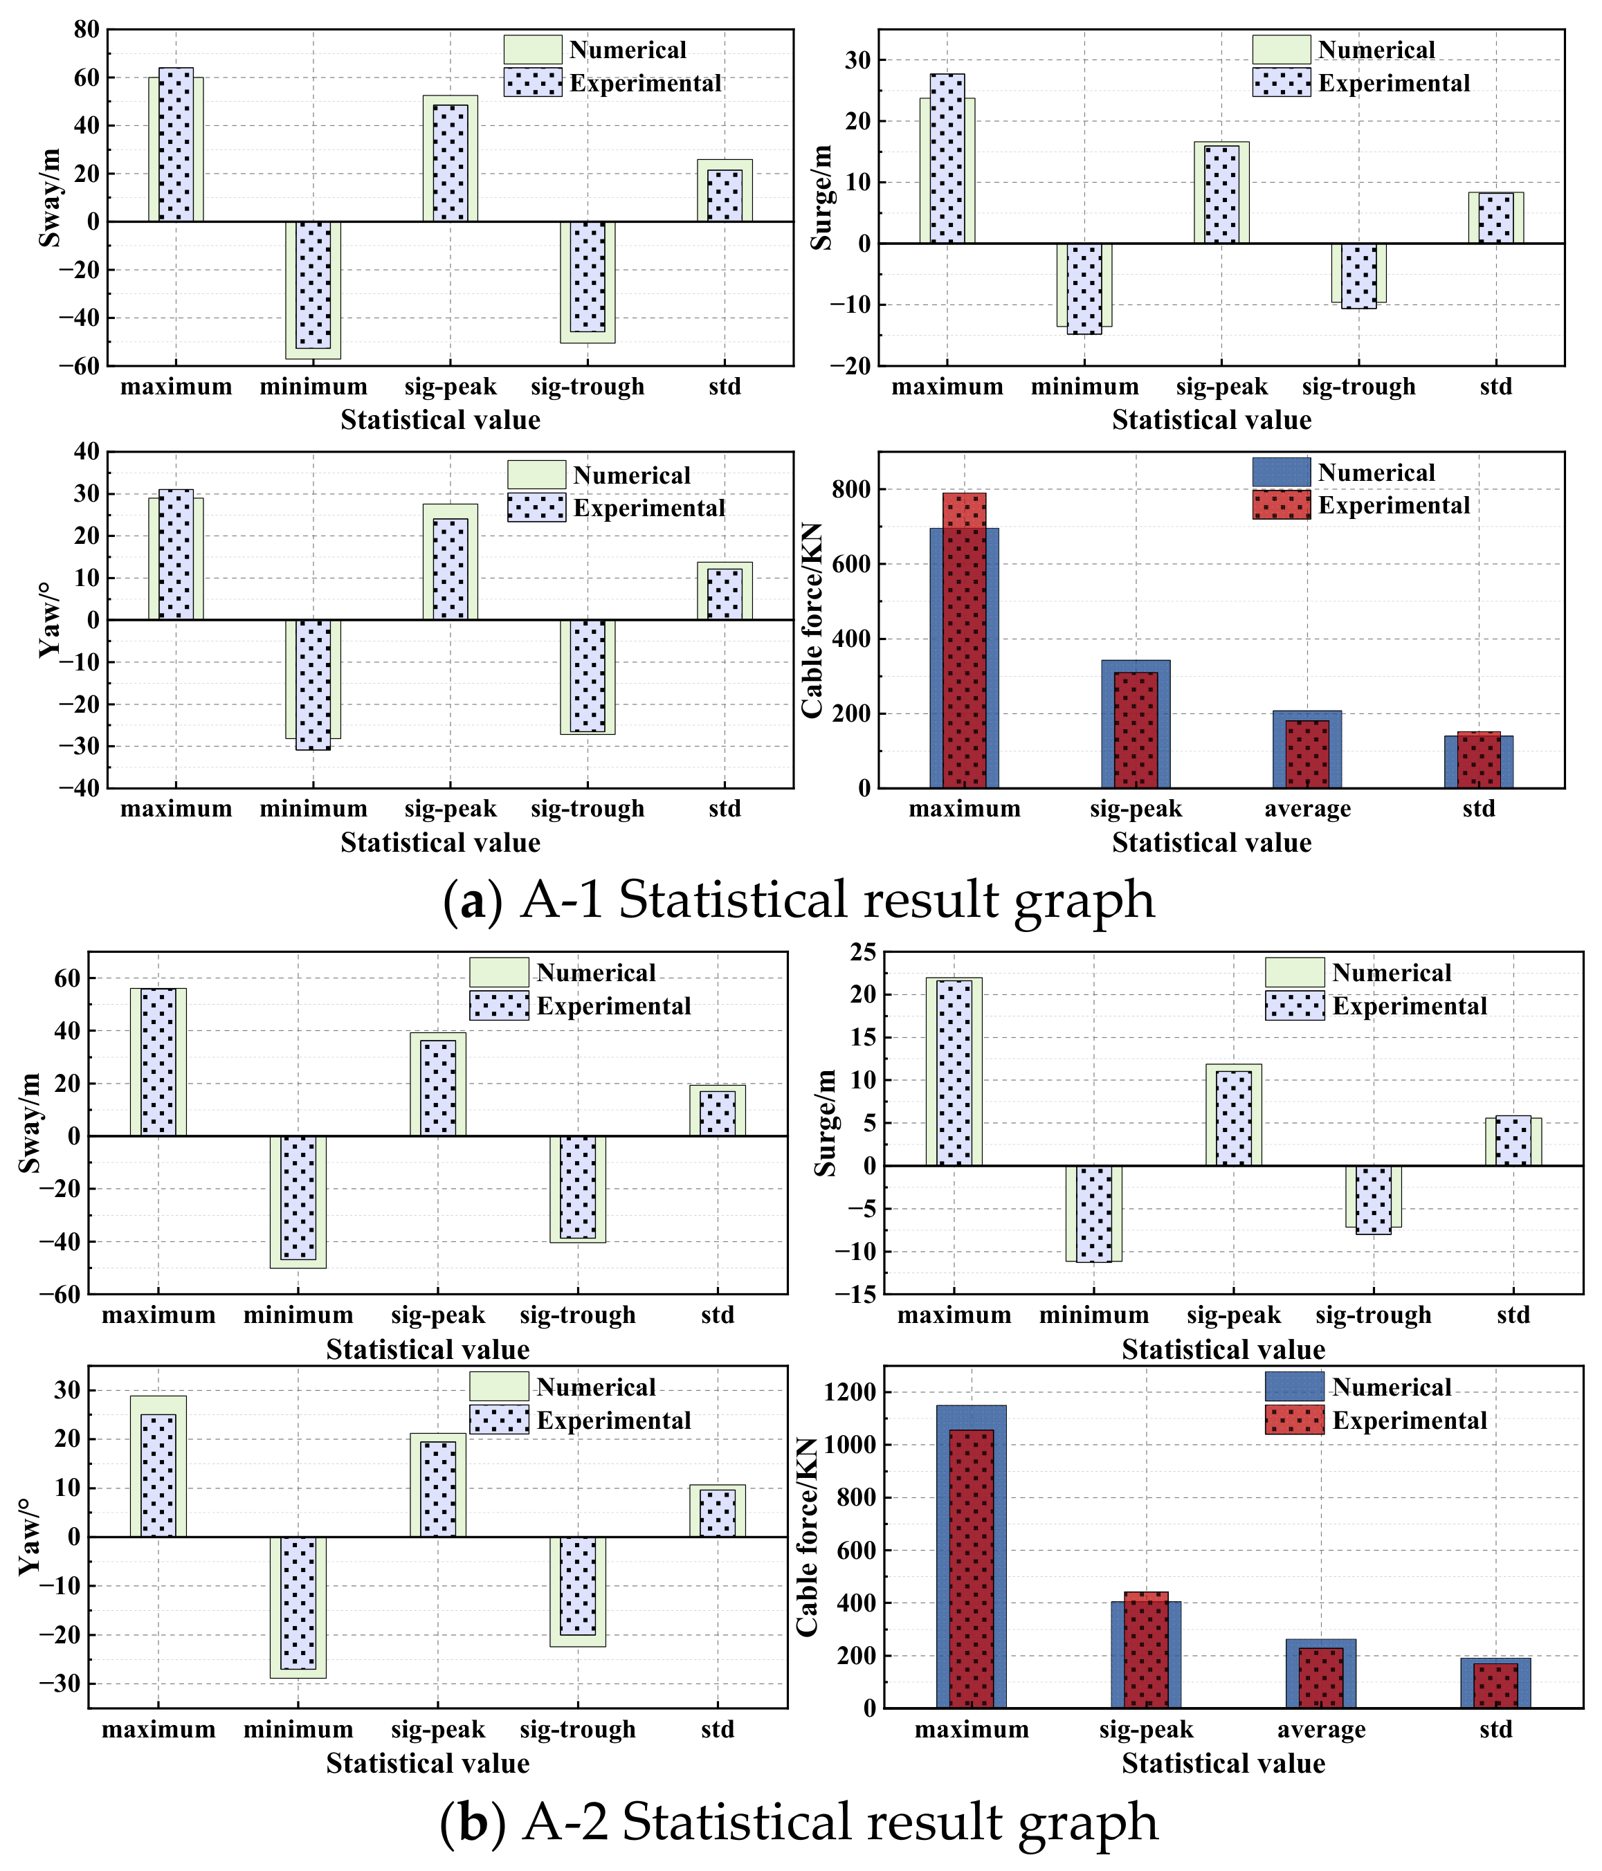
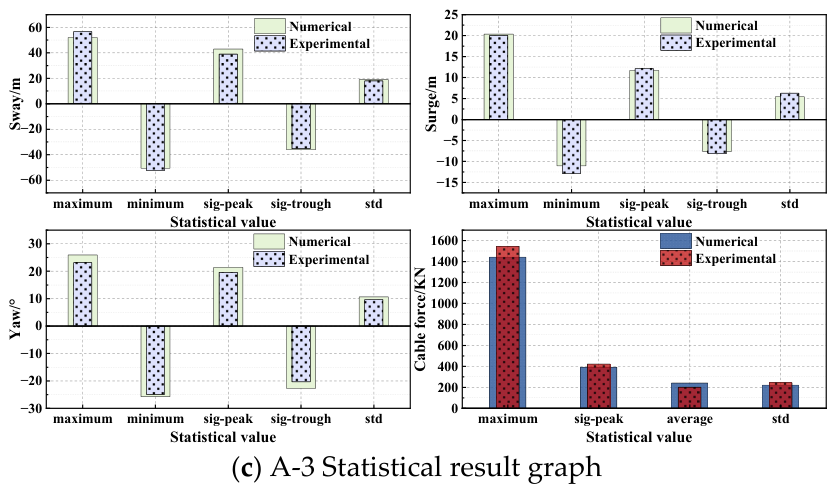
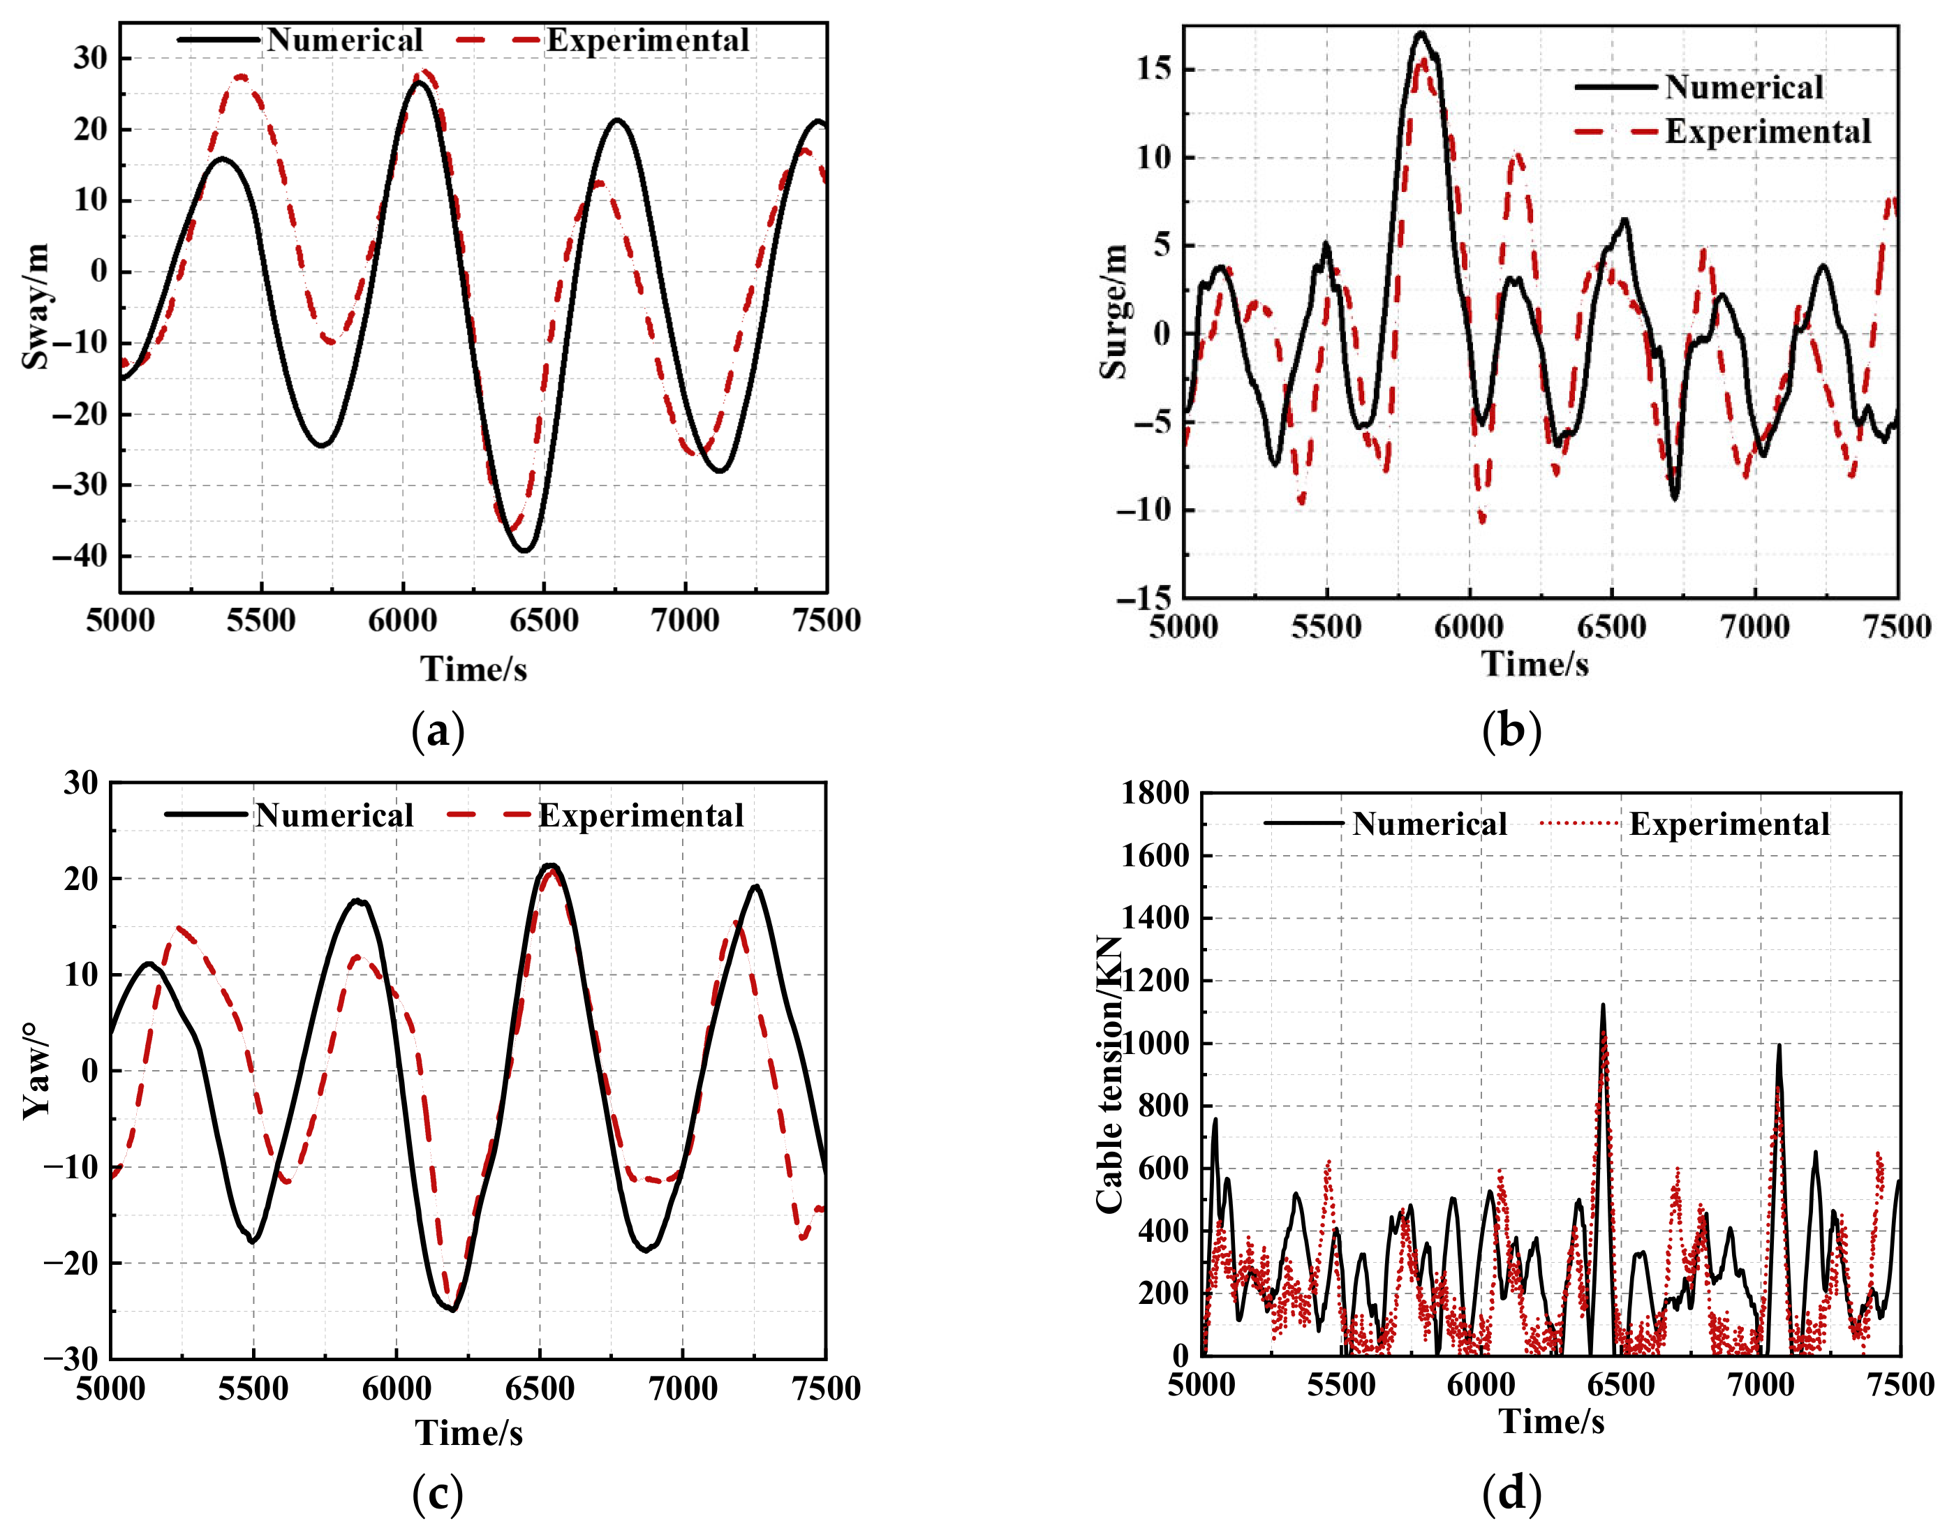
Based on the above marine environmental conditions, the statistical analysis results of the longitudinal sway, lateral sway, bow heave motion of the single-point moored oil tanker under the A-2 operating condition, as well as the forces on the mooring cables, are shown in Figure 8. The comparison results of selected time-history curves are shown in Figure 9:
In the time history curves, whether it is the force on the mooring cables or the motion situation, there are certain differences between the test and the numerical simulation; however, the overall trend is basically similar. Moreover, from the statistical results, it can be seen that the difference between the numerical and test statistical results is small; for all the statistical values related to the amount of exercise, the maximum error does not exceed 14.5%, and for the statistical values of cable forces, the maximum error does not exceed 14.7%.This indicates that the established numerical calculation model is reliable and can be used for further research on the fishtail effect characteristics of the oil tanker’s single-point mooring under multiple operating conditions. At the same time, from the numerical calculation results and the test results, it is evident that under the combined action of wind, waves, and currents, the oil tanker will produce unstable oscillations. At this time, its motion mainly manifests as certain longitudinal sway, as well as more significant lateral sway and bow heave. Therefore, this paper focuses on the motion in the lateral sway and bow heave directions to reveal the fishtail effect characteristics of the oil tanker in the pile-column single-point mooring system.

3. Analysis of Fishtailing Effect Characteristics Under Collinear Combination of Wind, Waves, and Current

This section, based on the experimentally validated numerical calculation method, conducts a statistical analysis of the tanker’s oscillation extremes by selecting multiple operational scenarios involving both collinear and non-collinear alignments of wind, waves, and currents at 180°. The parameters for the investigated scenarios are set as follows: the current velocity ranges from 0.5 to 1.5 m/s with an interval of 0.1 m/s; wind speeds are selected at three levels: 10 m/s, 15 m/s, and 20 m/s; the significant wave height ranges from 0.5 to 3 m with an interval of 0.5 m, and the peak period is 8 s. For the non-collinear scenarios, using the 180° wave direction as the baseline, individual deviation angles of 15° and 30° for the wind and current directions relative to the wave direction are established. For the same target wave spectrum, different random seed values will directly lead to differences in the generated random wave profile curves, thereby affecting the time-domain simulation results of the system loads and FPSO motion response. Therefore, in order to reduce the error impact of pseudo-randomness on the calculation results, this paper sets five different random seeds, conducts time-domain calculations independently for each sequence, and selects the random seeds and the extreme values of the single-point mooring system loads and the motion response of the FPSO in accordance with the BV specifications. The statistical calculation method for the actual response extreme value S is as follows:
S = S M + a S S
S M = 1 n i = 1 n X i
S S = 1 n 1 i = 1 n ( X i S M ) 2
where X i is the extreme values calculated under each random seed; a is selected as 0.6 according to the specification.

3.1. Analysis of Hull Motion Response Under Collinear Wind, Wave, and Current Conditions

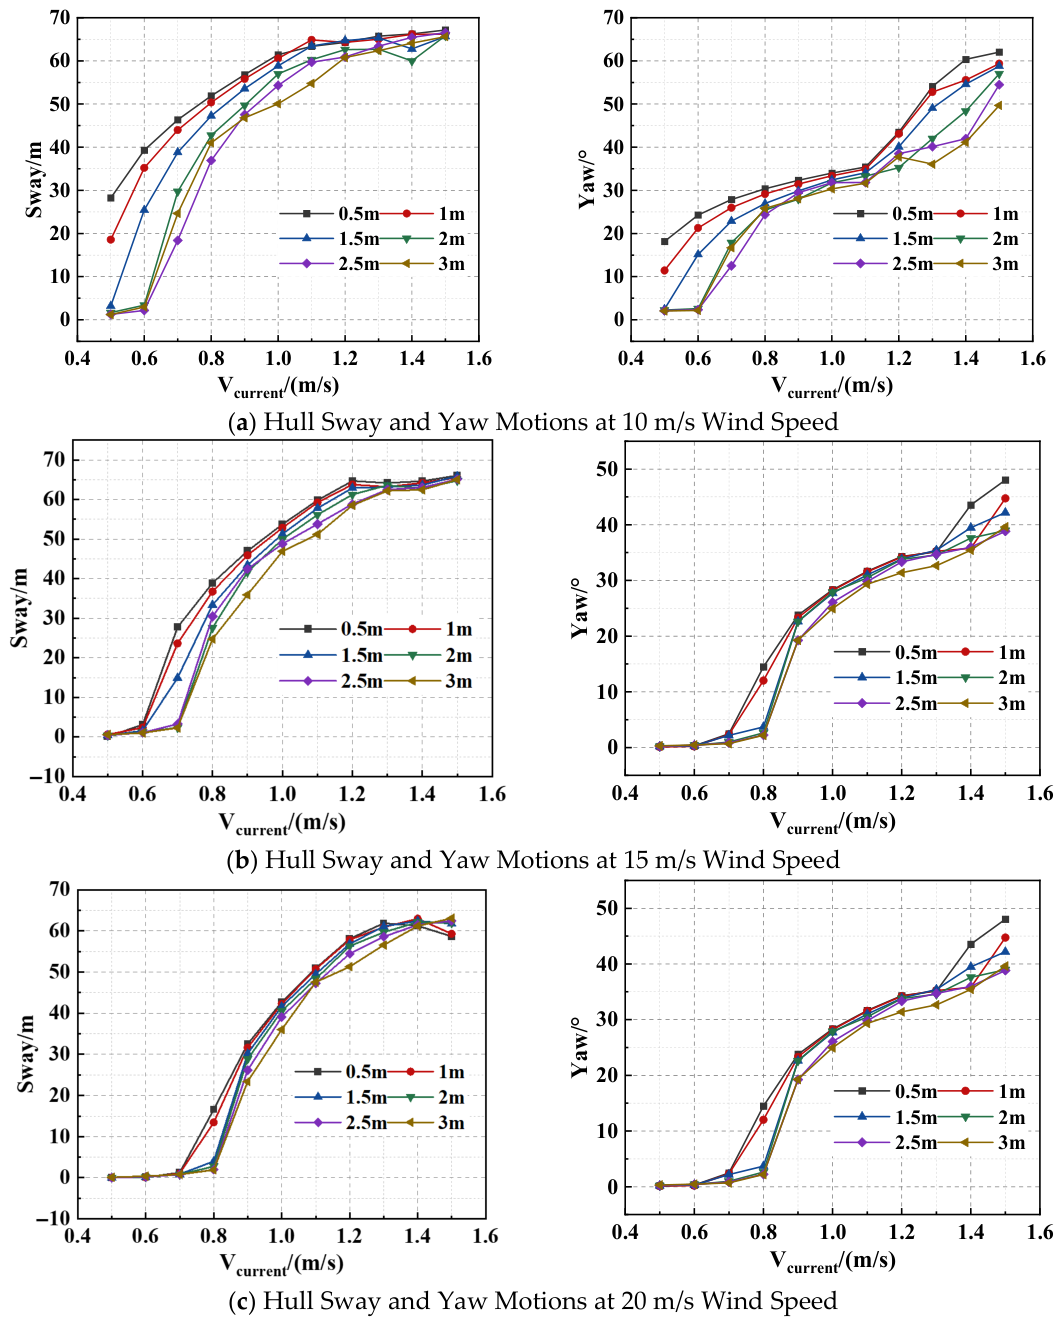
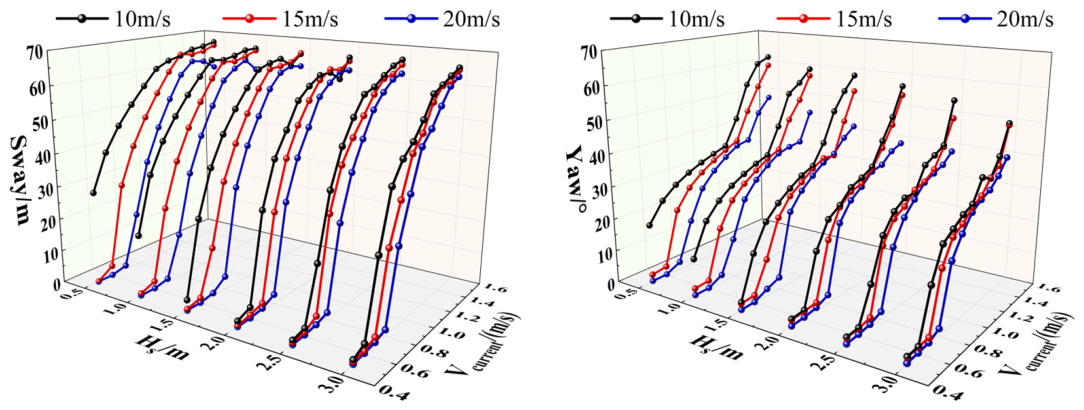
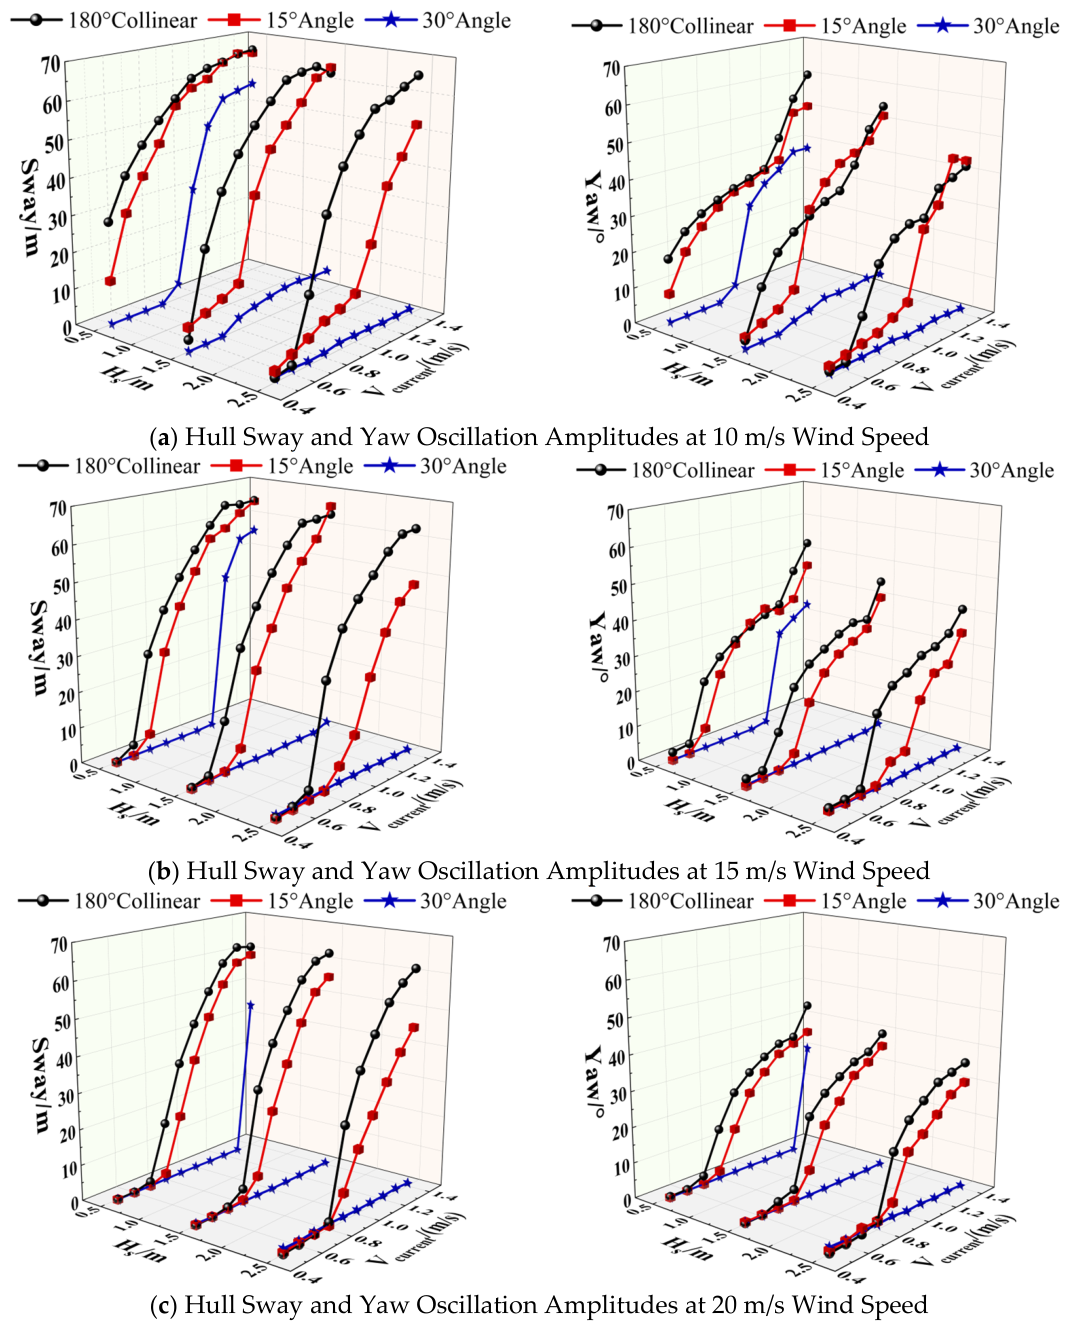
This section investigates the fishtailing phenomenon of the hull under the combined action of collinear wind, waves, and currents at 180°. A total of 198 operational scenarios were analyzed, combining 10 current speeds, 6 significant wave heights, and 3 wind speeds. Figure 10 presents the numerical calculation results for the hull’s sway and yaw motions under these collinear conditions.
The calculation results in Figure 10 show that, regardless of changes in wind speed and wave height, the amplitudes of the hull’s sway and yaw motions increase with rising current speed. This indicates that current speed is the primary influencing factor for the generation of fishtailing motion in the hull under the SPM conditions.
Analysis of the hull motion results under different wave heights reveals that increasing wave height can, to some extent, suppress the hull’s fishtailing motion. Specifically, for sway motion, when the current speed is less than 1.2 m/s, the suppressive effect of wave height is more pronounced under lower wind speed conditions. However, when the current speed exceeds 1.2 m/s, the suppressive effect of wave height on sway motion diminishes significantly. Conversely, the suppressive effect of wave height on yaw motion persists consistently and becomes even more prominent when the current speed surpasses 1.2 m/s. Further analysis combining the results from different wind speeds reveals that as wind speed increases, the trends of hull sway and yaw motions under varying wave height conditions gradually converge.
From Figure 10a, it can be seen that under a wind speed of 10 m/s, the combined action of significant wave heights of 0.5 m and 1.0 m with a current speed of 0.5 m/s both induce sway and yaw motions in the hull. Comparing Figure 10b,c shows that at this current speed, the tanker does not exhibit fishtailing motion as wind speed increases under the corresponding wave heights. Therefore, in practical engineering, when considering potential hull fishtailing, it is necessary to analyze not only the fishtailing motion under extreme sea states but also the potential for fishtailing under conditions of low wave height, low current speed, and low wind speed. This ensures a comprehensive analysis of the fishtailing phenomenon.
The comparative results of hull motions under different wind speeds are shown in Figure 11. For the sway motion, when the current speed is less than 1.2 m/s, an increase in wind speed demonstrates a significant suppressive effect on the hull’s sway motion. Conversely, when the current speed exceeds 1.2 m/s, the sensitivity of the sway motion to changes in wind speed markedly decreases. Regarding the yaw motion, variations in wind speed have a relatively minor influence when the current speed falls within the range of 0.9 to 1.2 m/s, and this influence further diminishes as the wave height increases. In other current speed intervals, however, the yaw motion exhibits strong sensitivity to wind speed changes, with increased wind speed showing a pronounced suppressive effect on the yaw motion.

3.2. Analysis of Mooring Line Tension Response Under Collinear Wind, Wave, and Current Conditions

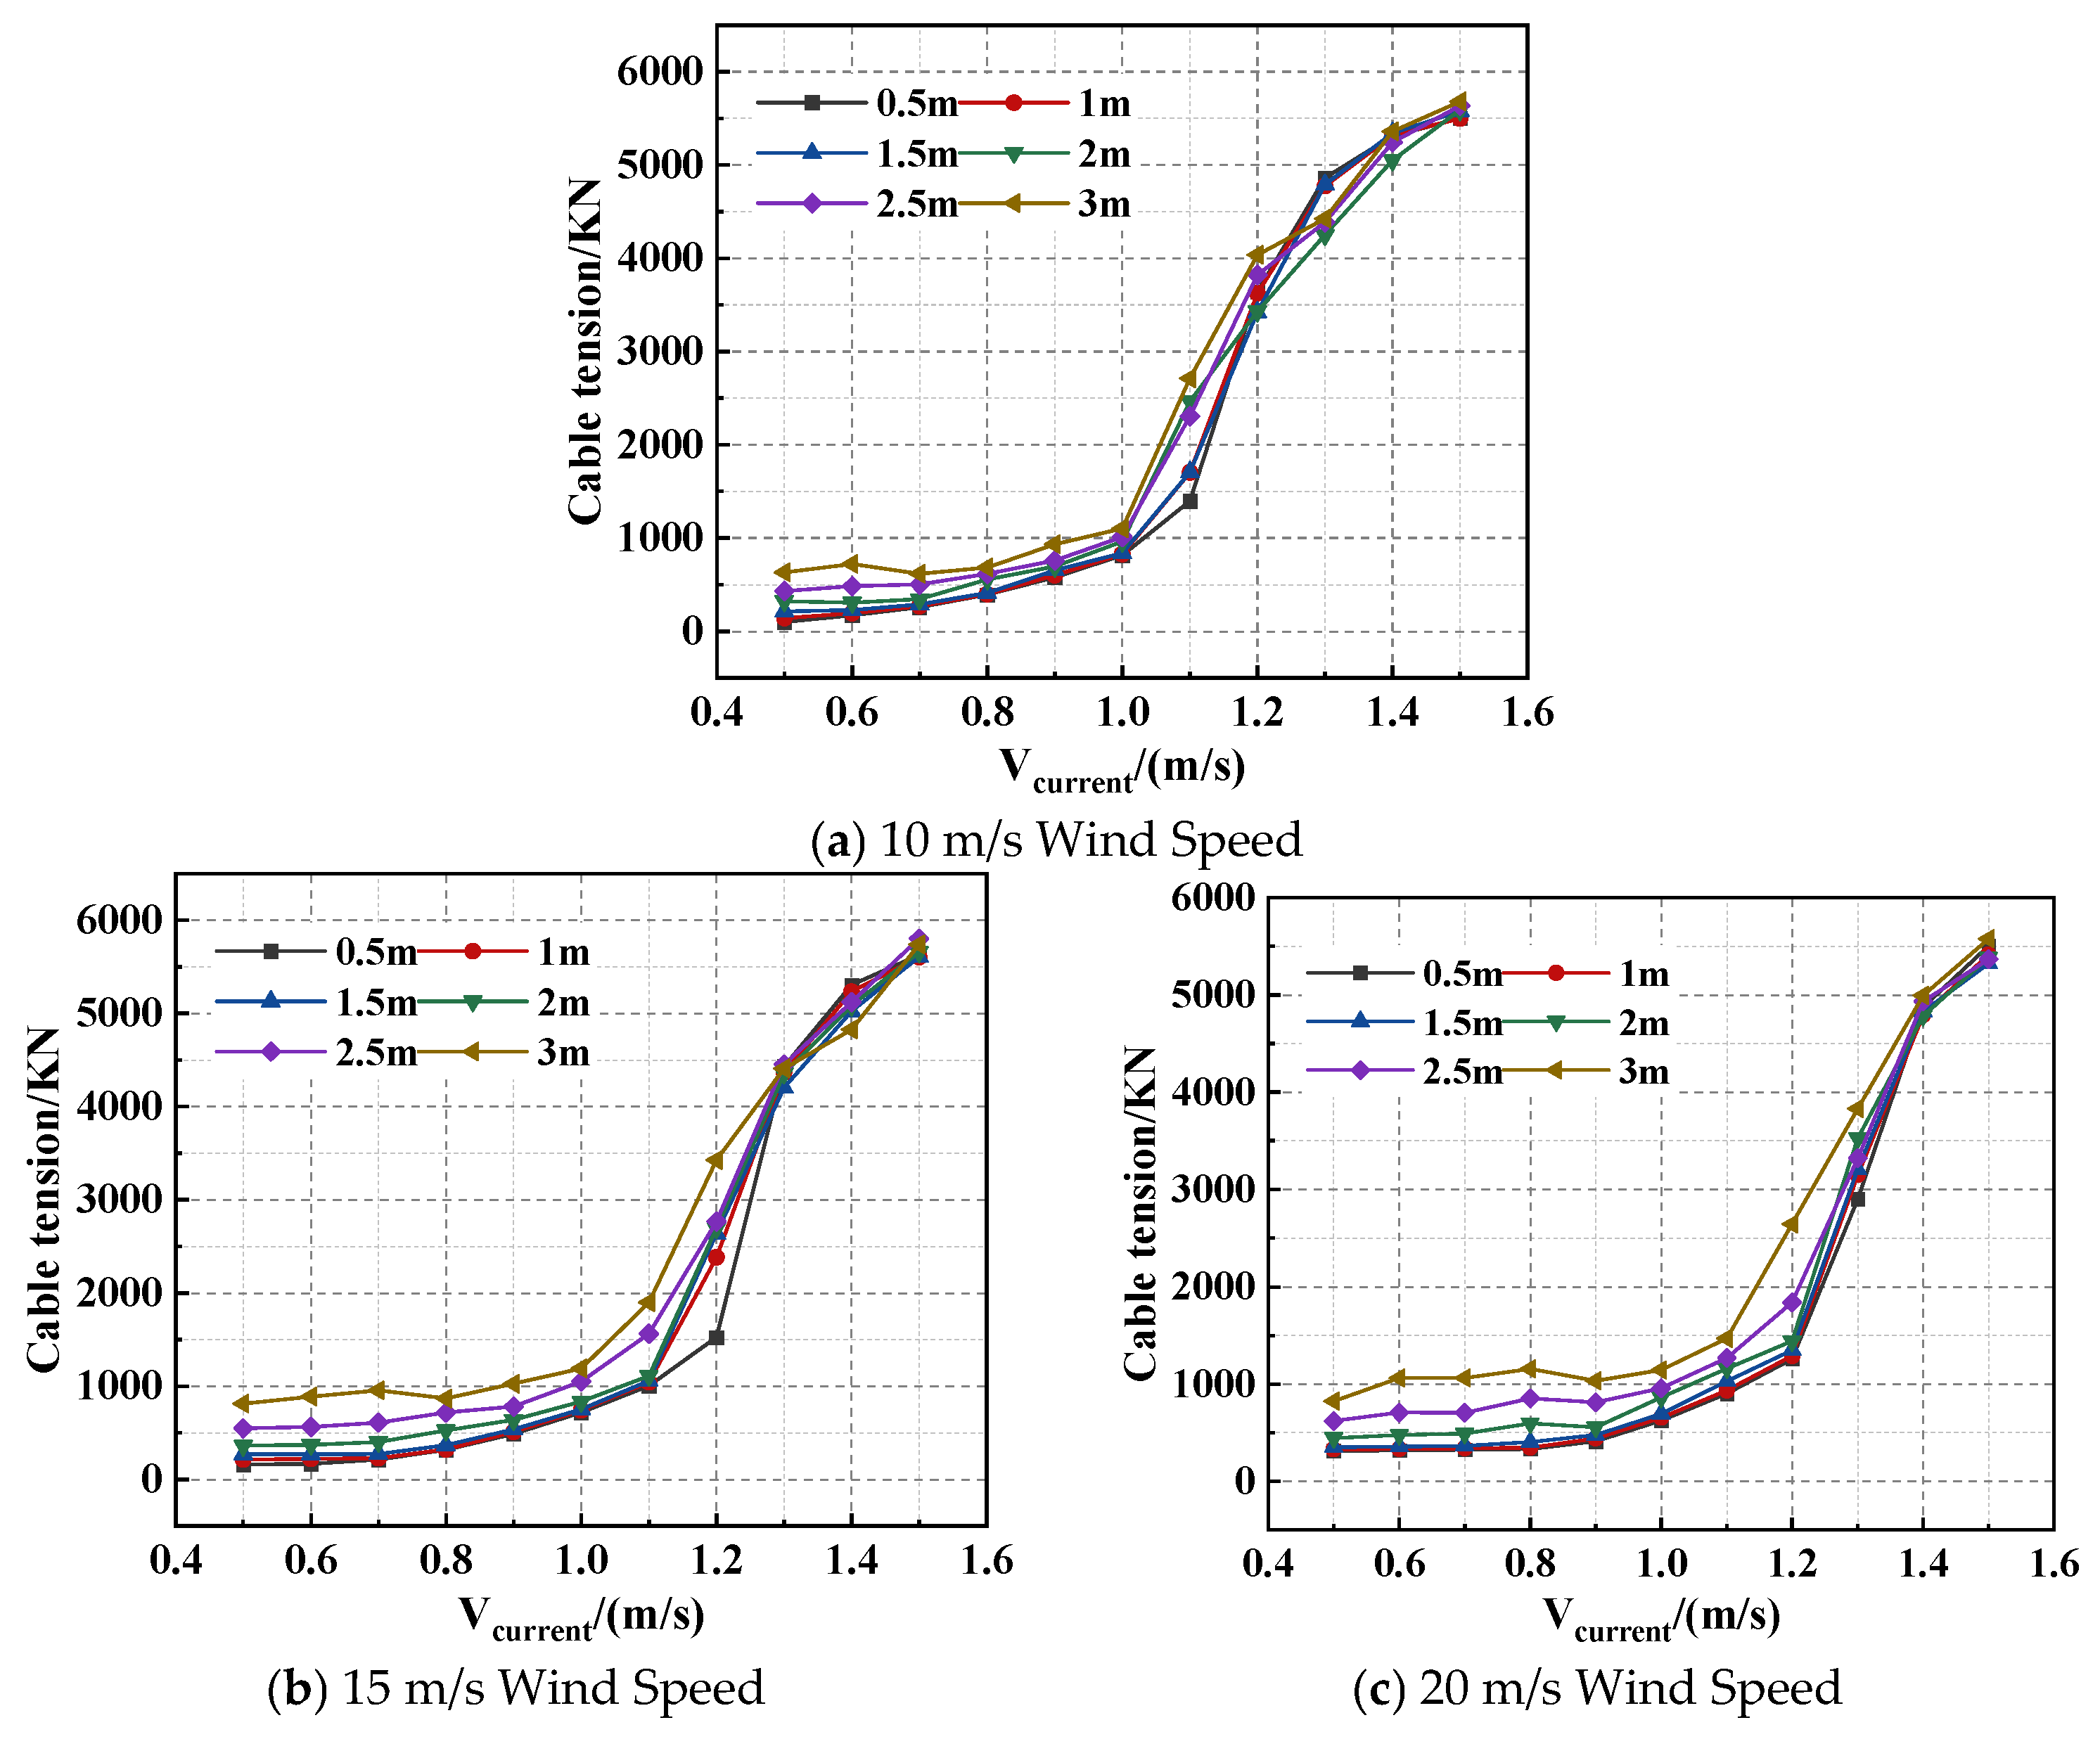
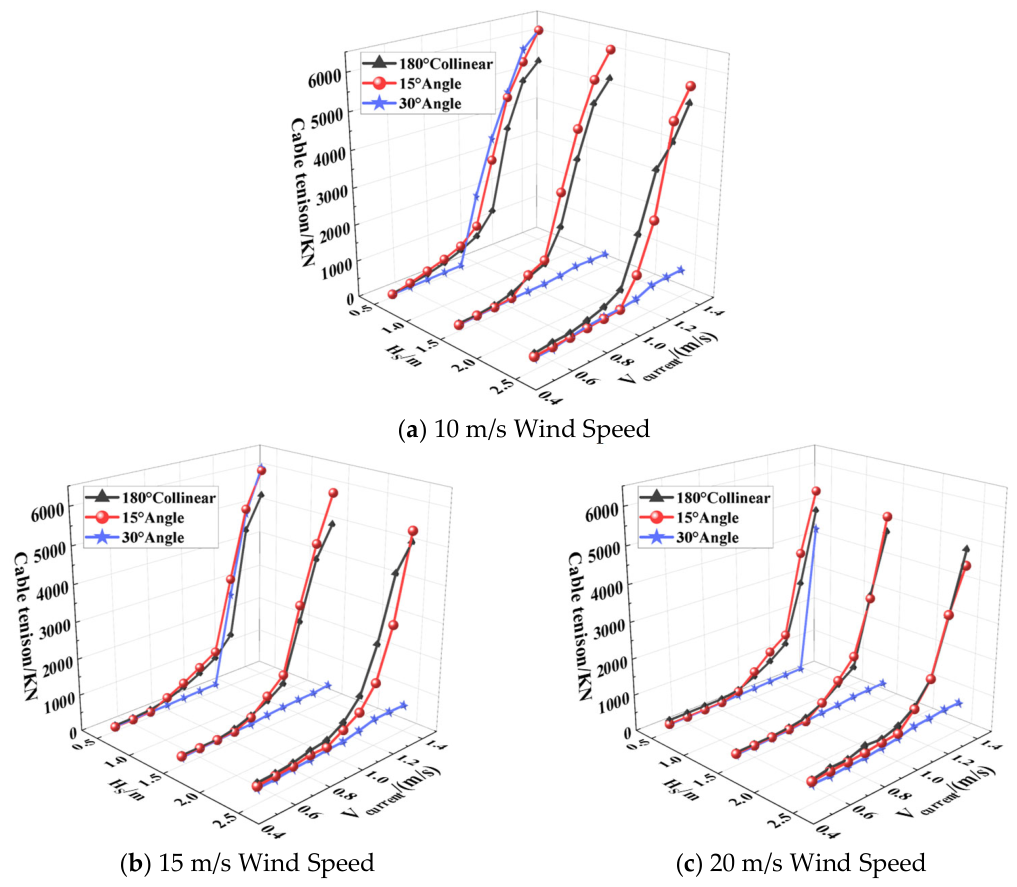
Figure 12 presents the calculated mooring line tensions corresponding to the aforementioned operational scenarios. The results indicate that the mooring line tension exhibits relatively low sensitivity to variations in wind speed and wave height, showing only a slight increasing trend as these two parameters rise. Within the low current speed range, the change in mooring line tension with increasing current speed is relatively gradual. However, when the current speed increases beyond a certain critical threshold, a significant abrupt change in the mooring line tension occurs. By comparing the critical current speeds corresponding to these abrupt changes in tension under the three different wind speeds, it can be concluded that this critical current speed is positively correlated with the wind speed.

4. Analysis of Fishtailing Effect Characteristics Under Non-Collinear Combination of Wind, Waves, and Current

Variations in the directional combinations of wind, waves, and currents significantly influence the hull’s oscillatory characteristics. In actual marine environments, wind, waves, and currents are not perfectly collinear but are often distributed at certain angles relative to each other. Based on this, this study selects operational scenarios with wave–current and wave–wind misalignment angles of 15° and 30°, respectively, to conduct targeted research on the hull’s fishtailing characteristics.

4.1. Analysis of Fishtailing Effect Characteristics Under Non-Collinear Wave-Wind Combination

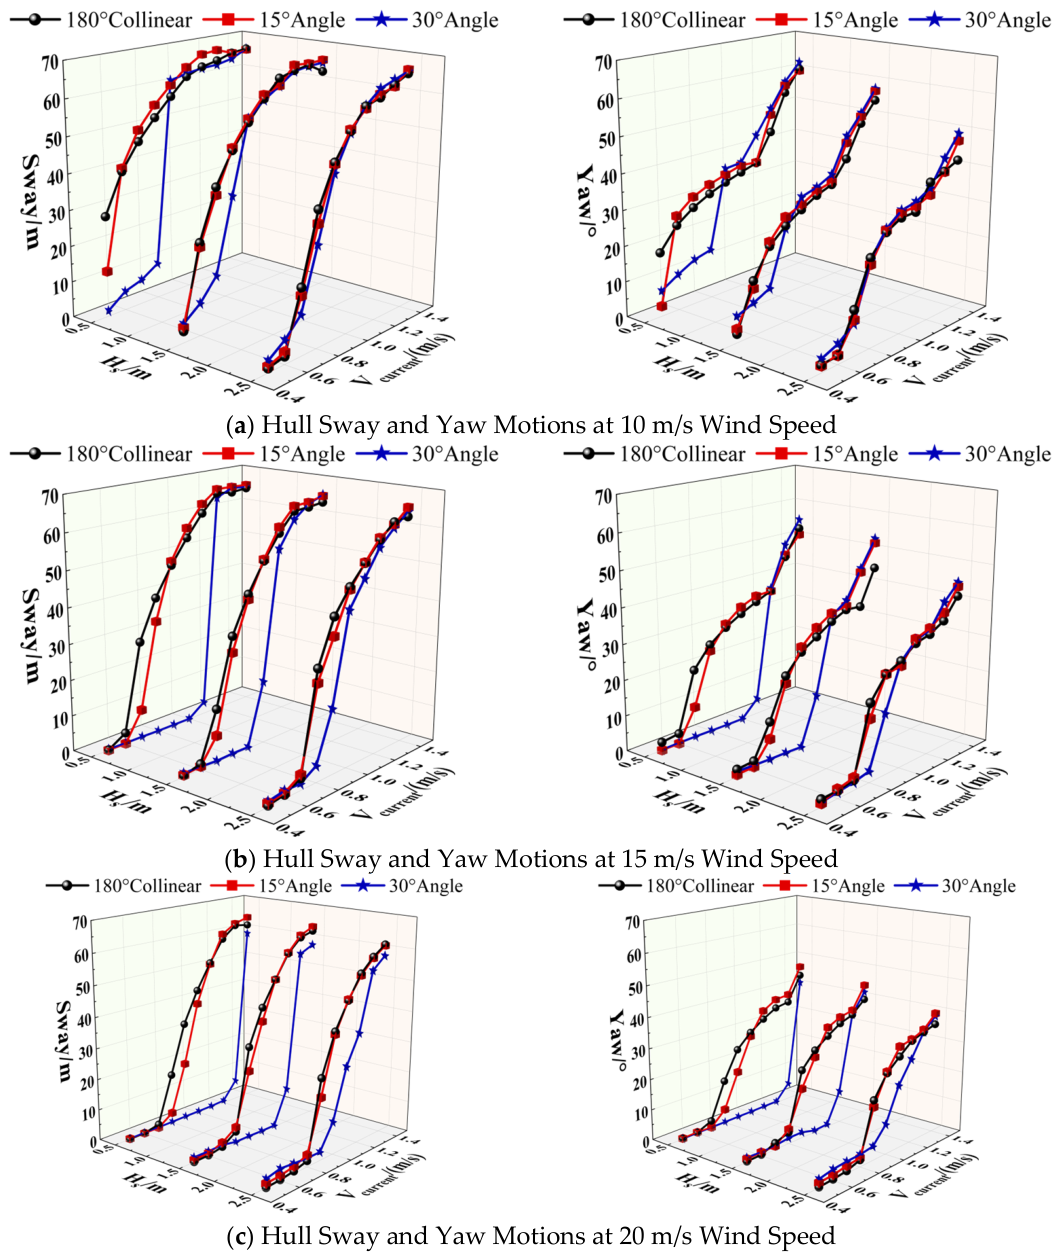
Building upon the previously discussed collinear wind–wave–current conditions, this section selects three sets of wave height conditions to specifically investigate the hull’s fishtailing characteristics when the wind field is at 15° and 30° angles relative to the combined wave–current field (where waves and current are aligned). The hull motion response results for the different misalignment angles are shown in Figure 13.
Analysis reveals that the influence of the wave–wind misalignment angle on hull oscillation is more pronounced within the lower current speed range. In this speed region, fishtailing occurs under perfectly collinear wind, wave, and current conditions. However, when the wind direction deviates by a certain angle, the hull only shifts to a new equilibrium position without initiating oscillatory motion.
From the three selected wave–wind misalignment scenarios, it is clearly observed that for the same wave height condition, fishtailing is more difficult to induce when the wave–wind angle is 30°, requiring a higher current speed to reach the critical threshold. Furthermore, once fishtailing is initiated, the overall oscillation amplitudes under different wave–wind misalignment angles show relatively little variation.
Results from the three different wind speed conditions indicate that an increase in wind speed raises the critical current speed required to trigger hull oscillation. Consistent with the conclusion drawn for the collinear condition, a higher wind speed can also, to some extent, suppress the oscillation amplitude of the hull.
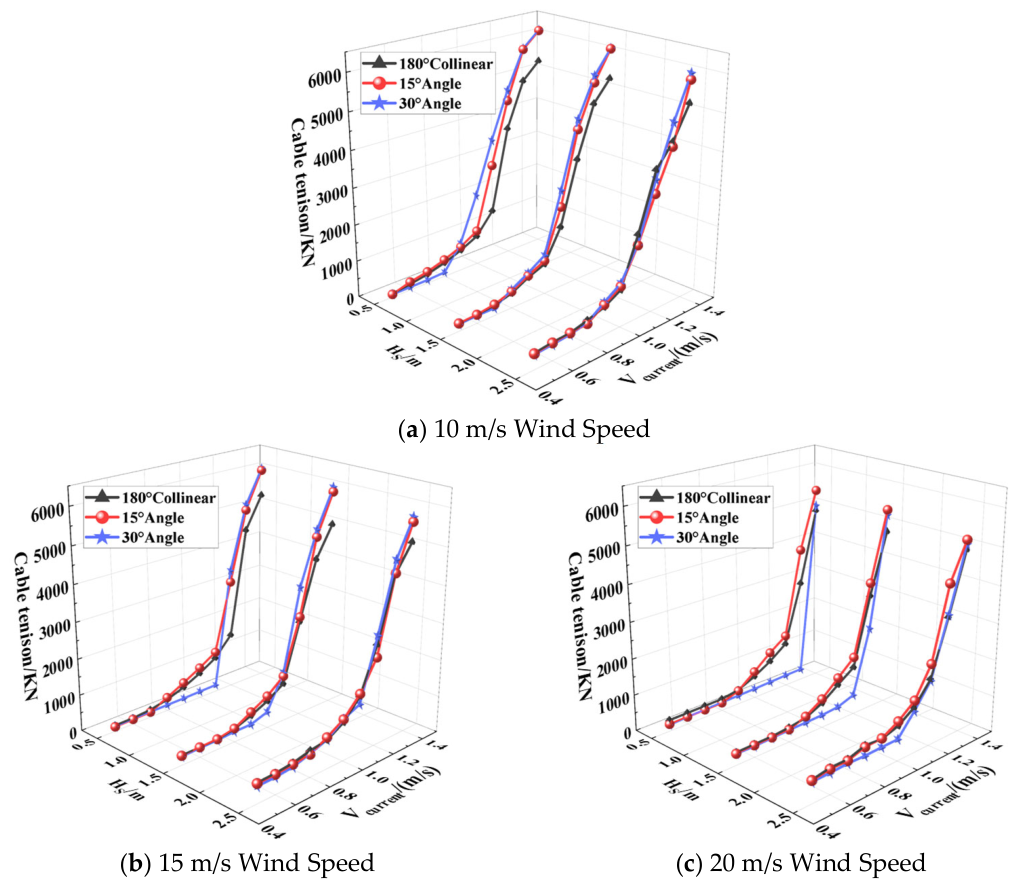
Figure 14 presents the mooring line tension response results under the non-collinear wave–wind conditions. A comparison with the analysis of hull motion reveals that the variation trend of the mooring line tension exhibits a strong correlation with the hull motion response. Consistent with the pattern observed under collinear wind–wave–current conditions, the change in mooring line tension remains relatively gradual across the low current speed range under different wind field directions.
Specifically, as seen from the results in Figure 14b,c, for the condition with a significant wave height of 0.5 m and within the current speed range of 0.5~1.0 m/s, the hull does not experience fishtailing. During this phase, the variation in mooring line tension is more gradual, even remaining largely stable. Conversely, results for significant wave heights of 1.5 m and 2.5 m show that when fishtailing occurs, the influence of the wind field direction on the mooring line tension is relatively minor. However, once the current speed increases beyond a certain critical value, the mooring line tension also demonstrates a significant abrupt change.

4.2. Analysis of Fishtailing Effect Characteristics Under Non-Collinear Wave-Current Combination

This section analyzes the hull fishtailing characteristics under non-collinear wave–current conditions, utilizing the same set of operational scenarios as those for the non-collinear wave–wind analysis. According to the calculated hull oscillation amplitudes for different wave–current misalignment angles shown in Figure 15, when the wind and waves are aligned, the hull’s fishtailing motion is significantly mitigated as the wave–current misalignment angle gradually increases. When the wave–current angle reaches 30°, under most operational conditions, the hull only undergoes a directional offset in the current direction and subsequently stabilizes to an equilibrium state under the action of its own damping, with no further fishtailing occurring.
Furthermore, the dampening effect of wave–wind action on hull oscillation becomes more pronounced once an angle exists between waves and current. As can be seen from the results in Figure 15, when the wave–current angle is 30° and the significant wave height exceeds 1.5 m, fishtailing of the hull essentially ceases. A comparison of the yaw calculation results under different wind speeds indicates that an increase in wind speed can significantly suppress the hull’s fishtailing motion.
Figure 16 presents the mooring line tension response under the action of non-collinear waves and currents. Analysis indicates that when hull fishtailing occurs, the mooring line tension under different wave–current misalignment angles shows little difference compared to the collinear wave–current condition. Combined with the analysis of hull motion, the variation in the extreme mooring line tension is very gradual under conditions where fishtailing does not occur.
From the results for the 15° wave0current misalignment angle, the observed pattern is consistent with the collinear wave–current condition: within the low current speed range, the variation in mooring line tension is relatively gradual. However, when the current speed increases beyond a certain critical threshold, the extreme mooring line tension exhibits a significant change in response to further increases in current speed.

5. Hull Oscillation Suppression Method

5.1. Analysis of Applying Stern Tug for Suppression

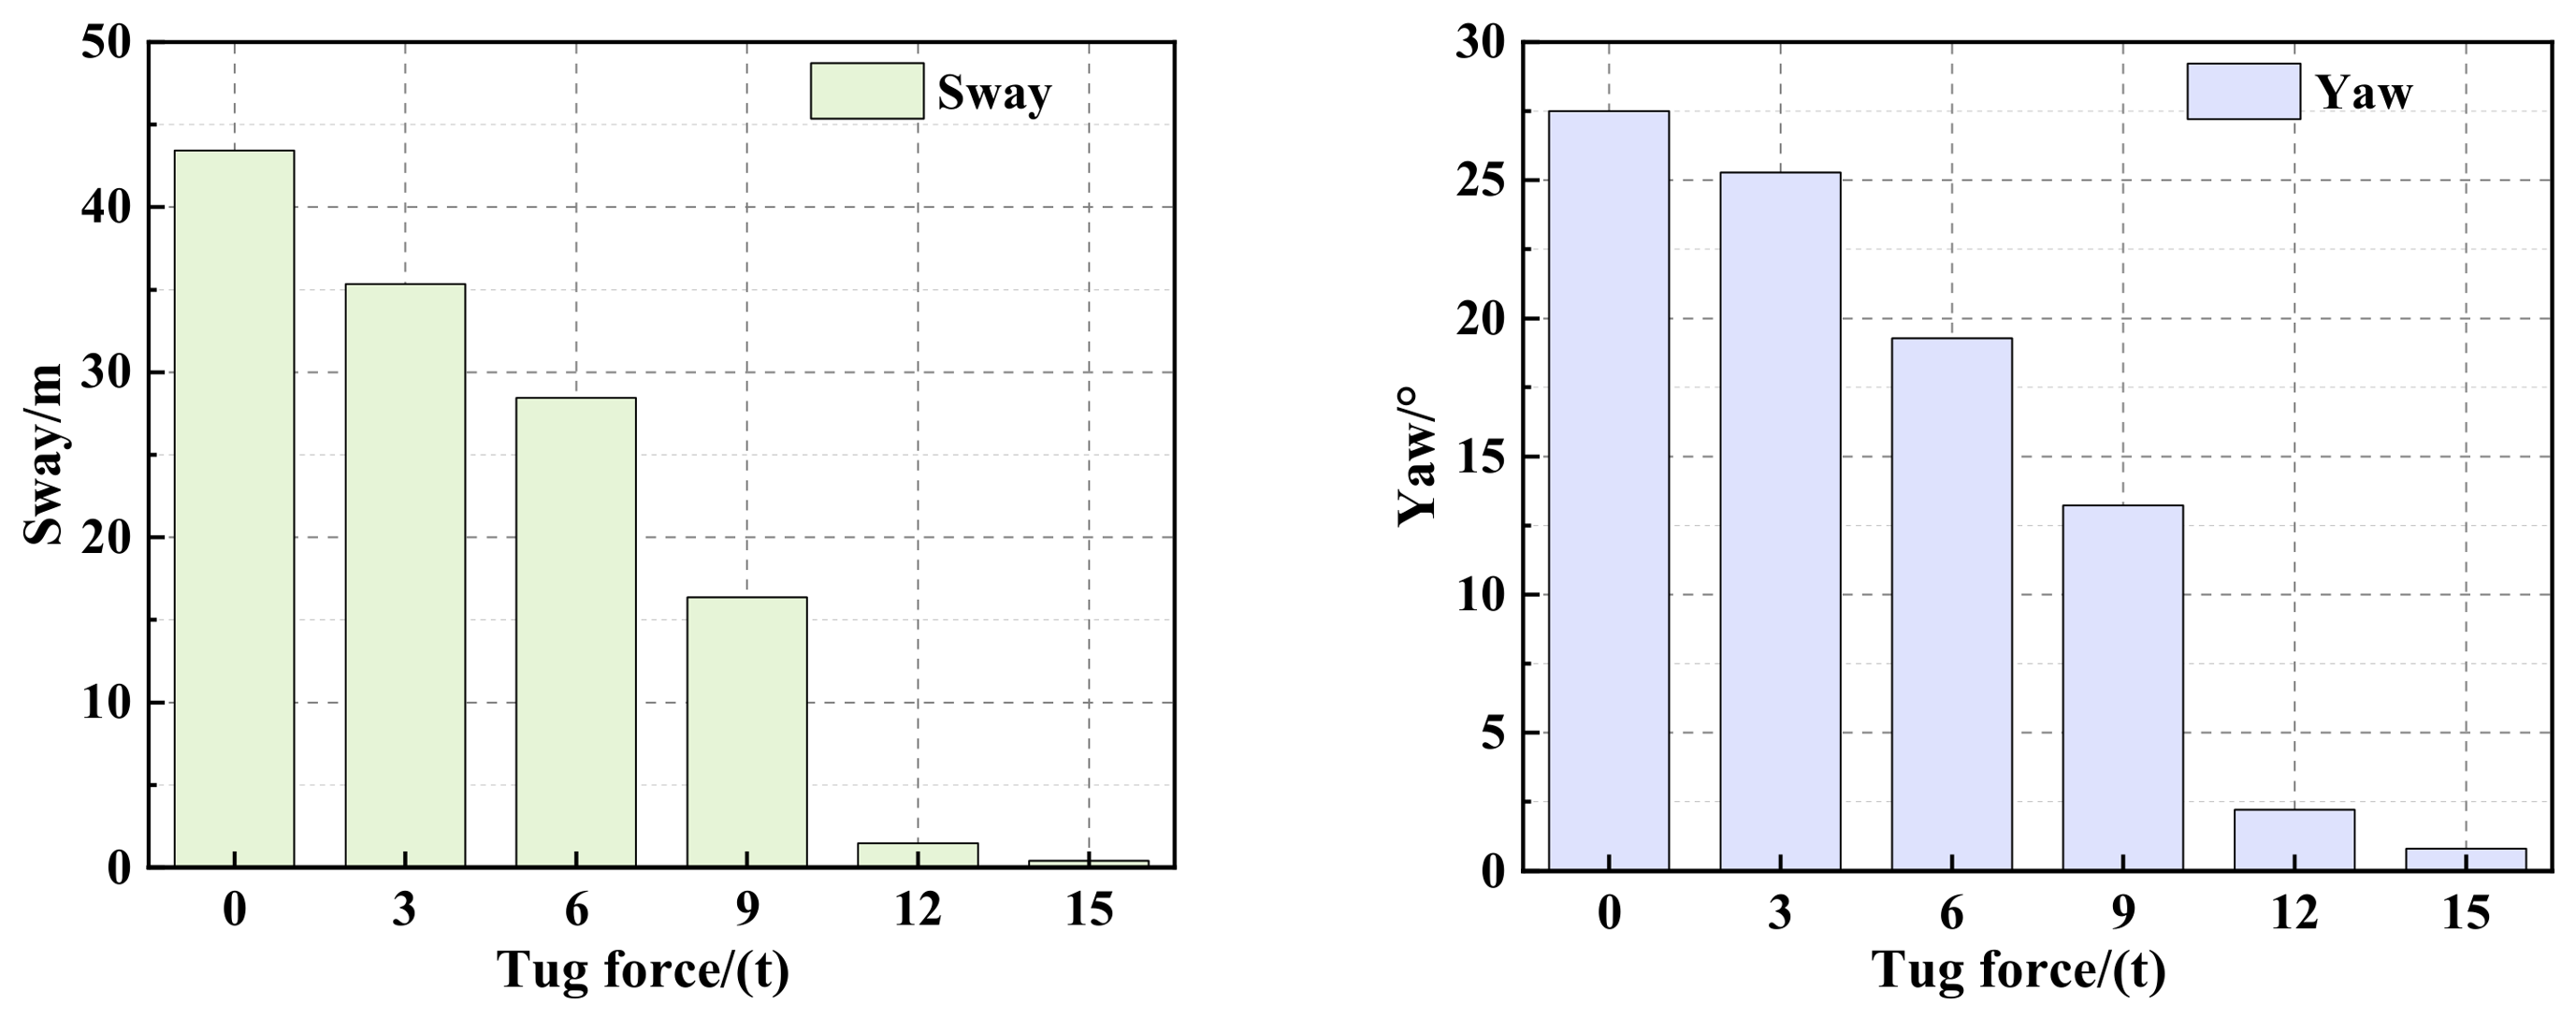
This section focuses on analyzing the suppressive effect of applying a stern tug force, aligned with the wave direction, on the hull’s fishtailing motion. The calculated hull motion results under different stern tug forces are shown in Figure 17. The results indicate that under the selected computational conditions (significant wave height of 1.5 m, wind speed of 15 m/s, current speed of 0.9 m/s), applying a stern tug force can significantly suppress the hull’s fishtailing motion. When the stern tug force reaches 12 t, fishtailing of the tanker essentially ceases. This stern tug force is therefore defined as the optimal stern tug force for the corresponding operational scenario.
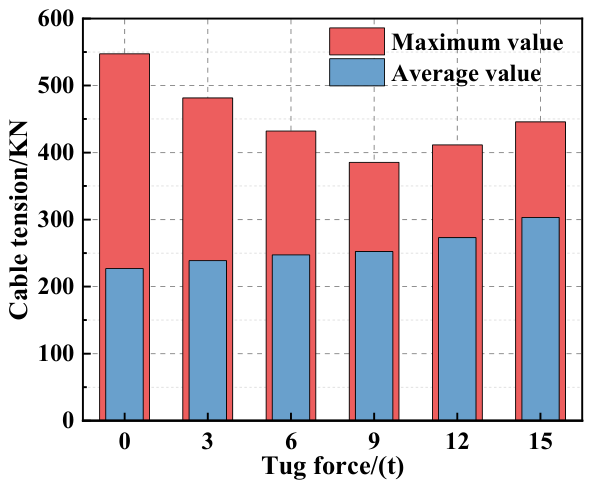
Figure 18 shows the statistical values of the mooring line tension response under the aforementioned different stern tug forces. It can be observed that applying a certain stern tug force to the hull can effectively reduce the extreme values of the mooring line tension. Although the overall average tension increases, it shows a slowly increasing trend.
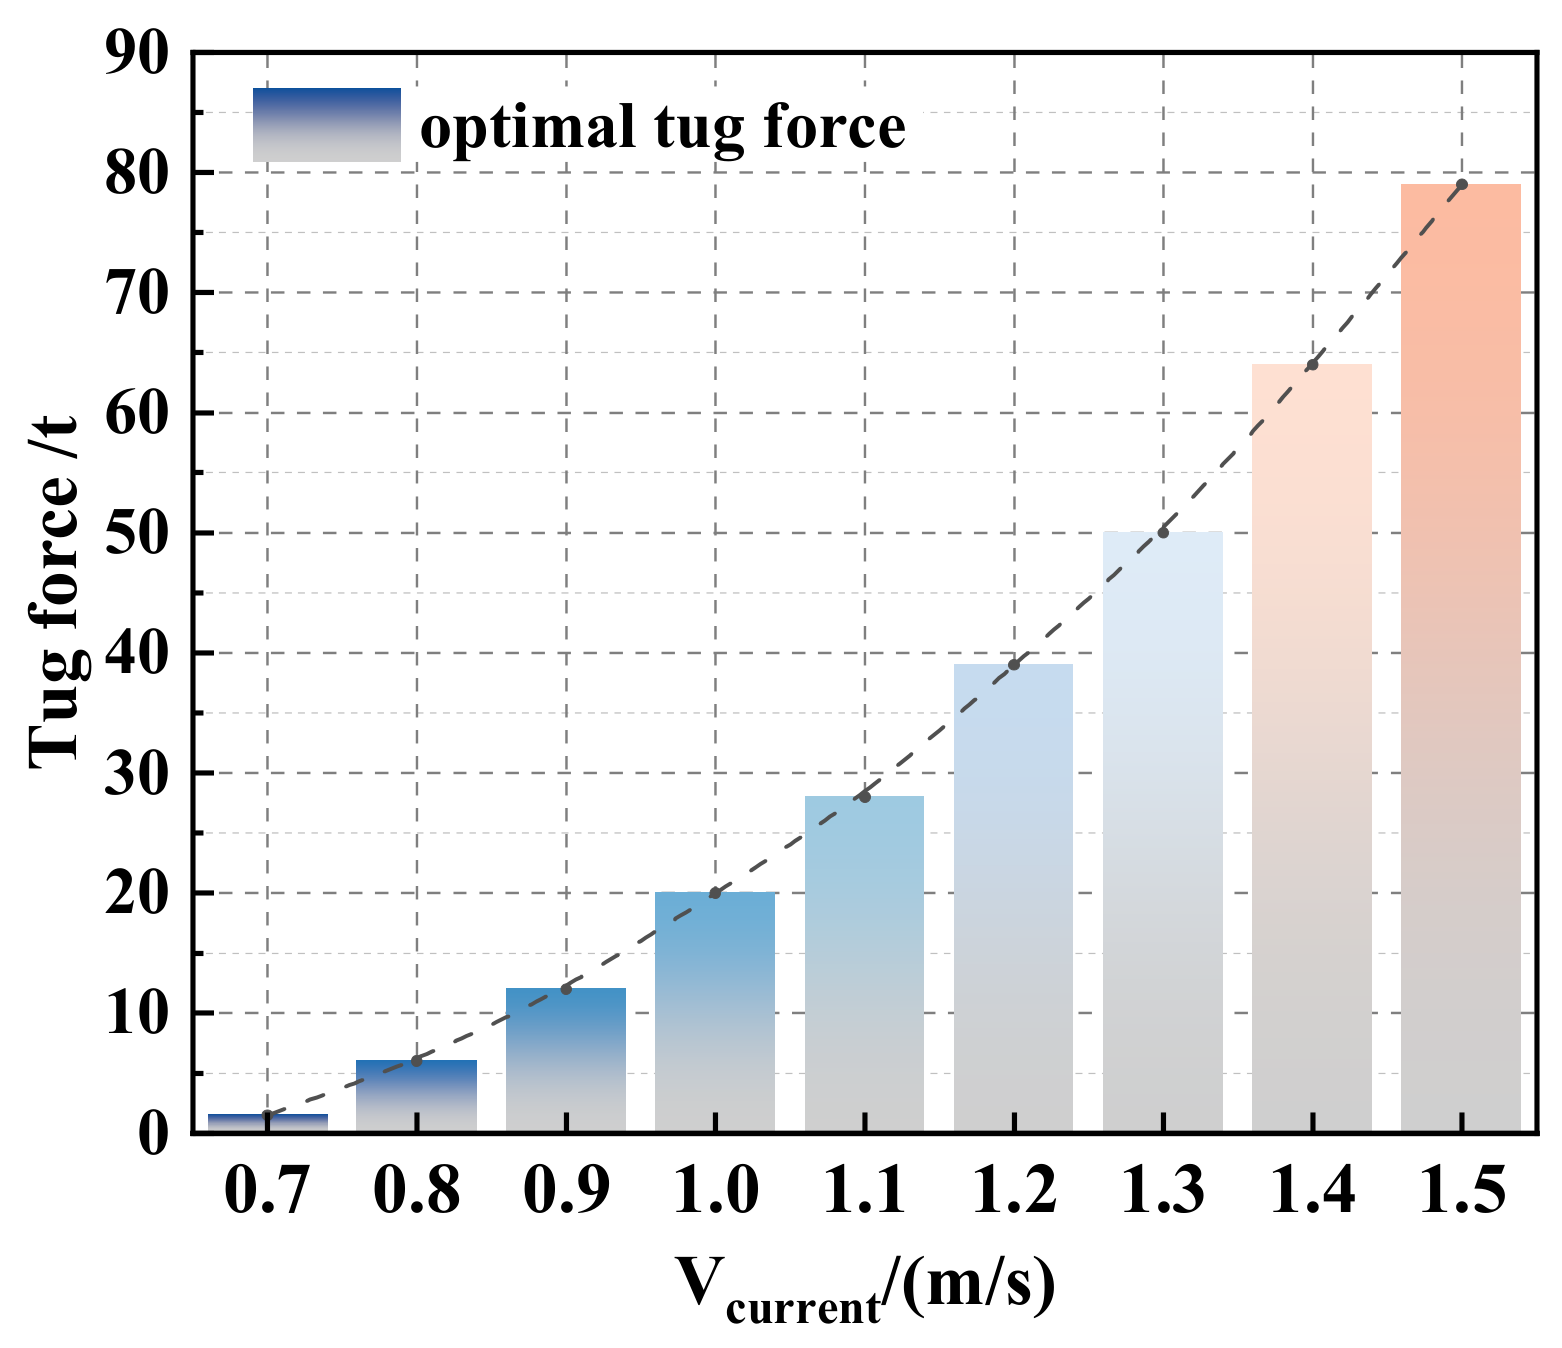
Analysis from Section 3 and Section 4 indicates that current speed is the dominant factor inducing the fishtailing effect in the hull. Based on this, this section analyzes the optimal stern tug force required under different current speed conditions, with the results shown in Figure 19. It can be seen that the appropriate magnitude of the stern tug force during the hull’s actual operation primarily depends on the prevailing current speed conditions. Furthermore, as the current speed increases, the required optimal stern tug force shows a significant upward trend.
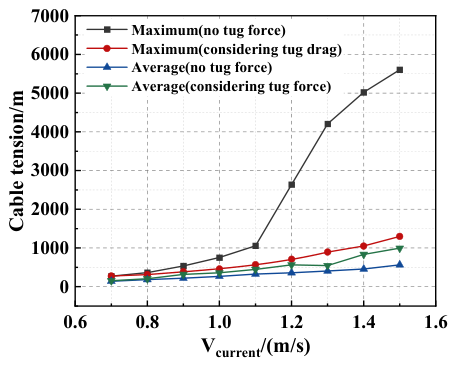
Figure 20 shows the statistical results of mooring line tension with and without the stern tug force under different current speeds. It can be observed that applying the optimal stern tug force to the hull can effectively mitigate the extreme tension response in the mooring line. Especially when the current speed exceeds 1.1 m/s—which corresponds to the speed at which a significant abrupt change in line tension occurs without a stern tug—applying the optimal stern tug force at this point can markedly reduce the extreme mooring line tension. Although the addition of the stern tug leads to a slight increase in the average mooring line tension, the increasing trend is very gradual.

5.2. Analysis of Mooring Line Length for Suppression

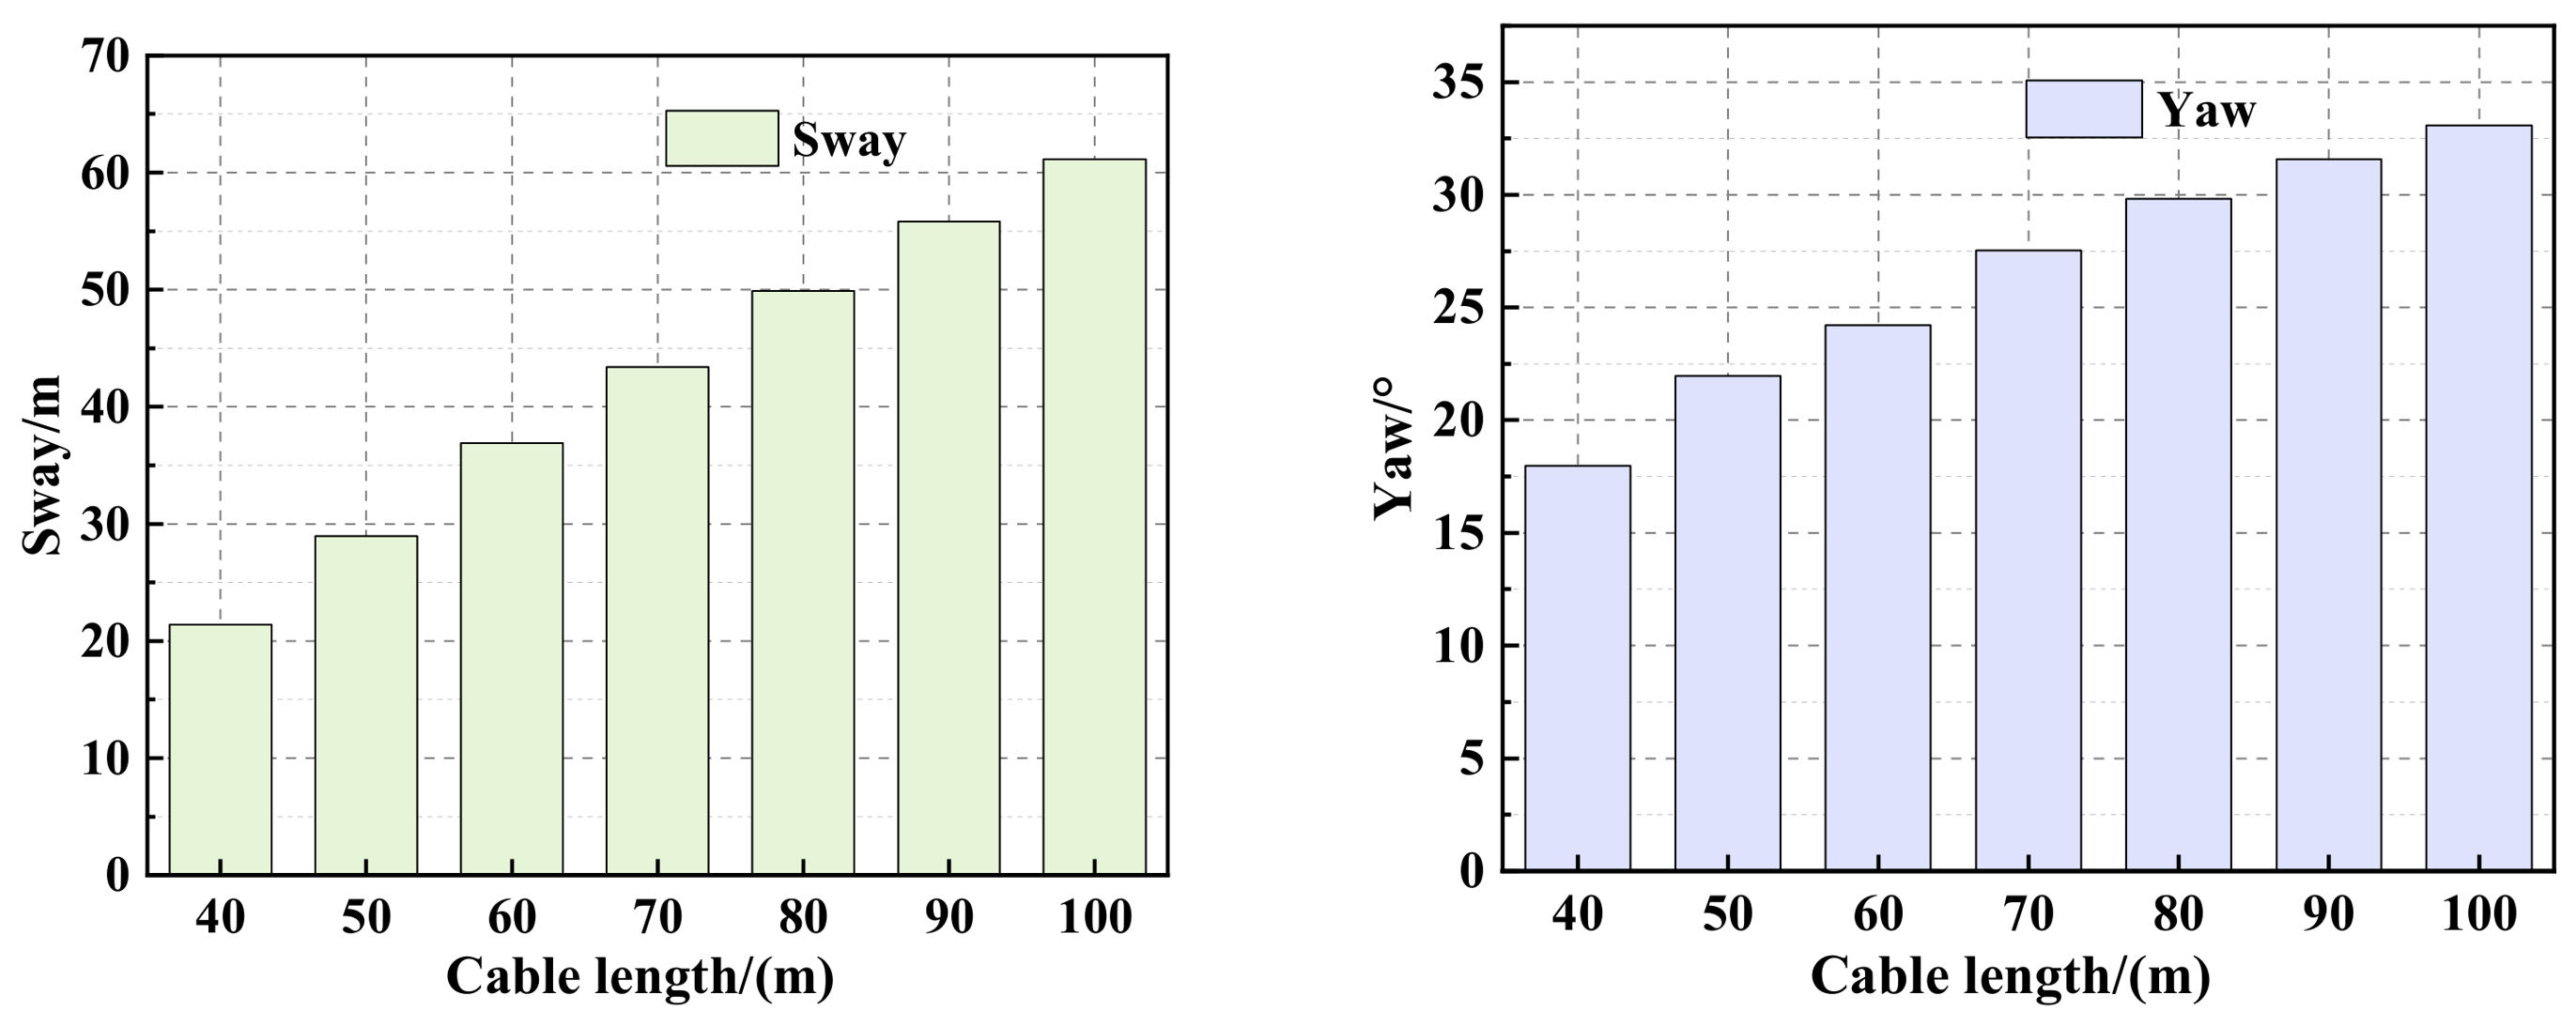
This section focuses on analyzing the hull’s fishtailing behavior under seven different mooring line lengths. Figure 21 shows the movement of the hull under different cable lengths. The results indicate that shortening the mooring line length can, to a certain extent, suppress the hull’s fishtailing motion, with a particularly effective suppression of the sway motion. When the mooring line length is reduced from 100 m to 40 m, the amplitude of the hull’s sway motion decreases by nearly two-thirds, while the amplitude of the yaw motion is reduced by approximately one-third.
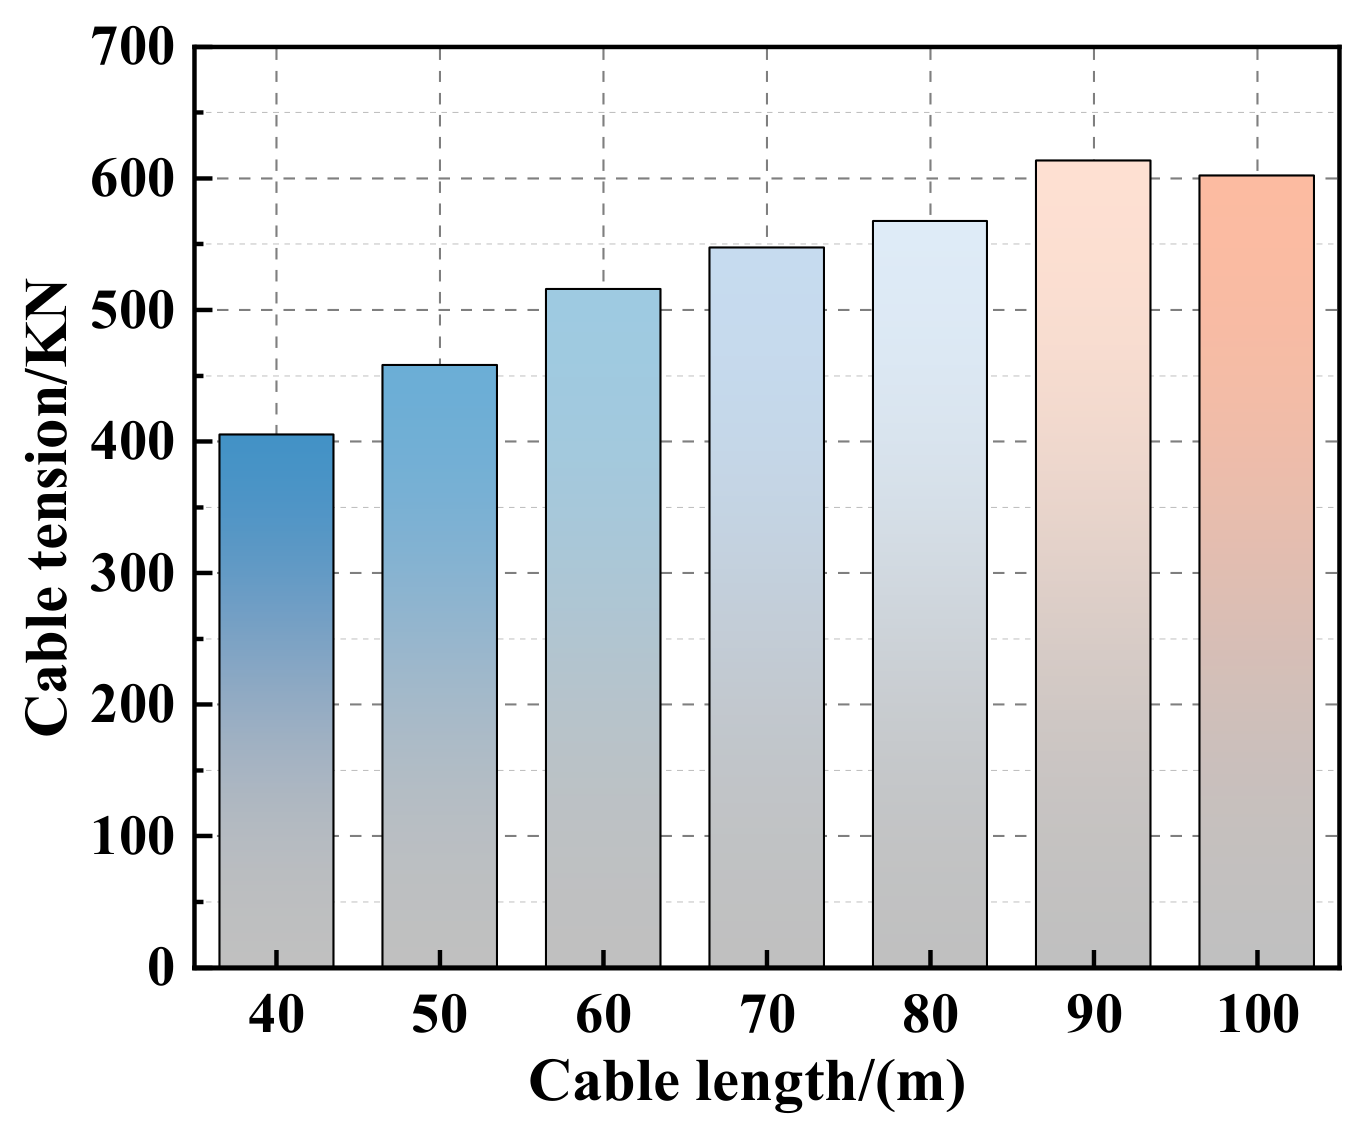
Figure 22 presents the extreme mooring line tension responses under different mooring line lengths. Analysis shows that shortening the mooring line length can, to a certain extent, reduce the extreme values of the mooring line tension. The underlying reason is that hull fishtailing is a significant factor contributing to the increase in extreme mooring line tension. Since shortening the mooring line length effectively suppresses hull fishtailing, a shorter mooring line consequently reduces the extreme tension response.
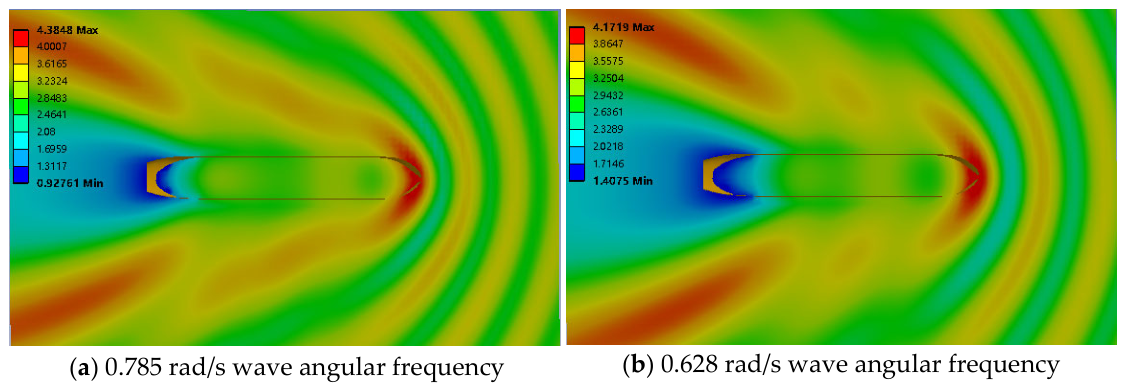
Figure 23 shows the water surface elevation contours for two different wave angular frequencies. These two water surface elevation plots show typical wave disturbances around the hull: a bow wave crest, a stern trough, and spreading Kelvin waves. Compared to the second plot, the first has a larger elevation range, steeper surface gradients, and more pronounced bow crest and stern trough, indicating stronger wave disturbances with higher risks of bow slamming and stern cavitation. The second plot, however, shows a calmer wave field with suppressed hull-induced wave motion. These differences highlight the effect of varying frequencies on the wave field of a single-point moored vessel, supporting subsequent wave load and motion response analyses.

6. Conclusions

6.1. Main Conclusions

This study investigates a tanker operating with a pile-founded column single-point mooring (SPM) system. Using a numerical calculation method validated by basin tests, the characteristics of the hull’s “fishtailing effect” and oscillation suppression methods under various sea states are analyzed. The following conclusions are drawn:
(1) When wind, waves, and currents are collinear, the hull is more prone to the “fishtailing effect,” and the oscillation amplitude increases with rising current speed. Both wind and waves exhibit a certain suppressive effect on the hull’s fishtailing motion, with the wind’s suppression effect being significantly stronger than that of the waves. In the practical design process of mooring systems, in addition to considering extreme combined conditions of wind, waves, and currents, due attention must also be given to the potential occurrence of the “fishtailing effect” under conditions of low wind speed and low wave height to ensure the stability of the mooring system.
(2) When either the wind or the current exhibits a certain misalignment angle relative to the other environmental forces, it can significantly suppress the tanker’s “fishtailing effect.” Particularly when the current direction forms an angle with the wave and wind directions, the tanker typically only experiences an equilibrium offset under the environmental forces, with no significant fishtailing occurring in most cases.
(3) In the low current speed range or when the tanker is not experiencing fishtailing, the variation trend of mooring line tension with changing environmental conditions is relatively gradual. However, when the tanker undergoes fishtailing, once the current speed increases beyond a certain critical value, the extreme value of the mooring line tension undergoes a significant abrupt change.
(4) Both reducing the mooring line length and applying a stern tug force at the tanker’s stern can, to a certain extent, suppress hull fishtailing. Furthermore, in the higher current speed range, these measures can significantly reduce the extreme values of the mooring line tension. Among these, the magnitude of the applied stern tug force is primarily determined by the current speed in the tanker’s operating environment.

6.2. Discussion on Limitations

(1) This paper uses potential flow software AQWA 2020 to conduct numerical analysis of the fishtail effect of the single-point mooring system with pile foundation. Although the numerical calculation model is modified with damping based on the free-decay test, the AQWA theory, based on potential flow, still cannot simulate the nonlinear viscous damping characteristics related to the amplitude and frequency of motion, nor can it consider the three-dimensional viscous effects such as flow separation and vortex-induced motion. As a result, the low-frequency slow-drift motion prediction of the pile-based single-point mooring system under strong nonlinear sea conditions still has deviations. Therefore, in future analyses of shallow-water pile-based single-point mooring systems, CFD can be extended for numerical simulation, and the consideration of nonlinear viscous effects can be increased to obtain more accurate calculation results closer to the actual situation.
(2) The analysis of the suppression of ship body oscillation by tail towing used in this paper has been idealized. Therefore, when conducting research on the suppression method of the fishtail effect of the pile-based single-point mooring system in the future, multi-body coupling analysis can be carried out by applying tail towing forms such as tugboat tail towing or two-point mooring, making it closer to engineering practical applications.


Author Contributions

Validation, L.S.; Data curation, H.H. and B.Z.; Writing—original draft, H.H. and B.Z.; Writing—review & editing, H.W., L.Y. and L.S.; Project administration, H.W., L.Y. and L.S. All authors have read and agreed to the published version of the manuscript.

Funding

This research received no external funding.

Data Availability Statement

The original contributions presented in this study are included in the article. Further inquiries can be directed to the corresponding author.

Conflicts of Interest

Authors Huifeng Wang and Liang Yang were employed by the company Offshore Oil Engineering Co., Ltd. The remaining authors declare that the research was conducted in the absence of any commercial or financial relationships that could be construed as a potential conflict of interest.

References

  1. Amaechi, C.V.; Chesterton, C.; Butler, H.O.; Wang, F.; Ye, J. Review on the design and mechanics of bonded marine hoses for Catenary Anchor Leg Mooring (CALM) buoys. Ocean Eng. 2021, 438, 109722. [Google Scholar] [CrossRef]
  2. Brownsort, P. Offshore offloading of CO2: Review of Single Point Mooring Types and Suitability. In SCCS (Scottish Carbon Capture and Storage); The University of Edinburgh: Edinburgh, Scotland, 2015; pp. 1–23. [Google Scholar]
  3. Wang, H.F.; Yang, X.L.; Zhang, S.S.; Liu, S.; Liang, Y. Development status and suggestions for independent development of single point mooring systems. China Offshore Oil Gas 2025, 37, 247–258. [Google Scholar]
  4. Lee, D.; Choi, H. A stability analysis of tandem offloading systems at sea. J. Mar. Sci. Technol. 2005, 10, 53–60. [Google Scholar] [CrossRef]
  5. Fitriadhy, A.; Aswad, M.; Aldin, N.A.; Mansor, N.A.; Bakar, A.; Nik, W.W. Computational Fluid Dynamics Analysis on the Course Stability of a Towed Ship. J. Mech. Eng. Sci. 2017, 11, 2919–2922. [Google Scholar] [CrossRef]
  6. Huo, P.; Wang, D.J.; Kun, L. Research on Fishtailing Oscillations of a Single Point Moored Vessel in Shallow Waters. In Proceedings of the 28th International Ocean and Polar Engineering Conference, Sapporo, Japan, 10–15 June 2018. [Google Scholar]
  7. Ju, X.; Amaechi, C.V.; Dong, B.; Meng, X.; Li, J. Numerical analysis of fishtailing motion, buoy kissing and pullback force in a catenary anchor leg mooring (CALM) moored tanker system. Ocean Eng. 2023, 278, 114236. [Google Scholar] [CrossRef]
  8. Gu, M. Safety Assessment of VLCC unloading in maoming single point mooring system. Saf. Environ. Health 2006, 6, 15–19. [Google Scholar]
  9. Zhou, N. “Fishtailing effect” of CALM single point mooring tankers. China Offshore Platf. 2018, 33, 70–74. [Google Scholar]
  10. Sun, Q.; Yan, J.; Peng, D.S.; Wang, W.H.; Yue, W.J. Influence of fishtailing effect on Catenary Anchor Leg Mooring tankers. Ship Eng. 2025, 47, 28–35. [Google Scholar]
  11. Ge, S.; Pan, X.R.; Wang, D.J.; Chen, J.C. Stability analysis and fishtailing motion countermeasures for single point mooring systems. Ship Sci. Technol. 2022, 44, 70–77. [Google Scholar]
  12. Huang, W.; Li, B.B.; Kim, D.K. An Investigation on material Diversity of Synthetic Fiber Ropes in the Course Stability of Towing under Wind. Ocean Eng. 2023, 279, 114410. [Google Scholar] [CrossRef]
  13. Brotons, M.; Jean, P. Numerical vs. experimental predictions of yaw motion of single point moored vessel. In Proceedings of the ASME 2005 24th International Conference on Offshore Mechanics and Arctic Engineering, Halkidiki, Greece, 12–17 June 2005. [Google Scholar]
  14. Paton, C.G.; Carra, C.J.; Sincock, P. Investigation of sway/yaw motions of deepwater FPSOs. In Proceedings of the Offshore Technology Conference, Houston, TX, USA, 1–4 May 2006. [Google Scholar]
  15. Huang, G.L.; Fujino, M. Study on the fishtailing oscillation of single-point mooring vessels under wind and tidal current actions. Ocean Eng. 1987, 3, 1–13. [Google Scholar]
  16. Hoollyhesd, C.J.; Townsend, N.C.; Blake, J.I.R. Experimental investigations into the current-induced motion of a lifeboat at a single point mooring. Ocean Eng. 2017, 146, 192–201. [Google Scholar] [CrossRef]
  17. Li, Y.; Zhou, J.; Wang, H.; Wang, C. Influence of viscous effects on mooring buoy motion. J. Mar. Sci. Eng. 2025, 13, 923. [Google Scholar] [CrossRef]
  18. Pistani, F.; Thiagarajan, K. Experimental campaign on a moored FPSO in complex bi-directional sea states. In Proceedings of the 22nd International Workshop on Water Waves and Floating Bodies, Plitvice, Croatia, 15–18 April 2007; pp. 169–172. [Google Scholar]
  19. Halliwell, A.R.; Harris, R.E. A parametric experimental study of low frequency motion of single point mooring systems in waves. Appl. Ocean Res. 1988, 10, 74–86.1. [Google Scholar] [CrossRef]
  20. Zainuddin, M.; Kim, M.; Bhataramanadka, S. Implementation of magneto-rheological (MR) elastomer for mitigating fishtailing instability in FPSO-tanker in-tandem system. In Proceedings of the Offshore Technology Conference, Rio de Janeiro, Brazil, 24–26 October 2023; p. 32918. [Google Scholar]
  21. Zhang, X.; Ni, W.; Sun, L.; Zhang, W. Experimental investigation of a shuttle tanker in irregular waves with hawser single point mooring system. Ships Offshore Struct. 2021, 16, 838–851. [Google Scholar] [CrossRef]
  22. Jiang, T.; Schellin, T.E.; Sharma, S.D. Horizontal motions of an SPM tanker under alternative mooring configurations. J. Offshore Mech. Arct. Eng.-Trans. ASME 1995, 117, 223–231. [Google Scholar] [CrossRef]
  23. Osborne, G.; Latorre, R. Investigation of spm mooring tension and barge orientation with wind, waves and strong current. J. Energy Resour. Technol. 1991, 113, 75–79. [Google Scholar] [CrossRef]
  24. Chen, S.H.; Sun, M.G. Fishtailing motion of tankers and Hopf bifurcation algorithm. Ocean Eng. 1994, 1, 26–41. [Google Scholar]
  25. Fan, J.; Yan, J.; Fang, H.; Huang, J. Nonlinear dynamics and fatigue damage of CALM systems with segmented mooring lines. Ships Offshore Struct. 2025, 1–29. [Google Scholar] [CrossRef]
  26. Ma, Y. Fishtailing Behaviour of Single Point Moored Floating Wind Turbines. Master’s Thesis, Norwegian University of Science and Technology, Trondheim, Norway, 2020. [Google Scholar]
  27. Simos, A.; Tannuri, E.; Aranha, J.; Leite, A.J.P.; De Janeiro, P.R. Theoretical analysis and experimental evaluation of the fishtailing phenomenon in a single-point moored tanker. In Proceedings of the Eleventh (2001) International Offshore and Polar Engineering Conference, Stavanger, Norway, 17–22 June 2001. [Google Scholar]
  28. Aghamohammadi, F.; Thompson, J.M.T. An experimental study of the large amplitude fish-tailing instabilities of a tanker at a single point mooring. Appl. Ocean Res. 1990, 12, 25–33. [Google Scholar] [CrossRef]
  29. Morandini, C.; Legerstee, F.; Mombaerts, J. Criteria for analysis of offloading operation. In Proceedings of the Offshore Technology Conference, Houston, TX, USA, 6–9 May 2002; p. 14311. [Google Scholar]
  30. Mohapatra, S.C.; Amouzadrad, P.; Bispo, I.B.d.S.; Guedes Soares, C. Hydrodynamic Response to Current and Wind on a Large Floating Interconnected Structure. J. Mar. Sci. Eng. 2025, 13, 63. [Google Scholar] [CrossRef]
  31. Goda, Y. Statistical variability of sea state parameters as a function of wavespectrum. Coast. Eng. Jpn. 1988, 31, 39–52. [Google Scholar] [CrossRef]
  32. Dai, Y.; Duan, W. Potential Flow Theory of Ships Moving in Waves; National Defence Industry Press: Beijing, China, 2008. [Google Scholar]
  33. Jiang, C.; el Moctar, O.; Schellin, T.E. Capability of a potential-flow solver to analyze articulated multibody offshore modules. Ocean Eng. 2022, 266, 112754. [Google Scholar] [CrossRef]
  34. Newman, J.N. The Theory of Ship Motions*1Preparation of this article was supported by the National Science Foundation and by the Office of Naval Research. In Advances in Applied Mechanics; Yih, C.-S., Ed.; Elsevier: Amsterdam, The Netherlands, 1979; Volume 18, pp. 221–283. [Google Scholar]
  35. Zhu, M.; Fang, H.; Li, A.; Liu, Y. A material–structure-wave integrated hydro-viscoelastic model for floating composite structure with generalised boundary. Phys. Fluids 2023, 35, 127101. [Google Scholar] [CrossRef]
  36. Amouzadrad, P.; Mohapatra, S.C.; Guedes Soares, C. Hydroelastic response of a floating flexible platform under oblique wave-current interaction. Mar. Struct. 2026, 107, 103990. [Google Scholar] [CrossRef]
  37. Cummins, W.E. The Impulse Response Function and Ship Motions; Tech. Rep.; David Taylor Model Basin: Washington, DC, USA, 1962. [Google Scholar]
  38. Jin, C.; Bakti, F.P.; Kim, M.H. Multi-floater-mooring coupled time-domain hydro-elastic analysis in regular and irregular waves. Appl. Ocean Res. 2020, 101, 102276. [Google Scholar] [CrossRef]
Figure 1. Diagram of single-point mooring with pile foundation column structure.
Jmse 14 00770 g001
Figure 2. Test instruments layout diagram.
Jmse 14 00770 g002
Figure 3. Comparison of the tension-elongation curves between the prototype and model.
Jmse 14 00770 g003
Figure 4. Comparison between the theoretical and experimental wave spectrum.
Jmse 14 00770 g004
Figure 5. Schematic diagram of model test setup.
Jmse 14 00770 g005
Figure 6. Pile-founded column single point mooring numerical calculation model.
Jmse 14 00770 g006
Figure 7. Definition of the zero-crossing method.
Jmse 14 00770 g007
Figure 8. Comparison of experimental results with numerical statistics results.
Jmse 14 00770 g008aJmse 14 00770 g008b
Figure 9. A-2 Comparison of experimental and numerical time history curves. (a) Comparison of sway time history curves. (b) Comparison of Surge Time History Curves. (c) Comparison of yaw time history curves. (d) Comparison of mooring line tension time history curves.
Jmse 14 00770 g009
Figure 10. The ship motion response under the combined action of wind, waves and currents.
Jmse 14 00770 g010
Figure 11. Ship’s lateral rolling and bow pitching motions under different wind speeds.
Jmse 14 00770 g011
Figure 12. Tension response of the cable under different wind speeds.
Jmse 14 00770 g012
Figure 13. Ship motion response under non-collinear wave and wind conditions.
Jmse 14 00770 g013
Figure 14. Tension response of the cable under the non-collinear wave and wind conditions.
Jmse 14 00770 g014
Figure 15. Ship motion response under non-collinear waves and current conditions.
Jmse 14 00770 g015
Figure 16. Tension response of the cable under the non-colinear wave and current conditions.
Jmse 14 00770 g016
Figure 17. The maximum values of the ship’s motion under different tail drag forces.
Jmse 14 00770 g017
Figure 18. Statistical values of cable tension under different tail drag forces.
Jmse 14 00770 g018
Figure 19. Optimal tug force at different current velocities.
Jmse 14 00770 g019
Figure 20. Statistical values of tug forces under different current velocities.
Jmse 14 00770 g020
Figure 21. The maximum values of the ship’s motion under different cable lengths.
Jmse 14 00770 g021
Figure 22. Extreme values of cable force under different cable lengths.
Jmse 14 00770 g022
Figure 23. Water Surface Elevation Contour Plot.
Jmse 14 00770 g023
Table 1. Parameters of the tanker.
ParametersUnitPrototypeModel
Overall lengthm220.44.408
breadthm350.700
Draftm9.9360.199
Displacementt623600.499
Longitudinal center of gravitym116.2362.325
Vertical center of gravitym9.8890.198
Roll radius of gyrationm10.7040.214
Pitch radius of gyrationm57.5771.152
Yaw radius of gyrationm58.0921.162
Table 2. Environmental parameters.
Case H S
(m)
T P
(s)
Vcurrent
(m/s)
Vwind
(m/s)
DC
(°)
Hwater
(m)
A-12100.91518013
A-2380.91518013
A-33100.91518013
Table 3. Numerical calculation parameters.
ParametersSize of Mesh Mesh QuantityTime StepCalculate the Duration
value3 m45320.1 s10,800 s
Table 4. Cable parameters.
ParametersLength DiameterWire WeightBreaking Load
value70 m144 mm12.8 kg/m650 t
Table 5. Damping parameter.
X
N/(m/s)
Y
N/(m/s)
Z
N/(m/s)
RX
N·m/(rad/s)
RY
N·m/(rad/s)
RZ
N·m/(rad/s)
1.3 × 1058.02 × 1051.13 × 1081.0 × 1093.15 × 10115.9 × 109
Disclaimer/Publisher’s Note: The statements, opinions and data contained in all publications are solely those of the individual author(s) and contributor(s) and not of MDPI and/or the editor(s). MDPI and/or the editor(s) disclaim responsibility for any injury to people or property resulting from any ideas, methods, instructions or products referred to in the content.