Article

Numerical Study on the Effect of Column Boot Diameter-to-Height Ratio on the Hydrodynamic Performance of Deep-Draft Cylindrical Offshore Platforms

1
State Key Laboratory of Ocean Engineering, Shanghai Jiao Tong University, Shanghai 200240, China
2
School of Ocean & Civil Engineering, Shanghai Jiao Tong University, Shanghai 200240, China
3
Yazhou Bay Institute of Deepsea Science and Technology, Shanghai Jiao Tong University, Sanya 572024, China
4
State Key Laboratory of Submarine Science and Delimitation, Shanghai Jiao Tong University, Shanghai 200240, China
*
Author to whom correspondence should be addressed.
J. Mar. Sci. Eng. 2026, 14(6), 584; https://doi.org/10.3390/jmse14060584
Submission received: 13 February 2026 / Revised: 18 March 2026 / Accepted: 20 March 2026 / Published: 21 March 2026
(This article belongs to the Special Issue Floating Offshore Structures: Hydrodynamic Analysis and Design)

Abstract

For deep-draft cylindrical platforms with a large annular column boot, the influence of the column boot diameter-to-height ratio (d/h) on motion performance remains unclear. This study investigates the effect of d/h on platform hydrodynamics while keeping the main body geometry, displacement, and draft unchanged. A hybrid numerical model validated against tests is adopted: STAR-CCM+ free-decay simulations identify equivalent linear damping, and ANSYS AQWA predicts hydrodynamic coefficients, response amplitude operators, and coupled time-domain responses under a 100-year survival sea state in the western South China Sea. Increasing d/h substantially increases heave added mass and added pitch moment of inertia, leading to longer natural periods and higher damping in heave and pitch. However, its effect on motion responses is non-monotonic and strongly response-dependent. As d/h increases, the responses are initially reduced markedly. The minimum surge and heave responses occur at d/h = 2.39 and 4.67, with reductions of about 34.0% and 87.2%, respectively, while the pitch response is already reduced by about 67.3% at d/h = 7.22. Further increases in d/h may weaken surge and heave mitigation while providing limited additional benefit for pitch. These findings provide qualitative understanding and quantitative guidance for response-oriented column boot design and optimization of similar platforms.

1. Introduction

Reliable electricity supply remains a major constraint for the development of remote offshore islands, where interconnection to mainland grids through long subsea cables is often impractical and conventional fuel supply is costly and vulnerable to severe weather interruptions [1]. In this context, nuclear energy is attractive because of its high energy density and dispatchable power output, with the additional advantage that, unlike wind, wave, and solar power, its electricity generation is not directly dependent on natural environmental conditions [2,3]. For offshore deployment, however, the power generation system must be integrated with a floating platform capable of maintaining adequate safety, operability, and environmental adaptability under severe wind, wave, and current conditions. Existing floating nuclear power studies and engineering practices have focused mainly on ship type or barge-based concepts [4,5]. For remote offshore islands exposed to harsh metocean conditions and lacking sufficient port infrastructure, platform-type floating concepts may offer advantages in environmental adaptability, station keeping, and operational safety [6].
To improve space utilization and exploit colder deep seawater for heat rejection, a deep-draft cylindrical offshore platform concept with a large annular column boot has been proposed [7,8]. The concept consists of a slender cylindrical main body and a large lower annular appendage with substantial horizontal and vertical extent. Compared with conventional cylindrical floaters, the column boot is expected to modify hydrodynamic added inertia and viscous dissipation, and thus affect motion characteristics. Existing studies on this concept, however, remain limited. Wang et al. [8] mainly evaluated its hydrodynamic characteristics and motion response performance under representative environmental conditions and showed that the survival responses could satisfy relevant acceptance criteria. Qin et al. [9] further compared the concept with conventional cylindrical and spar-type platforms and reported reduced susceptibility to heave and pitch resonance under similar displacement conditions. These studies demonstrated the feasibility and potential advantages of the concept. However, they focused mainly on baseline configuration assessment or comparison among a few representative platform types, rather than on systematic parametric investigation of the column boot itself.
From a hydrodynamic perspective, the column boot can be regarded as a large lower-hull appendage, and its geometry is expected to influence natural periods, damping, and motion responses in ways partly analogous to heave plates or damping plates used on spar-type and cylindrical floating platforms. Previous appendage studies have shown that geometric modifications can significantly affect added mass, damping, and motion characteristics. For example, Shen et al. [10] investigated the influence of heave plate edge form on the hydrodynamic characteristics of a spar platform, while Jiang et al. [11] studied the damping characteristics of a cylindrical FPSO fitted with a heave plate. Hao et al. [12] and Li et al. [13] further examined the effects of different anti-motion structures or damping plate forms on the damping performance and motion responses of cylindrical floaters. These studies established that appendage geometry plays an important role in hydrodynamic response control. However, they mainly concerned relatively thin damping appendages or local geometric modifications, rather than a large annular appendage with substantial vertical extent. More importantly, they did not address how the diameter-to-height ratio of such a large column boot governs the coupled evolution of natural periods, motion damping, RAOs, and survival responses when the main body geometry, total displacement, and draft remain unchanged.
Therefore, although previous studies have provided useful understanding of baseline deep-draft cylindrical concepts and conventional damping appendages, the hydrodynamic role of the column boot diameter-to-height ratio remains unclear. This unresolved issue constitutes the main scientific question addressed in the present work and is directly relevant to rational column boot sizing in engineering design.
Motivated by this gap, the present study investigates the influence of the column boot diameter-to-height ratio d/h on the hydrodynamic performance of a deep-draft cylindrical offshore platform under a representative survival sea state in the western South China Sea. To enable a controlled comparison, the main body geometry is unchanged, and the total displacement and draft remain constant for all considered cases. A hybrid numerical framework is adopted. Free-decay simulations are first carried out in STAR-CCM+ 18.06 to identify equivalent linear viscous damping, and potential flow calculations are then performed in ANSYS AQWA within Ansys Workbench 2023 R1 to obtain frequency-dependent hydrodynamic coefficients and RAOs. Based on these results, coupled time-domain simulations including wind, wave, current, and mooring loads are conducted, and the corresponding response spectra are further analyzed. This study focuses on how d/h affects natural periods, motion damping, RAOs, and survival responses and how these effects can be interpreted from both time-domain and frequency-domain perspectives.
The novelty of this work lies not simply in considering the presence of a column boot, but in systematically quantifying the hydrodynamic influence of its diameter-to-height ratio under strict geometric and hydrostatic constraints. Specifically, the study aims to clarify how d/h governs the coupled changes in added inertia, damping, and response characteristics, to identify the differences in d/h sensitivity among key response modes, and to provide design-oriented guidance for selecting column boot dimensions for the considered site conditions.
The remainder of this article is organized as follows. Section 2 introduces the platform model, the parametric definition of d/h, the mooring system, the environmental conditions, and the response acceptance criteria, thereby establishing the material basis and problem setting of the study. Section 3 and Section 4 then present the governing equations, viscous damping modeling, numerical setup, mesh independence analysis, and validation against model test data, which together constitute the methodological framework. On this basis, Section 5 presents and discusses the results in an integrated manner, including both frequency-domain and time-domain analyses, as well as an interpretation of the associated mechanisms, ensuring that physical explanations are provided for each major result. Finally, Section 6 summarizes the main conclusions and outlines directions for future work.

2. Platform Model and Case Definition

2.1. Platform Concept and Configuration

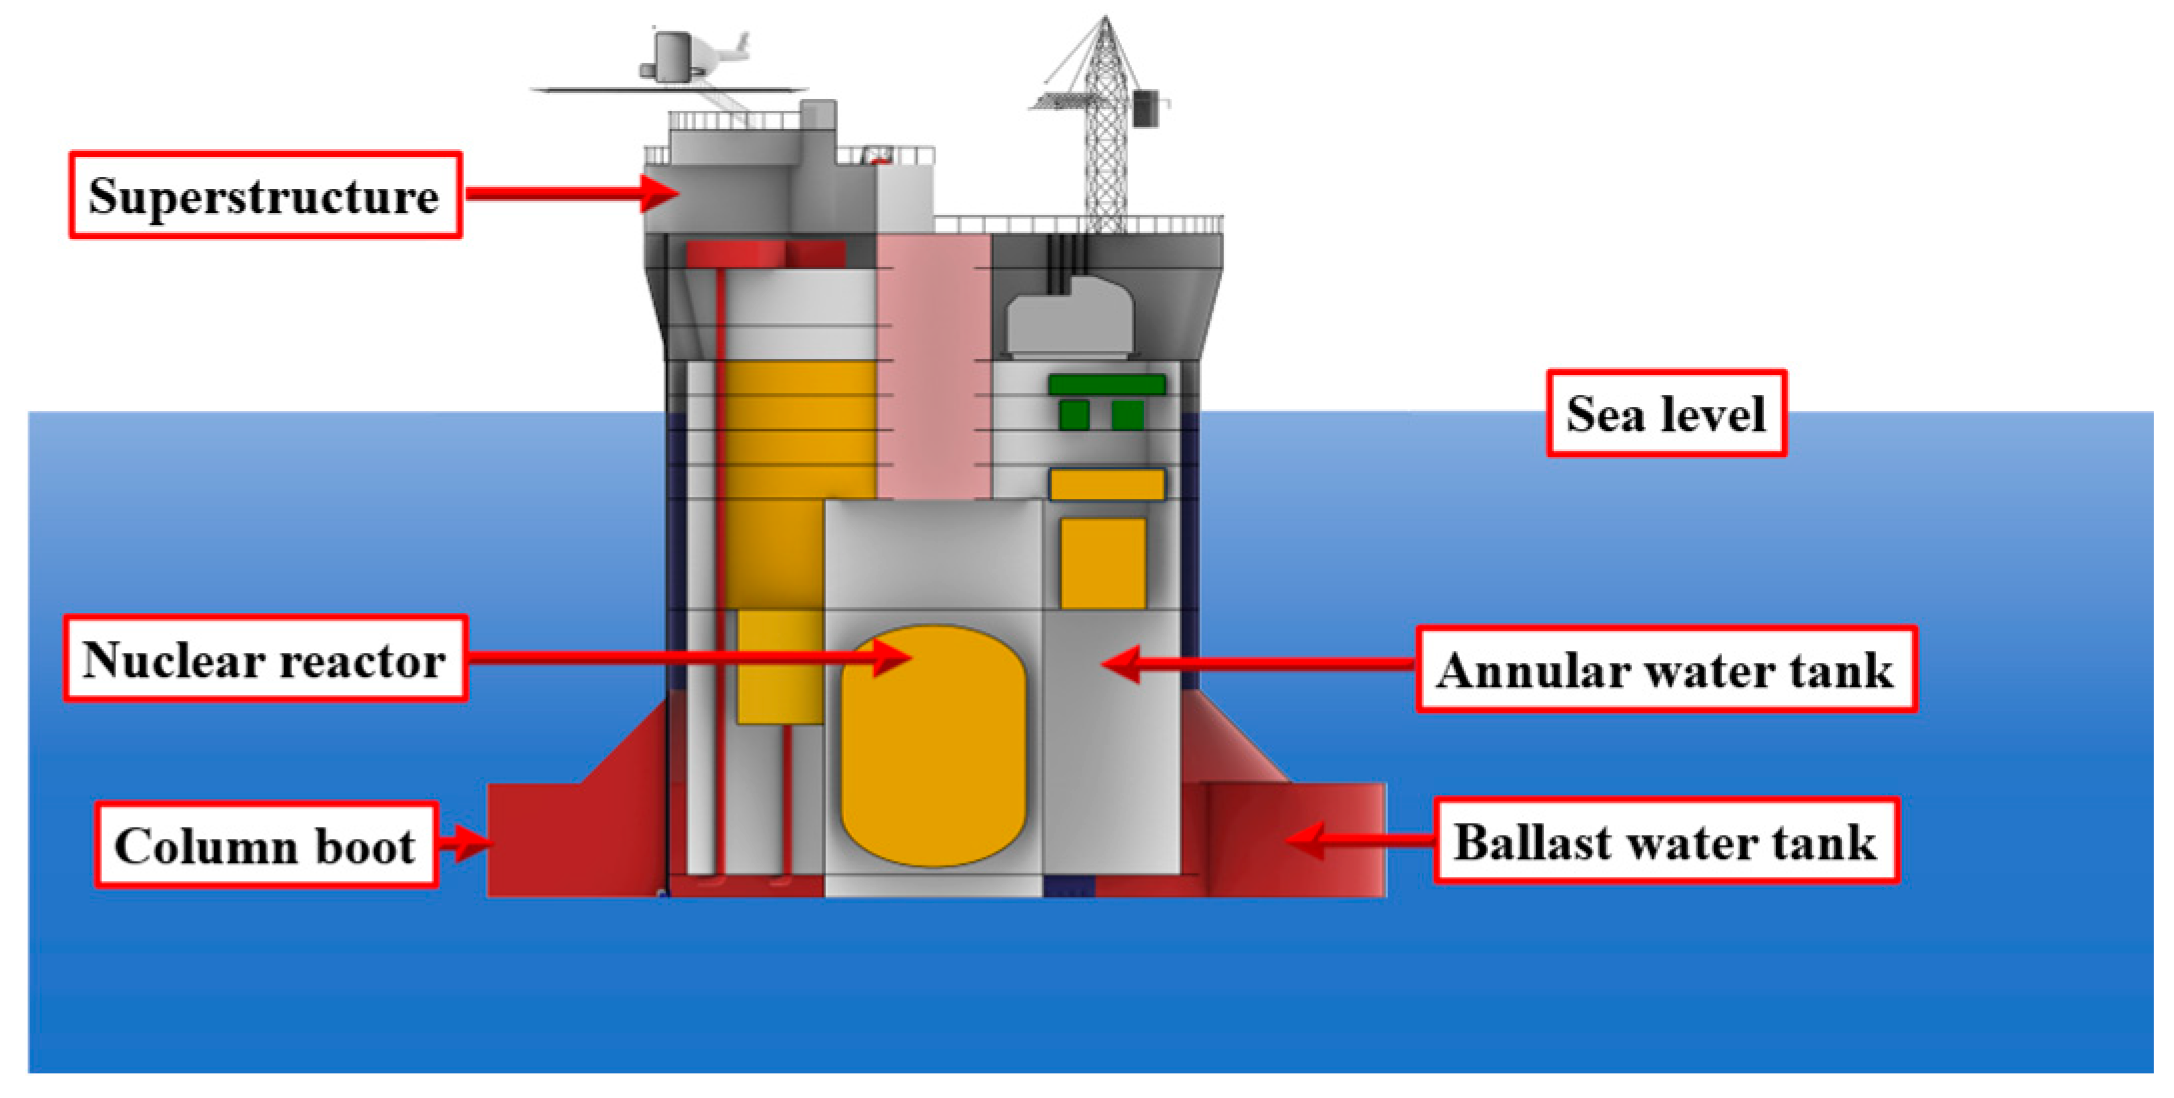
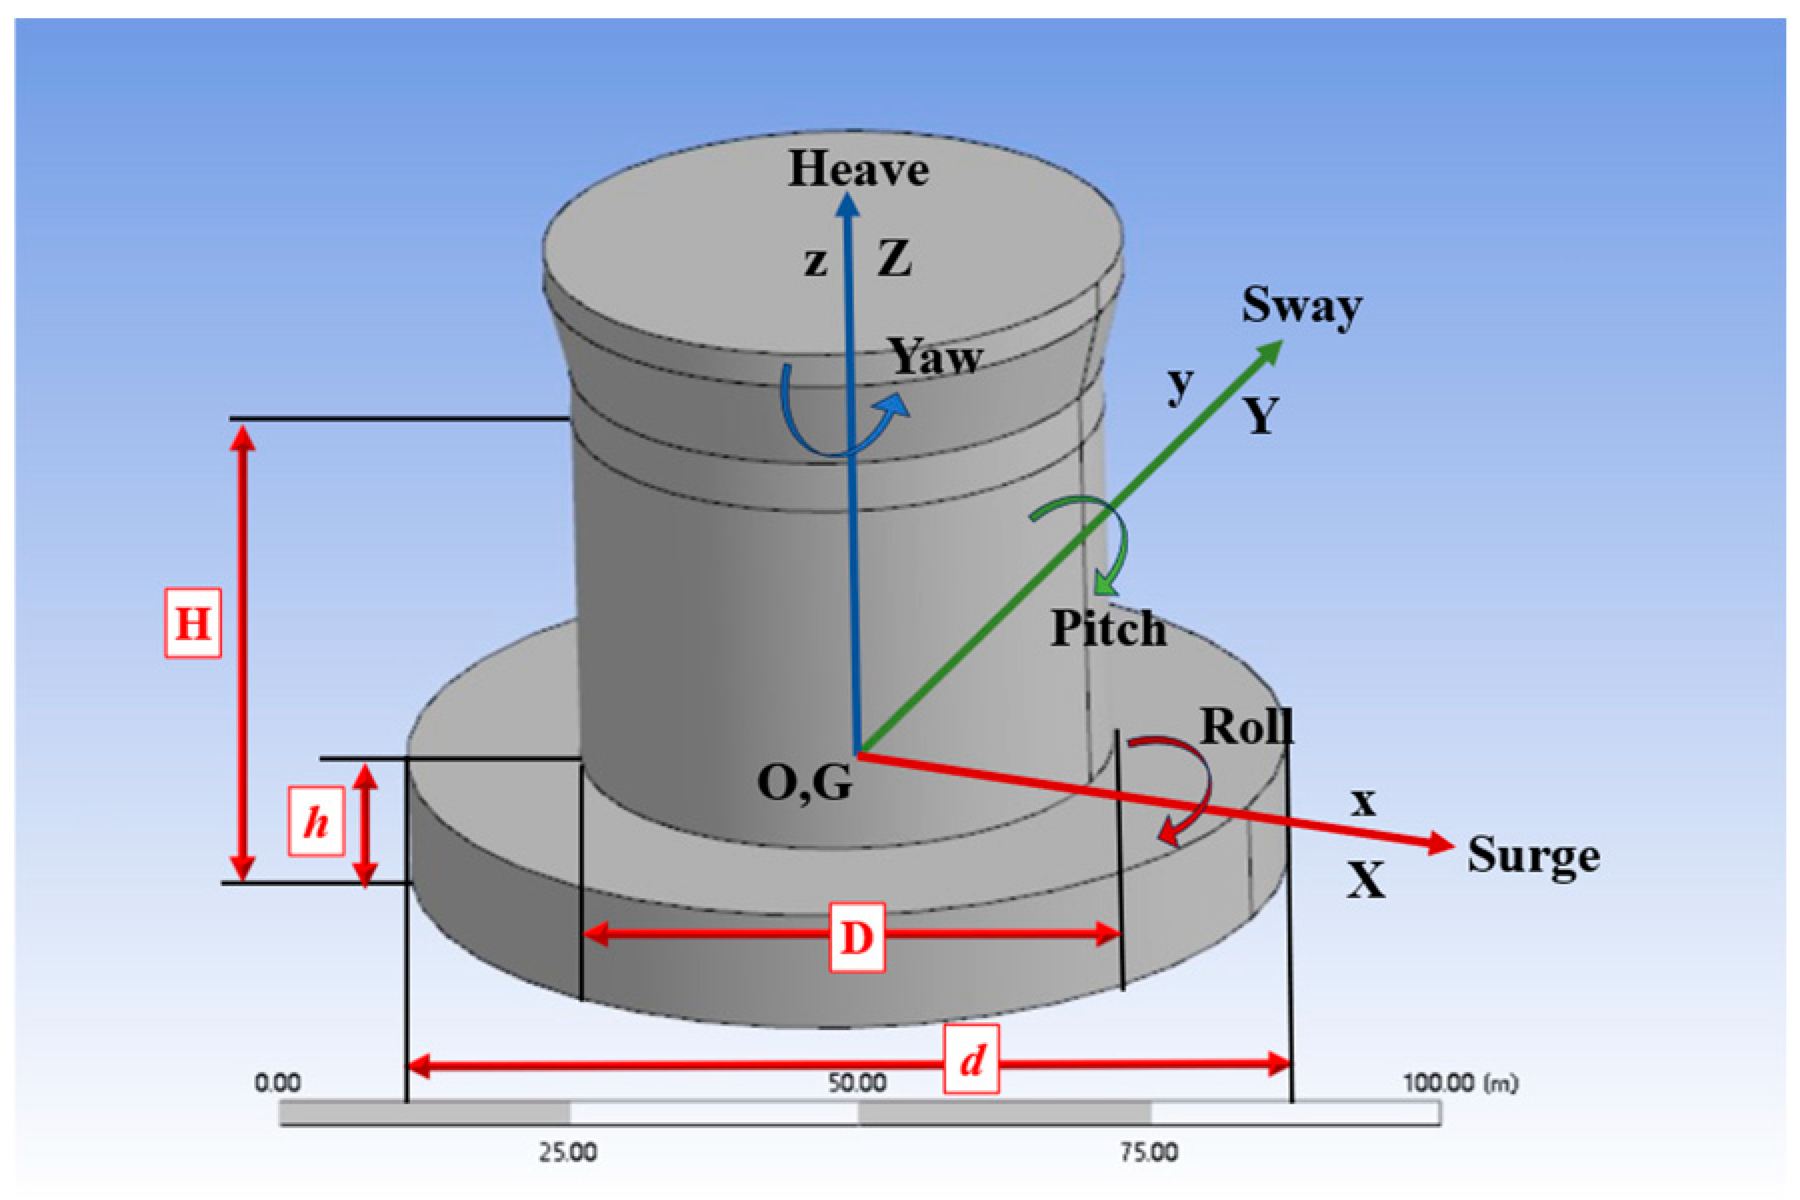
A deep-draft cylindrical offshore nuclear power platform concept, proposed by a research team from Shanghai Jiao Tong University, is considered in this study (Figure 1). The platform features a cylindrical main body, with the reactor pressure vessel located at its bottom. To maximize the utilization of lower temperature seawater for heat dissipation, the platform is designed with a relatively slender main body and a large draft. To improve heave and pitch performance, an annular column boot appendage is arranged at the lower part of the main body. Compared with the damping plates commonly adopted in conventional cylindrical floating production storage and offloading (FPSO) units, the column boot is characterized by a larger scale and a substantial vertical extent. Ballast water tanks are integrated within the column boot region to allow for significant draft adjustment, thereby facilitating transportation by a semi-submersible vessel.

2.2. Parametric Definition of Column Boot d/h and Case Setting

This study investigates the influence of the column boot diameter-to-height ratio (d/h) on the hydrodynamic performance of a deep-draft cylindrical offshore platform, with particular emphasis on the controlled variation in column boot geometry under constant displacement and draft conditions. The baseline geometry and main particulars follow the deep-draft cylindrical offshore nuclear power platform developed by the Shanghai Jiao Tong University team [14], as summarized in Figure 1 and Table 1. To enable a controlled parametric study, the column boot geometry is simplified while the main body is kept unchanged (Figure 2).
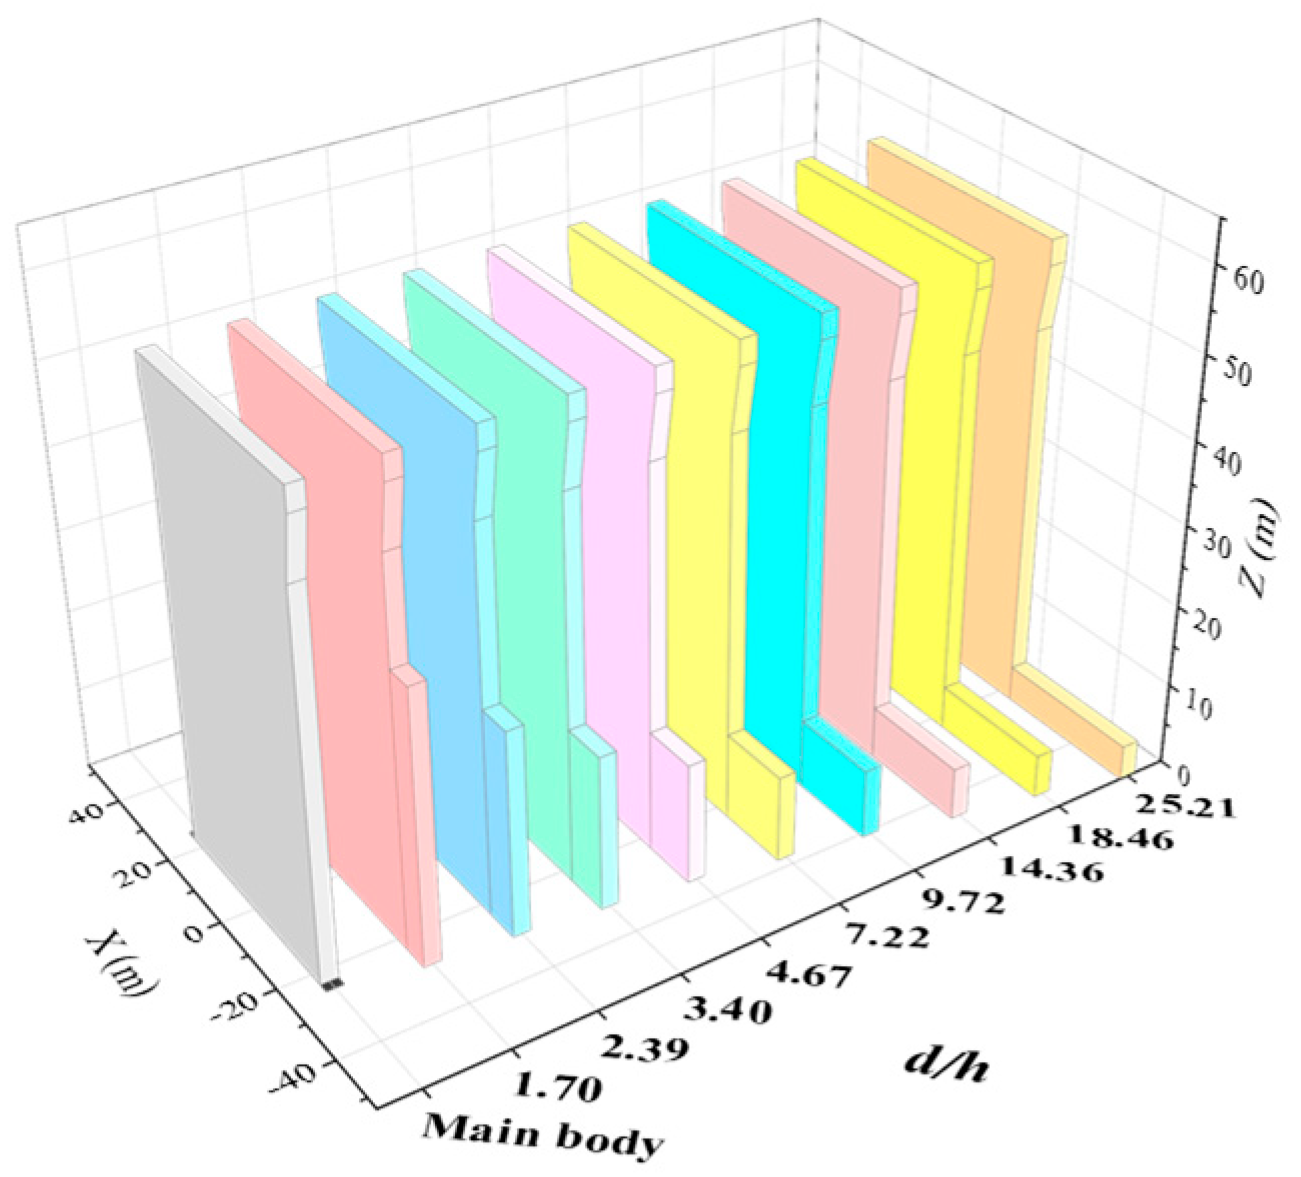
A series of platforms are generated by varying only the column boot d/h ratio while keeping the total platform displacement and draft constant (Figure 3). To enable this controlled parametric study, the column boot is idealized as an annular cylindrical appendage with constant volume and uniformly distributed mass, which is consistent with its primary function as a ballast tank region and facilitates the estimation of the pitch radius of gyration for each case. This simplification is applied consistently across all platforms without changing the displacement or draft conditions of the parametric cases. A main body model without the column boot is also established as a reference to quantify the anti-motion effectiveness of the appendage. The detailed case list is provided in Table 2.

2.3. Coordinate Systems and Motion Definitions

As shown in Figure 2, an earth-fixed coordinate system O-xyz is used to define the directions of environmental loads. A body-fixed coordinate system G-XYZ, attached to the platform, is employed to describe the six-degree-of-freedom motions, including three translations (surge, sway, and heave) and three rotations (roll, pitch, and yaw). At the initial equilibrium position, the two coordinate systems coincide and share the origin at the platform’s center of gravity. The positive directions of translations and rotations follow the right-hand convention.

2.4. Mooring System Layout and Properties

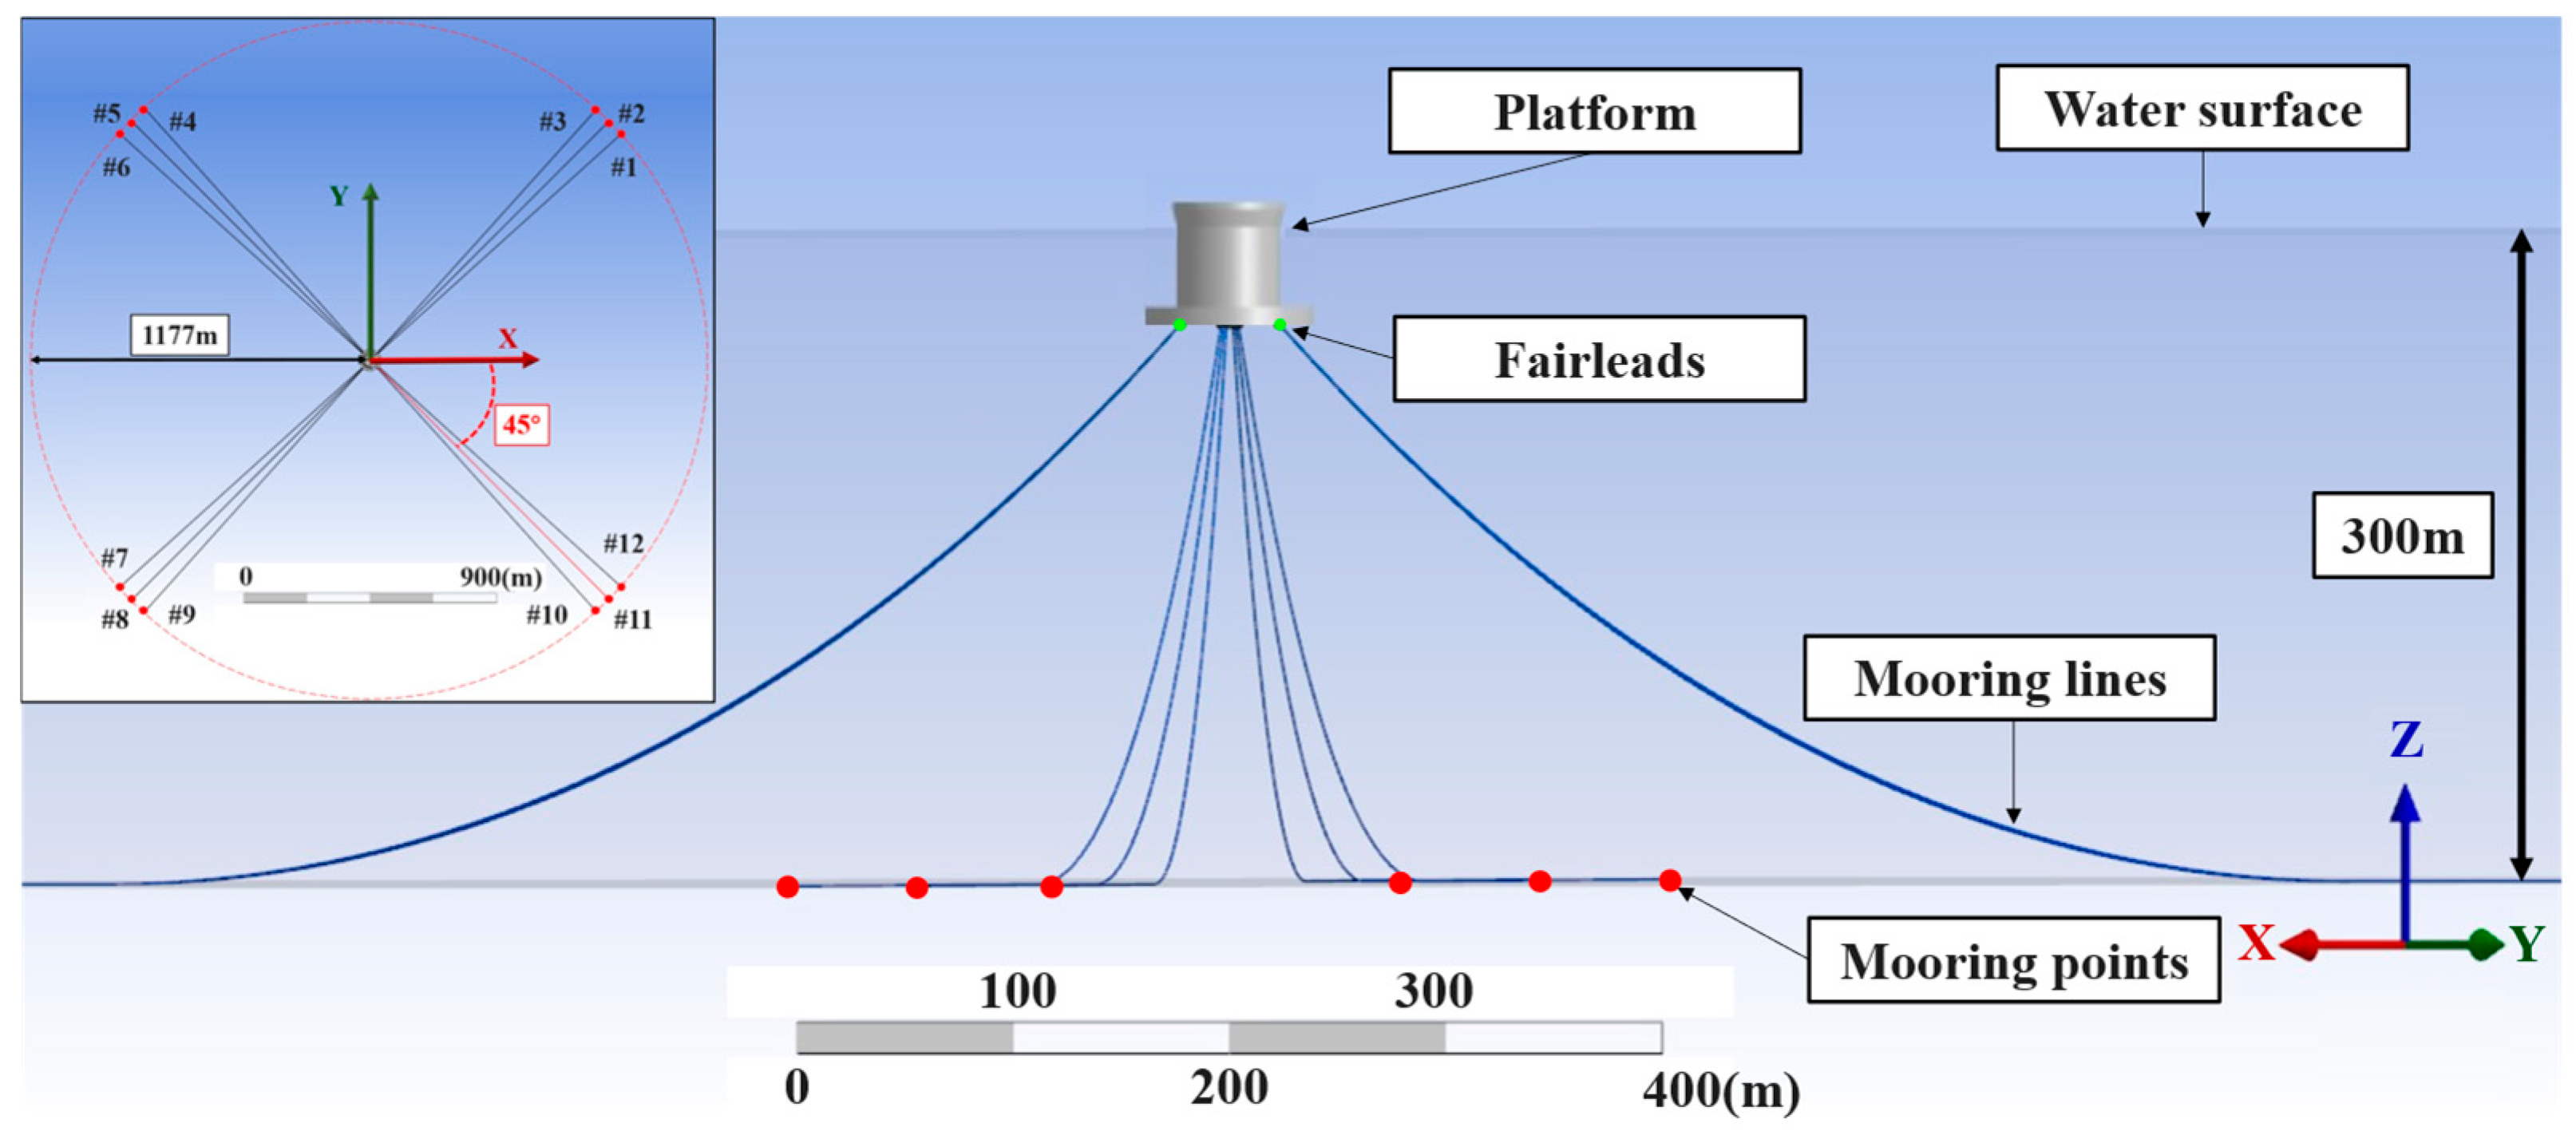
The platform is station-kept by a 4 × 3 grouped mooring system, four azimuthal line groups with three lines per group, resulting in a total of twelve chain mooring lines. The fairleads are located near the bottom of the main body. The mooring radius is 1177 m. To ensure a fair comparison among different d/h cases, an identical mooring configuration and the same line properties are applied to all platforms. The main line parameters are summarized in Table 3 and the mooring layout and coordinate orientation are illustrated in Figure 4.

2.5. Survival Sea State Environmental Conditions

The target deployment site is located in the western South China Sea, with a water depth of 300 m. Based on regional observations and reported environmental studies [15,16], the survival (1-in-100-year) wind, wave, and current conditions are defined. Irregular waves are represented by the JONSWAP spectrum, and the spectral parameters are calibrated following Liu’s research [17]. The wind field is modeled using an API wind spectrum. Due to the limited availability of depth-resolved current measurements, a linearly sheared (vertically varying) current profile is adopted. The detailed environmental parameters are listed in Table 4. For consistency and to obtain conservative response estimates, wind, wave, and current are applied from the same direction.

2.6. Response Metrics and Design Limits

As dedicated design codes for cylindrical floating nuclear power platforms are not yet available, the response metrics and acceptance limits in this study are established by referencing relevant guidance for similar floating structures and nuclear facility operability criteria. According to the China Classification Society (CCS), the heave amplitude of cylindrical FPSO units should not exceed 3 m. In addition, the allowable horizontal offset is limited to tan 6° times the water depth for a 1-in-100-year sea state [18]. For the present water depth of 300 m, the survival state offset limit therefore becomes 31.5 m. For mooring integrity, the CCS requires that the ratio of the minimum breaking load to the maximum dynamic line tension should exceed the specified safety factor; for survival conditions, a factor of 1.67 is adopted [19]. Nuclear power facilities impose additional limits on platform motions. The American Bureau of Shipping (ABS) indicates that the nuclear reactor safety system can operate normally within 45° roll and 15° pitch [20].
Based on the above references and adopting conservative values, the design limits used in this paper are summarized in Table 5, including the maximum dynamic inclination (represented by pitch), horizontal displacement, heave amplitude, and the mooring safety factor under the survival sea state.

3. Governing Equations and Viscous Damping Modeling

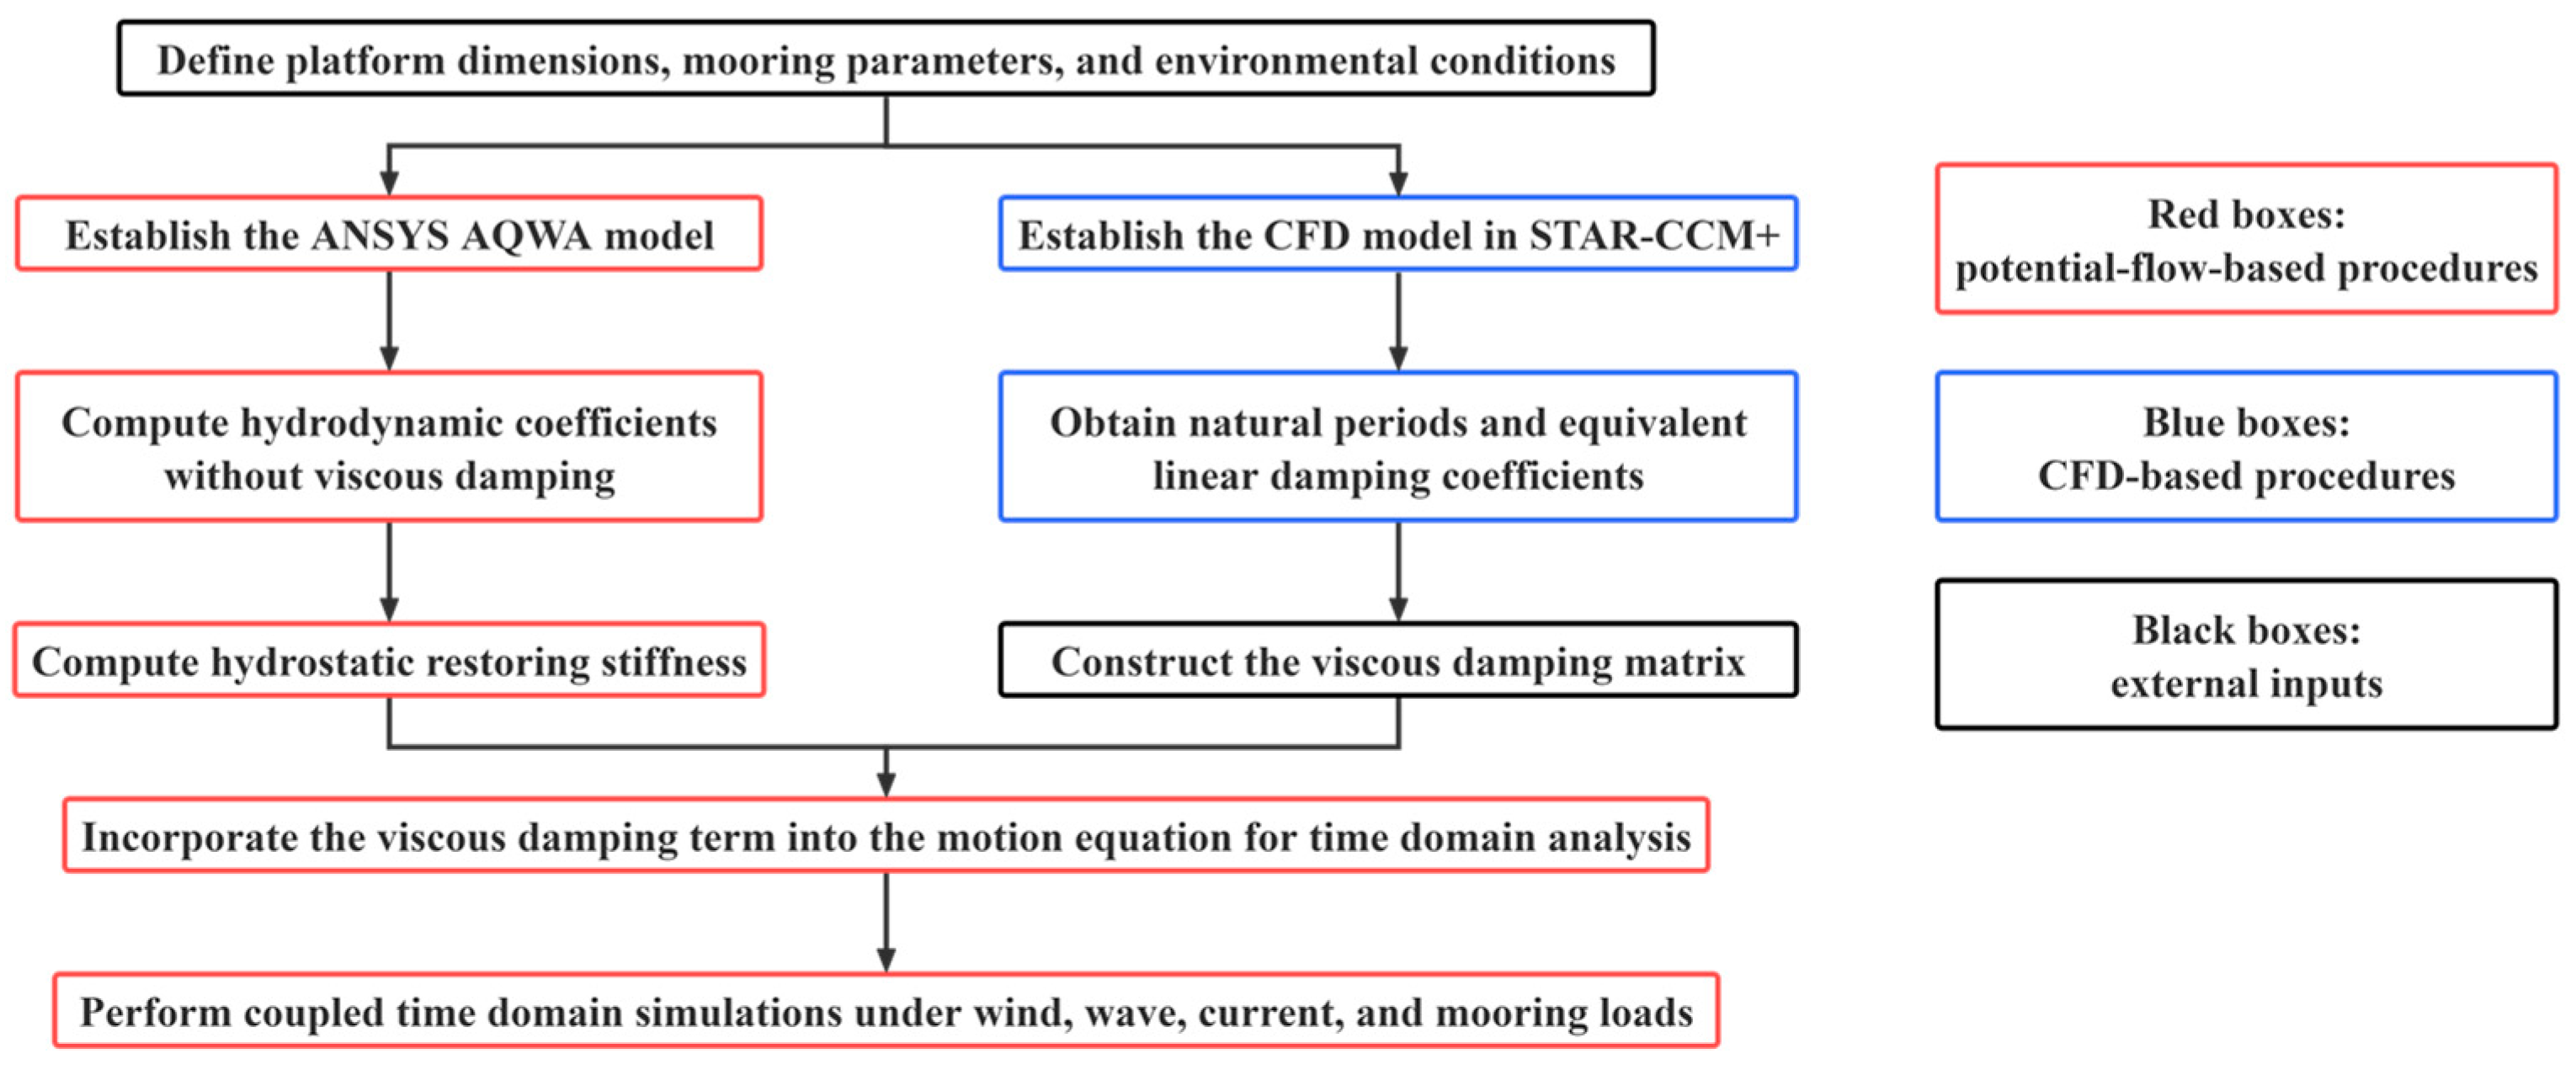
As illustrated in Figure 5, the hydrodynamic analysis framework adopted in this study combines potential flow calculations with viscous flow CFD simulations. First, ANSYS AQWA is used to establish the potential flow model and to compute the main hydrodynamic quantities, including added mass, radiation damping, wave excitation forces, and response amplitude operators. The hydrostatic restoring stiffness is also obtained within this framework. Owing to its high computational efficiency, the potential flow approach is well suited to the present parametric study. However, viscous effects are not explicitly resolved in the potential flow formulation and therefore need to be introduced through an additional damping term. To quantify this viscous contribution, STAR-CCM+ is employed to simulate free-decay motions under viscous flow conditions, from which the natural periods and equivalent linear damping coefficients are identified. These results are then used to construct the viscous damping matrix, which is incorporated into the motion equation for subsequent coupled time-domain simulations under wind, wave, current, and mooring loads. Thus, the left branch of Figure 5 provides the hydrostatic and potential flow hydrodynamic terms, while the right branch provides the viscous damping information derived from CFD free-decay analysis. The two branches are finally coupled through the viscous damping matrix for the subsequent time-domain response calculations.

3.1. Potential Flow Formulation

Within the potential flow framework, the fluid motion in the computational domain is described by a time-dependent velocity potential Φ ( x , y , z , t ) [21]. For an incompressible and irrotational flow, the governing equation reduces to the Laplace equation in the fluid domain:
2 Φ = 2 Φ 2 x 2 + 2 Φ 2 y 2 + 2 Φ 2 z 2 = 0
The velocity potential satisfies the boundary conditions on the body surface, the seabed, and the free surface [22]. Following the classical formulation, the total potential is decomposed into incident, diffraction, and radiation components [23]. Based on the solved potentials, hydrodynamic coefficients such as added mass, radiation damping, and wave excitation coefficients are obtained, together with the response amplitude operators (RAOs).
When wind, wave, and current loads as well as mooring forces are considered, the six-degree-of-freedom motion of the platform can be expressed in the time-domain as follows [24]:
M + Δ M X ¨ + ( B r a d + B v i s ) X ˙ + ( K s t i l l w a t e r + K m o r r i n g ) X = F 1 + F 2 l o w + F 2 h i g h + F w i n d + F c u r r e n t + F o t h e r s
where X ¨ is the acceleration of the platform, X ˙ is the velocity of the platform, X is the displacement of the platform, M is the mass matrix of the platform, M is the added mass matrix, B r a d is the radiation damping matrix, B v i s is the viscous damping matrix, K s t i l l w a t e r is the hydrostatic stiffness, K m o o r i n g is the mooring stiffness , F 1 is the first-order wave frequency load, F 2 l o w is the second-order low-frequency load, F 2 h i g h is the second-order high-frequency load, F w i n d is the wind load, F c u r r e n t is the current load, and F o t h e r s represents other external loads.

3.2. Equivalent Linear Viscous Damping

As potential flow theory does not account for viscosity, an equivalent linear viscous damping term is introduced to improve motion prediction accuracy [25]. For free-decay motions without mooring, the external excitation loads are neglected, and the governing equation reduces to the following:
M + Δ M X ¨ + ( B r a d + B v i s ) X ˙ + K s t i l l w a t e r X = 0
Assuming that viscous damping can be approximated by a linear form around the oscillation amplitude of interest, the equivalent linear damping B 1 is defined as follows:
B 1 = B r a d + B v i s
The critical damping B c r i t for the motion of a floating body at sea can be expressed by the following equation:
B c r i t = 2 M + Δ M K s t i l l w a t e r = 2 M + Δ M w N
where w N is the natural frequency of the platform. The relationship between critical damping and linear damping is as follows:
ζ = B 1 B c r i t
where ζ is the damping ratio, which represents the linear damping as a percentage of the critical damping. The damping ratio can be calculated from the free-decay curve of the platform using the following equation:
ζ = 1 π ln ϕ A 1 ϕ A 2 ,   ϕ A n > ϕ A n + 1
where ϕ A n and ϕ A n + 1 are two successive peak or valley amplitudes, respectively, in the free-decay time history curve.
This damping ratio can be obtained from both model testing and CFD simulations, as demonstrated by Wang’s study [26].

3.3. SST k-ω Turbulence Model for Free-Decay CFD

Viscous free-decay simulations are conducted in STAR-CCM+ to identify the damping characteristics of the platform. The SST k-ω turbulence model is adopted because it provides robust near-wall treatment and has been widely used for separated flows and vortex-dominated motions around offshore floating bodies [27,28]. This model is therefore suitable for capturing the dominant viscous effects that contribute to motion damping under free-decay conditions.

4. Numerical Model Setup and Validation

4.1. Numerical Model Setup

In the present study, a hybrid numerical framework combining CFD and potential flow methods is adopted. The viscous contribution is identified from free-decay simulations in STAR-CCM+, whereas the frequency-dependent hydrodynamic coefficients and long-duration response analyses are carried out in ANSYS AQWA. Within this framework, the damping ratios obtained from the CFD free-decay simulations are converted into equivalent linear viscous damping and then introduced into the subsequent AQWA calculations.
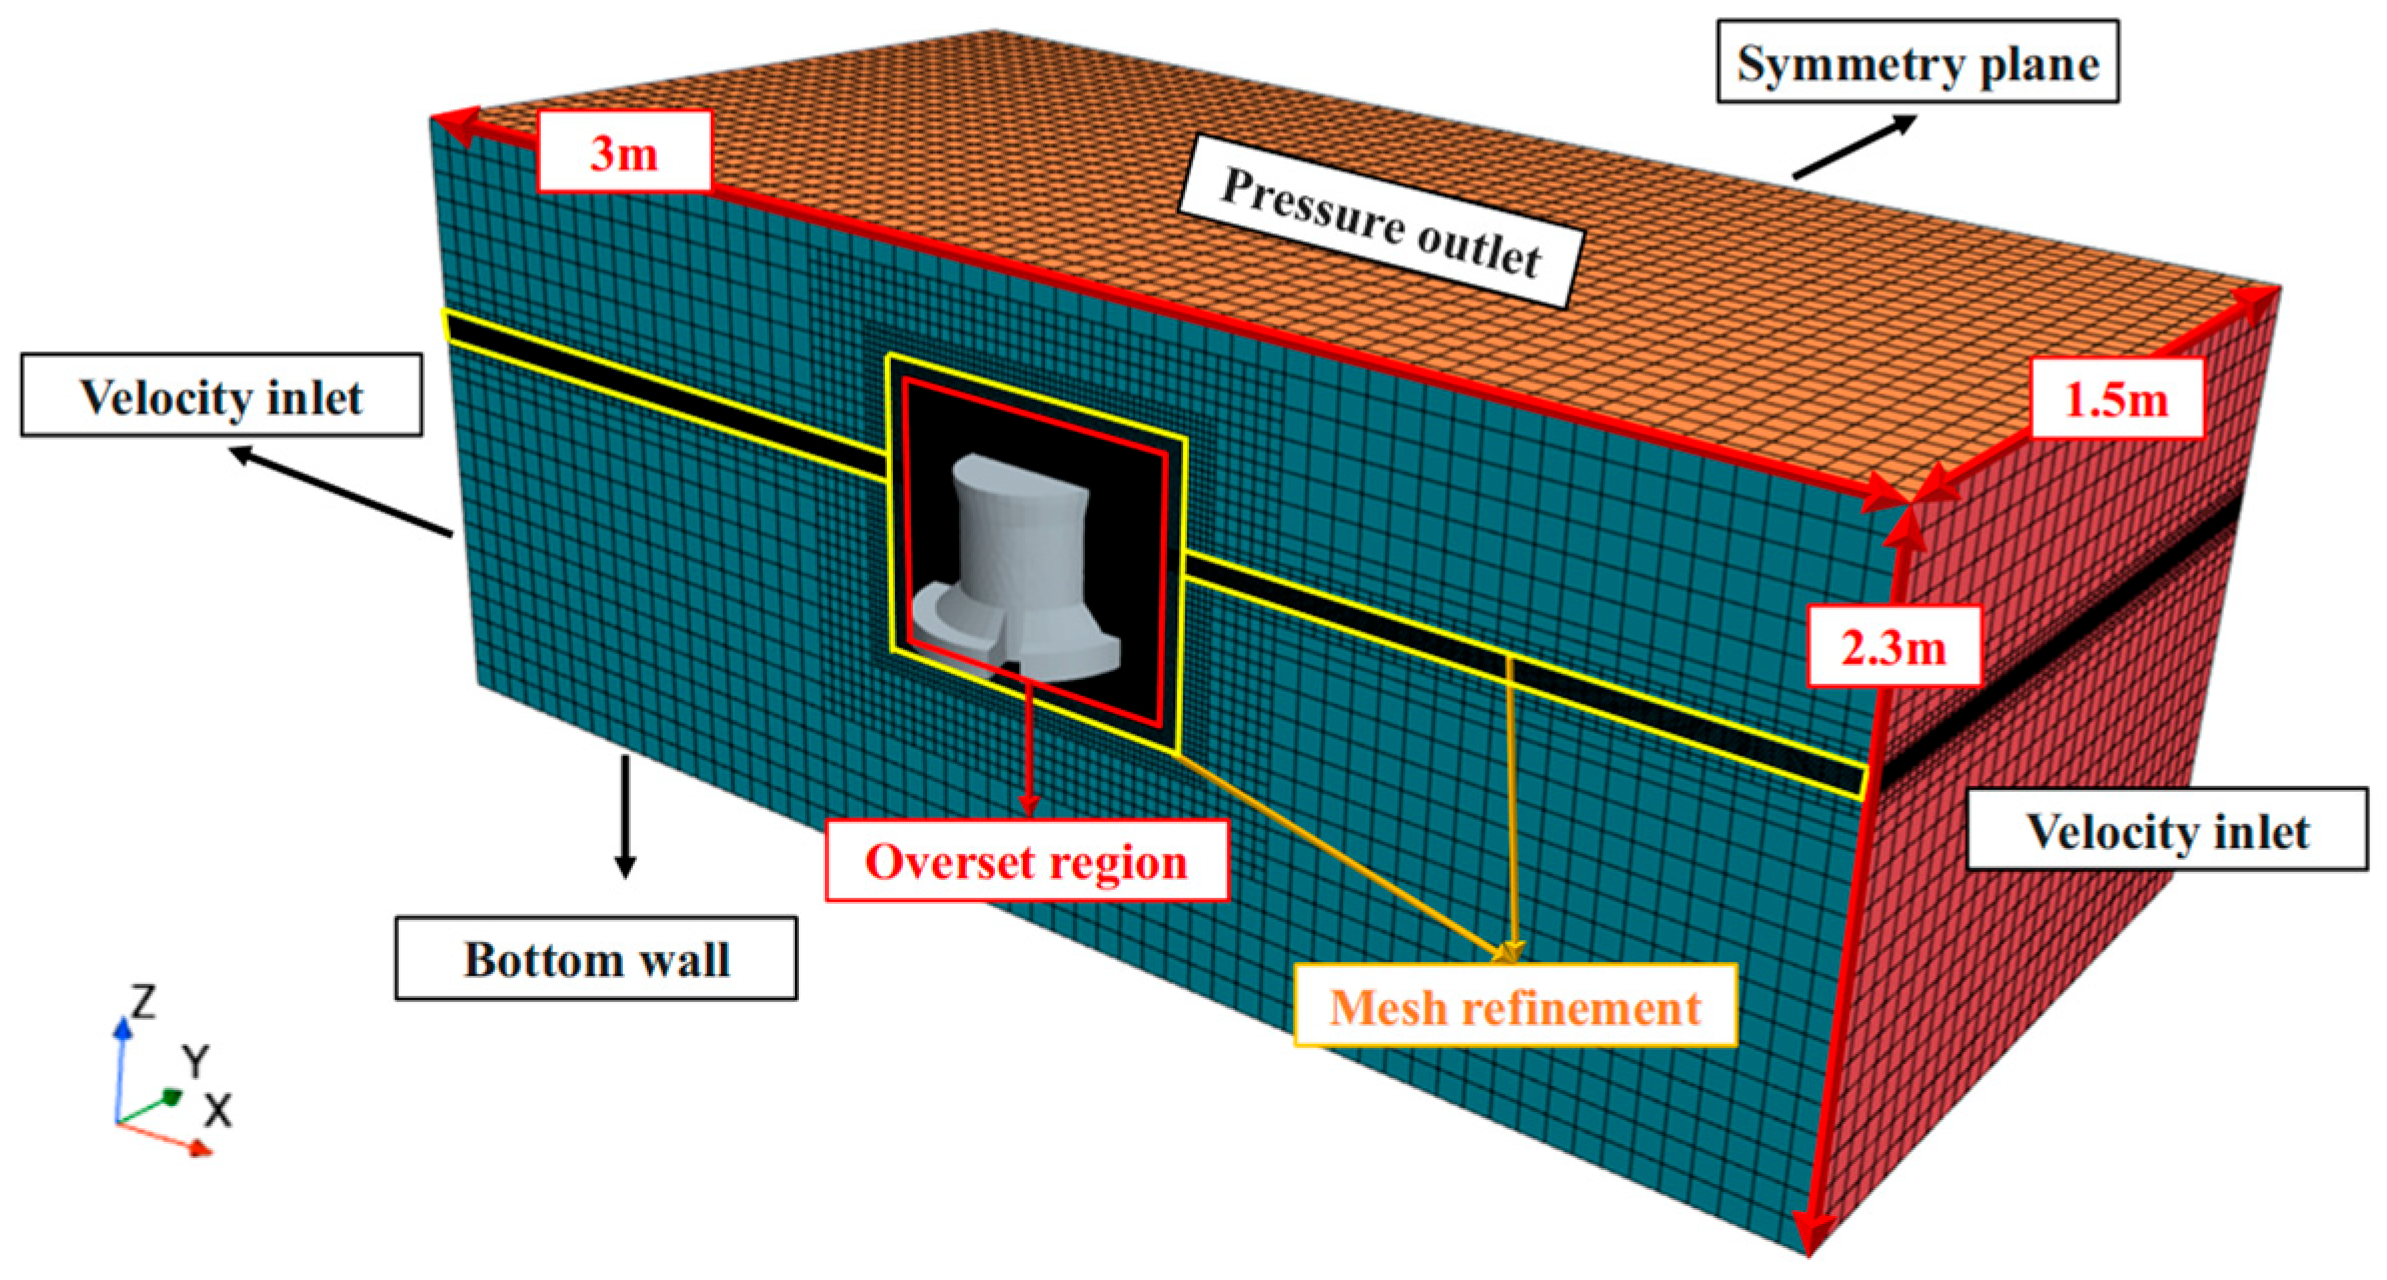
In STAR-CCM+, the platform free-decay motions are simulated under viscous flow conditions to identify the natural periods and damping characteristics of the dominant motion modes. As described in Section 3, the SST k-ω turbulence model is adopted because it provides robust near-wall treatment and is suitable for separated flows and vortex-dominated motions around offshore floating bodies. The CFD model is established using an overset-mesh strategy, in which the computational domain is divided into an overset region surrounding the platform and a background region covering the ambient fluid domain. The platform surface is treated as a wall boundary. The outer boundaries of the overset region are defined as overset interfaces, the top boundary is set as a pressure outlet, the bottom boundary is set as a wall, the front and rear boundaries are specified as velocity inlets, and the lateral boundaries are treated as symmetry planes. Local mesh refinement is applied near the platform surface, around the overset–background transition region, and in the vicinity of the free surface, so as to better resolve the flow separation, vortex evolution, and wave elevation variation associated with the free-decay process. The representative computational domain, boundary conditions, overset region, and local mesh refinement strategy adopted in the STAR-CCM+ free-decay simulations are illustrated in Figure 6. The CFD results are not used directly for long-duration sea state simulations, but rather to determine the equivalent linear damping coefficients required by the hybrid analysis framework.
The potential flow-based hydrodynamic analysis is then carried out in ANSYS AQWA. The mass properties of the full-scale platform, including mass, center of gravity, and radii of gyration, are specified together with the equivalent viscous damping coefficients identified from the CFD simulations. In the AQWA diffraction analysis, the wetted body surface is discretized using a representative panel size of 1 m. The computational domain is set to 3000 m × 3000 m × 300 m, which is consistent with the target water depth and sufficiently large to minimize boundary effects. Wave directions are defined from −180° to 180° with a 15° increment, and wave periods range from 3 s to 60 s with 100 frequency intervals. Based on these settings, the hydrostatic restoring stiffness, added mass, radiation damping, wave excitation forces, and response amplitude operators of the platform are obtained.
Time-domain simulations are subsequently performed in the AQWA Hydrodynamic Response module by incorporating the mooring system together with the prescribed wind, wave, and current conditions. The 4 × 3 grouped mooring layout adopted in the coupled response analysis is shown in Figure 4. Based on the symmetry of the platform and the mooring layout, two representative environmental directions, namely 180° and 225°, are considered in order to obtain conservative estimates of the governing responses. Wind, wave, and current are applied from the same direction. The simulation duration is set to 10,800 s with a time step of 0.1 s to ensure both sufficient simulation duration and adequate time resolution for statistically stable estimates of the survival responses.

4.2. CFD Mesh Independence Analysis

Compared with the potential-flow calculations in AQWA, the CFD free-decay simulations in STAR-CCM+ are much more sensitive to spatial discretization. Therefore, the mesh independence analysis in this study focuses on the CFD model to verify that the predicted natural periods and damping-related response characteristics are not significantly affected by mesh density. By contrast, the AQWA analysis is less sensitive to mesh refinement in the present application, and the adopted panel discretization is already the finest level practically affordable within the current software and computational framework.
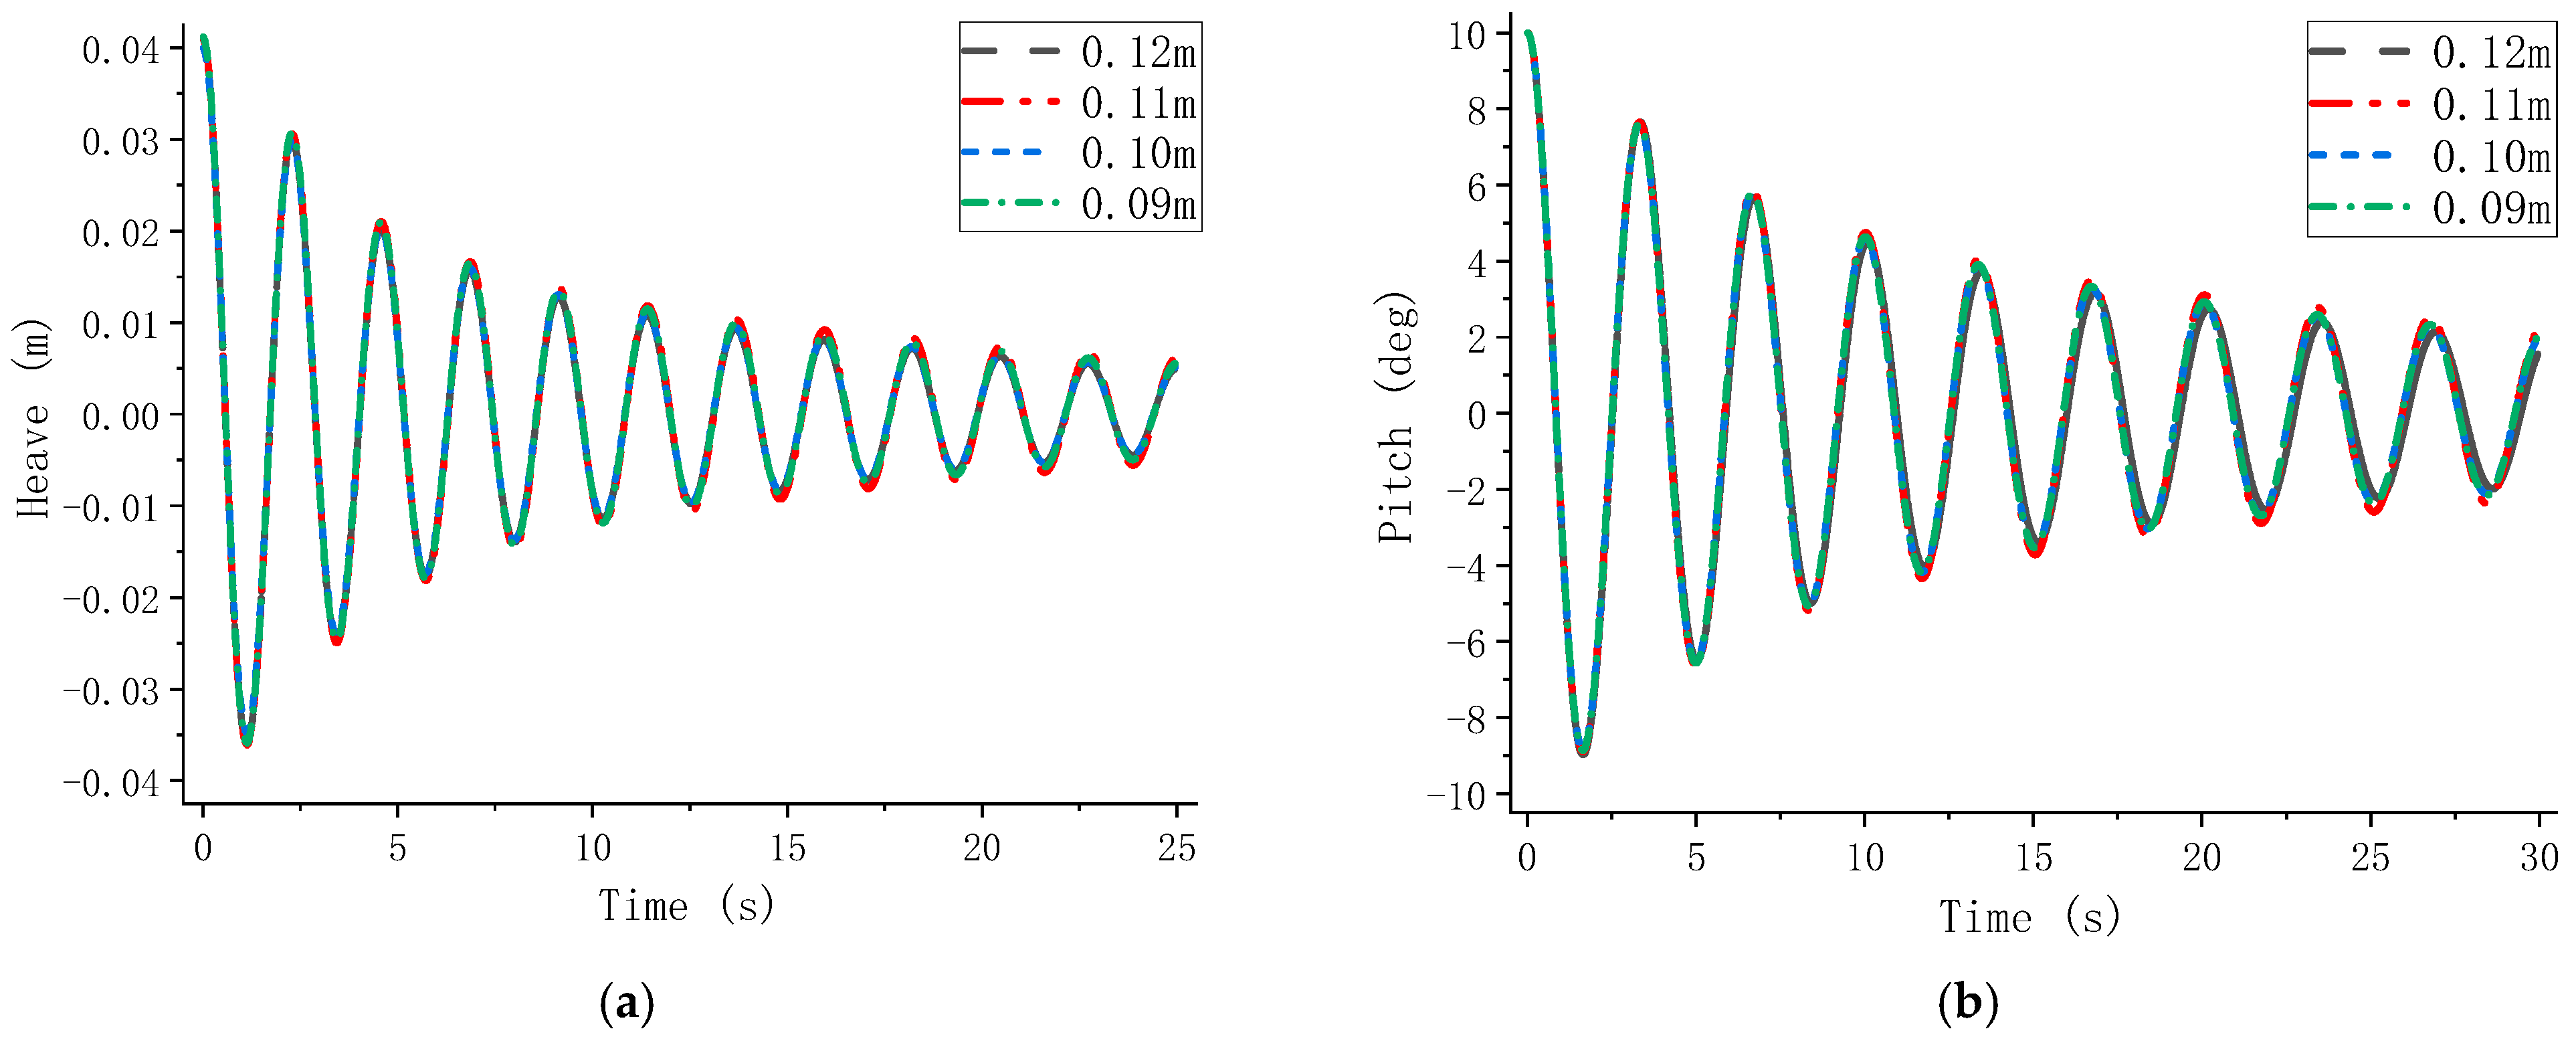
The mesh independence study is performed for the unmoored platform by considering the heave and pitch free-decay motions. The platform geometry used in this analysis corresponds to that of the model test platform reported in Ref. [14], while the mooring system is excluded here so that the influence of spatial discretization on the intrinsic viscous free-decay responses can be assessed more directly. Four basic mesh sizes, namely 0.12 m, 0.11 m, 0.10 m, and 0.09 m, are examined, corresponding to approximately 3.88 million, 4.95 million, 6.36 million, and 8.65 million cells, respectively. For each mesh, the natural periods are extracted from the simulated free-decay time histories, and the convergence of damping-related response characteristics is evaluated by comparing the representative peak amplitudes, taken here as the fifth positive peak.
Figure 7 shows the heave and pitch free-decay responses obtained with different basic mesh sizes, while Table 6 summarizes the corresponding convergence results for the natural periods and representative amplitudes. As the mesh is refined, both the natural periods and the fifth positive peak amplitudes show clear convergence. When the basic mesh size is reduced from 0.12 m to 0.10 m, the differences in the predicted free-decay responses decrease markedly. Compared with the finest mesh case of 0.09 m, the deviations obtained with the 0.10 m mesh remain small for both heave and pitch, indicating that further refinement produces only limited changes in the quantities of interest. This demonstrates that the 0.10 m mesh is sufficiently fine to capture the dominant viscous flow features governing the free-decay responses.
Considering both computational accuracy and efficiency, a basic mesh size of 0.10 m is selected for the CFD simulations in this study, resulting in approximately 6.36 million cells in the computational domain. This mesh resolution is used in the subsequent free-decay calculations for the evaluation of damping-related response characteristics and provides a reliable basis for the hybrid CFD–potential flow analysis presented in the following sections.

4.3. Validation Against Model Tests

The numerical approach is validated against model test results to assess its accuracy in predicting free-decay characteristics and motion response characteristics under wave loading. The validation is based on a 1:40 scale model test of the deep-draft cylindrical offshore platform developed by the Shanghai Jiao Tong University team, conducted in the multifunctional towing tank at the Minhang Campus of Shanghai Jiao Tong University using an equivalent horizontal spring mooring system. The experimental data considered in this paper include still-water free-decay tests and regular-wave tests, from which the natural periods, damping-related response characteristics, and motion RAOs were obtained. In particular, the free-decay validation focuses on the heave and roll modes, whereas the regular-wave validation is carried out for the heave and pitch RAOs, reflecting the availability and quality of the corresponding experimental data. More detailed descriptions of the experimental setup and procedures can be found in Qin et al. [14], whereas the key information required for the present numerical validation is summarized here for completeness.
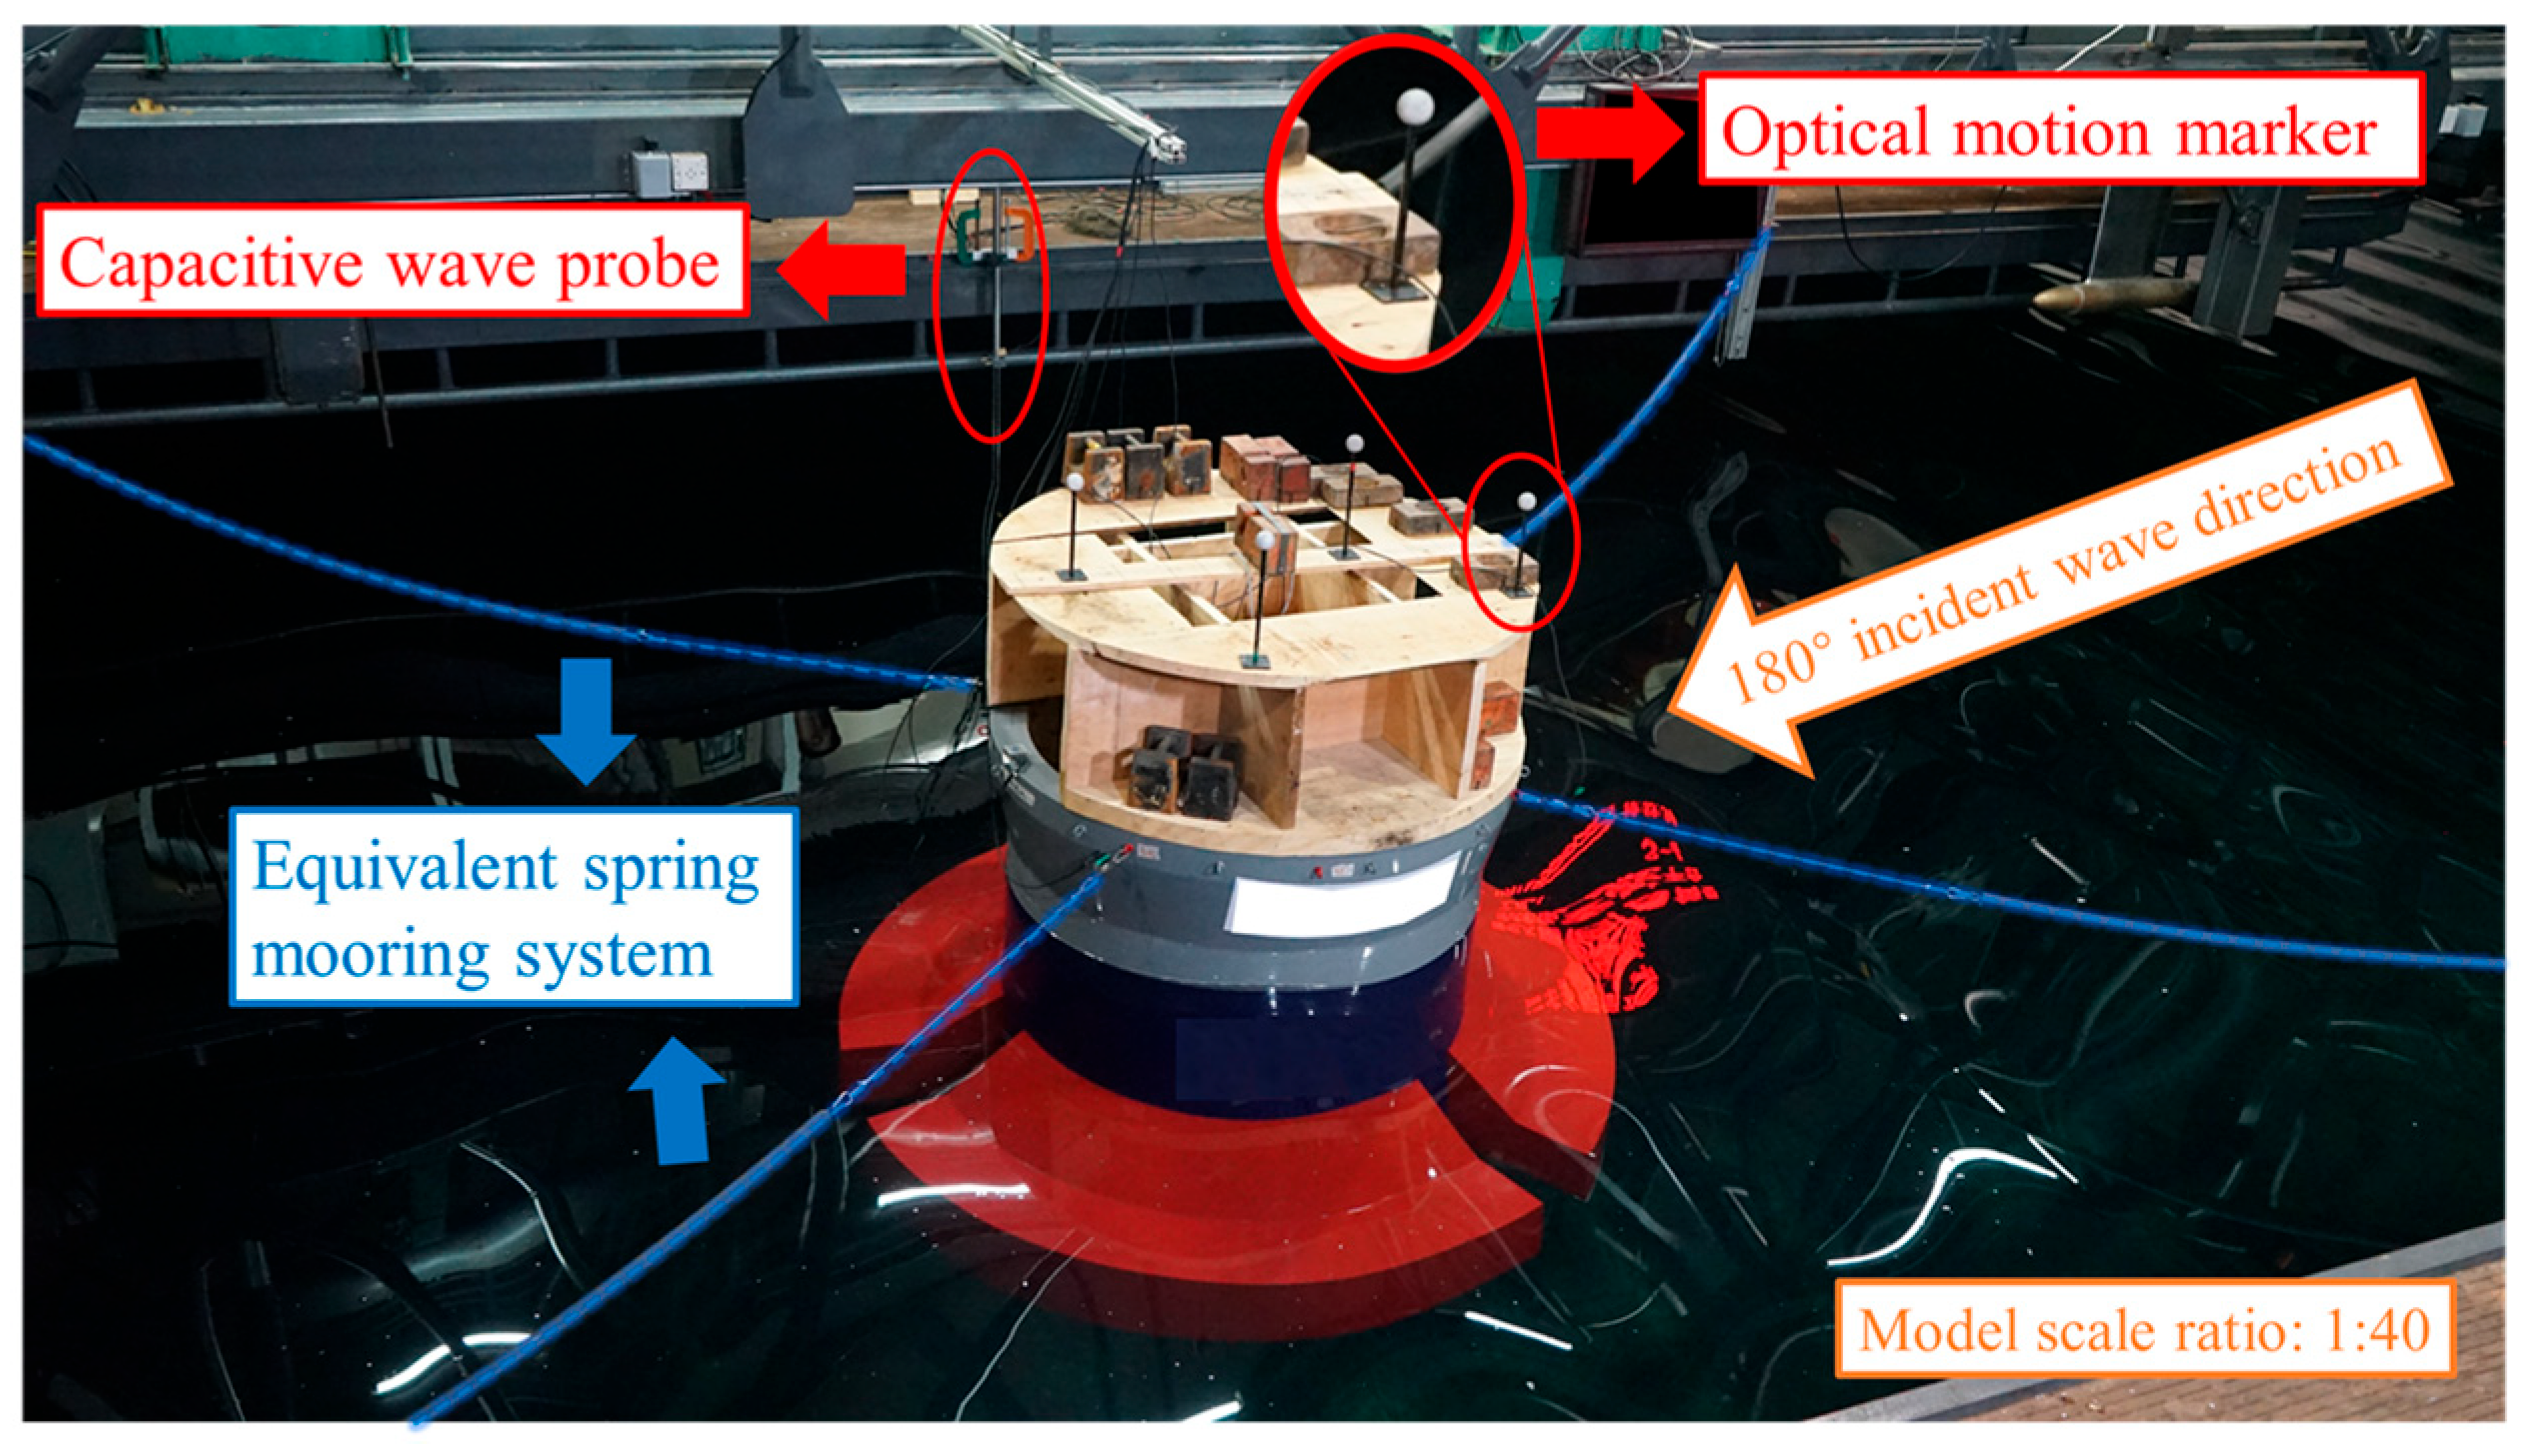
Figure 8 shows the experimental model and measurement arrangement used for validation, including the equivalent spring mooring system, capacitive wave probe, optical motion markers, and the 180° incident wave direction. The model test measured the incident wave elevation, platform motions, and mooring line loads through a calibrated acquisition system. The main measuring instruments included a capacitive wave probe for wave elevation measurement, a non-contact optical motion measurement system for platform motions, and tension sensors for mooring line forces. All measuring instruments were calibrated before testing. According to Qin et al. [14], the motion measurement accuracy, wave probe accuracy, and tension sensor accuracy were of the order of 10 × 10−4 m, 2 × 10⁻³ m, and 10 × 10−3 kg, respectively, which were sufficient for the present validation purpose.
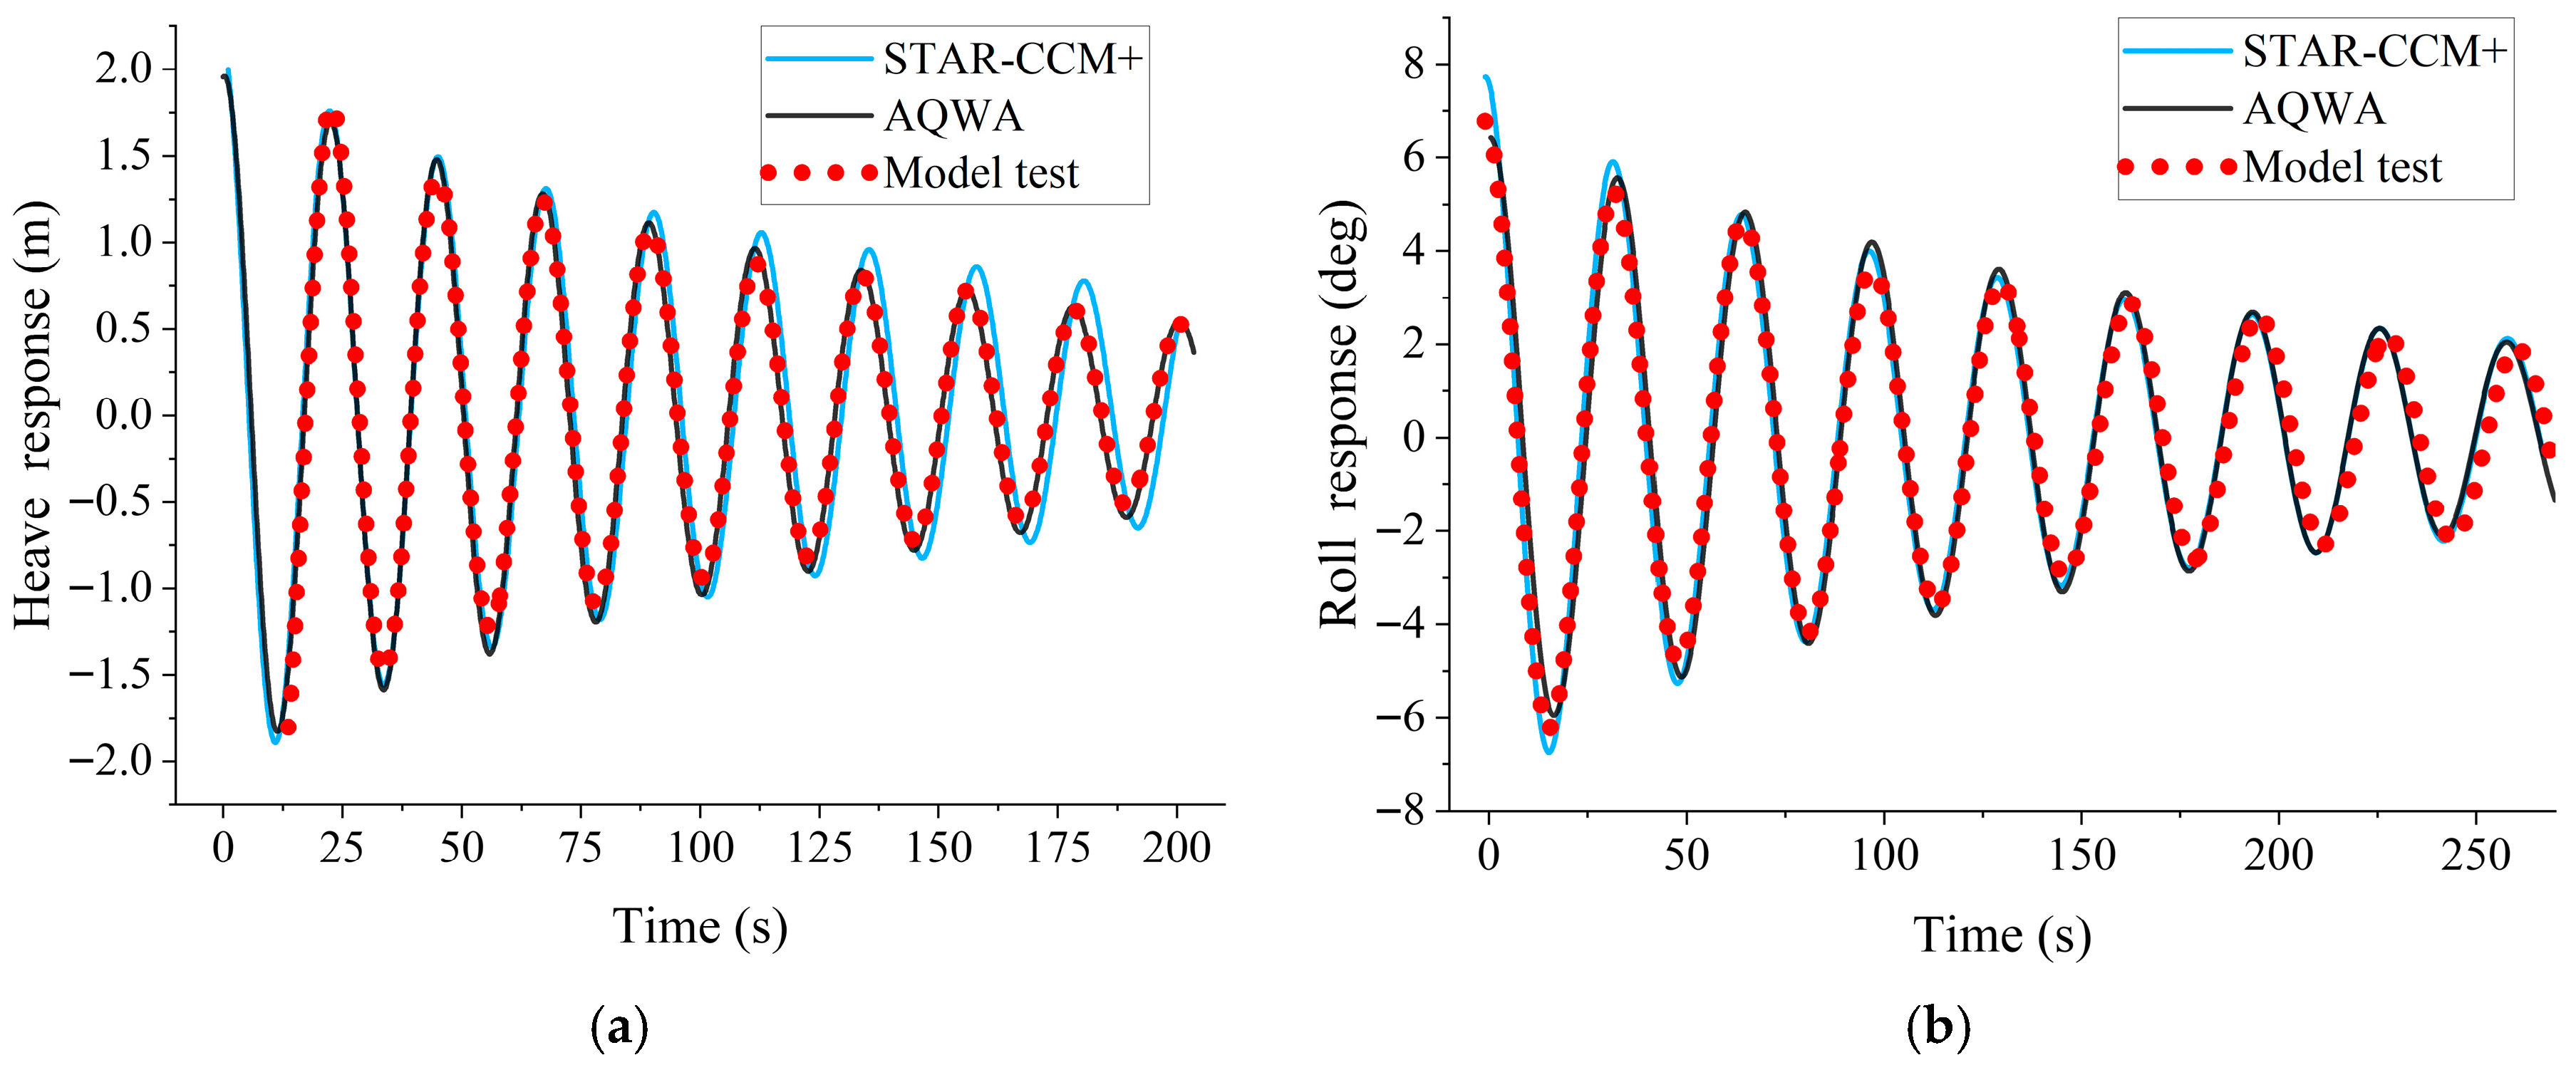
In the still-water free-decay tests, the initial disturbance was generated by an impact-type excitation because the restoring force of the moored model was relatively large, and direct manual release was insufficient to produce a clear initial displacement or rotation. A 20 kg ballast block was lifted by a beam crane and then released rapidly onto the model. For the heave free-decay test, the ballast block was dropped onto the center of the upper surface of the platform model and then immediately lifted away, thereby generating an initial heave displacement. For the roll free-decay test, the ballast block was dropped onto the edge region near the side of the upper surface and then immediately removed, thereby generating an initial roll angle. In the numerical simulations, the initial heave displacement and initial roll angle were set to 4 m and 10 deg in full scale, respectively. For clarity, only the overlapping portions of the experimental and numerical free-decay time histories are presented in Figure 9.
Although the CFD mesh independence analysis in Section 4.2 is carried out for the heave and pitch free-decay motions of the unmoored platform, the model test validation here uses the roll free-decay response instead of pitch because the experimental roll decay records are of better quality and provide a clearer basis for comparison under the moored test condition.
For validation, the measured model test results are compared with the numerical predictions from STAR-CCM+ and AQWA. In Table 7 and Figure 9, STAR-CCM+ denotes the CFD free-decay simulations used to identify damping-related response characteristics, whereas AQWA denotes the potential flow-based numerical predictions. As shown in Table 7 and Figure 9, the predicted natural periods for heave and roll agree well with the experiments, with errors within 1.8%. The STAR-CCM+ free-decay results also show good consistency with the experimental time histories, indicating that the adopted viscous modeling strategy can reasonably capture the dominant damping behavior under the present free-decay conditions.
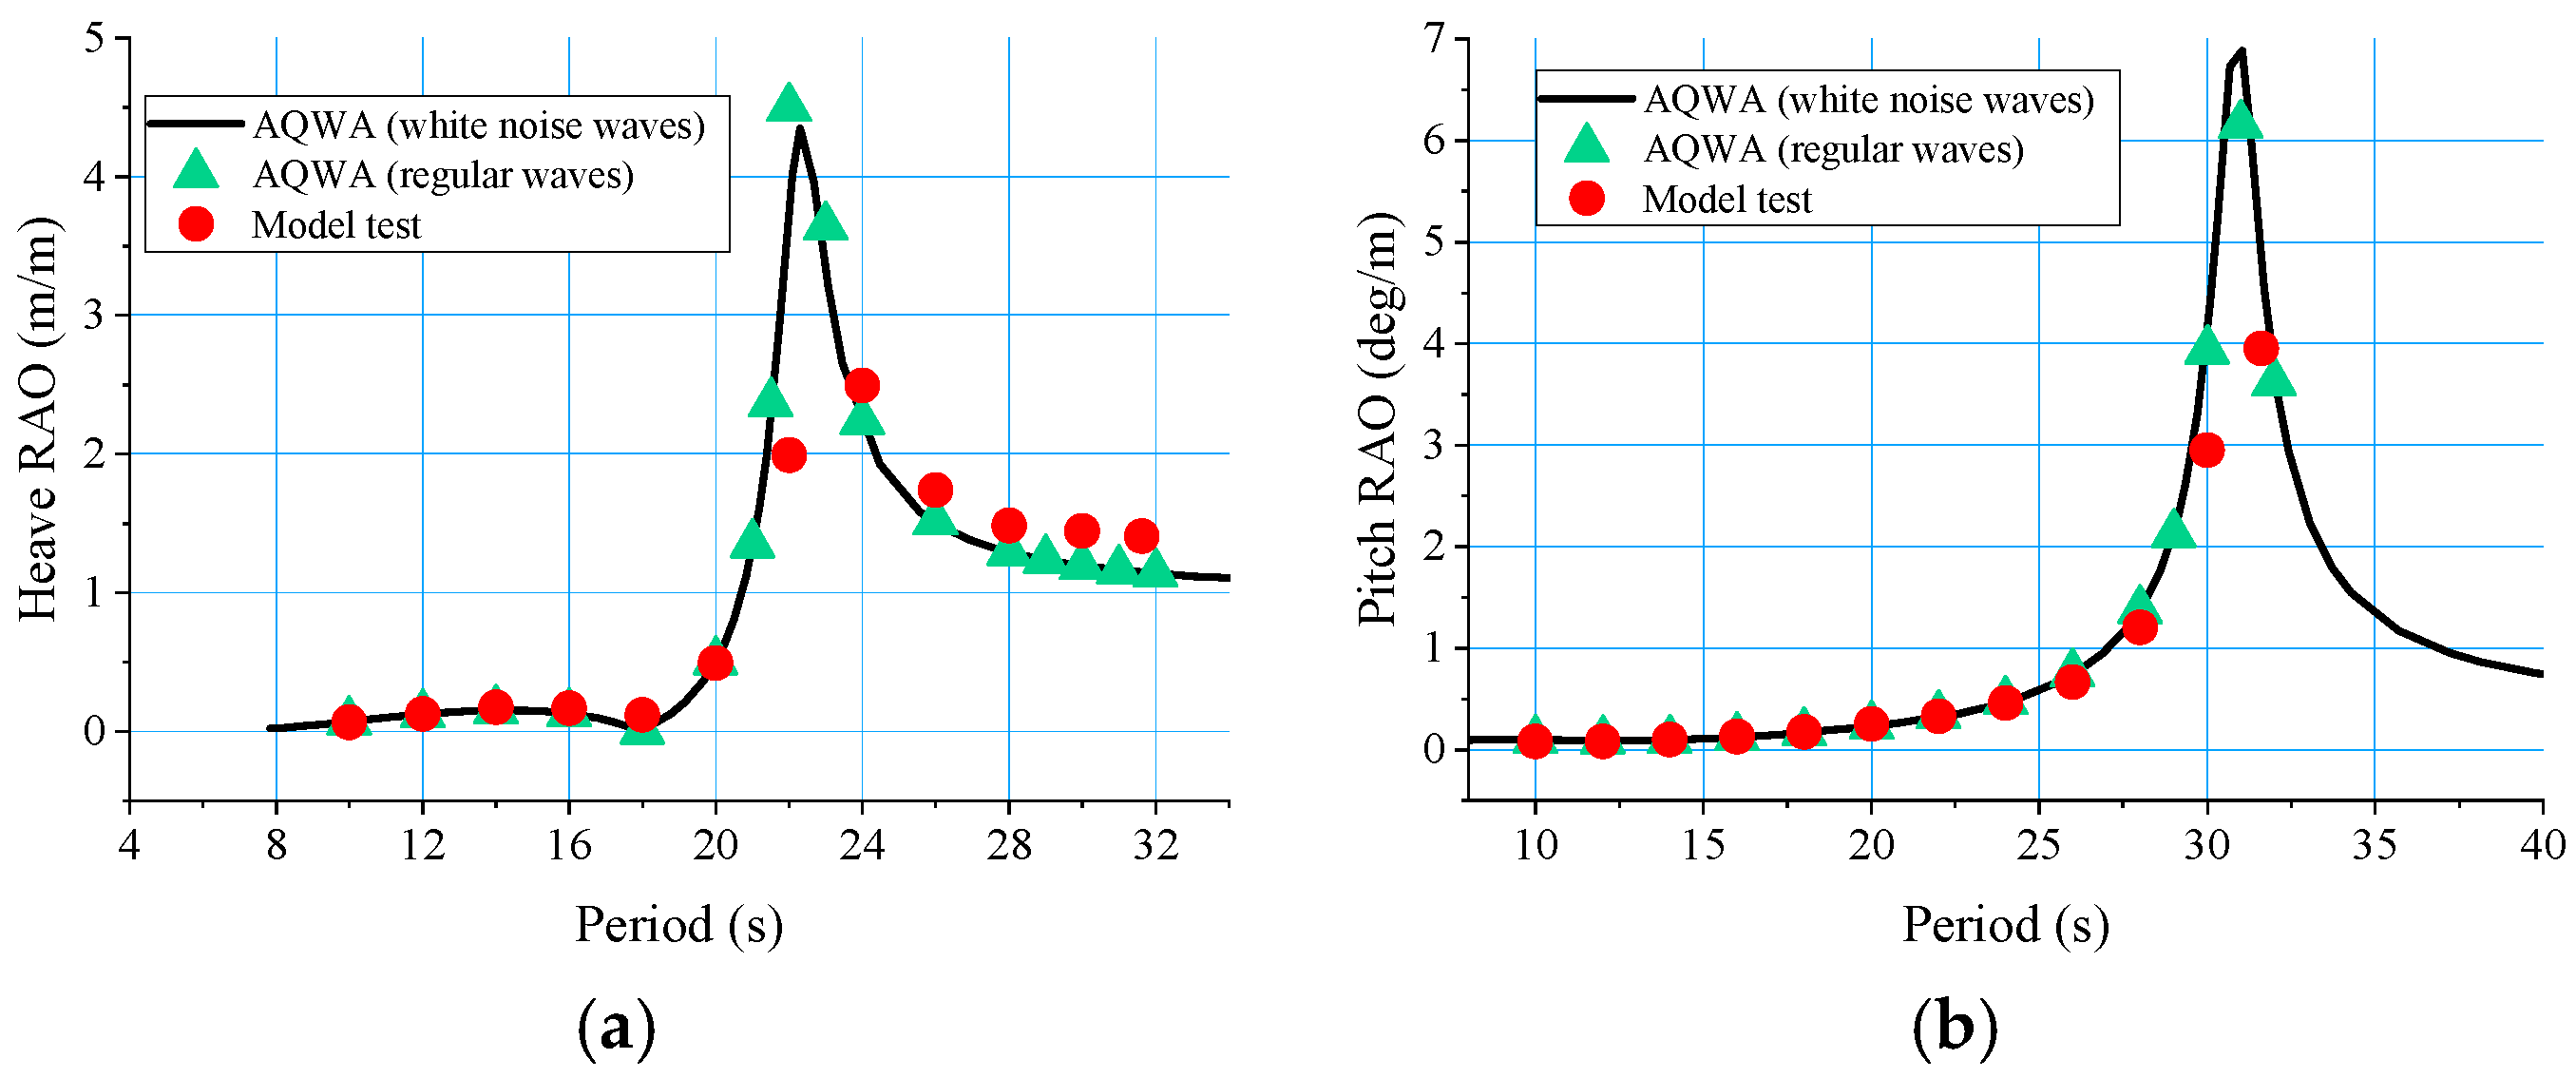
Figure 10 further compares the heave and pitch RAOs from AQWA with the model test results, showing overall good agreement in both peak location and response trend. In these comparisons, the AQWA results are obtained by both regular-wave and white-noise wave simulations. The regular-wave results provide a direct counterpart to the model test data, whereas the white-noise wave results offer a denser frequency representation of the response characteristics. The consistency between these two numerical treatments, together with their agreement with the experiments, further supports the reliability of the adopted validation approach. It is also noted that the numerical results provide a finer frequency resolution around the natural periods, which helps to better capture resonance peaks that may be under-resolved in the experiments due to limited frequency discretization.
Overall, the above comparisons indicate that the adopted numerical approach is sufficiently accurate and reliable for evaluating the hydrodynamic performance of the considered platforms in the present parametric study.

5. Results and Discussion

This section examines how the diameter-to-height ratio of the column boot affects the hydrodynamic performance of the platform. The discussion proceeds from free-decay characteristics to inertia-related parameters, RAO features, and finally to time-domain and spectral responses under the survival sea state, so that the observed trends can be interpreted consistently in both the frequency and time domains.

5.1. Natural Periods and Equivalent Damping Versus d/h

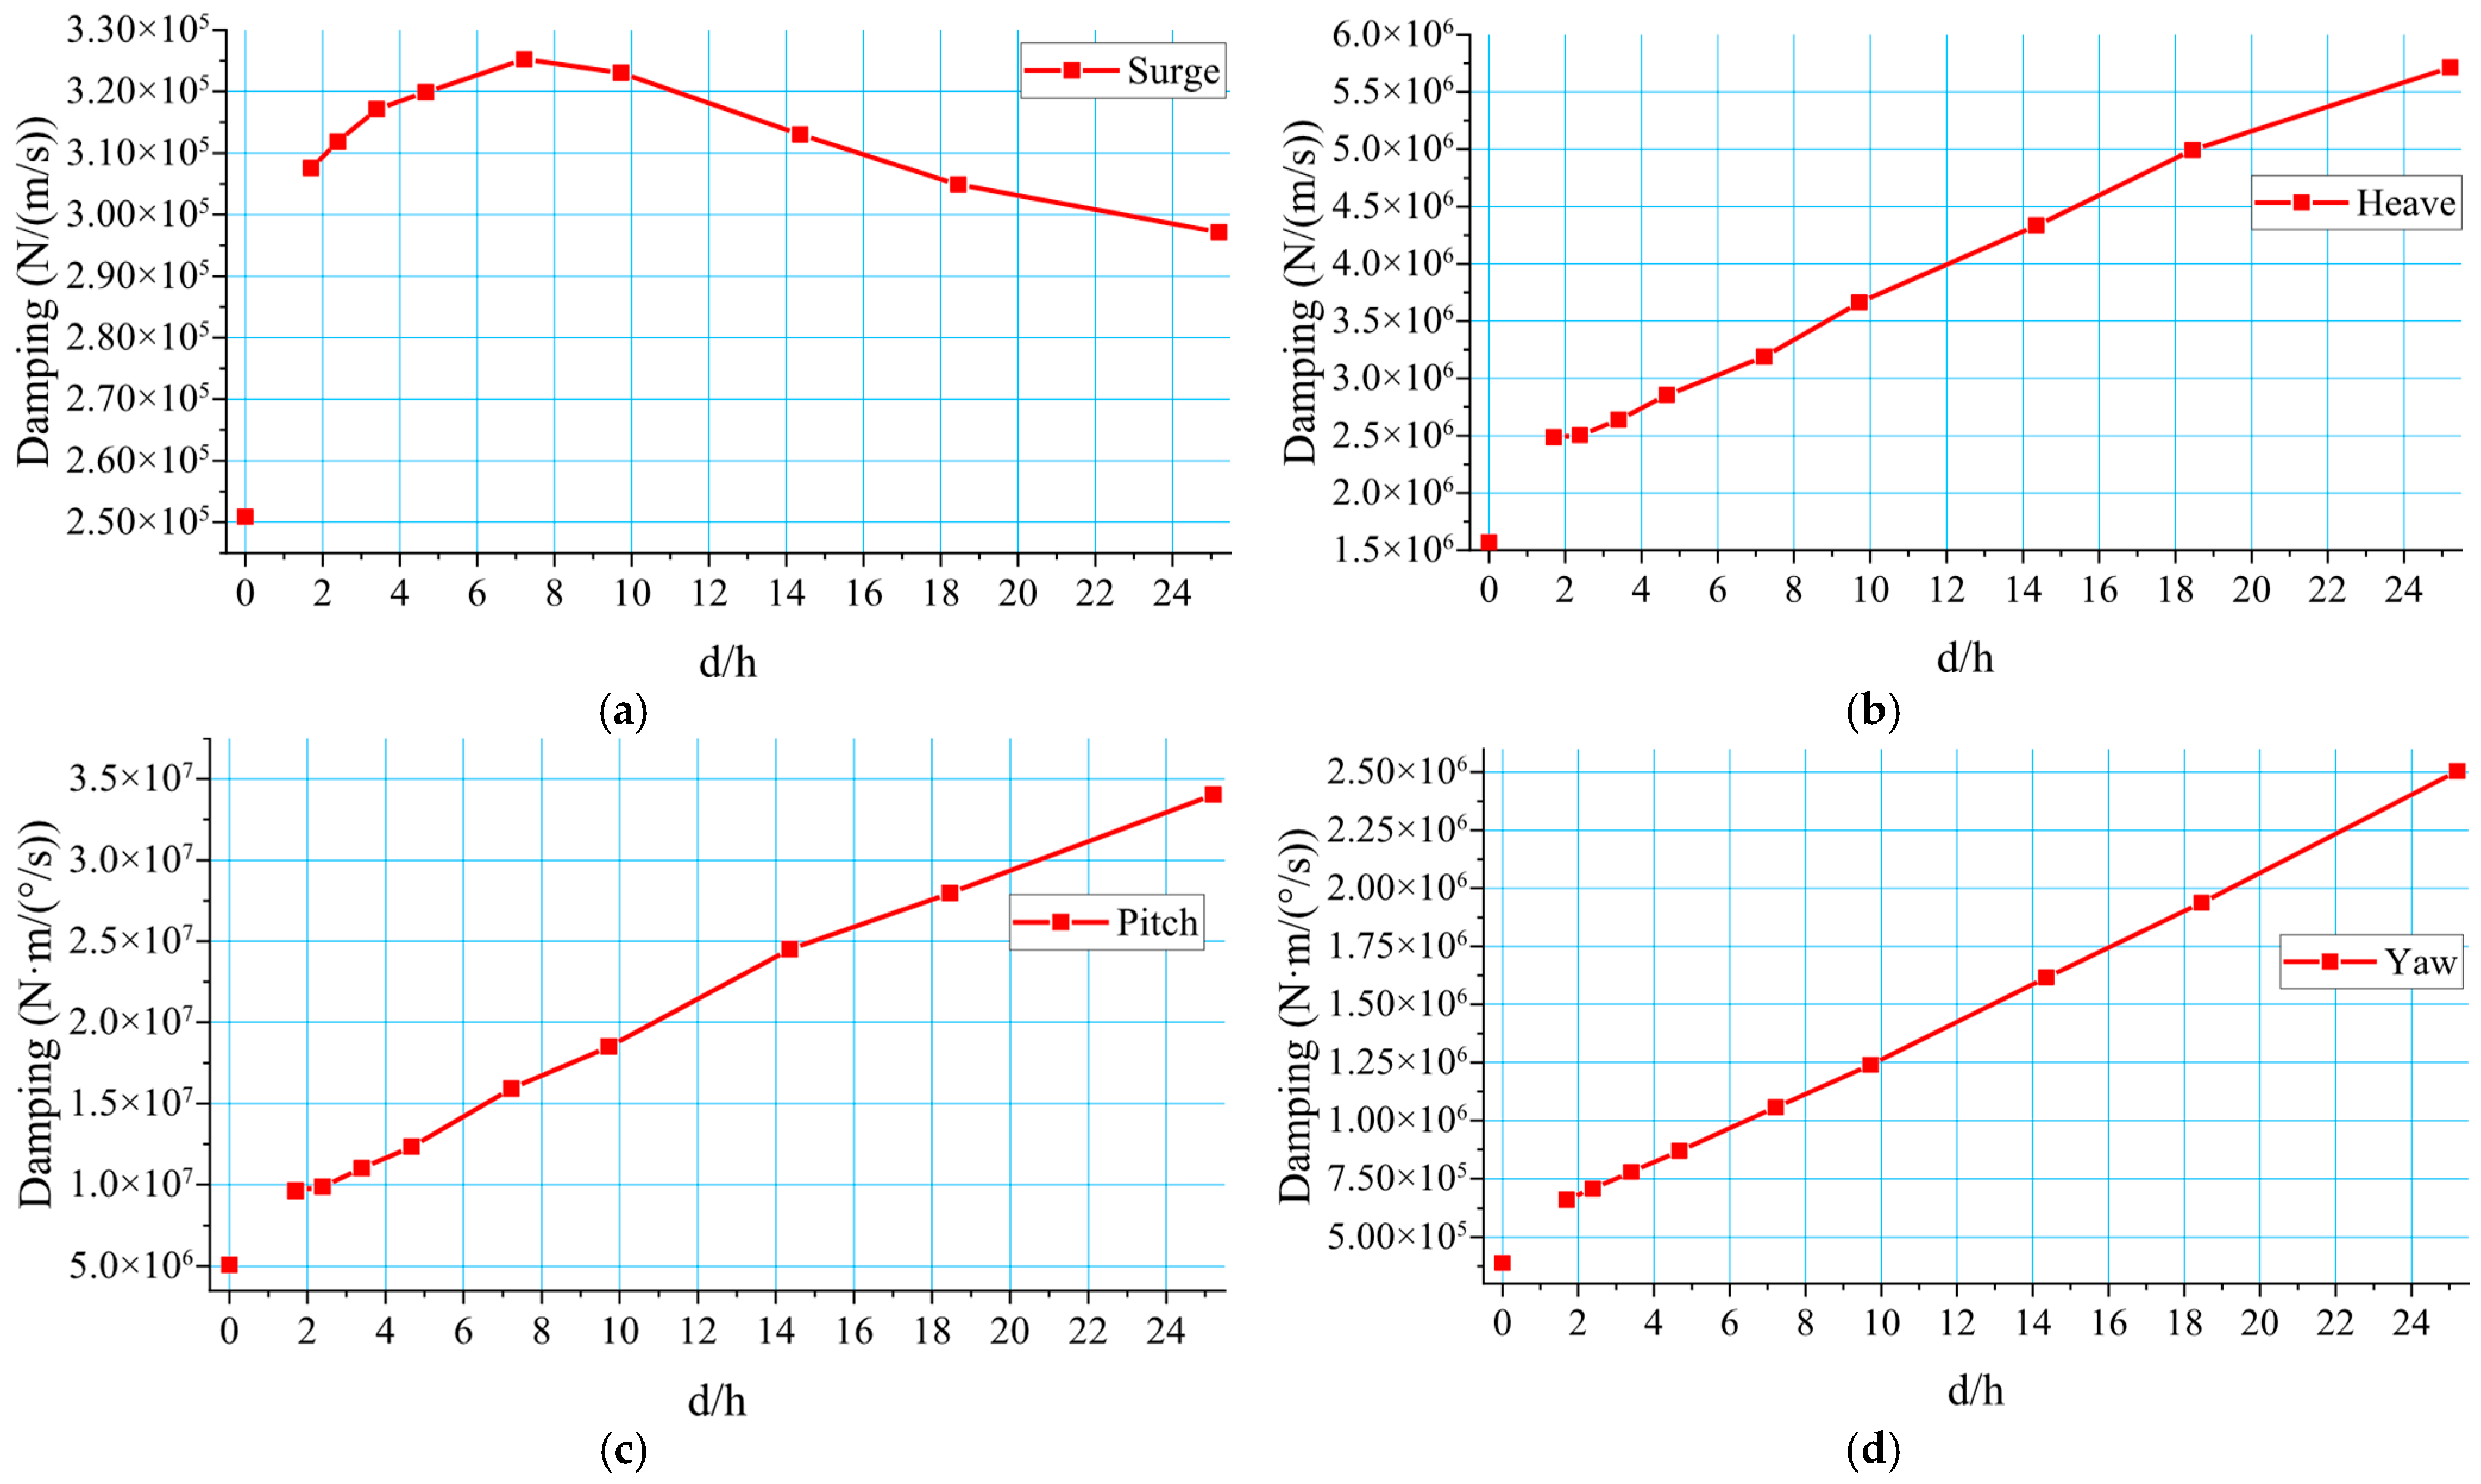
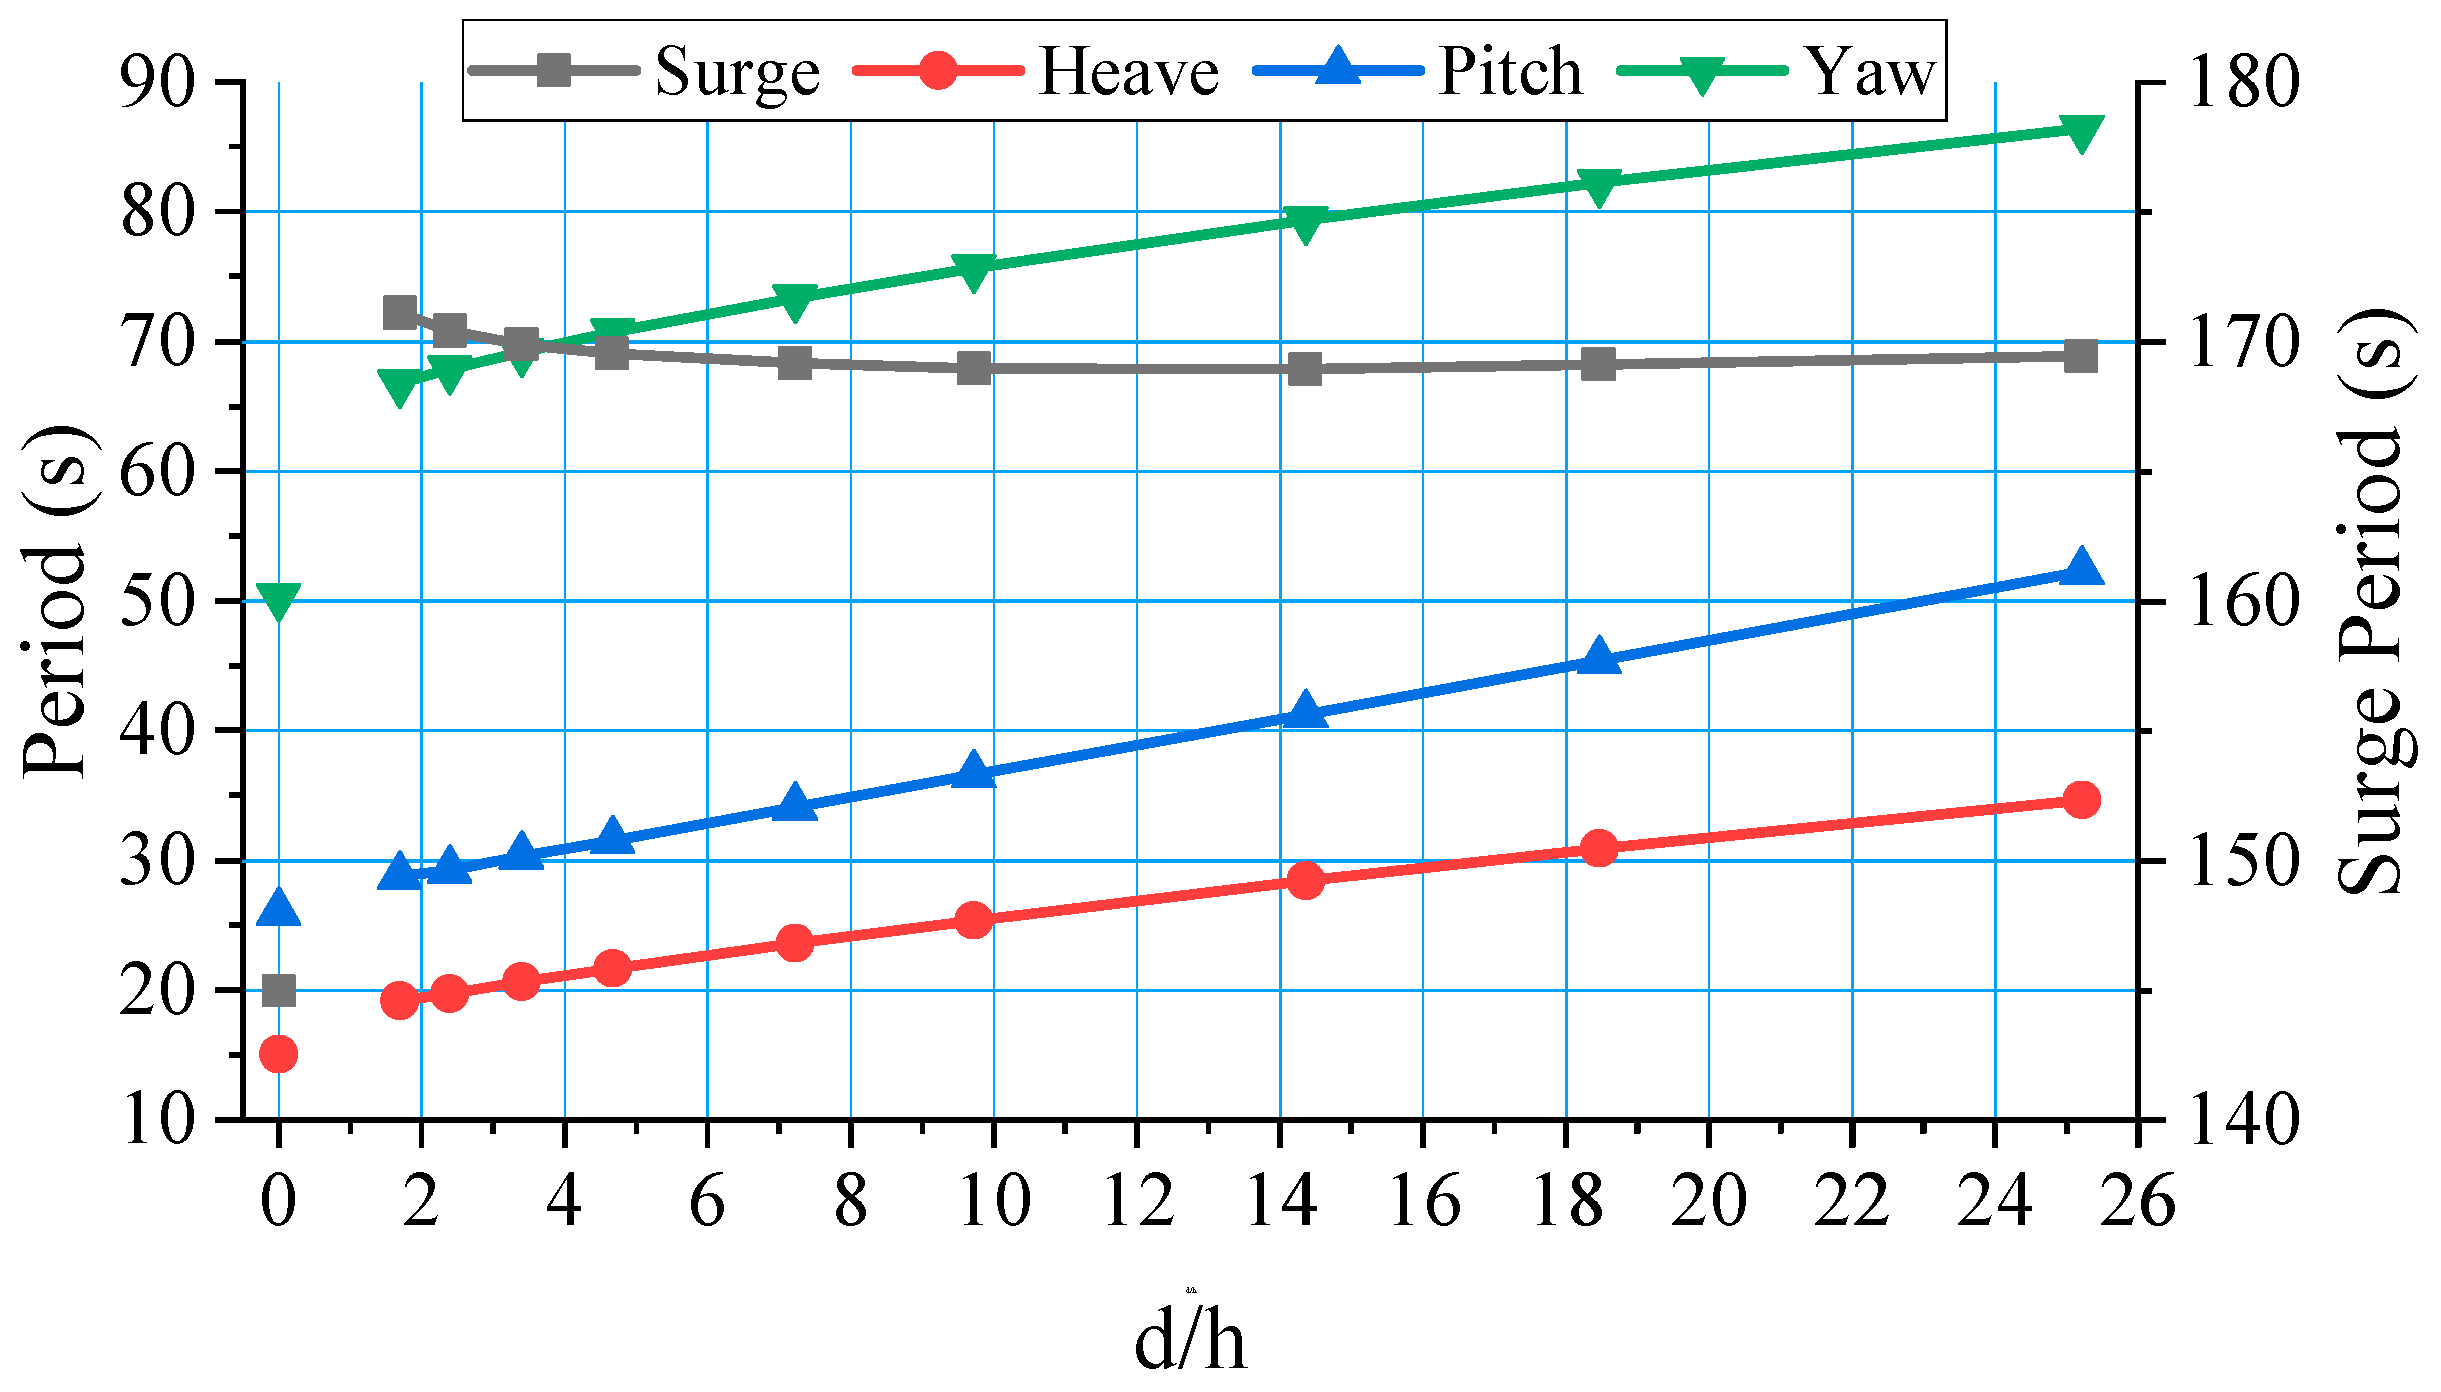
The natural periods and dimensionless damping coefficients were extracted from the free-decay time histories. The natural periods are shown in Figure 11, and the corresponding motion damping values, calculated from the damping ratios using Equations (5) and (6) are shown in Figure 12. In both figures, the horizontal axis denotes the compared d/h values, and x = 0 corresponds to the reference platform without a column boot.
As shown in Figure 11, the introduction of the column boot increases the natural periods of all motion modes relative to the main body case. The effect is most pronounced in heave, pitch, and yaw, whose natural periods increase almost monotonically with d/h. This indicates that increasing d/h strengthens the hydrodynamic inertia effects associated with the column boot and slows the dynamic response in these modes. From an engineering perspective, the shift in the heave and pitch natural frequencies away from the dominant wave energy range is beneficial for resonance avoidance.
Figure 12 shows that the column boot also increases motion damping in all modes. For heave, pitch, and yaw, the damping grows nearly linearly with d/h over most of the investigated range, indicating that increasing d/h enhances viscous energy dissipation in these motions. In contrast, surge damping varies non-monotonically. It first increases, reaches a maximum at about d/h = 7.22, and then gradually decreases. When d/h exceeds 18.46, the surge damping becomes lower than that at d/h = 1.70. This indicates that increasing d/h improves surge energy dissipation only over a moderate range.
A slight deviation is observed at d/h = 1.70, where the natural period and damping do not fully follow the overall trend. This may be related to the relatively shallow submergence of the column boot in that case, which makes the local flow near its upper part more sensitive to free surface effects. Overall, Figure 11 and Figure 12 show that increasing d/h is especially effective in modifying the dynamic characteristics in heave, pitch, and yaw, whereas its influence on surge remains comparatively limited and non-monotonic. Therefore, if heave and pitch control are the primary objectives, increasing d/h is beneficial; however, the largest d/h is not necessarily optimal when surge performance must also be considered.

5.2. Added Mass and Added Pitch Moment of Inertia

Section 5.1 shows that the natural periods in heave and pitch are much more sensitive to d/h than those in surge. According to Equations (5) and (6), and since the near-waterline geometry is identical among all cases, these changes are mainly associated with variations in the inertia terms, especially the heave added mass and the added pitch moment of inertia.
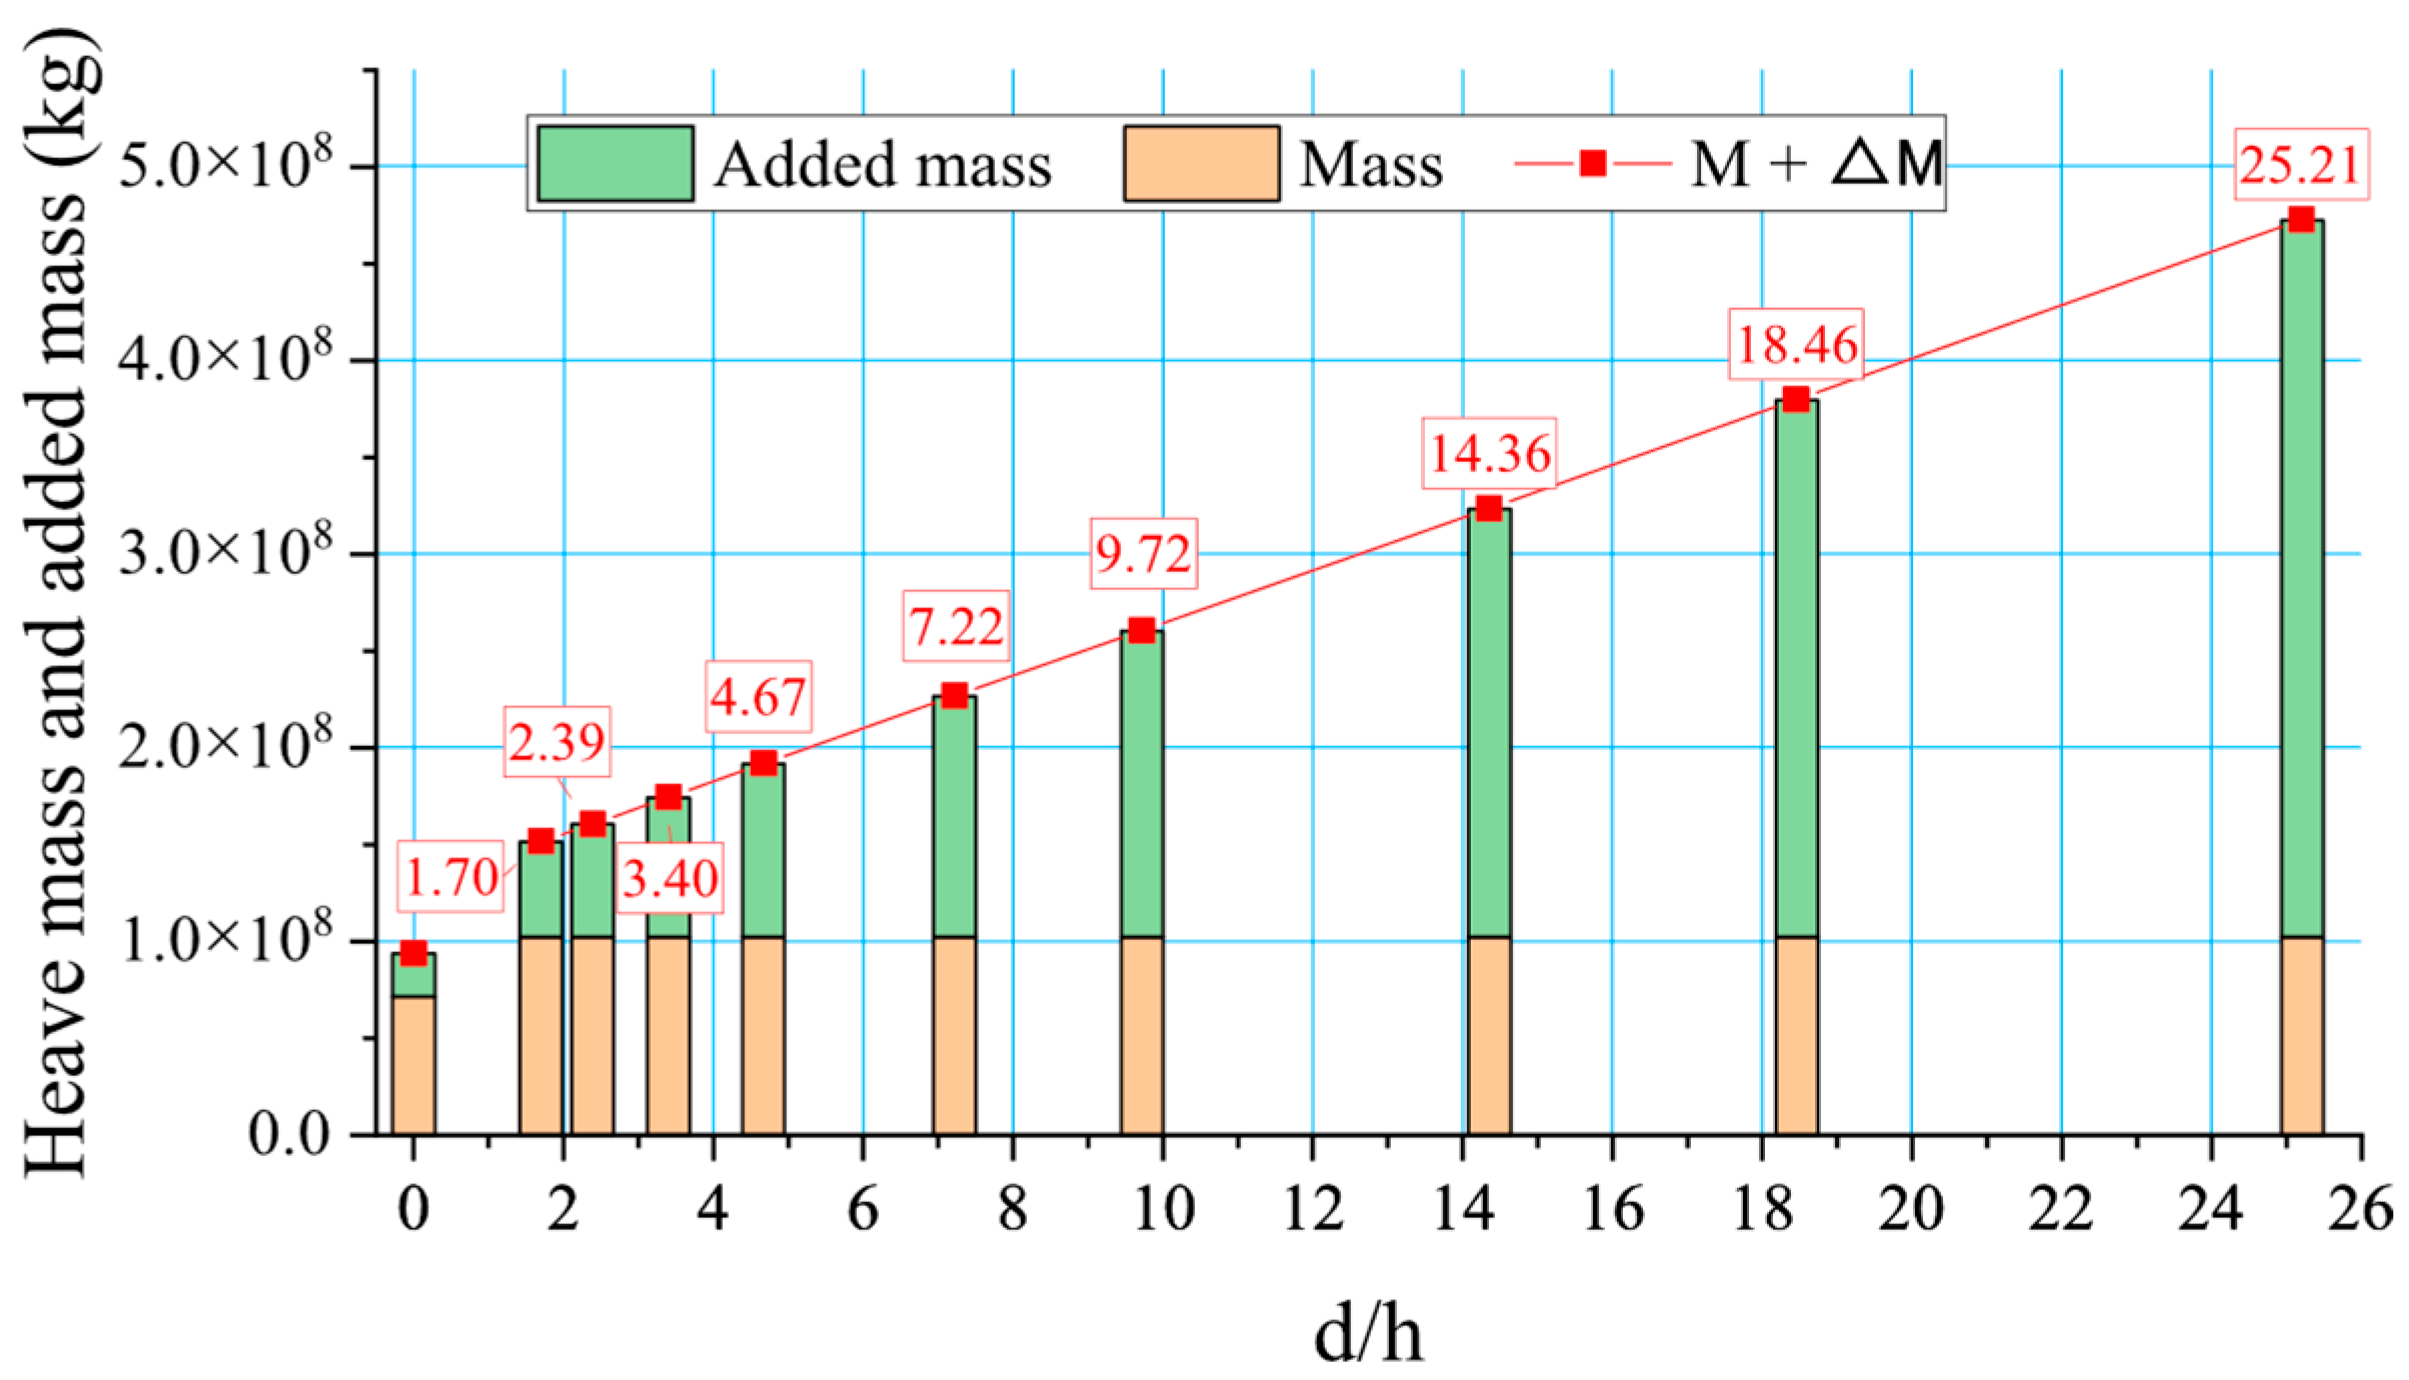
Figure 13 compares the structural mass M and the heave added mass ΔM evaluated at the heave natural period. Relative to the main body case, the column boot markedly increases ΔM, while the structural mass remains nearly unchanged. Moreover, ΔM increases approximately linearly with d/h and becomes the dominant part of the inertia term M + ΔM once d/h exceeds about 7.22. This explains the continuous increase in heave natural period as d/h increases and shows that the change is governed mainly by hydrodynamic added inertia rather than by structural mass.
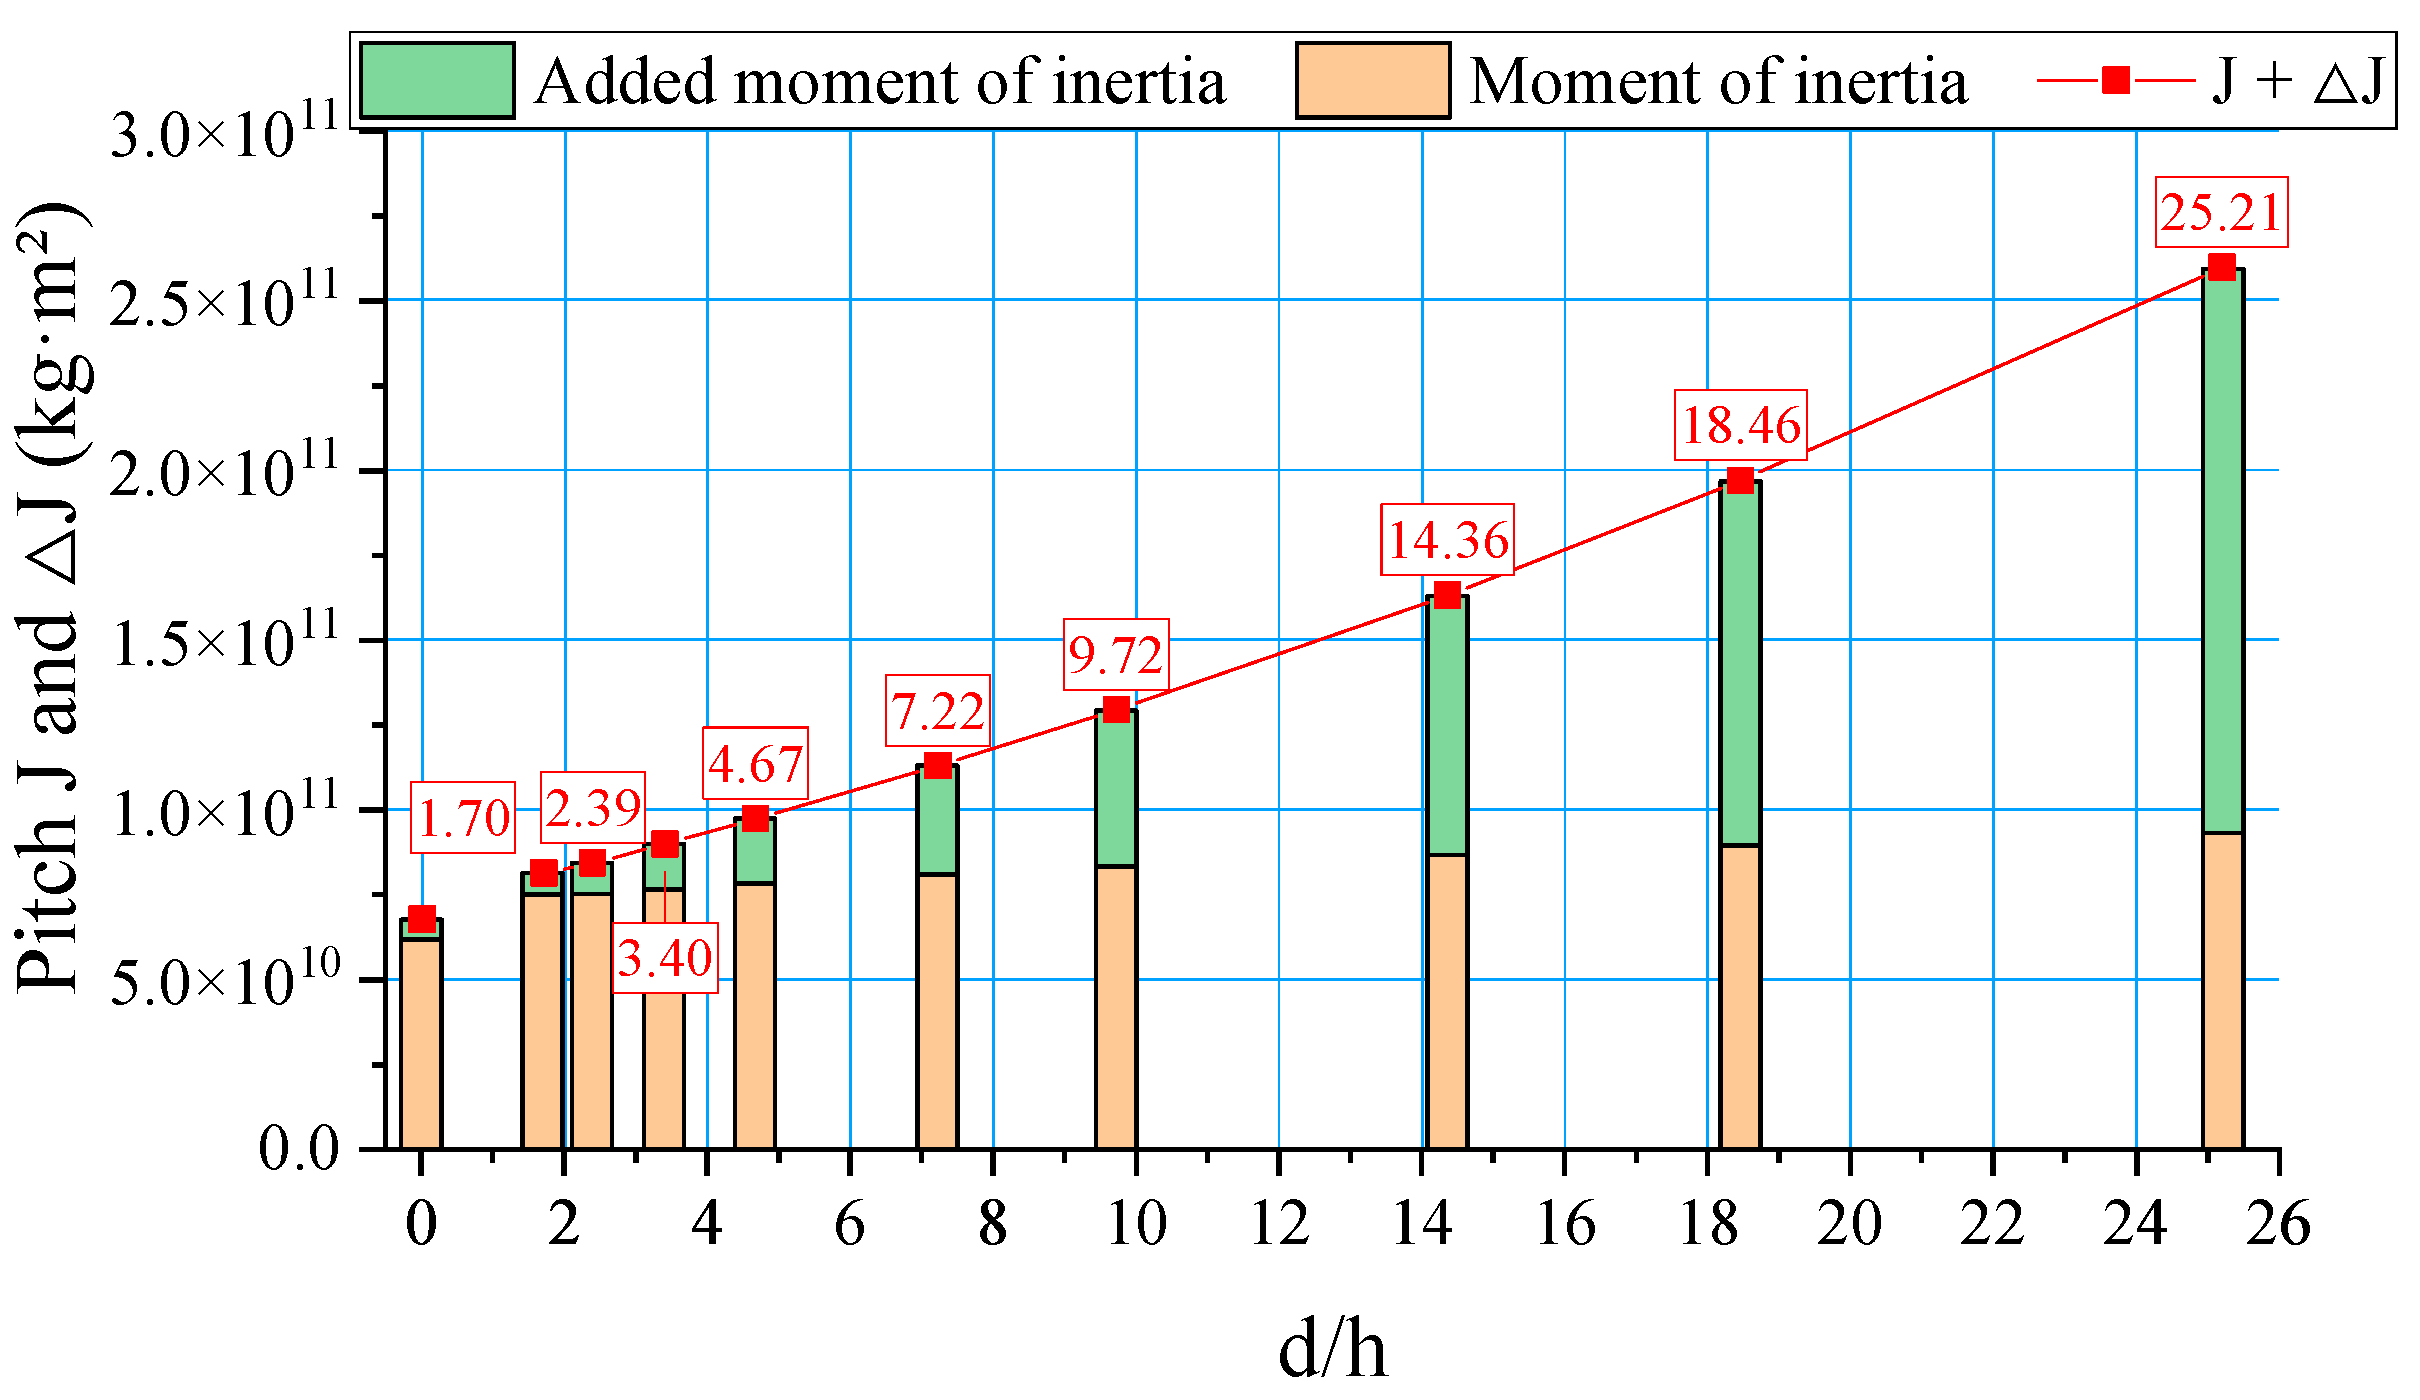
Figure 14 shows a similar tendency in pitch. The structural pitch moment of inertia J increases only slightly as d/h increases, whereas the added pitch moment of inertia ΔJ increases much more rapidly. As a result, the increase in the pitch inertia term J + ΔJ is controlled mainly by the added component, which directly leads to the lengthening of the pitch natural period. When d/h is sufficiently large, ΔJ becomes comparable to and then exceeds the structural contribution.
Taken together, Figure 13 and Figure 14 indicate that increasing d/h strengthens the hydrodynamic inertia effects in both heave and pitch, and that the added inertia terms are much more sensitive to d/h than the structural inertia terms. Therefore, the increase in natural periods is caused mainly by the growth of heave added mass and added pitch moment of inertia associated with the column boot geometry, rather than by a substantial increase in the platform’s own structural inertia. This also implies that adjusting d/h is an effective way to tune the heave and pitch dynamic characteristics of the platform.

5.3. RAO Characteristics

Since the mooring system mainly provides restoring stiffness in surge and yaw, and its influence on heave and pitch is relatively small [14], the heave and pitch RAOs were evaluated under unmoored conditions to highlight the inherent hydrodynamic differences among the platforms. In Figure 15 and Figure 16, the legend values denote the compared diameter-to-height ratios.
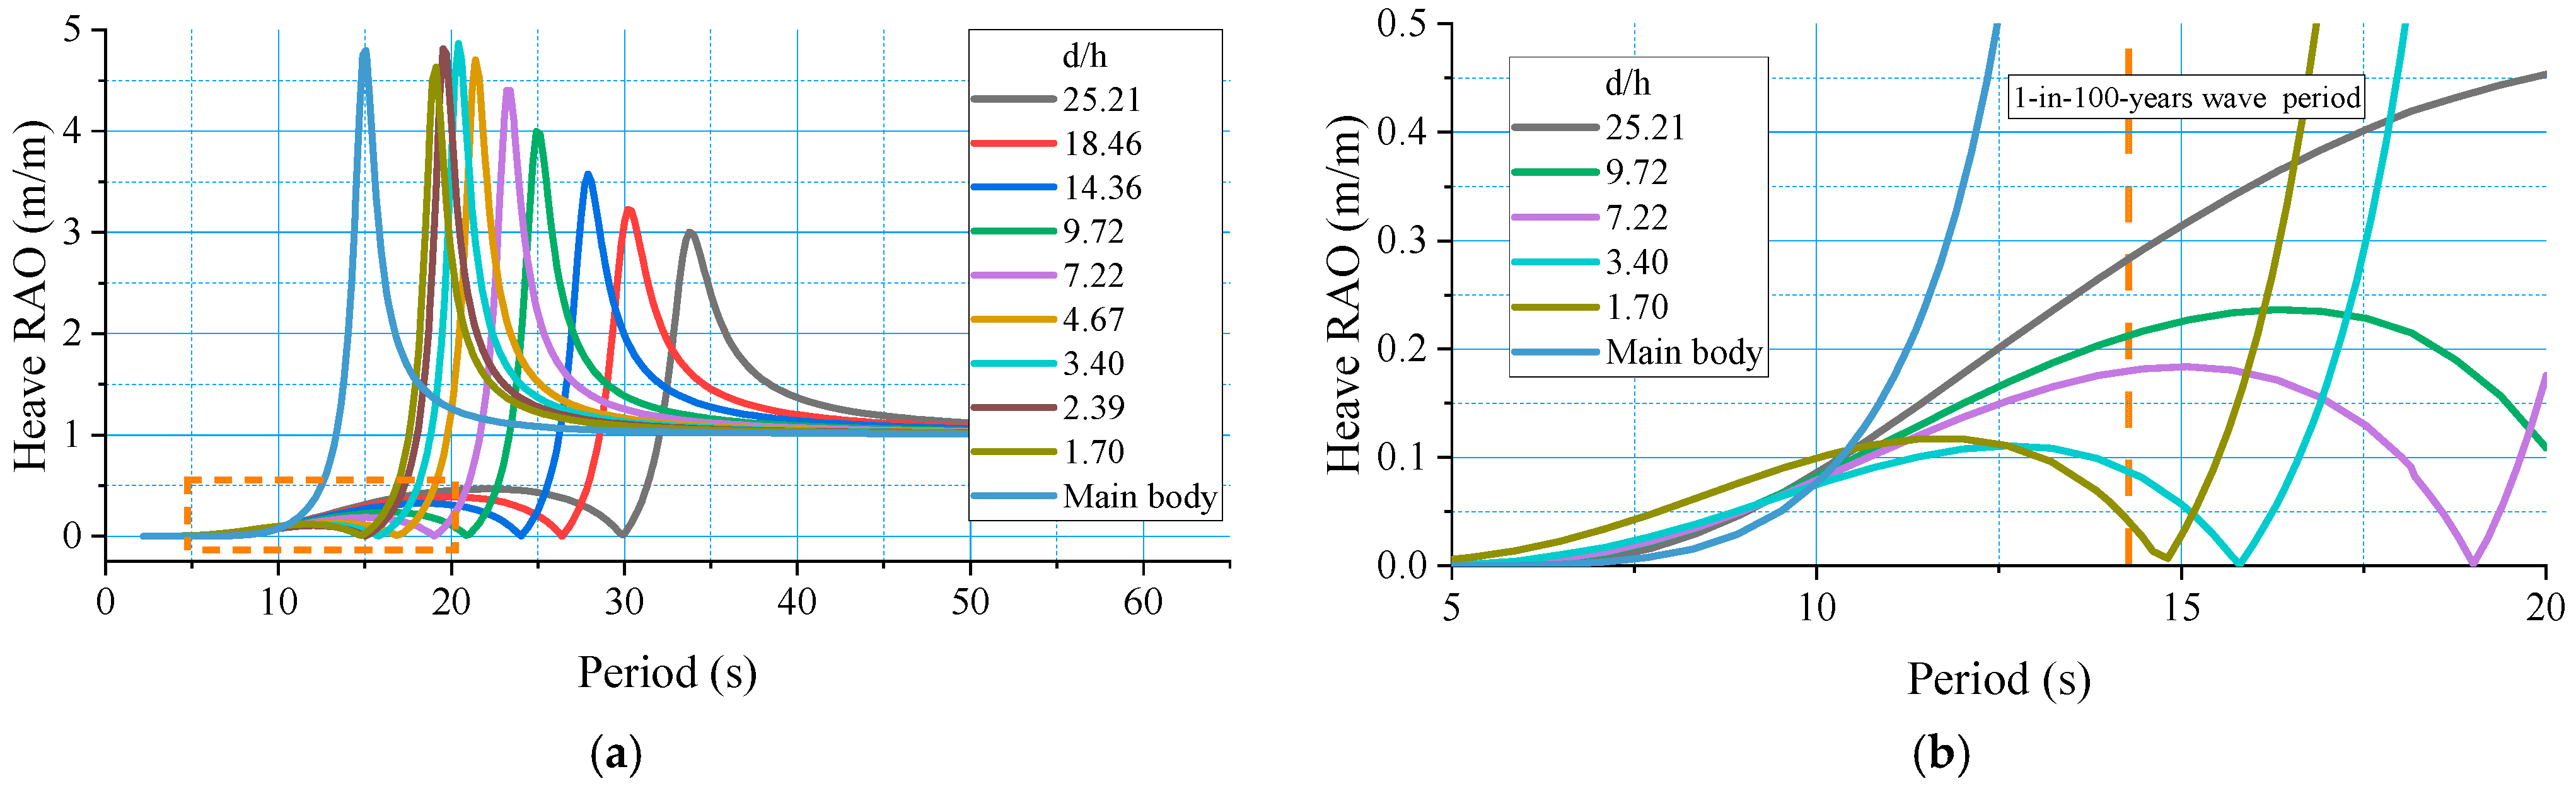
As shown in Figure 15a, the heave RAO exhibits a more complex dependence on d/h than the natural period alone would suggest. As d/h increases, the main peak shifts toward longer periods, consistent with the increase in the heave natural period, whereas its magnitude first increases slightly and then decreases. After the column boot is introduced, a secondary peak appears on the short period side, and both this peak and the intermediate trough move toward longer periods with increasing d/h. This indicates that d/h modifies not only the principal heave resonance but also the overall shape of the heave response curve over the wave frequency range. Therefore, the influence of d/h on heave cannot be evaluated solely from the main peak.
Figure 15b highlights the period range of 5 to 20 s, which covers the dominant wave energy range at the target site. Near the peak period of the 1-in-100-year wave spectrum, the heave RAO increases as d/h increases. This indicates that although a larger d/h can lengthen the heave natural period and increase damping, it does not necessarily improve heave performance within the most critical period range of the survival sea state.
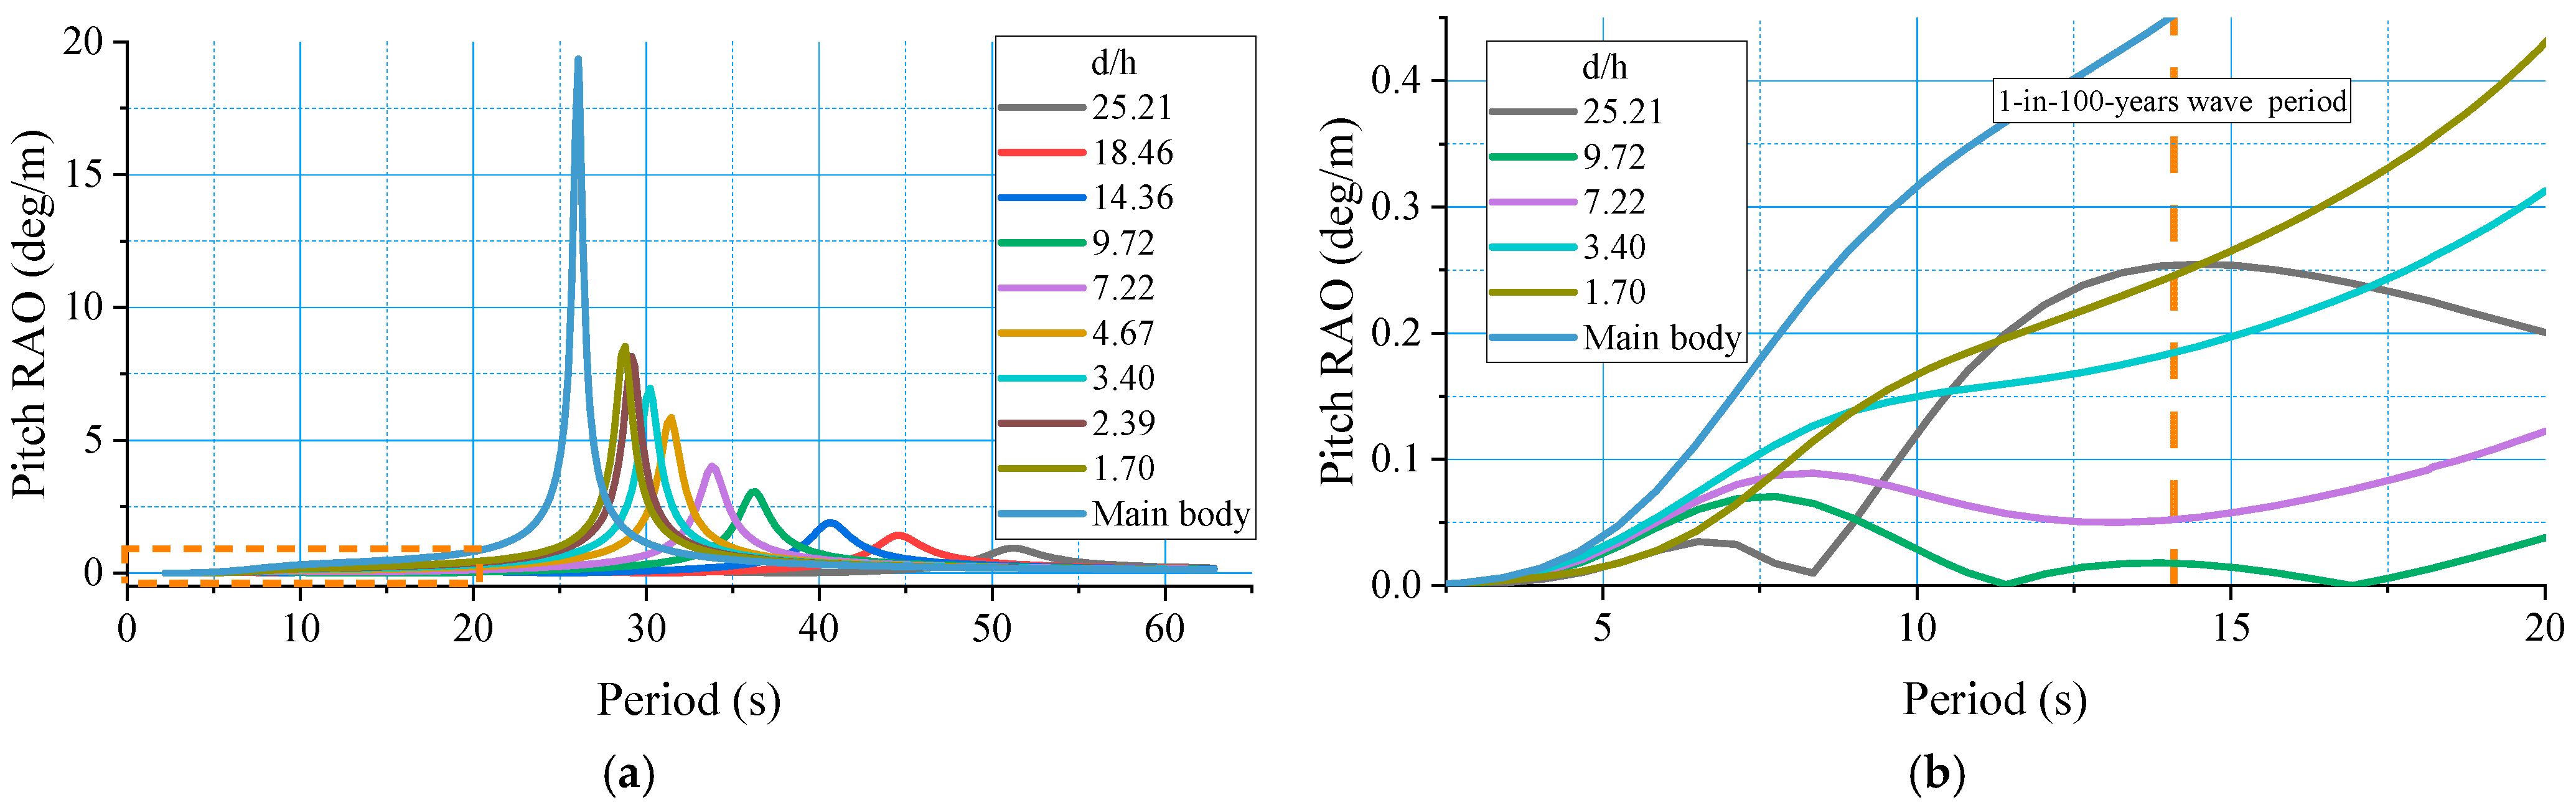
The pitch RAO in Figure 16 shows a clearer trend. Compared with the main body case, the introduction of the column boot substantially reduces the dominant pitch peak. As d/h increases, the main peak shifts toward longer periods and its magnitude decreases continuously, consistent with the changes in pitch natural period and damping identified in Section 5.1. In the zoomed-in view, the pitch RAO in the short period range generally decreases as d/h increases, although several local peaks appear at large d/h values. This indicates that increasing d/h remains beneficial for pitch control, but the improvement becomes less pronounced once d/h exceeds a moderate range. Near the peak period of the 1-in-100-year wave spectrum, the pitch RAO first decreases and then increases, showing again that the largest d/h is not necessarily the most favorable choice under the survival sea state.
A comparison between Figure 15 and Figure 16 shows that the benefits of increasing d/h are not identical for heave and pitch. The pitch response improves in a clearer and more stable manner, whereas the heave response is more sensitive to the period range considered. A similar design implication was reported by Subbulakshmi and Sundaravadivelu [29], who also showed that a wider damping plate is not necessarily more favorable in terms of RAO reduction. Although their study considered diameter variation alone, whereas the present study involves coupled changes in both diameter and height through d/h, both studies indicate that appendage geometry has an effective range. Therefore, the design value of d/h should be selected by balancing the heave and pitch responses under the target sea state, rather than by simply maximizing the natural period or damping.

5.4. Time-Domain Responses Under the Survival Sea State

Time-domain simulations were performed in AQWA using the time response analysis solver in the Hydrodynamic Response module. For each platform, the coupled responses under the prescribed wind, wave, and current conditions were obtained as time histories. According to the previous analysis for the present 4 × 3 mooring arrangement [30], the largest horizontal offset and dynamic inclination occur at 180°, whereas the maximum mooring line tension occurs at 225°. The following discussion therefore focuses on these critical directions. Owing to symmetry, the sway and roll responses at 180° are very small and are not discussed further. Surge is thus taken as the representative horizontal displacement, and pitch as the representative dynamic inclination. In Figure 17, Figure 18, Figure 19 and Figure 20, the horizontal axis labels denote the compared d/h cases and serve only as case identifiers. In Figure 21, the horizontal axis directly represents the d/h values.
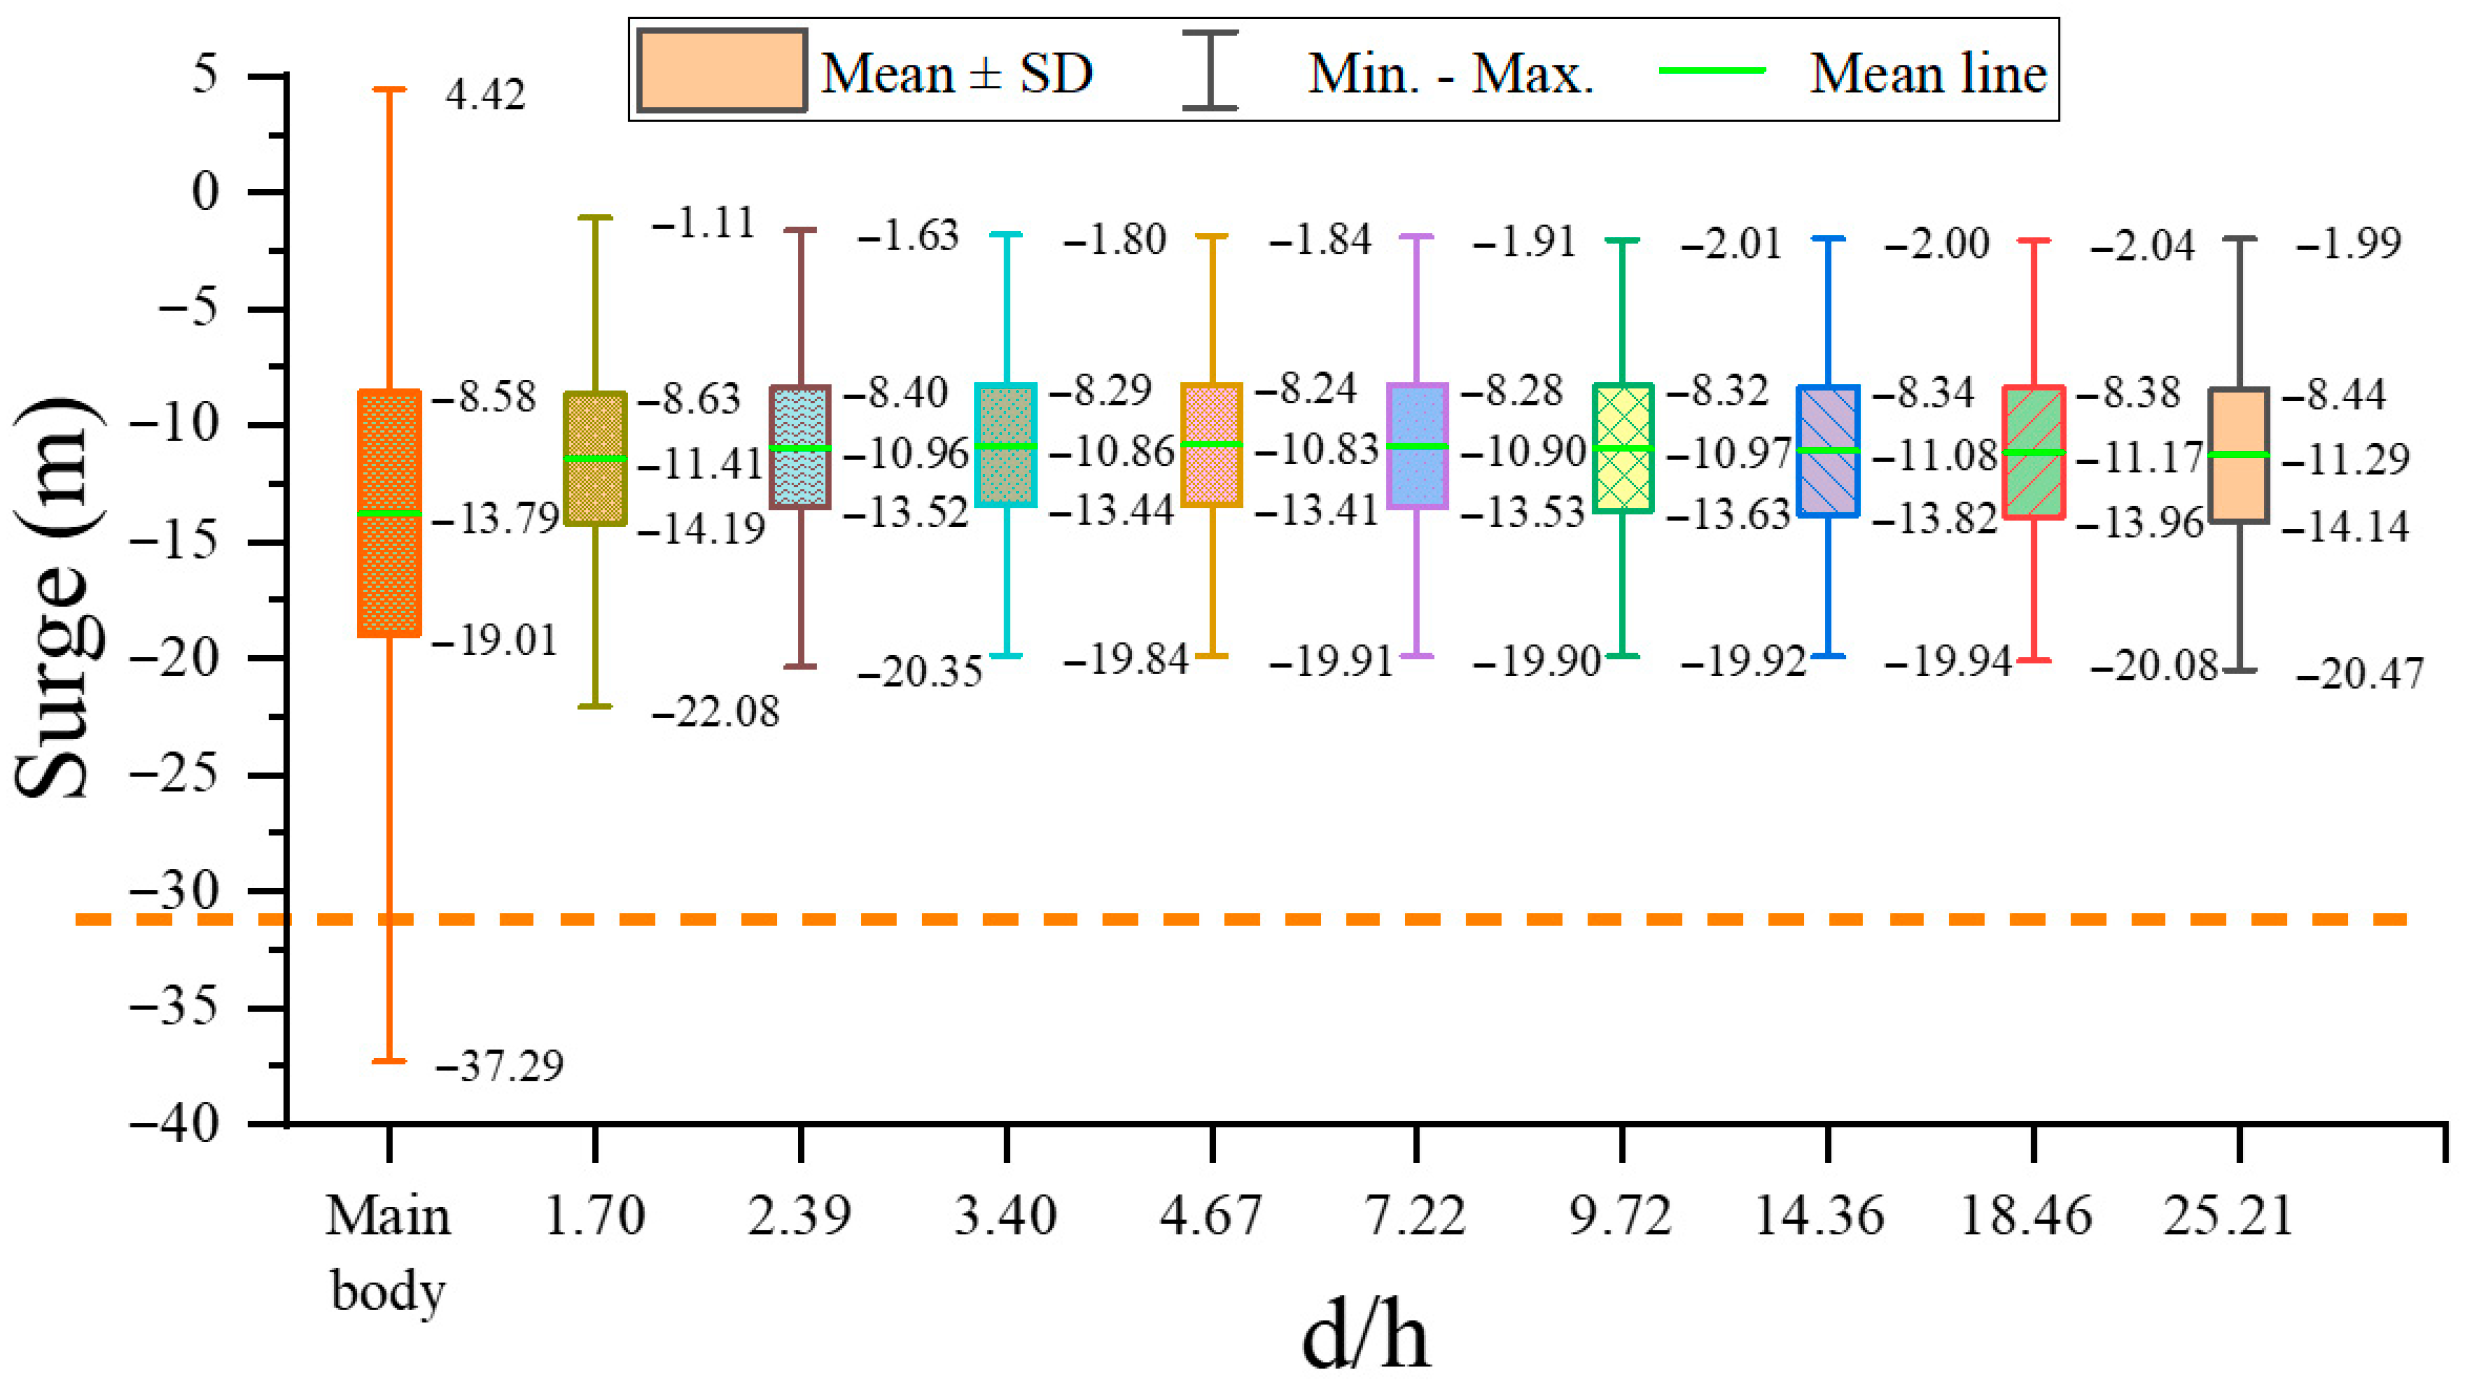
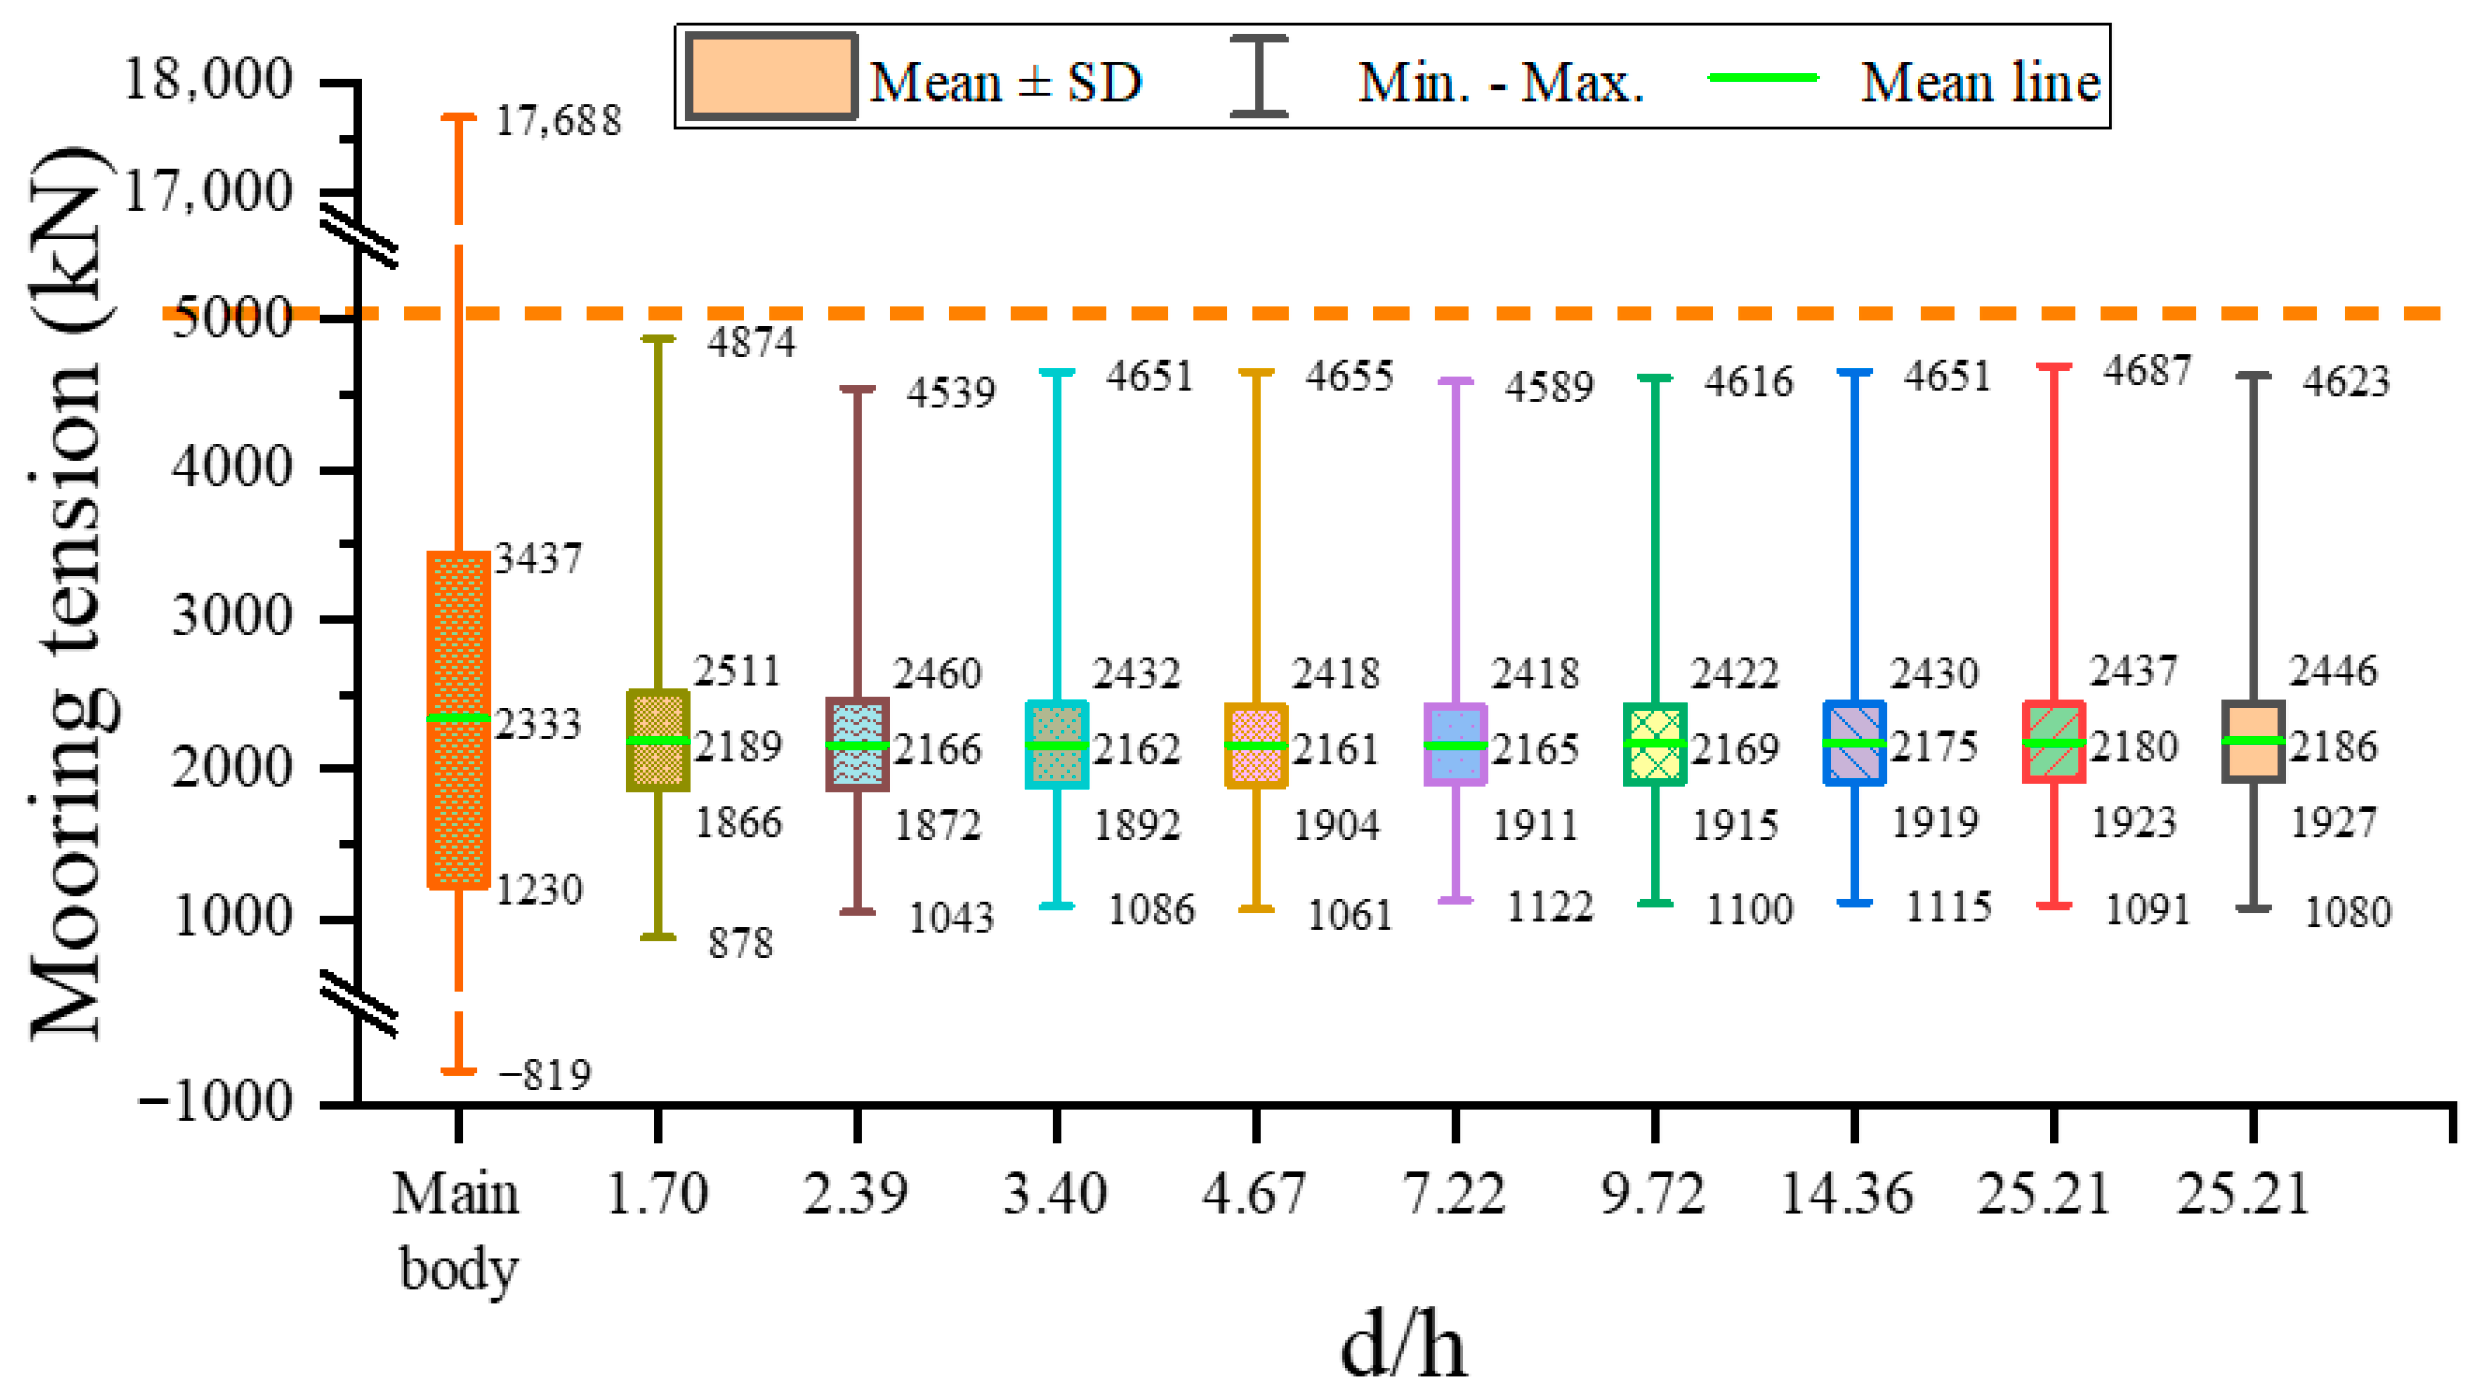
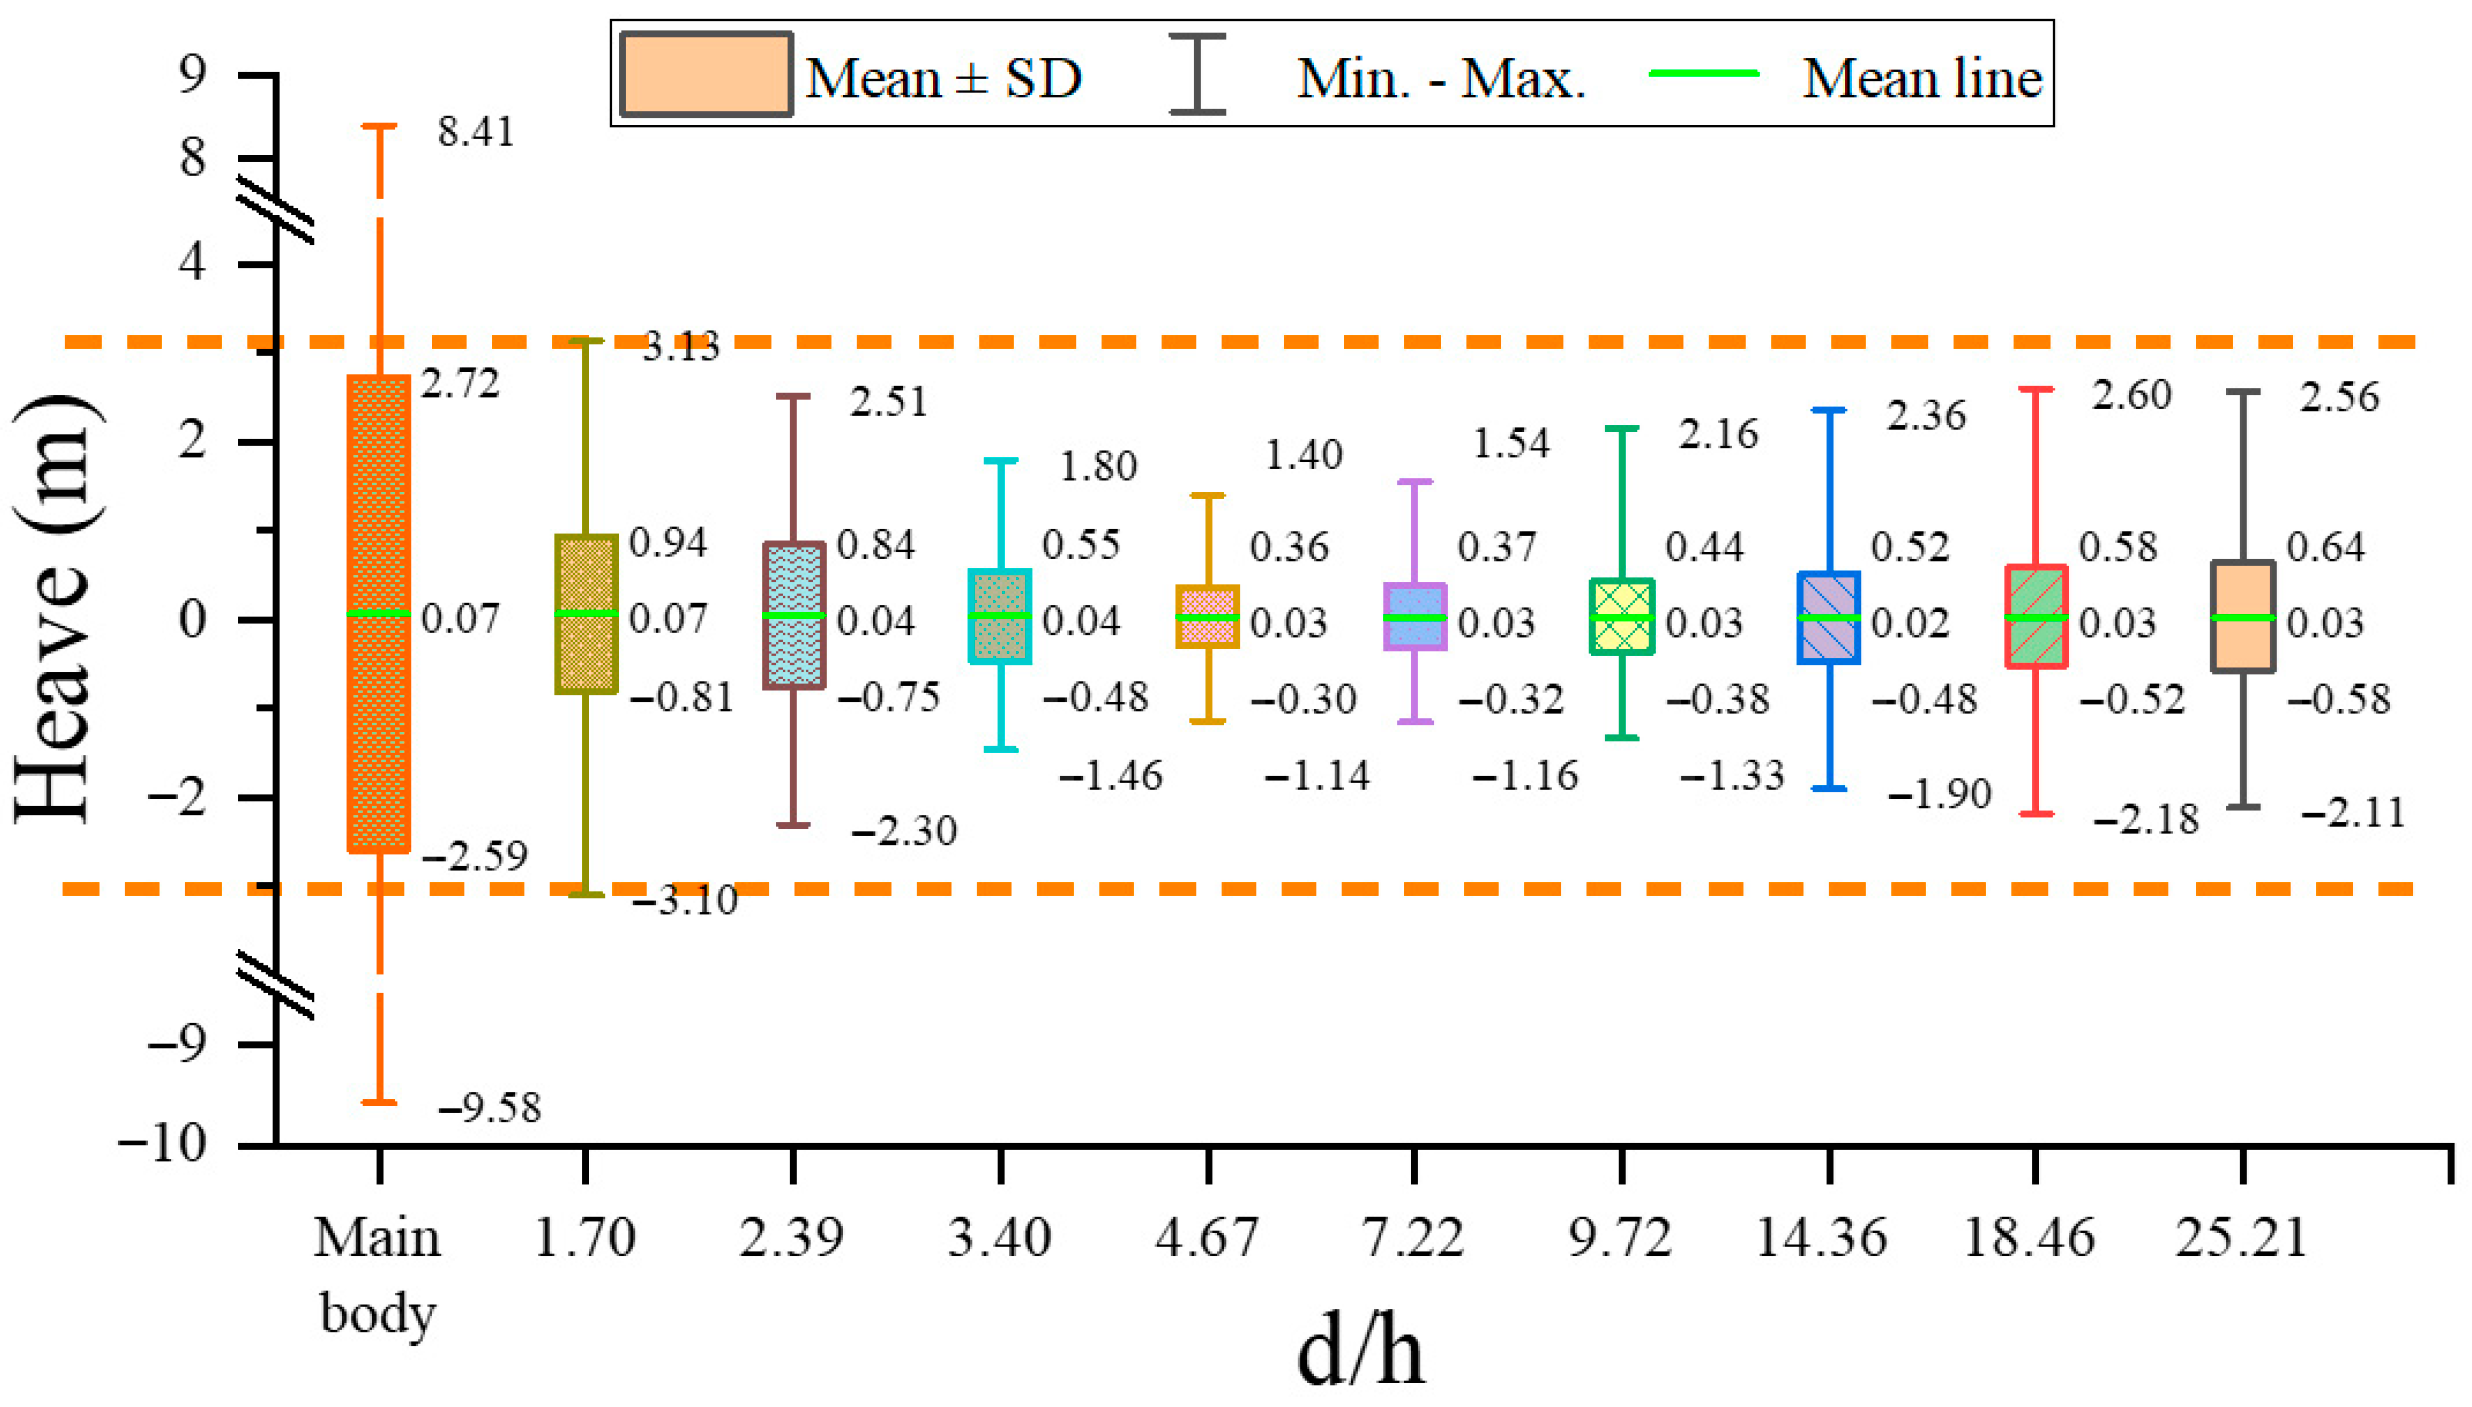
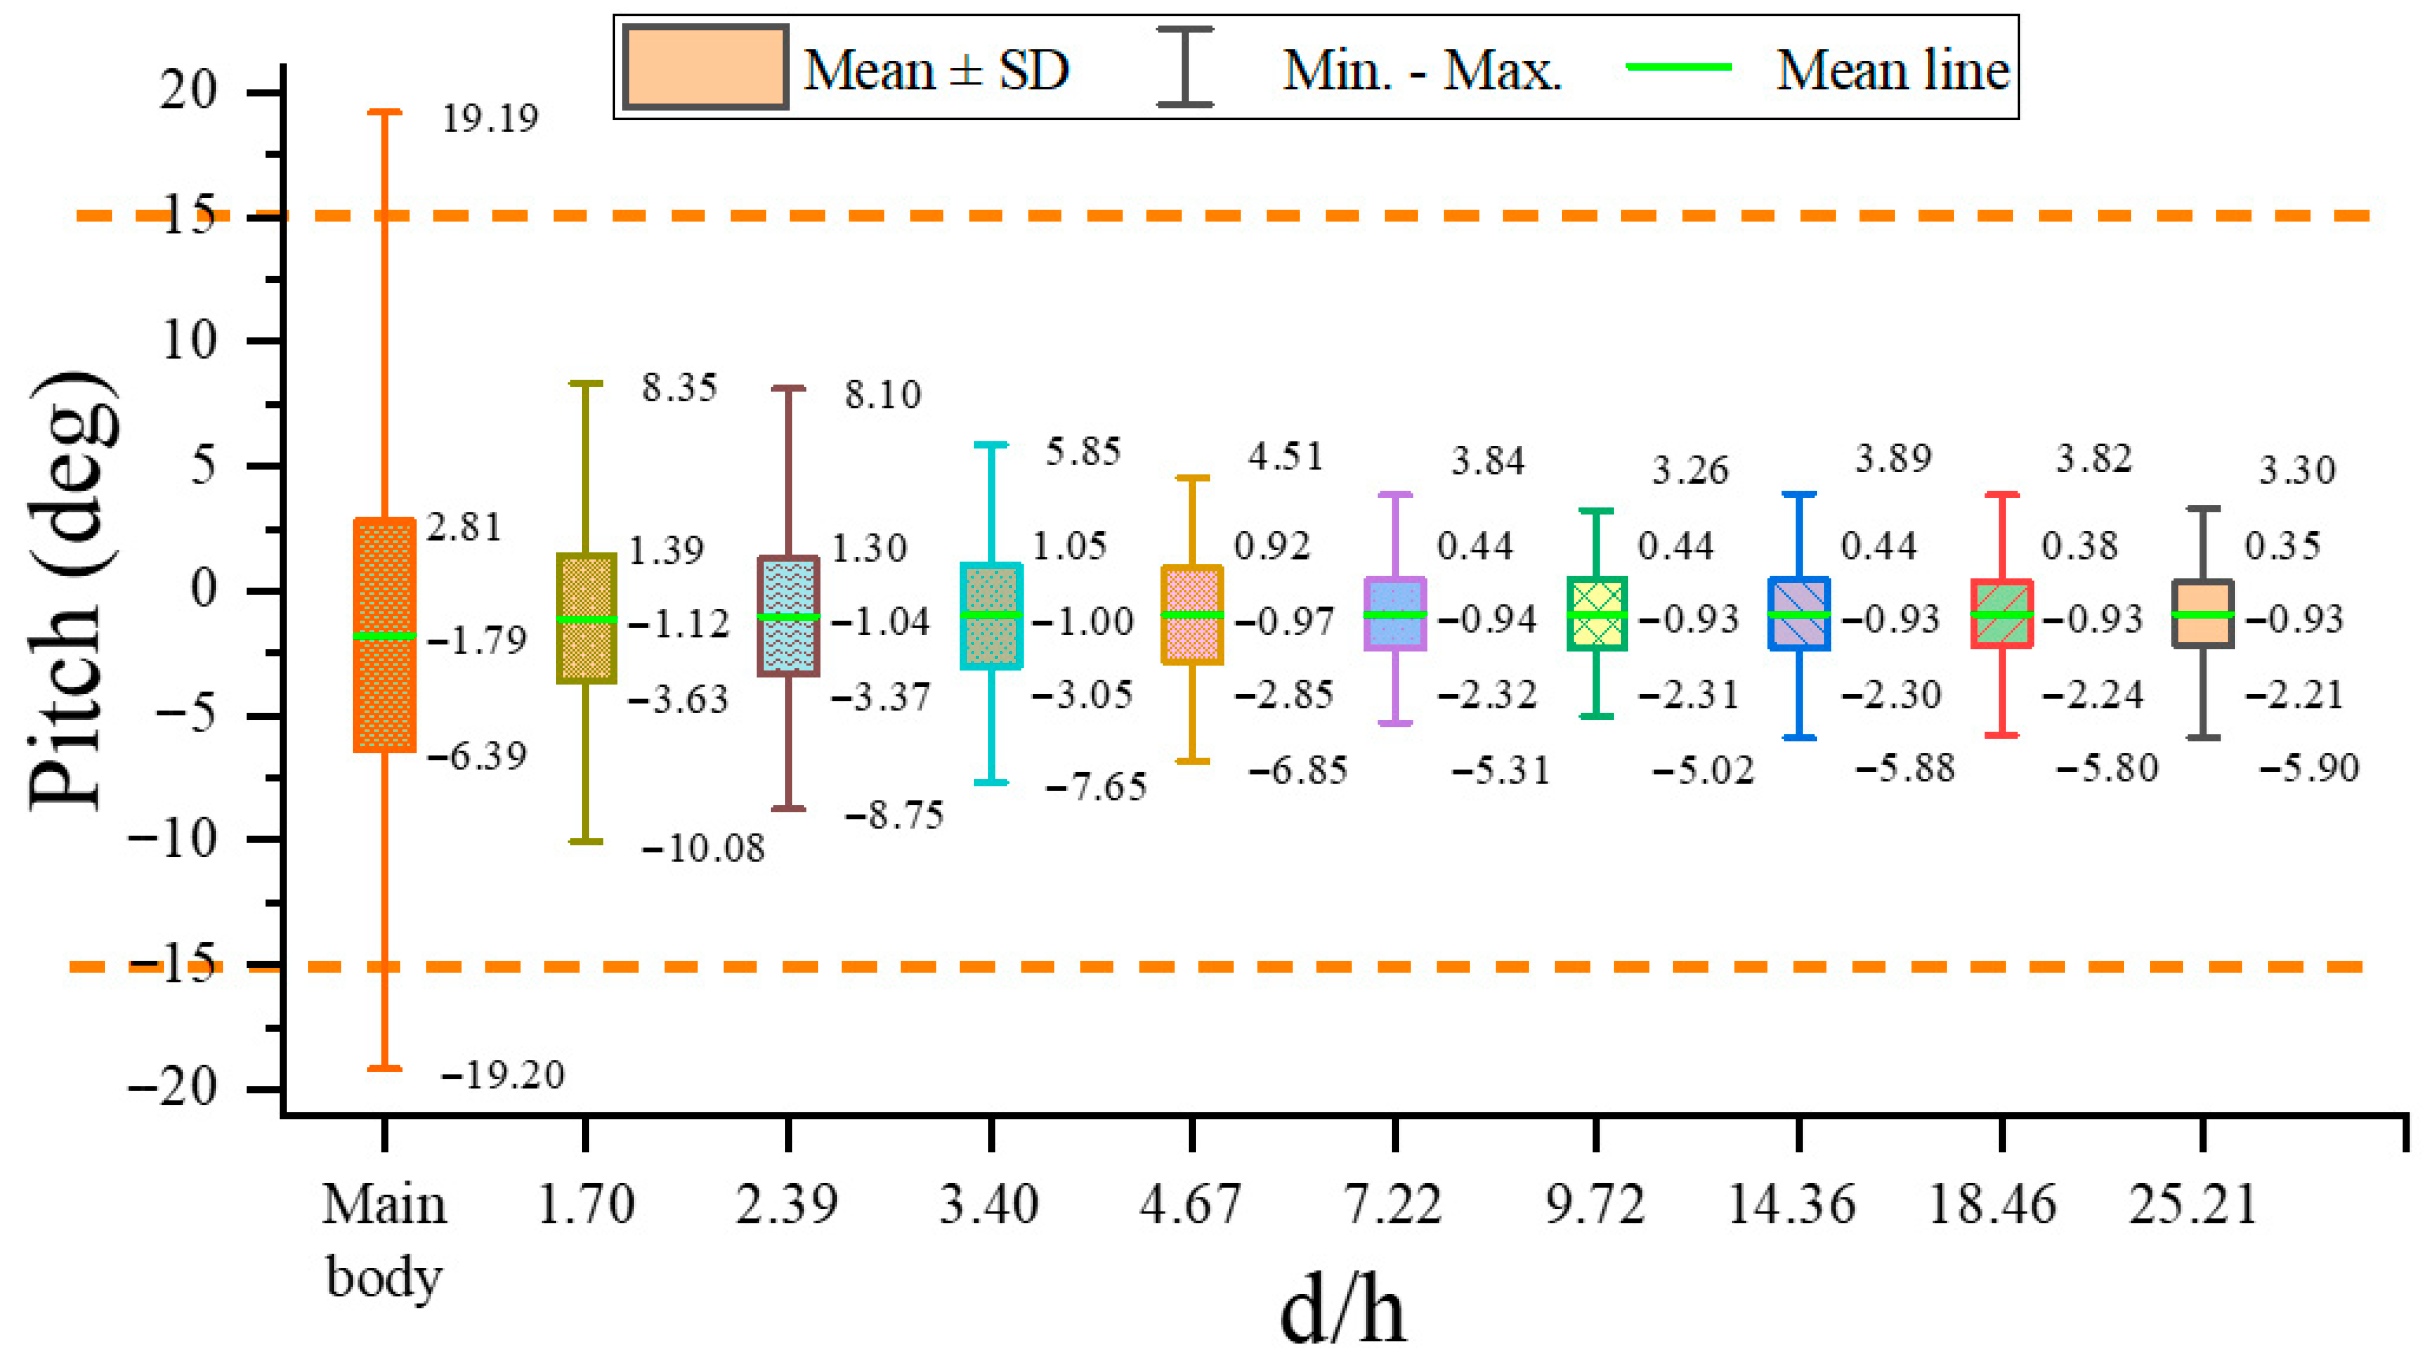
Figure 17, Figure 18, Figure 19 and Figure 20 summarize the response statistics of surge, heave, pitch, and mooring line tension. In general, the introduction of the column boot improves the survival performance of the platform and reduces the mooring load, but the improvement is not monotonic as d/h increases. Most responses show an initial improvement followed by gradual saturation or even slight deterioration, indicating that the hydrodynamic benefit of increasing d/h is mainly confined to a moderate range.
As shown in Figure 17, all platforms with column boots satisfy the surge criterion. Both the maximum and mean surge decrease with increasing d/h up to about 3.40, beyond which the variation becomes very small. This limited sensitivity is consistent with the free-decay results and indicates that surge under the survival sea state is governed mainly by the low-frequency horizontal response and the mooring restoring characteristics.
Figure 18 shows a similar trend for mooring line tension. Compared with the main body case, the column boot reduces not only the maximum tension but also its fluctuation level. The maximum and mean tension decrease as d/h increases, and the survival requirement is satisfied once d/h ≥ 1.70. However, when d/h exceeds about 3.40, the reduction becomes much less pronounced, which indicates a clear diminishing return.
The heave response exhibits a different trend. As shown in Figure 19, the maximum and standard deviation first decrease and then increase with d/h, and the smallest response occurs around d/h = 4.67. Combined with the RAO results in Section 5.3, this indicates that although increasing d/h lengthens the heave natural period and enhances damping, it also increases the heave response level near the dominant wave energy range when d/h becomes too large. The heave response therefore does not decrease monotonically.
The pitch response is also non-monotonic, but its overall tendency differs from that of heave. Figure 20 shows that the maximum pitch first decreases, then increases slightly, and finally decreases again, with the minimum appearing around d/h = 9.72. In contrast, the standard deviation decreases almost monotonically with increasing d/h, although the rate of reduction becomes smaller once d/h exceeds about 7.22. This indicates that increasing d/h remains beneficial for suppressing the overall fluctuation level of pitch, but the incremental gain becomes progressively smaller beyond a moderate range.
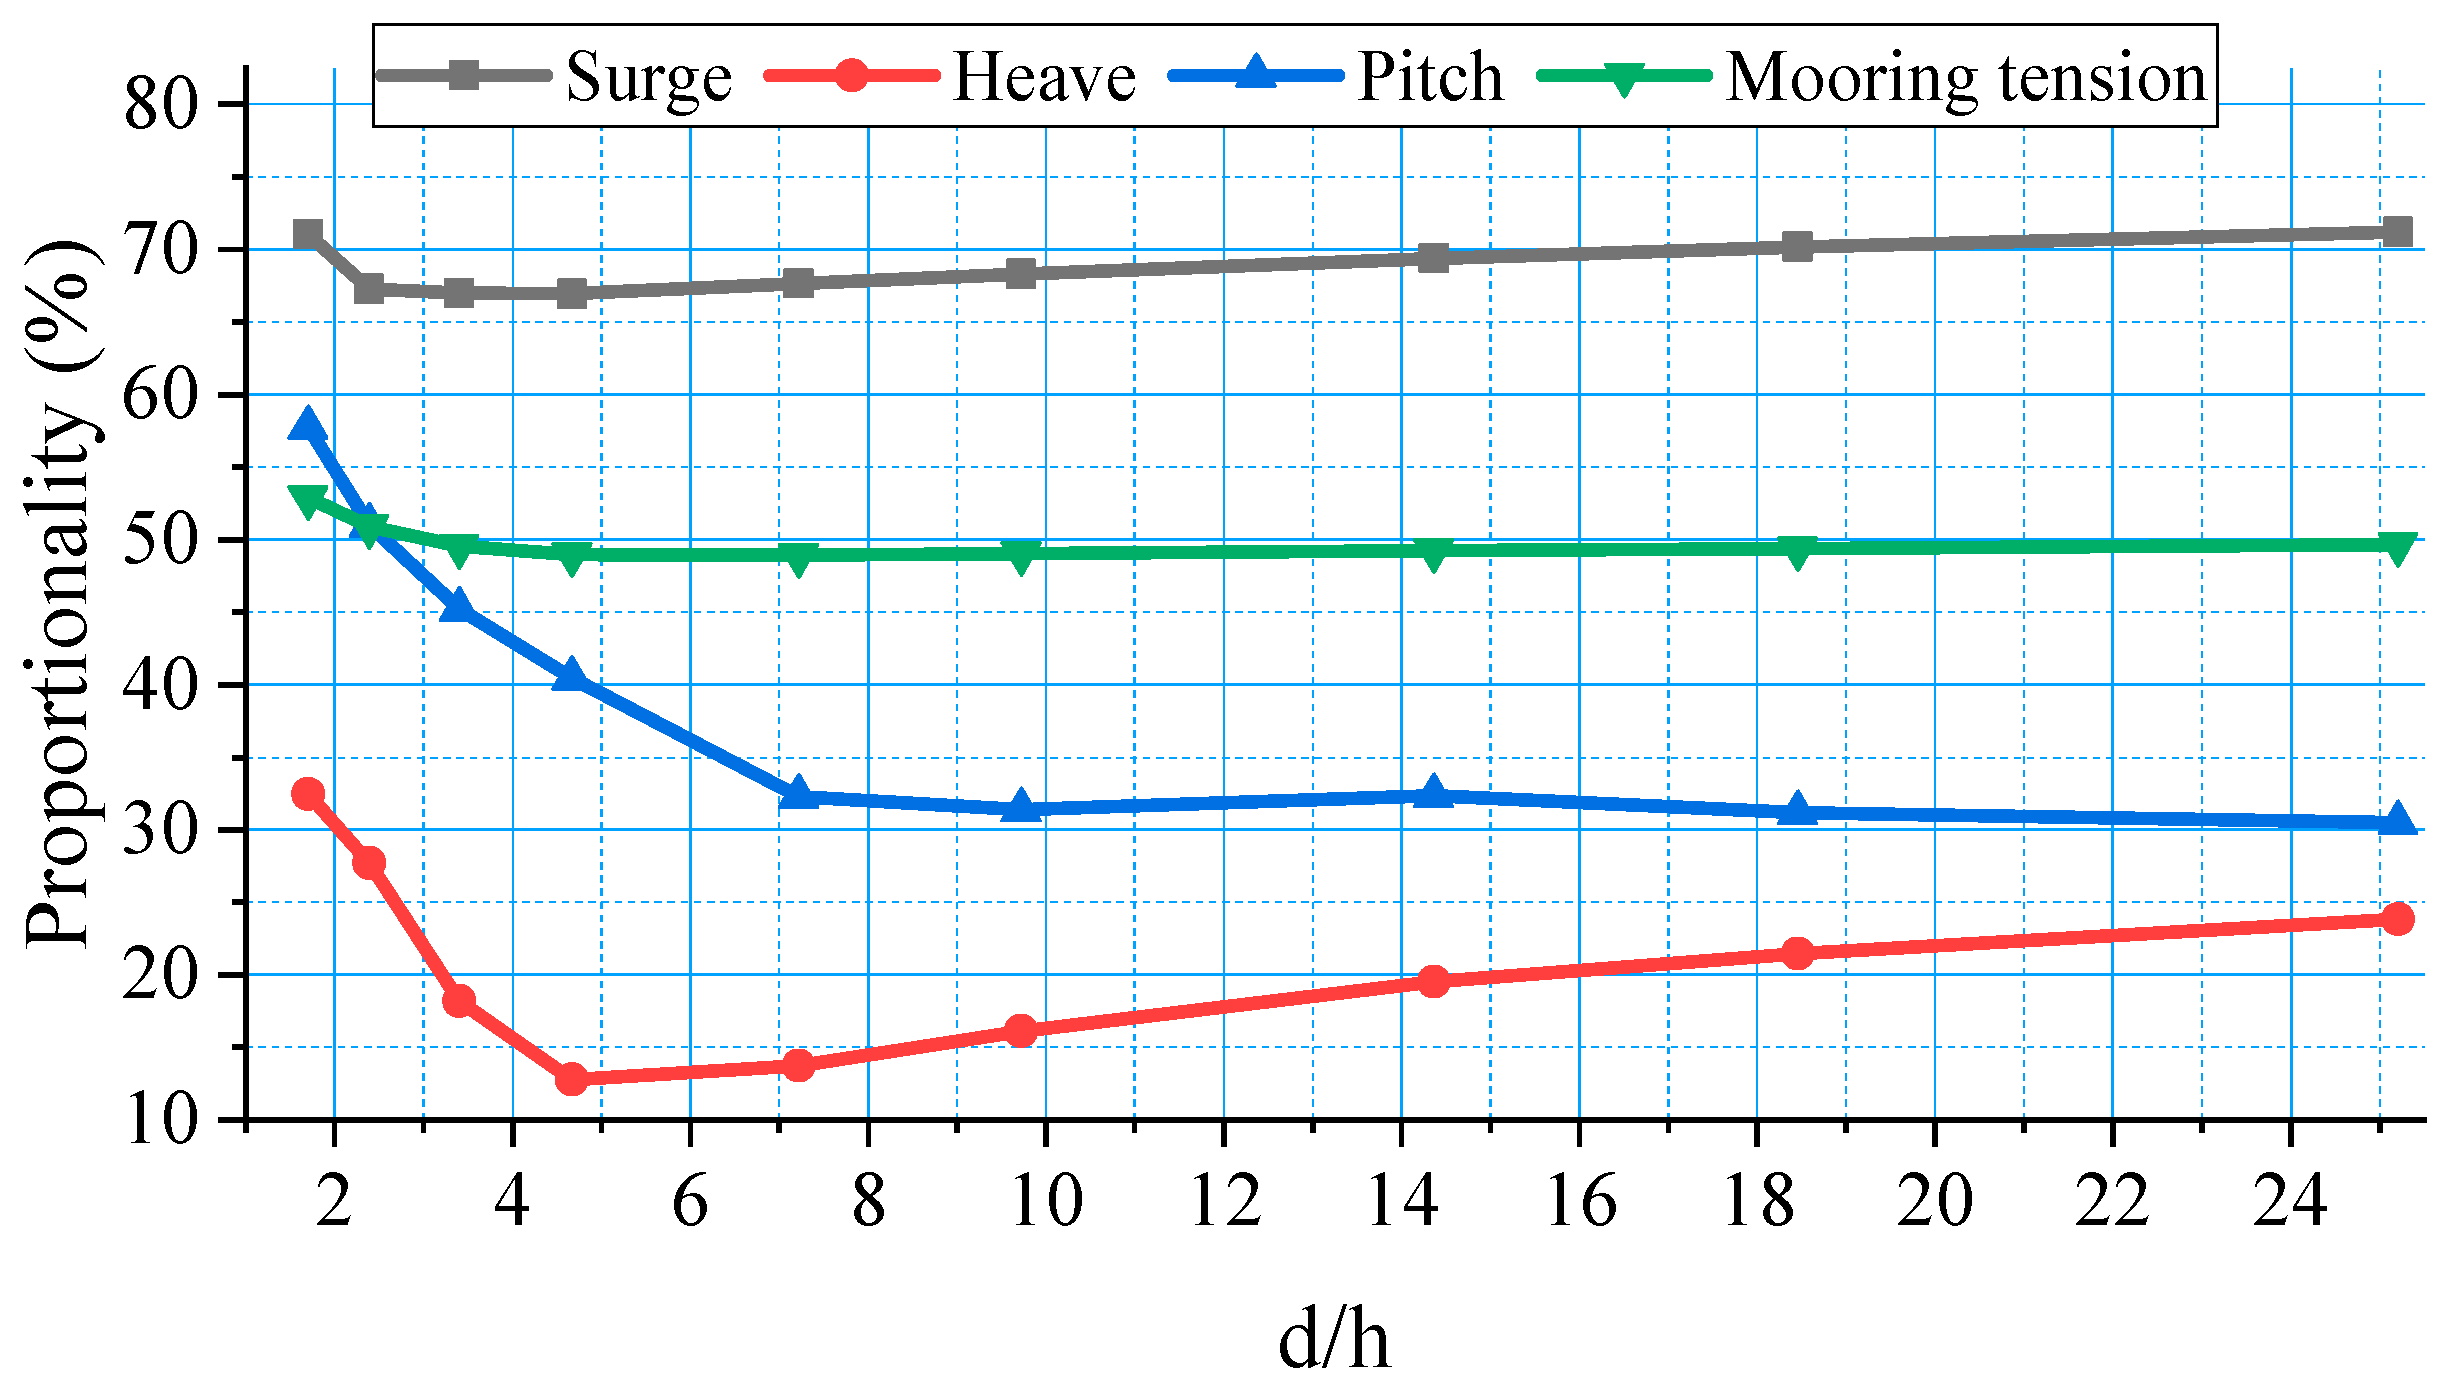
As the maxima extracted from irregular-wave simulations may be affected by stochastic variability, an additional metric was introduced for a more robust comparison. Specifically, the response amplitudes were extracted from each time history, ranked in descending order, and the mean of the largest 10% was calculated. Figure 21 shows the corresponding values normalized by the main body case without a column boot. The results further confirm that the hydrodynamic benefit of increasing d/h is strongly response-dependent and does not follow a simple monotonic trend. The lowest relative surge and heave responses are obtained at about d/h = 2.39 and 4.67, where the corresponding response levels are reduced to about 66.0% and 12.8% of the main body case, respectively. For pitch and mooring line tension, although the absolute minima occur at larger d/h values, most of the achievable improvement is already obtained once d/h reaches a moderate range. In particular, the pitch response has already been reduced to about 32.7% of the main body case at d/h = 7.22, and the mooring line tension to about 46.7% at d/h = 3.40, after which the additional benefit becomes limited. This indicates that the practically preferred d/h does not necessarily coincide with the absolute minimum of every response quantity.
Overall, the time-domain results confirm that increasing d/h does not lead to simultaneous, unlimited improvement in all response quantities. A relatively small-to-moderate d/h is sufficient for reducing surge and mooring line tension, whereas a somewhat larger d/h is more favorable for pitch control. Heave is the most sensitive to excessive increase in d/h because its response depends not only on the natural period and damping, but also on the alignment between the response characteristics and the dominant wave energy range. Therefore, the design value of d/h should be selected by balancing surge, heave, pitch, and mooring tension, rather than by simply maximizing the diameter-to-height ratio.

5.5. Response Spectra and Mechanism Interpretation

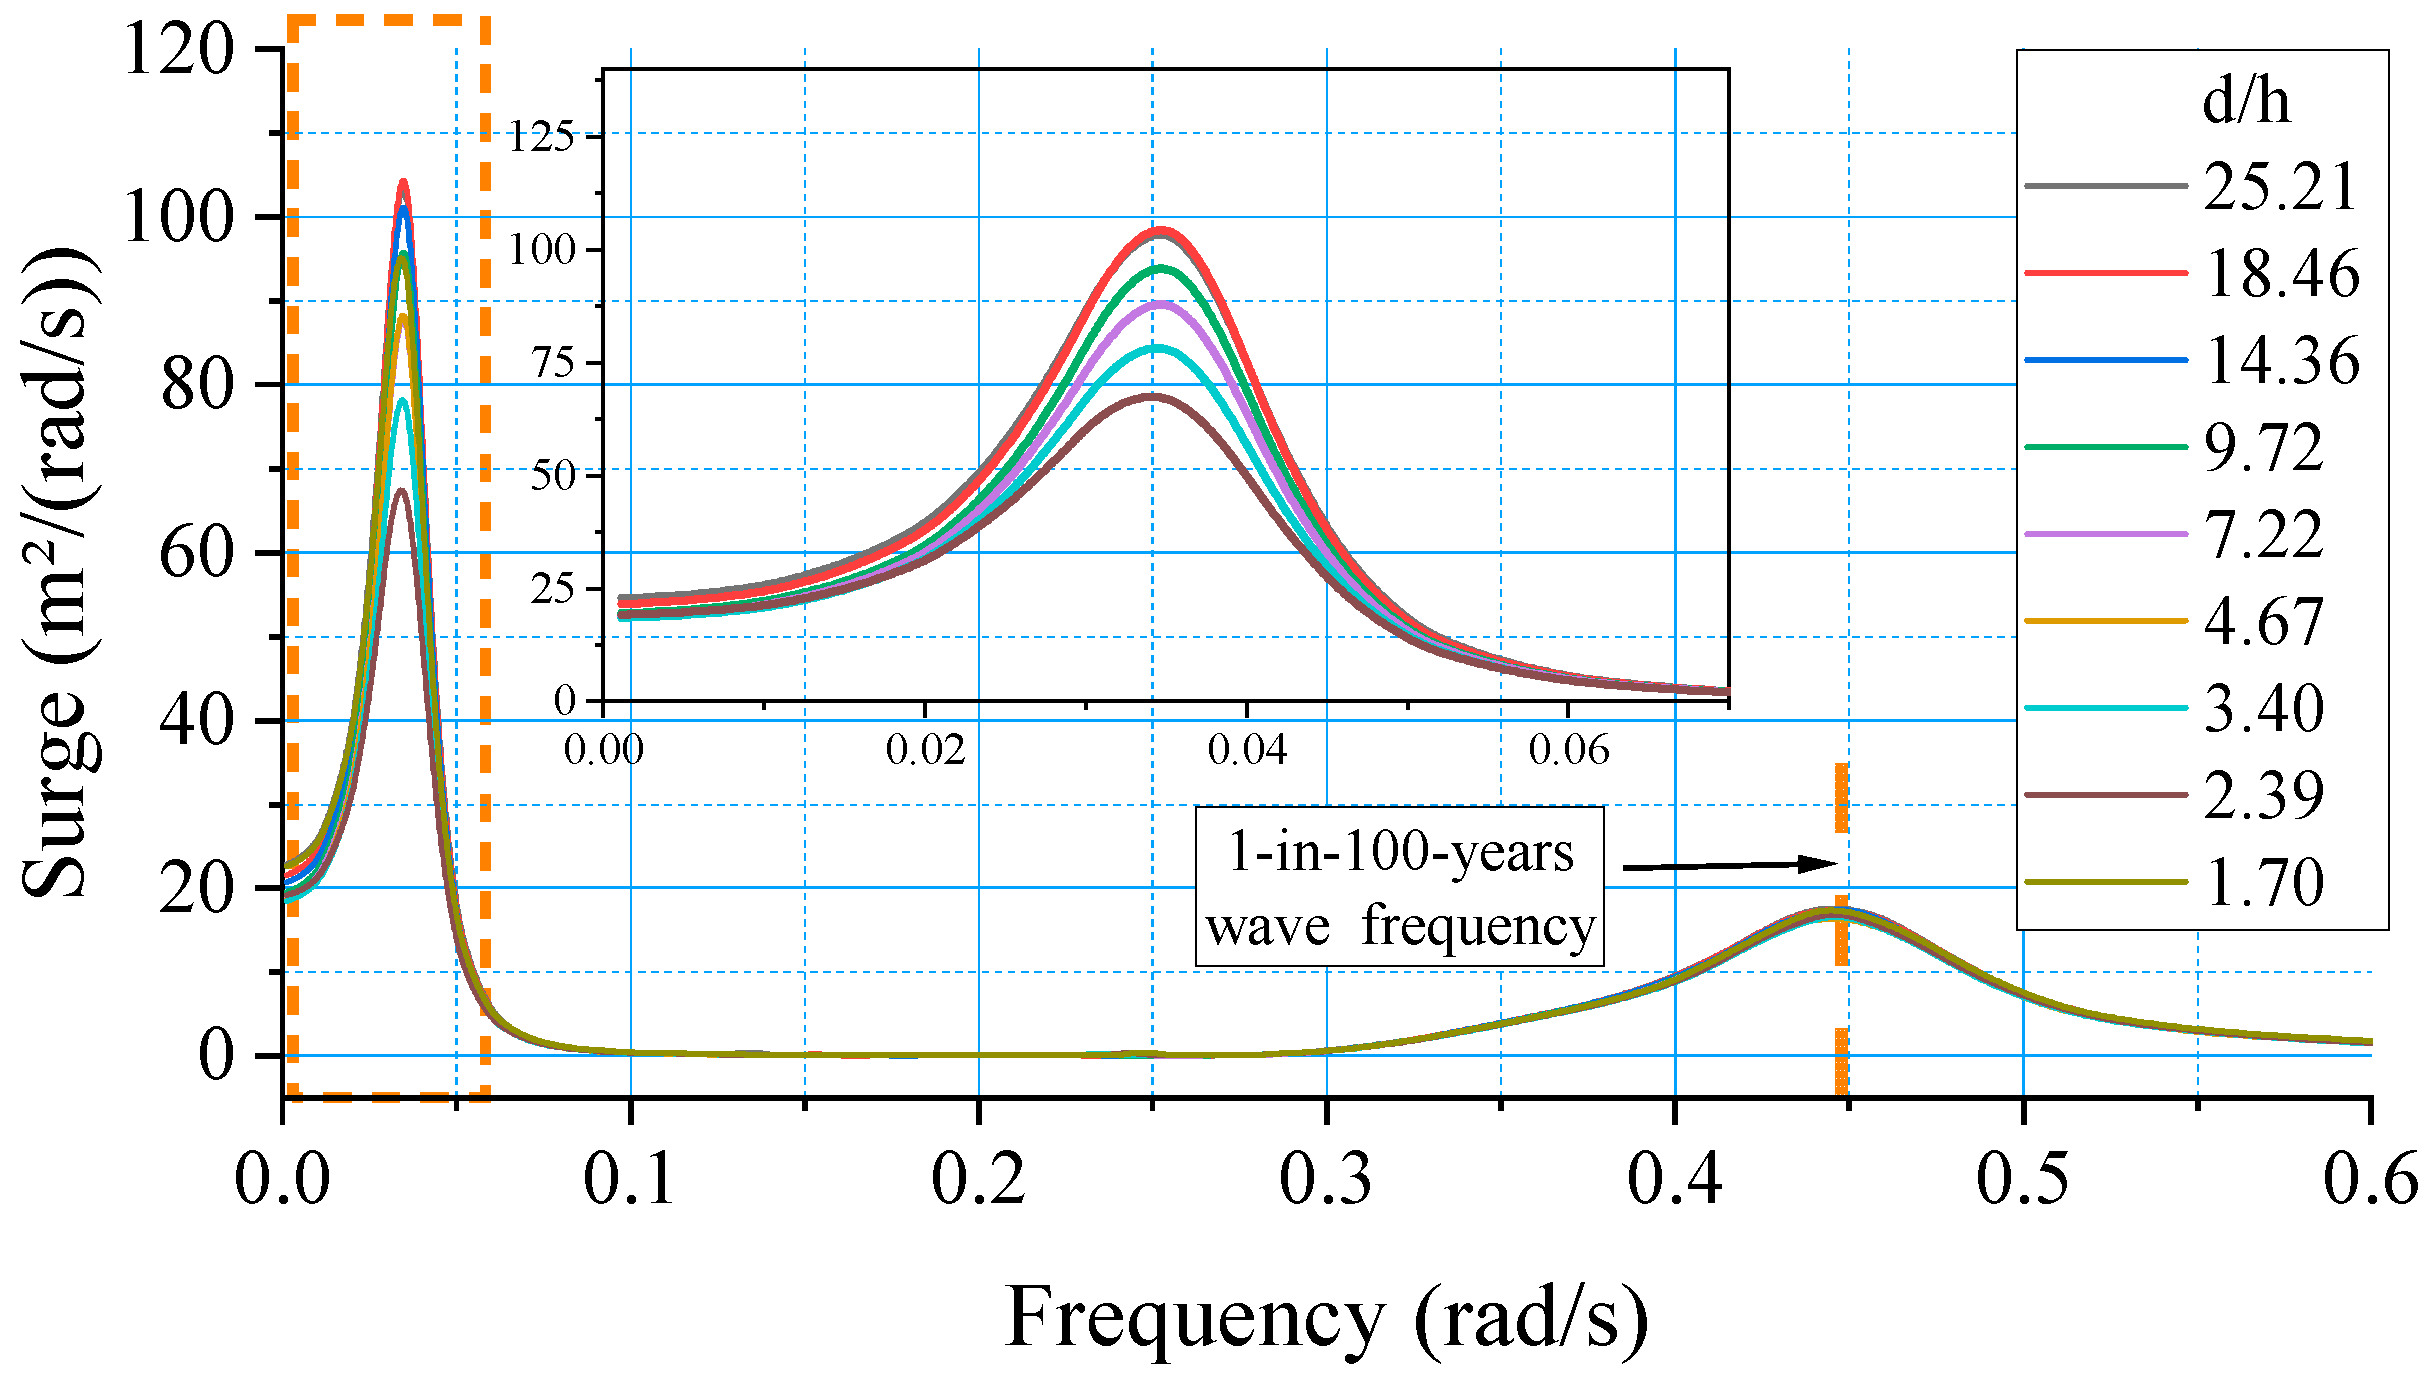
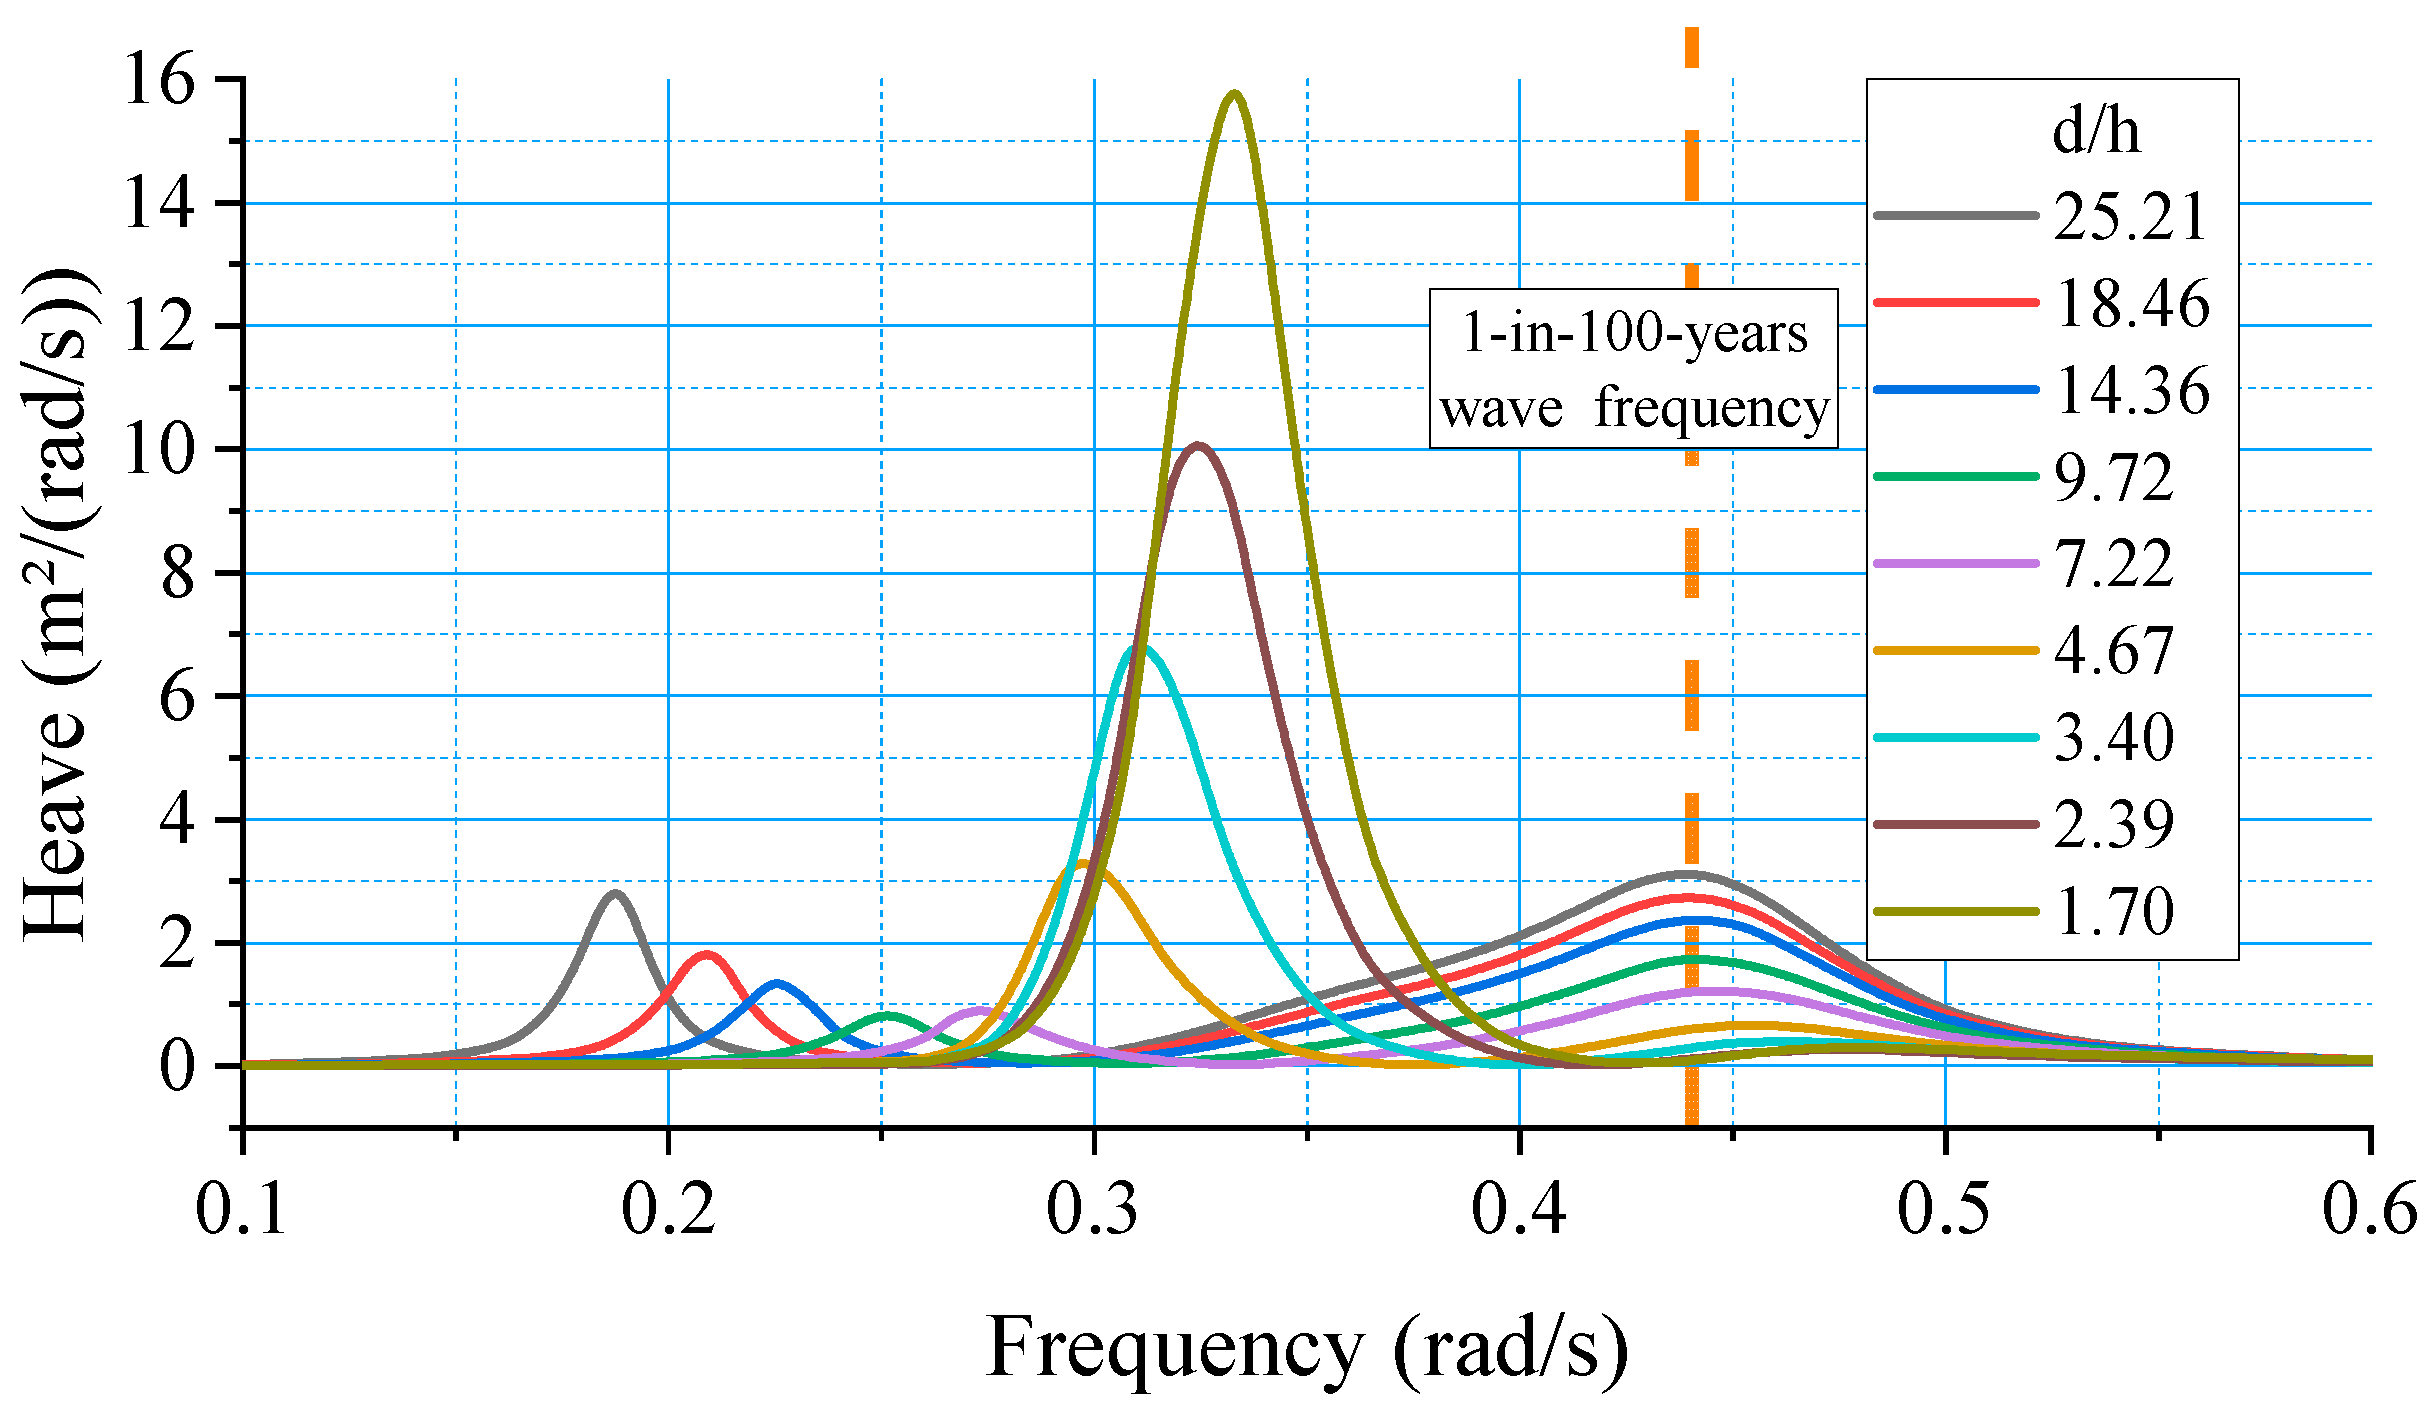
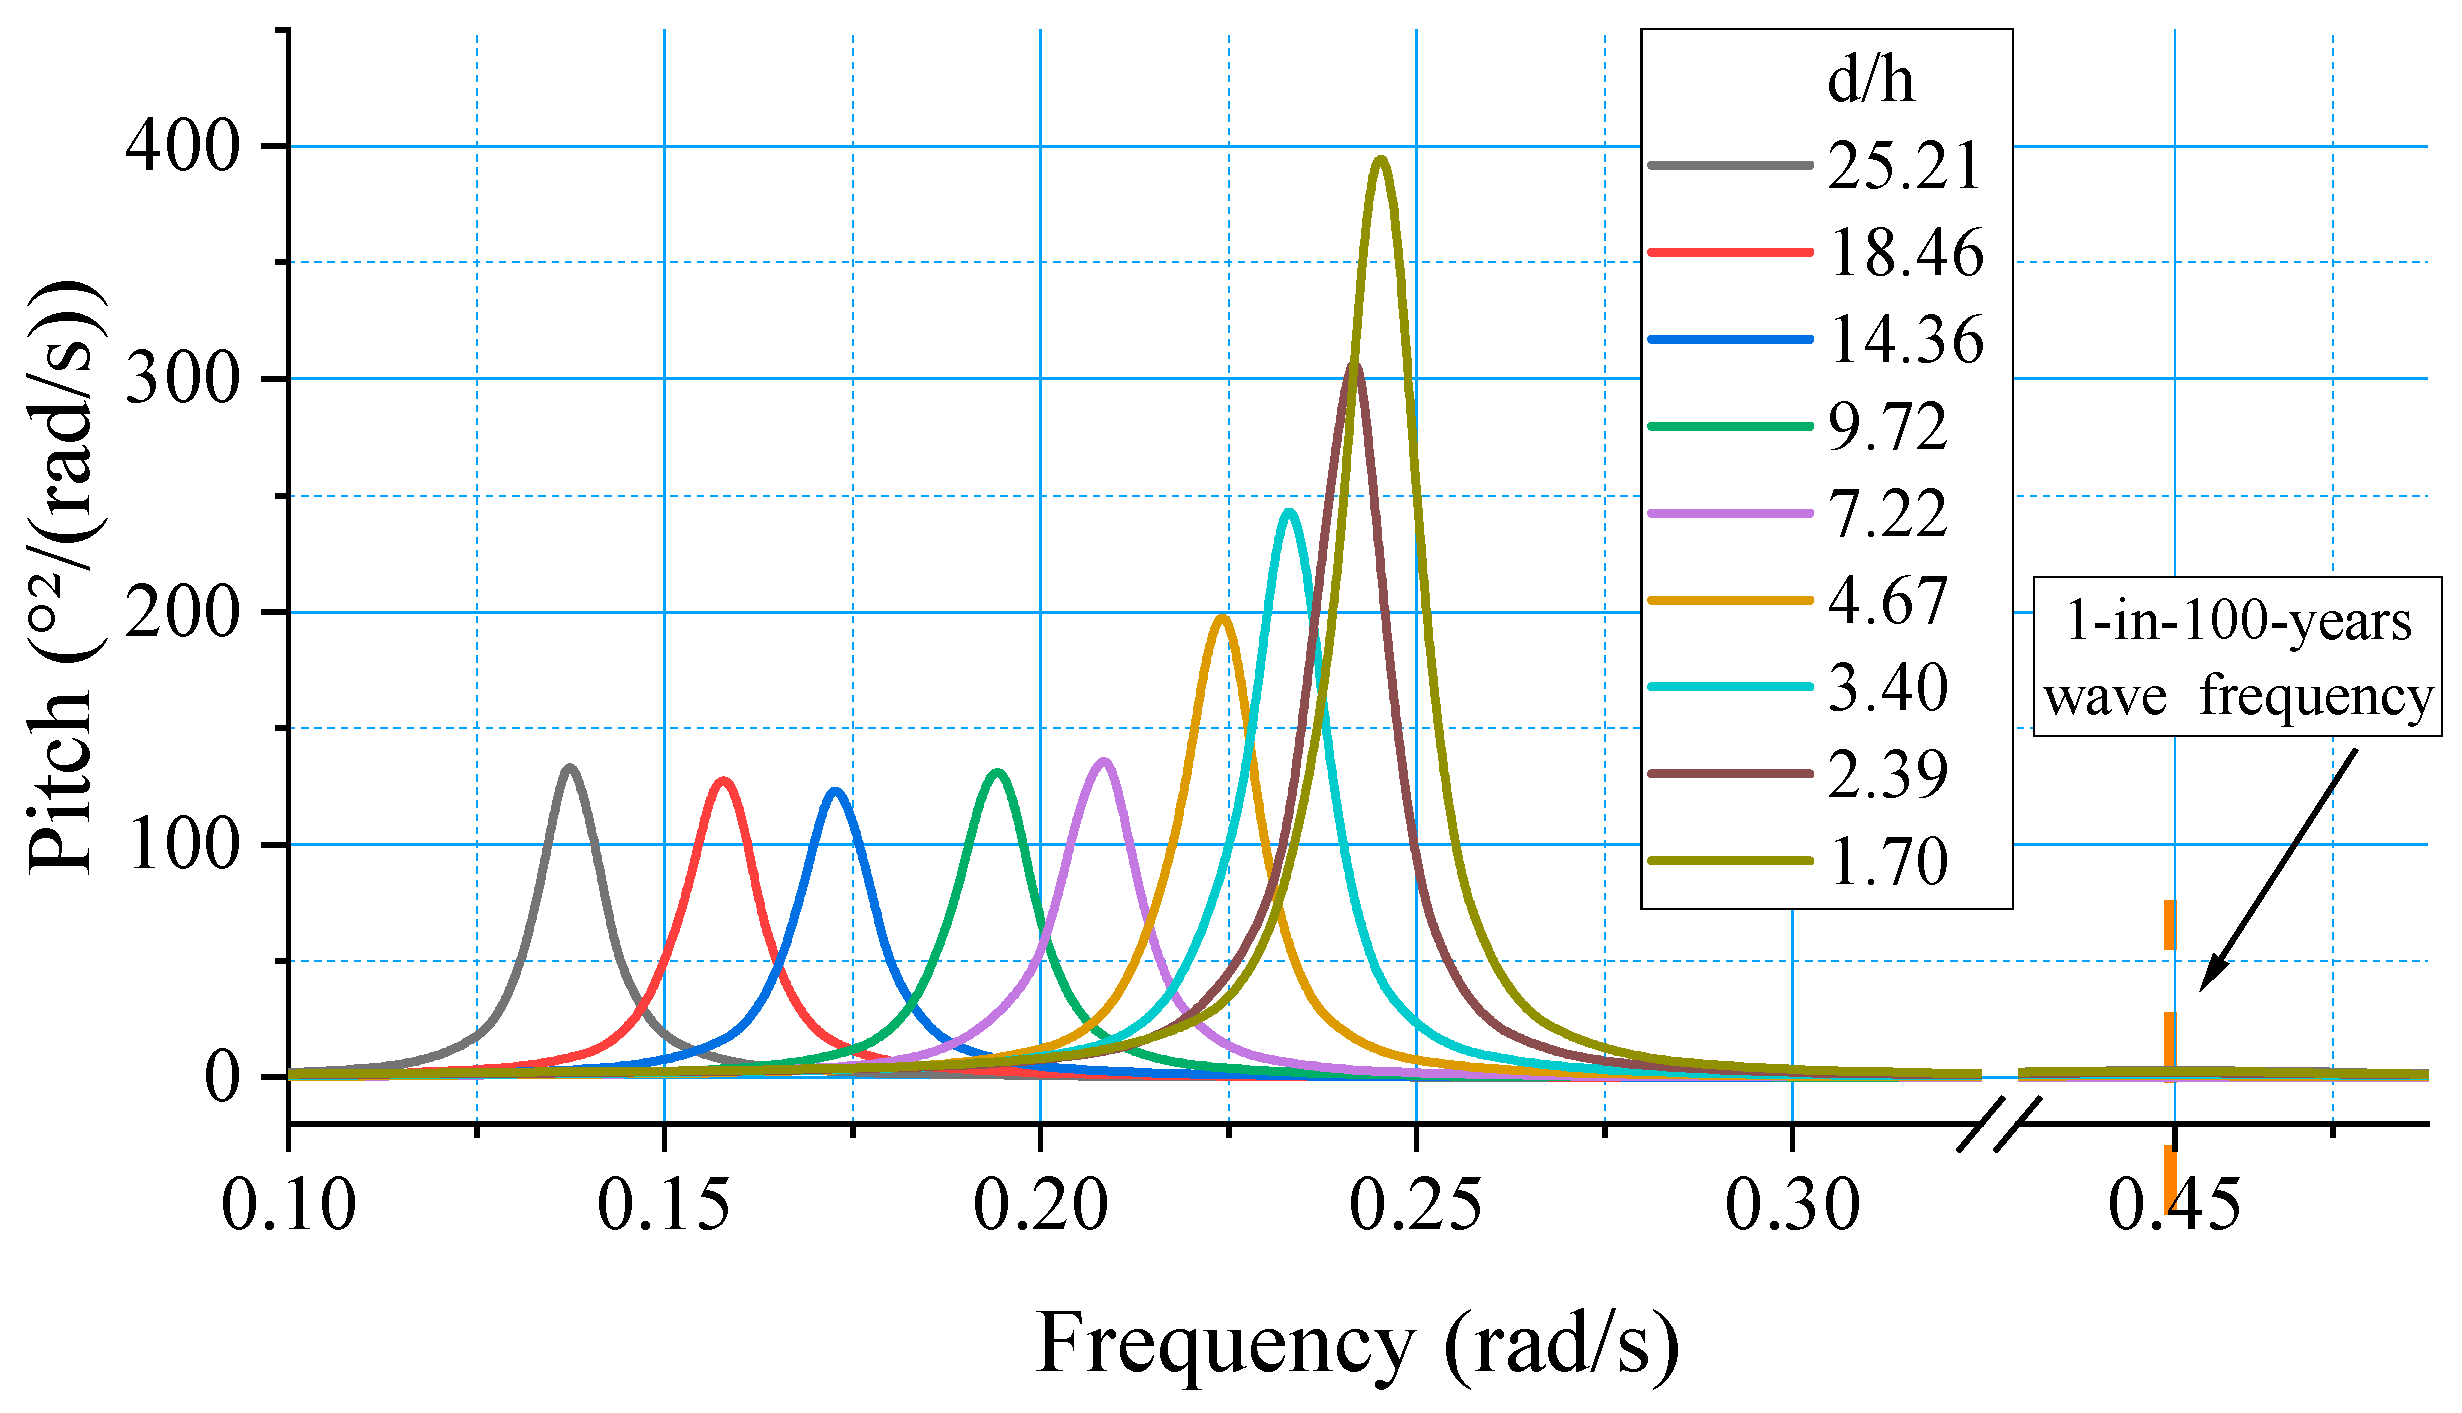
To further clarify the frequency-domain mechanisms underlying the time-domain responses, spectral analyses were conducted for surge, heave, and pitch under the survival sea state using the Frequency Statistical Analysis function in AQWA. The resulting response spectral density curves are shown in Figure 22, Figure 23 and Figure 24. In these figures, the legend values denote the compared diameter-to-height ratios.
Figure 22 shows that the surge response spectrum exhibits a typical bimodal distribution. One component lies in the low-frequency range near the surge natural frequency, and the other is located in the wave frequency range around the dominant frequency of the incident sea state. As d/h increases, the low-frequency spectral peak first decreases and then increases again, with its minimum occurring around d/h = 2.39. This trend agrees with the time-domain surge response and indicates that the reduction in horizontal offset is closely related to the suppression of the low-frequency surge component. At the same time, the wave frequency component becomes gradually more visible with increasing d/h. The surge response under the survival sea state is therefore governed by the combined evolution of the low-frequency drift-related component and the wave frequency component, which explains why its improvement becomes limited once the low-frequency peak has already been sufficiently reduced.
The heave response spectra in Figure 23 show a much stronger dependence on d/h. For small d/h values, the response is dominated by the component near the heave natural frequency, which gives rise to a pronounced principal peak. As d/h increases, this peak is first reduced, indicating that the resonance shift and damping increase are initially favorable for heave suppression. At the same time, the wave frequency component simultaneously increases with d/h. When d/h exceeds about 7.22, the natural frequency-related peak starts to rise again, while the wave frequency component continues to increase. As a result, the total heave response no longer decreases monotonically. This explains why a very large d/h, although beneficial for increasing the heave natural period and damping, may become unfavorable for heave mitigation under the survival sea state.
Compared with surge and heave, the pitch response spectrum in Figure 24 is more concentrated and is dominated by a single principal peak. As d/h increases, the peak shifts toward a lower frequency and its magnitude decreases continuously, although the rate of reduction becomes much smaller once d/h exceeds about 7.22. This indicates that increasing d/h is effective in reducing the dominant resonant pitch component, but the incremental benefit gradually diminishes beyond a moderate range. The more concentrated spectral pattern also explains why the pitch response exhibits a clearer improvement trend than heave in both the frequency and time domains.
Taken together, Figure 22, Figure 23 and Figure 24 show that the effects of d/h on surge, heave, and pitch are governed by distinct spectral mechanisms. Surge is controlled jointly by the low-frequency and wave frequency components, heave by the competition between the natural frequency-related component and the wave frequency component, and pitch mainly by the weakening of a single dominant resonant peak. These results confirm that the role of d/h is not simply to reduce all responses monotonically, but to change how response energy is distributed across different frequency ranges. Therefore, the appropriate value of d/h should be determined according to the target response and the dominant wave conditions of the design sea state.

6. Conclusions

6.1. Main Conclusions

This study investigated the hydrodynamic performance of deep-draft cylindrical offshore platforms equipped with a large annular column boot, while keeping the main body, the total displacement, and the draft constant across all cases. By varying the column boot diameter-to-height ratio d/h, the effects on natural periods, motion damping, RAOs, and survival responses were quantified, and the governing mechanisms were interpreted from both time and frequency-domain perspectives. The main conclusions are as follows:
  • The effects of d/h are much more pronounced in heave and pitch than in surge. As d/h increases, the natural periods of heave and pitch increase markedly, whereas the surge natural period changes only slightly.
  • The increase in heave and pitch natural periods is governed mainly by hydrodynamic added inertia rather than by structural inertia. As d/h increases, the heave added mass grows approximately linearly and gradually becomes the dominant part of the heave inertia term, while the added pitch moment of inertia increases much more rapidly than the structural pitch moment of inertia.
  • Increasing d/h generally enhances motion damping in heave, pitch, and yaw, but its benefit for surge is limited and non-monotonic. The damping in heave, pitch, and yaw increases almost monotonically with increasing d/h, whereas surge damping first increases and then decreases, reaching its maximum around d/h = 7.22. This indicates that enlarging the column boot does not continuously improve low-frequency surge responses.
  • The column boot diameter-to-height ratio affects the actual motion responses by redistributing the relative contributions of different frequency components. As d/h increases, the low-frequency surge and heave responses both decrease first and then increase again, while the wave frequency heave response increases progressively. By contrast, the low-frequency pitch response decreases rapidly at first and then changes more gradually. Consequently, the actual surge and heave responses both show non-monotonic variations, whereas the pitch response improves rapidly at first and then tends to level off. This indicates that increasing d/h is effective only within a moderate range, rather than in a simple wider-is-better manner.
  • For the design of deep-draft cylindrical floating nuclear power platforms with a column boot, no single d/h value can simultaneously optimize all key responses. In the present study, the preferred d/h values are approximately 2.39 for surge, 4.67 for heave, 7.22 for pitch, and 3.40 for mooring line tension, corresponding to reductions of about 34.0%, 87.2%, 67.3%, and 53.3%, respectively, relative to the main body case without a column boot. Beyond these preferred values, the response mitigation efficiency no longer increases significantly and may even decrease for some responses. Therefore, in subsequent platform design and optimization, a reasonable d/h should be selected by balancing the target requirements for surge, heave, pitch, and mooring performance under the design sea state.
In summary, this study clarifies that, under constant total displacement and draft, the column boot diameter-to-height ratio of a deep-draft cylindrical platform is not only a design variable whose effect depends on the target response, but also a parameter that does not simply follow a larger-is-better rule. Different responses correspond to different preferred d/h values, and once d/h exceeds the effective range, the additional mitigation effect becomes limited and may even deteriorate for some responses. Within the present platform scale, geometric constraints, and environmental conditions, the preferred d/h values and the corresponding reduction levels identified for surge, heave, pitch, and mooring line tension provide direct quantitative guidance for column boot sizing and for the parameter setting and optimization of similar platforms. This constitutes the practical significance of the present study.

6.2. Limitations and Future Work

The present conclusions are obtained for a deep-draft cylindrical platform of about 100,000 t displacement under a representative survival sea state in the western South China Sea, with the main body geometry unchanged and the total displacement and draft kept constant across the compared cases. Therefore, the recommended d/h range should be interpreted within the present platform scale, geometric constraints, and environmental conditions. In addition, the viscous contribution is introduced through equivalent linear damping identified from CFD free-decay simulations, which is effective for the present hybrid analysis framework but may not fully represent more complex nonlinear viscous effects.
Future work should therefore focus on extending the present analysis to different platform scales, environmental conditions, and independent variations in column boot diameter and height, while further improving the methodology through more systematic model tests or higher fidelity nonlinear simulations. Such efforts would help to improve the generality and robustness of the present design recommendations.

Author Contributions

C.Q. contributed to conceptualization, methodology, numerical simulation, data analysis, and writing (original draft, review and editing). Z.C. contributed to methodology and writing (review and editing). Y.H. contributed to conceptualization, methodology, supervision, project administration, and funding acquisition. Y.L. contributed to methodology and supervision. All authors have read and agreed to the published version of the manuscript.

Funding

This study is supported by the National Natural Science Foundation of China (grant number: 52571352 and 52301330), the Fundamental Research Funds for the Central Universities, the Hainan Provincial Natural Science Foundation of China (grant number: 625QN400), and the Specialized Scientific Research Fund of State Key Laboratory of Submarine Geoscience (grant number: SGLabZZKT2025-02).

Data Availability Statement

The original contributions presented in this study are included in the article. Further inquiries can be directed to the corresponding author.

Conflicts of Interest

The authors declare no conflicts of interest.

Abbreviations

ABSAmerican Bureau of Shipping
APIAmerican Petroleum Institute
CCSChina Classification Society
CFDComputational Fluid Dynamics
DCOPDeep-Draft Cylindrical Offshore Platform
FPSOFloating Production Storage and Offloading
JONSWAPJoint North Sea Wave Project (spectrum)
RAOResponse Amplitude Operator
R5R5 grade (mooring chain grade)
SSTShear Stress Transport (k–ω SST turbulence model)

Nomenclature

B 1 Linearized total damping coefficient
B c r i t Critical damping coefficient
B r a d Radiation damping coefficient
B v i s Viscous damping coefficient
DMain body diameter
dColumn boot diameter
d/hColumn boot diameter-to-height ratio
F 1 First-order wave force
F 2 h i g h Second-order high-frequency wave force
F 2 l o w Second-order low-frequency wave force
F c u r r e n t Current load
F o t h e r s Other external loads
F w i n d Wind load
G-XYZBody-fixed coordinate system
HPlatform draft
hColumn boot height
JStructural pitch moment of inertia
K m o o r i n g Mooring restoring stiffness
K s t i l l w a t e r Hydrostatic restoring stiffness
MStructural mass
O-xyzEarth-fixed coordinate system
X Motion displacement
X ˙ Motion velocity
X ¨ Motion acceleration
x, y, zSpatial coordinates
Φ Velocity potential
w N Natural circular frequency
ζ Damping ratio
ϕ A n n-th decay amplitude
ϕ A n + 1 (n + 1)-th decay amplitude
ΔJPitch added moment of inertia
ΔMHeave added mass

References

  1. Enevoldsen, P.; Sovacool, B.K. Integrating power systems for remote island energy supply: Lessons from Mykines, Faroe Islands. Renew. Energy 2016, 85, 642–648. [Google Scholar] [CrossRef]
  2. Ford, M.J.; Abdulla, A.; Morgan, M.G. Evaluating the Cost, Safety, and Proliferation Risks of Small Floating Nuclear Reactors. Risk Anal. 2017, 37, 2191–2211. [Google Scholar] [CrossRef] [PubMed]
  3. Hidayatullah, H.; Susyadi, S.; Subki, M.H. Design and technology development for small modular reactors—Safety expectations, prospects and impediments of their deployment. Prog. Nucl. Energy 2015, 79, 127–135. [Google Scholar] [CrossRef]
  4. Qiu, R.; Zhao, C.; Gao, H. Summary of Russian floating nuclear power plant “Akademik Lomonosov”. Foreign Nucl. News 2020, 4, 29–31. [Google Scholar]
  5. Li, Q.; Song, D.; Zeng, W.; Chen, Z.; Liu, J.; Wang, D.; Xiao, R. Overall Design and Verification of ACP100S Floating Nuclear Power Plant. Nucl. Power Eng. 2020, 41, 189–192. [Google Scholar] [CrossRef]
  6. Baghernezhad, N.; Edalat, P.; Etemaddar, M. Hull Performance Assessment and Comparison of Ship-Shaped and Cylindrical FPSOs With Regards to: Stability, Sea-Keeping, Mooring and Riser Loads in Shallow Water. Int. J. Marit. Technol. 2017, 8, 1–13. [Google Scholar] [CrossRef]
  7. Buongiorno, J.; Jurewicz, J.; Golay, M.; Todreas, N. The offshore floating nuclear plant concept. Nucl. Technol. 2016, 194, 1–14. [Google Scholar] [CrossRef]
  8. Wang, Z.; He, Y.; Zhang, W.; Liu, Y.; Zeng, M.; Qin, C. Hydrodynamic Characteristics and Motion Response Performance of Deep-Draft Cylindrical Offshore Nuclear Power Platform. China Offshore Platf. 2023, 38, 1–8. [Google Scholar] [CrossRef]
  9. Qin, C.; He, Y.; Wang, Z.; Liu, Y.; Chen, Z. Numerical Analysis of Hydrodynamic Characteristics of Deep-Draft Cylindrical Offshore Nuclear Power Platform. In Proceedings of the ISOPE International Ocean and Polar Engineering Conference, Ottawa, ON, Canada, 18–23 June 2023; pp. 1024–1031. [Google Scholar]
  10. Shen, W.-j.; Tang, Y.-g.; Liu, L.-q. Research on the hydrodynamic characteristics of heave plate structure with different form edges of a spar platform. China Ocean Eng. 2012, 26, 177–184. [Google Scholar] [CrossRef]
  11. Jiang, M.; Li, D.; Wang, Z.; Jia, X.; Yu, Y. Hydrodynamic Study on the Damping Characteristics of Cylindrical FPSO With the Heave Plate. In Proceedings of the ASME 2020 39th International Conference on Ocean, Offshore and Arctic Engineering, Virtual, 3–7 August 2020; p. V001T001A038. [Google Scholar]
  12. Hao, W.; Zhao, W.; Wan, D.; Deng, S. Damping performance of anti-motion structures on cylindrical FPSO. Chin. J. Hydrodyn. 2022, 37, 393–400. [Google Scholar]
  13. Li, C.; Li, X.; Tian, X.; Guo, X.; Zhang, X.; Lu, W. Motion Characteristics of Cylindrical FPSO Platform Affected by Different Damping Plate Form. Ship Eng. 2023, 45, 151–159. [Google Scholar]
  14. Qin, C.; Chen, Z.; He, Y.; Wang, Z.; Zeng, M.; Cao, C. Experimental study on dynamic response of deep-draft cylindrical offshore platform under wave loads. J. Ocean Eng. Sci. 2025, 10, 830–850. [Google Scholar] [CrossRef]
  15. Wang, Z. Motion Response Characteristics of a Deep-Draft Cylindrical Offshore Nuclear Power Platform. Master’s Thesis, Shanghai Jiao Tong University, Shanghai, China, 2023. [Google Scholar]
  16. Zong, F. Research on Distributions and Variations of Sea Wave and Wave Energy in South China Sea During Recent 20 Years; Ocean University of China: Qingdao, China, 2014. [Google Scholar]
  17. Liu, Y.; Li, S.; Yi, Q.; Chen, D. Wind Profiles and Wave Spectra for Potential Wind Farms in South China Sea. Part II: Wave Spectrum Model. Energies 2017, 10, 127. [Google Scholar] [CrossRef]
  18. SY/T 10032-2000; Rules for Building and Classing Single Point Moorings. China Classification Society: Beijing, China, 2000.
  19. China Classification Society. Rules for the Classification of Mobile Offshore Units; China Classification Society: Beijing, China, 2023. [Google Scholar]
  20. American Bureau of Shipping. Requirements for Nuclear Power Systems for Marine and Offshore Applications, October 2024 ed.; American Bureau of Shipping: Spring, TX, USA, 2024. [Google Scholar]
  21. Dai, Y.; Duan, W. Potential Flow Theory of Ships Moving in Waves; National Defence Industry Press: Beijing, China, 2008. [Google Scholar]
  22. Jiang, C.; el Moctar, O.; Schellin, T.E. Capability of a potential-flow solver to analyze articulated multibody offshore modules. Ocean Eng. 2022, 266, 112754. [Google Scholar] [CrossRef]
  23. Newman, J.N. The Theory of Ship Motions*1Preparation of this article was supported by the National Science Foundation and by the Office of Naval Research. In Advances in Applied Mechanics; Yih, C.-S., Ed.; Elsevier: Amsterdam, The Netherlands, 1979; Volume 18, pp. 221–283. [Google Scholar]
  24. Ansys. ANSYS Document: Theory Manual, Hydrodynamic Radiation and Diffraction Analysis by Source Distribution Method; Ansys Inc.: Canonsburg, PA, USA, 2023. [Google Scholar]
  25. Malta, E.B.; Gonçalves, R.T.; Matsumoto, F.T.; Pereira, F.R.; Fujarra, A.L.; Nishimoto, K. Damping coefficient analyses for floating offshore structures. In Proceedings of the ASME 2010 29th International Conference on Ocean, Offshore and Arctic Engineering; The American Society of Mechanical Engineers: New York, NY, USA, 2010; pp. 83–89. [Google Scholar]
  26. Wang, Y.; Tang, Z.; Wang, L.; Wang, X. Linear and quadratic damping coefficients of a single module of a very large floating structure over variable bathymetry: Physical and numerical free-decay experiments. J. Ocean Eng. Sci. 2022, 7, 607–618. [Google Scholar] [CrossRef]
  27. Menter, F.R. Two-equation eddy-viscosity turbulence models for engineering applications. AIAA J. 1994, 32, 1598–1605. [Google Scholar] [CrossRef]
  28. Wilcox, D.C. Reassessment of the scale-determining equation for advanced turbulence models. AIAA J. 1988, 26, 1299–1310. [Google Scholar] [CrossRef]
  29. Subbulakshmi, A.; Sundaravadivelu, R. Effects of damping plate position on heave and pitch responses of spar platform with single and double damping plates under regular waves. Ocean Eng. 2021, 224, 108719. [Google Scholar] [CrossRef]
  30. Liu, Y.; Zhao, Z.; Wang, Y.; Zhao, F.; Lu, D.; Cao, Q. Dynamic response of a multi-point mooring cylindrical floating nuclear power platform carrying a small-scale reactor. Ocean Eng. 2023, 267, 113121. [Google Scholar] [CrossRef]
Figure 1. Schematic central longitudinal section of deep-draft cylindrical offshore nuclear power platform.
Jmse 14 00584 g001
Figure 2. Simplified platform model adopted for parametric study (example case: d/h = 7.22).
Jmse 14 00584 g002
Figure 3. Central longitudinal sections of platforms with different column boot d/h ratios.
Jmse 14 00584 g003
Figure 4. Definition of 4 × 3 grouped mooring layout. The red dashed circle indicates the mooring radius range, and #1–#12 indicate the mooring point numbers.
Jmse 14 00584 g004
Figure 5. The workflow of the numerical methodology used in this study.
Jmse 14 00584 g005
Figure 6. Representative computational domain, boundary conditions, overset region, and local mesh refinement adopted in STAR-CCM+ free-decay simulations.
Jmse 14 00584 g006
Figure 7. Free-decay responses under different basic mesh sizes for CFD mesh independence analysis: (a) heave; (b) pitch.
Jmse 14 00584 g007
Figure 8. Experimental model and measurement arrangement for validation.
Jmse 14 00584 g008
Figure 9. Comparison of free-decay time histories for heave and roll: (a) heave; (b) roll.
Jmse 14 00584 g009
Figure 10. Comparison of heave and pitch RAOs from model tests and AQWA simulations: (a) heave; (b) pitch.
Jmse 14 00584 g010
Figure 11. A comparison of natural periods for the platforms with different d/h. The horizontal axis represents the compared d/h values, with x = 0 corresponding to the main body case.
Jmse 14 00584 g011
Figure 12. A comparison of motion damping for the platforms with different d/h: (a) surge; (b) heave; (c) pitch; (d) yaw. The horizontal axis represents the compared d/h values, with x = 0 corresponding to the main body case.
Jmse 14 00584 g012
Figure 13. A comparison of structural mass and heave added mass at the heave natural period. The horizontal axis represents the compared d/h values, with x = 0 corresponding to the main body case.
Jmse 14 00584 g013
Figure 14. A comparison of structural pitch moment of inertia and added pitch moment of inertia at the pitch natural period. The horizontal axis represents the compared d/h values, with x = 0 corresponding to the main body case.
Jmse 14 00584 g014
Figure 15. A comparison of heave RAOs for the platforms without mooring: (a) the full period range; (b) a zoomed-in view of 5 to 20 s. The dashed lined square in panel (a) indicates the range shown in panel (b). The legend values denote the compared column boot diameter-to-height ratios (d/h).
Jmse 14 00584 g015
Figure 16. A comparison of pitch RAOs for the platforms without mooring: (a) the full period range; (b) a zoomed-in view of 2.5 to 20 s. The dashed lined square in panel (a) indicates the range shown in panel (b). The legend values denote the compared column boot diameter-to-height ratios (d/h).
Jmse 14 00584 g016
Figure 17. A comparison of surge response statistics for the platforms under the 180° load direction. The horizontal axis labels denote the compared d/h cases, and the orange dashed line indicates the response limit.
Jmse 14 00584 g017
Figure 18. A comparison of mooring line tension response statistics for the platforms under the 225° load direction. The horizontal axis labels denote the compared d/h cases, and the orange dashed line indicates the response limit.
Jmse 14 00584 g018
Figure 19. A comparison of heave response statistics for the platforms under the 180° load direction. The horizontal axis labels denote the compared d/h cases, and the orange dashed line indicates the response limit.
Jmse 14 00584 g019
Figure 20. A comparison of pitch response statistics for the platforms under the 180° load direction. The horizontal axis labels denote the compared d/h cases, and the orange dashed line indicates the response limit.
Jmse 14 00584 g020
Figure 21. Comparison of normalized response levels based on the mean of the largest 10% amplitudes, expressed as percentages of the main body case without a column boot.
Jmse 14 00584 g021
Figure 22. Surge response spectra for the platforms under the 180° load direction. The legend values denote the compared column boot diameter-to-height ratios (d/h). The dashed-line square indicates the range of the enlarged view.
Jmse 14 00584 g022
Figure 23. Heave response spectra for the platforms under the 180° load direction. The legend values denote the compared column boot diameter-to-height ratios (d/h).
Jmse 14 00584 g023
Figure 24. Pitch response spectra for the platforms under the 180° load direction. The legend values denote the compared column boot diameter-to-height ratios (d/h).
Jmse 14 00584 g024
Table 1. Main particulars of baseline DCOP.
ItemUnitPlatformMain BodyColumn Boot
Displacementt104,10171,52232,579
Draft (H)m4242-
Center of gravitym14.6518.556.08
Main body diameter (D)m4646-
Column boot diameter (d)m78-78
Column boot height (h)m10-10
Pitch radius of gyrationm2829.3922.40
Table 2. Key platform parameters for different column boot d/h ratios.
d/hd (m)h (m)Center of Gravity (m)Pitch Radius of Gyration (m)
1.7057.0333.618.0327.09
2.3960.2625.216.7627.12
3.4064.3218.915.8227.35
4.6768.6614.715.1827.64
7.2275.8510.514.5528.14
9.7281.638.414.2428.53
14.3690.446.313.9229.13
18.4696.915.2513.7629.57
25.21105.884.213.6130.20
Table 3. Mooring system parameters.
ItemGradeNominal DiameterLengthWeight in AirAxial StiffnessBreaking Strength
ValueR5 Stud120 mm1257 m315 kg/m15,291 MN9720 kN
Table 4. Environmental parameters for survival sea state.
ItemDescriptionWindWaveCurrent
Wind Speed 10 m
Above Sea Level
Significant
Wave Height
Spectral Peak
Period (s)
Spectral
Parameter (γ)
Surface
Velocity
Survival sea state1-in-100 years43.1 m/s10.5 m14.02.731.56 m/s
Table 5. Acceptance limits of response metrics for survival sea state.
ItemDynamic Inclination AngleHorizontal DisplacementHeaveMooring Chain Tension Load Safety Factor
Survival sea state15°31.5 m3 m1.67
Table 6. Convergence of natural periods and representative amplitudes with different basic mesh sizes.
Basic Mesh Size
(m)
Cell
Number
(millions)
Heave Natural Period (s)Heave Period Deviation
(%)
5th Positive Heave Amplitude
(m)
Heave Amplitude Deviation
(%)
Pitch Natural Period
(s)
Pitch Period Deviation
(%)
5th Positive Pitch Amplitude
(deg)
Pitch Amplitude Deviation
(%)
0.123.8822.7530.0030.01284.77633.7150.6023.7154.565
0.114.9522.7640.0450.01382.76133.5160.0074.0483.978
0.16.3622.7480.0240.01302.98533.5130.0003.8680.625
0.098.6522.75400.0134033.51303.8930
Table 7. Validation of natural periods from free-decay simulations.
ItemExperiment
Values
STAR-CCM+
Values
STAR-CCM+
Errors (%)
AQWA
Values
AQWA
Errors (%)
Heave natural period22.26 s22.612 s1.58122.259 s0.003
Roll natural period32.73 s32.328 s1.22932.149 s1.776
Disclaimer/Publisher’s Note: The statements, opinions and data contained in all publications are solely those of the individual author(s) and contributor(s) and not of MDPI and/or the editor(s). MDPI and/or the editor(s) disclaim responsibility for any injury to people or property resulting from any ideas, methods, instructions or products referred to in the content.