Article

Interpretation of the Preconsolidation Stress in Soft Clay Using the One-Dimensional Consolidation Test


1
School of Civil & Environmental Engineering, Hankyong National University, 327 Jungang-ro, Anseong-si 17579, Gyeonggi-do, Republic of Korea
2
Energy Innovative Industry Department, Green Energy Institute, 177 Samhyangcheon-ro, Mokpo-si 58656, Jeollanam-do, Republic of Korea
3
Construction Engineering Research Institute, Hankyong National University, 327 Jungang-ro, Anseong-si 17579, Gyeonggi-do, Republic of Korea
*
Authors to whom correspondence should be addressed.
J. Mar. Sci. Eng. 2026, 14(8), 740; https://doi.org/10.3390/jmse14080740
Submission received: 6 March 2026 / Revised: 6 April 2026 / Accepted: 13 April 2026 / Published: 17 April 2026
(This article belongs to the Special Issue Marine Geotechnical Applications in Marine Structures)

Abstract

This study explores interpretation methods for determining the preconsolidation stress from one-dimensional consolidation test results. Twelve reconstituted clay specimens with targeted preconsolidation stresses of 60 and 120 kPa were prepared using commercial kaolinite and marine clays collected from coastal regions of South Korea. Five representative interpretation methods were applied, and the influence of maximum applied stress levels of 320, 640, and 1280 kPa was evaluated. The results indicate that the estimated preconsolidation stress varies considerably depending on both the interpretation method and the maximum applied stress, particularly for rounded compression curves with gradually changing virgin compression slopes. To address these limitations, a new interpretation approach is proposed. The method utilizes the rebound slope obtained from an unload–reload cycle and defines the virgin compression line through linear regression without identifying the recompression–virgin compression boundary. The proposed method demonstrated reduced sensitivity to the maximum applied stress and provided more reproducible estimates for rounded compression curves, although further validation using natural clays considering sample disturbance effects is required.

1. Introduction

Consolidation refers to the process in which excess pore pressure is generated in saturated clay under external loading, followed by a gradual dissipation of pore water that results in an increase in effective stress and a corresponding reduction in soil volume [1,2,3]. The rate of consolidation settlement is governed by the dissipation characteristics of excess pore pressure, which depend primarily on soil permeability and drainage conditions. In low-permeability clay deposits, pore water dissipation is significantly delayed, leading to long-term settlement that may continue for many years. Therefore, accurate prediction of consolidation settlement is essential for reliable geotechnical design [4].
Clay deposits are widely distributed in coastal and offshore regions. In South Korea, large-scale infrastructure projects, such as airports and industrial facilities, have increasingly been constructed on reclaimed land. These reclaimed areas are commonly underlain by thick deposits of soft marine clay [5,6], where long-term consolidation settlement becomes a critical design consideration. Accordingly, quantitative evaluation of the consolidation behavior of soft marine clays is essential to ensure the long-term stability and serviceability of engineering structures.
Evaluation of the consolidation behavior of clay requires an accurate understanding of its stress history, for which the preconsolidation stress ( σ p ' ) is widely used as a representative parameter [7]. The preconsolidation stress is defined as the maximum past vertical effective stress experienced by the soil. It serves as a boundary separating the recompression state, characterized by relatively low compressibility, from the virgin compression state, where the soil exhibits significantly higher compressibility. The overconsolidation ratio (OCR), defined as the ratio of the preconsolidation stress to the current in situ vertical effective stress ( σ v 0 ' ), is a key parameter governing the compressibility and deformation characteristics of clay. Numerous studies have reported that consolidation behavior and long-term settlement characteristics vary significantly depending on the magnitude of OCR [4,8,9,10].
The preconsolidation stress is commonly determined from the consolidation curve, expressed as the effective stress–void ratio relationship. Among the various approaches, the graphical procedure proposed by Casagrande [11] is the most widely used. This method assumes that the stiffness response of clay changes at the preconsolidation stress, marking the transition from the relatively stiff recompression region to the more compressible virgin compression region [12]. However, because the method relies on a graphical construction, the estimated preconsolidation stress may vary depending on the interpreter and the shape of the consolidation curve [12,13,14]. To address these limitations, several alternative interpretation methods have been proposed [9,15,16,17,18,19,20,21]. Nevertheless, previous studies [12,14,22,23] have reported that the preconsolidation stress obtained from the same consolidation data may differ depending on the interpretation method, and a consistent evaluation approach has not yet been established.
In addition, the shape of the consolidation curve may vary depending on the maximum applied stress level, which may influence the estimated preconsolidation stress [24]. Gouw [25] reported that the slope of the virgin compression region can change with increasing maximum applied stress. Since many interpretation methods rely on the identification of the virgin compression line, variations in its slope may lead to differences in the estimated preconsolidation stress. However, the effect of maximum applied stress level on the consolidation curve shape and the resulting preconsolidation stress has not been systematically evaluated.
Recent studies have explored automated curve interpretation and machine-learning-based approaches for estimating preconsolidation stress. Celik and Tan [26] applied an artificial neural network (ANN) to predict preconsolidation stress using inputs such as initial void ratio, final void ratio, recompression index, and compression index, based on 76 consolidation test datasets. Torres et al. [27] collected consolidation test data from 127 previous studies and developed random forest models for predicting preconsolidation stress. However, these studies were developed using datasets from specific regions (e.g., Brazilian clays), and thus do not provide a universal predictive model. In addition, such approaches focus on data-driven prediction rather than capturing the physical meaning of preconsolidation stress reflected in the consolidation curve. Montoya-Araque et al. [28] implemented various interpretation methods in a Python-based software (pySigmaP, version 0.1.8) to numerically determine the point of maximum curvature and perform linear fitting, thereby reducing analyst intervention. However, this approach primarily automates existing graphical methods and does not address the variability in interpretation results or the influence of maximum applied stress.
To address these limitations, this study performed one-dimensional consolidation tests on reconstituted clay specimens in accordance with ASTM D2435/D2435M-11 [29]. Based on the effective stress–void ratio relationships obtained from the tests, several representative interpretation methods [11,15,18,20,21] for determining the preconsolidation stress were applied. The preconsolidation stress was estimated under different maximum applied stress levels to examine how both the interpretation method and the maximum applied stress influence the estimated values. Similar to Grozic et al. [12] and Ural and Küçüker [14], the target preconsolidation stress applied during the reconstitution process was used as a reference value to quantitatively evaluate the accuracy and consistency of the estimated results. Particular attention was given to proposing a new interpretation approach that can mitigate the limitations of existing methods.

2. Literature Review

2.1. Methods for Determining Preconsolidation Stress

The preconsolidation stress is commonly determined from the results of a one-dimensional consolidation test. According to ASTM D2435/D2435M-11 [29], the test is performed using a specimen with a diameter (D) of at least 50 mm and a height (H) of at least 12 mm, satisfying a D/H ratio of 2.5 or greater. The load increment ratio (LIR) is typically set to 1, meaning that the total vertical stress is doubled at each loading stage. Each load increment is maintained for 24 h to allow sufficient completion of consolidation. The maximum applied stress is set to obtain at least three data points within the virgin compression region or to reach a stress level approximately eight times the estimated preconsolidation stress.
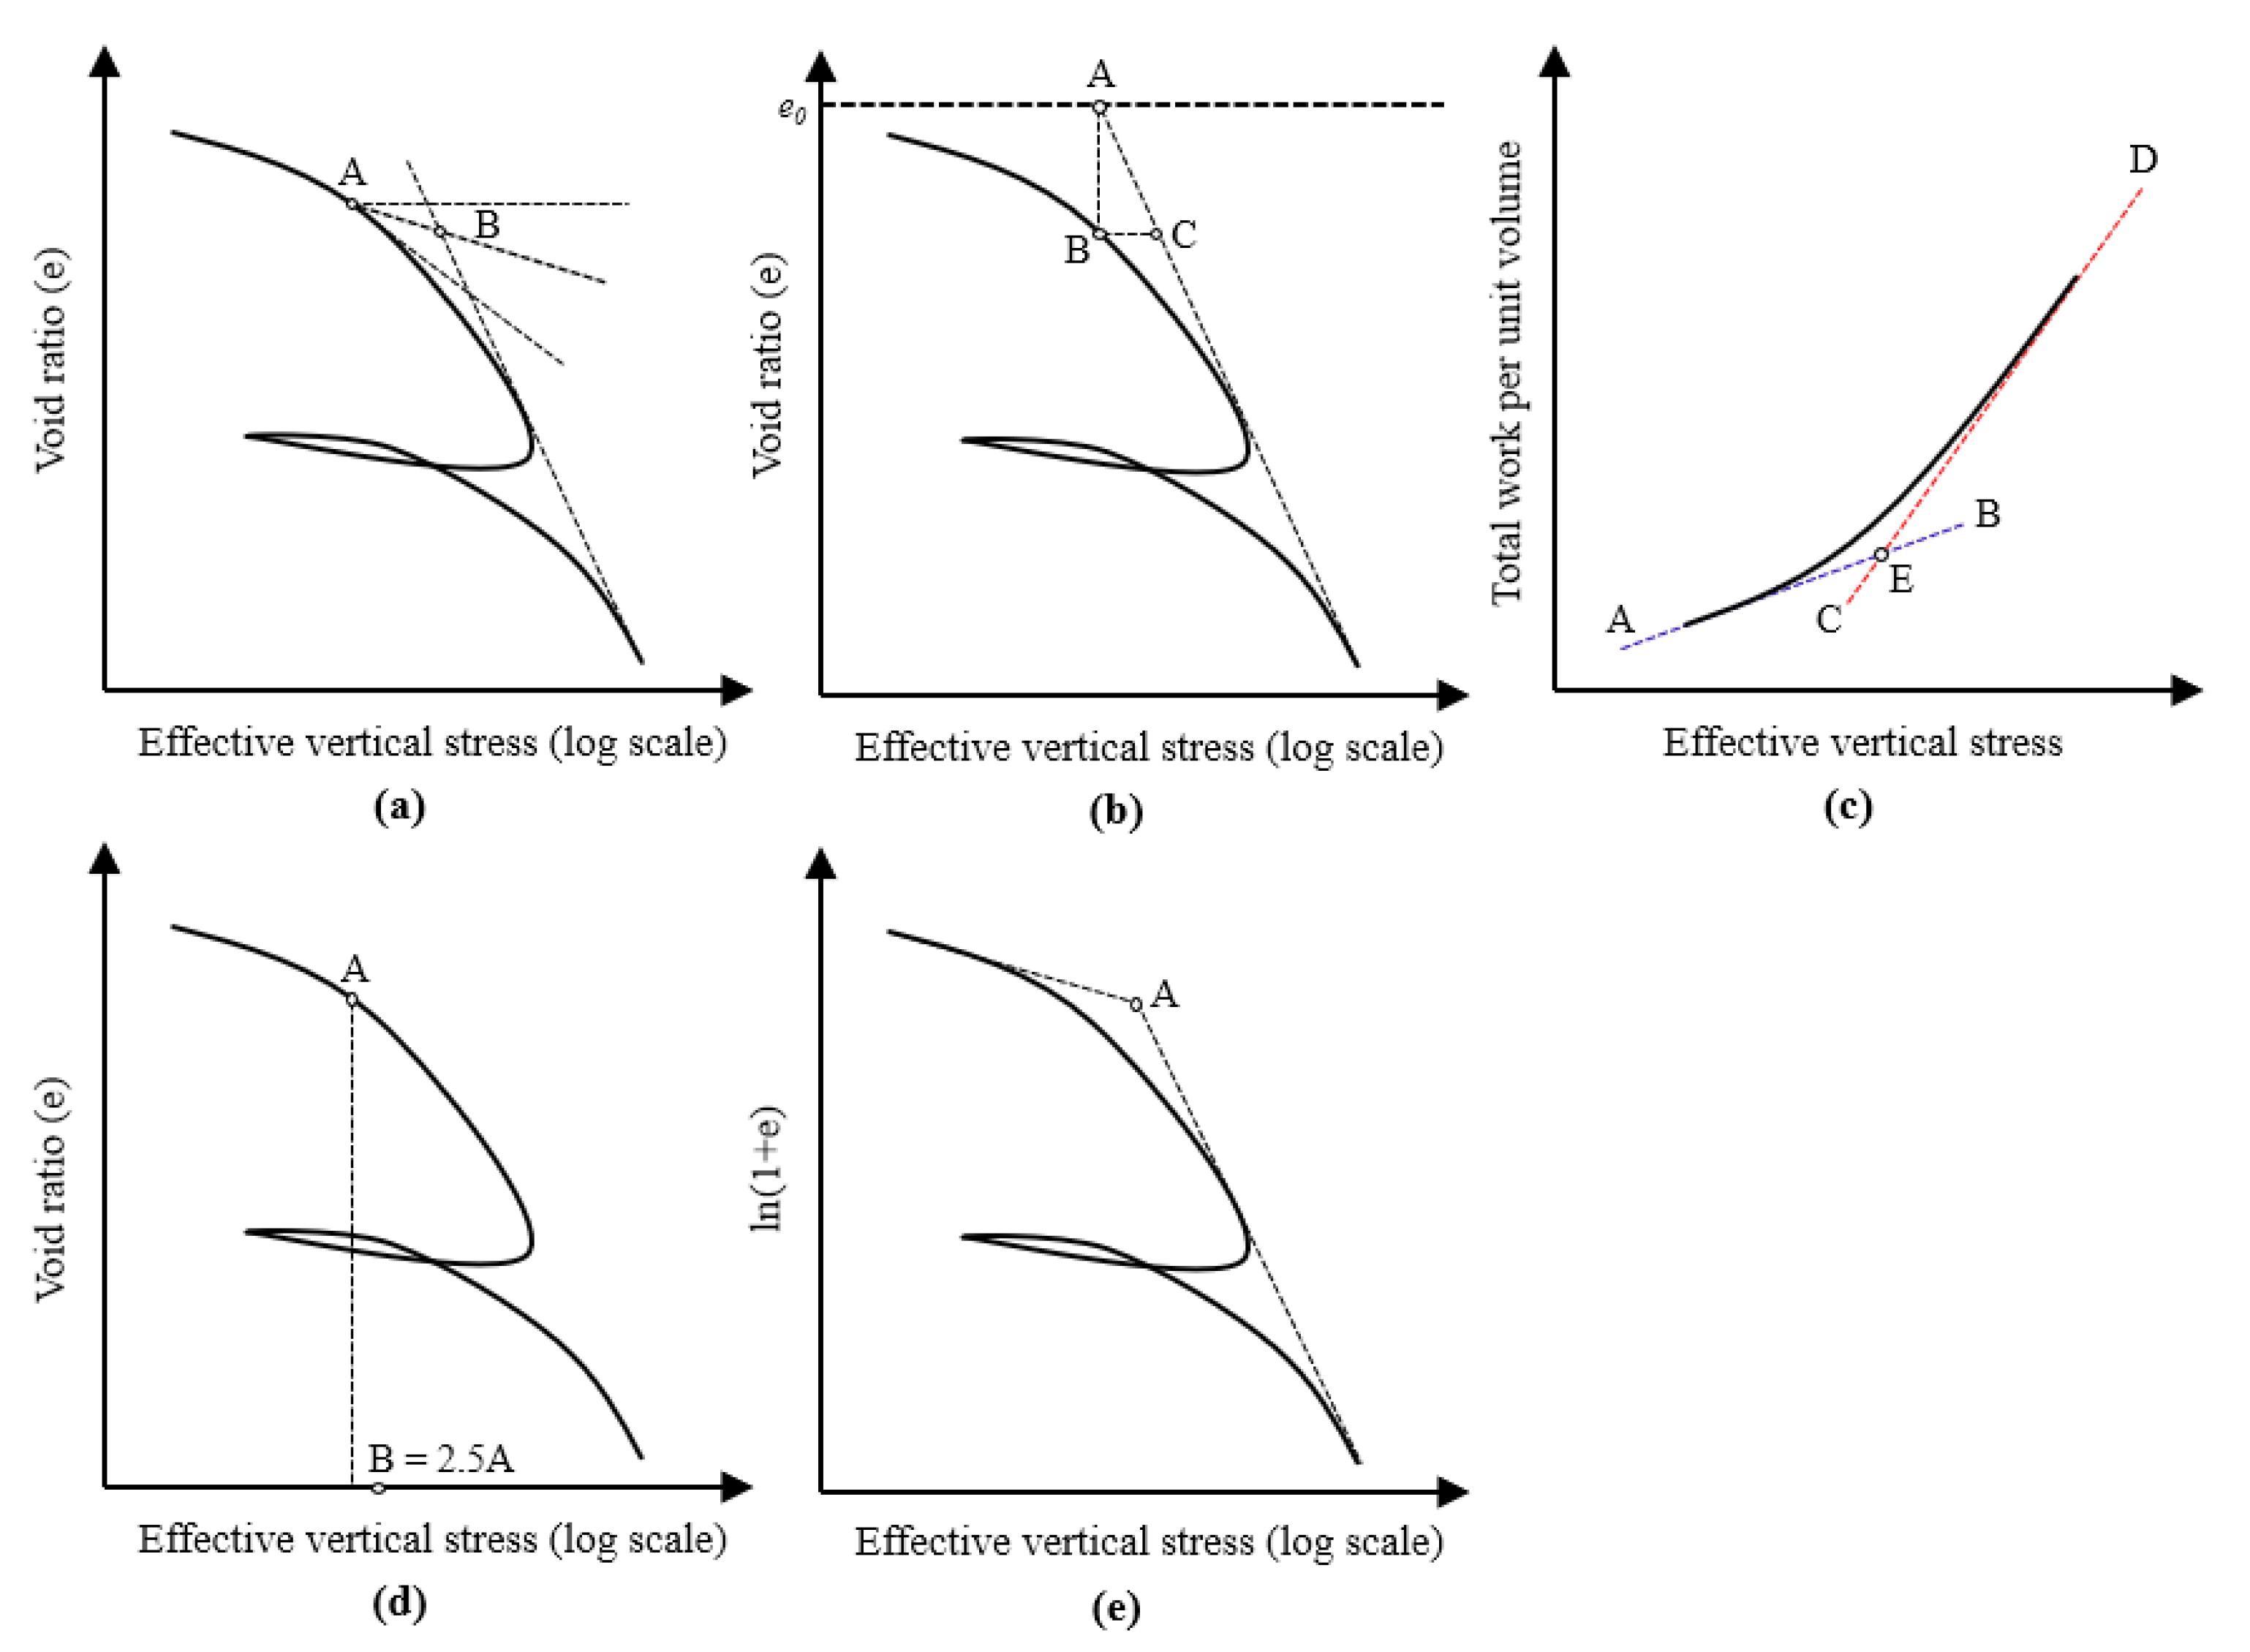
Various interpretation methods have been proposed in the literature to determine the preconsolidation stress from the effective stress–void ratio relationship obtained from consolidation tests. Figure 1 illustrates the interpretation methods, and the detailed procedures of the methods adopted in this study are described below.

2.1.1. Casagrande [11]

Casagrande [11] proposed a graphical method for determining the preconsolidation stress using the e l o g σ v ' curve, where the void ratio (e) is plotted against the logarithm of the vertical effective stress ( σ v ' ). In this procedure: (i) the point of maximum curvature is identified in the recompression region of the e l o g σ v ' curve (point A in Figure 1a); (ii) a tangent and a horizontal line are drawn at this point, and the bisector of the angle formed by these two lines is constructed; and (iii) the linear portion of the virgin compression region is extended to intersect the bisector, and the corresponding effective stress at the intersection is defined as the preconsolidation stress (point B in Figure 1a).
The Casagrande method is a classical technique and remains the most widely used interpretation procedure because of its relatively simple graphical steps. When both the point of maximum curvature in the recompression region and the linear portion of the virgin compression region are clearly defined, the preconsolidation stress can be determined with reasonable accuracy. However, when these features are not distinct, subjective judgment may be involved in the interpretation process, and different analysts may obtain different preconsolidation stress values from the same consolidation data [13].

2.1.2. Silva [21]

Similar to the Casagrande method, Silva [21] proposed a graphical interpretation procedure based on the e l o g σ v ' curve. In this method: (i) a horizontal line is drawn at the initial void ratio (e0); (ii) the linear portion of the virgin compression region is extended to intersect this horizontal line (point A in Figure 1b); (iii) from this intersection point, a vertical line is drawn downward to meet the e l o g σ v ' curve (point B in Figure 1b); and (iv) a horizontal line is then drawn from this point to intersect the extension of the virgin compression line, and the corresponding effective stress is defined as the preconsolidation stress (point C in Figure 1b).
This method has the advantage that it can be applied even when the point of maximum curvature in the recompression region is not clearly identifiable [30]. Nevertheless, if the linear portion of the virgin compression region is not distinctly defined, the selection of the linear segment may still depend on the analyst’s judgment, which can lead to variations in the estimated preconsolidation stress.

2.1.3. Becker et al. [15]

Becker et al. [15] noted that the Casagrande method may become ambiguous when a clearly defined break between the recompression and virgin compression regions is not observed on the e l o g σ v ' curve. In such cases, identifying the point of maximum curvature graphically can be subjective. To address this limitation, they proposed an alternative interpretation approach based on the concept of strain energy rather than geometric construction on the compression curve.
This method evaluates the consolidation behavior in terms of work per unit volume, i.e., strain energy density, generated during each load increment. The incremental strain energy density (   W o e d ) for each loading step is defined as:
  W o e d = ( σ i + 1 '   σ i ' 2 ) ( ε i + 1   ε i ) ,
where σ i and σ i + 1 are the vertical effective stresses at loading steps i and i + 1, respectively, and ε i and ε i   +   1 are the corresponding vertical strains.
The incremental values of   W o e d are cumulatively summed and plotted against effective stress on a linear scale. The resulting relationship generally exhibits two approximately linear segments with different slopes (lines A–B and C–D in Figure 1c). The intersection of these two segments is interpreted as the vertical yield stress ( σ y ' ), which represents a change in the resistance characteristics of the clay structure (point E in Figure 1c). Becker et al. [15] suggested that this vertical yield stress physically corresponds to the preconsolidation stress.

2.1.4. Jacobsen [18]

Jacobsen [18] analyzed consolidation test results obtained from overconsolidated clays in Denmark and proposed a simplified empirical method for estimating the preconsolidation stress. In this approach, the preconsolidation stress is assumed to be approximately 2.5 times the vertical effective stress ( σ K ' ) corresponding to the point of maximum curvature in the recompression region of the e l o g σ v ' curve (points A and B in Figure 1d). This method enables rapid estimation of the preconsolidation stress when the point of maximum curvature in the recompression region is clearly identifiable.
However, the coefficient of 2.5 was derived from empirical correlations based on Danish clays. Therefore, applying the same coefficient to soils with different geological conditions or stress histories may introduce uncertainty. In addition, when the point of maximum curvature in the recompression region is not distinctly defined, the reliability of the estimated preconsolidation stress may decrease.

2.1.5. Bilogarithmic Methods

Traditionally, the e l o g σ v ' curve has been widely used to determine the preconsolidation stress from consolidation test results. However, when a clearly defined break between the recompression and virgin compression regions is not observed on the e l o g σ v ' curve, the interpretation may involve considerable uncertainty. To mitigate this limitation, bilogarithmic methods have been proposed, in which the void ratio is also transformed into a logarithmic scale to enhance linearity.
In bilogarithmic approaches, the relationship between void ratio and effective stress is plotted in a logarithmic coordinate system, allowing the compression curve to be approximated by two linear segments. The preconsolidation stress is then defined as the effective stress corresponding to the intersection of these two lines. Representative formulations include the ln   1 + e l n   σ v ' , log 1 + e l o g   σ v ' , and ln 1 + e l o g   σ v ' relationships [16,19,20]. Among these methods, the approach proposed by Onitsuka et al. [20] was adopted in this study (Figure 1e) because it provided the most reliable results among the bilogarithmic approaches and had the strongest theoretical basis, as it can be mathematically derived from the work-based approach, which has a clear physical meaning [12].

2.2. Effect of Maximum Stress Level on the Interpretation of Preconsolidation Stress

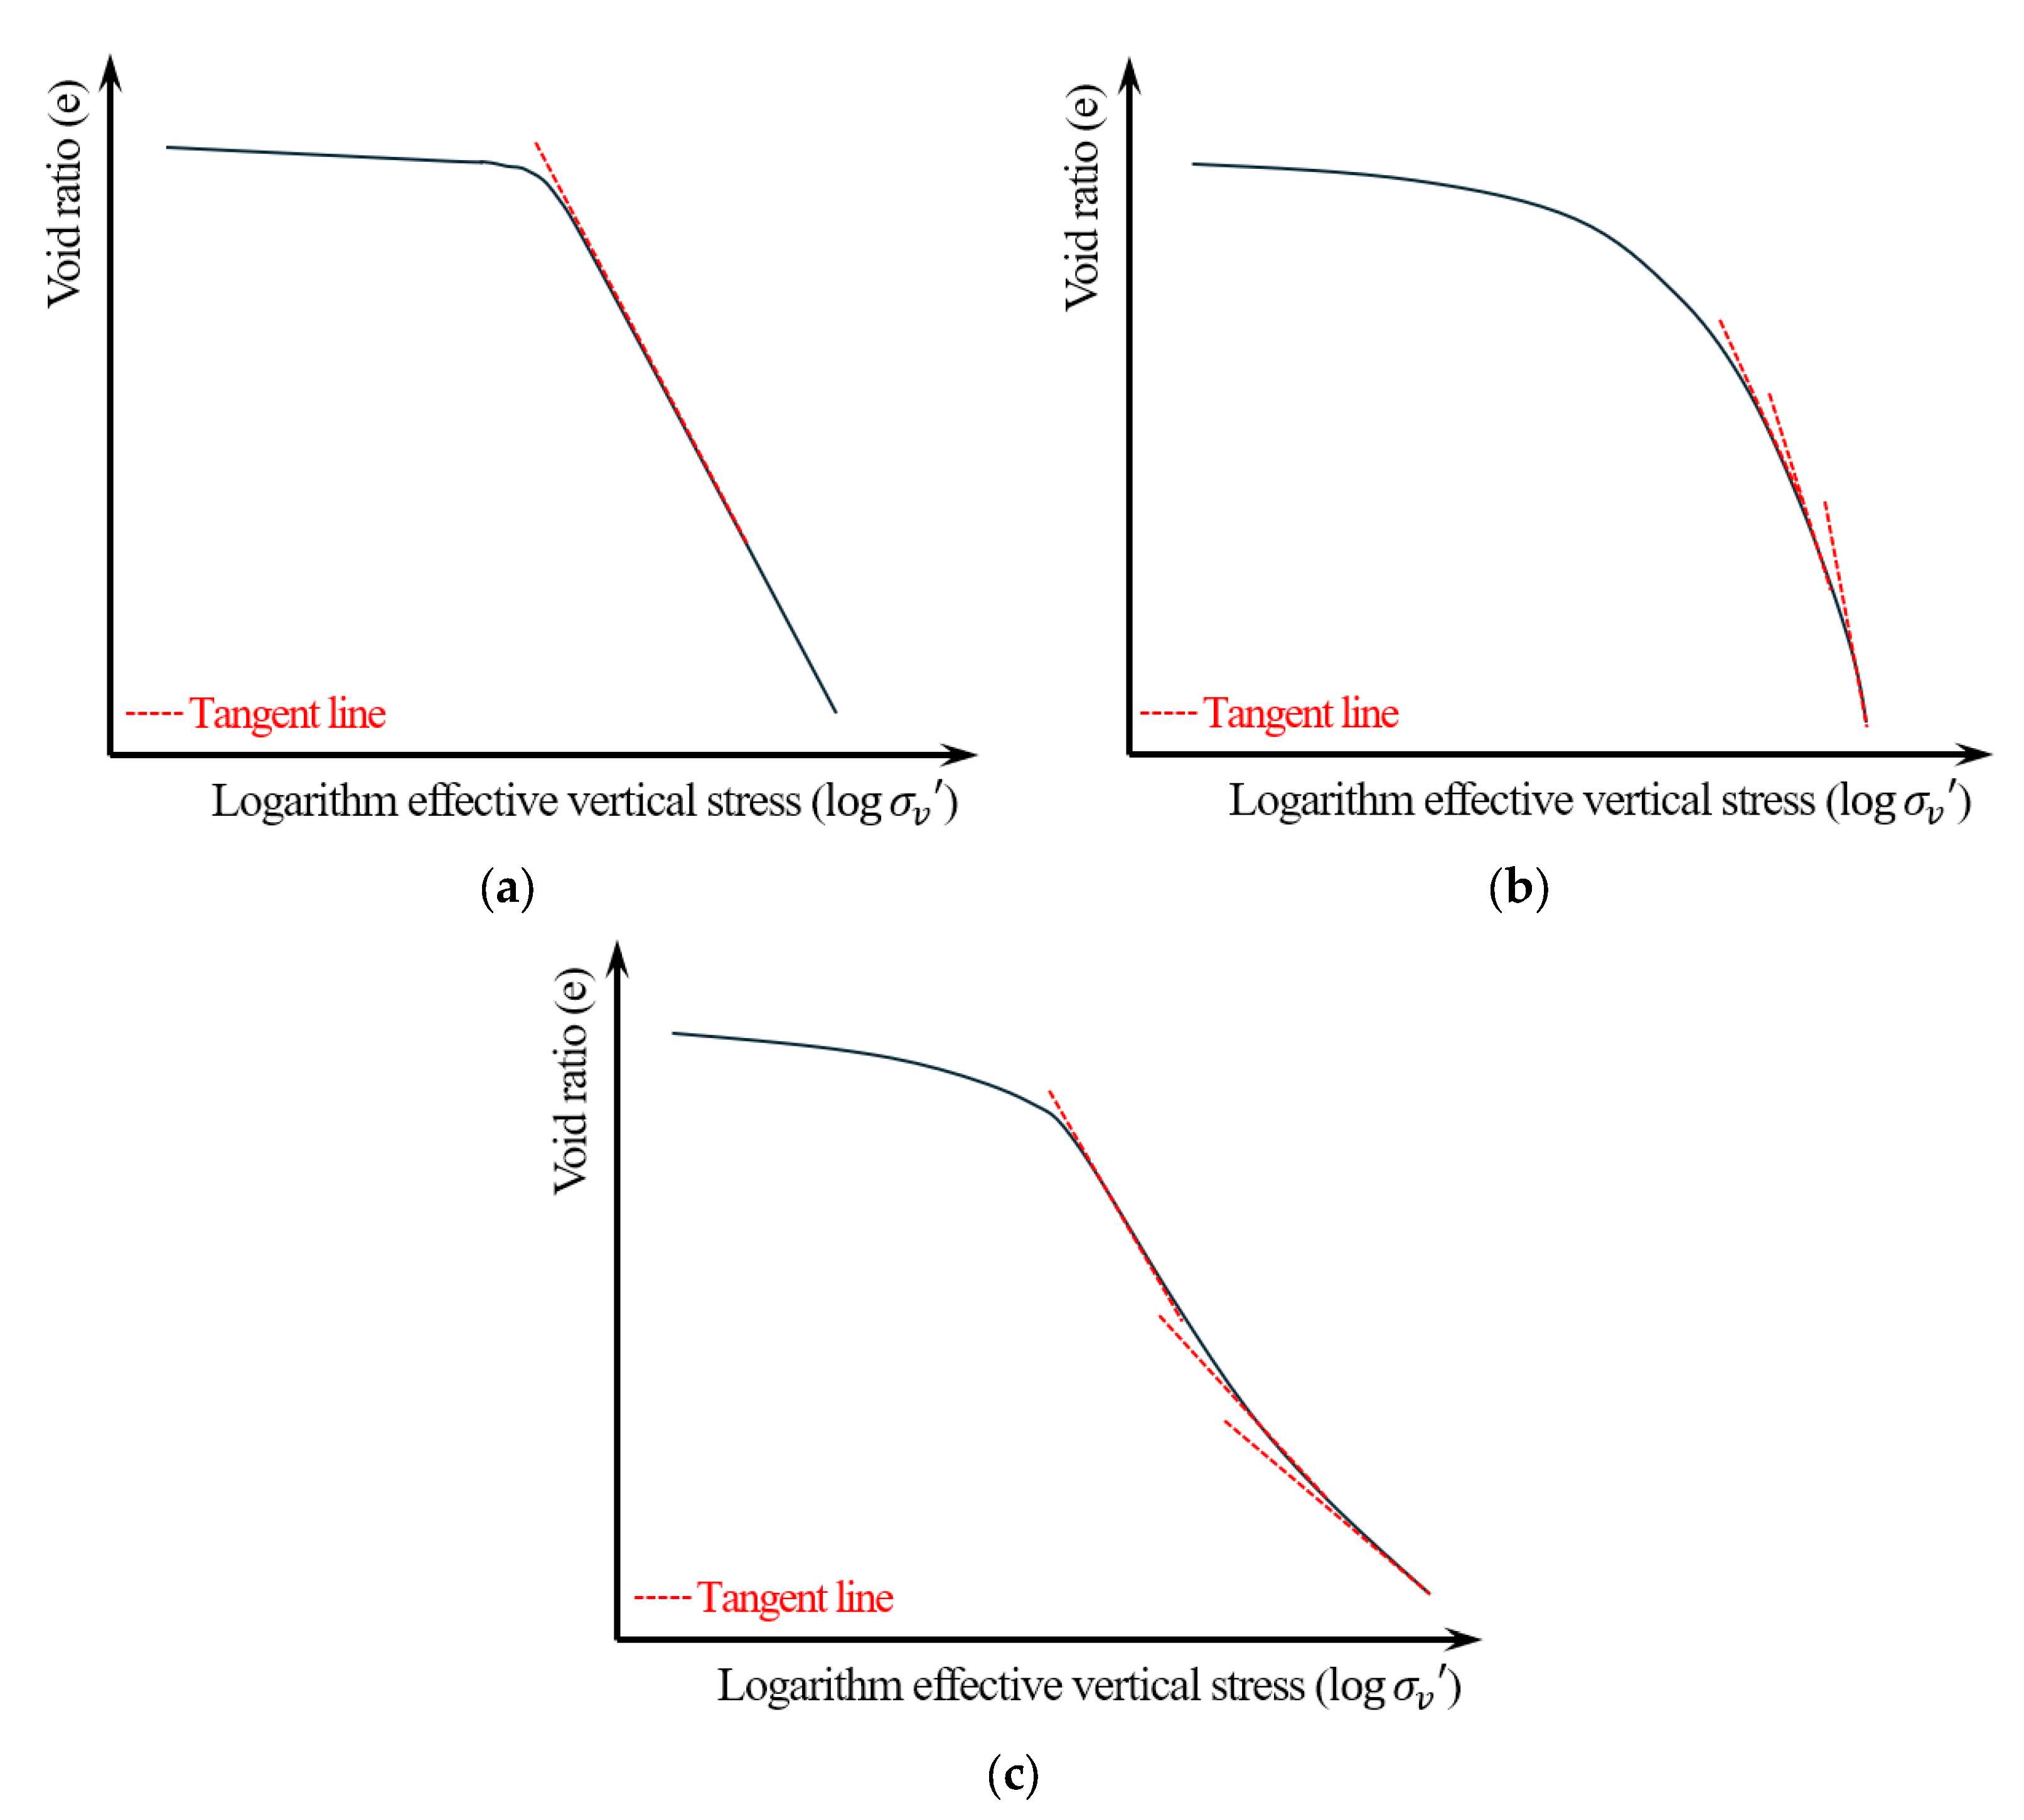
The preconsolidation stress is defined as the reference stress that distinguishes the recompression and virgin compression regions on the consolidation curve, and its determination significantly depends on the shape of the curve. As shown in Figure 2, some clays exhibit a clearly defined break between the recompression and virgin compression regions, whereas others do not show a distinct transition and instead display a rounded compression curve in which the curvature changes gradually.
Boone [24] reported that clays with high natural water content (or large void ratio) tend to exhibit a clearly defined break between the recompression and virgin compression regions, and that the slope of the virgin compression region is relatively straight (Figure 2a). For such clays, the estimated preconsolidation stress generally shows consistent results regardless of the maximum applied stress level. In contrast, for clays in which the break between the recompression and virgin compression regions is not clearly defined, i.e., those exhibiting a rounded compression curve, the slope of the virgin compression region gradually changes as the stress level increases (Figure 2b). In these cases, the slope of the virgin compression region tends to increase progressively with increasing stress. Accordingly, even when the same interpretation method is applied, the estimated preconsolidation stress may vary depending on the magnitude of the maximum applied stress [25].
In addition, Boone [24] reported that highly sensitive clays, such as Leda clay, which possess a strong soil structure, may exhibit reverse curvature in the high-stress range, where the slope of the virgin compression curve decreases (Figure 2c). This behavior was interpreted as a mechanical transition associated with the collapse of the open soil fabric at a certain stress level, followed by particle-to-particle contact becoming the dominant mechanism. In such cases, the slope of the virgin compression region decreases as the maximum applied stress increases, and the estimated preconsolidation stress is correspondingly influenced.
As described above, the estimation of preconsolidation stress is influenced not only by the interpretation method (method-dependent) but also by the maximum applied stress level during the consolidation test. This is because most conventional interpretation methods, including the Casagrande method, determine the preconsolidation stress based on the slope of the virgin compression region. However, the consolidation test standard, ASTM D2435/D2435M-11 [29], specifies only that the maximum applied stress should be sufficient to obtain at least three data points in the virgin compression region or to reach approximately eight times the estimated preconsolidation stress. The standard does not consider the potential changes in the shape of the consolidation curve or the variation in the slope of the virgin compression region associated with different maximum stress levels.
To address this limitation, several researchers have proposed additional criteria for selecting the maximum applied stress. Boone [24] suggested that, for sensitive clays exhibiting a decrease in the slope of the virgin compression curve in the high-stress range, the maximum slope within the virgin compression region should be used for determining the preconsolidation stress in order to minimize structural effects. Gouw [25] proposed different maximum applied stress levels depending on the consistency of the clay, recommending consolidation tests up to 1600 kPa for soft clays, 3200 kPa for medium stiff clays, and 6400 kPa for stiff to very stiff clays. Although these approaches aim to improve the consistency of the estimated preconsolidation stress regardless of the analyst, quantitative validation of their accuracy and applicability remains limited.

3. Materials and Methods

3.1. Sample Preparation

In this study, reconstituted clay specimens were prepared using commercial kaolinite and marine clays collected from coastal regions of South Korea (Ansan, Mokpo, Gwangyang, Saemangeum, and Nakdong). The index properties of each clay are summarized in Table 1. According to the Unified Soil Classification System (USCS), the Ansan, Gwangyang, and Saemangeum samples are classified as low-plasticity silts (ML), while the Nakdong sample is a high-plasticity clay (CH). The commercial kaolinite and Mokpo samples are classified as high-plasticity silts (MH).
The clay specimens were reconstituted using the slurry consolidation technique proposed by Sheeran and Krizek [31]. The marine clay samples collected from coastal regions were first sieved through a No. 40 sieve (0.42 mm) to remove foreign materials such as shell fragments before reconstitution. For each clay, reconstitution was performed under two target vertical pressures (i.e., preconsolidation stresses) of 60 kPa and 120 kPa, resulting in a total of 12 different reconstituted clay specimens.
The reconstitution procedure was conducted as follows. Distilled water was added to oven-dried clay to achieve a water content equal to twice the liquid limit, and the mixture was thoroughly stirred to form a homogeneous slurry. The slurry was then placed into a consolidometer with a diameter of 120 mm, and the vertical effective stress was increased stepwise until the target pressure was reached. The consolidometer was designed to apply load to the loading plate using air pressure and maintained double drainage conditions, allowing drainage from both the top and bottom boundaries. After reaching the target vertical pressure, the load was maintained for at least two weeks to ensure sufficient consolidation and to achieve a homogeneous internal state of the specimen.
After the reconstitution was completed, the specimens were carefully removed from the consolidometer, wrapped to prevent moisture loss, and sealed with paraffin. The specimens were then stored in a temperature- and humidity-controlled chamber maintained at a relative humidity of 95% and a temperature of 25 °C until testing.

3.2. One-Dimensional Consolidation Test Procedure

The test procedure was as follows: (1) the reconstituted clay specimen was trimmed to fit an oedometer ring with a diameter of 60 mm and a height of 20 mm and then installed in the oedometer cell; (2) vertical loads were applied using a dead-weight system with a lever ratio of 10:1; and (3) vertical displacement was measured using a digital dial gauge with a resolution of 0.001 mm, and the measured data were stored at 2 s intervals using a static data logger (GEOTS, Incheon, Republic of Korea).
One-dimensional consolidation tests were conducted on a total of 12 reconstituted clay specimens in accordance with ASTM D2435/D2435M-11 [29]. The tests were performed under double drainage conditions, allowing both top and bottom drainage, with lateral deformation constrained. The vertical load was initially applied at 10 kPa, and a load increment ratio (LIR) of 1 was adopted so that the total stress was doubled at each loading stage. Considering that the maximum preconsolidation stress applied during specimen reconstitution was 120 kPa, the vertical stress was increased up to 1280 kPa to reach at least eight times the preconsolidation stress and to ensure a minimum of three data points within the virgin compression region. The ASTM standard [29] recommends that an unload–reload cycle be applied after exceeding the preconsolidation stress, with at least two unloading steps; accordingly, unloading was performed at the 320 kPa stage down to 40 kPa in three steps, followed by reloading to observe rebound behavior. The applied loading sequence was 10, 20, 40, 80, 160, 320, 160, 80, 40, 80, 160, 320, 640, and 1280 kPa. Each loading stage was maintained for a minimum duration of 24 h to allow sufficient dissipation of excess pore water pressure.
During the tests, the specimens were maintained in a saturated condition. The laboratory temperature was kept at approximately 24 °C, and the relative humidity was stably controlled using a humidifier, thereby minimizing variations in the water content of the specimens and in consolidation behavior caused by changes in the external environment.

3.3. Interpretation of Preconsolidation Stress

Based on the effective stress–void ratio relationship obtained from the consolidation tests, the preconsolidation stress was determined using the various interpretation methods summarized in Section 2.1 [11,15,18,20,21]. To minimize subjective judgment that may arise during graphical interpretation, a MATLAB-based analysis code was developed using MATLAB R2022b (MathWorks, Natick, MA, USA) to reflect the theoretical procedures of each method, and a computerized interpretation process was applied.
Among the reconstituted clay specimens used in this study, those with a target preconsolidation stress of 60 kPa began to exhibit clear virgin compression behavior after the 80 kPa loading stage, whereas those with a target preconsolidation stress of 120 kPa began to show virgin compression behavior after the 160 kPa loading stage. The definition of the virgin compression region is a key element in most preconsolidation stress determination methods, and the maximum applied stress level may influence both the identification of the linear portion of the virgin compression region and the final estimated value. Accordingly, the maximum applied stress was set to 320 kPa, 640 kPa, and 1280 kPa, and the corresponding preconsolidation stresses were calculated and compared.
There is no consistent criterion for defining the straight-line portion of the virgin compression region on the e l o g σ v ' curve, and it is generally defined by fitting a straight line over a stress range that is judged to be representative of that region. In this study, the virgin compression line was defined using the straight-line portion formed in the latter part of the virgin compression region of the e l o g σ v ' curve, that is, in the high-stress range.

4. Results and Discussion

4.1. Preconsolidation Stress Determined by Existing Interpretation Methods

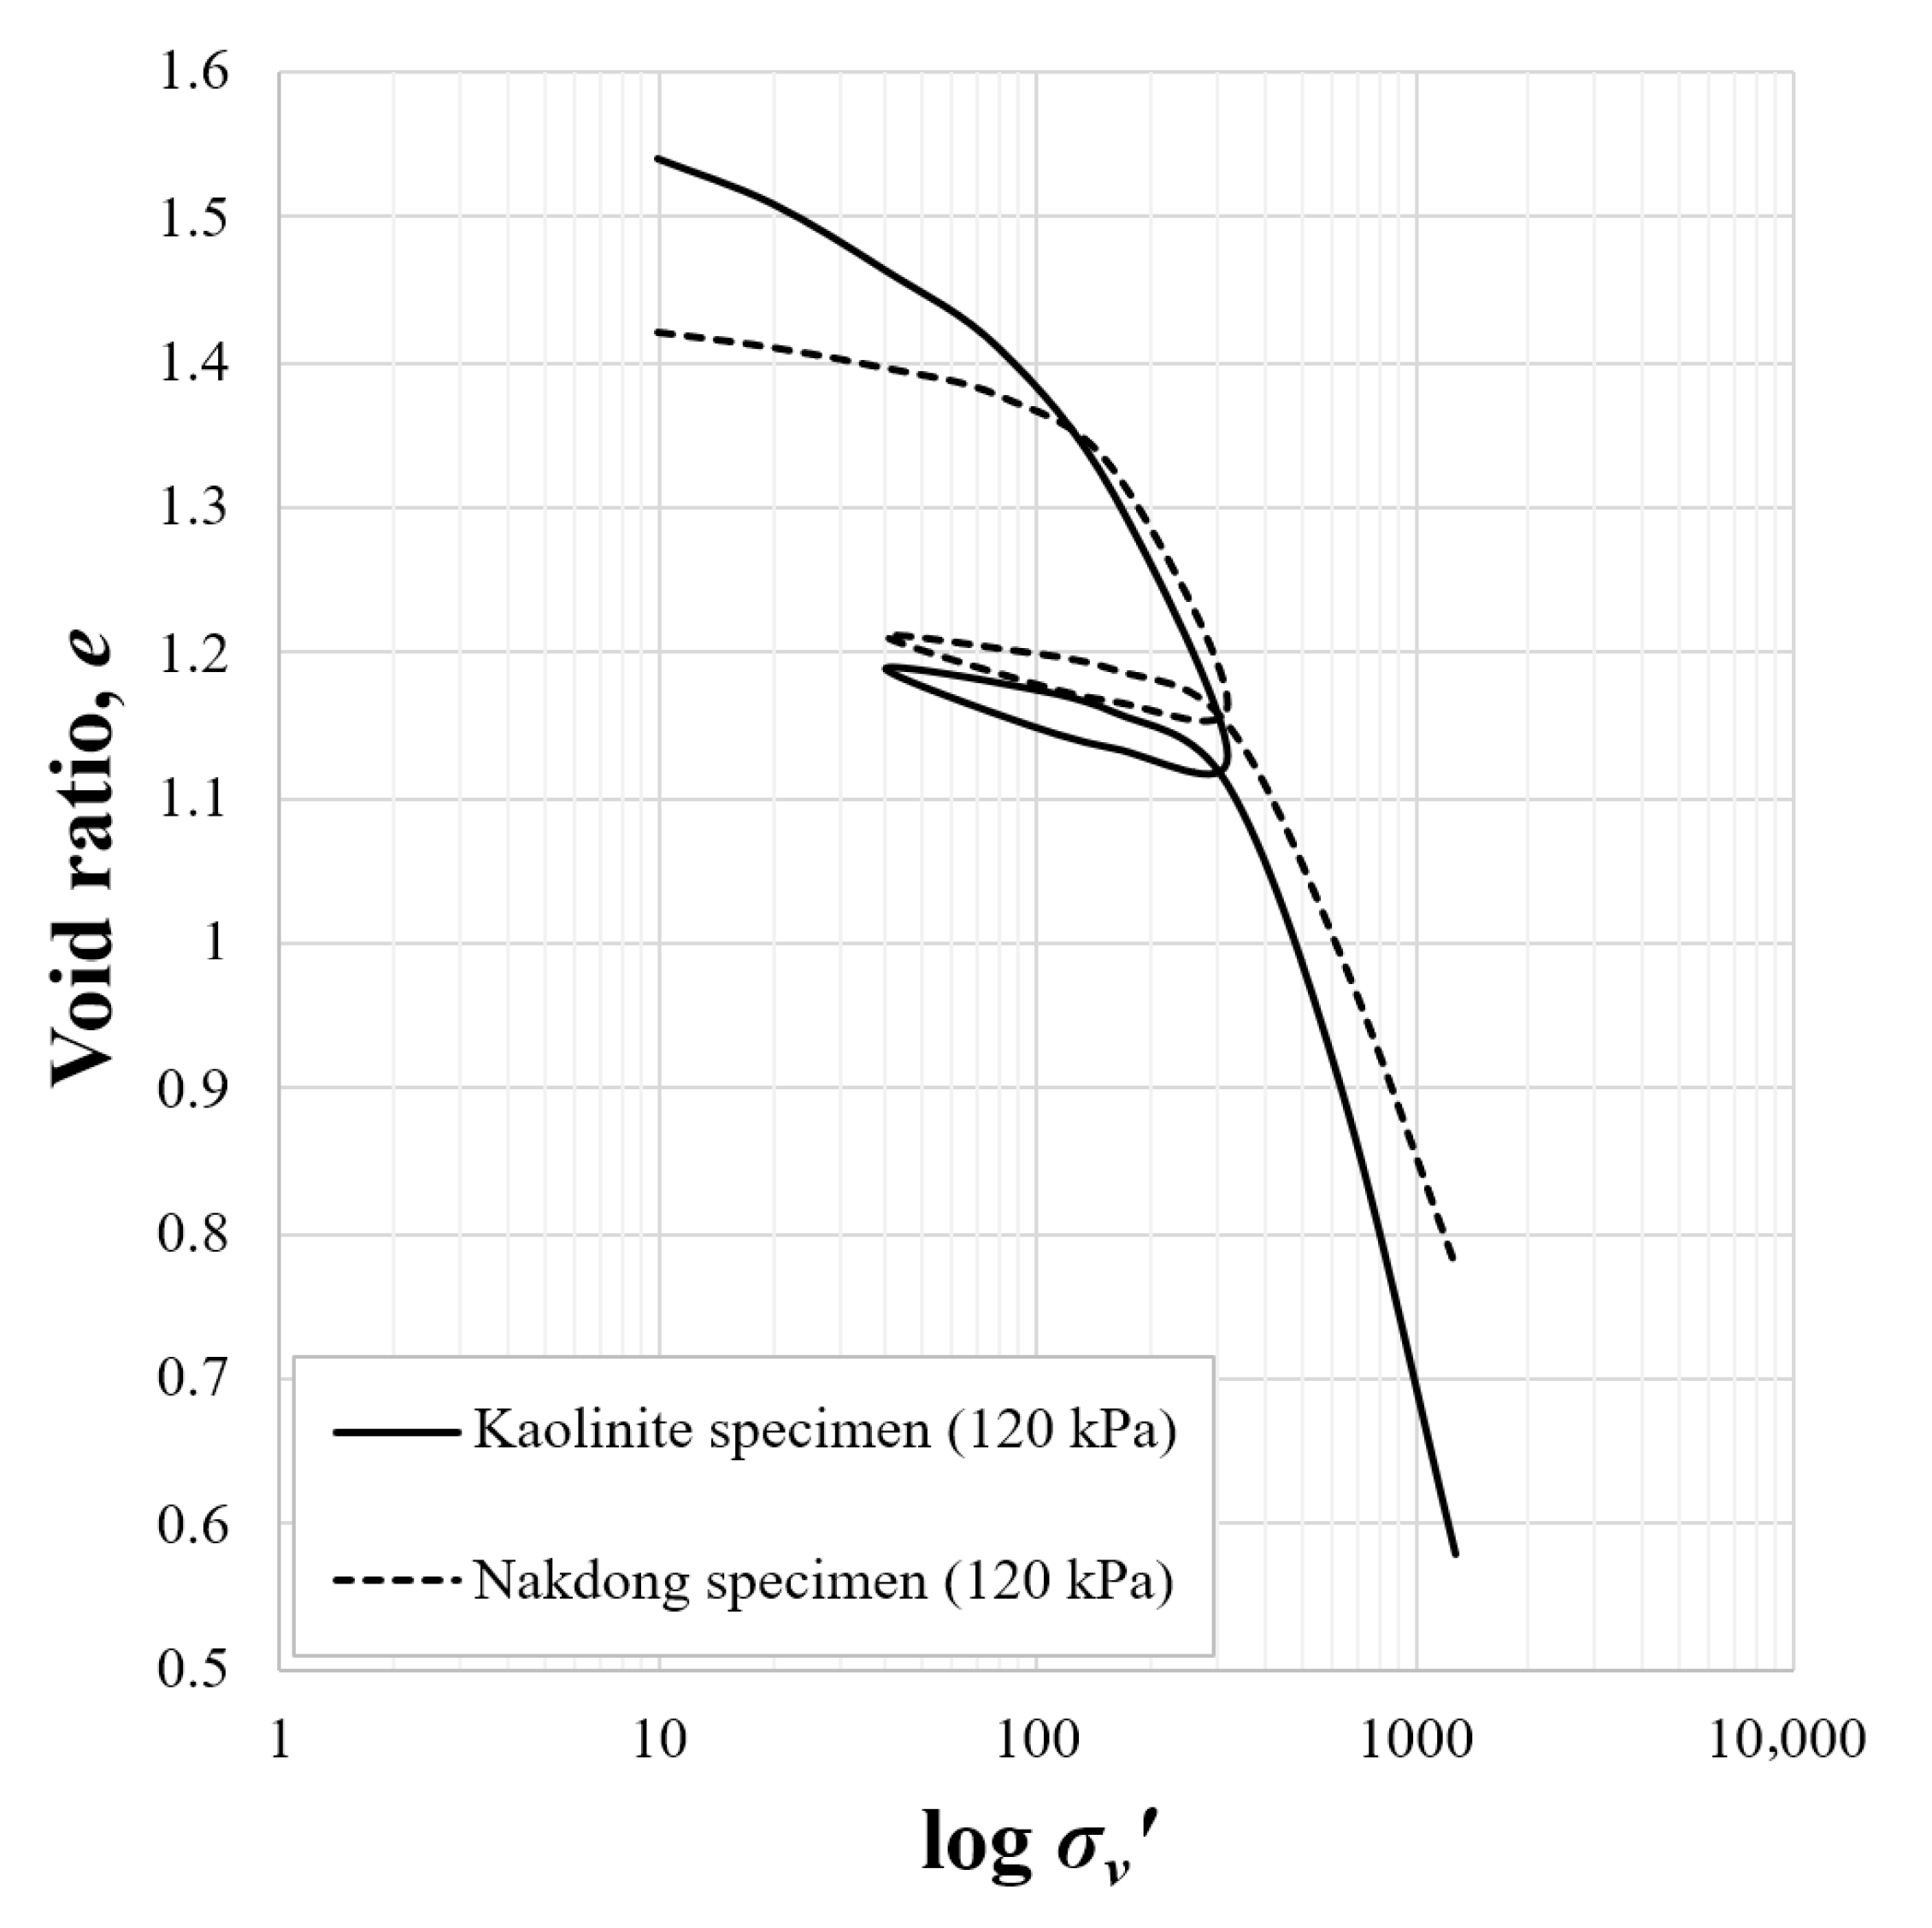
Figure 3 presents representative one-dimensional consolidation test results ( e l o g σ v ' curves) for the reconstituted kaolinite and Nakdong clay specimens with a target preconsolidation stress of 120 kPa. The kaolinite specimen exhibits a rounded compression curve, with the slope of the virgin compression region gradually increasing as stress increases. In contrast, the Nakdong specimen shows a clearly defined break between the recompression and virgin compression regions, and the virgin compression region is nearly linear.
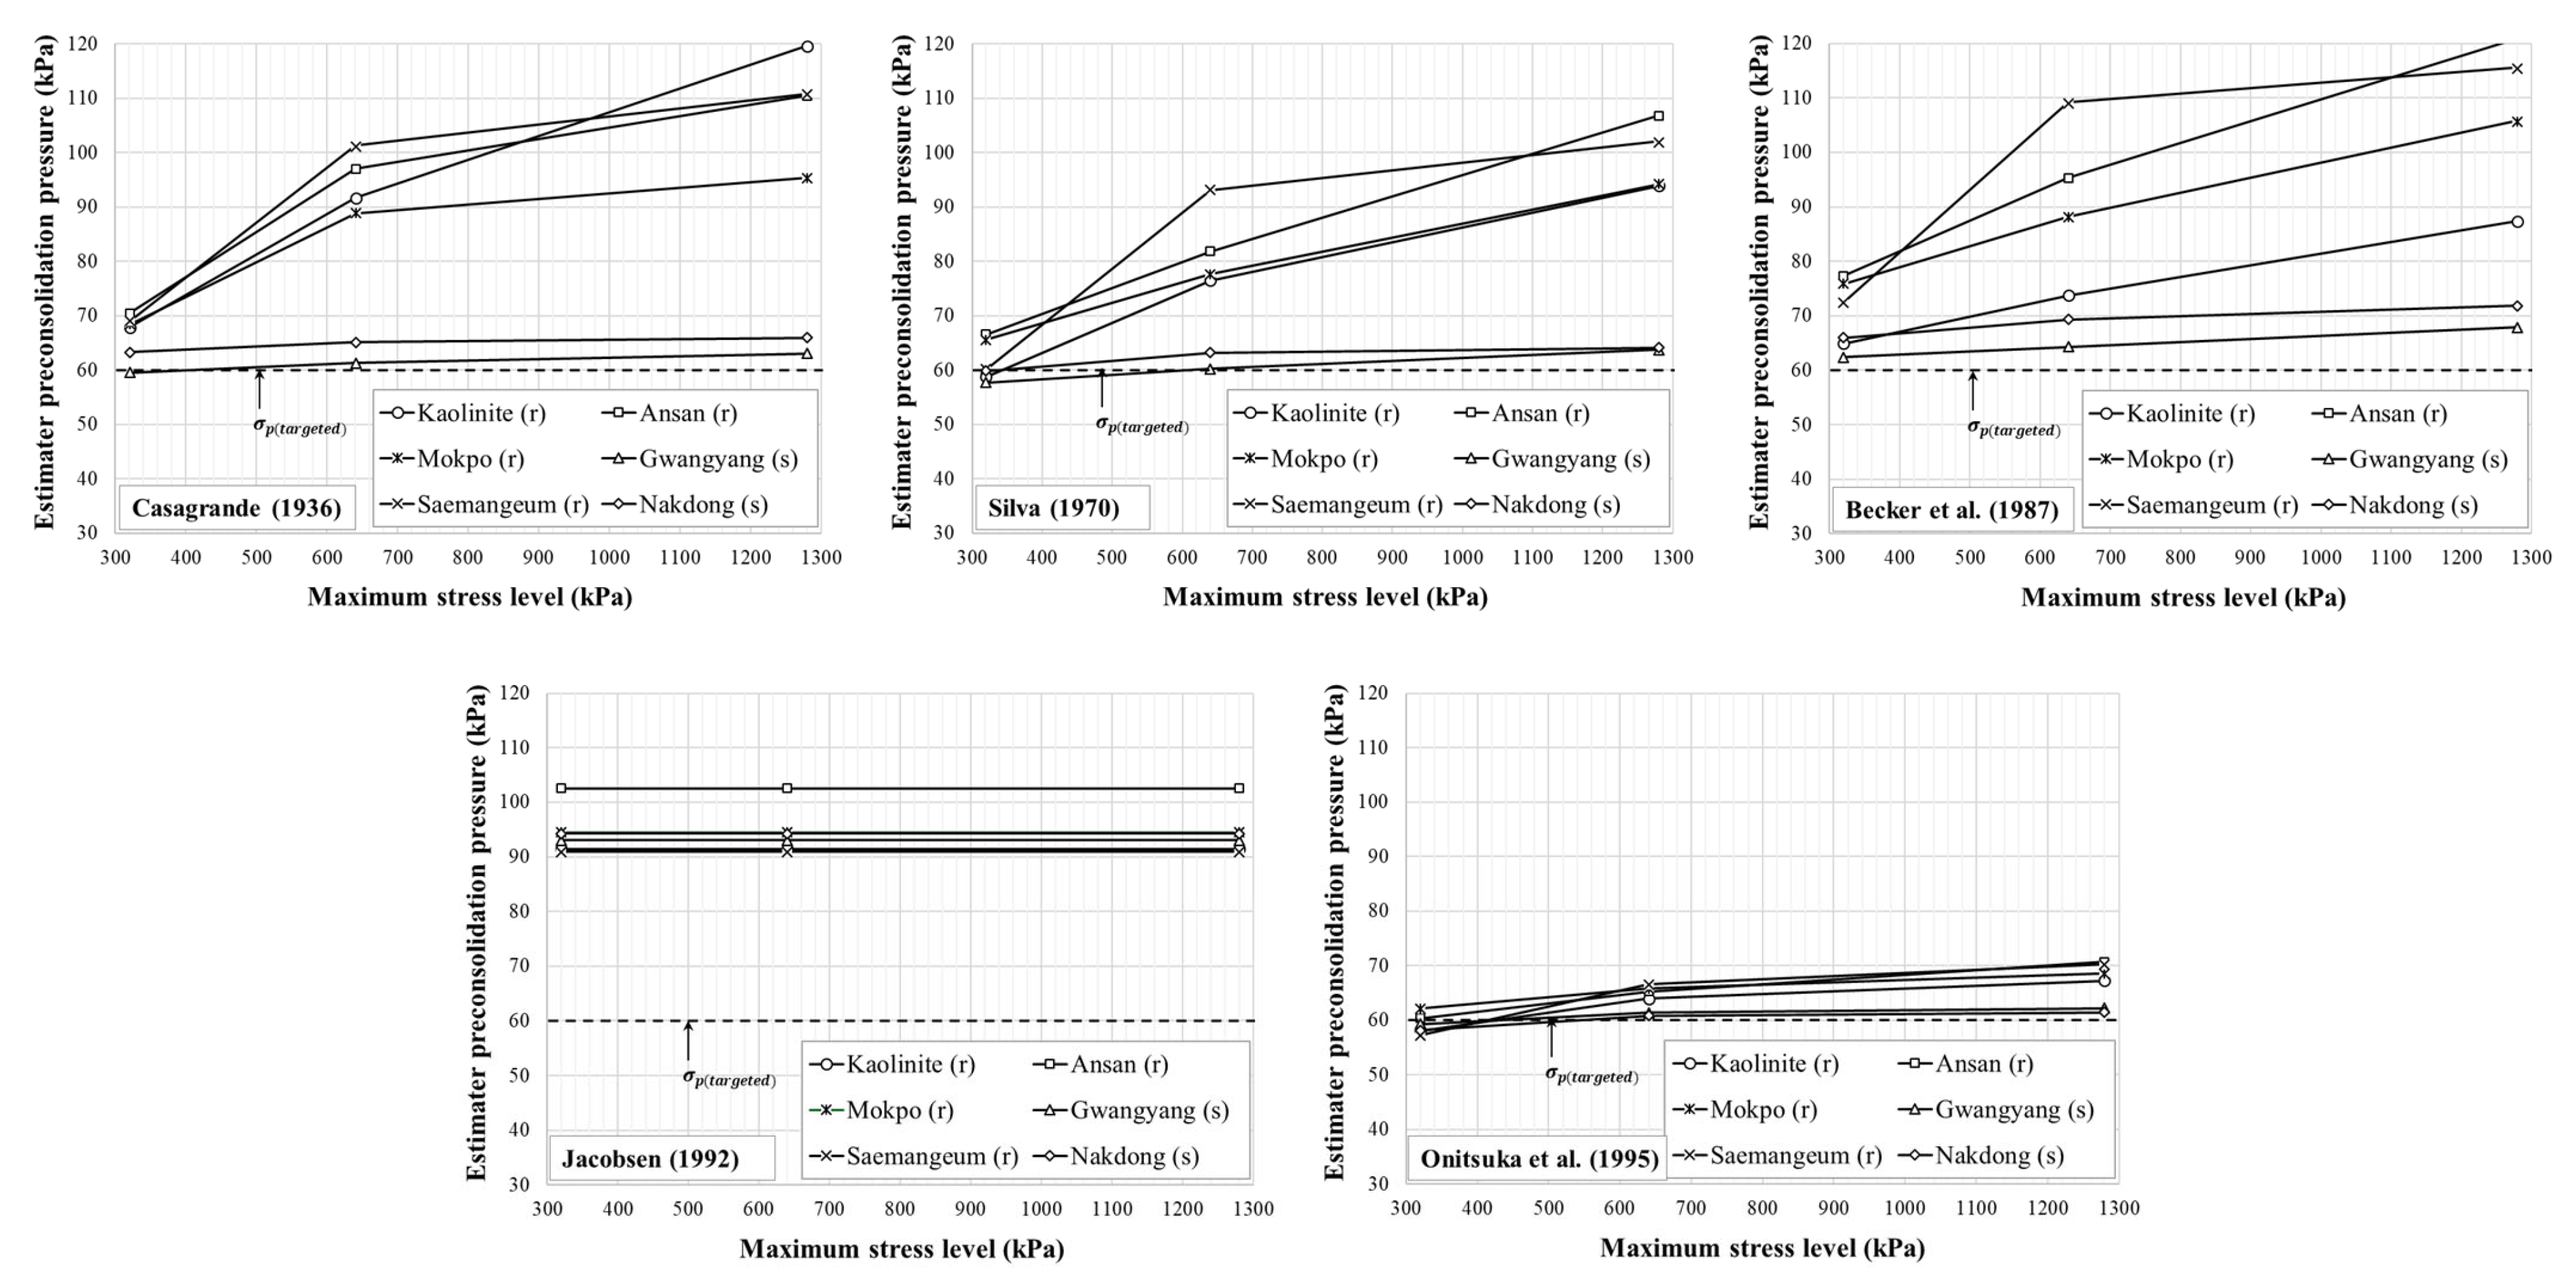
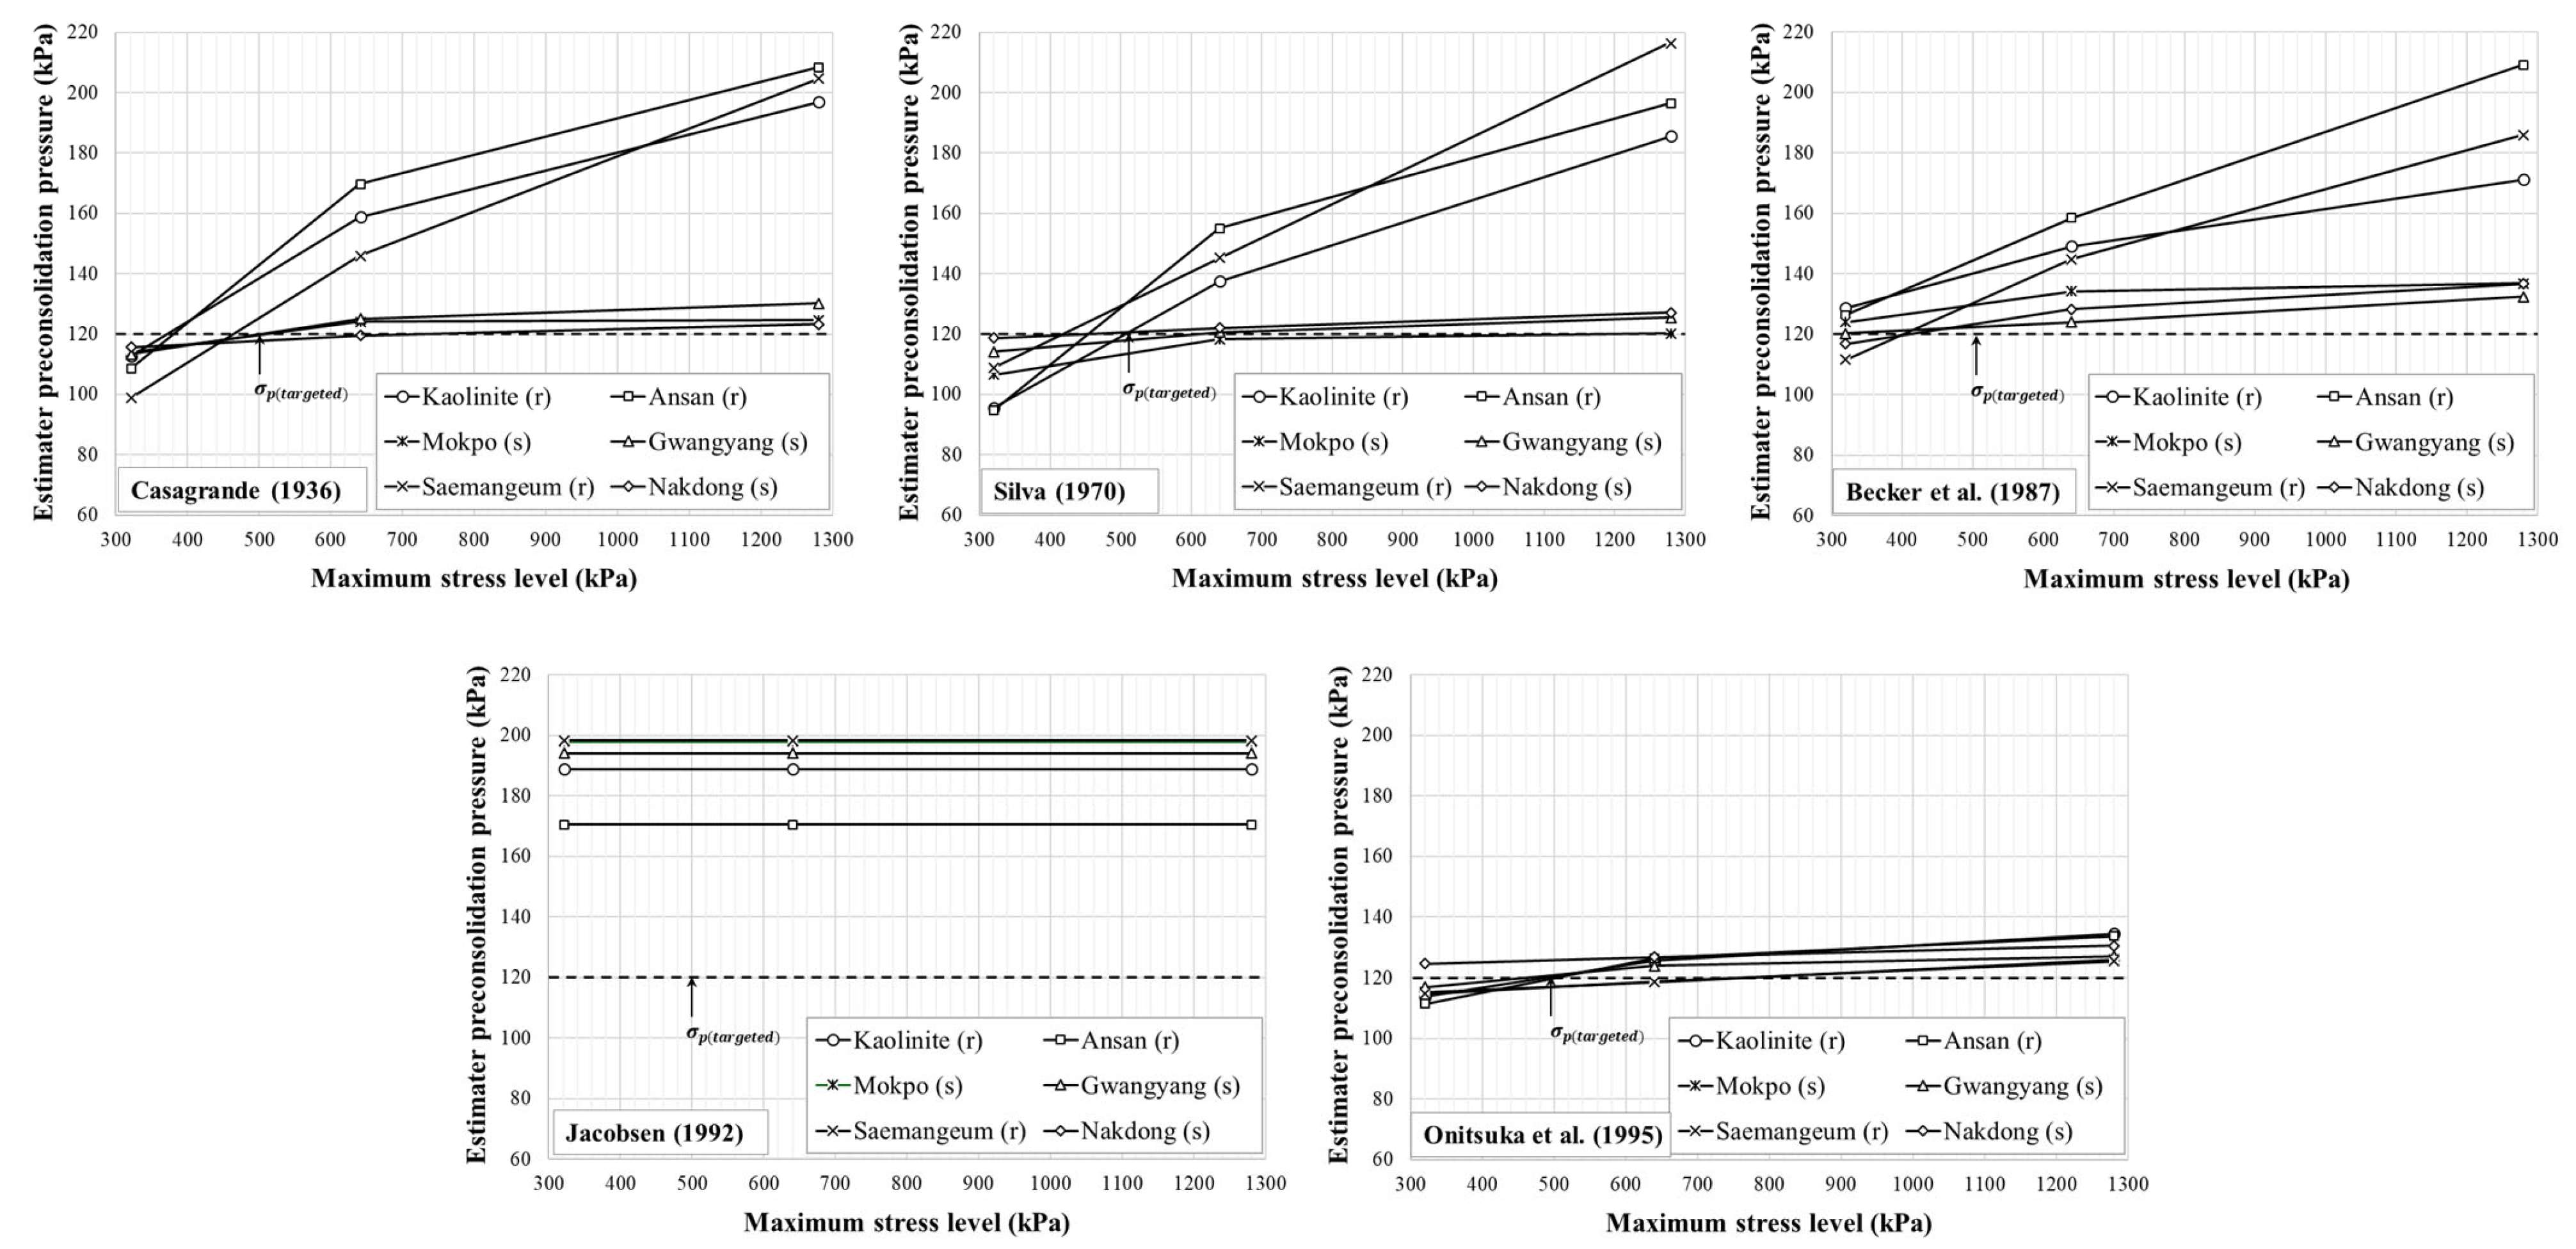
Figure 4 and Figure 5 present the preconsolidation stresses estimated by the existing interpretation methods for reconstituted clay specimens with target preconsolidation stresses of 60 kPa and 120 kPa, respectively. Specimens exhibiting a clearly defined break between the recompression and virgin compression regions, along with a nearly linear slope in the virgin compression region, were classified as ‘s’ type, whereas those showing a rounded compression curve were classified as ‘r’ type. In the figure legend, the type of each specimen is indicated in parentheses following the specimen name. Because reconstituted clay specimens were used in this study, reverse curvature, which is typically observed in highly structured natural clays, was not identified (refer to Figure 2c).
To quantitively evaluate the prediction accuracy of the existing interpretation methods and their dependency on the maximum stress, the mean absolute error (MAE) was calculated as:
M A E =   1 n i = 1 n σ p t a r g e t e d , i ' σ p i n t e r p r e t e d , i ' ,
where σ p t a r g e t e d , i ' is the target vertical pressure applied during reconstitution (60 or 120 kPa), σ p i n t e r p r e t e d , i ' is the preconsolidation stress determined by each interpretation method, and n is the total number of data points for each interpretation method and maximum stress level. The index i represents each individual observation used in the MAE calculation, corresponding to a specific specimen under a given maximum applied stress level. Table 2 and Table 3 present the MAE values of preconsolidation stress estimated by the existing interpretation methods for target preconsolidation stresses of 60 kPa and 120 kPa, respectively.
The Jacobsen [18] method defines the preconsolidation stress as 2.5 times the effective stress corresponding to the point of maximum curvature in the recompression region; therefore, it yielded identical values regardless of the maximum applied stress level. This is because the maximum applied stress influences only the definition of the virgin compression region and does not affect the point of maximum curvature determined within the recompression region. However, the Jacobsen [18] method tended to overestimate the preconsolidation stress for all specimens, resulting in the largest MAE values among the existing methods. This discrepancy is attributed to the direct application of an empirical correlation developed for Danish clays to Korean marine clays and commercial kaolinite. When the coefficient applied to the maximum curvature stress was recalibrated to minimize the MAE values, the optimal coefficient was found to be approximately 1.5, and the corresponding MAE decreased significantly to 1.90 and 2.73 kPa for target preconsolidation stresses of 60 and 120 kPa, respectively. These results indicate that the coefficient in the Jacobsen [18] method depends on the regional characteristics of the clay.
Except for the Jacobsen [18] method, the differences among interpretation methods and maximum applied stress levels were relatively small for the ‘s’ type curves (see Figure 4 and Figure 5). This is because the transition between the recompression and virgin compression regions is clearly defined and the virgin compression region is nearly linear, which is consistent with the findings of Grozic et al. [12]. However, since the virgin compression region is not perfectly linear, a slight increase in the estimated preconsolidation stress was observed as the maximum applied stress increased.
In contrast, for the ‘r’ type curves, substantial differences were observed depending on both the interpretation method and the maximum applied stress level (see Figure 4 and Figure 5). The method of Casagrande [11], Silva [21], and Becker et al. [15] exhibited a pronounced increase in the estimated preconsolidation stress with increasing maximum applied stress. For example, for the kaolinite specimen reconstituted with a preconsolidation stress of 120 kPa, the Casagrande [11] method predicted 113 kPa at a maximum applied stress of 320 kPa, which was relatively close to the target value; however, at 1280 kPa, it yielded 197 kPa, representing a significant overestimation. This behavior can be attributed to the gradual increase in the slope of the virgin compression region with increasing stress for ‘r’ type curves; as high-stress data are included, the slope of the fitted linear segment increases, resulting in overestimation of the preconsolidation stress. In contrast, the Onitsuka et al. [20] method showed relatively low sensitivity to the maximum applied stress. This is because both void ratio and effective stress are transformed into logarithmic scales, and the recompression and virgin compression regions are defined using linear regression equations, thereby reducing the influence of high-stress data.
As shown in Table 2 and Table 3, the Onitsuka et al. [20] method showed the lowest MAE values across all maximum applied stress levels. In particular, the lowest MAE values (i.e., the highest accuracy) were observed when the maximum applied stress was approximately 5.3 times the preconsolidation stress (i.e., 320 kPa for the 60 kPa condition and 640 kPa for the 120 kPa condition). However, this does not imply that the Onitsuka et al. [20] method always provides the most accurate predictions regardless of the maximum applied stress level; rather, this observation is limited to the specific stress levels considered in this study (i.e., 320, 640, and 1280 kPa). For certain maximum applied stress levels, other methods may yield more accurate results. For instance, under the 120 kPa preconsolidation stress condition, the Casagrande [11] and Silva [21] methods tended to underestimate the preconsolidation stress when the maximum applied stress was 320 kPa and to overestimate it when it was 640 kPa (see Figure 5); these methods may also achieve the highest prediction accuracy at intermediate maximum applied stress levels between these two conditions.
These results indicate that the selection of the maximum applied stress in a consolidation test has a decisive influence on the estimated preconsolidation stress. However, in practical consolidation testing, the preconsolidation stress is generally unknown in advance, making it difficult to establish a practical criterion for how many times the preconsolidation stress the maximum applied stress should reach. In this study, because the target preconsolidation stress of the reconstituted specimens was known, the transition between the recompression and virgin compression regions could be identified relatively clearly when applying the method of Onitsuka et al. [20]. In contrast, for natural clays, the transition itself is often indistinct, making it challenging to objectively define these regions. Therefore, for clays exhibiting ‘r’ type curves, the existing methods may not provide reliable estimates of the preconsolidation stress, and a new interpretation approach is required.

4.2. Proposed Interpretation Method

The existing interpretation methods have the following limitations when determining the preconsolidation stress for clays exhibiting a rounded compression curve. First, the boundary between the recompression and virgin compression regions is not clearly defined. Second, because the slope of the virgin compression region gradually changes with increasing stress level, the estimated preconsolidation stress may vary depending on the stress range selected to define the virgin compression region. In other words, the preconsolidation stress can be significantly affected by both the subjective judgment involved in distinguishing the recompression and virgin compression regions and the magnitude of the maximum applied stress.
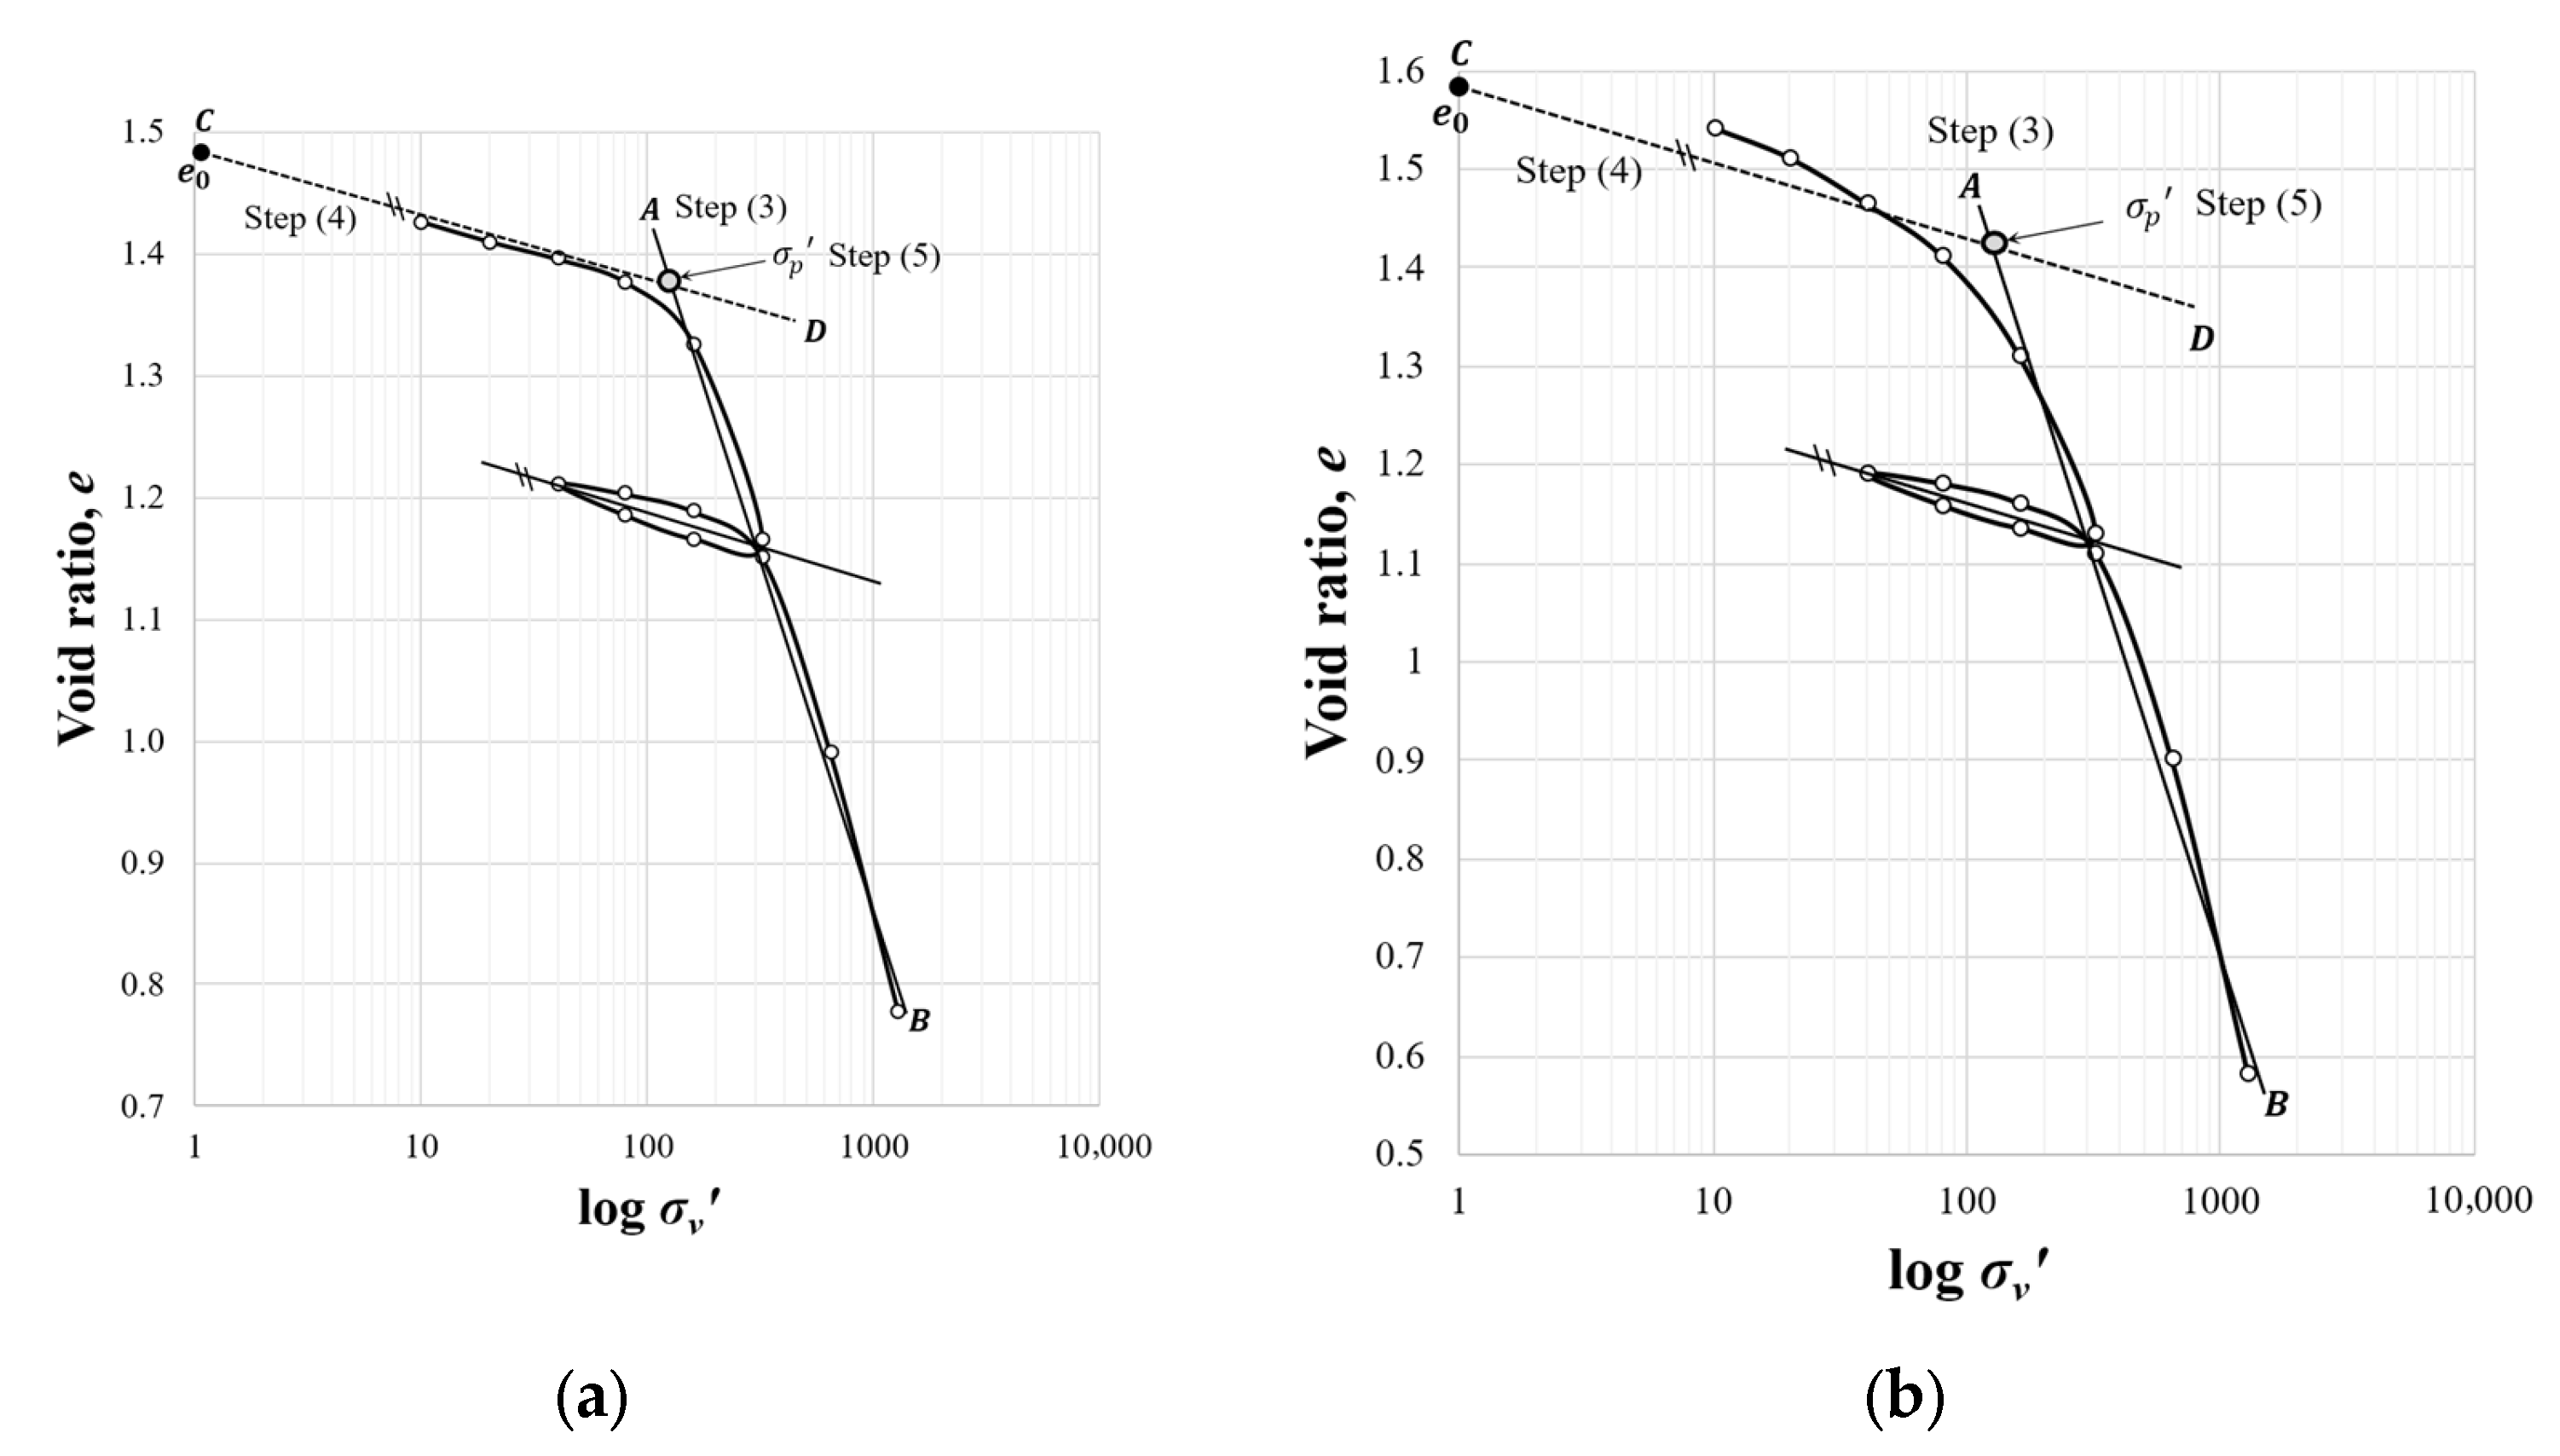
To address these limitations, a new interpretation method based on the e l o g σ v ' curve is proposed. The key concept of the proposed method is to use the slope of the rebound curve obtained from an unload–reload cycle as a reference line. According to Tsutsumi and Tanaka [32], the rebound curves appear nearly parallel to each other, indicating that the rebound slope reflects the intrinsic recompression characteristics of the clay. The initial part of the consolidation curve (i.e., the recompression region), however, is affected by structural changes associated with specimen swelling and disturbance [33]. Therefore, the rebound slope obtained from the unload–reload process is used as the representative slope of recompression and translated to pass through the initial void ratio (e0). This approach minimizes the influence of subjectivity associated with graphically defining the boundary between the recompression and virgin compression regions and reduces the effects of structural changes occurring during the initial stages of consolidation testing.
In addition, the virgin compression region was not defined graphically; instead, following the approach of Onitsuka et al. [20], it was defined using a linear regression equation. This procedure minimizes subjectivity associated with the selection of a specific stress range and mitigates the influence of variations in the maximum applied stress level. As a result, the proposed method determines the preconsolidation stress from the intersection of two independently defined behavioral lines without distinguishing the boundary between the recompression and virgin compression regions.
As shown in Figure 6, the preconsolidation stress is determined according to the following procedure: (1) A one-dimensional consolidation test is conducted in accordance with ASTM D2435/D2435M-11 [29], including at least one unload–reload cycle. (2) An e l o g σ v ' curve is plotted based on the test results. (3) The linear regression line representing the virgin compression region (line A–B) is determined. It is recommended to use at least the last three loading steps in the one-dimensional consolidation test to define the regression line. This recommendation is based on the requirement for a minimum number of data points for meaningful linear regression and is consistent with ASTM D2435/D2435M-11 [29], which suggests that at least three data points should be included within the virgin compression region. (4) The slope of the rebound curve is obtained from the unload–reload cycle, and a straight line (line C–D) with this slope passing through the initial void ratio ( e 0 ) is defined. For reconstituted specimens, the vertical effective stress corresponding to the initial void ratio ( e 0 ) is 0 kPa; however, since l o g ( 0 ) is undefined in the e l o g σ v ' coordinate system, a small reference stress of 1 kPa is adopted so that l o g σ v ' = 0 . This value approximates a near-zero effective stress, consistent with the seating pressure applied in one-dimensional consolidation tests, at which compression is negligible and the initial state is preserved [33,34]. Accordingly, the initial state is defined as ( l o g σ v ' = 0 , e 0 ). (5) The intersection point of the lines A–B and C–D is determined, and the corresponding effective stress is defined as the preconsolidation stress. The intersection of the two lines representing the recompression (line C–D) and virgin compression (line A–B) regions corresponds to the vertical yield stress, which physically represents the preconsolidation stress [9,15].
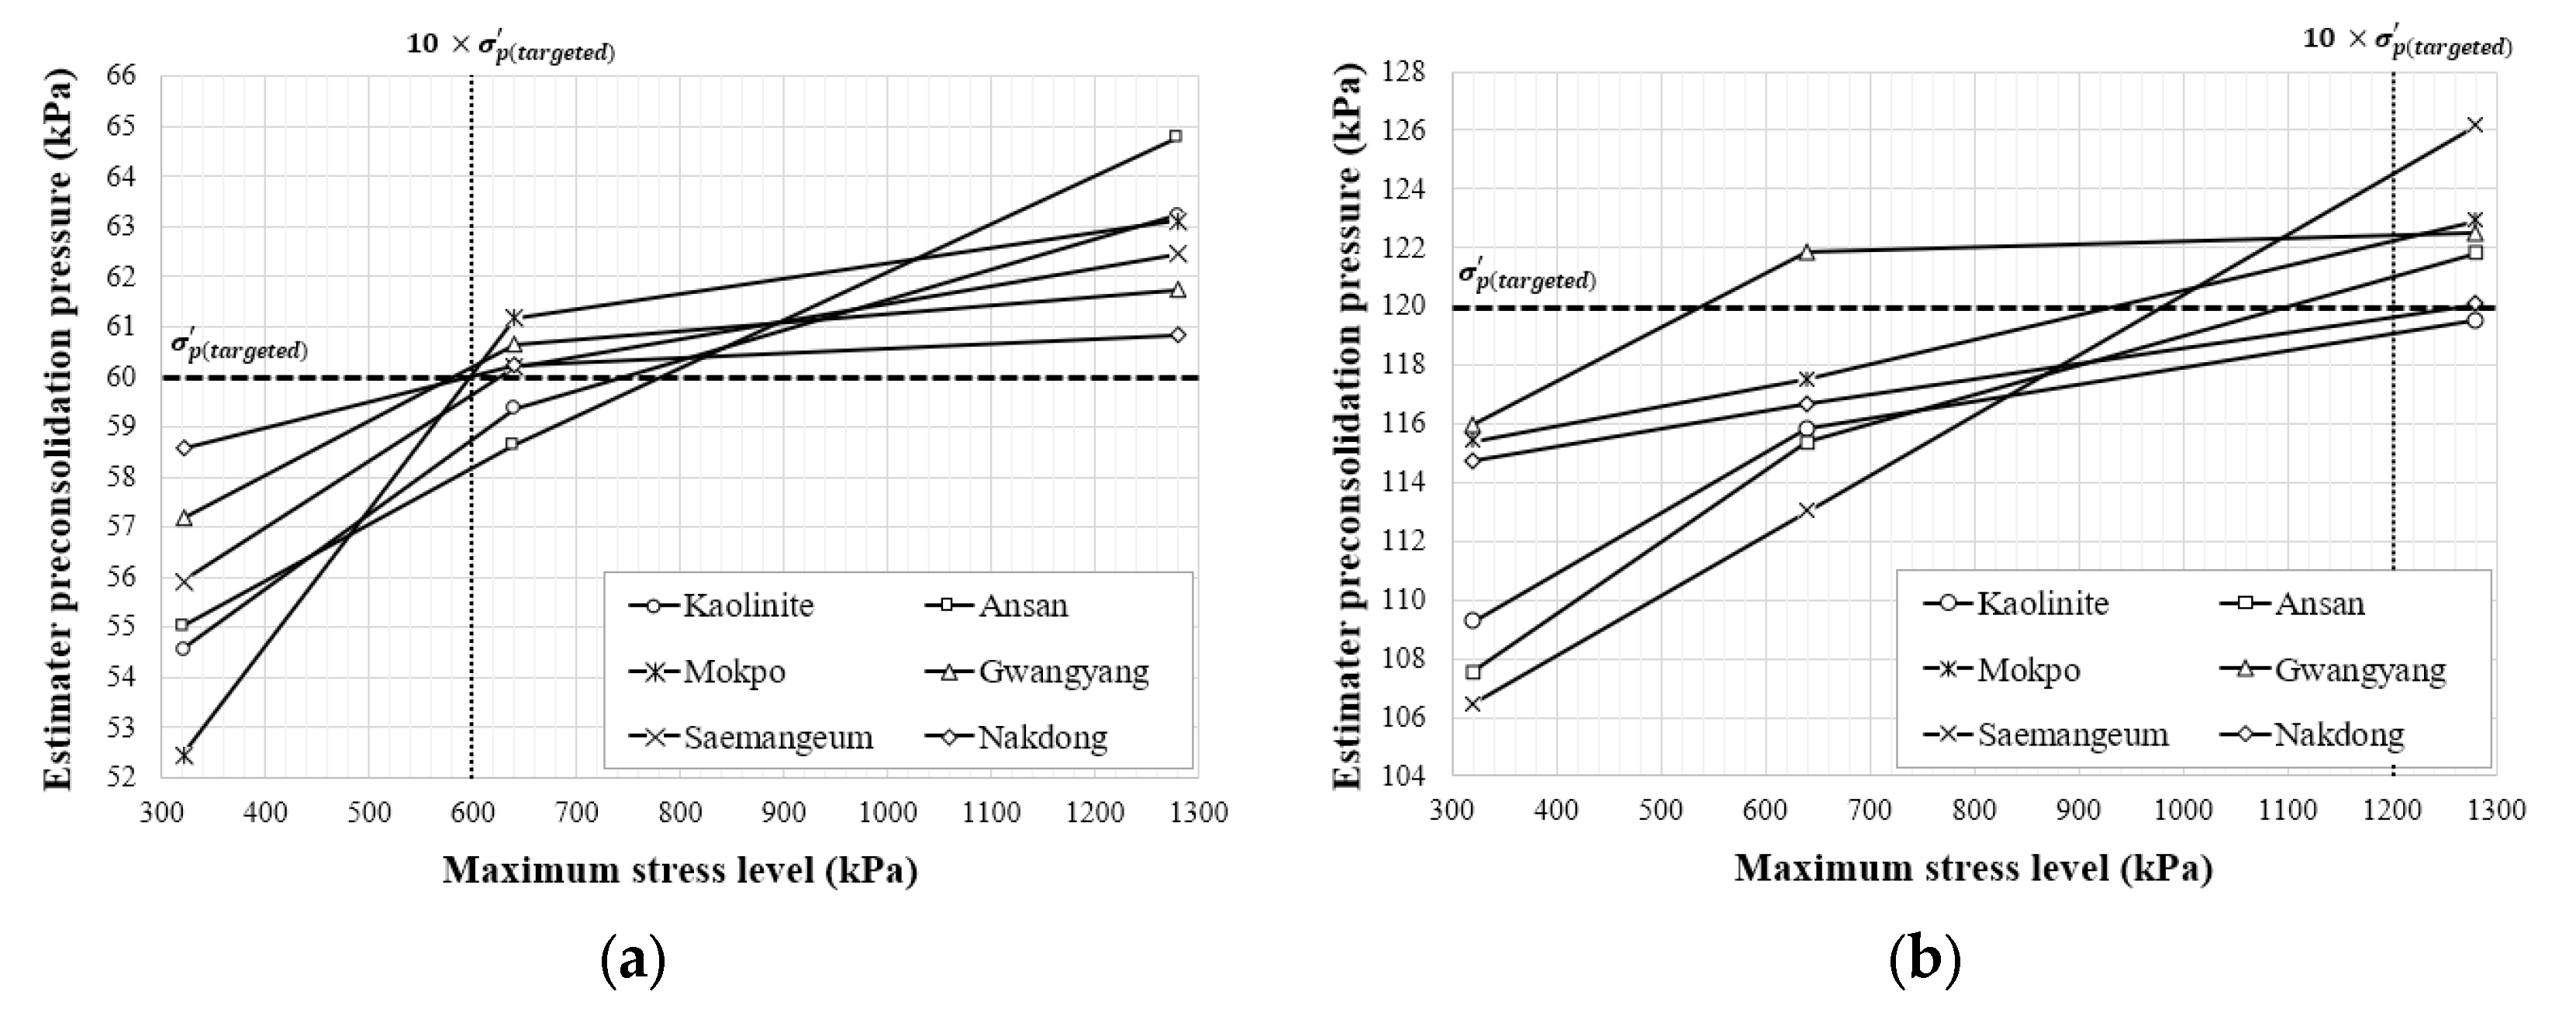
Figure 7 and Table 4 present the preconsolidation stresses estimated using the proposed method and the corresponding MAE values, respectively. Under the 60 kPa condition, the predicted values ranged from 52.4 to 63.2 kPa, whereas under the 120 kPa condition, they ranged from 108.5 to 125.2 kPa. The maximum applied stress level that provided the highest prediction accuracy varied depending on the magnitude of the preconsolidation stress. For the 60 kPa condition, the highest prediction accuracy was obtained when the maximum applied stress was approximately 9.7–13.0 times the preconsolidation stress (approximately 580–780 kPa). For the 120 kPa condition, higher accuracy was observed when the maximum applied stress was approximately 4.5–10.7 times the preconsolidation stress (approximately 540–1280 kPa). For all specimens, the minimum MAE was obtained when the maximum applied stress was approximately 10 times the preconsolidation stress (see Table 4).
Therefore, when the preconsolidation stress can be approximately assumed in advance, it is recommended to set the maximum applied stress to about 10 times that value. However, in practical consolidation testing, the preconsolidation stress is generally unknown beforehand. One of the key advantages of the proposed method is its robustness with respect to the maximum applied stress level. Unlike existing interpretation methods, which show significant variations in MAE depending on the maximum stress level (see Table 2 and Table 3), the proposed method exhibits relatively small variations. Even in the worst-case scenario (maximum applied stress of 320 kPa), the MAE values were only 2.09 and 2.91 kPa for the target preconsolidation stresses of 60 and 120 kPa, respectively, which are lower than the best-case results of the existing methods. That is, even if the maximum applied stress is not strictly set to a specific multiple, relatively stable estimation of the preconsolidation stress can be achieved. In addition, because the proposed method does not require prior identification of the transition point between the recompression and virgin compression regions, it enables more reproducible of the preconsolidation stress for clays exhibiting rounded compression curves.
It should be noted, however, that this study validated the proposed method using reconstituted clay specimens, for which the influence of sample disturbance is relatively limited. In the case of reconstituted specimens, consolidation tests are performed after removal of the applied load under conditions where disturbance is minimized; thus, the initial state of the test can be regarded as a continuation of the unload–reload behavior. Under such conditions, the assumption that the initial void ratio follows a slope similar to that of the rebound curve is considered reasonable. For natural clays, disturbance may occur during sampling, transportation, and storage, potentially resulting in an increase in the initial void ratio or changes in structural characteristics. In such cases, the position of the line C–D in Figure 6 may differ. Therefore, additional experimental studies are required to examine the influence of sample disturbance and changes in the initial void ratio when applying the proposed method to natural clays.

5. Conclusions

This study explored interpretation methods for determining the preconsolidation stress from one-dimensional consolidation test results. Reconstituted specimens with target preconsolidation stresses of 60 kPa and 120 kPa were prepared using commercial kaolinite and marine clays collected from coastal regions of South Korea (Ansan, Mokpo, Gwangyang, Saemangeum, and Nakdong), and consolidation tests were performed. Representative existing interpretation methods [11,15,18,20,21] were applied, and the influence of the maximum applied stress was analyzed by varying it to 320, 640, and 1280 kPa.
The results showed that different preconsolidation stresses were obtained from the same consolidation data depending on the interpretation method and the maximum applied stress level. In particular, for rounded compression curves, most existing methods were significantly influenced by the magnitude of the maximum applied stress, leading to large variations in prediction accuracy. Although the method of Onitsuka et al. [20] exhibited relatively low sensitivity and provided comparatively accurate predictions, its performance still depended on the clarity of the transition between recompression and virgin compression regions, indicating that subjective judgment may affect its practical application.
Accordingly, a new interpretation method based on the e l o g σ v ' curve was proposed. The proposed method determines the preconsolidation stress from the intersection of two independently defined lines, without requiring identification of the boundary between the recompression and virgin compression regions. The method utilizes the rebound slope obtained from an unload–reload cycle as the reference for recompression behavior and defines the virgin compression region through linear regression.
Quantitative evaluation using the mean absolute error (MAE) demonstrated that the proposed method provides stable and accurate estimates of the preconsolidation stress over a wide range of maximum applied stress levels. Even in the worst-case condition, the MAE values were as low as 2.09 kPa and 2.91 kPa for target preconsolidation stresses of 60 kPa and 120 kPa, respectively, which are lower than or comparable to the best results obtained using existing methods. These results indicate that the proposed method is less sensitive to the selection of the maximum applied stress and provides more reproducible estimates, particularly for clays exhibiting rounded compression curves.
However, the proposed method was validated using reconstituted clay specimens, for which the influence of sample disturbance is relatively small. In natural clays, disturbance may occur during sampling, transportation, and storage, which can lead to changes in structural characteristics (e.g., the initial void ratio). Such changes may affect the estimation of preconsolidation stress. Therefore, when applying the proposed method to natural clays, further studies are required to evaluate the influence of sample disturbance and associated changes in soil structure on the estimation of preconsolidation stress. Furthermore, the applicability and generality of the proposed method should be further validated using an expanded dataset that includes a wider range of stress conditions and OCR values.

Author Contributions

Conceptualization, S.-H.B.; methodology, S.-H.B.; software, D.-J.G.; validation, B.-H.J. and S.-H.B.; formal analysis, D.-J.G.; investigation, D.-J.G.; resources, K.P., B.-H.J. and S.-H.B.; data curation, D.-J.G.; writing—original draft preparation, D.-J.G.; writing—review and editing, B.-H.J. and S.-H.B.; visualization, D.-J.G.; supervision, B.-H.J. and S.-H.B.; project administration, K.P. and S.-H.B.; funding acquisition, K.P. and S.-H.B. All authors have read and agreed to the published version of the manuscript.

Funding

This work was supported by the Korea Institute of Energy Technology Evaluation and Planning (KETEP) and the Ministry of Climate, Energy & Environment (MCEE) of the Republic of Korea (No. RS-2025-02318006).

Data Availability Statement

The data that support the findings of this paper are available upon request.

Conflicts of Interest

The authors declare no conflicts of interest.

References

  1. Terzaghi, K. Principles of soil mechanics. IV. Settlement and consolidation of clay. Eng. News-Rec. 1925, 95, 874. [Google Scholar]
  2. Gibson, R.E.; England, G.L.; Hussey, M.J.L. The theory of one-dimensional consolidation of saturated clays: I. Finite non-linear consolidation of thin homogeneous layers. Geotechnique 1967, 17, 261–273. [Google Scholar] [CrossRef]
  3. Clayton, C.R.I.; Müller-Steinhagen, H.M.; Powrie, W.; Terzaghi, K.; Skempton, A.W. Terzaghi’s theory of consolidation and the discovery of effective stress (compiled from the work of K. Terzaghi and A.W. Skempton). Proc. Inst. Civ. Eng. Geotech. Eng. 1995, 113, 191–205. [Google Scholar] [CrossRef]
  4. Mesri, G. Primary compression and secondary compression. In Soil Behavior and Soft Ground Construction; ASCE: Reston, VA, USA, 2003; pp. 122–166. [Google Scholar]
  5. Kim, S.G. Current status of soft ground in Korea. J. Korean Soc. Civ. Eng. 1987, 35, 14–21. (In Korean) [Google Scholar]
  6. Kim, S.G.; Yeo, G.K.; Kim, G.S.; Kim, H.Y. Physical and compressibility characteristics of marine clays along the west and south coasts of Korea: Incheon, Mokpo, Gwangyang, and Busan. J. Korean Geotech. Soc. 2011, 12, 43–51. (In Korean) [Google Scholar] [CrossRef]
  7. Mesri, G.; Ajlouni, M. Engineering properties of fibrous peats. J. Geotech. Geoenviron. Eng. 2007, 133, 850–866. [Google Scholar] [CrossRef]
  8. Leroueil, S.; Kabbaj, M.; Tavenas, F.; Bouchard, R. Stress–strain–strain rate relation for the compressibility of sensitive natural clays. Geotechnique 1985, 35, 159–180. [Google Scholar] [CrossRef]
  9. Burland, J.B. On the compressibility and shear strength of natural clays. Geotechnique 1990, 40, 329–378. [Google Scholar] [CrossRef]
  10. Dobie, M. On the preconsolidation pressure: Experience based on testing the Holocene marine clay of Peninsular Malaysia. Geotech. Eng. J. SEAGS AGSSEA 2016, 47, 97–108. [Google Scholar]
  11. Casagrande, A. The determination of the pre-consolidation load and its practical significance. In Proceedings of the 1st International Conference on Soil Mechanics and Foundation Engineering, Cambridge, MA, USA, 22–26 June 1936; Volume 3, pp. 60–64. [Google Scholar]
  12. Grozic, J.L.; Lunne, T.; Pande, S. An oedometer test study on the preconsolidation stress of glaciomarine clays. Can. Geotech. J. 2003, 40, 857–872. [Google Scholar] [CrossRef]
  13. Conte, O.; Rust, S.; Ge, L.; Stephenson, R. Evaluation of pre-consolidation stress determination methods. In Instrumentation, Testing, and Modeling of Soil and Rock Behavior; ASCE: Reston, VA, USA, 2011; pp. 147–154. [Google Scholar]
  14. Ural, N.; Küçüker, U. Determination of pre-consolidation pressure by different methods. J. Civ. Eng. Constr. 2021, 10, 36–43. [Google Scholar] [CrossRef]
  15. Becker, D.E.; Crooks, J.H.A.; Been, K.; Jefferies, M.G. Work as a criterion for determining in situ and yield stresses in clays. Can. Geotech. J. 1987, 24, 549–564. [Google Scholar] [CrossRef]
  16. Butterfield, R. A natural compression law for soils (an advance on e–log p′). Geotechnique 1979, 29, 469–480. [Google Scholar] [CrossRef]
  17. Janbu, N. The resistance concept applied to deformation of soils. In Proceedings of the 7th International Conference on Soil Mechanics and Foundation Engineering, Mexico City, Mexico, 25–29 August 1969; Volume 1, pp. 191–196. [Google Scholar]
  18. Jacobsen, H.M. Determination of preconsolidation pressure in the laboratory. In Proceedings of the 11th Nordic Geotechnical Meeting (NGM-92), Aalborg, Denmark, 28–30 May 1992; pp. 455–460. [Google Scholar]
  19. Oikawa, H. Compression curve of soft soils. Soils Found. 1987, 27, 99–104. [Google Scholar] [CrossRef]
  20. Onitsuka, K.; Hong, Z.; Hara, Y.; Yoshitake, S. Interpretation of oedometer test data for natural clays. Soils Found. 1995, 35, 61–70. [Google Scholar] [CrossRef]
  21. Pacheco Silva, F. A new graphical construction for determination of the preconsolidation stress of a soil sample. In Proceedings of the 4th Brazilian Conference on Soil Mechanics and Foundation Engineering, Rio de Janeiro, Brazil, 3–8 August 1970; Volume 2, pp. 225–232. [Google Scholar]
  22. Olek, B.S.; Moskal, M. Comparison between methods for determining the effective vertical yield stress of intermediate fine-grained soils. Sci. Rep. 2024, 14, 131. [Google Scholar] [CrossRef]
  23. Paniagua, P.; L’Heureux, J.S.; Yang, S.; Lunne, T. Study on the practices for preconsolidation stress evaluation from oedometer tests. In Proceedings of the 17th Nordic Geotechnical Meeting (NGM), Reykjavik, Iceland, 25–28 May 2016. [Google Scholar]
  24. Boone, S.J. A critical reappraisal of “preconsolidation pressure” interpretations using the oedometer test. Can. Geotech. J. 2010, 47, 281–296. [Google Scholar] [CrossRef]
  25. Gouw, T.L. Consolidation parameters—Alternative to Casagrande and Taylor methods. In Proceedings of the 19th International Conference on Soil Mechanics and Geotechnical Engineering, Seoul, Republic of Korea, 17–21 September 2017; pp. 2985–2990. [Google Scholar]
  26. Çelik, S.; Tan, Ö. Determination of preconsolidation pressure with artificial neural network. Civ. Eng. Environ. Syst. 2005, 22, 217–231. [Google Scholar] [CrossRef]
  27. Torres, L.C.; Nemes, A.; ten Damme, L.; Keller, T. Current limitations and future research needs for predicting soil pre-compression stress: A synthesis of available data. Soil Tillage Res. 2024, 244, 106225. [Google Scholar] [CrossRef]
  28. Montoya-Araque, E.A.; Aparicio-Ortube, A.J.; Zapata-Medina, D.G.; Arboleda-Monsalve, L.G. An open-source application software to determine the preconsolidation pressure of soils in incremental loading oedometer testing: PySigmaP. SoftwareX 2022, 17, 100990. [Google Scholar] [CrossRef]
  29. ASTM D2435/D2435M-11; Standard Test Methods for One-Dimensional Consolidation Properties of Soils Using Incremental Loading. ASTM International: West Conshohocken, PA, USA, 2020.
  30. Pinto, C.S. First Pacheco Silva Conference—Part I: Distinguished aspects of Pacheco Silva’s activities. Solos Rochas 1992, 15, 49–87. [Google Scholar]
  31. Sheeran, D.E.; Krizek, R.J. Preparation of homogeneous soil samples by slurry consolidation. Geotechnique 1971, 21, 353–358. [Google Scholar]
  32. Tsutsumi, A.; Tanaka, H. Compressive behavior during the transition of strain rates. Soils Found. 2011, 51, 813–822. [Google Scholar] [CrossRef]
  33. Murison, R.A.; Gaspar, T.A.; Jacobsz, S.W.; Heymann, G.; Osman, A.S. Practical guidelines on the determination of one-dimensional swell properties of highly expansive clays. Can. Geotech. J. 2025, 62, 1–25. [Google Scholar] [CrossRef]
  34. Jennings, J.E.; Knight, K. The prediction of total heave from the double oedometer test. Trans. S. Afr. Inst. Civ. Eng. 1957, 7, 285–291. [Google Scholar]
Figure 1. Schematic diagrams of existing preconsolidation stress interpretation methods: (a) Casagrande [11]; (b) Silva [21]; (c) Becker et al. [15]; (d) Jacobsen [18]; (e) Onitsuka et al. [20].
Jmse 14 00740 g001
Figure 2. Example of void ratio–logarithm effective vertical stress relationships showing: (a) a clearly defined break with a linear virgin compression region; (b) a rounded transition without a distinct break; (c) a decreasing slope in the virgin compression region.
Jmse 14 00740 g002
Figure 3. Void ratio–logarithm of effective vertical stress curves for reconstituted kaolinite and Nakdong specimens with a preconsolidation stress of 120 kPa.
Jmse 14 00740 g003
Figure 4. Preconsolidation stress estimated by the existing methods [11,15,18,20,21] under different maximum stress levels: target preconsolidation stress (dash line) of 60 kPa.
Jmse 14 00740 g004
Figure 5. Preconsolidation stress estimated by the existing methods [11,15,18,20,21] under different maximum stress levels: target preconsolidation stress (dash line) of 120 kPa.
Jmse 14 00740 g005
Figure 6. Illustration of the proposed interpretation method for determining the preconsolidation stress from void ratio–logarithm effective vertical stress relationships: (a) specimen with a clearly defined break and linear virgin compression region; (b) specimen with a rounded transition.
Jmse 14 00740 g006
Figure 7. Preconsolidation stress estimated by the proposed method under different maximum stress levels: target preconsolidation stress (dash line) = (a) 60 kPa and (b) 120 kPa.
Jmse 14 00740 g007
Table 1. Index properties of soil specimen used in this study.
SpecimenLiquid Limit (%)Plastic Limit (%)Plasticity Index (%)Specific GravityUSCS Classification
Kaolinite65.335.330.02.61MH
Ansan41.428.213.22.63ML
Mokpo57.536.820.72.65MH
Gwangyang46.528.617.92.70ML
Saemangeum38.227.710.52.68ML
Nakdong59.123.835.32.67CH
Table 2. Mean absolute error (MAE) values of preconsolidation stress estimated by the existing interpretation methods for target preconsolidation stress of 60 kPa.
Maximum Stress Level (kPa)Mean Absolute Error (kPa)
Casagrande [11]Silva [21]Becker et al. [15]Jacobsen [18]Onitsuka et al. [20]
3206.562.679.8134.431.61
64024.1815.3923.3434.433.96
128034.2227.4534.9034.436.74
Table 3. Mean absolute error (MAE) values of preconsolidation stress estimated by the existing interpretation methods for target preconsolidation stress of 120 kPa.
Maximum Stress Level (kPa)Mean Absolute Error (kPa)
Casagrande [11]Silva [21]Becker et al. [15]Jacobsen [18]Onitsuka et al. [20]
3209.5113.555.1675.365.46
64020.6713.7119.8375.364.24
128044.6741.9242.0075.369.56
Table 4. Mean absolute error (MAE) values of preconsolidation stress estimated by the proposed interpretation method.
Maximum Stress Level (kPa)Mean Absolute Error (kPa)
Target Preconsolidation Stress = 60 kPaTarget Preconsolidation Stress = 120 kPa
3202.092.91
6400.841.98
12801.641.52
Disclaimer/Publisher’s Note: The statements, opinions and data contained in all publications are solely those of the individual author(s) and contributor(s) and not of MDPI and/or the editor(s). MDPI and/or the editor(s) disclaim responsibility for any injury to people or property resulting from any ideas, methods, instructions or products referred to in the content.