Article

Thermodynamic Analysis and Economic Evaluation of a CO2 Re-Liquefaction System Utilizing Cold Energy of Alternative Marine Fuels


1
Department of Naval Architecture and Offshore Engineering, Dong-A University, 37 Nakdong-daero 550 Boen-gil, Saha-gu, Busan 49315, Republic of Korea
2
Department of Naval Architecture and Ocean Engineering, Dong-A University, 37 Nakdong-daero 550 Beon-gil, Saha-gu, Busan 49315, Republic of Korea
*
Author to whom correspondence should be addressed.
J. Mar. Sci. Eng. 2026, 14(7), 636; https://doi.org/10.3390/jmse14070636
Submission received: 5 March 2026 / Revised: 27 March 2026 / Accepted: 28 March 2026 / Published: 30 March 2026

Abstract

This study proposes a CO2 re-liquefaction system utilizing the cold energy of LNG and liquid hydrogen (LH2) to efficiently manage boil-off gas in alternative fuel-based CO2 carriers. Process simulations using Aspen HYSYS V11 under 100% and 70% propulsion loads evaluated the Specific Energy Consumption (SEC), Coefficient of Performance (COP), UA of heat exchangers, and Specific Life Cycle Cost (SLCC). The results demonstrate that under both 100% and 70% propulsion load conditions, the utilization of cold energy decreases the SEC by 24.5% and improves the COP by approximately 34% compared to the reference model without cold energy utilization. Sensitivity analysis on the minimum temperature approach indicates limited impact on performance. The UA of the heat exchangers decreased by up to 83% (LNG) and 87% (LH2), offering significant downsizing advantages. Economically, SLCC was reduced by up to 14.8% and 15.9% for the LNG and H2 models, respectively, due to lower Capital Expenditure (CAPEX) and Operating Expenditure (OPEX). Consequently, this study demonstrates that exploiting the cold energy of alternative fuels significantly improves both the thermodynamic performance and economic feasibility of CO2 re-liquefaction systems, providing foundational data for future optimization.

1. Introduction

International goals were adopted in 2015 to limit the rise in global average temperature to well below 2 °C relative to pre-industrial levels, with efforts to restrict the increase to 1.5 °C [1]. Achieving these temperature suppression targets requires minimizing atmospheric carbon emissions, which has led to the rapid expansion of the Carbon Capture, Utilization, and Storage (CCUS) market [1]. With the expansion of CCUS technology, the demand for carbon dioxide (CO2) carriers to transport captured CO2 for utilization and storage is also increasing [1].
As the demand for CO2 maritime transport increases, the large-scale transport of CO2 is required. Liquid CO2 possesses a significantly higher density compared to the gaseous state, allowing for a greater mass to be accommodated within the same storage volume, making it advantageous for large-scale transport. However, conventional Type C tanks are noted for structural limitations in terms of space efficiency and weight, and analyses suggest that they are unsuitable for large-scale transport [2]. Consequently, to facilitate large-scale transport, there is a transition toward tank systems designed for low-pressure conditions [2]. Since these conditions require maintaining the cargo at low temperatures, heat ingress inevitably leads to the generation of boil-off gas (BOG), making its appropriate treatment essential [3]. Methods for handling BOG generated during maritime transport include maintaining the BOG in the tank’s vapor space without separate processing equipment to allow pressure build-up, and using equipment to re-liquefy the BOG [4]. Among these, the re-liquefaction method offers the advantage of preventing cargo loss and effectively recovering BOG by re-liquefying the gas generated during storage and transport and injecting it back into the storage tank [5].
Furthermore, with the proliferation of global carbon neutrality policies, securing carbon emission reduction technologies has emerged as a key challenge in the maritime transport industry. The International Maritime Organization (IMO) aims to achieve net-zero greenhouse gas emissions by or around 2050. In response, existing vessels powered by Bunker C oil are transitioning to eco-friendly alternative fuels such as hydrogen, LNG, and ammonia. Among these, hydrogen and LNG are liquefied and stored at cryogenic temperatures of −253 °C and −163 °C, respectively, to secure higher volumetric density compared to the gaseous state. The stored fuel is supplied to the engine and fuel cell via the fuel gas supply system (FGSS). In this study, the target supply conditions were assumed to be approximately 6–7 bar and 45 °C, representing typical operating requirements. Consequently, during the regasification process to meet these conditions, the fuel vaporizes, releasing significant cold energy. This cold energy can contribute to system efficiency improvements if utilized appropriately [6]. Regarding BOG management, conventional re-liquefaction technologies include the vapor compression cycle, Claude cycle, and Linde–Hampson cycle, each possessing distinct operating principles and performance characteristics.
First, the vapor compression cycle compresses the refrigerant via a compressor to increase pressure, followed by a condensation process and pressure reduction at an expansion valve to perform cooling and liquefaction. This cycle is characterized by relatively high energy efficiency and has the advantage of abundant commercialization and empirical cases [7].
The Claude cycle can improve energy efficiency by utilizing an expander. However, limitations have been reported regarding increased complexity in terms of system configuration and operation due to the expander and the accompanying rotating machinery and control systems [8].
The Linde–Hampson cycle is the simplest structure that liquefies high-pressure gas through isenthalpic expansion via a Joule–Thomson valve. Although it features a simple system configuration by eliminating the need for an expander, it is reported to have limitations such as high compressor power consumption and low energy efficiency due to the high compression pressure required for liquefaction [9].
Therefore, this study selected the vapor compression cycle, which has relatively high energy efficiency and extensive commercialization experience, as the BOG re-liquefaction cycle. Ammonia was selected as the refrigerant for CO2 re-liquefaction. Ammonia is an eco-friendly natural refrigerant that can improve the energy efficiency of the refrigeration cycle based on its high latent heat of evaporation and superior thermodynamic performance [10]. It is also evaluated as an economic and realistic option in terms of actual system design and operation due to its high compatibility with commercialized compressors and heat exchangers [11].
While separate studies exist on existing CO2 re-liquefaction technologies and fuel cold energy utilization technologies, research integrating both fields remains limited. Lee et al. (2012) presented a thermodynamic system for ship-based liquid CO2 transport and suggested potential energy consumption reductions through the optimization of compression ratios and cooling conditions but did not consider an integrated design with external cold sources [7]. Lebedevas et al. (2024) analyzed the applicability of cryogenic carbon capture technology using LNG fuel vaporization cold energy for dual-fuel vessels, suggesting potential efficiency improvements, yet did not perform heat integration with CO2 BOG re-liquefaction or economic evaluations [12]. Yoo (2017) proposed an LNG cold energy-based CO2 BOG re-liquefaction process based on simple heat exchange but limited the technological scalability by not applying a refrigerant cycle [13].
In terms of refrigeration technology, Wang et al. (2024) proposed the application of ammonia-based absorption refrigeration technology to natural gas and hydrogen liquefaction systems to suggest energy savings, but this did not include shipboard applications or integrated design for CO2 BOG re-liquefaction [10]. Additionally, Lin et al. (2023) introduced the concept of utilizing fuel vaporization cold energy for re-liquefaction in ammonia-propelled CO2 carriers; however, the study was insufficient regarding the combined utilization with hydrogen cold energy, the application of refrigerant circulation systems, and economic evaluation [14].
Thus, the existing research has mostly focused on the analysis of individual elements such as the type of re-liquefaction cycle, cold energy recovery schemes, or refrigerant examination. There is a relative lack of studies that comprehensively evaluated the impact of utilizing alternative fuel cold energy on the performance of the re-liquefaction process from thermodynamic and economic perspectives. In particular, quantitative analysis regarding the improvement effects on SEC, COP, and the overall cost structure when integrating the cold energy of alternative fuels such as LNG or liquid hydrogen into the re-liquefaction process has not been sufficiently conducted.
To address this research gap, this study proposed a system designed to utilize the cryogenic cold energy recovered during the vaporization of alternative fuels for BOG re-liquefaction, specifically targeting CO2 carriers equipped with LNG engines or hydrogen-fueled proton exchange membrane fuel cells (PEMFCs). The primary novelty of this work lies in the integration and comparative evaluation of these two distinct alternative marine power systems. Furthermore, this study distinguishes itself from the existing literature by conducting a simultaneous, in-depth assessment of both thermodynamic performance (e.g., SEC and COP) and economic feasibility (e.g., SLCC and USD/ton-CO2) under varying propulsion load conditions (100% and 70%).
The ammonia refrigerant used for CO2 re-liquefaction requires a multi-stage compression process. This configuration is essential for attaining the high-pressure levels required for CO2 condensation while maintaining overall system efficiency. Previous studies on CO2 liquefaction indicate that restricting the compression ratio at each stage is critical to prevent excessively high discharge temperatures, which can lead to lubricant degradation and diminished isentropic efficiency. Consequently, in alignment with the established methodologies, the compression ratio for each stage in this study was strictly maintained below 3.0, thereby necessitating a multi-stage configuration [15].
This study examined a high-efficiency process configuration that thermally integrates the re-liquefaction system and the FGSS by effectively cooling the refrigerant superheated during the compression process through heat exchange with the alternative fuel, and subsequently supplying the fuel, which has increased in temperature after vaporization, to the propulsion system via the FGSS [14]. Additionally, the study quantitatively evaluates the impact of utilizing alternative fuel cold energy on the thermodynamic efficiency and economics of the CO2 re-liquefaction system.

2. Methodology

2.1. System Overview and Configuration

The system considered in this study comprises an ammonia refrigerant-based re-liquefaction system for the re-liquefaction of BOG generated within the tanks of a CO2 carrier and a FGSS for fuel supply. To verify thermodynamic and economic feasibility, the system was configured into two models: one that does not utilize the cold energy of the alternative fuel and one that utilizes it. The model utilizing cold energy also incorporated the propulsion load of the target vessel. Previous studies categorized the main engine load within a range of 30–100%, evaluating performance by setting 50–70% as medium-to-high load operating conditions and 100% as the rated maximum load condition [13]. Accordingly, in this study, 70% was set as the rated load condition, and 100% was set as the maximum load condition.
The target vessel for analysis was assumed to be a 50,000 m3 class CO2 carrier, and the propulsion power was estimated at 15,000 kW based on data from the proven 7500 m3 class carrier, Northern Pioneer [16]. To calculate the mass flow rate of the boil-off gas (BOG), the boil-off rate (BOR) was set to 0.15%/day, and the density of the liquid cargo was determined based on the specific operating conditions [3]. Furthermore, the filling limit of the cargo tank was assumed to be 90%. The main design parameters of the target CO2 carrier are summarized in Table 1.
To determine the fuel flow rate required to generate a propulsion power of 15,000 kW, Ballard’s FCwave fuel cell (Ballard Power Systems, Burnaby, BC, Canada) as adopted as the power source for the hydrogen-fueled case. The required hydrogen flow rate was calculated based on the energy efficiency derived from the lower heating value (LHV) [17]. Similarly, for the LNG-fueled case, the MAN Energy Solutions S35ME-C9.7-GI engine (MAN Energy Solutions, Augsburg, Germany) was selected as the power source, and the LNG flow rate was estimated based on the engine’s rated specific fuel consumption [18]. The mass flow rate of the BOG ( m ˙ B O G ) was calculated using the total tank volume ( V ), the tank filling limit ( F L ), the liquid density ( ρ ), and the BOR as follows:
m ˙ B O G = V × F L × ρ × B O R 24 × 100
The mass flow rate of hydrogen ( m ˙ H 2 ) was calculated using the propulsion power ( P p r o p ), the fuel cell efficiency ( η F C ), and the lower heating value of hydrogen ( L H V H 2 ) as follows:
m ˙ H 2 = P p r o p η F C × L H V H 2
Similarly, the mass flow rate of LNG ( m ˙ L N G ) was calculated using the propulsion power ( P p r o p ) and the specific fuel consumption of the engine ( S F C L N G ) as follows:
m ˙ L N G = P p r o p × S F C L N G
The flow rates of BOG, hydrogen, and LNG, calculated based on the parameters in Table 1 and Table 2, are summarized in Table 3.
The CO2 re-liquefaction system considered in this study adopts the external refrigerant-based re-liquefaction method proposed in previous studies as illustrated in Figure 1 for the model without cold energy utilization.
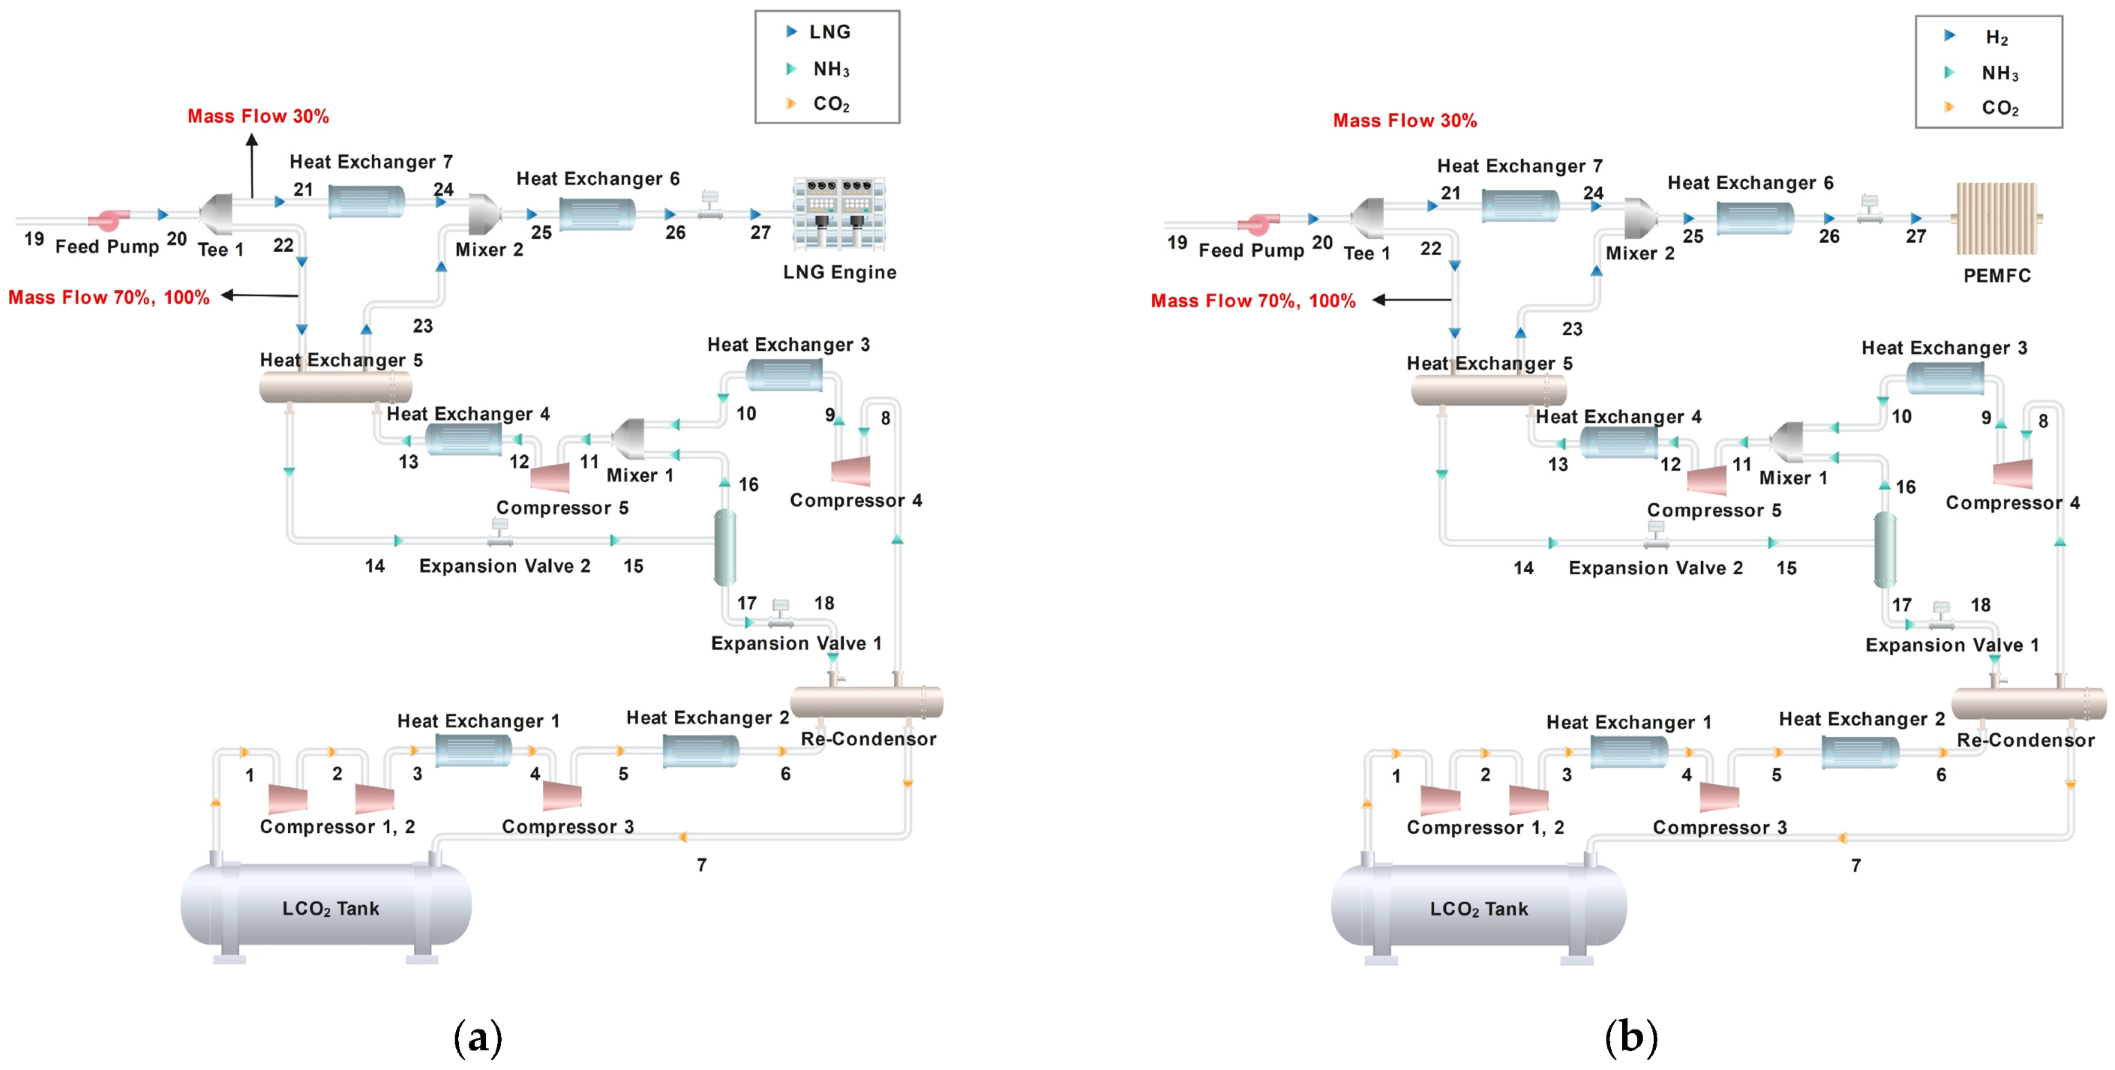
Furthermore, the system is configured to expand upon this by incorporating alternative fuel cold energy utilization and propulsion load conditions [13,14], as shown in Figure 2:
  • 100% Load Model: The entire fuel flow rate vaporizes through heat exchange with the ammonia refrigerant, and the vaporized fuel is supplied to the fuel cell and engine via the FGSS.
  • 70% Load Model: Only 70% of the total fuel vaporizes through heat exchange with the ammonia refrigerant, while the remainder is vaporized in an independent vaporizer before being merged for supply.
The system configuration utilizing the cold energy of alternative fuels integrates the re-liquefaction system with the FGSS. Under the 70% propulsion load condition, 70% of the flow rate is supplied to the re-liquefaction system via Tee 1 for vaporization, while the remaining 30% of the flow rate is vaporized through a separate vaporizer and subsequently combined via Mixer 2. Under the 100% propulsion load condition, the entire flow rate (100%) is supplied through Tee 1 for vaporization and is subsequently delivered to the engine and fuel cell. The cold energy of the alternative fuel is utilized to reduce the refrigerant temperature upstream of the expander to approximately 10 °C by exchanging heat with the ammonia refrigerant in the heat exchanger located upstream of the expansion valve [6].

2.2. Modeling and Simulation

All simulations were performed using Aspen HYSYS V11 (Aspen Technology, Inc., Bedford, MA, USA) software, assuming steady-state conditions for all components of the CO2 re-liquefaction system and the FGSS. The Peng–Robinson equation of state was applied for all fluids.
Previous studies on CO2 re-liquefaction and cryogenic processes have widely employed thermodynamic simulations using commercial process simulators to analyze energy consumption and overall system performance [19,20,21,22,23]. The simulation-based energy consumption analysis conducted in this study is considered highly valid, as it strictly adopts the Peng–Robinson equation of state, a well-established thermodynamic property package alongside methodological frameworks consistent with the existing literature. The alignment of the present analytical approach with previously validated studies ensures the reliability of the thermodynamic and energy consumption results presented herein.
The following assumptions were applied during the modeling process:
  • Pressure drops in pipes and separation vessels are neglected.
  • Heat loss between the system and the external environment is neglected.
  • Cooling water is supplied at 30 °C and returns at 35 °C.
  • Minimum temperature approach (MTA) for the CO2 liquefaction heat exchanger: 5 °C.
  • MTA for the cooling water–refrigerant heat exchanger: 10 °C.
  • Compressor adiabatic efficiency: 75%.
  • Pump adiabatic efficiency: 75%.
  • Pressure drop in heat exchangers (for CO2, refrigerant, and cooling water): 0.2 bar for CO2/refrigerant, 0.5 bar for refrigerant/cooling water.
  • Pressure drop in heat exchangers (for refrigerant and fuel): 0.2 bar for both refrigerant and fuel sides.
  • Maximum pressure ratio of compressor: 3.
  • Efficiency of liquid–vapor separation in all separators: 100%.
  • Mechanical energy losses in the compressor and pump shafts are neglected.
The MTA values for the fuel-to-refrigerant heat exchangers (LNG-to-refrigerant and H2-to-refrigerant) were not predefined, but rather thermodynamically determined by the energy balance under the specified stream conditions.
These assumptions were applied with reference to cryogenic process design guidelines and standard values for ship-based cooling systems [7,14]. The modeling results were subsequently utilized for thermodynamic performance analysis and economic evaluation.
Hereafter, the hydrogen and LNG systems that do not utilize cold energy are defined as the H2 model and LNG model, respectively. The models utilizing the cold energy of hydrogen and LNG are defined and denoted as the H2-CA (cold energy assisted) model and LNG-CA (cold energy assisted) model, respectively, as summarized in Table 4.
The Heat and Material Balance (H&MB) data for each model are presented in Appendix A.

2.3. Thermodynamic Analysis

In this study, to quantitatively evaluate the thermodynamic performance of the CO2 re-liquefaction system, performance indicators were defined based on the SEC consumed in the re-liquefaction process and the heat removed during the re-liquefaction process [19]. The energy consumption of the system was calculated by considering the electric power consumed by the compressors included in the CO2 re-liquefaction system to directly reflect the performance of the re-liquefaction process. The FGSS was included solely for the analysis of heat transfer characteristics resulting from cold energy utilization and was excluded from the energy consumption calculations.
The power consumption of the compressor, which represents the total energy consumption of the re-liquefaction system, was calculated using the mass flow rate of the working fluid and the specific enthalpy difference between the compressor inlet and outlet, as follows.
W ˙ c o m p = m ˙ × ( h o u t h i n )
Here, m ˙ denotes the mass flow rate of the working fluid passing through the compressor, and h i n and h o u t represent the specific enthalpy at the compressor inlet and outlet, respectively. The total energy consumption of the re-liquefaction system was defined as the sum of the power consumption of all compressors included in the re-liquefaction cycle.
To evaluate the energy efficiency of the re-liquefaction process, the SEC, representing the energy consumption per unit mass of liquefied CO2, was defined as follows.
S E C = Σ W ˙ c o m p m ˙ L C O 2
Here, m ˙ L C O 2 denotes the mass flow rate of the re-liquefied CO2. SEC was utilized as a performance indicator to comparatively analyze the energy efficiency of the re-liquefaction process according to the utilization of cold energy and propulsion load conditions.
Additionally, the heat removed during the re-liquefaction process was defined to evaluate the refrigeration performance of the system. The heat removed, Q ˙ r e l , is defined as the heat rejected by the CO2 as it passes through the re-liquefaction heat exchanger and was calculated as follows.
Q ˙ r e l = m ˙ L C O 2 × ( h i n h o u t )
where h i n and h o u t denote the specific enthalpies of carbon dioxide at the inlet and outlet of the condenser, respectively. This removed heat encompasses both the sensible heat and the latent heat associated with the phase change of CO2. Based on removed heat, a second performance indicator, the COP, representing the ratio of the re-liquefaction heat load to the compressor energy consumption, was defined as follows:
C O P = Q ˙ r e l Σ W ˙ c o m p
The COP serves as a dimensionless indicator representing the relative level of re-liquefaction cooling output obtained per unit of electric power consumed by the target system, where a higher value indicates superior refrigeration performance.
The system boundary for the thermodynamic analysis was defined to exclusively encompass the components directly involved in the CO2 re-liquefaction cycle. The energy consumption associated with the FGSS was excluded from the SEC and COP calculations, given that the FGSS serves as a fundamental auxiliary system for ship propulsion and operates independently of the re-liquefaction process.
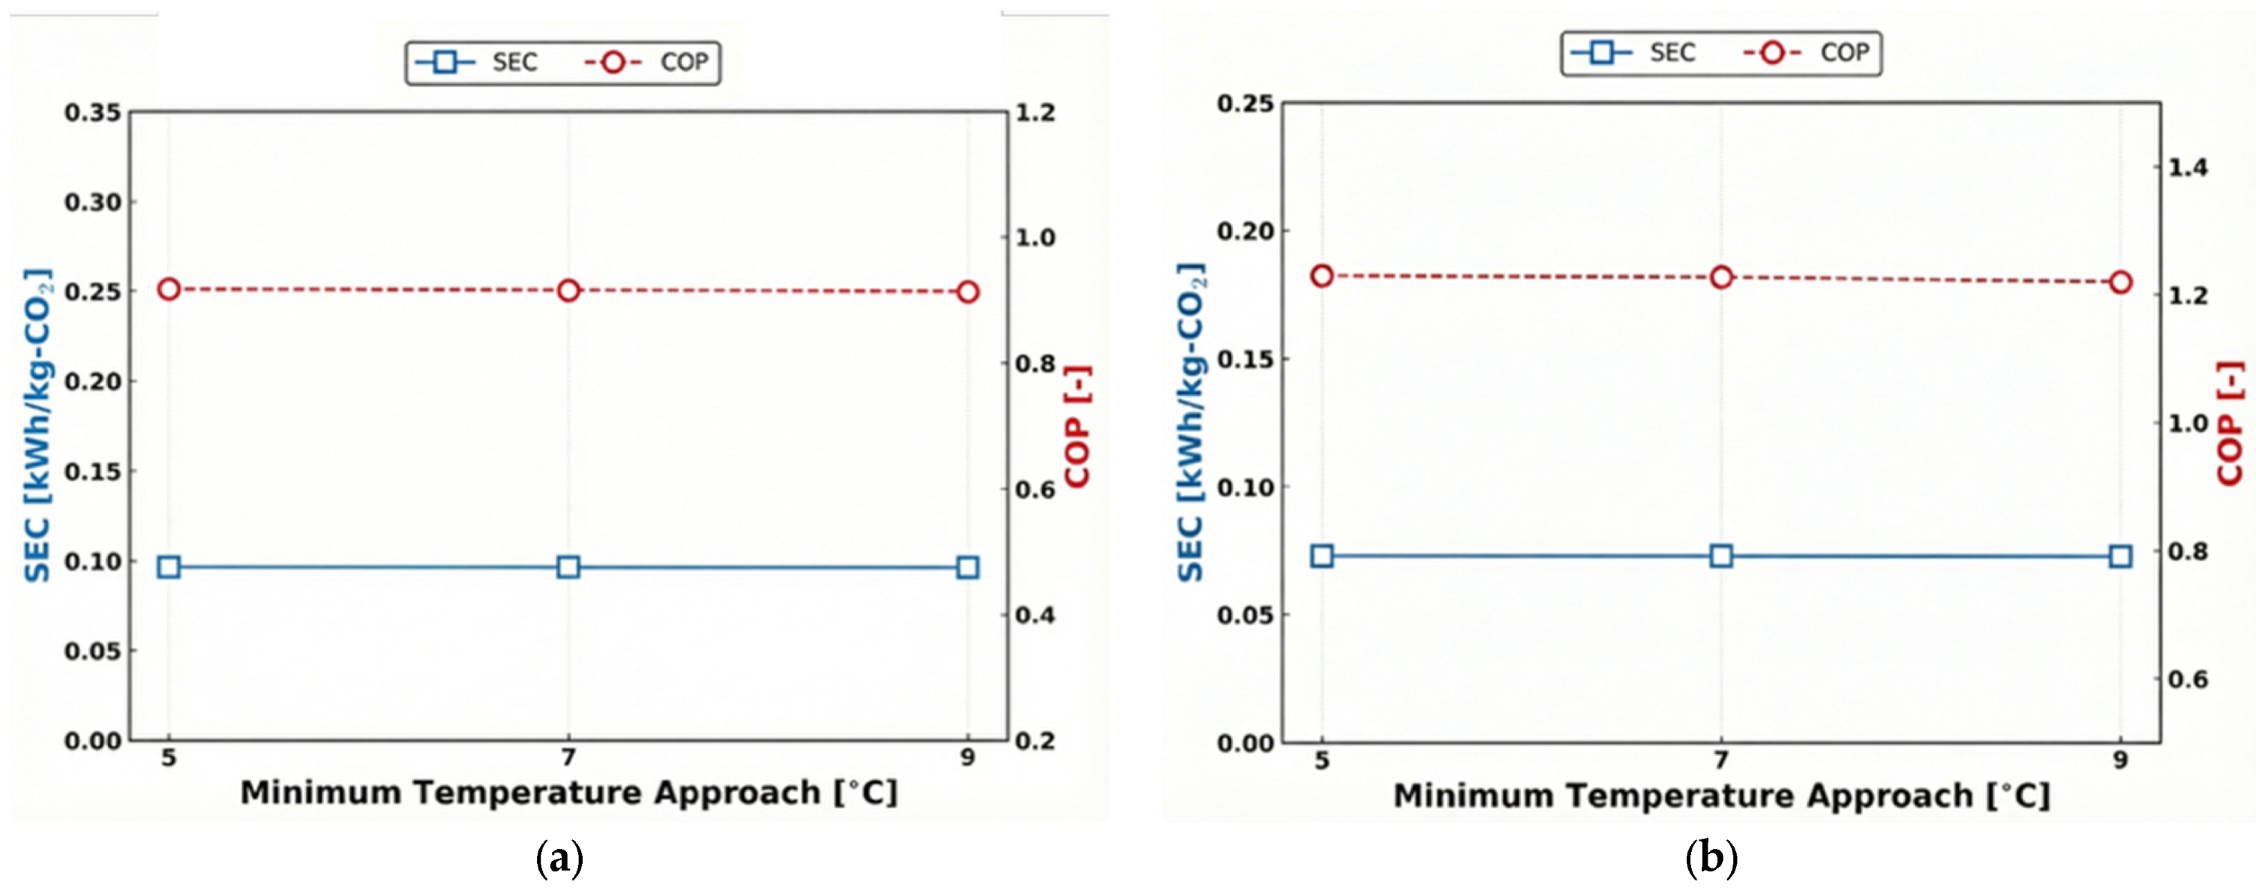
Furthermore, to analyze the impact of re-liquefaction heat exchanger design conditions on energy performance, the variations in SEC and COP were additionally analyzed by varying the MTA of the CO2 re-liquefaction heat exchanger to 5, 7, and 9 °C.
To compare the differences in required heat transfer levels depending on system configurations and propulsion load conditions, the UA values of the key heat exchangers selected for analysis in each model were compared. UA is defined as the product of the required heat transfer area and the overall heat transfer coefficient, and was examined to quantitatively compare the scale and heat transfer performance of the heat exchangers. The heat transfer rate in the heat exchanger is expressed by the following fundamental relationship.
Q = U A × ( T e q )
Here, U denotes the overall heat transfer coefficient, A represents the heat transfer area, and T e q signifies the effective temperature difference between the fluids on both sides of the heat exchanger. The comparison of UA was performed targeting Heat Exchanger 5, Heat Exchanger 6, and Heat Exchanger 7. Accordingly, the UA for each model is defined by a minimum of two heat exchangers (at 100% load) to a maximum of three heat exchangers (at 70% load), depending on the load conditions. Through this, the differences in required heat transfer levels were comparatively analyzed according to the utilization of cold energy and variations in propulsion load.
The expansion valve within the system serves the role of pressure reduction, and the enthalpy across the valve (inlet and outlet) follows an isenthalpic process.
h i n = h o u t

2.4. Economic Evaluation

Economic evaluation was performed based on the LCC. The equipment costs were estimated using the Aspen Capital Cost Estimator software V11 (Aspen Technology, Inc., Bedford, MA, USA), and the LCC was defined as the sum of the CAPEX and the OPEX. CAPEX consists of Direct Costs ( C D E ) and Indirect Costs ( C I D E ), and is calculated as follows.
C A P E X = C D E + C I D E
C D E consists of the Purchased Equipment Cost ( C P ), Operating Labor Cost ( C L ), and Material Cost ( C M ).
C D E = C P + C L + C M
C I D E was calculated based on cost factors generally applied in plant design, as follows [24]. The variables required for the calculation of C I D E consist of Freight, Insurance, and Taxes ( C F I T ), Construction ( C O ), and Contractor Engineering Expense ( C E ).
C I D E = C F I T + C O + C E
The specific coefficients applied to each item were referenced from values widely used in chemical plant economic evaluations and are summarized in Table 5 [24,25].
OPEX was calculated using the annual Cost of Manufacturing ( C O M ). Given the characteristics of the CO2 re-liquefaction process, costs for Waste Treatment and Raw Material were not considered. Excluding depreciation, C O M is calculated as follows. The variables required for the calculation of C O M consist of Fixed Capital Investment ( F C I ), Operating Labor Cost ( C O L ), and Utility Cost ( C U T ).
C O M = 0.180 F C I + 2.73 C O L + 1.23 C U T
C O L was calculated using Salary ( C S ), Number of Operators per Shift ( N O L ), and Number of Shifts ( N S ) as follows.
C O L = C S × N O L × N S
Salary was assumed to be 59,580 USD/year, and N O L was calculated as follows considering the number of nonparticulate processing steps ( N n p ). The number of processing steps involving the handling of particulate solids ( P ) was assumed to be 0 as it is not applicable to this system.
N O L = ( 6.29 + 31.7 P 2 + 0.23 N n p ) 0.5
C U T was calculated by summing the costs of electricity and cooling water. The Electric Cost ( C E ) was calculated as follows using the power consumption of the compressors ( P C ) used in the re-liquefaction system, the annual operating hours ( t O P ) , and the unit price of electricity ( P E ), as summarized in Table 6:
C E = Σ P C × t O P   × P E
The Cooling Water Cost ( C W ) was calculated as follows, based on the heat duty of the heat exchangers ( D H ) utilizing cooling water, t O P , and the unit price of cooling water price ( P C W ) as summarized in Table 6:
C W = Σ D H × t O P   × P C W
As detailed in Table 6, the unit prices were determined to reflect both marine specific conditions and established industrial standards. Specifically, the unit price of electricity was estimated based on the generation cost of a shipboard power plant to accurately represent the marine operational environment. Conversely, for cooling water, the standard utility costs conventionally applied in energy systems and chemical plants were adopted to ensure a robust, objective, and conservative economic assessment [19,20,26].
Based on the annual Cost of Manufacturing ( C O M ), the OPEX for the entire operating period was calculated as follows.
O P E X = C O M × 1 ( 1 + r ) T r
The interest rate ( r ) and System Lifetime ( T ) were selected as 5% and 25 years, respectively, referring to representative values commonly used in the economic evaluation of ships and energy systems [27,28]. Based on the aforementioned CAPEX and OPEX, the LCC of the proposed system was calculated as expressed in Equation (19):
L C C = C A P E X + O P E X
The LCC was calculated for the six CO2 re-liquefaction models by applying identical economic assumptions. Through this, the economic feasibility was compared and analyzed according to the utilization of cold energy, fuel type, and load conditions.
S L C C = L C C T o t a l   a m o u n t   o f   l i q u e f i e d   C O 2   o v e r   t h e   l i f e t i m e
To evaluate the economic feasibility of the proposed systems, the Specific Life Cycle Cost (SLCC) was employed as a normalized key performance indicator. The SLCC was calculated by dividing the total LCC by the cumulative mass of CO2 re-liquefied over the entire project lifetime.
It should be noted that the economic evaluation of shipboard systems inherently involves parameter uncertainties. From an energy systems perspective, the installation environments, spatial constraints, and safety regulations of marine vessels differ significantly from those of onshore plants. However, standardized and empirical cost-estimation models specifically developed for novel shipboard CO2 re-liquefaction systems are currently lacking in the open literature. Consequently, this study adopted widely validated indirect cost factors derived from onshore chemical plant engineering. Given that the primary objective of this economic evaluation was to conduct a relative comparative analysis among the proposed alternative fuel models, rather than to determine absolute shipyard construction costs, the consistent application of these established factors provides a rational, conservative, and objective baseline for assessing economic feasibility [19,20].

3. Results and Discussion

3.1. Thermodynamic Analysis

As a result of the process simulation, the power consumption of the compressor used for CO2 re-liquefaction in the Reference Model was found to be 338 kW. On the other hand, in the Cold Energy Utilization Model, the power consumption of the compressor decreased to 255 kW, regardless of the fuel type and propulsion load conditions. This is primarily attributed to the direct utilization of the cryogenic cold energy from the alternative fuel in Heat Exchanger 5, which functions as the condenser for the ammonia refrigeration cycle. This direct cooling effect significantly lowers the condensation temperature of the refrigerant, thereby mitigating the overall compression requirements and consequently reducing the necessary number of compressor stages from three to two.
The SEC analysis revealed that the SEC of the model without cold energy utilization was 0.0966 kWh/kg-CO2, while the models utilizing cold energy all yielded 0.0729 kWh/kg-CO2. Through this, it was confirmed that the energy consumption per unit mass of liquefied CO2 decreased by approximately 24.5% when using cold energy compared to the model not utilizing cold energy. This indicates that the utilization of cold energy directly improves the energy efficiency of the re-liquefaction process, as summarized in Table 7.
The results of the COP analysis are as follows. The re-liquefaction heat output was found to be 310 kW for the model without cold energy utilization and 314 kW for the model with cold energy utilization. Based on these values, the COP was calculated to be 0.9172 for the Reference Model and 1.2296 for the Cold Energy Utilization Model. The COP of the Cold Energy Utilization Model increased by approximately 34% compared to the model without cold energy utilization, which implies that the same cooling output can be provided with less compressor power. In other words, the utilization of cold energy has the effect of improving the refrigeration performance of the re-liquefaction system, as presented in Table 8.
The re-liquefaction system was designed to utilize the maximum cold energy corresponding to a propulsion power output of 15,000 kW. By applying this maximum available cold energy as a constant design constraint under both 100% and 70% load conditions, the specific energy performance metrics remained consistent across all simulated scenarios.
As a result of performing a sensitivity analysis by varying the MTA of the CO2 re-liquefaction heat exchanger from 5 °C to 7 °C and 9 °C, both SEC and COP showed a tendency to change slightly as the MTA increased. However, the variation in SEC due to the change in MTA was approximately 0.2~0.4%, and the variation in COP was very small at a level of approximately 0.2~0.8%. In other words, within the range of MTA variation considered in this study, the impact on the energy performance of the re-liquefaction system was judged to be limited (Figure 3).
The UA values of the heat exchangers for each model are summarized in Table 9. As a result of the UA comparison for Heat Exchanger 5, the LNG-CA Model showed a variation rate of approximately 83% and 80% at propulsion loads of 70% and 100%, respectively, compared to the LNG Model. The H2-CA Model showed a variation rate of approximately 87% and 85% at propulsion loads of 70% and 100%, respectively, compared to the H2 Model.
Regarding the UA comparison for Heat Exchanger 6, the LNG-CA Model showed a variation rate of approximately 39% and 52% at propulsion loads of 70% and 100%, respectively, compared to the LNG Model. Compared to the H2 Model, the H2-CA Model showed a variation rate of approximately 8% for both propulsion loads of 70% and 100%.
The UA of Heat Exchanger 7 was confirmed to be 2644 kJ/°C·h for the LNG-CA Model (70%) and 442 kJ/°C·h for the H2-CA Model (70%).
The significant reduction in the heat exchanger UA in the Cold Energy Utilization Model is attributed to the improvement in the heat exchange conditions of the re-liquefaction system. In the case of the Reference Model, which does not utilize cold energy, a large temperature difference was established between the CO2 and the cooling water or refrigerant upstream of the condenser. This resulted in a substantial temperature difference between the inlet and outlet of the heat exchanger, thereby necessitating high heat transfer performance.
Conversely, in the Cold Energy Utilization Model, the temperature upstream of the condenser was pre-cooled via the cryogenic cold energy of the alternative fuel, thereby relaxing the temperature conditions required for the heat exchanger. Consequently, identical re-liquefaction performance could be achieved with lower heat transfer requirements, resulting in a significant reduction in the total UA value for the heat exchangers.
This reduction in the UA value signifies a design advantage that extends beyond mere improvements in heat transfer characteristics, potentially leading to a reduction in heat exchanger size and the simplification of the overall system structure. While a reduction in the UA value inherently involves variations in both the overall heat transfer coefficient ( U ) and the heat transfer area ( A ), the decrease in A is significantly more dominant. Although U fluctuates depending on fluid types and phase-change conditions, adequate heat transfer performance can be effectively secured through specific heat exchanger design optimizations. Consequently, the significant reduction of up to 87% in the UA value predominantly translates to a substantial decrease in the required heat transfer area ( A ) and the physical volume of the equipment. In spatially constrained shipboard environments, this yields critical space-saving benefits. Furthermore, the minimized physical footprint and reduced weight of the heat exchangers facilitate skid-mounting and modularization within a compact space, ultimately contributing to enhanced spatial efficiency and lower CAPEX.

3.2. Economic Evaluation

The results of the CAPEX comparison are summarized in Table 10. Compared to the LNG Model, the CAPEX of the LNG-CA Model decreased by 13.8% and 10.8% at 100% and 70% loads, respectively. Similarly, under identical conditions, the H2-CA Model showed a decrease of 18.2% and 15.2% compared to the H2 Model.
The results of the OPEX comparison are presented in Table 11. Compared to the LNG Model, the OPEX of the LNG-CA Model decreased by 14.9% and 13.9% at 100% and 70% loads, respectively. Similarly, under identical conditions, the H2-CA Model showed a decrease of 15.5% and 14.7% compared to the H2 Model.
This reduction in OPEX is interpreted as a result of the reduced energy consumption required for system operation, driven by the simplification of the re-liquefaction system configuration and the decrease in compressor power consumption resulting from the utilization of cold energy.
The economic advantages of the cold energy-integrated models are primarily driven by the simplification of the compression process. The utilization of cryogenic cold energy decreases the required re-liquefaction duty, enabling a reduction in the total number of compressor units and thereby significantly lowering the CAPEX. Furthermore, the reduced number of compression stages results in lower utility requirements and diminished manpower for system operation and maintenance, collectively contributing to a reduction in the OPEX.
The SLCC results, calculated by summing the CAPEX and OPEX, are summarized in Table 12. Based on the SLCC, utilizing LNG cold energy resulted in a decrease of 14.8% and 13.6% at 100% and 70% loads, respectively. The hydrogen Cold Energy Utilization Model showed a decrease of 15.9% and 14.8%, respectively.

4. Conclusions

This study proposed a CO2 re-liquefaction system utilizing the cryogenic cold energy of alternative fuels, specifically LNG and LH2, for the efficient treatment of BOG generated in CO2 carriers, and quantitatively evaluated the thermodynamic performance and economic feasibility of the system. The Reference Model and the Cold Energy Utilization Model were simulated using Aspen HYSYS V11, and a comparative analysis was performed considering propulsion load conditions of 100% and 70%.
As a result of thermodynamic analysis, the Cold Energy Utilization Model was able to alleviate the compression conditions required for re-liquefaction by lowering the temperature upstream of the condenser. Consequently, the number of refrigerant compressor stages decreased from 3 to 2 compared to the Reference Model. This led to a decrease in compressor power consumption, resulting in a reduction in SEC by approximately 24.5% and an increase in COP by approximately 34% compared to the Reference Model. This indicates that utilizing the cold energy of alternative fuels could effectively reduce the energy consumption of the CO2 re-liquefaction process.
The analysis of SEC and COP with respect to MTA values of the condenser (5, 7, and 9 °C) showed only marginal variations in both the Reference Model and the Cold Energy Utilization Model. Consequently, within the analyzed range, the impact of MTA on the overall thermodynamic performance of the re-liquefaction system was found to be negligible. This suggests that the utilization of cold energy from alternative fuels is a significantly dominant factor in determining system efficiency than the design variations of the condenser’s MTA.
Based on the analysis of the UA values, the Cold Energy Utilization Model demonstrated a significant decrease in total UA compared to the Reference Model. Specifically, a maximum reduction of 83% was observed in the LNG-CA Model, and 87% in the H2-CA Model. This implies that the target re-liquefaction performance could be achieved with a smaller heat transfer area, offering design advantages such as reduced equipment size and a simplified system configuration.
The effect of utilizing cold energy was also clearly confirmed in the economic evaluation results. In the Cold Energy Utilization Model, CAPEX decreased due to the reduction in the number of compressors and heat exchangers, and OPEX also decreased as energy consumption during the operation phase was reduced due to lower compressor power consumption. Consequently, the SLCC was reduced by up to 14.8% for the LNG-based case and 15.9% for the hydrogen-based case compared to their respective reference models.

Author Contributions

Conceptualization, J.P. and W.J.; methodology, J.P. and Y.J.; software, J.P. and Y.J.; validation, J.P., Y.J. and J.C.; formal analysis, J.P.; investigation, J.P. and Y.J.; resources, W.J.; data curation, J.P. and Y.J.; writing—original draft preparation, J.P.; writing—review and editing, J.C. and W.J.; visualization, J.P. and Y.J.; supervision, W.J.; project administration, W.J.; funding acquisition, W.J. All authors have read and agreed to the published version of the manuscript.

Funding

This work was supported by the Technology Innovation Program (No. 20022461: Development of compact heat exchanger design technology for liquefied hydrogen under −200℃ at 100 MPa) funded by the Ministry of Trade, Industry & Energy (MOTIE, Korea).

Data Availability Statement

Data are contained within the article.

Conflicts of Interest

The authors declare no conflicts of interest.

Abbreviations

The following abbreviations are used in this manuscript:
BOGBoil-Off Gas
BORBoil-Off Rate
CAPEXCapital Expenditure
CCUSCarbon Capture, Utilization, and Storage
CACold-Assisted
CO2Carbon Dioxide
COPCoefficient of Performance
FGSSFuel Gas Supply System
FLFilling Limit
H&MBHeat & Material Balance
IMOInternational Maritime Organization
LCCLife Cycle Cost
LH2Liquefied Hydrogen
LHVLower Heating Value
LNGLiquefied Natural Gas
MTAMinimum Temperature Approach
NH3Ammonia
OPEXOperating Expenditure
SECSpecific Energy Consumption
SFCSpecific Fuel Consumption
SLCCSpecific Life Cycle Cost
UAOverall Heat-transfer Coefficient × Area
A Heat Transfer Area
C D E Direct Cost
C E Contractor Engineering Expense
C F I T Freight, Insurance, and Taxes
C I D E Indirect Cost
C L Labor Cost
C M Material Cost
C O Construction Overhead Cost
C O L Operating Labor Cost
C P Purchased Equipment Cost
C S Salary Cost
C U T Utility Cost
C O M Cost of Manufacturing
D H Heat Exchanger Duty
F I C Fixed Capital Investment
h Specific Enthalpy
m ˙ B O G Mass Flow Rate of Boil-Off-Gas
m ˙ H 2 Mass Flow Rate of Hydrogen
m ˙ L C O 2 Mass Flow Rate of Liquid CO2
m ˙ L N G Mass Flow Rate of Liquefied Natural Gas
N n p Number of Nonparticulate Processing Steps
N O L Number of Operators per Shift
N S Number of Shifts
P Number of Processing Steps Involving the Handling of Particulate Solids
P C Compressor Power
P C W Cooling Water Price
P E Electricity Price
P p r o p Propulsion Power
Q ˙ r e l Re-Liquefaction Heat Duty
r Discount Rate
T System Lifetime
T e q Effective Temperature Difference Between Fluids in the Heat Exchanger
t O P Annual Operating Hours
U Overall Heat Transfer Coefficient
V Total Tank Volume
W ˙ c o m p Compressor Power Consumption
ρ Density
η F C Fuel Cell Efficiency

Appendix A. Heat and Mass Balance (HMB) Data

This appendix provides detailed heat and mass balance (HMB) data for the proposed CO2 re-liquefaction systems utilizing the cold energy of alternative fuels. The thermodynamic properties at each key state point including temperature, pressure, vapor fraction, mass flow rate, and mass enthalpy are summarized to ensure the transparency and reproducibility of the simulation results. The node numbers presented in the tables correspond directly to the state points depicted in the system flow diagrams (Figure 1 and Figure 2).
Table A1. Heat and mass balance of the LNG Model.
LNG Model
Stream
Number
1234567
Vapor
Fraction
1111110
Temperature
[°C]
−76.99−13.1060.0140.00128.5240.00−9.57
Pressure
[bar]
1.854.7211.2511.0527.4027.2027.00
Mass Flow
[kg/h]
3500350035003500350035003500
Mass Enthalpy
[kJ/kg]
−9036−8986−8926−8945−8870−8961−9284
Stream
Number
891011121314
Vapor
Fraction
1111111
Temperature
[°C]
35.00141.2640.0036.52138.5240.0039.81
Pressure
[bar]
1.504.193.993.9910.6410.4410.44
Mass Flow
[kg/h]
826826826915915915930
Mass Enthalpy
[kJ/kg]
−2668−2439−2665−2673−2458−2687−2687
Stream
Number
15161718192021
Vapor
Fraction
100.0165100.09671
Temperature
[°C]
141.3635.0031.2631.2631.266.336.33
Pressure
[bar]
27.2027.0012.0212.0212.025.355.35
Mass Flow
[kg/h]
9309309301591591588
Mass Enthalpy
[kJ/kg]
−2488−3876−3876−2713−3895−3895−2743
Stream
Number
222324252627
Vapor
Fraction
00.08570011
Temperature
[°C]
6.33−18.53−161.76−161.3745.0044.78
Pressure
[bar]
5.352.001.008.007.507.00
Mass Flow
[kg/h]
8268262500250025002500
Mass Enthalpy
[kJ/kg]
−4019−4019−5580−5577−4631−4631
Table A2. Heat and mass balance of the H2 Model.
H2 Model
Stream
Number
1234567
Vapor
Fraction
1111110
Temperature
[°C]
−76.99−13.1060.0140.00128.5240.00−9.57
Pressure
[bar]
1.854.7211.2511.0527.4027.2027.00
Mass Flow
[kg/h]
3500350035003500350035003500
Mass Enthalpy
[kJ/kg]
−9036−8986−8926−8945−8870−8961−9284
Stream
Number
891011121314
Vapor
Fraction
1111111
Temperature
[°C]
35.00141.2640.0036.52138.5240.0039.81
Pressure
[bar]
1.504.193.993.9910.6410.4410.44
Mass Flow
[kg/h]
826826826915915915930
Mass Enthalpy
[kJ/kg]
−2668−2439−2665−2673−2458−2687−2687
Stream
Number
15161718192021
Vapor
Fraction
100.0165100.09671
Temperature
[°C]
141.3635.0031.2631.2631.266.336.33
Pressure
[bar]
27.2027.0012.0212.0212.025.355.35
Mass Flow
[kg/h]
9309309301591591588
Mass Enthalpy
[kJ/kg]
−2488−3876−3876−2713−3895−3895−2743
Stream
Number
222324252627
Vapor
Fraction
00.08570011
Temperature
[°C]
6.33−18.53−248.58−248.1245.0045.03
Pressure
[bar]
5.352.003.007.006.806.00
Mass Flow
[kg/h]
826826840840840840
Mass Enthalpy
[kJ/kg]
−4019−4019314.832344844484
Table A3. Heat and mass balance of the LNG-CA (100%) Model.
LNG-CA Model (100%)
Stream
Number
1234567
Vapor
Fraction
1111110
Temperature
[°C]
−76.99−13.1060.0140.00128.5240.00−11.15
Pressure
[bar]
1.854.7211.2511.0527.4027.2027.00
Mass Flow
[kg/h]
3500350035003500350035003500
Mass Enthalpy
[kJ/kg]
−9036−8986−8926−8945−8870−8961−9284
Stream
Number
891011121314
Vapor
Fraction
1111110
Temperature
[°C]
35.00129.0140.0038.2299.4540.0010.00
Pressure
[bar]
1.503.753.553.556.506.306.10
Mass Flow
[kg/h]
814814814850850850850
Mass Enthalpy
[kJ/kg]
−2668−2466−2664−2668−2540−2673−4001
Stream
Number.
15161718192021
Vapor
Fraction
0.0423100.05800-
Temperature
[°C]
−1.57−1.57−1.57−18.53−161.76−161.35-
Pressure
[bar]
4.004.004.002.001.008.20-
Mass Flow
[kg/h]
8503681481425002500-
Mass Enthalpy
[kJ/kg]
−4001−2755−4056−4056−5580−5577-
Stream
Number
222324252627
Vapor
Fraction
01-0.764411
Temperature
[°C]
−161.35−128.95-−128.9545.0044.78
Pressure
[bar]
8.208.00-8.007.507.00
Mass Flow
[kg/h]
25002500-250025002500
Mass Enthalpy
[kJ/kg]
−5577−5162-−5162−4631−4631
Table A4. Heat and mass balance of the LNG-CA (70%) Model.
LNG-CA Model (70%)
Stream
Number
1234567
Vapor
Fraction
1111110
Temperature
[°C]
−76.99−13.1060.0140.00128.5240.00−11.15
Pressure
[bar]
1.854.7211.2511.0527.4027.2027.00
Mass Flow
[kg/h]
3500350035003500350035003500
Mass Enthalpy
[kJ/kg]
−9036−8986−8926−8945−8870−8961−9284
Stream
Number
891011121314
Vapor
Fraction
1111110
Temperature
[°C]
35.00129.0140.0038.2299.4540.0010.00
Pressure
[bar]
1.503.753.553.556.506.36.10
Mass Flow
[kg/h]
814814814850850850850
Mass Enthalpy
[kJ/kg]
−2668−2466−2664−2668−2540−2673−4001
Stream
Number
15161718192021
Vapor
Fraction
0.0423100.058000
Temperature
[°C]
−1.57−1.57−1.57−18.53−161.76−161.35−161.35
Pressure
[bar]
4.004.004.002.001.008.208.20
Mass Flow
[kg/h]
8503681481425002500750
Mass Enthalpy
[kJ/kg]
−4001−2755−4056−4056−5580−5577−5577
Stream
Number
222324252627
Vapor
Fraction
011111
Temperature
[°C]
−161.35−89.23−123.95−99.8545.0044.78
Pressure
[bar]
8.208.008.008.007.507.00
Mass Flow
[kg/h]
17501750750250025002500
Mass Enthalpy
[kJ/kg]
−5577−4932−5011−4956−4631−4631
Table A5. Heat and mass balance of the H2-CA (100%) Model.
H2-CA Model (100%)
Stream
Number
1234567
Vapor
Fraction
1111110
Temperature
[°C]
−76.99−13.1060.0140.00128.5240.00−11.14
Pressure
[bar]
1.854.7211.2511.0527.4027.2027.00
Mass Flow
[kg/h]
3500350035003500350035003500
Mass Enthalpy
[kJ/kg]
−9036−8986−8926−8945−8870−8961−9284
Stream
Number
891011121314
Vapor
Fraction
1111110
Temperature
[°C]
35.00129.0140.0038.2299.4540.0010.00
Pressure
[bar]
1.503.753.553.556.506.306.10
Mass Flow
[kg/h]
814814814850850850850
Mass Enthalpy
[kJ/kg]
−2688−2466−2664−2688−2540−2673−4001
Stream
Number
15161718192021
Vapor
Fraction
0.0423100.05800-
Temperature
[°C]
−1.57−1.57−1.57−18.53−248.58−248.12-
Pressure
[bar]
4.004.004.002.003.007.00-
Mass Flow
[kg/h]
85036814814840840-
Mass Enthalpy
[kJ/kg]
−4056−2755−4056−4056314.8323-
Stream
Number
222324252627
Vapor
Fraction
01-111
Temperature
[°C]
−248.12−163.75-−163.7545.0045.01
Pressure
[bar]
7.006.50-6.506.306.00
Mass Flow
[kg/h]
840840-840840840
Mass Enthalpy
[kJ/kg]
3231667-166744844484
Table A6. Heat and mass balance of the H2-CA (70%) Model.
H2-CA Model (70%)
Stream
Number
1234567
Vapor
Fraction
1111110
Temperature
[°C]
−76.99−13.1060.0140.00128.5240.00−11.14
Pressure
[bar]
1.854.7211.2511.0527.4027.2027.00
Mass Flow
[kg/h]
3500350035003500350035003500
Mass Enthalpy
[kJ/kg]
−9036−8986−8926−8945−8870−8961−9284
Stream
Number
891011121314
Vapor
Fraction
1111110
Temperature
[°C]
35.00129.0140.0038.2299.4540.0010.00
Pressure
[bar]
1.503.753.553.556.506.306.10
Mass Flow
[kg/h]
814814814850850850850
Mass Enthalpy
[kJ/kg]
−2668−2466−2664−2688−2540−2673−4001
Stream
Number
15161718192021
Vapor
Fraction
0.0423100.058000
Temperature
[°C]
−1.57−1.57−1.57−18.53−248.58−248.12−248.12
Pressure
[bar]
4.004.004.002.003.007.007.00
Mass Flow
[kg/h]
85036814814840840252
Mass Enthalpy
[kJ/kg]
−4001−2755−4056−4056314.8323323
Stream
Number
222324252627
Vapor
Fraction
011111
Temperature
[°C]
−248.12−116.75−239.29−151.5945.0045.01
Pressure
[bar]
7.006.506.806.506.306.00
Mass Flow
[kg/h]
588588252840840840
Mass Enthalpy
[kJ/kg]
3232243801.6181144844484

References

  1. Nguyen-Trinh, H.A.; Ha-Duong, M. Perspective of CO2 Capture & Storage (CCS) Development in Vietnam: Results from Expert Interviews. Int. J. Greenh. Gas Control 2015, 37, 220–227. [Google Scholar] [CrossRef] [Scilit]
  2. Pérez-Bódalo, E.; d’Amore-Domenech, R.; Leo, T.J. CO2 Marine Transportation from a Techno-Energetic Perspective. J. Mar. Sci. Eng. 2024, 12, 12. [Google Scholar] [CrossRef] [Scilit]
  3. Tocock, M.; Ross, A.; Rogers, J. Northern Territory Low Emissions Carbon Capture Storage and Utilisation Hub Transnational CO2 Shipping Logistics and Technoeconomic Model-Task 8 Report. 2024. Available online: https://www.csiro.au/en/research/technology-space/energy/Carbon-management/NT-low-emissions-hub/LEH (accessed on 27 March 2026).
  4. Ryu, J.; Lee, C.; Seo, Y.; Kim, J.; Seo, S.; Chang, D. A Novel Boil-off Gas Re-Liquefaction Using a Spray Recondenser for Liquefied Natural-Gas Bunkering Operations. Energies 2016, 9, 1004. [Google Scholar] [CrossRef] [Scilit]
  5. Shu, G.; Liu, B.; Tian, H.; Li, L.; Sun, R.; Wang, X. A Cryogenic CO2 Capture System Coupled with Boil-off Gas Re-Liquefaction for LNG Carriers. Sep. Purif. Technol. 2025, 362, 131783. [Google Scholar] [CrossRef] [Scilit]
  6. Lu, J.; Li, Y.; Li, B.; Yang, Q.; Deng, F. Research on Re-Liquefaction of Cargo BOG Using Liquid Ammonia Cold Energy on CO2 Transport Ship. Int. J. Greenh. Gas Control 2023, 129, 103994. [Google Scholar] [CrossRef] [Scilit]
  7. Lee, U.; Yang, S.; Jeong, Y.S.; Lim, Y.; Lee, C.S.; Han, C. Carbon Dioxide Liquefaction Process for Ship Transportation. Ind. Eng. Chem. Res. 2012, 51, 15122–15131. [Google Scholar] [CrossRef] [Scilit]
  8. Aghabalazadeh, M.; Farshi, L.G.; Mosaffa, A.H. Proposal and 3E Analysis of Two Novel Claude Liquefaction Systems. Results Eng. 2025, 27, 106426. [Google Scholar] [CrossRef] [Scilit]
  9. Seo, Y.; You, H.; Lee, S.; Huh, C.; Chang, D. Evaluation of CO2 Liquefaction Processes for Ship-Based Carbon Capture and Storage (CCS) in Terms of Life Cycle Cost (LCC) Considering Availability. Int. J. Greenh. Gas Control 2015, 35, 1–12. [Google Scholar] [CrossRef] [Scilit]
  10. Wang, L.; He, L.; He, Y. Review on Absorption Refrigeration Technology and Its Potential in Energy-Saving and Carbon Emission Reduction in Natural Gas and Hydrogen Liquefaction. Energies 2024, 17, 3427. [Google Scholar] [CrossRef] [Scilit]
  11. Chen, F.; Morosuk, T. Exergetic and Economic Evaluation of Co2 Liquefaction Processes. Energies 2021, 14, 7174. [Google Scholar] [CrossRef] [Scilit]
  12. Lebedevas, S.; Malūkas, A. The Application of Cryogenic Carbon Capture Technology on the Dual-Fuel Ship through the Utilisation of LNG Cold Potential. J. Mar. Sci. Eng. 2024, 12, 217. [Google Scholar] [CrossRef] [Scilit]
  13. Yoo, B.Y. The Development and Comparison of CO2 BOG Re-Liquefaction Processes for LNG Fueled CO2 Carriers. Energy 2017, 127, 186–197. [Google Scholar] [CrossRef] [Scilit]
  14. Lin, Y.; Lu, J.; Li, B.; Li, Y.; Yang, Q. Application of Fuel Cold Energy in CO2 Bog Reliquefaction System on Ammonia-Powered CO2 Carrier. Pol. Marit. Res. 2023, 30, 22–34. [Google Scholar] [CrossRef] [Scilit]
  15. Seo, Y.; Huh, C.; Lee, S.; Chang, D. Comparison of CO2 Liquefaction Pressures for Ship-Based Carbon Capture and Storage (CCS) Chain. Int. J. Greenh. Gas Control 2016, 52, 1–12. [Google Scholar] [CrossRef] [Scilit]
  16. IEAGHG. IEAGHG Technical Report 2023-04 Components of CCS Infrastructure-Interim CO2 Holding Options November 2023; IEA Greenhouse Gas R&D Programme: Cheltenham, UK, 2023. Available online: https://ieaghg.org (accessed on 19 March 2026).
  17. Ballard Power Systems. FCwave™ Fuel Cell Power Module for Marine Applications; Document SPC5115469-DA; Ballard Power Systems Inc.: Burnaby, BC, Canada, 2024; Available online: https://www.ballard.com (accessed on 19 March 2026).
  18. MAN Energy Solutions. 7C35ME-GI Engine Specifications (Technical Documentation); MAN Energy Solutions: Copenhagen, Denmark, 2024; Available online: https://www.man-es.com/en (accessed on 19 March 2026).
  19. Choi, M.; Jung, W.; Lee, S.; Joung, T.; Chang, D. Thermal Efficiency and Economics of a Boil-off Hydrogen Re-Liquefaction System Considering the Energy Efficiency Design Index for Liquid Hydrogen Carriers. Energies 2021, 14, 4566. [Google Scholar] [CrossRef] [Scilit]
  20. Yu, C.; Choi, M.; Chang, D. Economic Analysis of Cargo Containment Systems and Boil-off Hydrogen Handling Options for Large-Scale Liquid Hydrogen Carriers Considering Insulation-Layer Thickness of Liquid-Hydrogen Storage Tank. Int. J. Hydrogen Energy 2025, 97, 1055–1067. [Google Scholar] [CrossRef] [Scilit]
  21. Kwak, D.H.; Heo, J.H.; Park, S.H.; Seo, S.J.; Kim, J.K. Energy-Efficient Design and Optimization of Boil-off Gas (BOG) Re-Liquefaction Process for Liquefied Natural Gas (LNG)-Fuelled Ship. Energy 2018, 148, 915–929. [Google Scholar] [CrossRef] [Scilit]
  22. Tan, H.; Shan, S.; Nie, Y.; Zhao, Q. A New Boil-off Gas Re-Liquefaction System for LNG Carriers Based on Dual Mixed Refrigerant Cycle. Cryogenics 2018, 92, 84–92. [Google Scholar] [CrossRef] [Scilit]
  23. Jackson, S.; Brodal, E. Optimization of the CO2 Liquefaction Process-Performance Study with Varying Ambient Temperature. Appl. Sci. 2019, 9, 4467. [Google Scholar] [CrossRef] [Scilit]
  24. Khalili-Garakani, A.; Davoudi, S.; Nejad, M.G. Techno-Economic Evaluation of Polygeneration System for Power and DME Production from Power Plant Flue Gas Using Direct and Indirect Synthesis MethodsEconomic Evaluation of Polygeneration System for Power and DME Production from Power Plant Flue Gas Using Direct and Indirect. Oil Gas Sci. Technol 2023, 12, 114–135. [Google Scholar] [CrossRef]
  25. Peters, M.S.; Timmerhaus, K.D.; West, R.E. Plant Design and Economics for Chemical Engineers, 5th ed.; McGraw-Hill Education: New York, NY, USA, 2003. [Google Scholar]
  26. Turton, R.; Bailie, R.C.; Whiting, W.B.; Shaeiwitz, J.A.; Bhattacharyya, D. Analysis, Synthesis, and Design of Chemical Processes Fifth Edition; Pearson Education: Boston, MA, USA, 2018. [Google Scholar]
  27. Fiorenza, G.; Sharma, V.K.; Braccio, G. Techno-Economic Evaluation of a Solar Powered Water Desalination Plant. Energy Convers. Manag. 2003, 44, 2217–2240. [Google Scholar] [CrossRef] [Scilit]
  28. Ćetković, J.; Knežević, M.; Lakić, S.; Žarković, M.; Vujadinović, R.; Živković, A.; Cvijović, J. Financial and Economic Investment Evaluation of Wastewater Treatment Plant. Water 2022, 14, 122. [Google Scholar] [CrossRef] [Scilit]
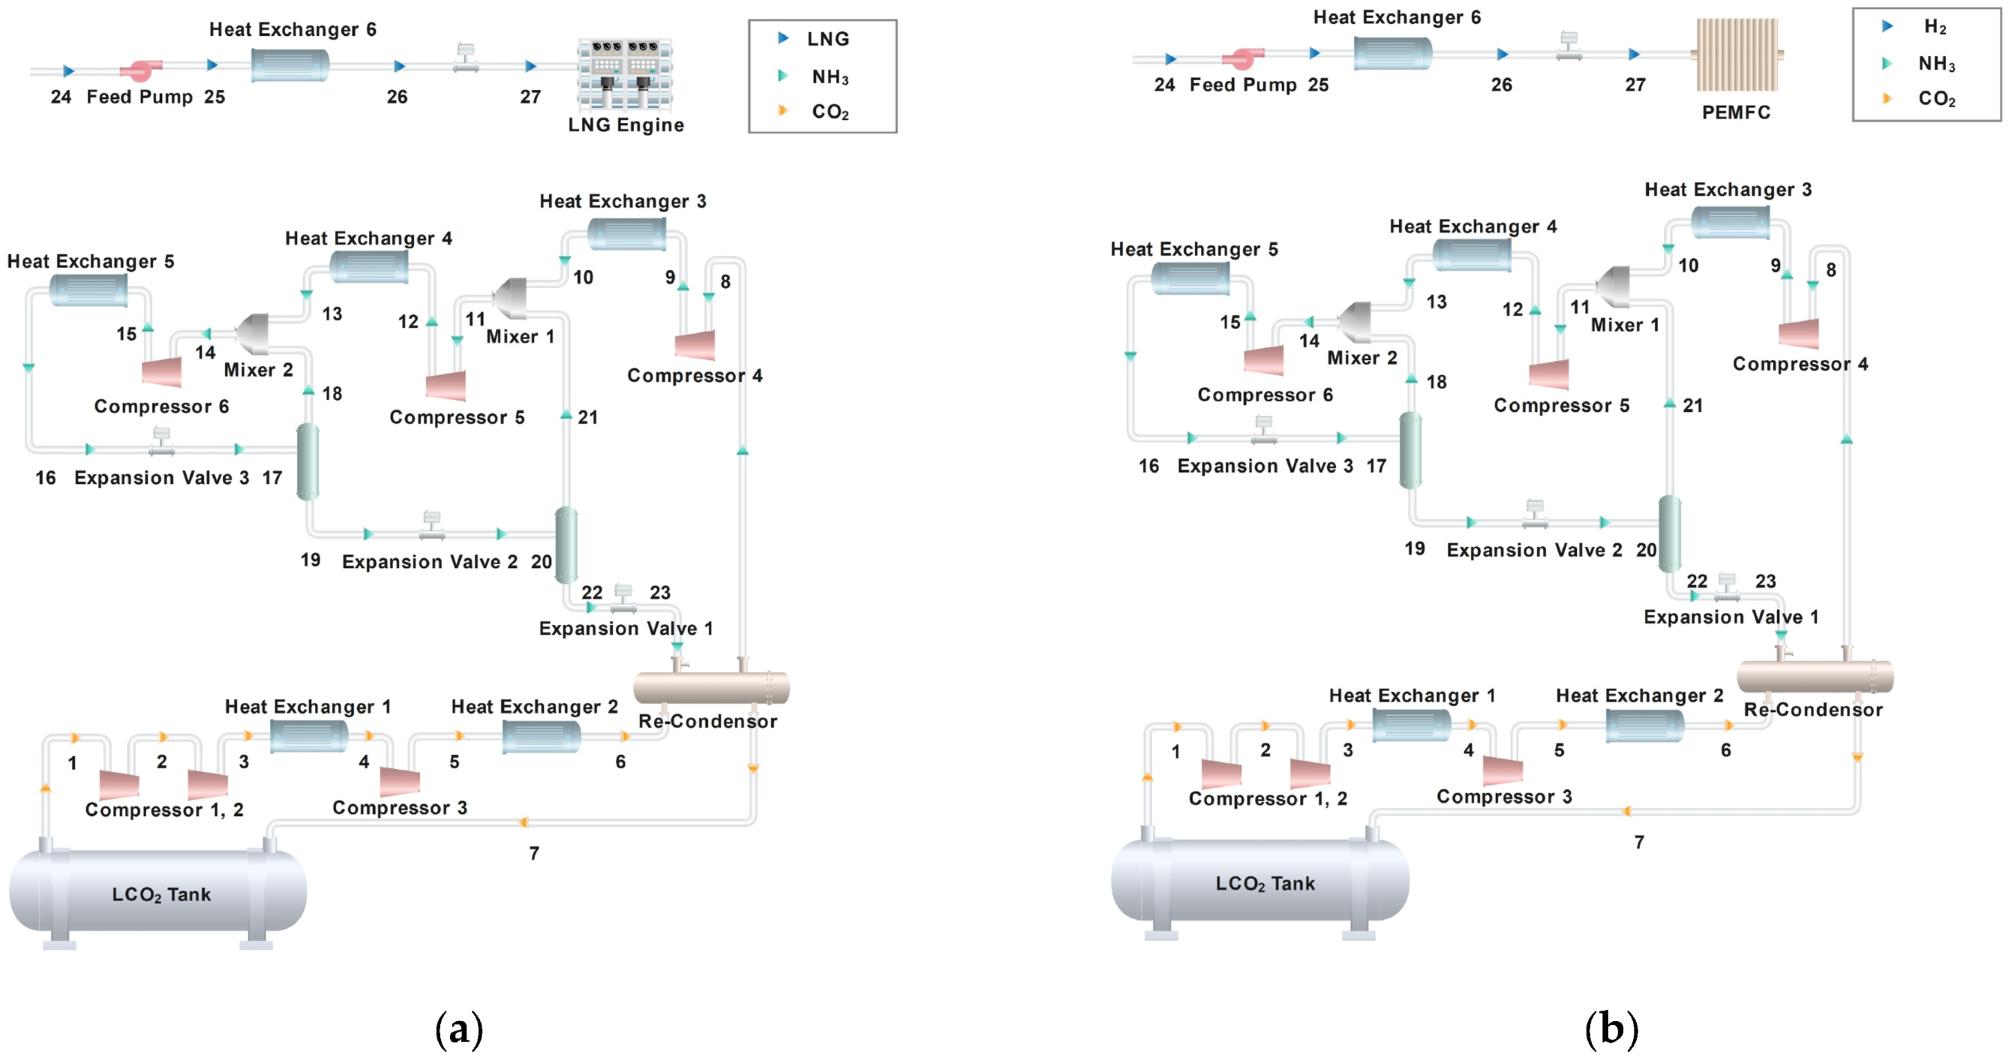
Figure 1. Schematic diagram of the CO2 re-liquefaction system without cold energy utilization. (a) LNG Model; (b) H2 Model.
Jmse 14 00636 g001
Figure 2. Schematic diagram of the CO2 re-liquefaction system with cold energy utilization. (a) LNG-CA Model; (b) H2-CA Model.
Jmse 14 00636 g002
Figure 3. Effect of MTA on SEC and COP: (a) H2 and LNG Model; (b) H2-CA and LNG-CA Model.
Jmse 14 00636 g003
Table 1. Main design parameters of the target CO2 carrier.
ParameterUnitValue
Tank volumem350,000
Tank filling limit%90
CO2 densitykg/m31244
Propulsion powerkW15,000
Boil-off rate%/day0.15
Table 2. Parameters for estimating fuel consumption of propulsion power source.
ParameterUnitValue
Fuel cell efficiency%53.5
Lower heating value MJ/kg120
Specific fuel consumptionkg/kWh0.169
Table 3. Design flow rates of BOG and alternative fuels.
ParameterUnitValue
Boil-off gas flow ratekg/h3500
Hydrogen flow rate840
LNG flow rate2500
Table 4. Definition of system models investigated in this study.
Model NamePropulsion FuelCold Energy Utilization
H2 ModelHydrogenNo
H2-CA ModelYes
LNG ModelLNGNo
LNG-CA ModelYes
Table 5. Factors for estimating indirect costs relative to equipment purchase cost.
ItemValue
[%]
Purchased equipment cost100
Engineering and supervision33
Construction expense41
Legal expenses4
Contractor’s fee22
Contingency44
Total indirect cost144
Table 6. Unit prices of electricity and cooling water used for economic evaluation.
ItemUnitValue
Electric PriceUSD/kWh0.04
Cooling Water Price0.0012744
Table 7. Comparison of compressor power consumption and SEC according to load conditions.
ModelCompressor Power [kW]SEC [kWh/kg-CO2]Reduction Rate [%]
LNG Model3380.0966-
LNG-CA Model (100%)2550.072924.5
LNG-CA Model (70%)2550.072924.5
H2 Model3380.0966-
H2-CA Model (100%)2550.072924.5
H2-CA Model (70%)2550.072924.5
Table 8. Comparison of re-liquefaction heat output and COP according to load conditions.
ModelHeat Output [kW]COP [-]Increase Rate [%]
LNG Model3100.9172-
LNG-CA Model (100%)3141.229634.0
LNG-CA Model (70%)3141.229634.0
H2 Model3100.9172-
H2-CA Model (100%)3141.229634.0
H2-CA Model (70%)3141.229634.0
Table 9. Comparison of UA values for heat exchangers across different models.
ModelHeat Exchanger 5
[kJ/°C-h]
Heat Exchanger 6
[kJ/°C-h]
Heat Exchanger 7
[kJ/°C-h]
LNG Model38,72849,819-
LNG-CA Model (100%)663630,477-
LNG-CA Model (70%)756323,8062644
H2-Model38,72953,759-
H2-CA Model (100%)501449,298-
H2-CA Model (70%)575449,417442
Table 10. Comparison of CAPEX by model.
ModelRe-Liquefaction CAPEX
[USD/ton-CO2]
FGSS CAPEX
[USD/ton-CO2]
Total CAPEX
[USD/ton-CO2]
LNG Model6.30.26.5
LNG-CA Model (100%)5.40.25.6
LNG-CA Model (70%)5.40.45.8
H2-Model6.40.26.6
H2-CA Model (100%)5.20.25.4
H2-CA Model (70%)5.20.45.6
Table 11. Comparison of OPEX by model.
ModelRe-Liquefaction OPEX
[USD/ton-CO2]
FGSS OPEX
[USD/ton-CO2]
Total OPEX
[USD/ton-CO2]
LNG Model42.718.561.2
LNG-CA Model (100%)33.718.452.1
LNG-CA Model (70%)33.719.052.7
H2-Model42.918.561.4
H2-CA Model (100%)33.418.551.9
H2-CA Model (70%)33.419.052.4
Table 12. Comparison of SLCC and reduction rates by model.
ModelTotal SLCC
[USD/ton-CO2]
Reduction Rate
[%]
LNG Model67.7-
LNG-CA Model (100%)57.714.8
LNG-CA Model (70%)58.513.6
H2-Model68.1-
H2-CA Model (100%)57.315.9
H2-CA Model (70%)58.014.8
Disclaimer/Publisher’s Note: The statements, opinions and data contained in all publications are solely those of the individual author(s) and contributor(s) and not of MDPI and/or the editor(s). MDPI and/or the editor(s) disclaim responsibility for any injury to people or property resulting from any ideas, methods, instructions or products referred to in the content.