Article

Spatiotemporal Response and Evaluation of Composite Marine Carrying Capacity Driven by Various Factors


1
School of Marine Science and Engineering, Nanjing Normal University, 1 Wenyuan Road, Nanjing 210023, China
2
Jiangsu Key Laboratory of Ocean-Land Environmental Change and Ecological Construction, School of Marine Science and Engineering, Nanjing Normal University, Nanjing 210023, China
*
Author to whom correspondence should be addressed.
J. Mar. Sci. Eng. 2026, 14(7), 638; https://doi.org/10.3390/jmse14070638
Submission received: 3 March 2026 / Revised: 24 March 2026 / Accepted: 27 March 2026 / Published: 30 March 2026

Abstract

This study quantifies the sustainable development thresholds of marine ecosystems under high-intensity human development by establishing a composite evaluation framework based on the Pressure–State–Response (PSR) model. Taking the Nantong sea area as a typical study region, this research indicates that prior to large-scale development (2006–2010), the comprehensive carrying capacity was higher in the northern region than in the south. The lowest capacity was observed near the Yangtze River Estuary, while the Subei Radial Sand Ridges in the north exhibited the highest capacity. Following the period of intensive coastal development (2016–2020), a significant decline in composite marine carrying capacity occurred in the northern radial sand ridge area, whereas the central waters remained stable. The nearshore areas in the south exhibited the poorest capacity. Despite a substantial increase in anthropogenic pressure, the overall decline of the sea area’s composite marine carrying capacity remains within an acceptable range, with all levels categorized as “Near Carrying Capacity” or above. Quantitative assessment of marine environmental carrying capacity and marine ecological carrying capacity provides an effective pathway for monitoring the specific status of the marine environment and determining whether critical thresholds have been reached under high-intensity human development scenarios.

1. Introduction

Coastal zones are critical interfaces for maritime development and are projected to support more than 75% of the global population by 2025 [1]. The continuous advancement of urbanization has led to a high concentration of human activities and rapid economic development, driven by the exploitation of marine resources [2]. However, following intense impacts triggered by human activities, approximately 41% of global oceans are suffering from severe ecological challenges, particularly in nearshore zones [3]. Since China’s reform and opening-up, coastal regions have developed rapidly. Diversified industries, including tidal flat agriculture, the salt industry, and marine engineering, have achieved high-quality growth. Under the support of national strategies, these regions have entered a new stage of coastal development [4]. Although the marine economy shows a growth trend, the ecological environment of these waters is facing unprecedented challenges. Therefore, it is essential not only to comprehensively understand the marine ecological environment but also to conduct in-depth research on the specific impacts of human activities on marine ecosystems in coastal regions. Understanding the marine ecological carrying capacity is vital to providing a solid scientific basis for nearshore ecological protection and resource development, thereby ensuring the sustained growth of the marine economy and the harmonious coexistence of humanity and nature.
Marine carrying capacity is a specific variant of regional carrying capacity, defined as the maximum population, environmental, and socio-economic development that a marine area can support within a certain period while maintaining resource sustainability and ecological integrity [5,6]. In the current context, coordinating development intensity with marine carrying capacity involves two aspects: on the one hand, humanity seeks to maximize the utilization of resources obtained from the ocean; on the other hand, there is a desire to improve the marine environment to enhance its productivity and meet increasing needs. These factors necessitate the application of sustainable development concepts to establish and maintain a mutually beneficial relationship between humans and the ocean [7]. The focus of marine carrying capacity research primarily lies in determining the sustainable development thresholds for fish, shellfish, and other marine resources [8]. With the continuous exploitation of marine resources and environment, research has gradually expanded from single-factor analysis to Composite Carrying Capacity [9], encompassing studies on marine ecosystem services and ecosystem health [10]. Due to the lack of explicit quantitative evaluation standards, marine carrying capacity is often regarded as a management concept. To better address various issues in marine management, precise and quantifiable methods are required to assess the carrying capacity of sea areas.
However, a consensus on the assessment methods and frameworks for marine carrying capacity has yet to be reached. Most studies remain limited to single resource or environmental elements, such as beach carrying capacity, environmental carrying capacity, or coastal tourism carrying capacity [11,12]. Regarding research methodology, many scholars lean toward in-depth analysis from a socio-economic perspective or utilize statistical tools to establish concise evaluation systems, which allow for the direct estimation of the actual carrying capacity of a region [13]. Currently, the state-space method, supply–demand analysis, and system dynamics are the primary methods for the quantitative evaluation of carrying capacity. The state-space method assesses ecosystem carrying capacity by establishing indicator systems such as the Pressure–State–Response (PSR) model [14,15]. Building upon this, the model has been extended into the Driving–Pressure–State–Impact–Response (DPSIR) model and the Driving–Pressure–State–Ecosystem Services–Response (DPSIR) model [16,17]. As the focus of carrying capacity research shifts from simple to complex, and from external phenomena to internal mechanisms, research methods have gradually transitioned from single-mode to composite modes, and from basic descriptive statistics to highly sophisticated model simulations [18].
Since the onset of coastal development, the northern part of the Nantong sea area has been characterized by the Subei Radial Sand Ridges, while the south borders the northern branch of the Yangtze River Estuary. The central waters feature important shipping channels such as Tongzhou Bay, as well as the Xiaoyangkou National Marine Park and the famous Lvsi Fishing Ground [19]. Quantitatively evaluating the development and changes in the environmental, ecological, and Composite Carrying Capacity of Nantong since the implementation of the coastal development strategy is an effective way to determine whether the carrying capacity has reached critical thresholds under high-intensity human development scenarios. This study focuses on the evaluation of the Composite Carrying Capacity since the start of large-scale offshore development. Taking the typical regional Nantong sea area as a case study, a comprehensive evaluation system—including the marine environment, ecology, and anthropogenic pressure (human activity pressure)—is developed to realize the transition from single-factor carrying capacity to Composite Carrying Capacity evaluation. This research primarily aims to dynamically evaluate the spatiotemporal variations of the composite marine carrying capacity in nearshore waters. Specifically, it assesses how marine environmental and ecological carrying capacities, alongside anthropogenic pressures, have evolved under different coastal development scenarios.

2. Materials and Methods

2.1. Overview of Data and Research Workflow

2.1.1. Study Area Description

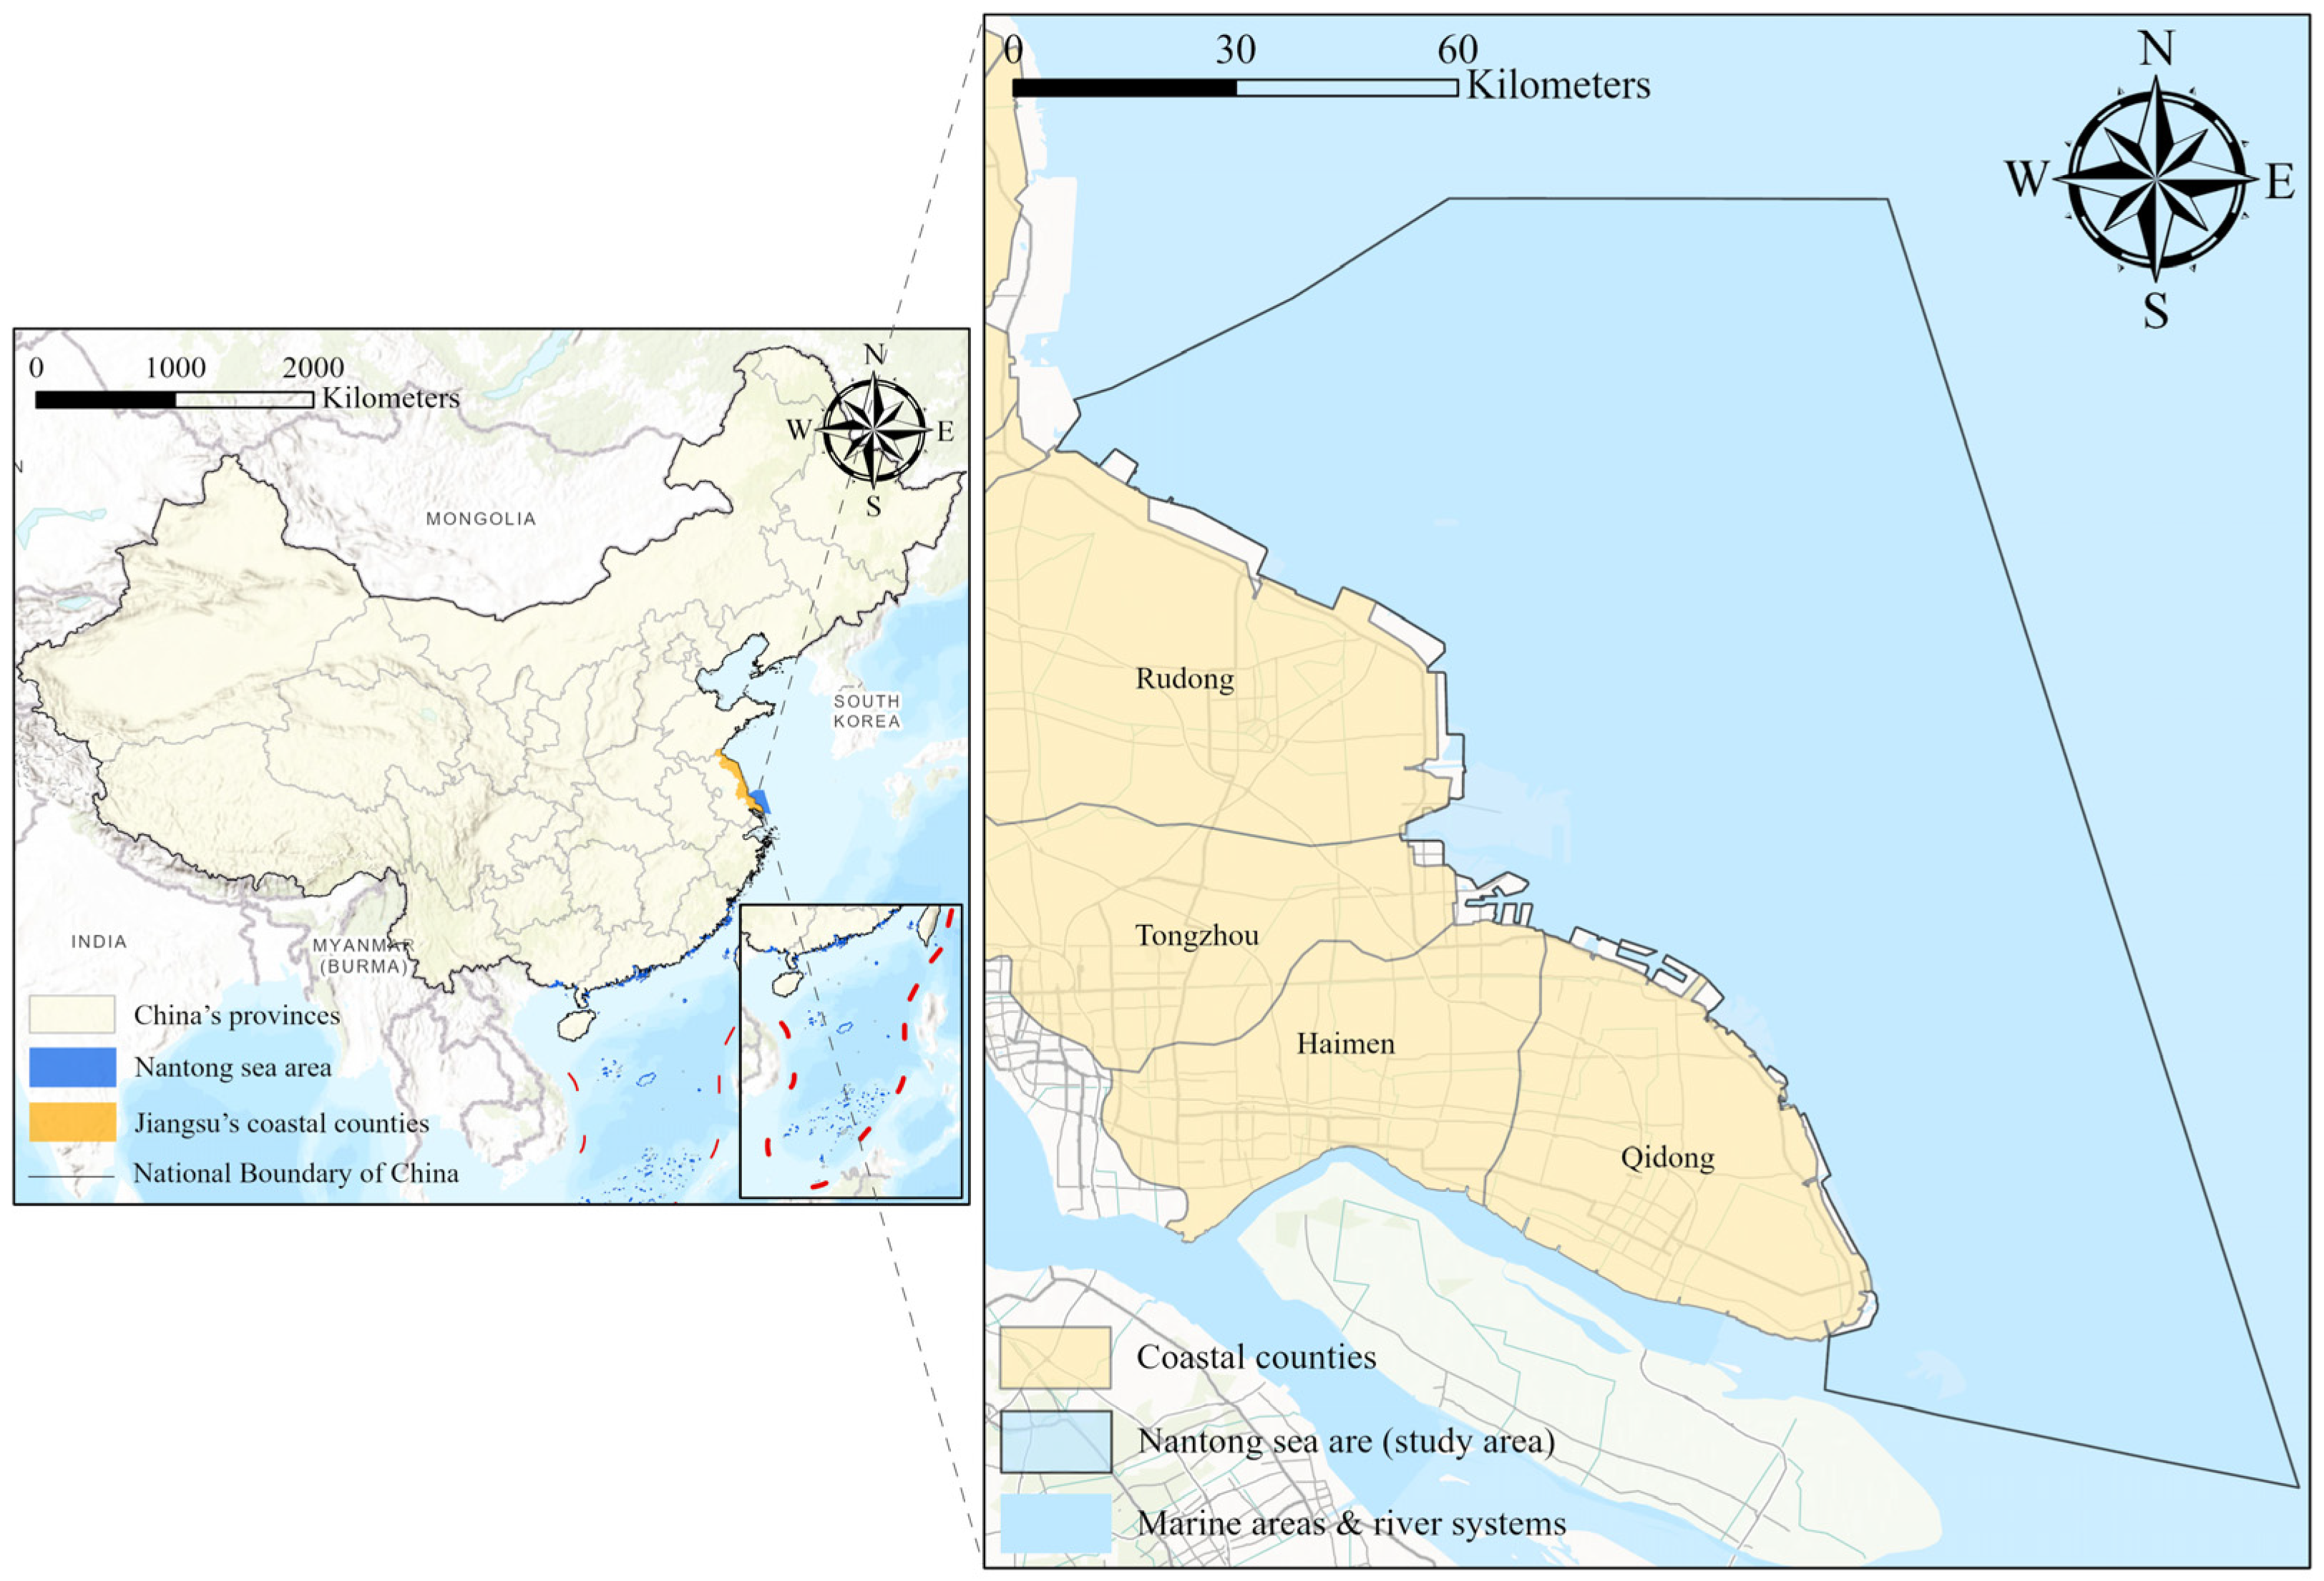
Nantong is situated on the southeastern coast of Jiangsu Province, at the northern edge of the Yangtze River Delta city cluster. It extends from Laobagang in the north to Yuantuojiao in the south (31°41′–32°43′ N, 120°12′–121°55′ E), bordered by the Yellow Sea to the east and the Yangtze River to the south. The city’s total marine area covers approximately 8837.57 km2, encompassing the coastal jurisdictions of Haian, Rudong, Tongzhou, Haimen, and Qidong. The region features a north subtropical humid monsoon climate, with an annual average temperature of approximately 16.0–16.6 °C and annual precipitation ranging between 1000 and 1100 mm. A high proportion of rainfall occurs during the Meiyu (plum rain) season in June and July. Although the area receives over 2000 h of sunshine annually, it faces high risks from natural disasters such as typhoons, rainstorms, floods, and droughts.
The Nantong sea area is characterized by an alternating landscape of tidal flats and channels with dense sand ridges as shown in Figure 1. The tidal range increases from south to north, and the tidal currents align with the axes of the waterways. In certain deep-water areas, rotational tidal current characteristics are prominent, providing favorable conditions for navigation and port construction. Furthermore, the nearshore tidal flats have undergone significant evolution, influenced by land reclamation and changes in sediment supply. Socio-economically, the marine economy plays a pivotal role in regional development. The area possesses a well-established fishing port system and abundant fishery resources. Marine space utilization is primarily dominated by fisheries while also integrating functions such as transportation, industry, and general development.

2.1.2. Data Description

This study involves multi-source data, including seawater environment, sediment environment, biological and ecological data, human activity data, and marine use type-related data (Table 1).

2.1.3. Research Workflow Framework

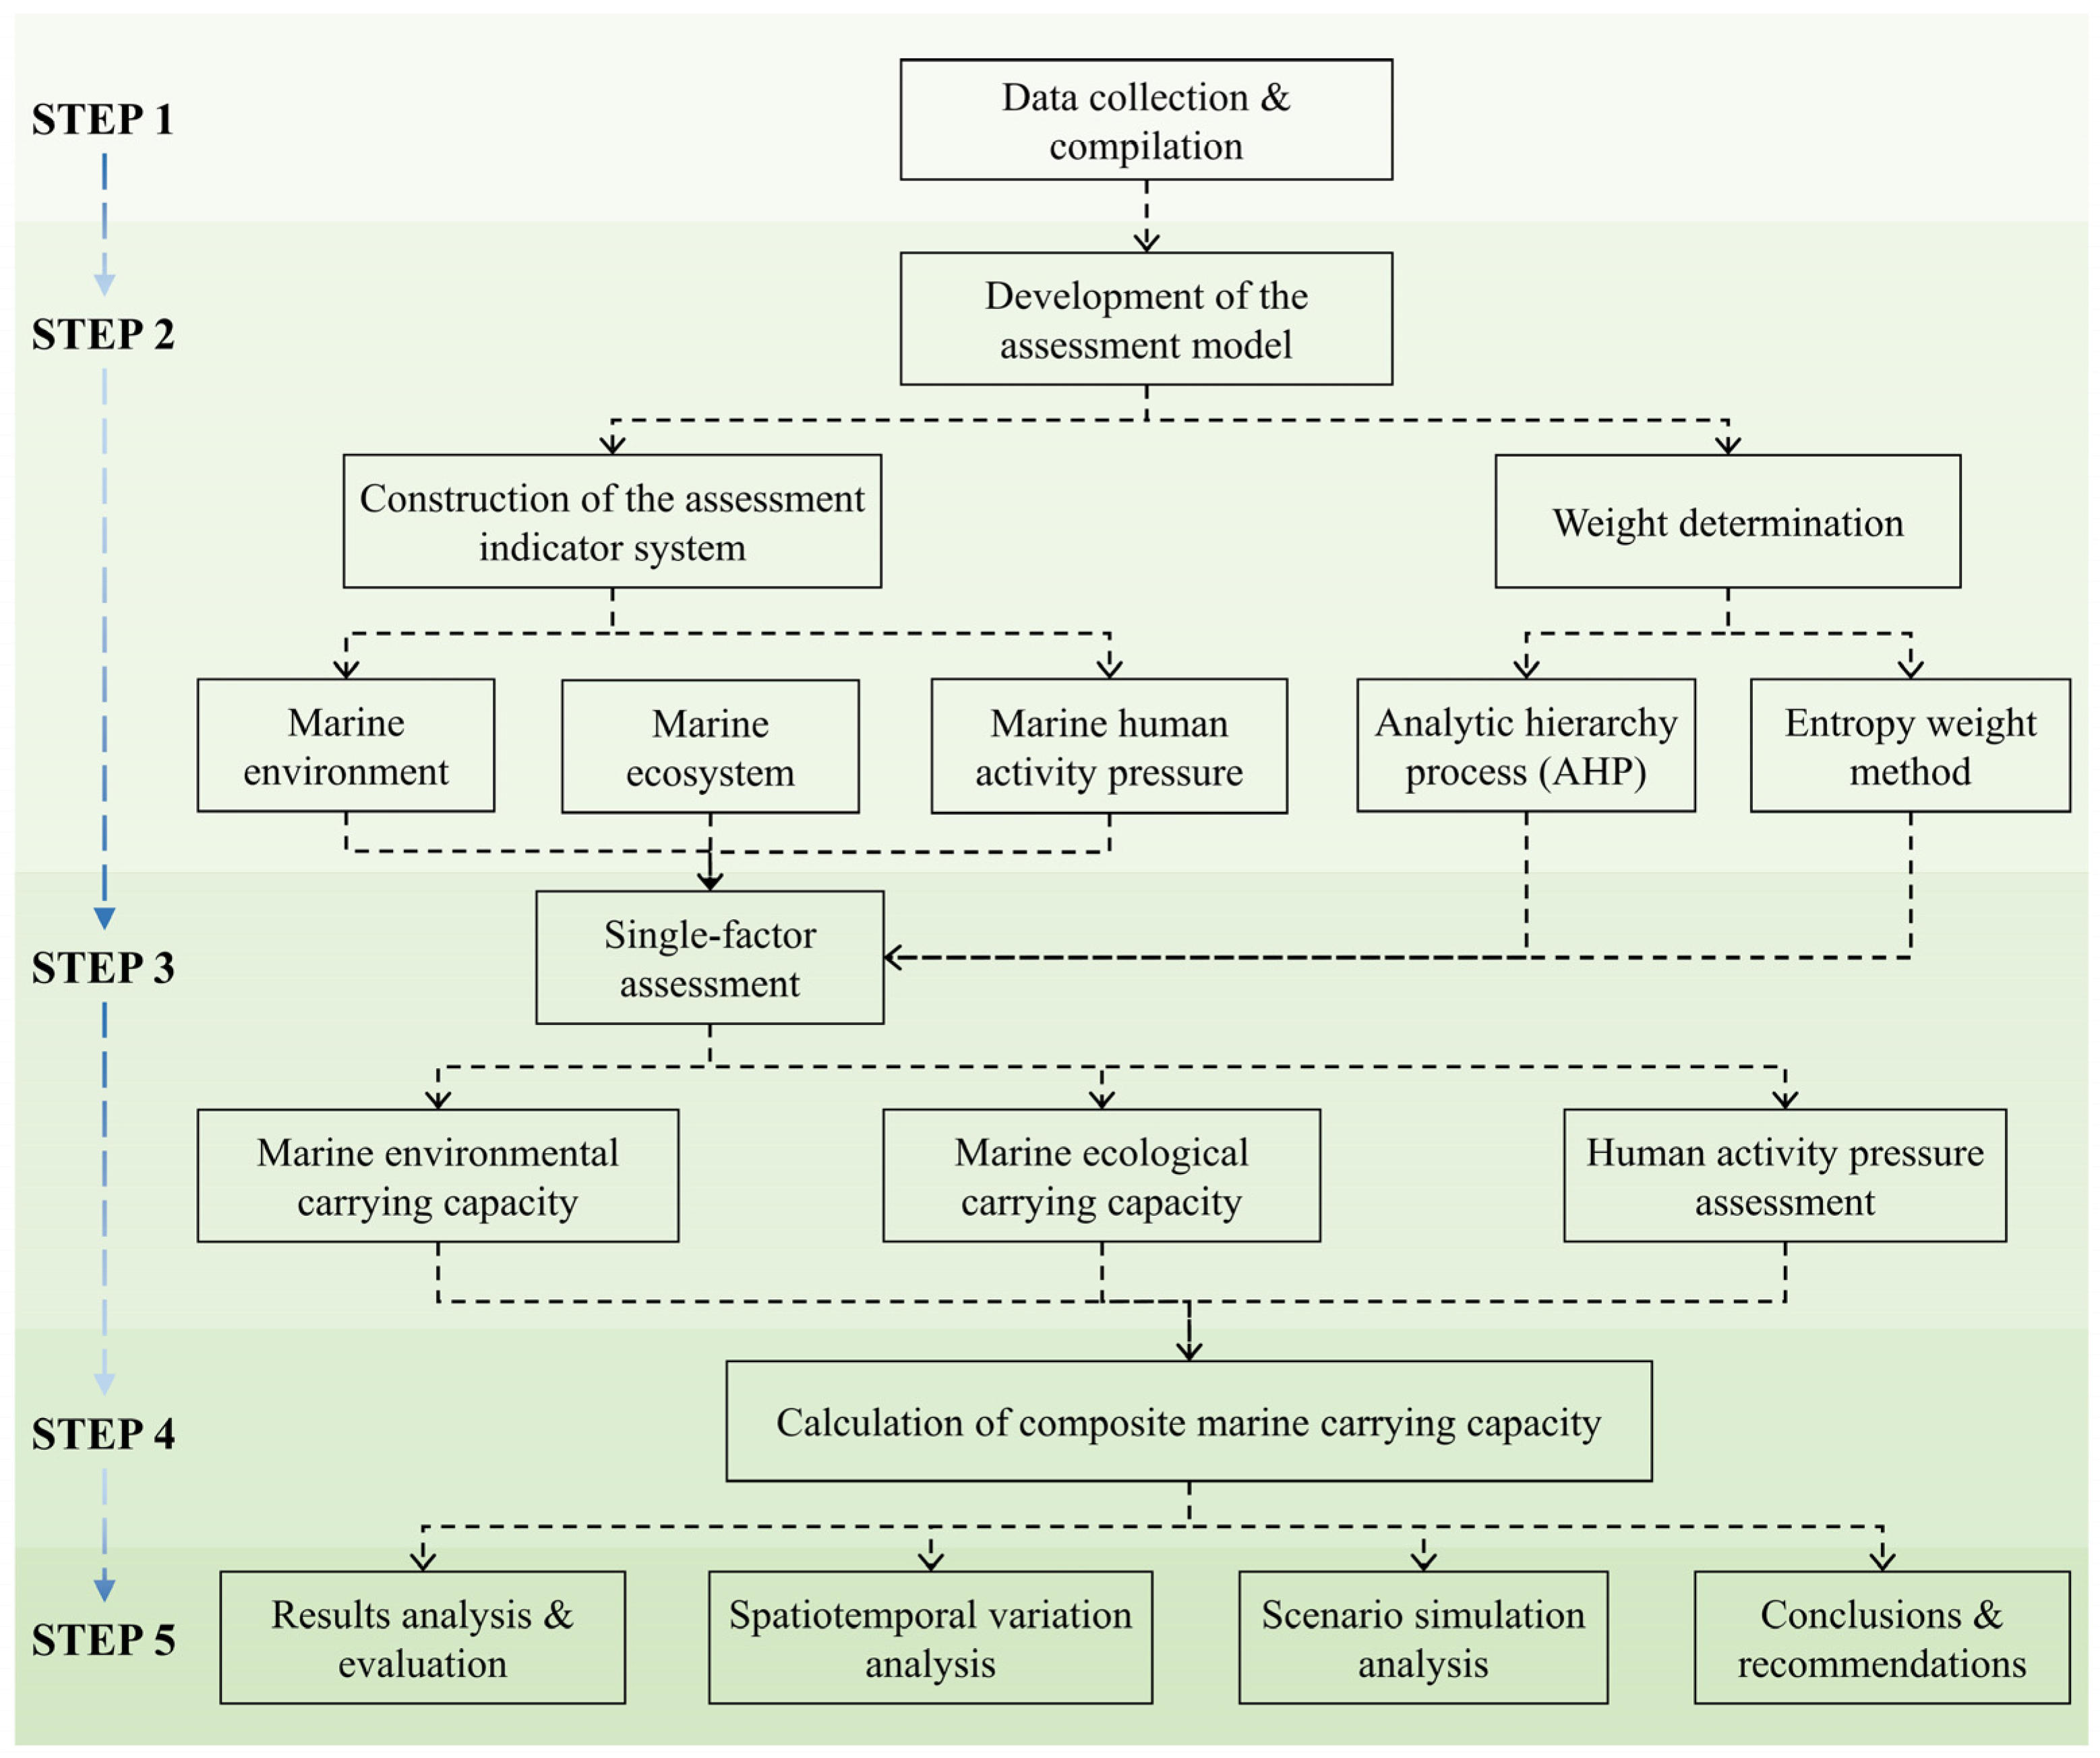
This study is divided into five main components: data collection and processing, construction of the assessment model, evaluation of single-factor carrying capacities and anthropogenic pressure, calculation of the Composite Marine Carrying Capacity, and analysis of the Composite Marine Carrying Capacity (Figure 2). These five components constitute a comprehensive technical workflow for the study of marine carrying capacity.
Table 1. Data description and sources.
NameDescriptionSource
Marine Eutrophication IndexCalculated based on chemical oxygen demand (COD), dissolved inorganic nitrogen (DIN), and reactive phosphate in seawater.Obtained from offshore sampling, primarily conducted in two seasons: summer (May–June) and autumn (September–October). Figure 3 shows the cumulative spatial distribution of sampling points for 2006–2010 and 2016–2020.
Seawater Heavy Metal IndexRatio of measured heavy metal concentrations in seawater to the evaluation standard values of Grade I seawater quality standards.
Seawater Petroleum Hydrocarbons IndexRatio of measured petroleum concentrations in seawater to the evaluation standard values of Grade I seawater quality standards.
Sediment Total Organic Carbon (TOC) IndexRatio of measured organic carbon content in sediment to the Grade I standard of Marine Sediment Quality standards.
Sediment Heavy Metal IndexRatio of measured heavy metal content in sediment to the Grade I standard of Marine Sediment Quality standards.
Sediment Petroleum Hydrocarbons IndexRatio of measured petroleum content in sediment to the Grade I standard of Marine Sediment Quality standards.
Marine Phytoplankton Diversity IndexCalculated using the Shannon–Weaner index.
Marine Zooplankton Diversity Index
Marine Benthic Diversity Index
Marine Benthic Organism BiomassRatio of the measured number of benthic individuals to the sampling investigation volume.
Marine Chlorophyll aContent of chlorophyll a in seawater samples per unit volume.
Sea Use TypeData on various types of marine space use; this study utilizes data from 2010 and 2020.Literature and government documents.
ShippingDetermined based on the route density of cargo ships over multiple years.https://www.marinetraffic.com
Fishing IntensityDetermined based on the route density of fishing vessels to determine fishing intensity.https://globalfishingwatch.org
Ecological RedlineData on various marine protected areas, marine parks, fishery germplasm resource reserves, and important estuaries.Literature and government documents.
Fishery ResourcesRefers to the “three grounds and one corridor” of fisheries, specifically spawning grounds, feeding grounds, wintering grounds, and migration corridors.Literature.
Habitat of Endangered BirdsBuffer zone analysis conducted according to endangerment levels.Field investigation and buffer zone analysis.
Coastal VegetationVisual interpretation using Landsat and Sentinel data.Field investigation and buffer zone analysis
Coastal WetlandRemote sensing image extraction and field investigation

2.2. Methodology

2.2.1. Indicator Construction

Construction of Marine Environmental Carrying Capacity Indicators
Based on the primary pollution characteristics of the Jiangsu coastal environment, the main pollution factors of the water and sediment environments in the study area were selected as evaluation indicators. A multi-factor comprehensive evaluation method was employed for quantitative assessment. For the marine water environment quality assessment, the Marine Eutrophication Index, Seawater Heavy Metal Index, and Seawater Petroleum Hydrocarbons Index were selected. For the marine sediment environment quality assessment, the Sediment Total Organic Carbon (TOC) Index, Sediment Heavy Metal Index, and Sediment Petroleum Hydrocarbons Index were selected [20]. Based on the current Chinese Marine Environmental Quality Standards, a five-level evaluation standard for environmental indicators was established, corresponding to the five-level classification of the comprehensive evaluation grade. Detailed information regarding the marine environmental carrying capacity indicator system and calculation methods is provided in Appendix A Table A1 and Table A2.
Construction of Marine Ecological Carrying Capacity Indicators
This study selected indicators such as Marine Chlorophyll a, plankton diversity, and benthic organisms to assess marine ecology. Marine Chlorophyll a represents primary productivity; plankton diversity reflects community structure, energy transfer, and ecological stability; benthic organisms are environmentally sensitive and have low mobility, serving as indicators of water quality changes. Ecological carrying capacity was also quantitatively evaluated using a multi-factor comprehensive evaluation method [20]. Based on the current Chinese Marine Environmental Quality Standards, a five-level evaluation standard for ecological indicators was established, corresponding to the five-level classification of the comprehensive evaluation grade. The specific indicators and calculation methods are detailed in Appendix A Table A3 and Table A4.
Construction of the Assessment Indicator System for Anthropogenic Pressure in Marine Areas
Considering the development status of nearshore waters, an assessment indicator system for anthropogenic pressure was constructed focusing on three aspects: marine engineering construction, shipping, and fishing. Offshore development activities can be categorized into fishery use, industrial use, transportation use, tourism and recreation use, submarine engineering use, pollution discharge and dumping use, land reclamation engineering use, special use, and others. Concurrently, based on the characteristics of sea use and the degree of impact on the natural attributes of the marine environment, activities were divided into different use modes. These include five primary categories—land reclamation, structures, enclosure, open use, and others—and 20 secondary categories. According to the impact of different sea use modes on the natural attributes of the sea area, the impact levels are classified into five grades from low to high [21,22] (Table 2).
Indicator System for Composite Marine Carrying Capacity Evaluation
The strength of the composite marine carrying capacity is reflected in the marine environment and ecological carrying capacity. Simultaneously, the state of the ecological environment serves as a clear indicator of structural and functional disorder within the marine ecosystem. The anthropogenic pressure system consists of two sub-modules: the pressure category and the management response category. Against this background, pressure-related indicators primarily focus on the engineering exploitation of marine resources by humans and the discharge of harmful pollutants into the sea. Responsiveness indicators refer to the technical methods used by people to alleviate pressure on marine ecosystems, as well as effective management measures taken by the government to protect and restore marine ecosystems, representing the human support capacity category (Table 3).

2.2.2. Weight Calculation

Analytic Hierarchy Process
When conducting the evaluation of composite marine carrying capacity, the Analytic Hierarchy Process is used to determine the relative importance of each sub-goal level (the relative importance values (1–9) were determined through a Delphi consensus process involving a panel of seven experts in marine ecology and environmental management). Calculating indicator weights in AHP requires the construction of a judgment matrix to subsequently obtain the weight vector [23,24]. The judgment matrix is constructed through pairwise comparisons of the importance of each indicator, using a 1–9 scale to represent the importance of two indicators. If n indicators need to be compared, the judgment matrix A is an n × n matrix, where the element a i j represents the importance of the i-th indicator relative to the j-th indicator. If a i j = k , it means the importance of the i-th indicator relative to the j-th indicator is k (where k is an integer from 1 to 9 or the reciprocal of an integer from 1 to 9). If a i j = k , then a j i = 1 / k . The elements on the diagonal are a i i = 1 , and the weight of each indicator relative to itself is 1 (Table 4).
Based on this, the maximum eigenvalue and the corresponding eigenvector of the judgment matrix are calculated. Let λmax be the maximum eigenvalue of matrix.
Let A and ω be the corresponding eigenvector, which represents the relative weights of each indicator. Mathematically, matrix A and the weight vector ω satisfy the following equation:
A ω = λ max ω
Subsequently, the eigenvector is normalized to ensure that the sum of all weights is 1:
ω i = ω i i = 1 n ω i
The resulting ωi represents the relative weight of each indicator. Furthermore, a consistency test must be performed. Since the judgment matrix is constructed based on subjective judgments, potential inconsistencies may arise. To ensure the validity of the judgment matrix, it is necessary to conduct a consistency check.
C I = λ max n n 1
where CI is the consistency index and n is the order of the matrix. Subsequently, the consistency ratio CR is obtained.
C R = C I R I
where RI is the random index, representing the random consistency index corresponding to the order of the matrix n (Appendix A Table A3). If CR < 0.1, the judgment matrix is considered consistent and acceptable. If CR > 0.1, the matrix must be reconstructed. After an in-depth comparison of the importance of various indicators, Analytic Hierarchy Process evaluation matrices were established.
Specifically, three judgment matrices with orders of n = 6, 5, and 8 were constructed for marine environmental carrying capacity (X), marine ecological carrying capacity (Y), and anthropogenic pressure (Z), respectively; these matrices were labeled as AX, AY and AZ (Table 5).
The Analytic Hierarchy Process was applied to determine and verify the weights for marine environmental carrying capacity. For the n = 6 order environmental carrying capacity judgment matrix AX (Table 5), the maximum eigenvalue λ_max was calculated as 0.68, and the consistency index (CI) was −1.064. The consistency ratio (CR) was −1.32, which is less than 0.10. Following the consistency test, the logical process of weight determination was deemed reasonable, and the structure of the indicator weights was confirmed.
The judgment matrix AY for marine ecological carrying capacity (Table 6) has a maximum eigenvalue λ_max of 0.49 and a consistency index (CI) of −0.902. The consistency ratio (CR) is −0.805, which is lower than 0.10. This indicates that the judgment matrix possesses logical consistency in determining weights. Furthermore, after passing the consistency test, the calculated results for the indicator weights were found to be fully feasible. The judgment matrix AY is presented in Table 6.
In the process of using the Analytic Hierarchy Process to determine and verify the weights for anthropogenic pressure, the maximum eigenvalue λmax for the n = 8 order anthropogenic pressure judgment matrix AZ (Table 7) was calculated to be 0.78, with a consistency index (CI) of −1.03 and a consistency ratio (CR) of −1.45. This confirms that the constructed judgment matrix possesses logical rationality in weight determination. Following the consistency test, the output results for the indicator weights were found to be highly reliable.
Entropy Weight Method
In the process of evaluating the composite marine carrying capacity, combined weights are utilized for calculation. Specifically, the difference coefficients from the entropy weight method are applied to optimize the weights derived from the Analytic Hierarchy Process judgment matrix, thereby enabling a comprehensive evaluation of the marine environmental carrying capacity, marine ecological carrying capacity, and anthropogenic pressure.
The entropy weight method is an objective weighting approach that determines the weights of indicators by calculating their information entropy. Information entropy reflects the information volume and uncertainty of an indicator; a higher information entropy indicates a more dispersed data distribution, signifying richer information and resulting in a relatively lower corresponding weight. Conversely, the smaller the information entropy, the higher the indicator weight [25,26]. The entropy weight method involves five steps:
1. Data standardization. Given the dimensional differences between various datasets, it is necessary to standardize the indicator data. In this study, the Min–Max standardization method is employed to standardize the data for each indicator.
y i = x i min 1 j n x j max 1 j n x j min 1 j n x j
Transform the values x1, x2, …, xn in the equation to obtain the standardized values y1, y2, …, yn∈[0,1], which are dimensionless.
2. Calculate the proportion of the data points for each indicator. Assuming the position of a data point is (i,j), the proportion of the k-th indicator corresponding to this point is calculated as shown in the formula, where Xij,k represents the data point at (i,j) for indicator k.
P i j , k = X i j , k i = 1 n j = 1 m X i j , k
3. Calculate the information entropy. Based on the proportion of each data point, the information entropy Ek for each indicator is calculated (Equation (7)), where n and m denote the number of rows and columns of the raster values, respectively.
E k = 1 ln ( n × m ) i = 1 n j = 1 m P i j , k ln ( P i j , k )
4. Calculate the coefficient of variation. Based on the information entropy Ek, the coefficient of variation gk for each indicator is calculated (Equation (8)).
g k = 1 E k
5. Calculate the weight wk of each indicator based on the coefficient of variation, where h denotes the total number of indicators (Equation (9)).
w k = g k k = 1 h g k
The weight parameters for the element levels across all goal levels of the composite marine carrying capacity are determined using the entropy weight method. Subsequently, the final evaluation results for the composite marine carrying capacity are obtained through the comprehensive evaluation model.

2.2.3. Evaluation Methods for Anthropogenic Pressure and Carrying Capacity

Evaluation Methods for Marine Environmental and Ecological Carrying Capacity
To calculate the carrying capacity scores, factors with beneficial effects on marine environmental and ecological carrying capacity are treated as positive indicators, while factors with harmful effects are treated as negative indicators. Building on this, the weights for various indicators are obtained using the Analytic Hierarchy Process. Ultimately, a higher total carrying capacity score represents a stronger carrying capacity, while a lower score indicates a weaker carrying capacity (Appendix A Table A1 and Table A3). The carrying capacity is classified into five levels: Strong (>0.8), Relatively Strong (0.6~0.8), Moderate (0.4~0.6), Relatively Weak (0.2~0.4), and Weak (<0.2).
Evaluation Method for Anthropogenic Pressure
The Analytic Hierarchy Process is employed to assign weights to various modes of sea use, and the comprehensive anthropogenic pressure is calculated using Equation (10).
I Z = k = 1 n I k × W k
where IZ denotes the composite pressure caused by human activities in the marine area; n is the number of types of human activities; k represents the k-th type of human activity; Ik represents the pressure generated by the k-th type of human activity; and Wk is the weight assigned to the k-th type of human activity.
Evaluation Method for Composite Marine Carrying Capacity
The evaluation of the composite marine carrying capacity is performed by determining the weights of relevant factors—including the environment, ecology, and anthropogenic pressure—using the entropy weight method. Subsequently, the evaluation of the composite marine carrying capacity is carried out based on the Pressure–State–Response (PSR) model.
C C C = j = 1 m w j x j 2
In Equation (11), xj is the value of the j-th indicator, wj is the weight of the j-th indicator, and CCC is the value of the composite marine carrying capacity.
Specifically, by performing weight assignment and spatial overlay analysis on the individual environmental and ecological indicators, comprehensive evaluation models for both the marine environmental carrying capacity and the marine ecological carrying capacity of the Nantong sea area were established.

3. Results

3.1. Spatiotemporal Response of Nearshore Marine Environmental and Ecological Carrying Capacity

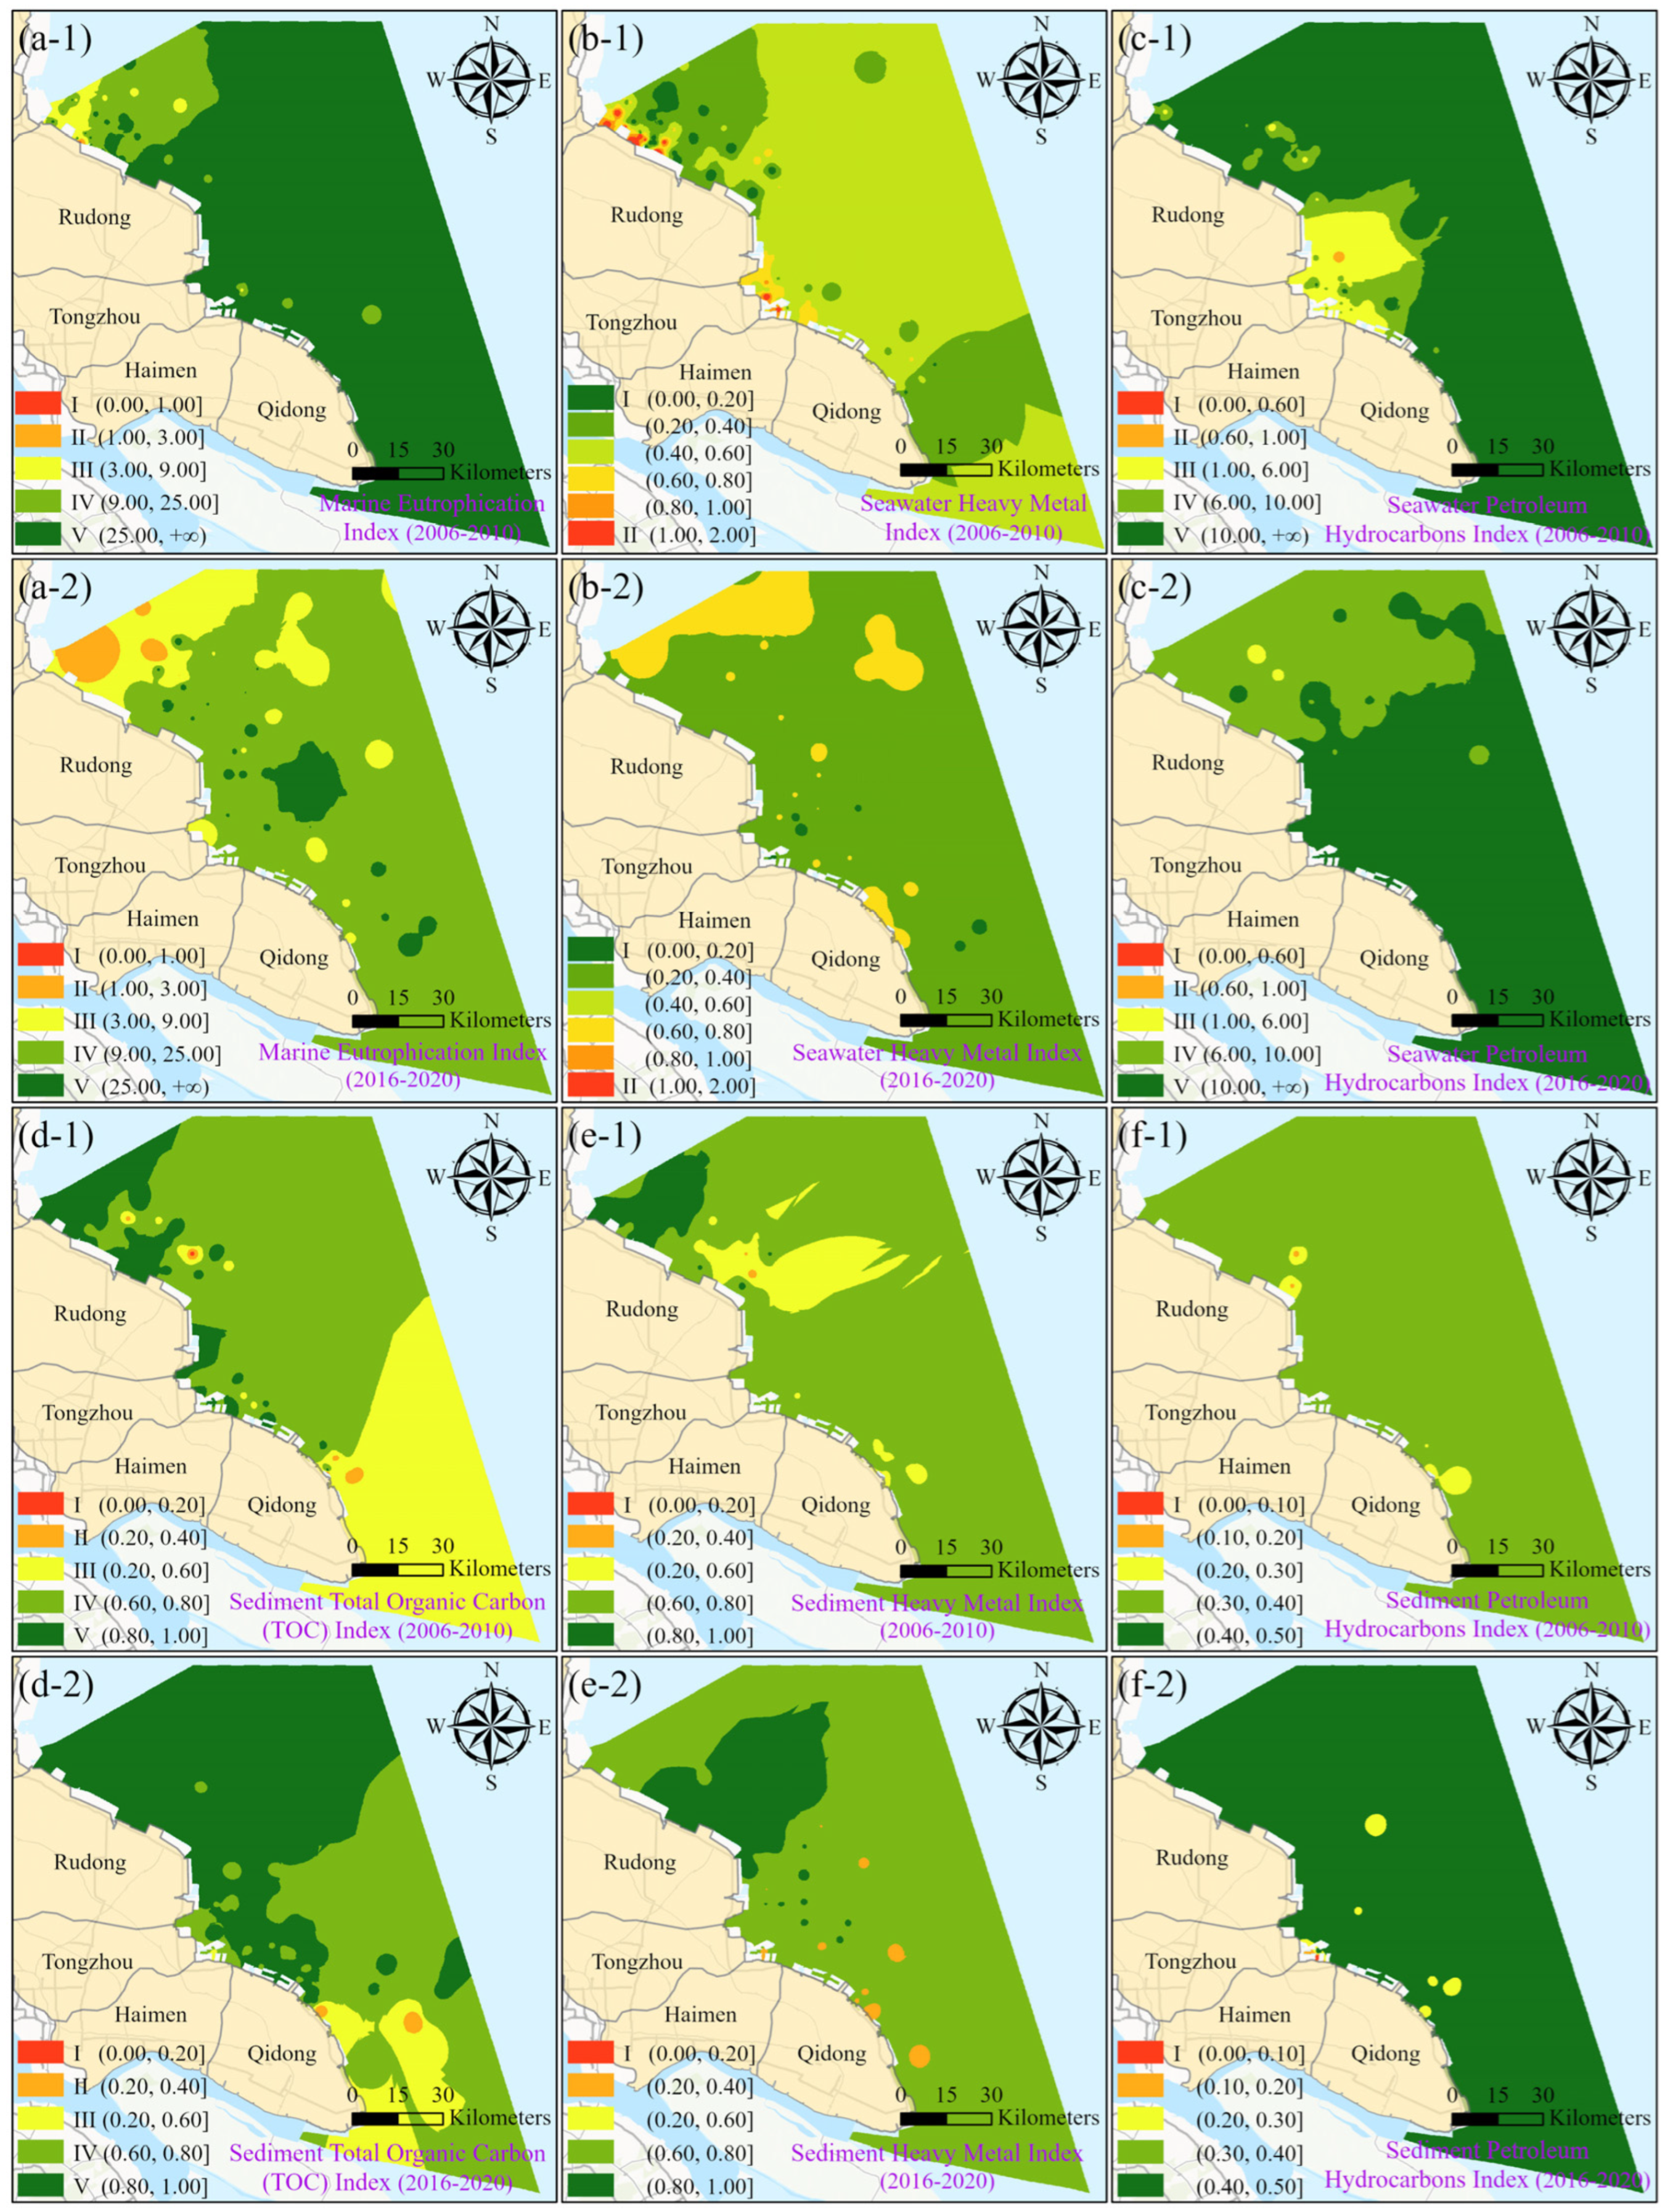
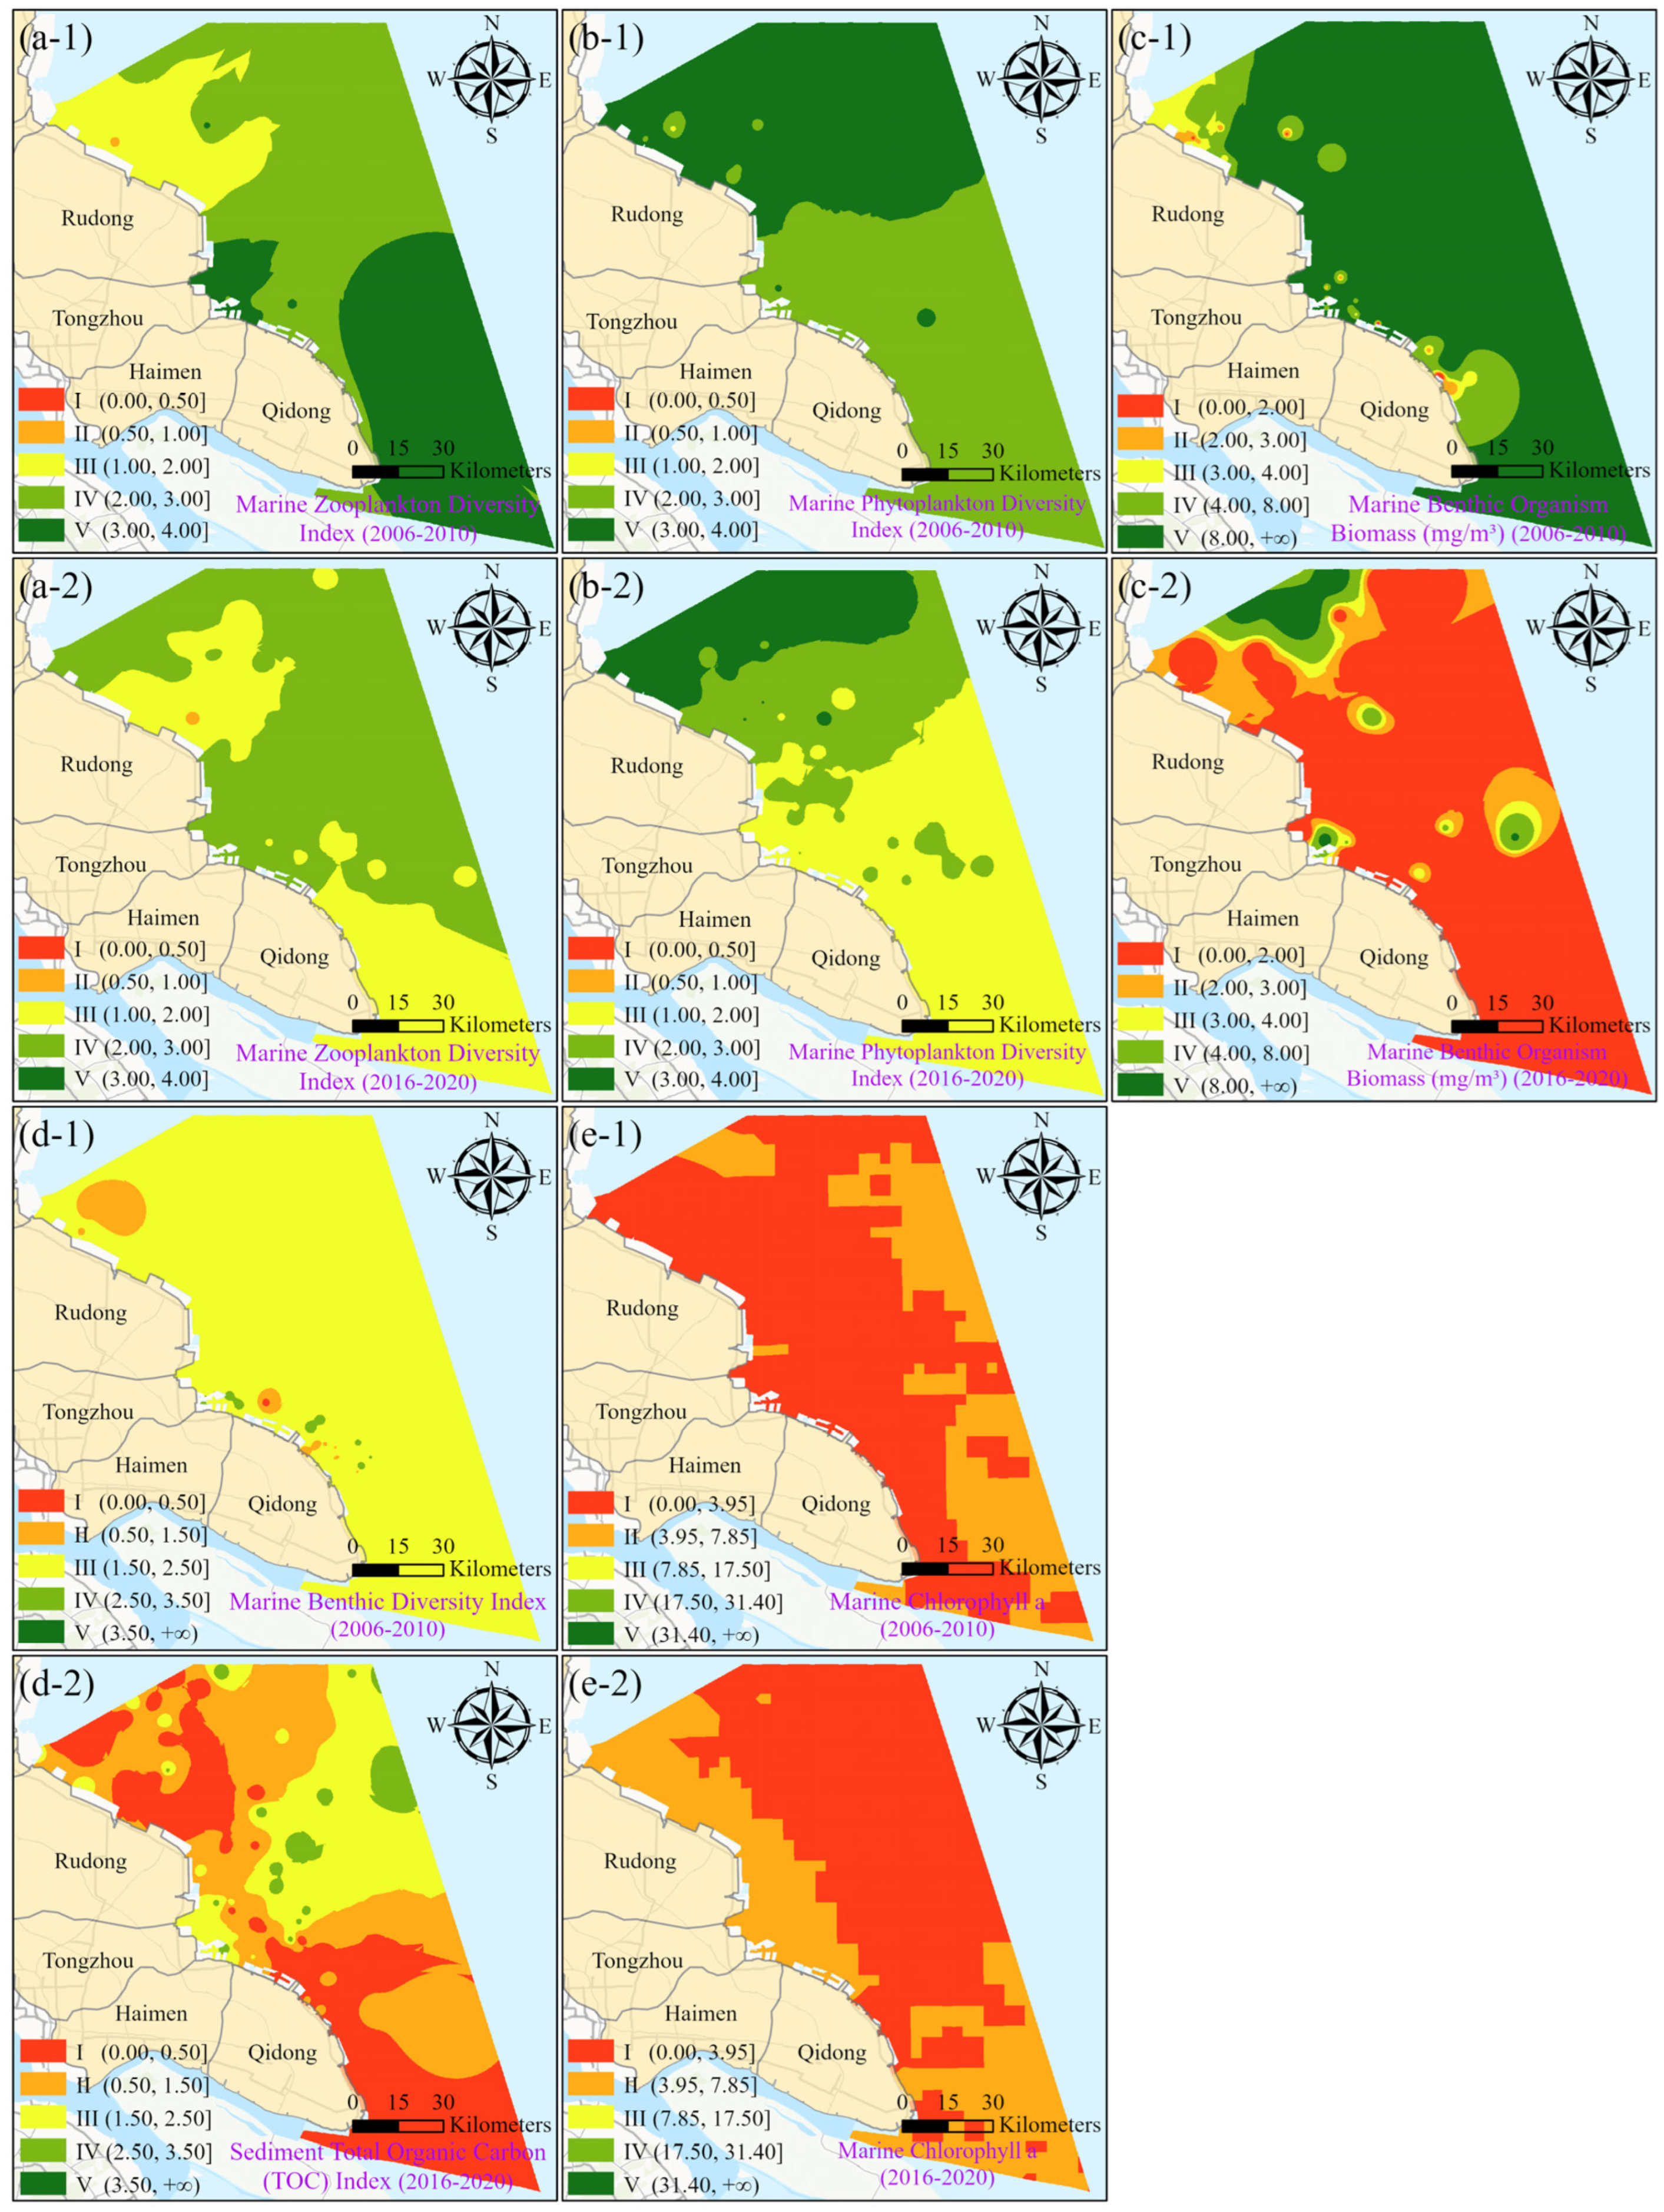
The spatial distributions of the individual evaluation indicators for the marine environmental carrying capacity (including eutrophication, heavy metals, etc.) and the marine ecological carrying capacity (including phytoplankton, zooplankton, etc.) across the two study periods are presented in Figure 3 and Figure 4, respectively. Based on the spatial overlay of these indicators, the comprehensive carrying capacities were quantitatively assessed.
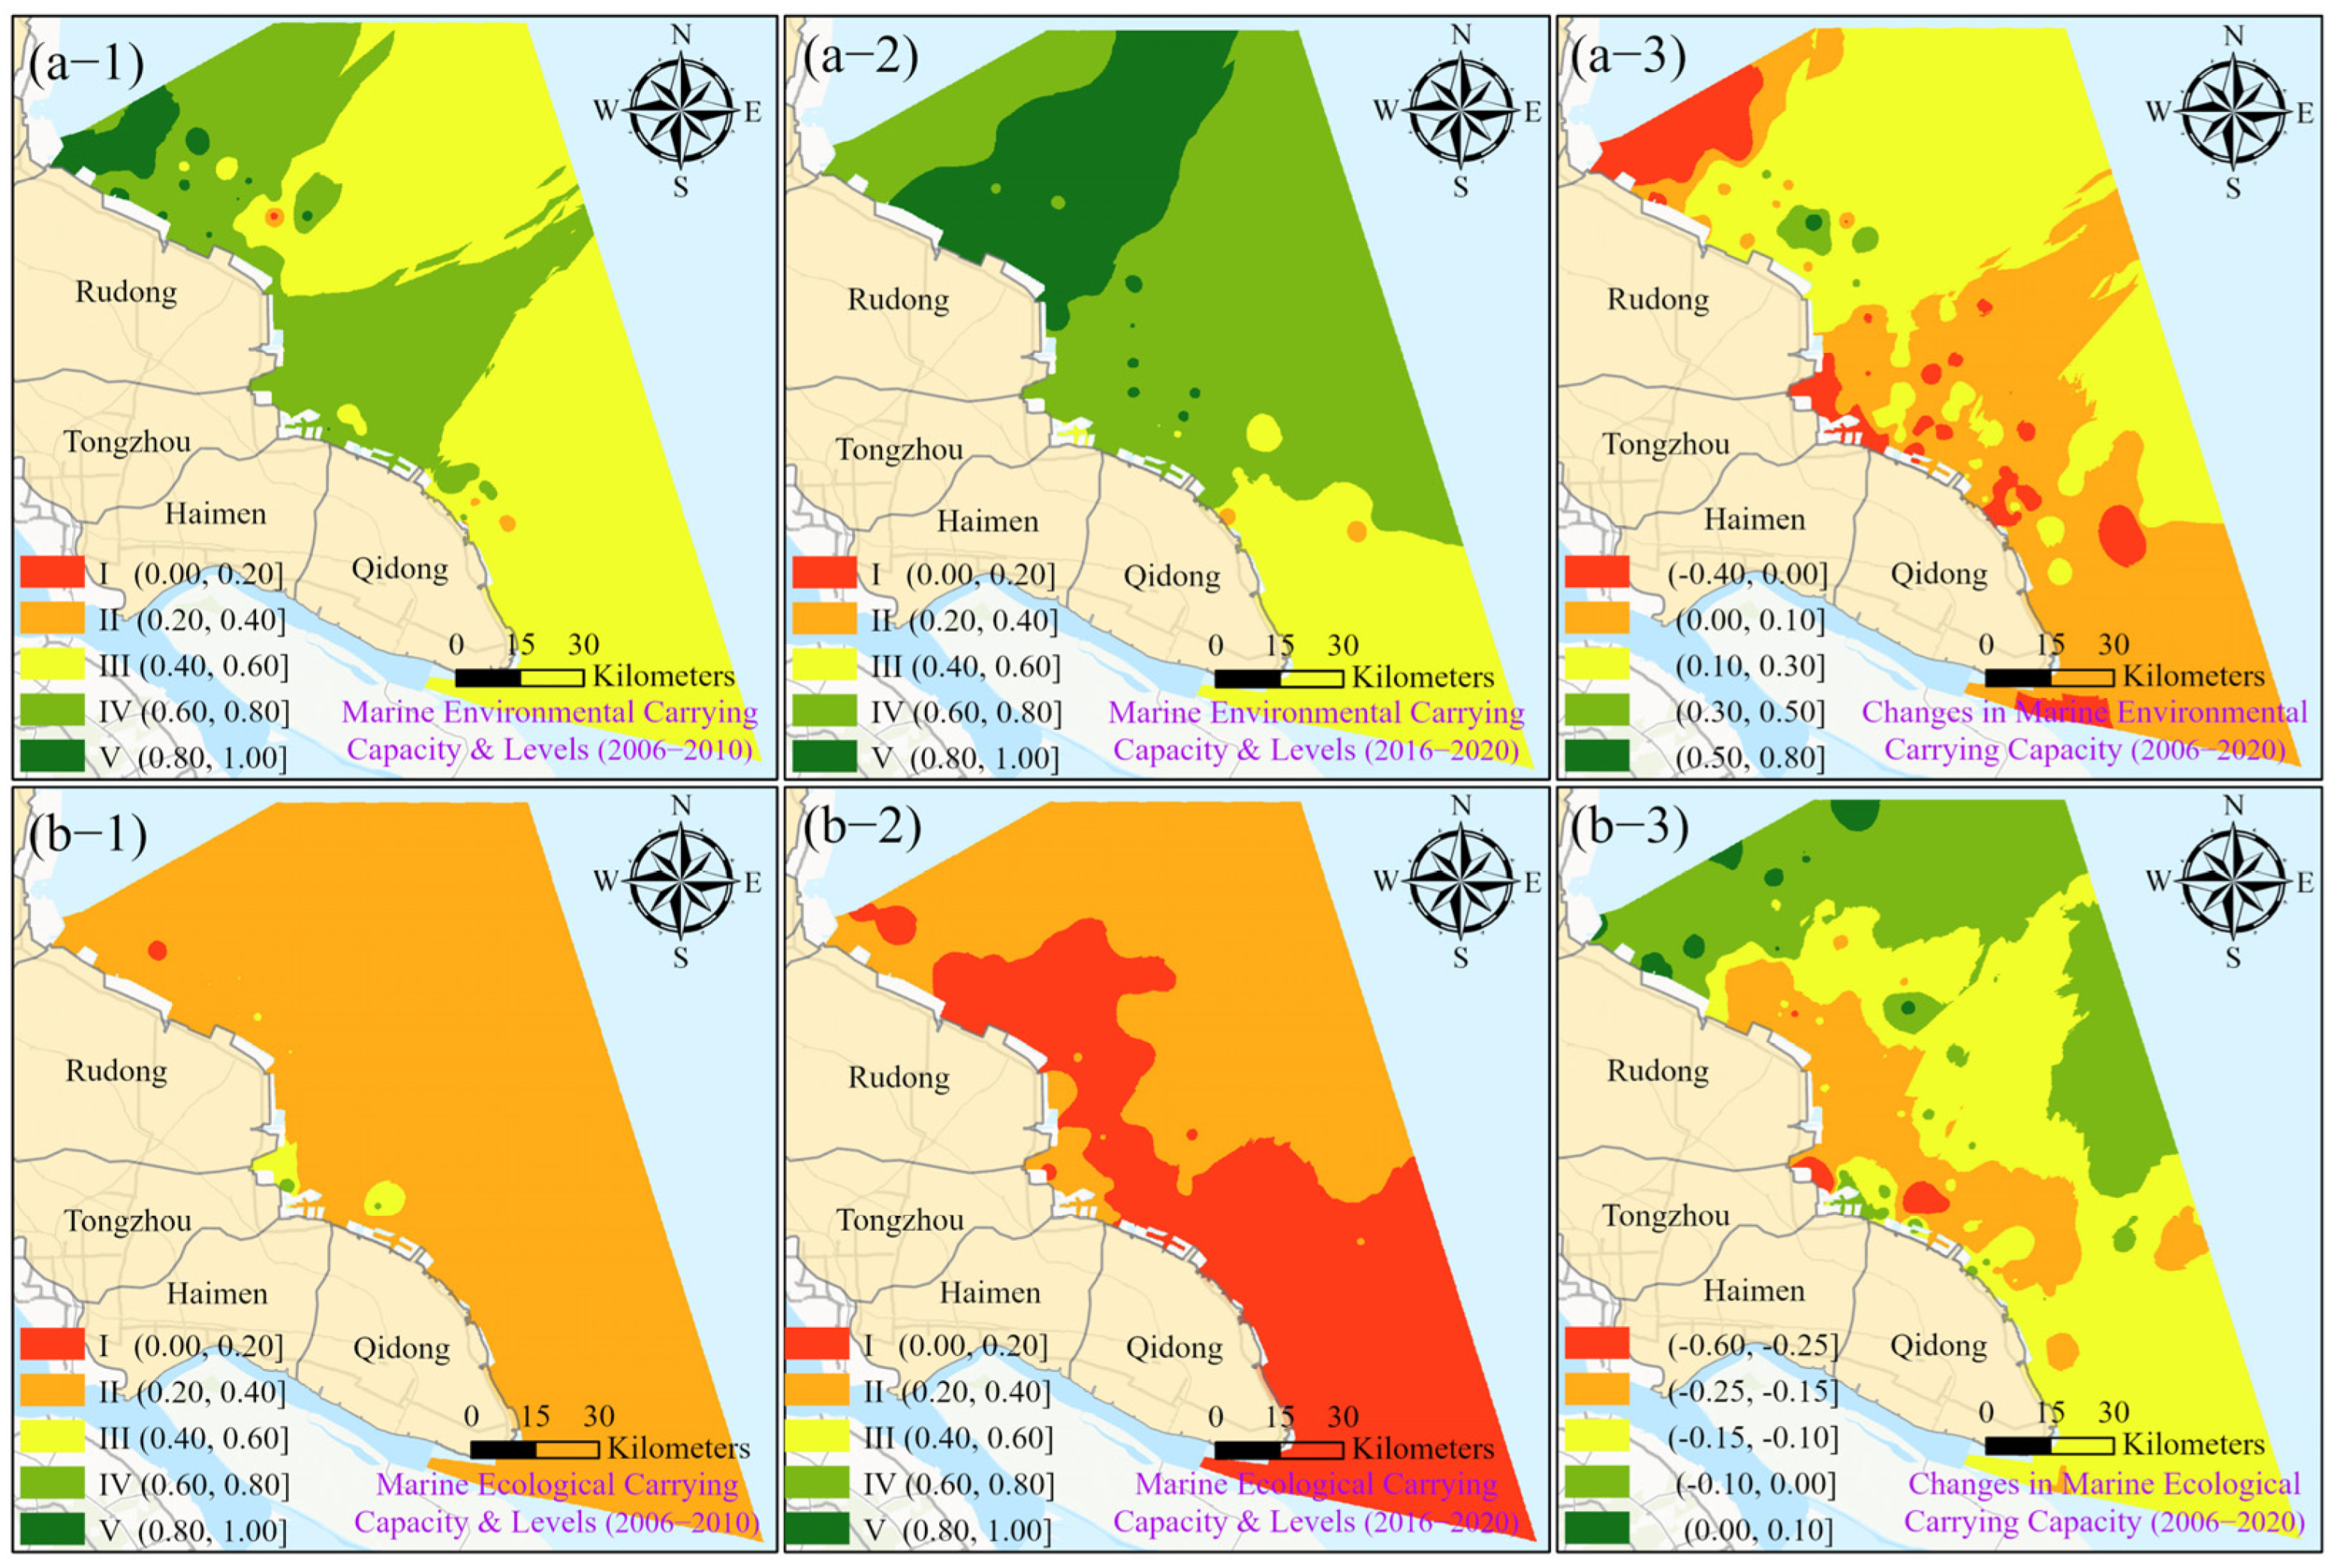
The study period covered two time intervals: 2006–2010 and 2016–2020. Analysis results indicate that the Nantong sea area overall demonstrated good marine environmental carrying capacity. Specifically, from 2006 to 2010, areas of high carrying capacity accounted for 2.8%, relatively high carrying capacity areas accounted for 32.7%, and moderate carrying capacity areas accounted for 64.3% (Figure 5a-1). In contrast, from 2016 to 2020, the proportion of high carrying capacity areas increased to 20.4%, relatively high carrying capacity areas rose to 55.1%, and moderate carrying capacity areas decreased to 24.1%. The northern sea area exhibited relatively high environmental carrying capacity, while the Qidong sea area and the waters on the north side of the Yangtze River Estuary showed moderate carrying capacity (Figure 5a-2).
From the distribution of the change magnitude of marine environmental carrying capacity, four regions in the Nantong sea area experienced significant declines during the 2016–2020 period compared to the 2006–2010 period: the waters near Jiangjiasha in the northeast, the Tongzhou Bay port area in the center, the northern Qidong sea area, and the waters near the Yangtze River Estuary. Regarding the magnitude of these declines, the Tongzhou Bay port area and the northern Qidong sea area exhibited more pronounced decreases. Conversely, the marine environmental carrying capacity improved in most other sea areas, with the northern Nantong sea area showing the greatest overall increase. From the perspective of spatial transition between different carrying capacity levels, the minimal areas of high marine environmental carrying capacity that existed during 2006–2010 mostly transitioned into relatively high marine environmental carrying capacity areas. However, simultaneously, 30.3% of the original relatively high areas and 16% of the original moderate areas were upgraded to high marine environmental carrying capacity, while 46.7% of the original moderate areas improved to relatively high. Overall, the marine environmental carrying capacity of the Nantong sea area shows a steady, step-by-step upward trend (Figure 5a-3).
The results indicate that during the 2006–2010 study period, the marine ecological carrying capacity of the Nantong sea area was generally at a moderate level, with most areas classified as Grade II, while the central coastal region contained small patches of Grade III (Figure 5b-1). During the 2016–2020 study period, the marine ecological carrying capacity of the Nantong sea area experienced a certain degree of decline, with 50.3% of the total area dropping to Grade I, indicating lower ecological carrying capacity in these regions (Figure 5b-2). In terms of spatial distribution trends, the ecological carrying capacity in the northern sea area was slightly better than that in the southern sea area.
Regarding the distribution of change magnitude, compared with the 2006–2010 period, the marine ecological carrying capacity declined across the vast majority of the Nantong sea area between 2016 and 2020, with only scattered areas of improvement in the northern waters. Among the regions where capacity declined, the nearshore waters of central Nantong experienced the most significant decrease, followed by the southern waters, while the northern waters and central offshore areas showed relatively lower degrees of decline. Overall, the magnitude of decline exhibited a trend of being larger in nearshore areas and decreasing as distance from the coast increased. From the perspective of spatial transition between different carrying capacity levels, 50.2% of the areas characterized by a relatively weak marine ecological carrying capacity (which accounted for the vast majority of the area in 2006–2010) were downgraded to weak, while the remaining 49.8% remained relatively weak. Overall, the marine ecological carrying capacity of the Nantong sea area shows a trend of slow decline (Figure 5b-3).

3.2. Evaluation of Anthropogenic Pressure in Nearshore Waters

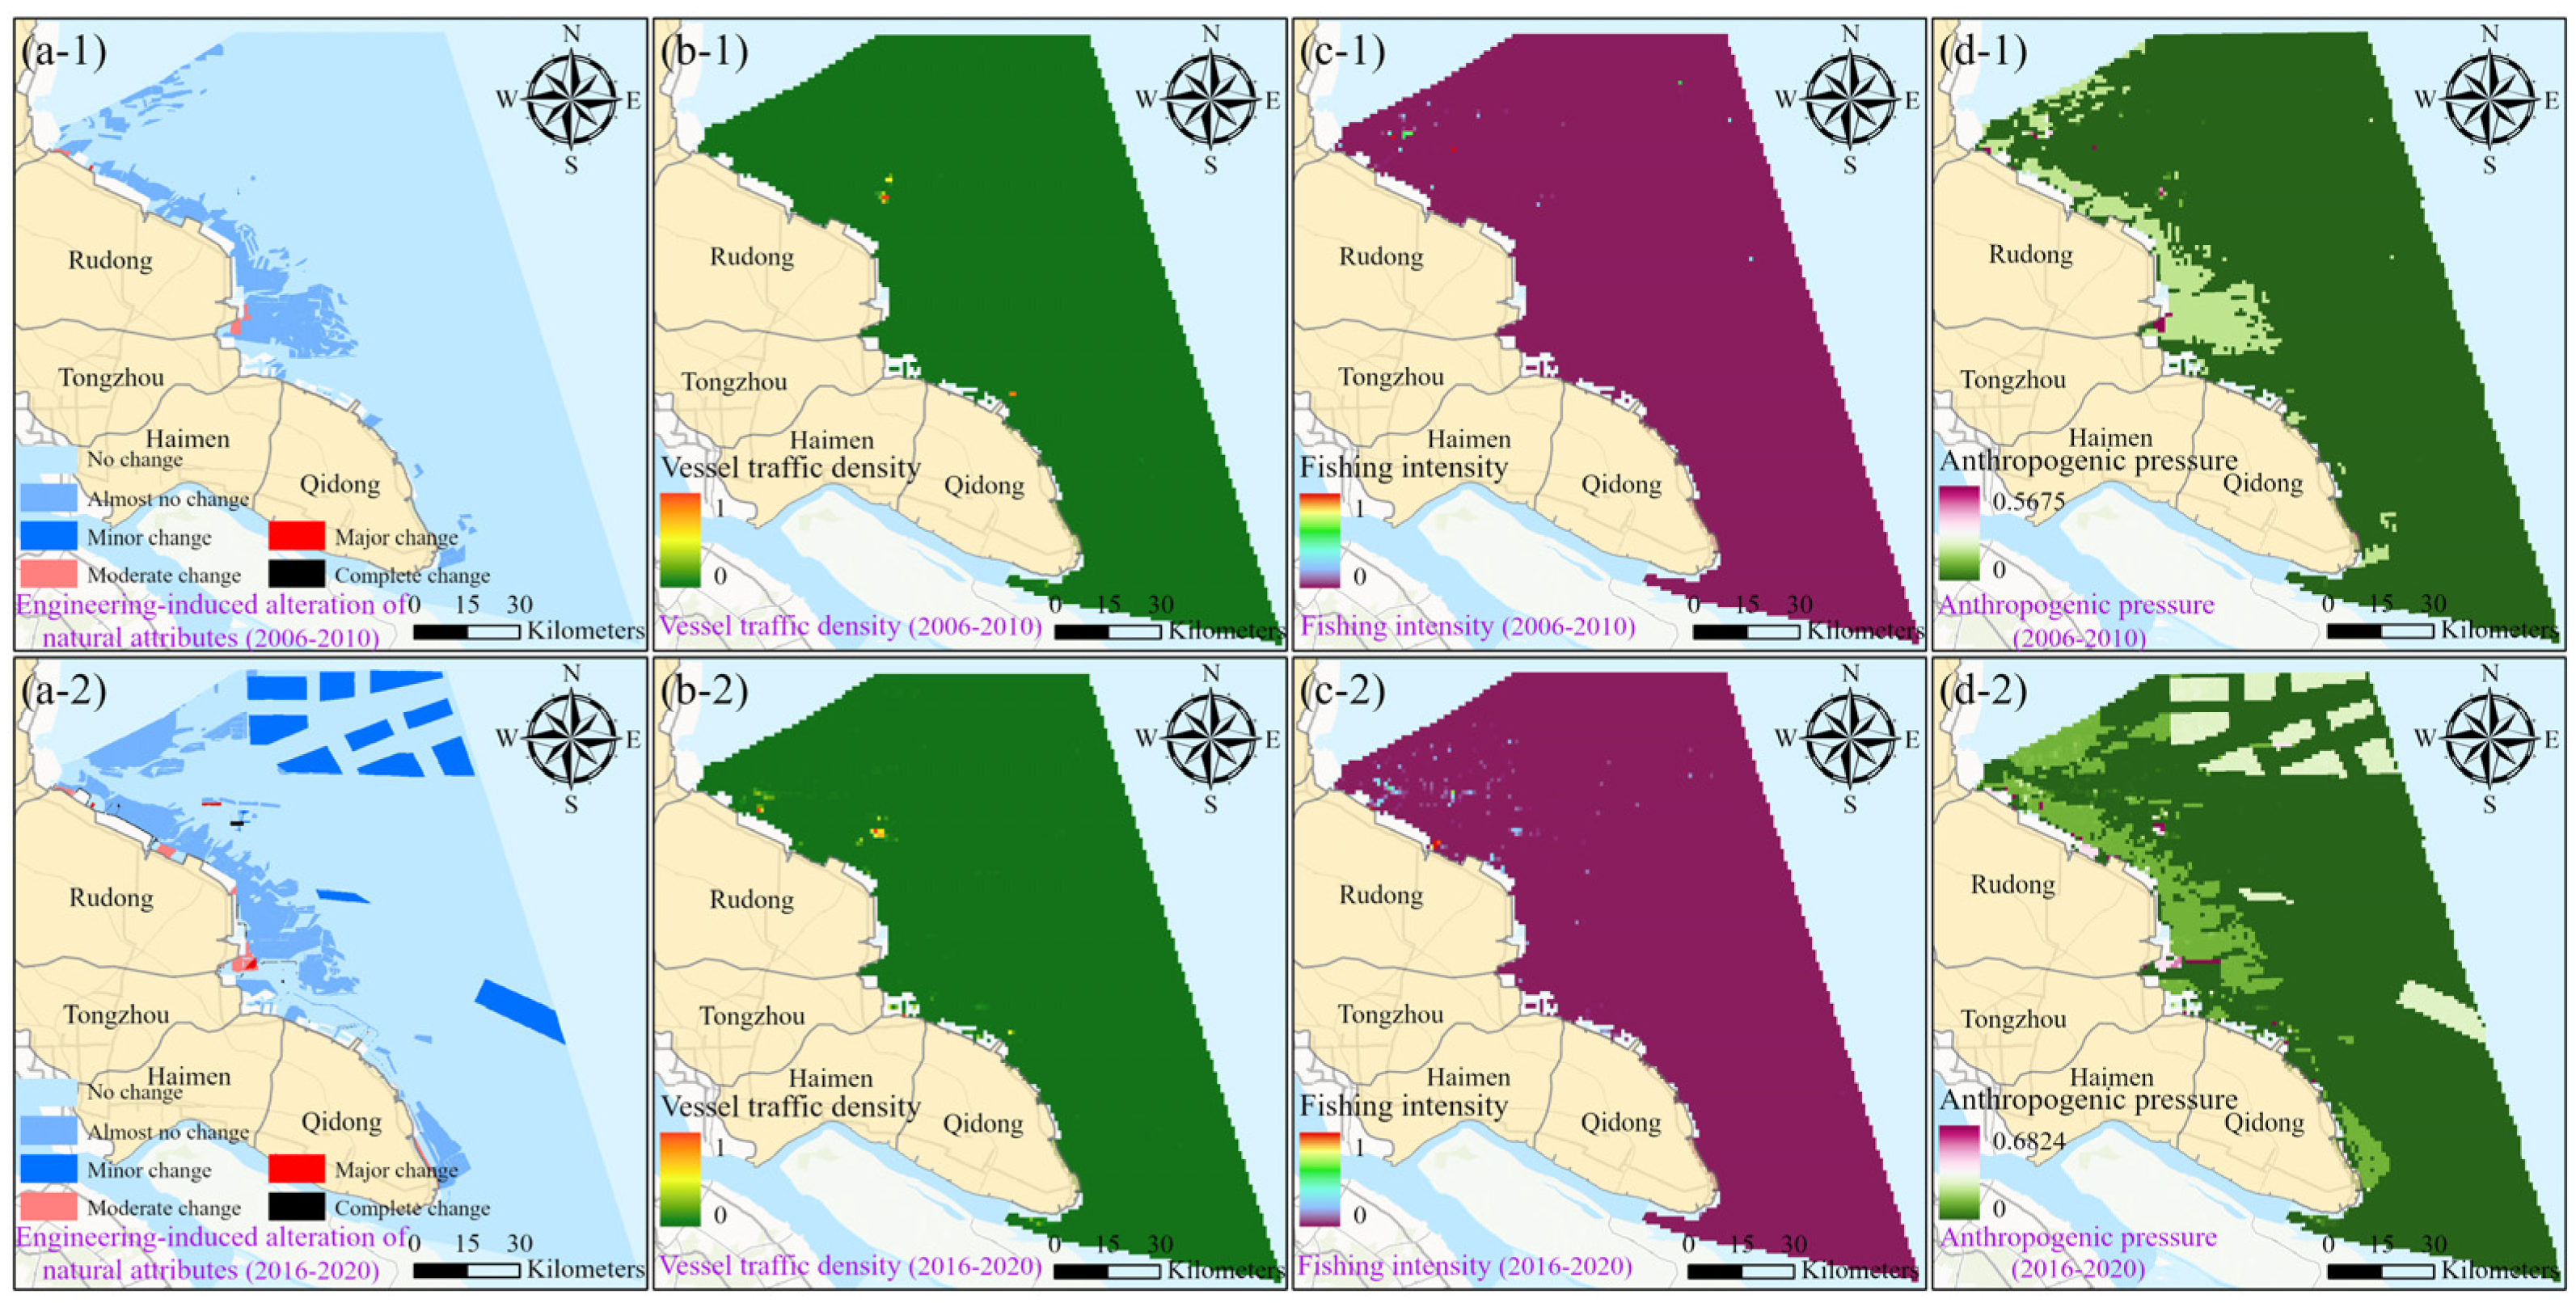
Between 2006 and 2010, the maximum value of anthropogenic pressure in the nearshore waters of Nantong was 0.5675, with an average value of 0.008. Spatially, the pressure exhibited a trend of being higher near the shore than in the open sea, and higher in the northern sea area than in the southern sea area. During this period, marine development activities were primarily concentrated in nearshore areas, with minimal development occurring offshore. Regions with high shipping density were mainly concentrated in the primary navigation channels, Sunshine Island, Lvsi Port, and the waters of the Yangtze River Estuary (Figure 6b-1). Fishing activities were predominantly concentrated in the northern coastal regions (Figure 6c-1).
Based on the calculation results, areas with high anthropogenic pressure values during this period were mainly distributed in the nearshore tidal flats where marine development was intensive, as well as in specific dense fishing zones in the northern sea area. The relative concentration of human activities in these regions led to elevated anthropogenic pressure values. However, due to the low overall development intensity, the majority of the marine area remained in an undisturbed state (Figure 6d-1).
During the 2016–2020 period, the maximum value of anthropogenic pressure in the nearshore waters of Nantong increased to 0.6824, and the average value rose to 0.019. The anthropogenic pressure values in the nearshore waters of Nantong significantly increased during this timeframe, reflecting that the region underwent larger-scale development and utilization. In terms of spatial distribution, the anthropogenic pressure in the nearshore waters of Nantong exhibited clear spatial expansion; the disturbed areas not only increased in size but also gradually extended toward the open sea. The area of nearshore aquaculture zones continued to expand, and more offshore wind farms were constructed in the open sea. Vessel traffic density in the open sea increased significantly, and new high-density shipping zones emerged in the northern Nantong sea area and the nearshore waters of Tongzhou Bay. The spatial distribution of fishing activities became more dispersed and gradually expanded offshore. New fishing activity hotspots appeared in the nearshore waters between Tongzhou Bay and Lvsi Port, while sporadic fishing activities also emerged in the southern sea area. By comparing the anthropogenic pressure distribution maps of the two periods, it is evident that the pressure in the nearshore waters of Nantong is shifting from point-like concentrations to area-based expansion. Especially in some areas that were originally undisturbed, the intrusion of human activities has caused the ecosystems in these regions to bear increasing pressure (Figure 6d-2).

3.3. Evaluation of Composite Marine Carrying Capacity Based on the State-Space Model

3.3.1. Evaluation and Change Analysis of Composite Marine Carrying Capacity

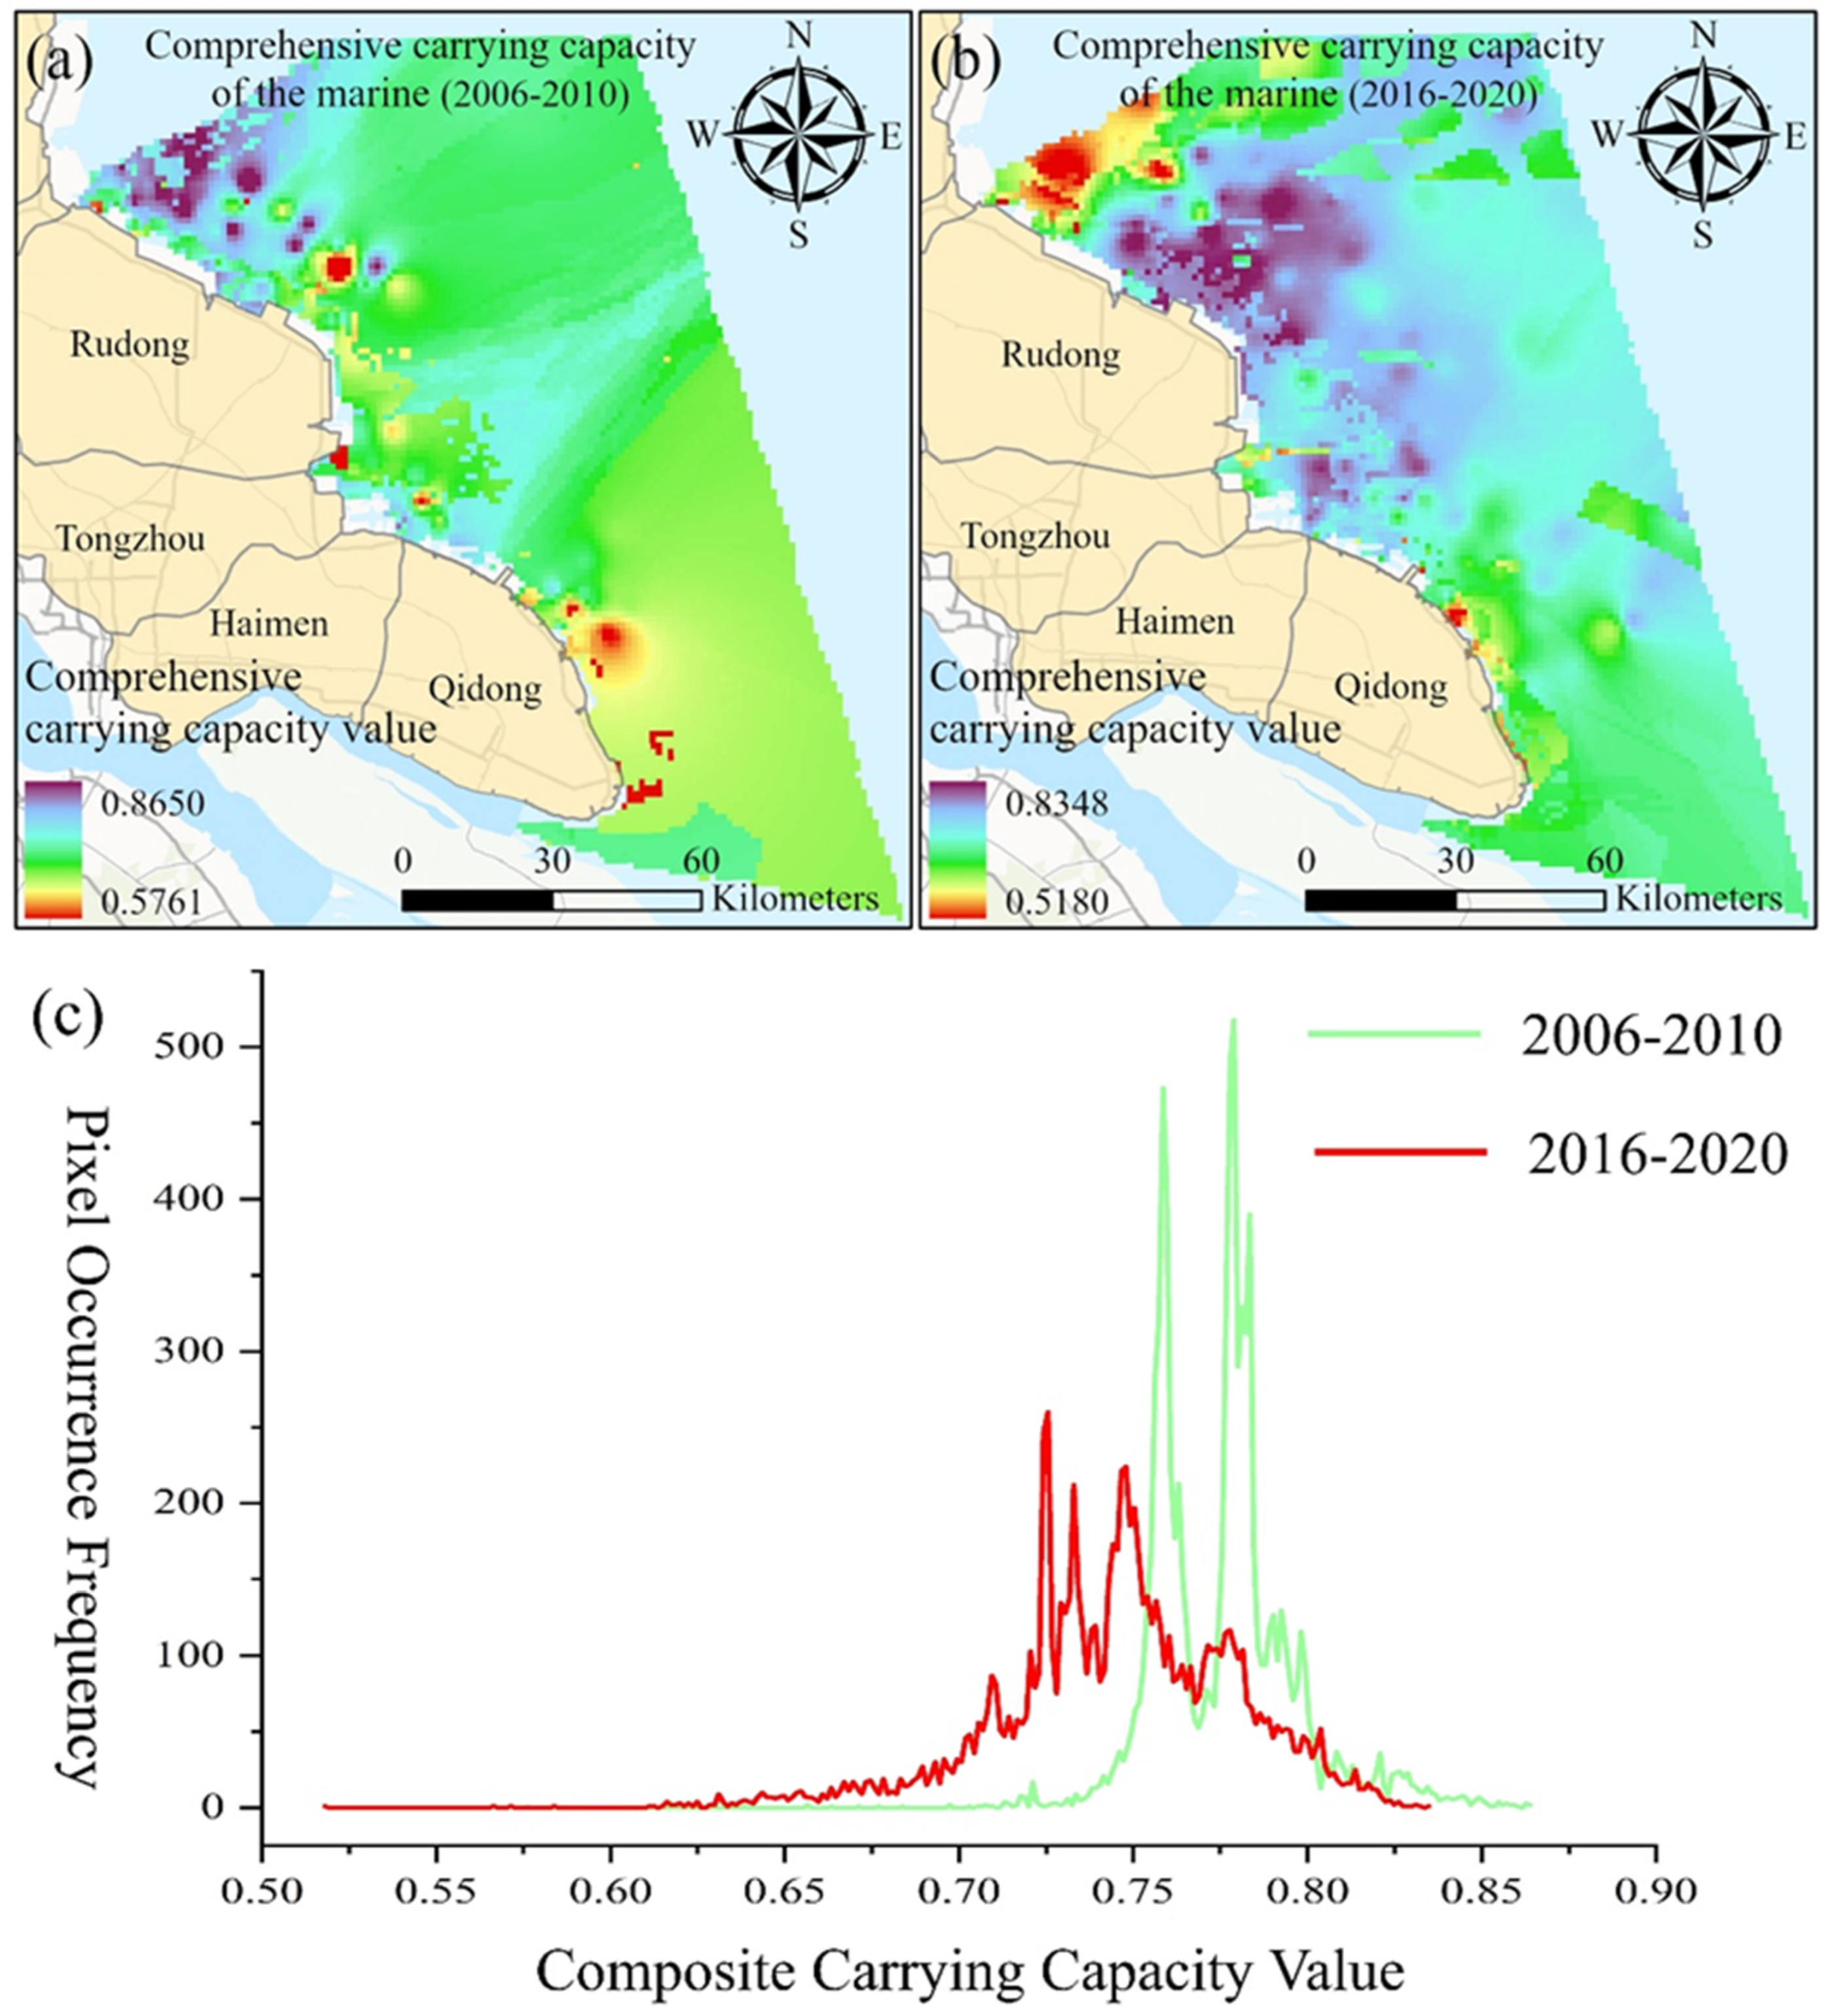
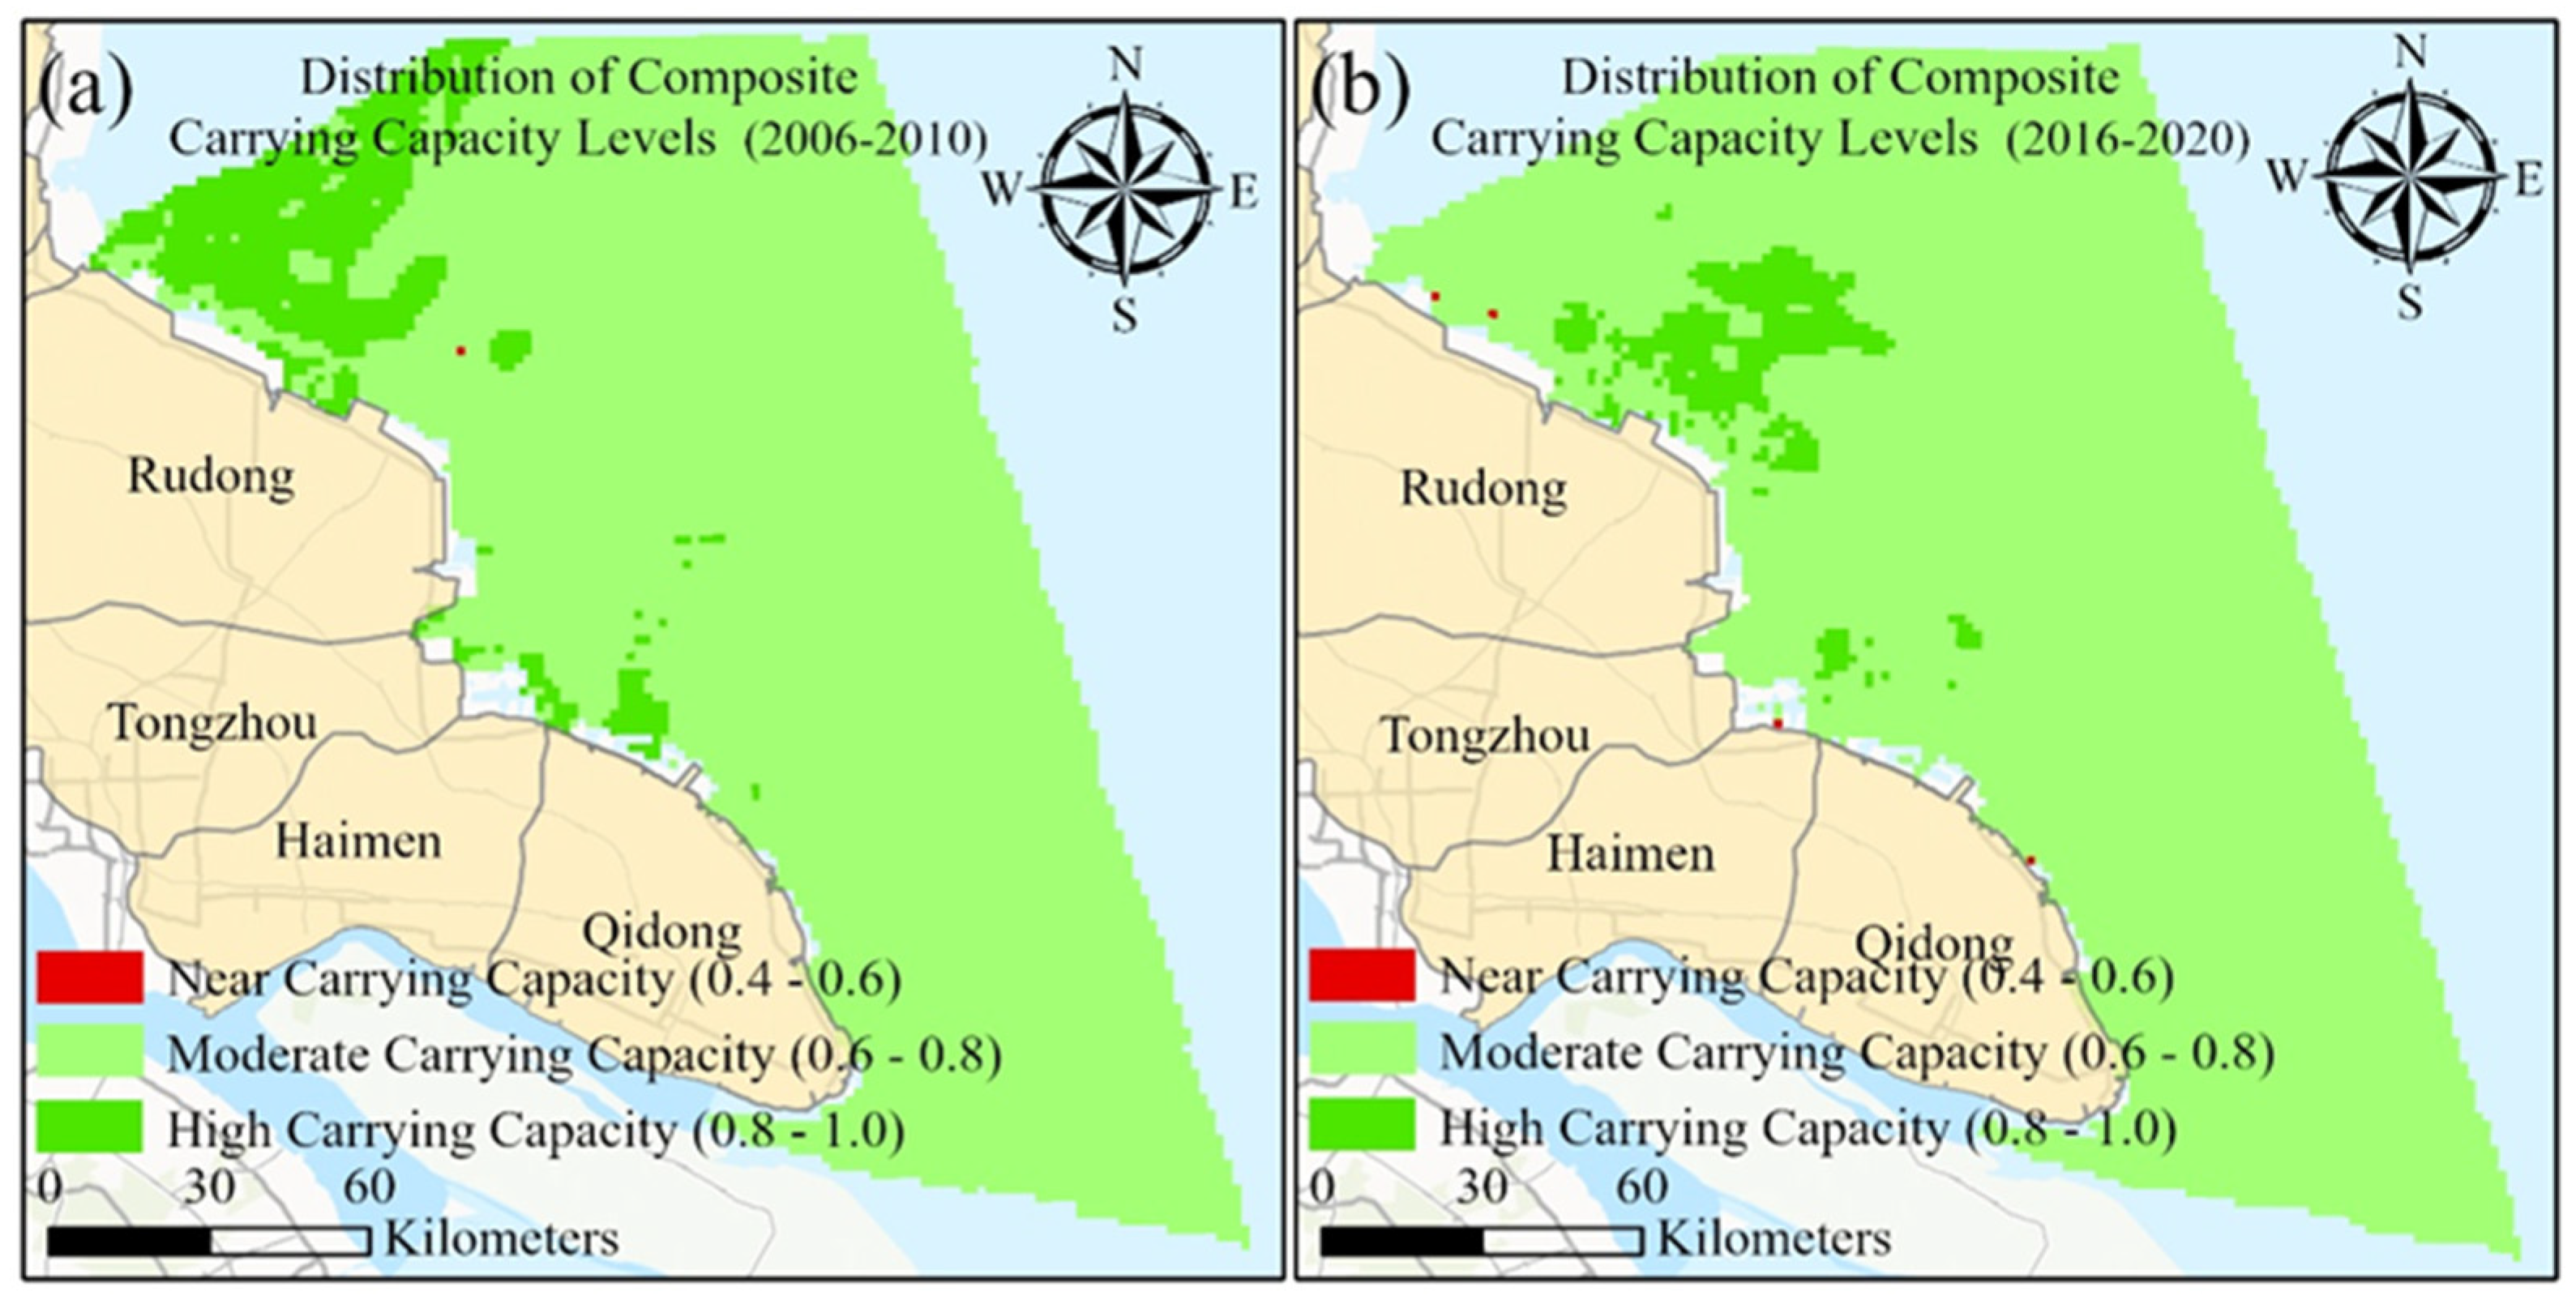
During the 2006–2010 period, the composite marine carrying capacity of the Nantong sea area was higher in the north than in the south. The southern sea area, located near the Yangtze River Estuary, had the lowest overall composite marine carrying capacity. In contrast, the northern sea area, characterized by the Subei Radial Sand Ridges, exhibited the highest overall capacity, while the central Rudong sea area also showed good carrying capacity. Following the period of large-scale coastal development (2016–2020), there was a significant decline in the composite marine carrying capacity in the northern Subei Radial Sand Ridges region. The central sea area maintained good carrying capacity, whereas the southern sea area, particularly the nearshore zones, exhibited the worst composite marine carrying capacity.
The composite marine carrying capacity before the large-scale coastal development (2006–2010) was higher than that after the development (2016–2020). It can be observed that after the large-scale development, the overall composite marine carrying capacity dropped to between 0.70 and 0.80, whereas prior to the development, the values were distributed between 0.75 and 0.85. During the 2006–2010 period, the mean value of the composite marine carrying capacity was approximately 0.78, while in the 2016–2020 period, it was approximately 0.75. The analysis reveals that following the large-scale coastal development, the distribution range of composite marine carrying capacity values widened, indicating the continuous seaward extension of human development; particularly in nearshore areas, the composite ecological carrying capacity exhibited a significant decline (Figure 7b,c).
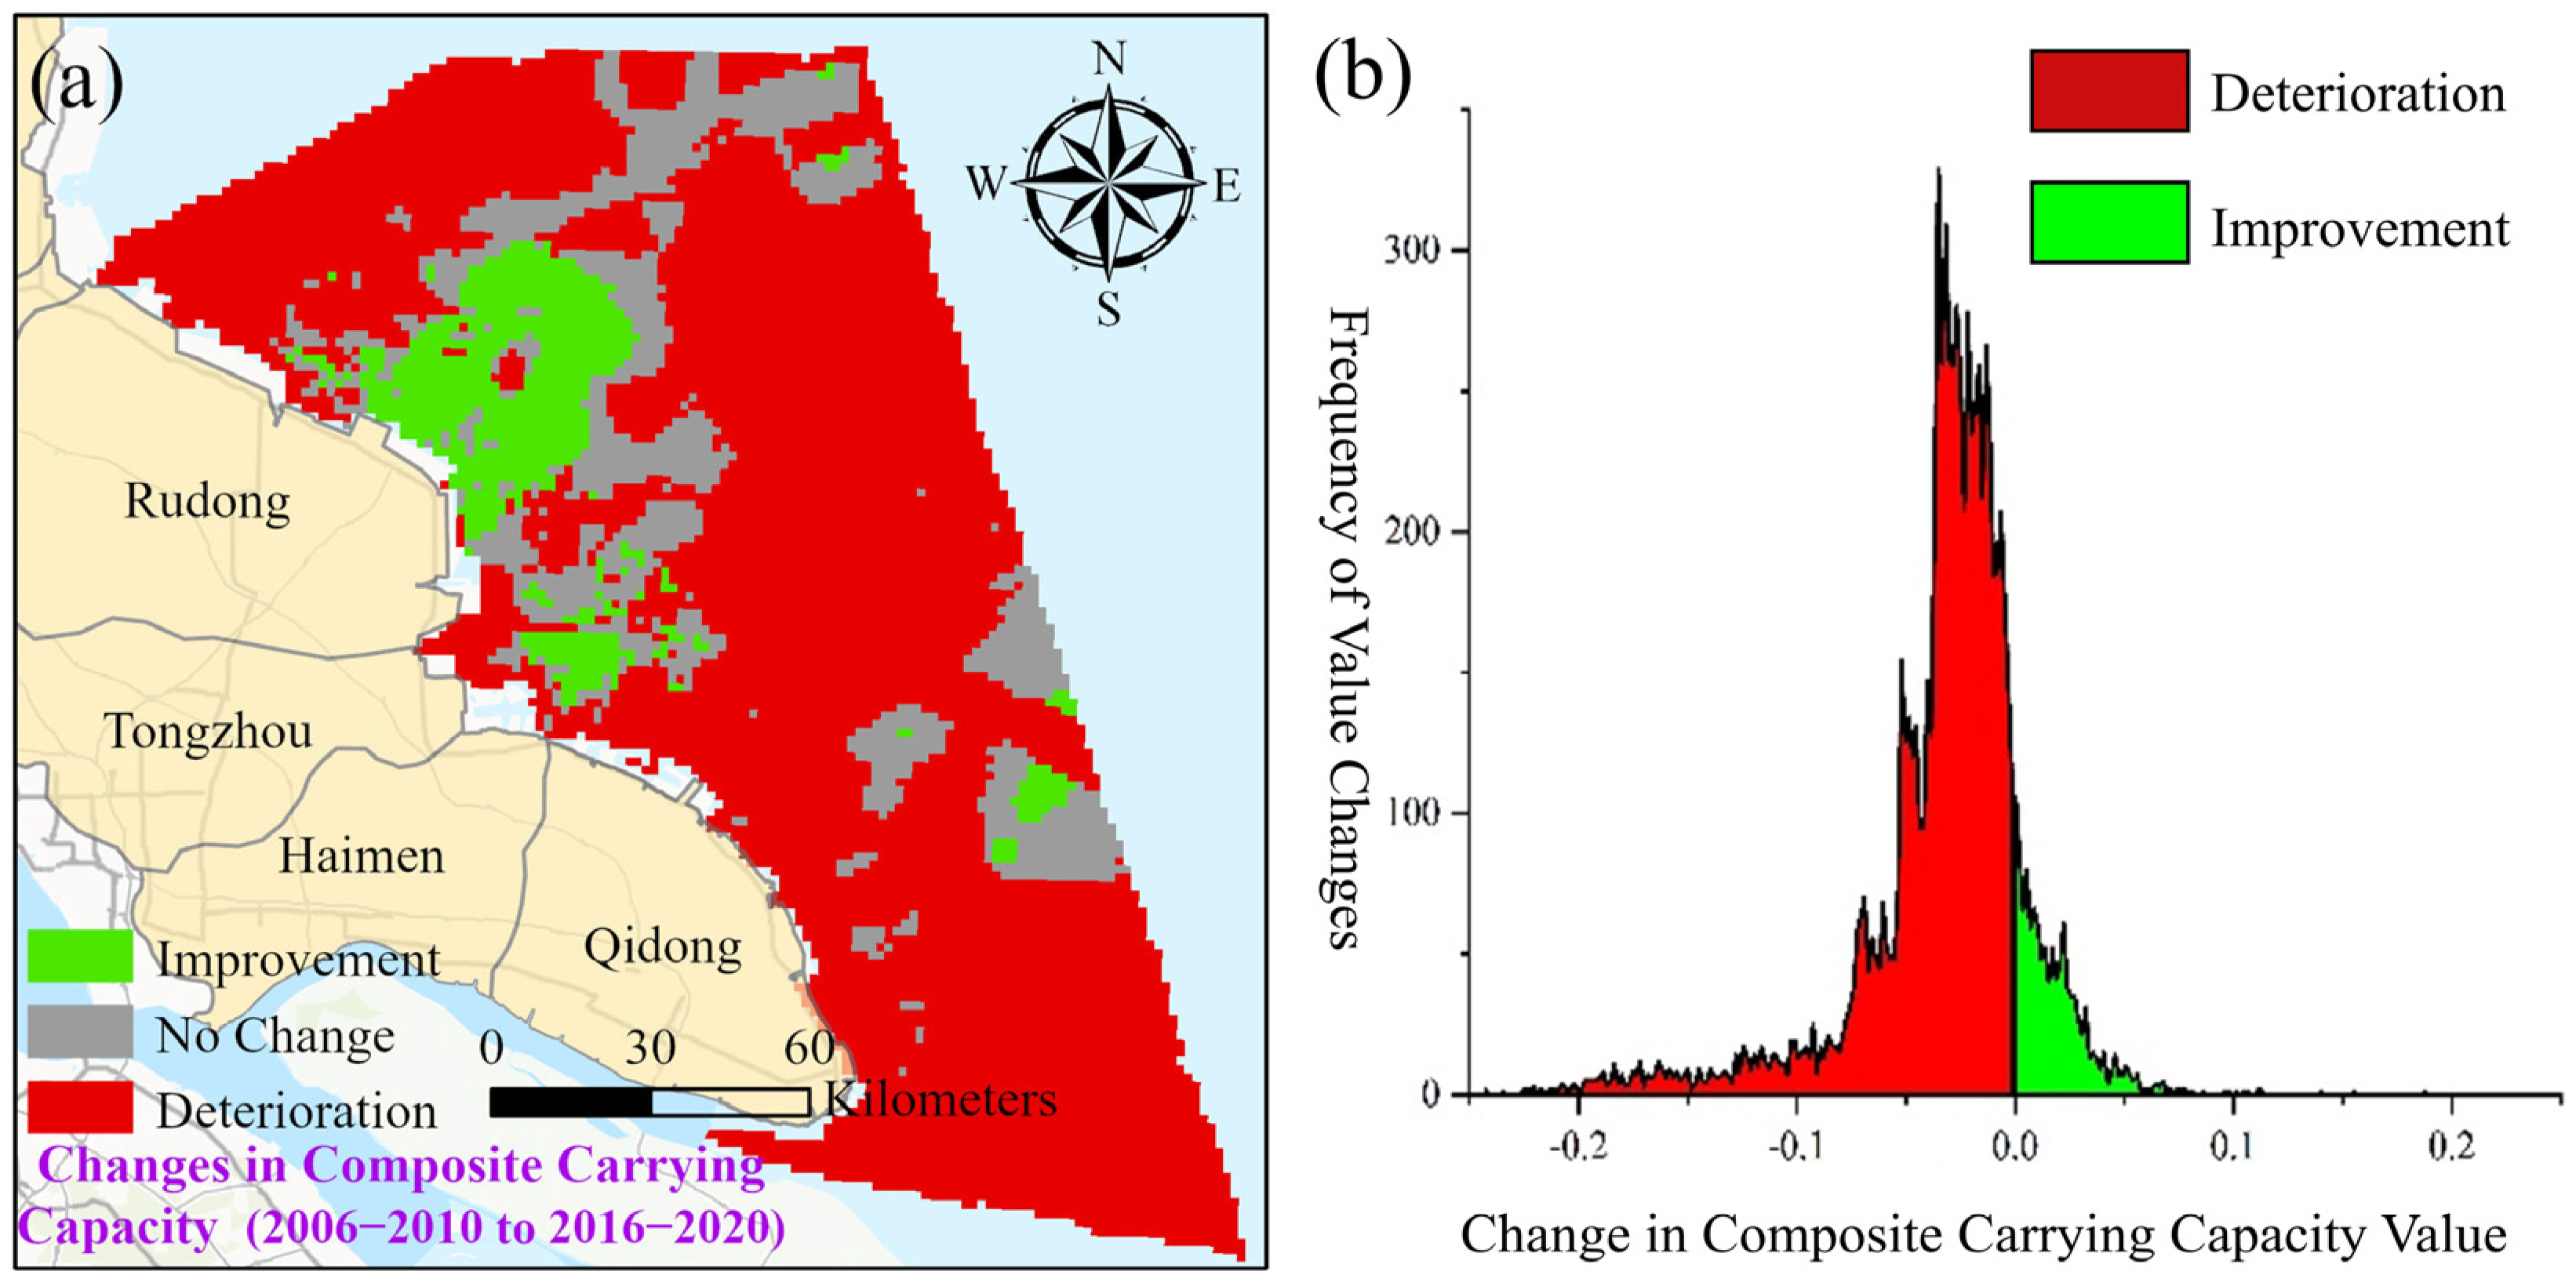
Between the 2006–2010 and 2016–2020 periods, the composite marine carrying capacity of the Nantong sea area exhibited a general downward trend (Figure 8). Only specific regions, such as the southeastern nearshore waters of Rudong, the nearshore areas of Tongzhou Bay, and parts of Qidong, showed signs of improvement (Figure 8a). Notably, the upward trend in the southeastern nearshore waters of Rudong is particularly significant. A buffer zone of “no change” exists between the areas of improvement and deterioration in composite marine carrying capacity, suggesting that the variations in the composite carrying capacity of the ecological environment follow certain patterns; the extensive regions of decline are gradually surrounding the improvement zones, which are showing a shrinking trend toward the center. In terms of numerical changes, the areas of deterioration account for the vast majority, with the magnitude of decline concentrated within a range of 0.1, while the magnitude of improvement remains within 0.05. Specifically, the area proportion of decreased composite marine carrying capacity is 75.06%, the area of improvement accounts for 7.81%, and the unchanged area represents approximately 17.13% (where the range of change between −0.01 and 0.01 is defined as remaining unchanged).

3.3.2. Classification of Composite Marine Carrying Capacity Levels

Based on the Nantong Statistical Yearbook, field investigations, and comprehensive data calculations, factors including environment, ecology, human pressure, and ecological protection management and policies were integrated into the state-space method for analysis. The composite marine carrying capacity levels of the Nantong sea area were systematically classified. Specifically, the composite carrying capacity of the ecological environment in the Nantong sea area was divided into four numerical intervals: 0–0.4, 0.4–0.6, 0.6–0.8, and 0.8–1.0. These intervals respectively correspond to the following status levels: Overloaded, Near Carrying Capacity, Moderate Carrying Capacity, and High Carrying Capacity. This classification framework primarily accounts for marine environmental quality, ecological resources, human activity pressure, and ecological protection management and measures (Table 8).
Regardless of whether it was before (2006–2010) or after (2016–2020) the large-scale coastal development, no overloaded areas were observed within the composite marine carrying capacity of the Nantong sea area. Furthermore, it was found that the areas of high carrying capacity shifted southward and decreased in size. Conversely, the areas classified as near carrying capacity increased, and similarly, the areas of moderate carrying capacity also showed an upward trend in total area.
Furthermore, the majority of the composite marine carrying capacity levels in the Nantong sea area remained unchanged before and after the coastal development (Figure 9), accounting for approximately 87.88% of the total area. The proportions of areas where levels decreased and increased were approximately 8.35% and 3.77%, respectively. Compared to the period before the development (2006–2010), the period after the development (2016–2020) saw an increase of 0.03% in areas of near carrying capacity and 4.36% in moderate carrying capacity, while high carrying capacity areas decreased by 4.39%. This indicates that the large-scale coastal development resulted in a slight reduction in the area of high carrying capacity zones, most of which transitioned into near carrying capacity and moderate carrying capacity zones (Table 9).
Based on the evaluation and corresponding level determination of the composite carrying capacity of the ecological environment before and after the coastal development, the overall magnitude of decline remains within an acceptable range. All carrying capacity levels are at or above the near carrying capacity level, with the majority categorized as moderate carrying capacity. Therefore, since the onset of coastal development, the composite carrying capacity of the ecological environment in the Nantong sea area has remained within a normal range. Emphasizing ecological environmental protection will further promote the sustainable development of the ecological environment in the Nantong sea area.

4. Discussion

4.1. Impact of Different Scenarios on the Assessment of Composite Marine Carrying Capacity

Regarding the deterioration of the marine ecological environment and the intensification of anthropogenic pressure before and after the large-scale coastal development in Nantong, different levels of protection have been established according to various ecological protection targets and requirements. These include wetland reserves, forest parks, rare bird nature reserves, and marine parks. These measures are primarily intended to protect key fishery spawning grounds, critical tidal wetlands, shallow sea waters, important estuaries, and islands, as well as to prevent sand source loss, maintain biodiversity, and conserve water resources (Table 10).
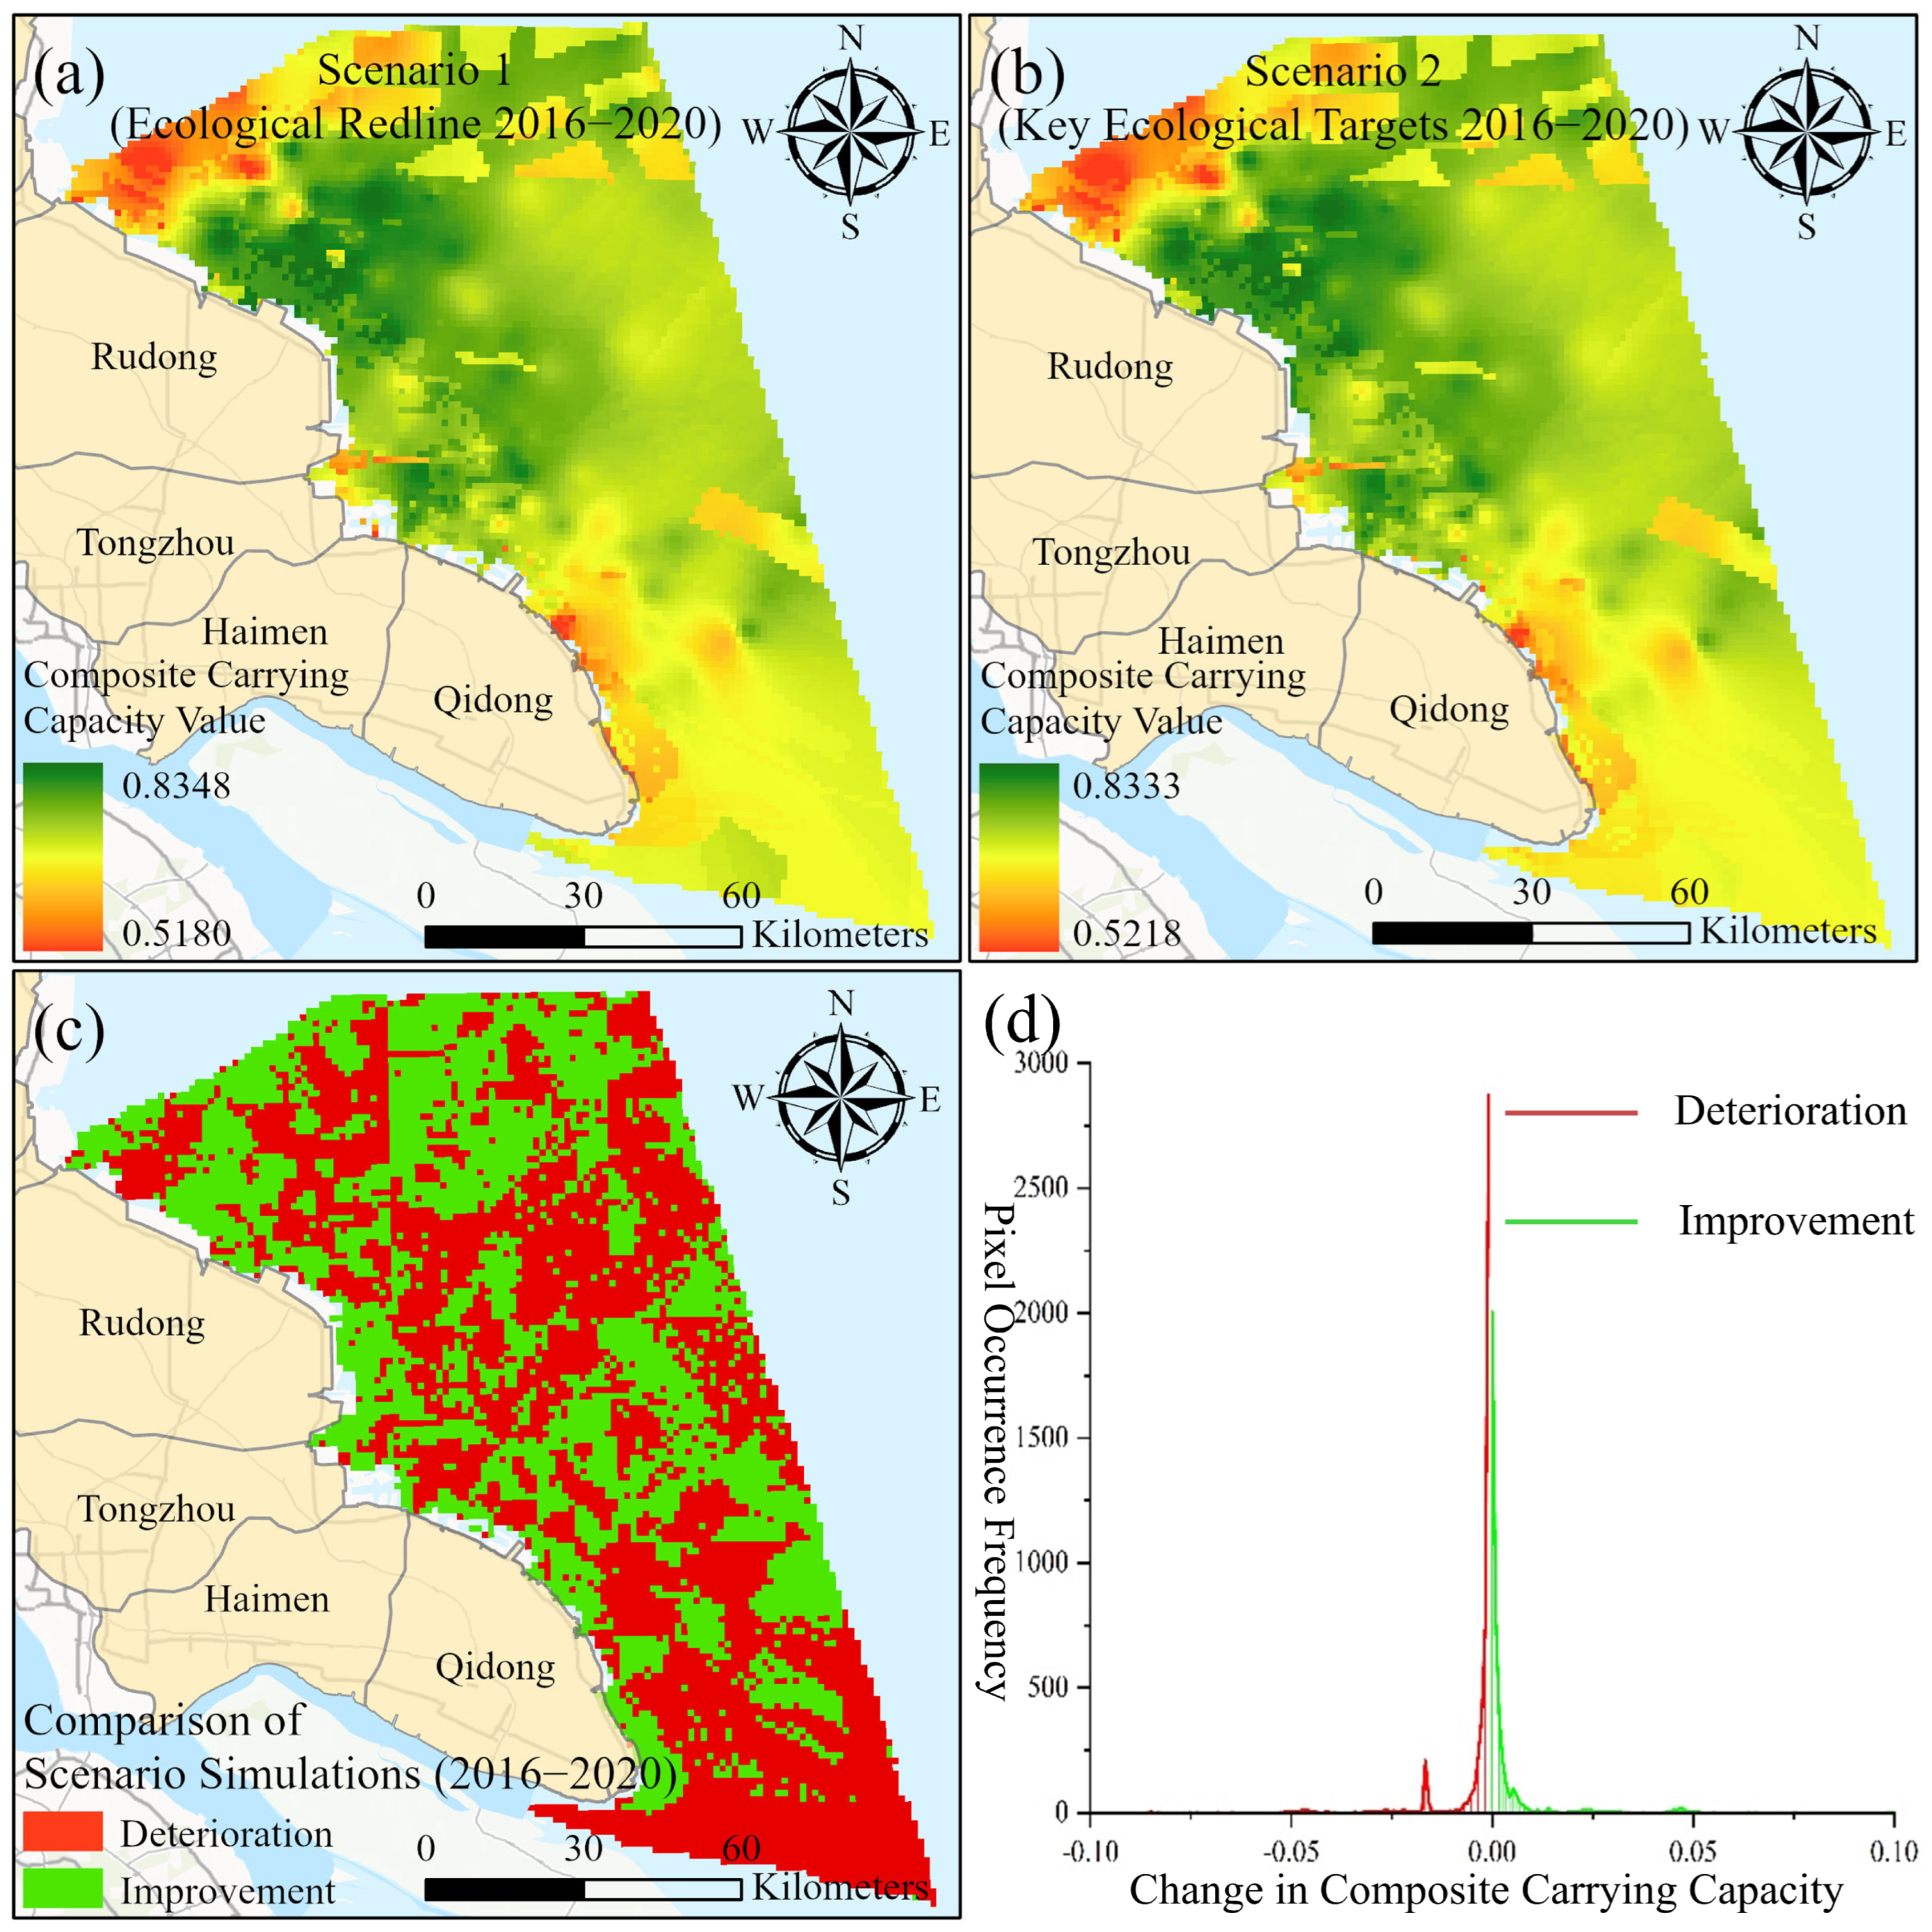
The study established different levels of protection for existing protected areas, habitats of endangered birds, important coastal wetlands, important fishery resource areas, and coastal tidal wetlands in the Nantong sea area. These settings aim to avoid or mitigate the impact of anthropogenic pressure and enhance the composite carrying capacity of the marine ecological environment [27]. Following the full implementation of the marine ecological redline in Jiangsu Province in 2016, this research investigates two scenarios based on either the ecological redline or a broader set of protection targets and objectives. It explores the response of marine ecological environmental protection and management under the current ecological redline status, as well as the spatial distribution of these responses under a more comprehensive consideration of ecological protection.
The results show that the difference in the composite marine carrying capacity between the two scenarios is minimal, and the overall conditions are basically consistent. This indicates that the current ecological redline can effectively cover all key ecological protection targets. Furthermore, it demonstrates that the marine ecological environmental protection and management measures in Nantong have been scientific and effective since the onset of coastal development (Figure 10).
If the management shifts from being based on the current ecological redline to the protection and management of key ecological targets, the composite carrying capacity of the ecological environment will exhibit deterioration. However, the range of change is concentrated between −0.01 and 0.01, indicating that the overall change is insignificant. The current ecological redline is broad; therefore, whether it can achieve effective protection targeted at key ecological elements is crucial for further promoting marine ecological conservation and the development of the marine economy.

4.2. Investigation of Influencing Factors of Composite Marine Carrying Capacity

Since the onset of coastal development, the environment, ecology, and composite marine carrying capacity of the Nantong sea area have undergone dramatic changes. Through carrying capacity assessment and analysis, it is possible to evaluate whether human activities have reached a state of being carrying, full load, or overloaded. The evaluation of composite marine carrying capacity must consider multiple dimensions, including ecological–environmental status, anthropogenic pressure, and ecological protection and management response. Based on existing research, ecological–environmental status and its capacity show a positive correlation with ecological protection and management response, while anthropogenic pressure exhibits a certain negative correlation with carrying capacity.
The influencing factors of composite marine carrying capacity in nearshore waters are multi-source. Firstly, the evaluation of composite marine carrying capacity involves ecology, environment, human activities, management policies, and other aspects, making the comprehensively evaluated capacity all-encompassing; therefore, the investigation of influencing factors cannot be generalized. This study selected the 2006–2010 and 2016–2020 periods for the evaluation primarily due to the coastal development strategy of Jiangsu Province. After 2010, Nantong entered a phase of large-scale offshore development, leading to a sudden intensification of anthropogenic pressure, which inevitably affected the marine ecological–environmental quality and, consequently, the corresponding carrying capacity [28].
The study found that during 2016–2020, the carrying capacity of the Subei Radial Sand Ridges in northern Nantong declined rapidly. This was mainly due to the intensification of tidal flat aquaculture, which caused ecological–environmental issues that led to a reduction in composite marine carrying capacity [29]. Secondly, the construction of offshore renewable energy in Nantong affected the carrying capacity to some extent, though the impact was not significant. The primary cause of decline remains nearshore marine engineering, particularly the construction of various non-permeable structures. Meanwhile, the composite marine carrying capacity in the southern Nantong sea area has remained consistently low. This is likely due to the socio-economic radiation impacts from the upper reaches of the Yangtze River on its northern branch, along with natural factors related to river discharge into the sea [30,31].
In comparison with other typical coastal deltas in China, the spatiotemporal evolution of marine carrying capacity in Nantong exhibits unique characteristics. For instance, in the Pearl River Delta [8], the decline in carrying capacity was primarily driven by rapid industrial urbanization and land reclamation in the early 2000s. In contrast, the decline in northern Nantong (Subei Radial Sand Ridges) is more closely linked to the recent intensification of offshore renewable energy and large-scale aquaculture [29]. Similarly, research in the Yellow River Delta [17] indicates that ecosystem health is highly sensitive to sediment discharge and salinity variations, whereas Nantong’s composite capacity is more resilient but faces higher anthropogenic pressure from intensive marine engineering. These regional differences underscore the importance of tailored ecological redline policies for different delta systems.

4.3. Limitations and Prospects of Composite Marine Carrying Capacity Evaluation

The coastal zone is the region where land–sea interactions and human–ocean interactions are most complex and frequent [32]. The evaluation of composite marine carrying capacity serves as the foundation for effective ecological protection, environmental resource exploitation, and socio-economic development [9]. In this study, there are still gaps in the collection and evaluation of marine socio-economic data. Furthermore, future research involving multi-scenario predictions of marine ecological–environmental carrying capacity would be significant for marine spatial planning, as it could effectively assist in controlling resource development intensity, ecological protection efforts, and the sustainability of collaborative development. Based on past research and the results of this study, the following two prospects are proposed for future research.
(1) Future research should determine how to effectively represent statistical yearbooks, government documents, and other paper or electronic report data and how to spatialize these data scientifically and reasonably. In short, this involves the extension and expansion of data from one-dimensional to two-dimensional, three-dimensional, and multi-dimensional forms. Making data “three-dimensional” transforms it into effective information for ecological protection and human social development, thereby alleviating the problem of missing marine data.
(2) Current results show that the changes in the composite carrying capacity of the marine ecological environment under the direct influence of anthropogenic pressure are entirely within an acceptable range. However, the indirect impacts of human activities affect the health of the marine ecological environment on a large scale, which inevitably impacts the level of composite marine carrying capacity. By integrating global climate change models and utilizing advanced methods such as deep learning for the scientific prediction of carrying capacity, we can assist in current marine spatial planning and provide a key means of verifying the rationality of planning schemes.
Monitoring should be strengthened across multiple aspects, including marine bio-ecology, environmental quality, and marine physical properties [33]. Marine spatial planning measures should be adjusted in real time, and comprehensive evaluations of the marine ecological environment should be conducted promptly [34]. Only then can behaviors harmful to the health of the marine ecological environment be effectively controlled and stopped. Based on ecological environmental protection, scientific and reasonable marine spatial planning schemes should be formulated [35] to achieve the goal of harmonious coexistence between humans and the sea and the sustainable development of marine ecological protection and resource exploitation.

5. Conclusions

This study established a composite evaluation framework based on the PSR model to quantify the marine carrying capacity of Nantong. The main findings are as follows:
(1)
Spatiotemporal Trends: Prior to 2010, the comprehensive carrying capacity was higher in the north than in the south. However, intensive development (2016–2020) caused it to significantly decline in the northern radial sand ridge area, while that in the south remained consistently low due to proximity to the Yangtze River Estuary.
(2)
Anthropogenic Drivers: Offshore renewable energy, intensive aquaculture, and marine engineering are the primary drivers of capacity decline. Despite increased pressure, the overall capacity remains within an acceptable range (“Near Carrying Capacity” or above).
(3)
Management Implications: The current ecological redline policy in Jiangsu Province effectively covers key ecological areas and provides a scientific baseline for sustainable maritime development. Future planning should focus on the synergistic effects of multiple stressors in rapidly developing delta regions.

Author Contributions

Conceptualization, M.X.; Methodology, M.X.; Software, Y.H., Q.W. and L.C.; Data Curation, Q.W., L.C., Y.G. and H.Z.; Investigation, Y.G. and H.Z.; Visualization, Y.H., Q.W. and L.C.; Writing—Original Draft, Y.H.; Writing—Review and Editing, M.X. All authors have read and agreed to the published version of the manuscript.

Funding

This research was funded by Marine Science and Technology Innovation Project of Jiangsu Province (Grant No. JSZRHYKJ202311) and Jiangsu Provincial Innovation Research Program on Carbon Peaking and Carbon Neutrality (BT2025033).

Data Availability Statement

Publicly available datasets were analyzed in this study. The vessel traffic density data were sourced from MarineTraffic (https://www.marinetraffic.com), and the fishing intensity data were obtained from Global Fishing Watch (https://globalfishingwatch.org).

Conflicts of Interest

The authors declare no conflict of interest.

Appendix A

Table A1. Classification of levels for marine environmental carrying capacity evaluation indicators.
Evaluation IndicatorGrade IGrade IIGrade IIIGrade IVGrade V
Marine Eutrophication Index(0, 1](1, 3](3, 9](9, 25](25, +∞)
Seawater Heavy Metal Index(0, 1](1, 2](2, 4](4, 8](8, +∞)
Seawater Petroleum Hydrocarbons Index(0, 0.6](0.6, 1](1, 6](6, 10](10, +∞)
Sediment Total Organic Carbon (TOC) Index(0, 1](1, 2](2, 3](3, 4](4, +∞)
Sediment Heavy Metal Index(0, 1](1, 2](2, 4](4, 8](8, +∞)
Sediment Petroleum Hydrocarbons Index(0, 0.5](0.5, 1](1, 2](2, 3](3, +∞)
Score(0.8, 1](0.6, 0.8](0.4, 0.6](0.2, 0.4][0, 0.2]
Table A2. Evaluation indicators and calculation methods for marine environmental carrying capacity.
Evaluation IndicatorCalculation Method
Water Environment QualityMarine Eutrophication Index E = C C O D × C I P × C I N 4500 (A1)
In the formula, E represents the Marine Eutrophication Index; CCOD, CIN and CIP denote the measured values of chemical oxygen demand (mg/L), dissolved inorganic nitrogen (μg/L), and reactive phosphate (μg/L) in seawater samples, respectively. E > 1 indicates eutrophication, and a higher E value signifies a higher degree of eutrophication.
Seawater Heavy Metal Index P = 1 n i = 1 n C i C 0 i (A2)
In the formula, P represents the Seawater Heavy Metal Index; Ci is the measured concentration of the i-th heavy metal in the seawater sample, and C0i is the evaluation standard value for the i-th heavy metal concentration.
Seawater Petroleum Hydrocarbons Index P = C i C 0 (A3)
In the formula, P represents the Seawater Petroleum Hydrocarbons Index; Ci is the measured concentration of petroleum hydrocarbons in the seawater sample, and C0 is the evaluation standard value for petroleum hydrocarbon concentration. The evaluation standards are based on the Grade I seawater quality standards in GB 3097-1997 (Sea Water Quality Standard).
Sediment Environment QualitySediment Total Organic Carbon (TOC) IndexThe calculation method is the same as Equation (A3), where P is the Sediment Total Organic Carbon (TOC) Index. Ci is the measured organic carbon content in the sediment sample, and C0 is the evaluation standard value for organic carbon.
Sediment Heavy Metal IndexThe calculation method is the same as Equation (A2). In the formula, P represents the Sediment Heavy Metal Index; Ci is the measured content of the i-th heavy metal in the sediment sample, and C0 is the evaluation standard value for the heavy metal.
Sediment Petroleum Hydrocarbons IndexThe calculation method is the same as Equation (A3). In the formula, P represents the Sediment Petroleum Hydrocarbons Index; Ci is the measured content of petroleum hydrocarbons in the sediment sample, and C0 is the evaluation standard value for petroleum hydrocarbons.
Table A3. Classification of levels for marine ecological carrying capacity evaluation indicators.
Evaluation IndicatorGrade VGrade IVGrade IIIGrade IIGrade I
Marine Phytoplankton Diversity Index(3.5, +∞)(2.5, 3.5](1.5, 2.5](0.5, 1.5](0, 0.5]
Marine Zooplankton Diversity Index(3, 4](2, 3](1, 2](0.5, 1](0, 0.5]
Marine Benthic Organism Biomass (mg/m3)(8, +∞)(4, 8](3, 4](2, 3](0, 2]
Marine Benthic Diversity Index(3.5, +∞)(2.5, 3.5](1.5, 2.5](0.5, 1.5](0, 0.5]
Marine Chlorophyll a(31.4, +∞)(15.7, 31.4](7.85, 15.7](3.95, 7.85](0, 3.95]
Score(0.8, 1](0.6, 0.8](0.4, 0.6](0.2, 0.4][0, 0.2]
Table A4. Evaluation indicators and calculation methods for marine ecological carrying capacity.
Evaluation IndicatorCalculation Method
Ecological ConditionMarine Phytoplankton Diversity IndexThe species diversity index is calculated using the Shannon–Weaner index:
H = i = 1 s P i log 2 P i (A4)
where H′ is the diversity index of the community; Pi
is the proportion of individuals belonging to the i-th species in the sample; if the total number of individuals in the sample is N and the number of individuals of the i-th species is ni, then
Pi = ni/N, and S is the total number of species.
Marine Zooplankton Diversity IndexThe calculation method is the same as Equation (A4).
Marine Benthic Organism Biomass B = W A (A5)
where B is the biomass of benthic organisms, W is the total wet weight of measured benthic individuals (mg), and A is the sampling investigation volume (m3).
Marine Benthic Diversity IndexThe calculation method is the same as Equation (A4).
Marine Chlorophyll aMeasured content of chlorophyll a in seawater samples, with the unit of mg/m3.

References

  1. Zhang, T.; Hu, Q.; Zhou, D.; Gao, W.; Fukuda, H. Ecological carrying capacity evaluation for villages’ spatial planning in rural revitalization strategy in gully regions of the Loess Plateau (China). J. Asian Archit. Build. Eng. 2023, 22, 1746–1762. [Google Scholar] [CrossRef] [Scilit]
  2. Wei, Z.; Jian, Z.; Sun, Y.; Pan, F.; Han, H.; Liu, Q.; Mei, Y. Ecological sustainability and high-quality development of the Yellow River Delta in China based on the improved ecological footprint model. Sci. Rep. 2023, 13, 3821. [Google Scholar] [CrossRef] [Scilit]
  3. MacCready, J.S.; Roggenkamp, E.M.; Gdanetz, K.; Chilvers, M.I. Elucidating the obligate nature and biological capacity of an invasive fungal corn pathogen. Mol. Plant-Microbe Interact. 2023, 36, 411–424. [Google Scholar] [CrossRef] [Scilit]
  4. Xu, N.; Wang, Y.; Huang, C.; Jiang, S.; Jia, M.; Ma, Y. Monitoring coastal reclamation changes across Jiangsu Province during 1984–2019 using landsat data. Mar. Policy 2022, 136, 104887. [Google Scholar] [CrossRef] [Scilit]
  5. Douvere, F. The importance of marine spatial planning in advancing ecosystem-based sea use management. Mar. Policy 2008, 32, 762–771. [Google Scholar] [CrossRef] [Scilit]
  6. Agmour, I.; Achtaich, N.; El Foutayeni, Y. Carrying capacity influence on the incomes of seiners exploiting marine species in the Atlantic coast of Morocco. Math. Biosci. 2018, 305, 10–17. [Google Scholar] [CrossRef] [Scilit]
  7. Feng, Z.M.; Li, P. The genesis and evolution of the concept of carrying capacity: A view of natural resources and environment. J. Nat. Resour. 2018, 33, 1475–1489. [Google Scholar]
  8. Suo, A.; Li, H.; Zhou, W.; Jiao, M.; Zhang, L.; Yue, W. Estimation of ecological carrying capacity of small-scale fish in marine ranch of the Pearl River Estuary, China. Reg. Stud. Mar. Sci. 2023, 61, 102901. [Google Scholar] [CrossRef] [Scilit]
  9. Du, Y.W.; Li, B.Y.; Quan, X.J. Construction and application of DPPD model for evaluating marine resources and environment carrying capacity in China. J. Clean. Prod. 2020, 252, 119655. [Google Scholar] [CrossRef] [Scilit]
  10. Song, D.; Gao, Z.; Zhang, H.; Xu, F.; Zheng, X.; Ai, J.; Hu, X.; Huang, G.; Zhang, H. GIS-based health assessment of the marine ecosystem in Laizhou Bay, China. Mar. Pollut. Bull. 2017, 125, 242–249. [Google Scholar] [CrossRef] [Scilit]
  11. Sun, J.; Miao, J.; Mu, H.; Xu, J.; Zhai, N. Sustainable development in marine economy: Assessing carrying capacity of Shandong province in China. Ocean Coast. Manag. 2022, 216, 105981. [Google Scholar] [CrossRef] [Scilit]
  12. Ma, P.; Ye, G.; Peng, X.; Liu, J.; Qi, J.; Jia, S. Development of an index system for evaluation of ecological carrying capacity of marine ecosystems. Ocean Coast. Manag. 2017, 144, 23–30. [Google Scholar] [CrossRef] [Scilit]
  13. Zheng, L.; Wang, S. Assessing Marine Resource Carrying Capacity: Methods, Economic Impacts, and Management Strategies. Water 2025, 17, 691. [Google Scholar] [CrossRef] [Scilit]
  14. Berger, A.R.; Hodge, R.A. Natural change in the environment: A challenge to the pressure-state-response concept. Soc. Indic. Res. 1998, 44, 255–265. [Google Scholar] [CrossRef] [Scilit]
  15. Neri, A.C.; Dupin, P.; Sánchez, L.E. A pressure–state–response approach to cumulative impact assessment. J. Clean. Prod. 2016, 126, 288–298. [Google Scholar] [CrossRef] [Scilit]
  16. Kelble, C.R.; Loomis, D.K.; Lovelace, S.; Nuttle, W.K.; Ortner, P.B.; Fletcher, P.; Cook, G.S.; Lorenz, J.J.; Boyer, J.N. The EBM-DPSER conceptual model: Integrating ecosystem services into the DPSIR framework. PLoS ONE 2013, 8, e70766. [Google Scholar] [CrossRef] [Scilit]
  17. Wei, C.; Guo, Z.; Wu, J.; Ye, S. Constructing an assessment indices system to analyze integrated regional carrying capacity in the coastal zones—A case in Nantong. Ocean Coast. Manag. 2014, 93, 51–59. [Google Scholar] [CrossRef] [Scilit]
  18. Abdolmaleky, M.; Mahdei, K.N.; Nejatian, P. Environmental sustainability assessment: Potato production in Western Iran. Process Integr. Optim. Sustain. 2022, 4, 1063–1073. [Google Scholar] [CrossRef] [Scilit]
  19. Chen, Z.; Zhang, H.; Zhao, L.; Du, W.; Xu, M. The ecosystem-based marine comprehensive zoning practice and evaluation: A case study of Nantong, China. Ecol. Eng. 2025, 219, 107684. [Google Scholar] [CrossRef] [Scilit]
  20. Chen, Z.; Xu, M.; Zhang, H.; Wang, J.; Liu, Y.; Fang, J. Selection of mariculture sites based on ecological zoning—Nantong, China. Aquaculture 2024, 578, 740039. [Google Scholar] [CrossRef] [Scilit]
  21. Chen, Z.; Chen, Y.; Zhang, H.; Zhang, H.; Xu, M. Understanding spatiotemporal changes and influencing factors in the habitat quality of coastal waters: A case study of Jiangsu Province, China (2006–2020). Ecol. Indic. 2025, 170, 113125. [Google Scholar] [CrossRef] [Scilit]
  22. Zhang, H.; Chen, Z.; Xu, M. An integrated assessment of coastal habitat quality in Nantong, Jiangsu, China. J. Nat. Conserv. 2024, 82, 126756. [Google Scholar] [CrossRef] [Scilit]
  23. Khalil, N.; Kamaruzzaman, S.N.; Baharum, M.R. Ranking the indicators of building performance and the users’ risk via Analytical Hierarchy Process (AHP): Case of Malaysia. Ecol. Indic. 2016, 71, 567–576. [Google Scholar] [CrossRef] [Scilit]
  24. Sutadian, A.D.; Muttil, N.; Yilmaz, A.G.; Perera, B. Using the Analytic Hierarchy Process to identify parameter weights for developing a water quality index. Ecol. Indic. 2017, 75, 220–233. [Google Scholar] [CrossRef] [Scilit]
  25. Yi, Y.U.N. Entropy method for determination of weight of evaluating indicators in fuzzy synthetic evaluation for water quality assessment. J. Environ. Sci. 2006, 18, 1020–1023. [Google Scholar] [CrossRef] [Scilit]
  26. Zhu, Y.; Tian, D.; Yan, F. Effectiveness of entropy weight method in decision-making. Math. Probl. Eng. 2020, 2020, 3564835. [Google Scholar] [CrossRef] [Scilit]
  27. Chen, Z.; Zhang, H.; Xu, M.; Liu, Y.; Fang, J.; Yu, X.; Zhang, S. A study on the ecological zoning of the Nantong coastal zone based on the Marxan model. Ocean Coast. Manag. 2022, 229, 106328. [Google Scholar] [CrossRef] [Scilit]
  28. Jha, D.K.; Wu, M.; Thiruchitrambalam, G.; Marimuthu, P.D. Coastal and marine environmental quality assessments. Front. Mar. Sci. 2023, 10, 1141278. [Google Scholar] [CrossRef] [Scilit]
  29. Shao, K.; Gong, N.; Shen, L.; Han, X.; Wang, Z.; Zhou, K.; Kong, D.; Pan, X.; Cong, P. Why did the world’s largest green tides occur exclusively in the southern Yellow Sea? Mar. Environ. Res. 2024, 200, 106671. [Google Scholar] [CrossRef] [Scilit] [PubMed]
  30. Zheng, J.; Gao, S.; Liu, G.; Wang, H.; Zhu, X. Modeling the impact of river discharge and wind on the hypoxia off Yangtze Estuary. Nat. Hazards Earth Syst. Sci. 2016, 16, 2559–2576. [Google Scholar] [CrossRef] [Scilit]
  31. Li, B.; Chen, N.; Wang, W.; Wang, C.; Schmitt, R.; Lin, A.; Daily, G.C. Eco-environmental impacts of dams in the Yangtze River Basin, China. Sci. Total Environ. 2021, 774, 145743. [Google Scholar] [CrossRef] [Scilit]
  32. McLean, R.F.; Tsyban, A.; Burkett, V.; Codignotto, J.O.; Forbes, D.L.; Mimura, N.; Beamish, R.J.; Ittekkot, V. Coastal zones and marine ecosystems. In Climate Change 2001: Impacts, Adaptation, and Vulnerability. Contribution of Working Group II to the Third Assessment Report of the Intergovernmental Panel on Climate Change; McCarthy, J.J., Canziani, O.F., Leary, N.A., Dokken, D.J., White, K.S., Eds.; Cambridge University Press: Cambridge, UK, 2001; pp. 343–379. [Google Scholar]
  33. Danovaro, R.; Carugati, L.; Berzano, M.; Cahill, A.E.; Carvalho, S.; Chenuil, A.; Corinaldesi, C.; Cristina, S.; David, R.; Dell’ANno, A.; et al. Implementing and innovating marine monitoring approaches for assessing marine environmental status. Front. Mar. Sci. 2016, 3, 213. [Google Scholar] [CrossRef] [Scilit]
  34. Li, W.; Ye, J.; Gao, X.; Zhang, Y.; Li, Y.; Li, H. Integrated ecological quality assessment of the sea area adjacent to the Yellow River estuary under multiple pollutants. Front. Mar. Sci. 2025, 12, 1542611. [Google Scholar] [CrossRef] [Scilit]
  35. Foley, M.M.; Halpern, B.S.; Micheli, F.; Armsby, M.H.; Caldwell, M.R.; Crain, C.M.; Prahler, E.; Rohr, N.; Sivas, D.; Beck, M.W.; et al. Guiding ecological principles for marine spatial planning. Mar. Policy 2010, 34, 955–966. [Google Scholar] [CrossRef] [Scilit]
Figure 1. Overview map of the study area.
Jmse 14 00638 g001
Figure 2. Research flowchart.
Jmse 14 00638 g002
Figure 3. Spatial distribution of relevant indicators for calculating marine environmental carrying capacity. (a-1) Marine Eutrophication Index (2006–2010); (a-2) Marine Eutrophication Index (2016–2020); (b-1) Seawater Heavy Metal Index (2006–2010); (b-2) Seawater Heavy Metal Index (2016–2020); (c-1) Seawater Petroleum Hydrocarbons Index (2006–2010); (c-2) Seawater Petroleum Hydrocarbons Index (2016–2020); (d-1) Sediment Total Organic Carbon (TOC) Index (2006–2010); (d-2) Sediment Total Organic Carbon (TOC) Index (2016–2020); (e-1) Sediment Heavy Metal Index (2006–2010); (e-2) Sediment Heavy Metal Index (2016–2020); (f-1) Sediment Petroleum Hydrocarbons Index (2006–2010); (f-2) Sediment Petroleum Hydrocarbons Index (2016–2020). Note: To better illustrate spatial heterogeneity, the values–which overall fall within a single high-quality grade–have been further subdivided into finer sub-intervals in the legend.
Jmse 14 00638 g003
Figure 4. Spatial distribution of relevant indicators for calculating marine ecological carrying capacity. (a-1) Marine Zooplankton Diversity Index (2006–2010); (a-2) Marine Zooplankton Diversity Index (2016–2020); (b-1) Marine Phytoplankton Diversity Index (2006–2010); (b-2) Marine Phytoplankton Diversity Index (2016–2020); (c-1) Marine Benthic Organism Biomass (mg/m3) (2006–2010); (c-2) Marine Benthic Organism Biomass (mg/m3) (2016–2020); (d-1) Marine Benthic Diversity Index (2006–2010); (d-2) Sediment Total Organic Carbon (TOC) Index (2016–2020); (e-1) Marine Chlorophyll a (2006–2010); (e-2) Marine Chlorophyll a (2016–2020).
Jmse 14 00638 g004
Figure 5. Levels and distribution of changes in marine environmental and ecological carrying capacity in the nearshore waters of Nantong. (a-1) Marine Environmental Carrying Capacity & Levels (2006–2010); (a-2) Marine Environmental Carrying Capacity & Levels (2016–2020); (a-3) Changes in Marine Environmental Carrying Capacity (2006–2020); (b-1) Marine Ecological Carrying Capacity & Levels (2006–2010); (b-2) Marine Ecological Carrying Capacity & Levels (2016–2020); (b-3) Changes in Marine Ecological Carrying Capacity (2006–2020). Note: To better illustrate spatial heterogeneity, the values–which overall fall within a single high-quality grade–have been further subdivided into finer sub-intervals in the legend.
Jmse 14 00638 g005
Figure 6. Spatial distribution of relevant evaluation indicators and anthropogenic pressure. (a-1) Engineering-induced alteration of natural attributes (2006–2010); (a-2) Engineering-induced alteration of natural attributes (2016–2020); (b-1) Vessel traffic density (2006–2010); (b-2) Vessel traffic density (2016–2020); (c-1) Fishing intensity (2006–2010); (c-2) Fishing intensity (2016–2020); (d-1) Anthropogenic pressure (2006–2010); (d-2) Anthropogenic pressure (2016–2020).
Jmse 14 00638 g006
Figure 7. Spatial and numerical distribution of composite marine carrying capacity across different development periods. (a) Spatial distribution of the comprehensive carrying capacity of the marine (2006–2010); (b) Spatial distribution of the comprehensive carrying capacity of the marine (2016–2020); (c) Frequency distribution (pixel occurrence frequency) of the composite carrying capacity values for the periods 2006–2010 and 2016–2020.
Jmse 14 00638 g007
Figure 8. Spatial and numerical change distribution of composite marine carrying capacity. (a) Spatial distribution of changes in composite carrying capacity between 2006–2010 and 2016–2020 (classified into Improvement, No Change, and Deterioration); (b) Frequency distribution of the change in composite carrying capacity values.
Jmse 14 00638 g008
Figure 9. Distribution of composite marine carrying capacity levels in the Nantong sea area. (a) Distribution of composite carrying capacity levels for the period 2006–2010; (b) Distribution of composite carrying capacity levels for the period 2016–2020.
Jmse 14 00638 g009
Figure 10. Assessment and comparative analysis of composite marine carrying capacity under different protection scenarios along the Nantong coast. (a) Spatial distribution of composite carrying capacity under Scenario 1 (Ecological Redline); (b) Spatial distribution of composite carrying capacity under Scenario 2 (Key Ecological Targets); (c) Spatial comparison of the two scenario simulations, showing areas of improvement and deterioration; (d) Frequency distribution (pixel occurrence frequency) of the changes in composite carrying capacity values between the two scenarios.
Jmse 14 00638 g010
Table 2. Coefficients of the degree of impact of nearshore marine engineering on the natural attributes of sea areas.
Primary CategorySecondary CategoryDegree of Impact on Natural Attributes
Land reclamationConstruction-based land reclamation5
StructuresNon-permeable structures5
Permeable structures2
EnclosurePort basins, water storage, etc.1
Enclosure aquaculture3
Open useOpen aquaculture1
Dedicated channels, anchorages, and other open uses1
Other modesIntakes and outlets3
Compliant sewage discharge4
Dumping4
Table 3. Assessment indicator system for composite marine carrying capacity in nearshore waters.
Goal LevelSub-Goal LevelElement LevelIndicator Level
Evaluation of composite marine carrying capacityEvaluation of environmental carrying capacityEnvironmental stateMarine Eutrophication Index, Seawater Heavy Metal Index, Seawater Petroleum Hydrocarbons Index
Sediment Total Organic Carbon (TOC) Index, Sediment Heavy Metal Index, Sediment Petroleum Hydrocarbons Index
Evaluation of ecological carrying capacityEcological stateMarine Phytoplankton Diversity Index, Marine Zooplankton Diversity Index, Marine Benthic Organism Biomass, Marine Benthic Diversity Index, Marine Chlorophyll a
Anthropogenic pressure and feedbackHuman pressureLand reclamation, Non-permeable structures, Permeable structures, Port and shipping, Enclosure aquaculture, Open aquaculture, Fishery catching, Sewage discharge, etc.
Management responseMarine protected areas or Ecological redline
Table 4. Scaling and definitions for the judgment matrix.
ScaleDefinition
1Equal importance of two indicators
3Moderate importance of one indicator over the other
5Strong importance of one indicator over the other
7Very strong importance of one indicator over the other
9Extreme importance of one indicator over the other
1, 2, 4, 6, 8Intermediate values used to refine judgments between adjacent scales(1, 2, 4, 6, 8: Intermediate values used for refinement. Note: ‘1’ represents equal importance as defined in the primary scale)
Table 5. Analytic Hierarchy Process judgment matrix for marine environmental carrying capacity.
135135
1/3131/213
1/51/311/31/21
123135
1/3121/313
1/51/311/51/31
Table 6. Analytic Hierarchy Process judgment matrix for marine ecological carrying capacity.
11/31/31/51
311/31/53
3311/33
55315
11/31/31/51
Table 7. Analytic Hierarchy Process judgment matrix for anthropogenic pressure.
15337973
1/51333551
1/31/311/51/311/31/7
1/31/3511331/3
1/71/3311331/5
1/91/511/31/311/31/7
1/71/531/31/3311/5
1/31735751
Table 8. Classification standards for composite marine carrying capacity levels.
CCCCarrying Capacity LevelBasic Characteristics
0.8–1.0High Carrying CapacityAbundant marine ecological resources, good environmental quality, low human activity pressure, and very sufficient ecological environmental protection.
0.6–0.8Moderate Carrying CapacityModerate marine ecological resources and environmental quality, moderate human activity pressure, and reasonable ecological environmental protection.
0.4–0.6Near Carrying CapacityLimited marine ecological resources, basically acceptable environmental quality, relatively high human activity pressure, and a certain degree of ecological environmental protection.
0–0.4Overloaded Scant marine ecological resources, serious marine pollution, excessive human activity pressure, and lack of ecological environmental protection.
Table 9. Proportion of area changes for regions with different composite marine carrying capacity levels.
Overloaded (%)Near (Poor) Carrying Capacity (%)Moderate Carrying Capacity (%)High Carrying Capacity (%)
2006–201000.0190.919.08
2016–202000.0495.274.69
Change0+0.03+4.36−4.39
Table 10. Response weights under different scenarios determined by the Analytic Hierarchy Process judgment matrix.
Sub-GoalMeasuresIndicator LayerWeight Value 1Weight Value 2Scenario 1Scenario 2
ResponseEcological protection and managementProtected areas0.44380.2841Ecological redlineSetting ecological protection measures
Marine park0.06270.0400
Fishery resources0.16450.1507
Important estuaries0.16450.1020
Important tidal flats0.16450.1020
Habitat of endangered birds /0.2136/
Coastal vegetation/0.1076/
Disclaimer/Publisher’s Note: The statements, opinions and data contained in all publications are solely those of the individual author(s) and contributor(s) and not of MDPI and/or the editor(s). MDPI and/or the editor(s) disclaim responsibility for any injury to people or property resulting from any ideas, methods, instructions or products referred to in the content.