Article

Occurrence of Semi-Volatile Organic Compounds in Sediments of the Nerbioi-Ibaizabal Estuary (Bilbao, Spain): Spatial and Temporal Distribution and Ecological Risk Assessment


by
Uxue Uribe-Martinez
1,2,*,
Leire Mijangos
1,
Juan F. Ayala-Cabrera
1,2 and
Alberto de Diego
1,2,*
1
Department of Analytical Chemistry, University of the Basque Country (UPV/EHU), Sarriena Auzoa, 48940 Leioa, Spain
2
Research Centre for Experimental Marine Biology and Biotechnology, University of the Basque Country (PiE-UPV/EHU), Areatza Hiribidea 47, 48620 Plentzia, Spain
*
Authors to whom correspondence should be addressed.
J. Mar. Sci. Eng. 2026, 14(6), 537; https://doi.org/10.3390/jmse14060537
Submission received: 5 February 2026 / Revised: 10 March 2026 / Accepted: 11 March 2026 / Published: 12 March 2026
(This article belongs to the Section Marine Pollution)

Abstract

The occurrence and spatial distribution of polycyclic aromatic hydrocarbons (PAHs), polychlorinated biphenyls (PCBs), organochlorine pesticides (OCPs), fragrances, UV filters and photoinitiators were investigated in surface sediments of Nerbioi-Ibaizabal estuary between 2005 and 2013, in 2020. Samples were extracted by focused ultrasound solid–liquid extraction technique and analyzed by gas chromatography coupled with mass spectrometry. Total PAHs, PCBs, OCPs, musks, UV filters and photoinitiators concentrations ranged between not detected (n.d.) and 43000 ng g−1, n.d. and 2500 ng g−1, n.d. and 820 ng g−1, n.d. and 880 ng g−1, n.d. and 91 ng g−1 and from nd to 120 ng g−1, respectively. Hexachlorocyclohexanes (HCHs) were ubiquitous in the estuary, suggesting that these compounds, although banned, leach from landfills. The PCB concentrations showed a decreasing trend. Ecological risk assessments based on sediment quality guidelines (SQGs) and risk quotient (RQ) suggested semi-volatile organic compounds could represent a potential ecological risk in the Nerbioi-Ibaizabal estuary.

1. Introduction

The intensive use of chemical products in daily and industrial activities has caused an increase in the production of waste as well as an intense emission of both classical and emerging organic compounds into the different environmental compartments [1]. Thus, the aquatic environments, such as estuaries, are, in many cases, the “last sink” of large volumes of many pollutants [2].
Among the pollutants entering estuarine systems, semi-volatile organic compounds (SVOCs) can provoke serious impacts on estuarine organisms. This group of compounds is characterized by low polarity, high stability, low solubility in water and high lipophilicity [3]. Some of them are also persistent and harmful to most biotic groups, tending to bioaccumulate in aquatic organisms and, in the case of certain compounds, even biomagnify along the food chain [4]. In addition, some of them such as polycyclic aromatic hydrocarbons (PAHs), polychlorinated biphenyls (PCBs) and organochlorine pesticides (OCPs) have been classified as priority substances by the Water Framework Directive [5] due to their potentially adverse effects on the health of wildlife and humans. In addition, the growing number of chemicals registered in recent decades has increased concern about their potential effects on human health and the environment, driving interest in emerging contaminants (ECs). This increase is reflected in the rapid growth of the Chemical Abstracts Service Registry, which grew from 20 million substances in 2002 to more than 204 million in 2023. Although not all of these substances pose a risk, their continued incorporation, at a rate of about 15,000 new substances per day, highlights the need to assess their behaviour and potential environmental impacts [6,7].
In aquatic environments, different types of SVOCs tend to be adsorbed into both organic and inorganic small particles (<63 μm) that eventually settle to the bottom sediments [4]. As some compounds can be trapped almost permanently, while others can be released into the water column under certain circumstances [8], the analysis of the sediments offers an idea of both the degree of accumulated contamination over time at a punctual point and the potential of this matrix as a source of future contamination [9].
The Nerbioi-Ibaizabal estuary, which is located in the North coast of the Iberian Peninsula (Cantabrian coast), have been drastically modified by urban, industrial, and port developments. In the 20th century, the intense industrial activity and the large volume of effluents from different origins (domestic and industrial), caused the environmental collapse of the system [10,11]. However, since the implementation of environmental protection policies, the decrease in industrial activities during the last decades and the implementation of treatment systems, sewerage and wastewater treatment, urban and industrial contamination have been substantially reduced, although the estuary still supports the impact of over one million inhabitants in the surrounding Bilbao metropolitan area [11,12,13].
Previous studies in the area demonstrated that the sediments of the estuary accumulated different types of pollutants [9,14,15,16,17,18] with special focus in heavy metals, PAHs and PCBs. However, in order to obtain a broader and more comprehensive overview of the contamination in the estuary, it is necessary to include a wider range of compounds. Therefore, the aim of this study has been to stablish trendlines from 2005 to 2013, as well as to evaluate the levels corresponding to 2020, for the concentration of several priority (PAHs, PCBs and OCPs) and emerging (fragrances and UV filters) organic contaminants in sediments collected at selected sites covering the tidal part of the Nerbioi-Ibaizabal estuary in January of each year. The results were used to: (i) study the geographical distribution of the selected organic pollutants within the area investigated, (ii) to detect possible trends in the concentration of the selected organic pollutants over time, and (iii) to estimate the toxicity associated with the sediment samples due to the presence of the organic pollutants investigated.

2. Materials and Methods

2.1. Study Area and Sample Collection

The Nerbioi-Ibaizabal estuary has a length of 15 km; it is an urban mesotidal system partially mixed with a semi-diurnal tidal regime [19]. Its main contribution of fresh water comes from the Nerbio-Ibaizabal River (68%), but it also receives fresh water from other four minor tributaries: Kadagua (27%); Galindo (4%); Asua (0.7%) and Gobela (0.3%) [12,20].
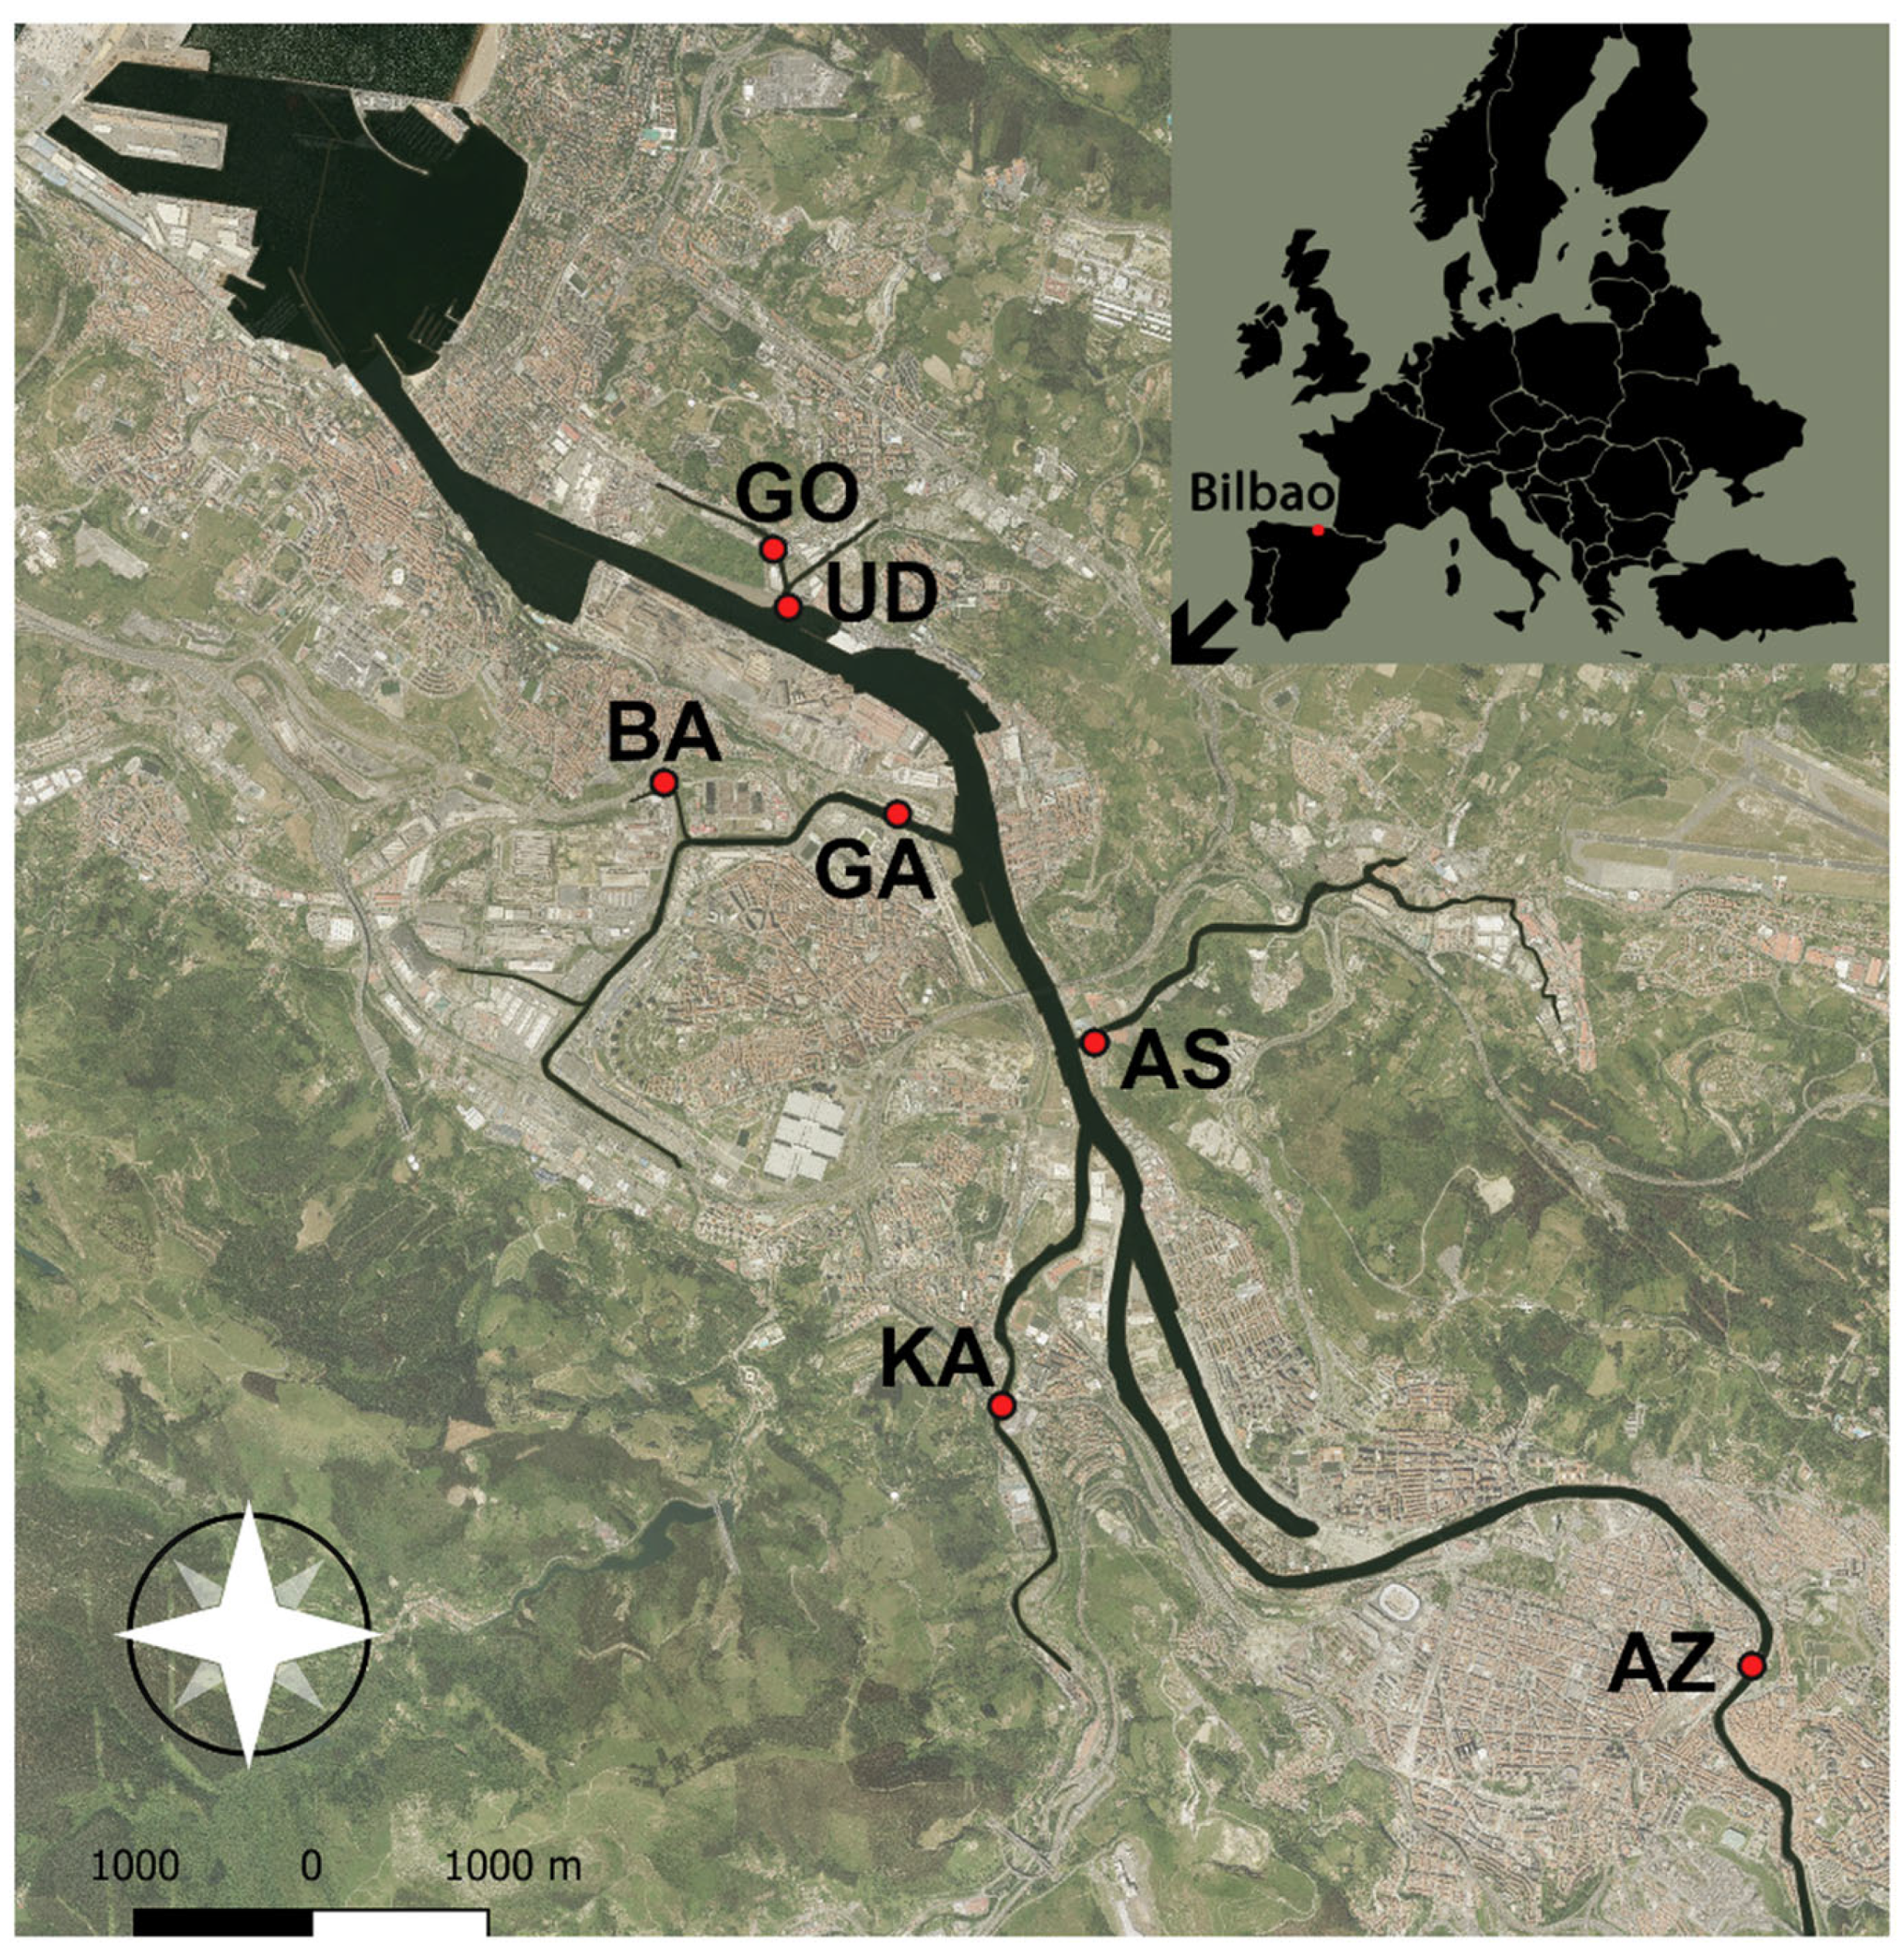
Between 1 and 2 kg of surface sediments (0–2 cm) were collected during low tide, combining several subsamples taken by hand with a spatula within a 1 m × 1 m quadrant. The collection was carried out over ten years in the same sampling month (January 2005, 2006, 2007, 2008, 2009, 2010, 2011, 2012, 2013 and 2020) at the following seven stations: Gobela (GO), Udondo (UD), Galindo (GA), Kadagua (KA), Ballonti (BA), Asua (AS) and Alde Zaharra (AZ) (Figure 1). The samples were transported to the laboratory in clean, airtight plastic bags and kept at 4 °C until analysis. Some samples were accidentally lost or not collected, so we do not have complete series for all the years and/or all the sites.

2.2. Sample Treatment and Analysis

The sediment samples were freeze-dried at −52 °C and 150 mTorr in a Cryodos apparatus (Telslar, Barcelona, Spain), sieved to a maximum particle size of 63 µm and stored in tightly closed borosilicate vials at 4 °C and protected from light until extraction. Samples were treated and analyzed all together as a single batch in 2020. The extraction protocol for the simultaneous determination of PCBs, PAHs, OCPs, fragrances, UV filters, and photoinitiators from sediment samples was carried out following the procedure described by Errekatxo et al. (2008) [21], while the analysis and quantification of the target compounds were performed according to Mijangos et al. (2023) [22]. Briefly, 0.5 g of freeze-dried sediment were extracted by focused ultrasound solid–liquid extraction (FUSLE, Sonoplus HD 3200, Bandelin, Berlin, Germany) with 10 mL of a n-hexane and acetone mixture (1:1 v/v, HPLC grade, 95%, Macron Fine Chemicals, Avantor, Gliwice, Poland). Before the extraction, surrogate standard mixture was added (final concentration of 40 ng g−1). The same mass of activated copper was used to remove sulphur. After extraction, the resultant solutions were reduced to approximately 0.5 mL under a gentle flow of nitrogen (N2 > 99.999% purity, Messer Iberica de Gases SA, Tarragona, Spain). Solid phase extraction clean-up was carried out using 1 g Florisil in 6 mL cartridges (Supelco, Walton-on-Thames, UK). The elution was performed with 12 mL of an n-hexane and toluene mixture (4:1 v/v, HPLC grade, 99.9%, Lab-Scan Analytical Sciences, Gliwice, Poland), followed by 5 mL of ethyl acetate (HPLC grade, Macron Fine Chemicals, Avantor, Poland). The resulting extracts were combined and concentrated until dryness using a Turbo Vap LV evaporator (Zymark, Hopkinton, MA, USA), under a gentle flow of N2 and redissolved to 200 μL of n-hexane.
The analysis of the SVOCs was carried out using a gas chromatograph (Agilent Technologies 7890A, Santa Clara, CA, USA) coupled to a quadrupole mass spectrometer (Agilent Technologies 5975C, Santa Clara, CA, USA) (GC-MS) equipped with an electron ionization (EI) source working at 70 eV, using a HP-5MS (5% phenyl-95% polydimethylsiloxane, Agilent Technologies, Santa Clara, CA, USA) column (30 m × 250 µm × 0.25 µm). The oven temperature was programmed as follows: 60 °C (held 1 min), increase at 3 °C min−1 to 170 °C, increase again at 5 °C min−1 to 300 °C (held 20 min) and a final increase at 30 °C min−1 to 310 °C (held 4 min) [22]. Data were acquired in selected ion monitoring (SIM). For a reliable SVOC identification, retention times and two transitions (one for quantification and one for confirmation) were required while the quantification was based on seven-point external calibration curves (from 1 to 150 ng g−1).
Fifty-two target compounds including the 16 PAHs, 14 PCBs, 11 OCPs, 7 fragrances, 2 UV filters and 2 photoinitiators were analyzed. The list of all compounds is provided in Table S1 included in the Supplementary Materials.

2.3. Quality Assurance and Quality Control

Instrumental limits of quantification (LOQs) were calculated from external calibration curves, with each calibration level injected in triplicate. Instrumental LOQs were defined as the lowest concentration fitted to the calibration curve presenting a relative standard deviation (RSD) below 30% and trueness higher than 70% between the theoretical concentrations and the concentrations estimated from the external calibration curve. Procedural LOQs were estimated by considering the instrumental LOQs, sample pre-treatment, and absolute recoveries.
Blank and spiked sediment samples (100 ng g−1 in original sample) were processed together with the studied samples to evaluate the trueness of the concentrations reported for each analyte, calculating the absolute recoveries of the analytical method (%, n = 3). For PCBs, a certified reference material (CRM) purchased from Sigma-Aldrich (SQC 072-50G, Sigma-Aldrich, Madrid, Spain) was used to evaluate method performance. Apparent recoveries were calculated after the correction of the analyte concentration with the corresponding isotopically labelled compound (Ace-d10, B[a]A-d12, B[a]P-d12, B[ghi]P-d12, DEHP-d4, HCH-d6, Nap-d8, Pyr-d10, and Tonalide-d3). The surrogate used for each target analyte is defined in Table S2. Finally, method repeatability (i.e., intra-day precision) was evaluated by calculating the relative standard deviation (RSD) from three replicate analyses.
SVOCs were not detected in the procedural blanks. The absolute recoveries were in the range of 16–133%, showing satisfactory apparent recoveries after correction with internal standards (70–130%) with optimal repeatability of the method (RSD < 30%). The results from the CRM analysis were within the upper and lower 95% confidence interval reference values for the PCBs analyzed, with mean recoveries of 88.4%. iLOQs and mLOQs values were estimated in the range 1–90 ng g−1 and 1–127 ng g−1, respectively. See Table S2 for more information.

2.4. Ecological Risk Assessment

The concentrations found in the Nerbioi-Ibaizabal estuary sediments were compared with the threshold values of Sediments Quality Guidelines (SQGs) [23]. Additionally, for compounds that did not have a threshold value, risk quotients (RQs) were computed following predicted no-effect concentration (PNEC) derivation approach. For this purpose, the sediment PNEC value (PNECsed) was obtained from the lowest water PNEC value (PNECsw) obtained for several target species representing different trophic levels (algae/bacteria, invertebrates and fish), using the equilibrium partitioning method (EPM), using default values for sediment propierties, applying the following Equation (1) [24,25]:
PNECsed = PNECsw × (0.783 + 0.0217 × Koc)
where PNECsed is expressed in dry weight (ng g−1); PNECsw (μg l−1), and Koc is the partition coefficient between organic carbon and water (l kg−1). For the estimation of PNECsw, the work of Lopez-Herguedas et al., 2022 [26] was followed, where PNECsw values were calculated taking into account the lowest chronic toxicity data (no observed effect concentration, NOEC) collected from the ecotoxicology database (ECOTOX database, https://cfpub.epa.gov/ecotox/, accessed on 10 March 2026) for the trophic levels, divided by an assessment factor (AF). Values not available in the database were obtained using the QSAR models included in the ECOSAR™ v. 2.2 (ECOlogical Structure Activity Relationship) software, in which the lowest toxicity prediction for each taxon was chosen. An AF of 100 was established if only a long-term NOEC value was available, and an AF of 50 and 10 was used if two or three NOECs were available, respectively. Acute toxicity values (lowest EC50 value) were used to calculate PNECs when no chronic NOEC values were found, applying an AF of 1000 [26] (see Table S3). When the calculated RQ was ≥1, a high potential environmental risk was indicated. RQ values between 0.1 and 1 were considered to give rise to moderate risks, and when RQs were <0.1, the environmental risk was considered insignificant

2.5. Statistical Analysis

R version 4.3.0 was used for statistical analyses. Analyses of variance (ANOVA) were performed with α = 0.05 to detect differences between treatments. In cases where normality or homogeneity of variances were not met, non-parametric Kruskal–Wallis tests were applied (p ≤ 0.05).

3. Results

3.1. SVOC Levels and Spatial Distribution in Sediment Samples

The individual concentration of the 33 detected PAH, PCB, OCPs, fragrances, UV filters and photoinitiators in sediment samples of Nerbioi-Ibaizabal estuary are presented in Table S3. The results for OCPs are only presented for hexachlorocyclohexane (HCHs), because Dichlorodiphenyltrichloroethane (DDT) and its transformation products, tebufenpyrad, chlorphenvynphos and tetraconazole were below detection limits in all samples analyzed. The total concentrations measured ranged from not detected (n.d.) to 43,000 ng g−1 d.w. for ΣPAHs, from n.d. to 2500 ng g−1 d.w. for ΣPCBs, from n.d. to 820 ng g−1 d.w. for ΣHCH, from n.d. to 880 ng g−1 d.w. for Σfragrances, from n.d. to 91 ng g−1 for 2-ethylhexyl 4-(dimethylamino)benzoate (the only UV filter detected) and from nd to 120 ng g−1 d.w. for Σphotoinitiators (Table S4).
Table 1 shows the averages within sampling campaigns of the sum of the concentrations of all individuals detected for each family. The highest amounts of PAHs were found in UD with a mean sum of concentrations of 16,000 ng g−1 d.w. The UD sampling site is located on a semi-enclosed dock near, but protected from, the mouth of the Gobela tributary, on the right side of the estuary. The lowest concentrations were found in AZ with mean sum of concentrations of 7000 ng g−1. Due to the high dispersion of the results, no significant difference was found within sampling stations (p > 0.05) after one-way Kruskal–Wallis test.
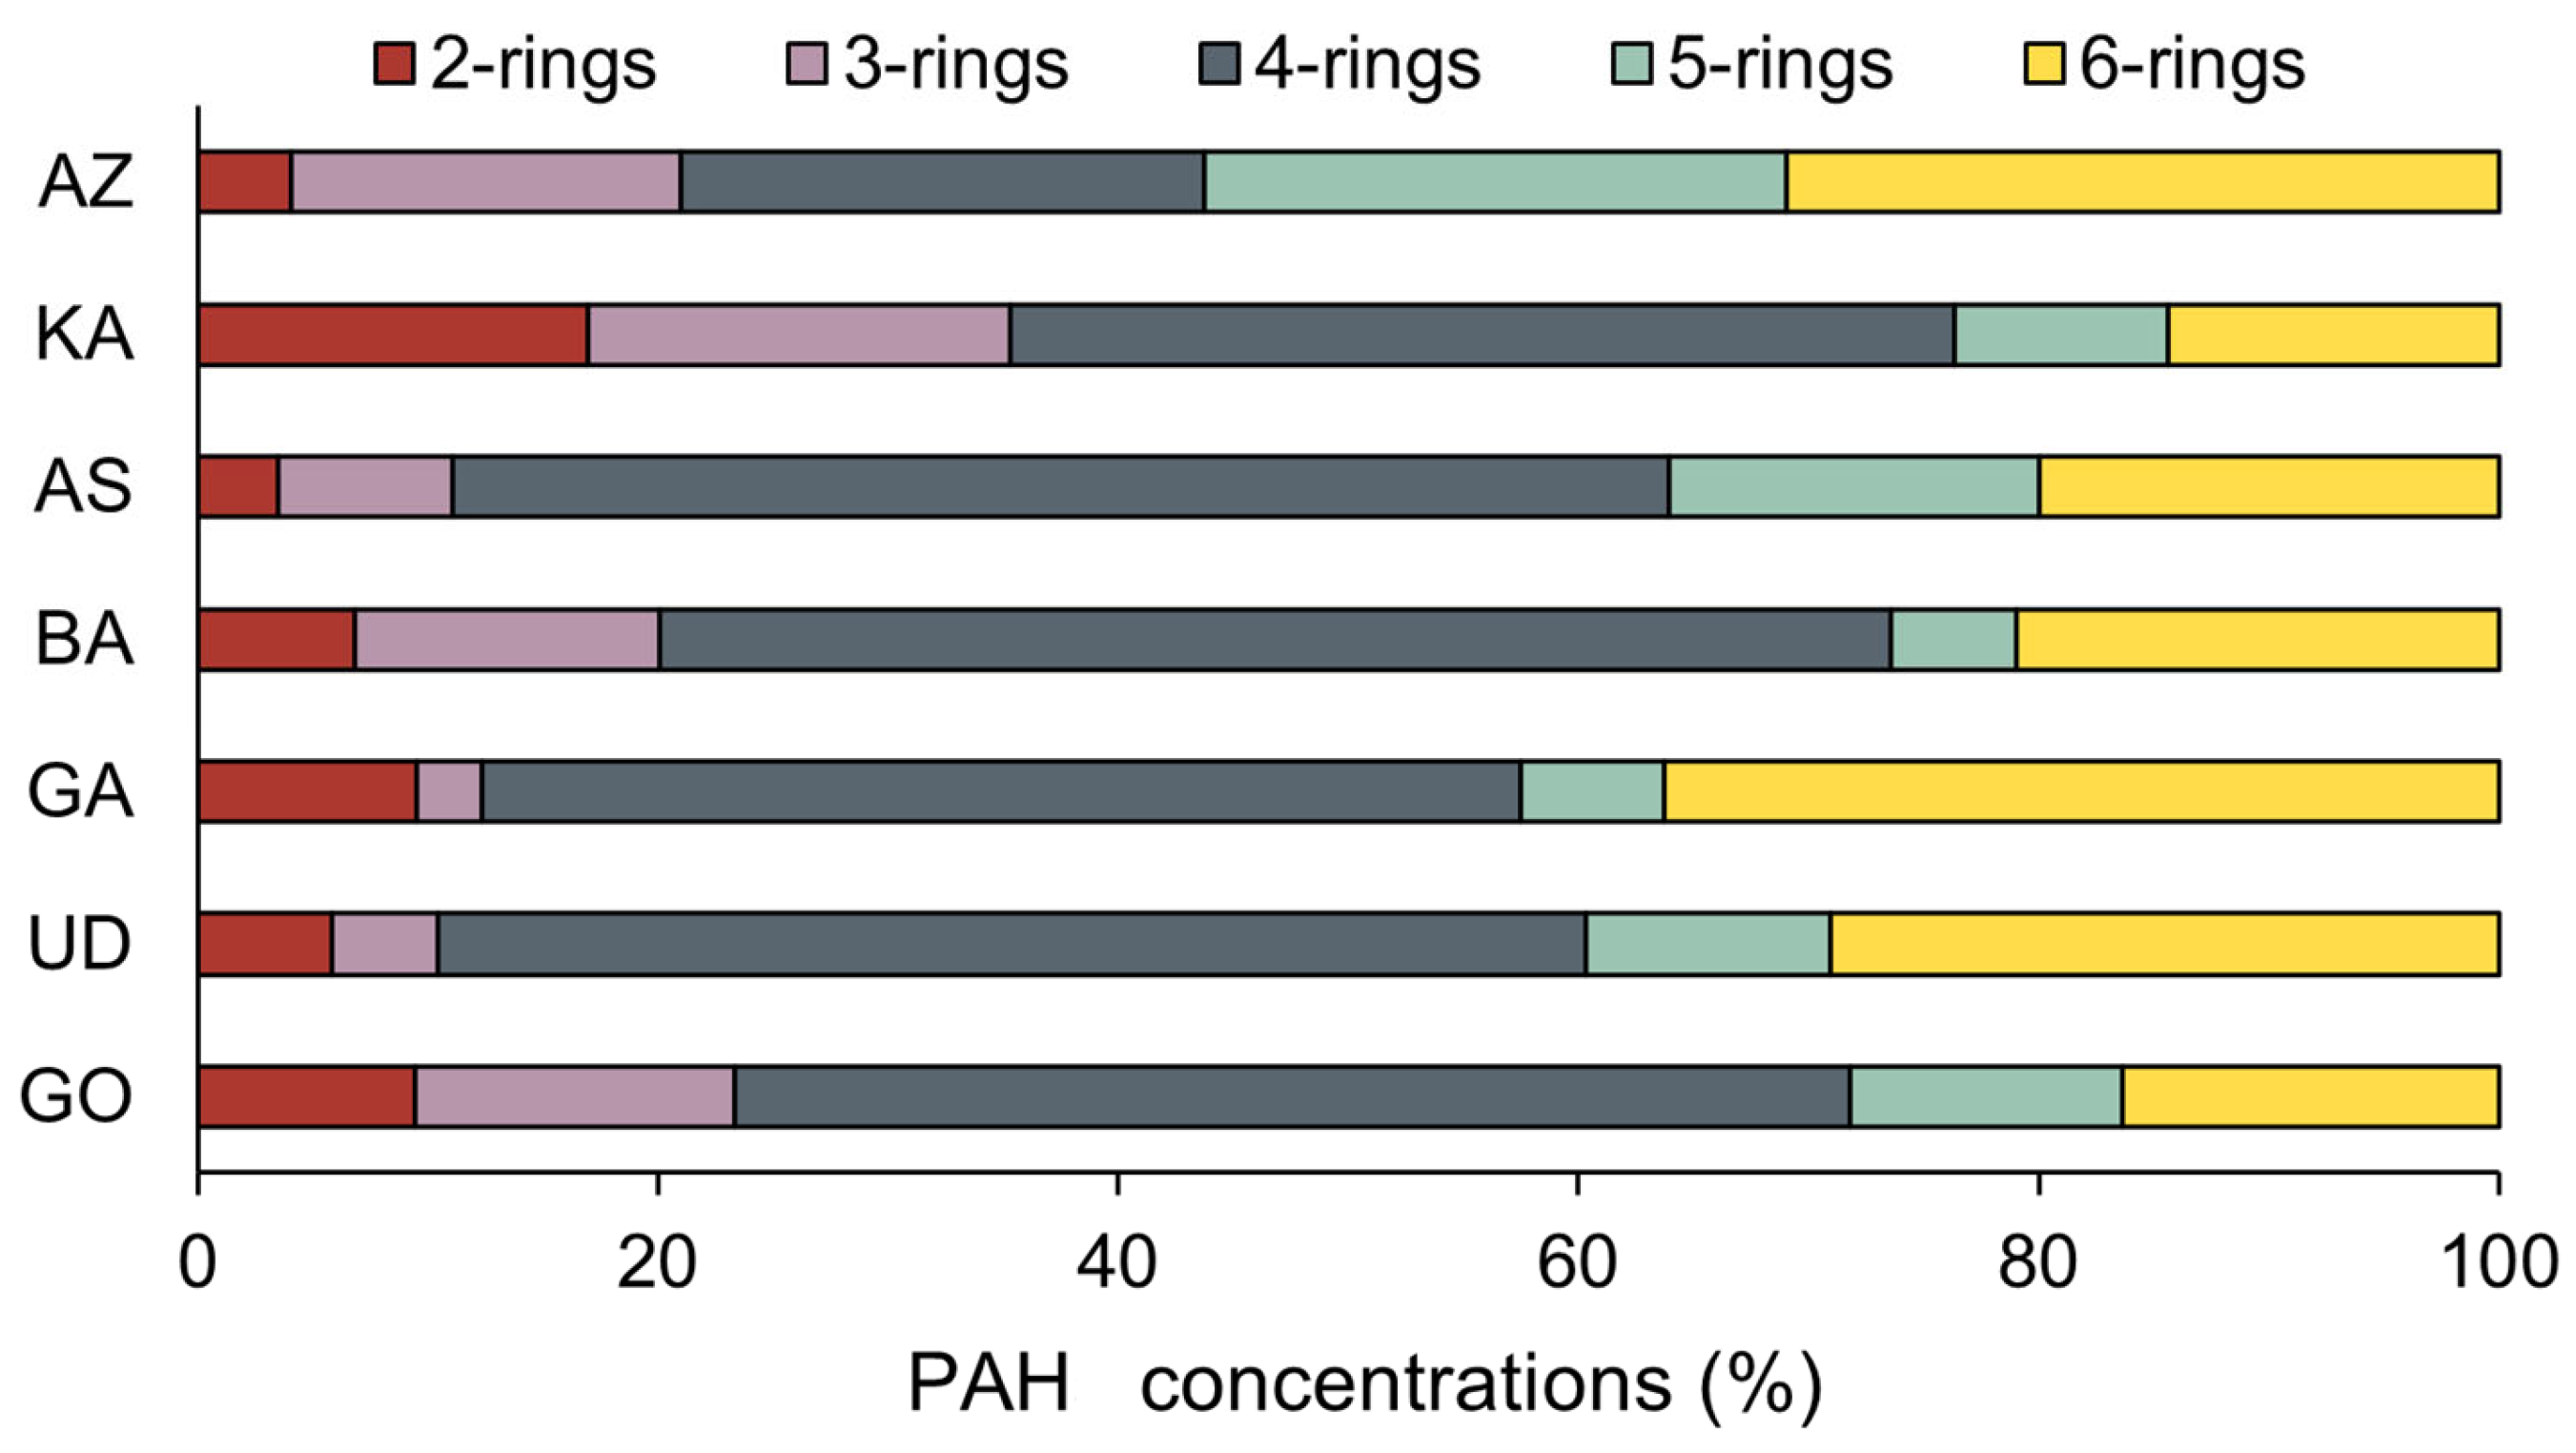
Figure 2 shows the distribution of PAHs by ring size accumulated in the sediments of each sampling point. The concentration of high molecular weight PAHs (HMW with ≥4 aromatic rings) was higher than the concentration of low molecular weight PAHs (LMW with two and three aromatic rings). As illustrated in the figure, this distribution appears to be rather homogeneous. Medium molecular weight PAHs (four-ring PAHs) dominated in six points of the Nerbioi-Ibaizabal estuary (KA, AS, BA, GA, UD, and GO). In AZ, PAHs with five and six rings were predominant.
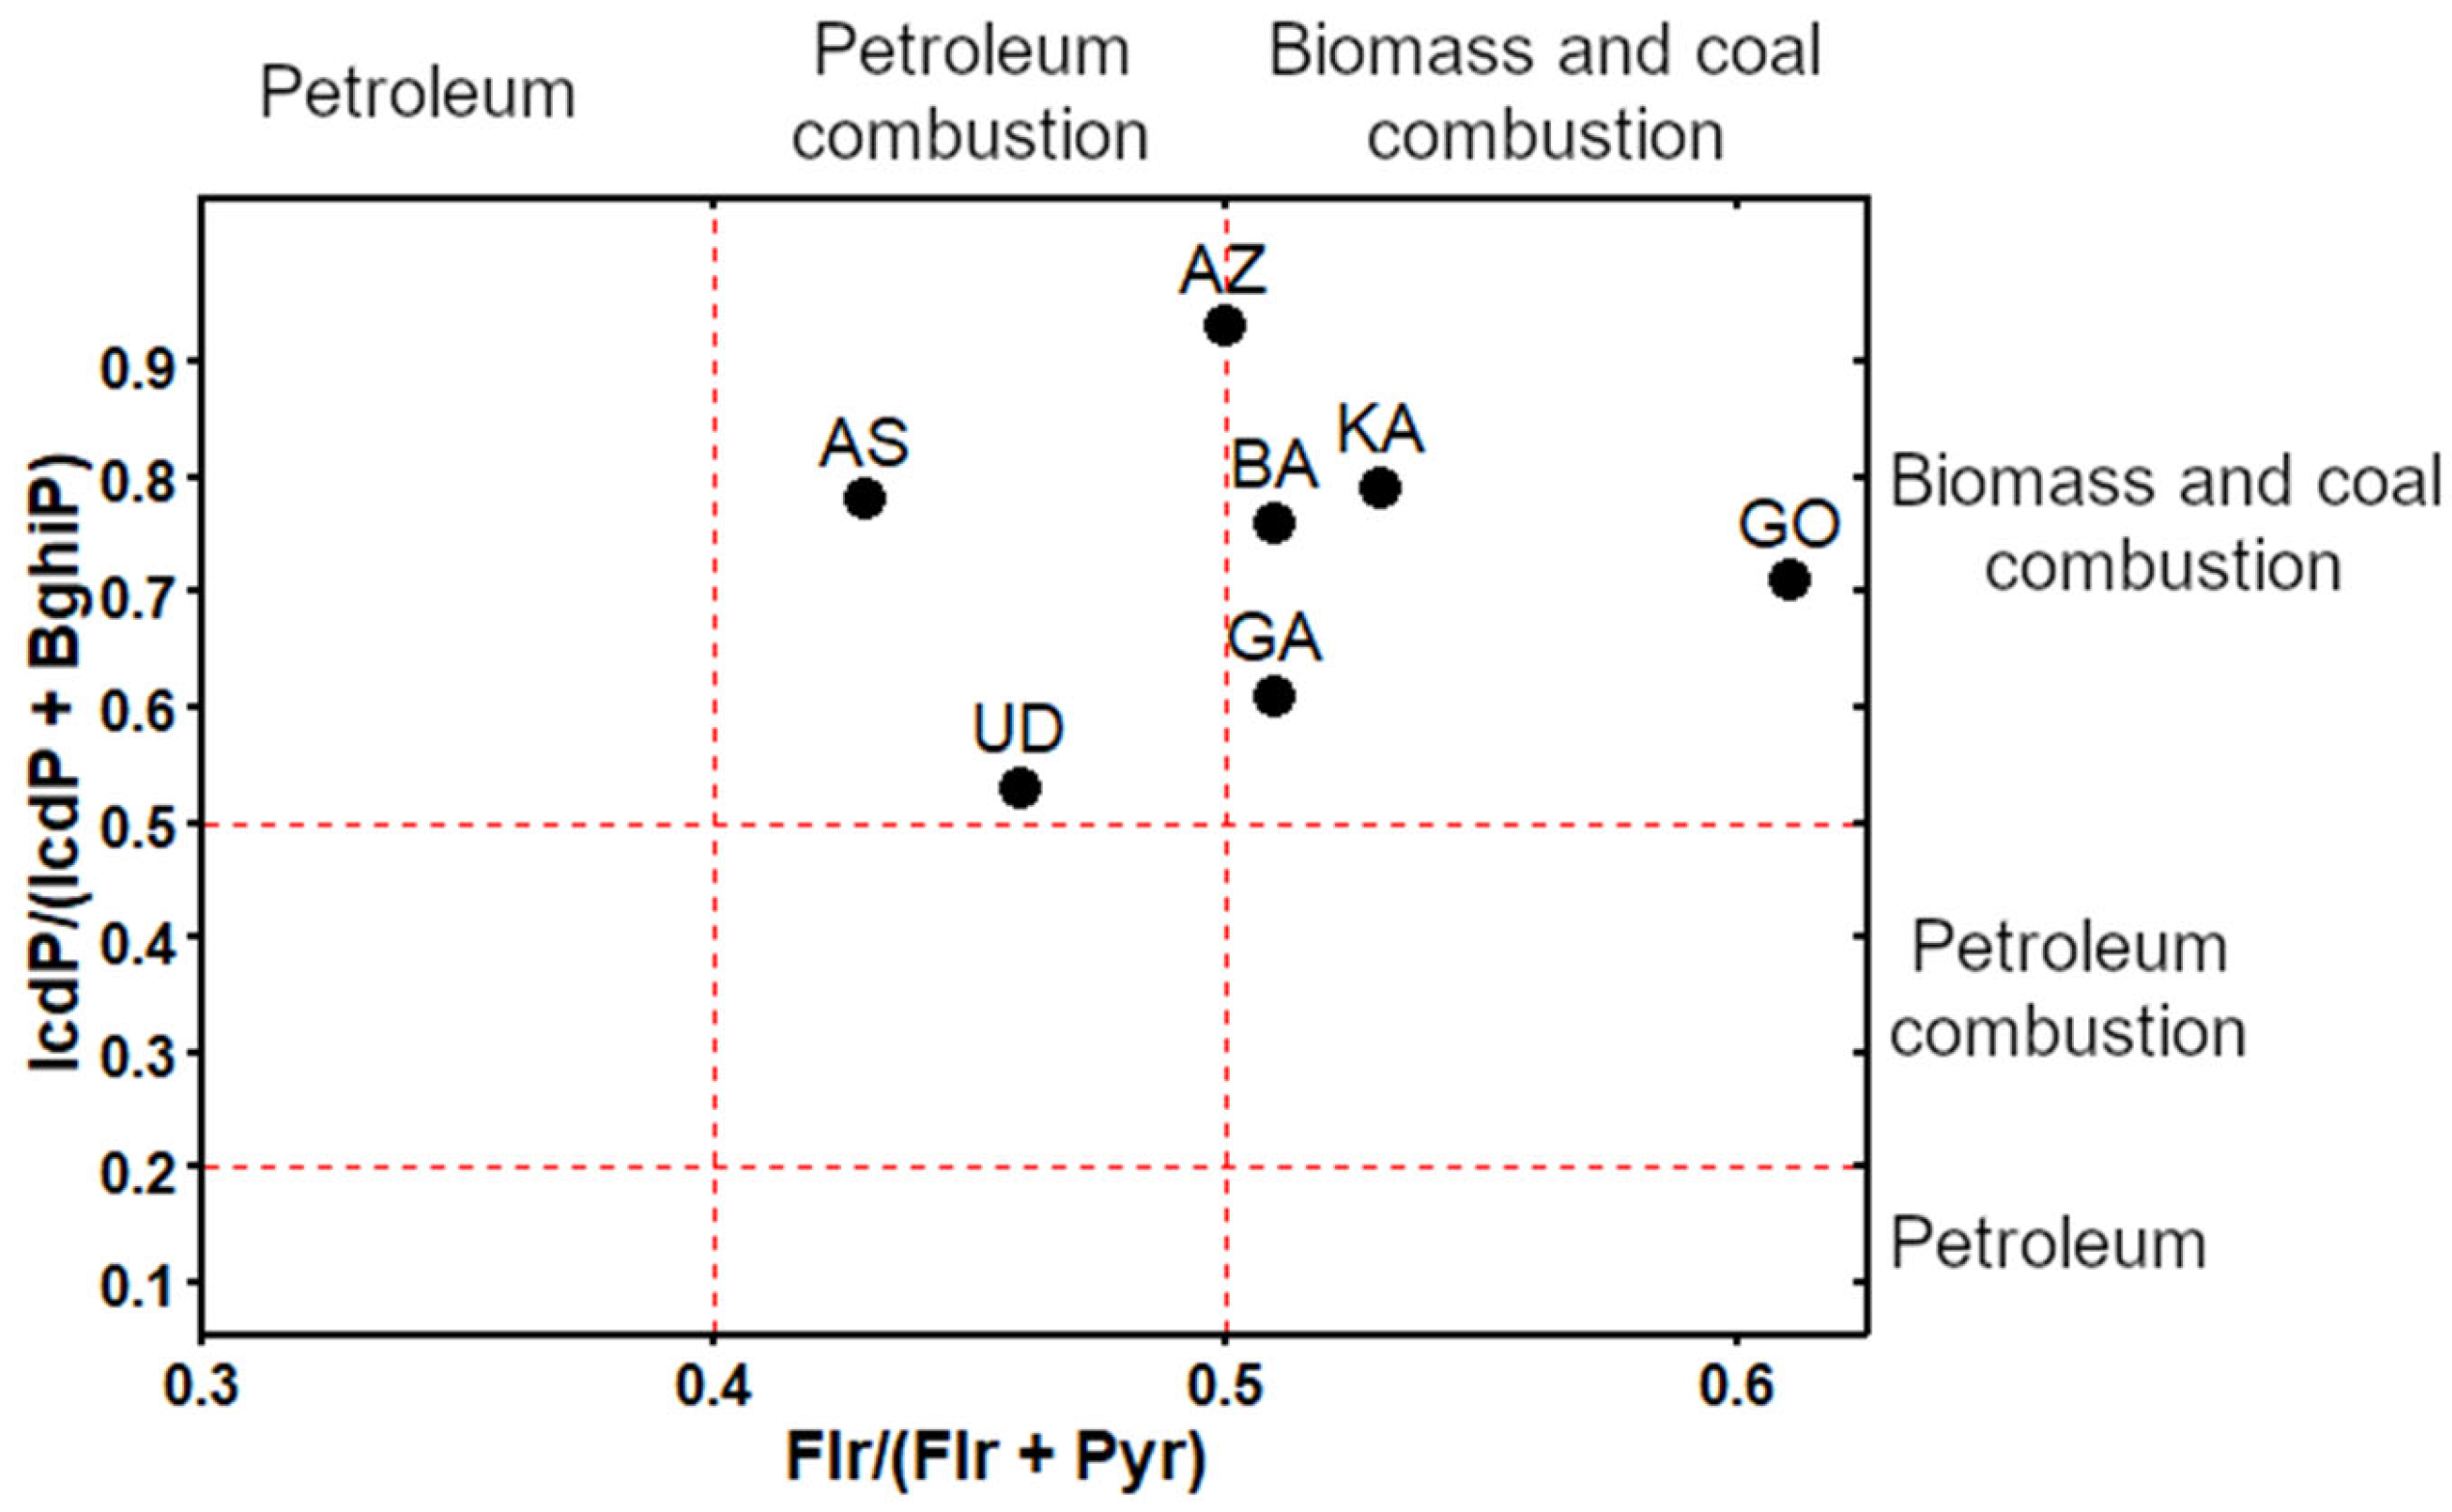
To further explore the potential sources of PAHs, the molecular diagnostic ratios, Indeno [1,2,3-cd]pyrene (IcdP)/(IcdP + Benzo[ghi]perylene (BghiP)) and Fluoranthene (Flr)/(Flr + Pyrene (Pyr)), proposed by Yunker et al. 2002 [27] were considered (Figure 3). According to the results, biomass and coal combustion seems to be the predominant source of PAHs in the study area.
For PCBs, despite the large variability between sampling campaigns, a significant difference was found between sediments from different stations (p < 0.05, Kruskal–Wallis test) after analysis of variance. The highest concentrations were found in BA, being about three times higher than the concentrations found in AZ and KA (Table 1). The highest concentrations were measured in BA and AS, while the concentrations in UD, GO and GA were similar.
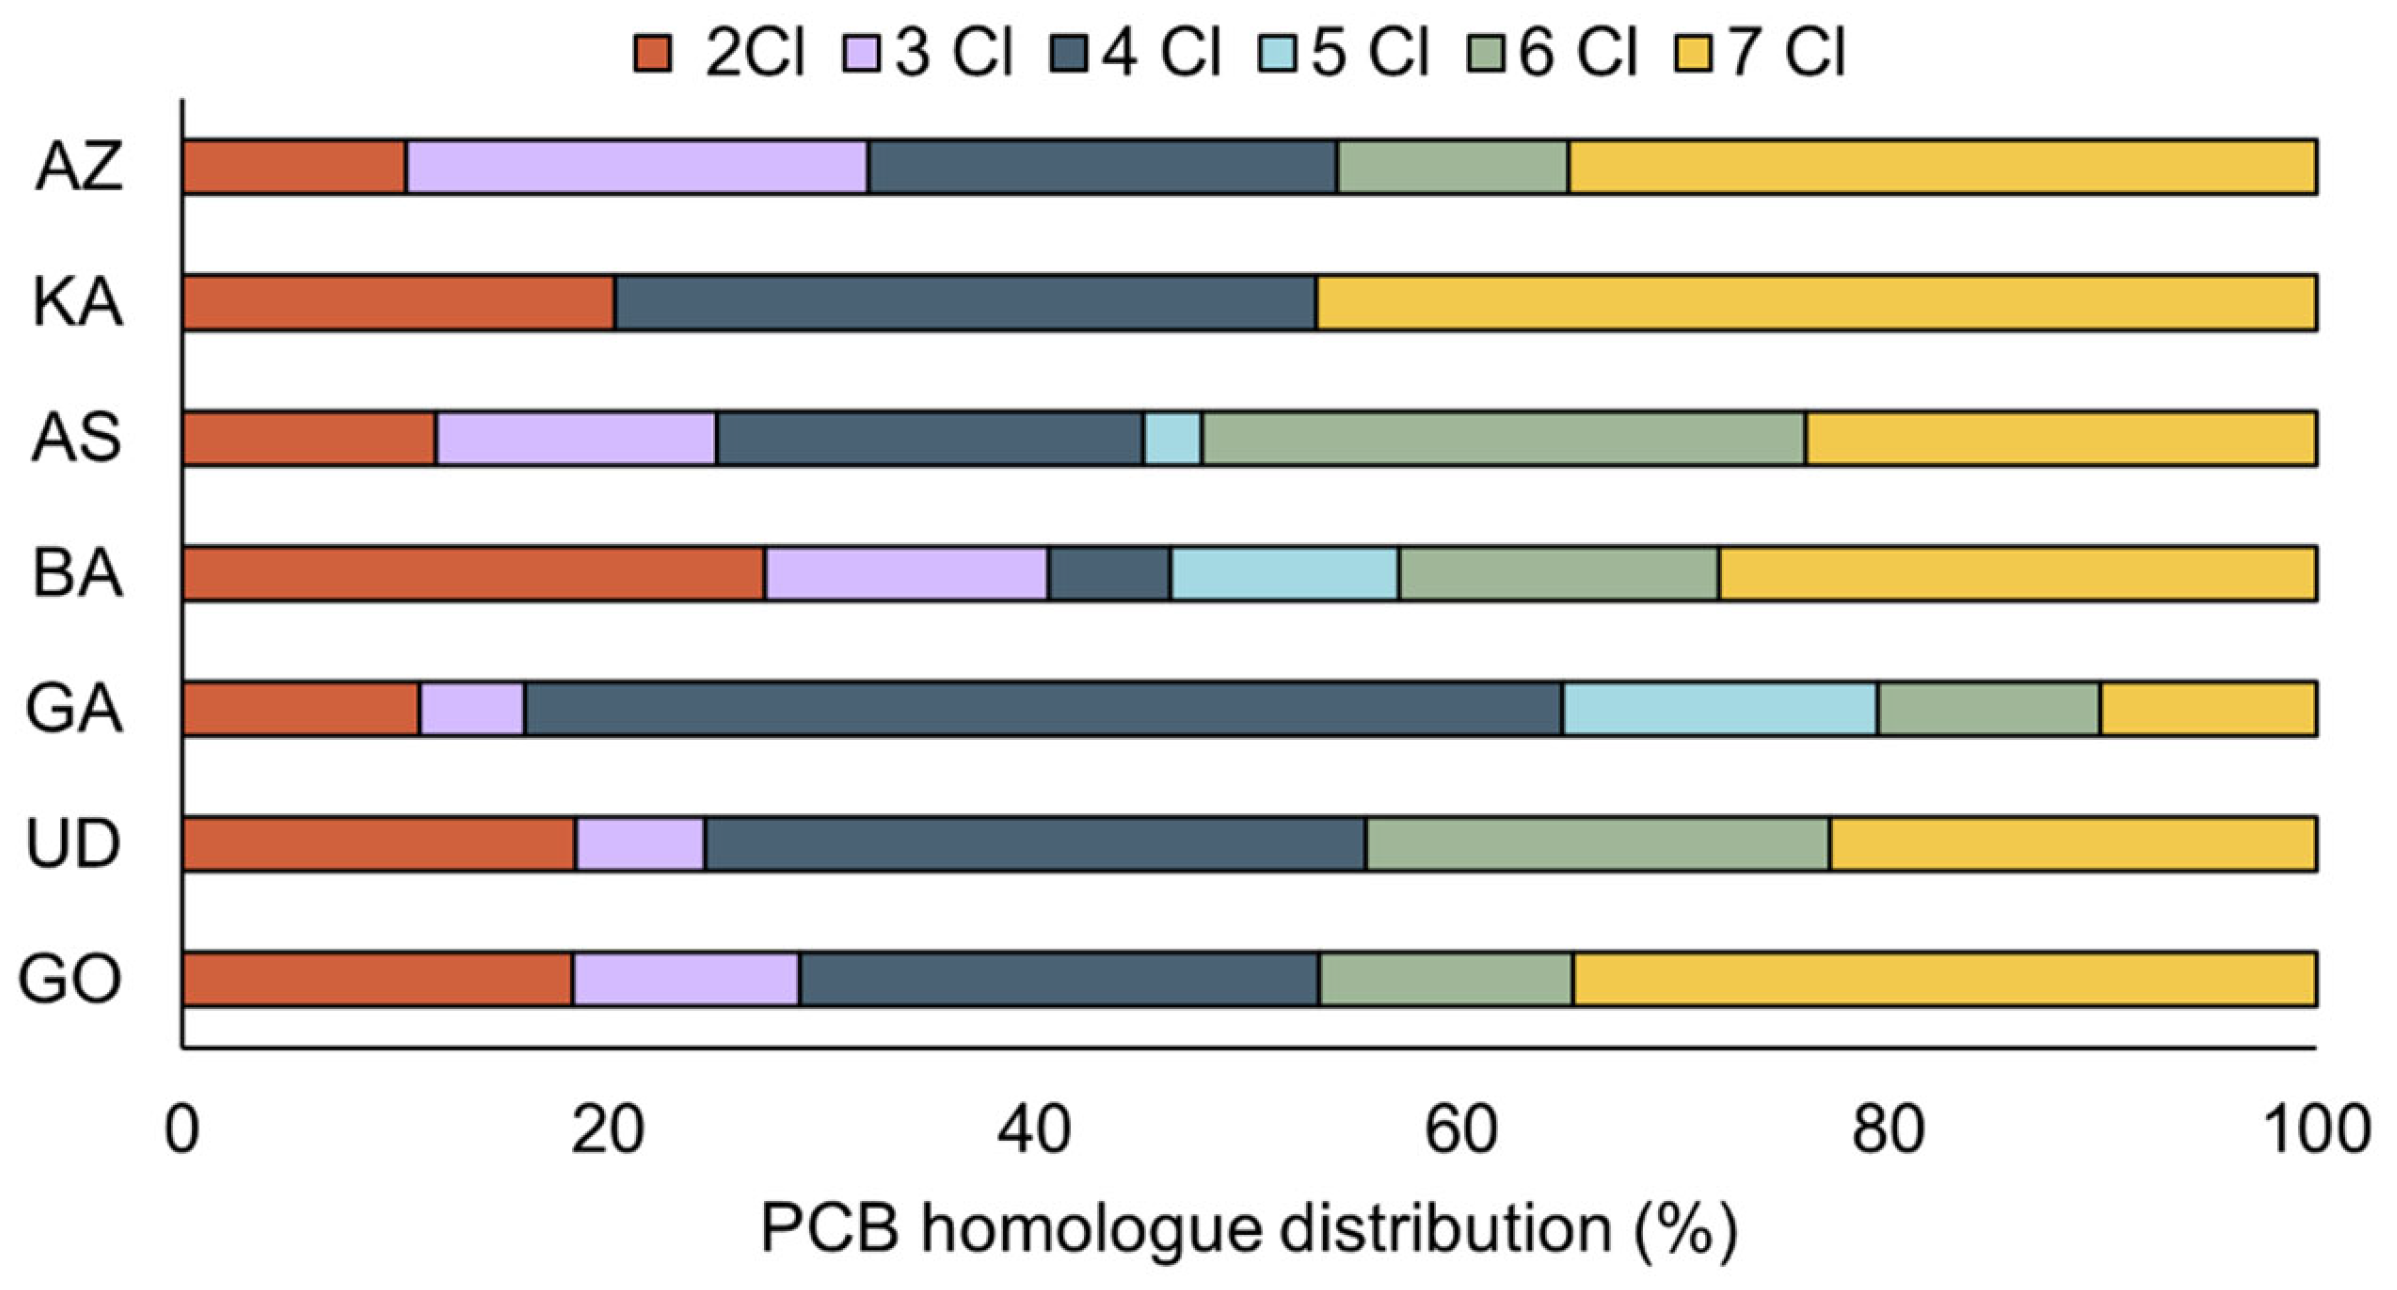
The PCB homologue distributions are presented in Figure 4. Di-, tri-, tetra-, penta-, hexa- and hepta-chlorinated congeners were detected. The hepta-congeners were the most abundant in almost all sites, with CB-200 being the only contributor, followed by hexa- and tetra-chlorinated congeners. Hepta-chlorates were only detected in three of the seven sites, with CB-98 being the only contributor.
Among the HCHs, only γ, δ and α-HCH isomers were quantified. The mean concentrations of ΣHCHs ranged from 100 ng g−1 (GO) to 400 ng g−1 (AS) (Table 1) and no significant spatial trend was observed. The concentrations found at the different sites were of a similar order, with γ-HCH being the most abundant isomer (Table S3). Regarding PCPs, five musks (with sum of concentrations ranging from 170 ng g−1 to 300 ng g−1) and a single UV filter, e.g., EHA (only present in four samples, 7% frequency rate), were quantified. The distribution of musks and UV filters within the estuary was rather uniform, with the lowest and highest average concentrations found in UD and GO (Table 1), respectively.
Two photoinitiators were quantified in sediments samples, ranging from 50 ng g−1 to 70 ng g−1. The sum of concentrations remains similar throughout the estuary, with the lowest and highest average values in UD and AS (Table 1), respectively.

3.2. Temporal Distribution Characteristics in Sediments

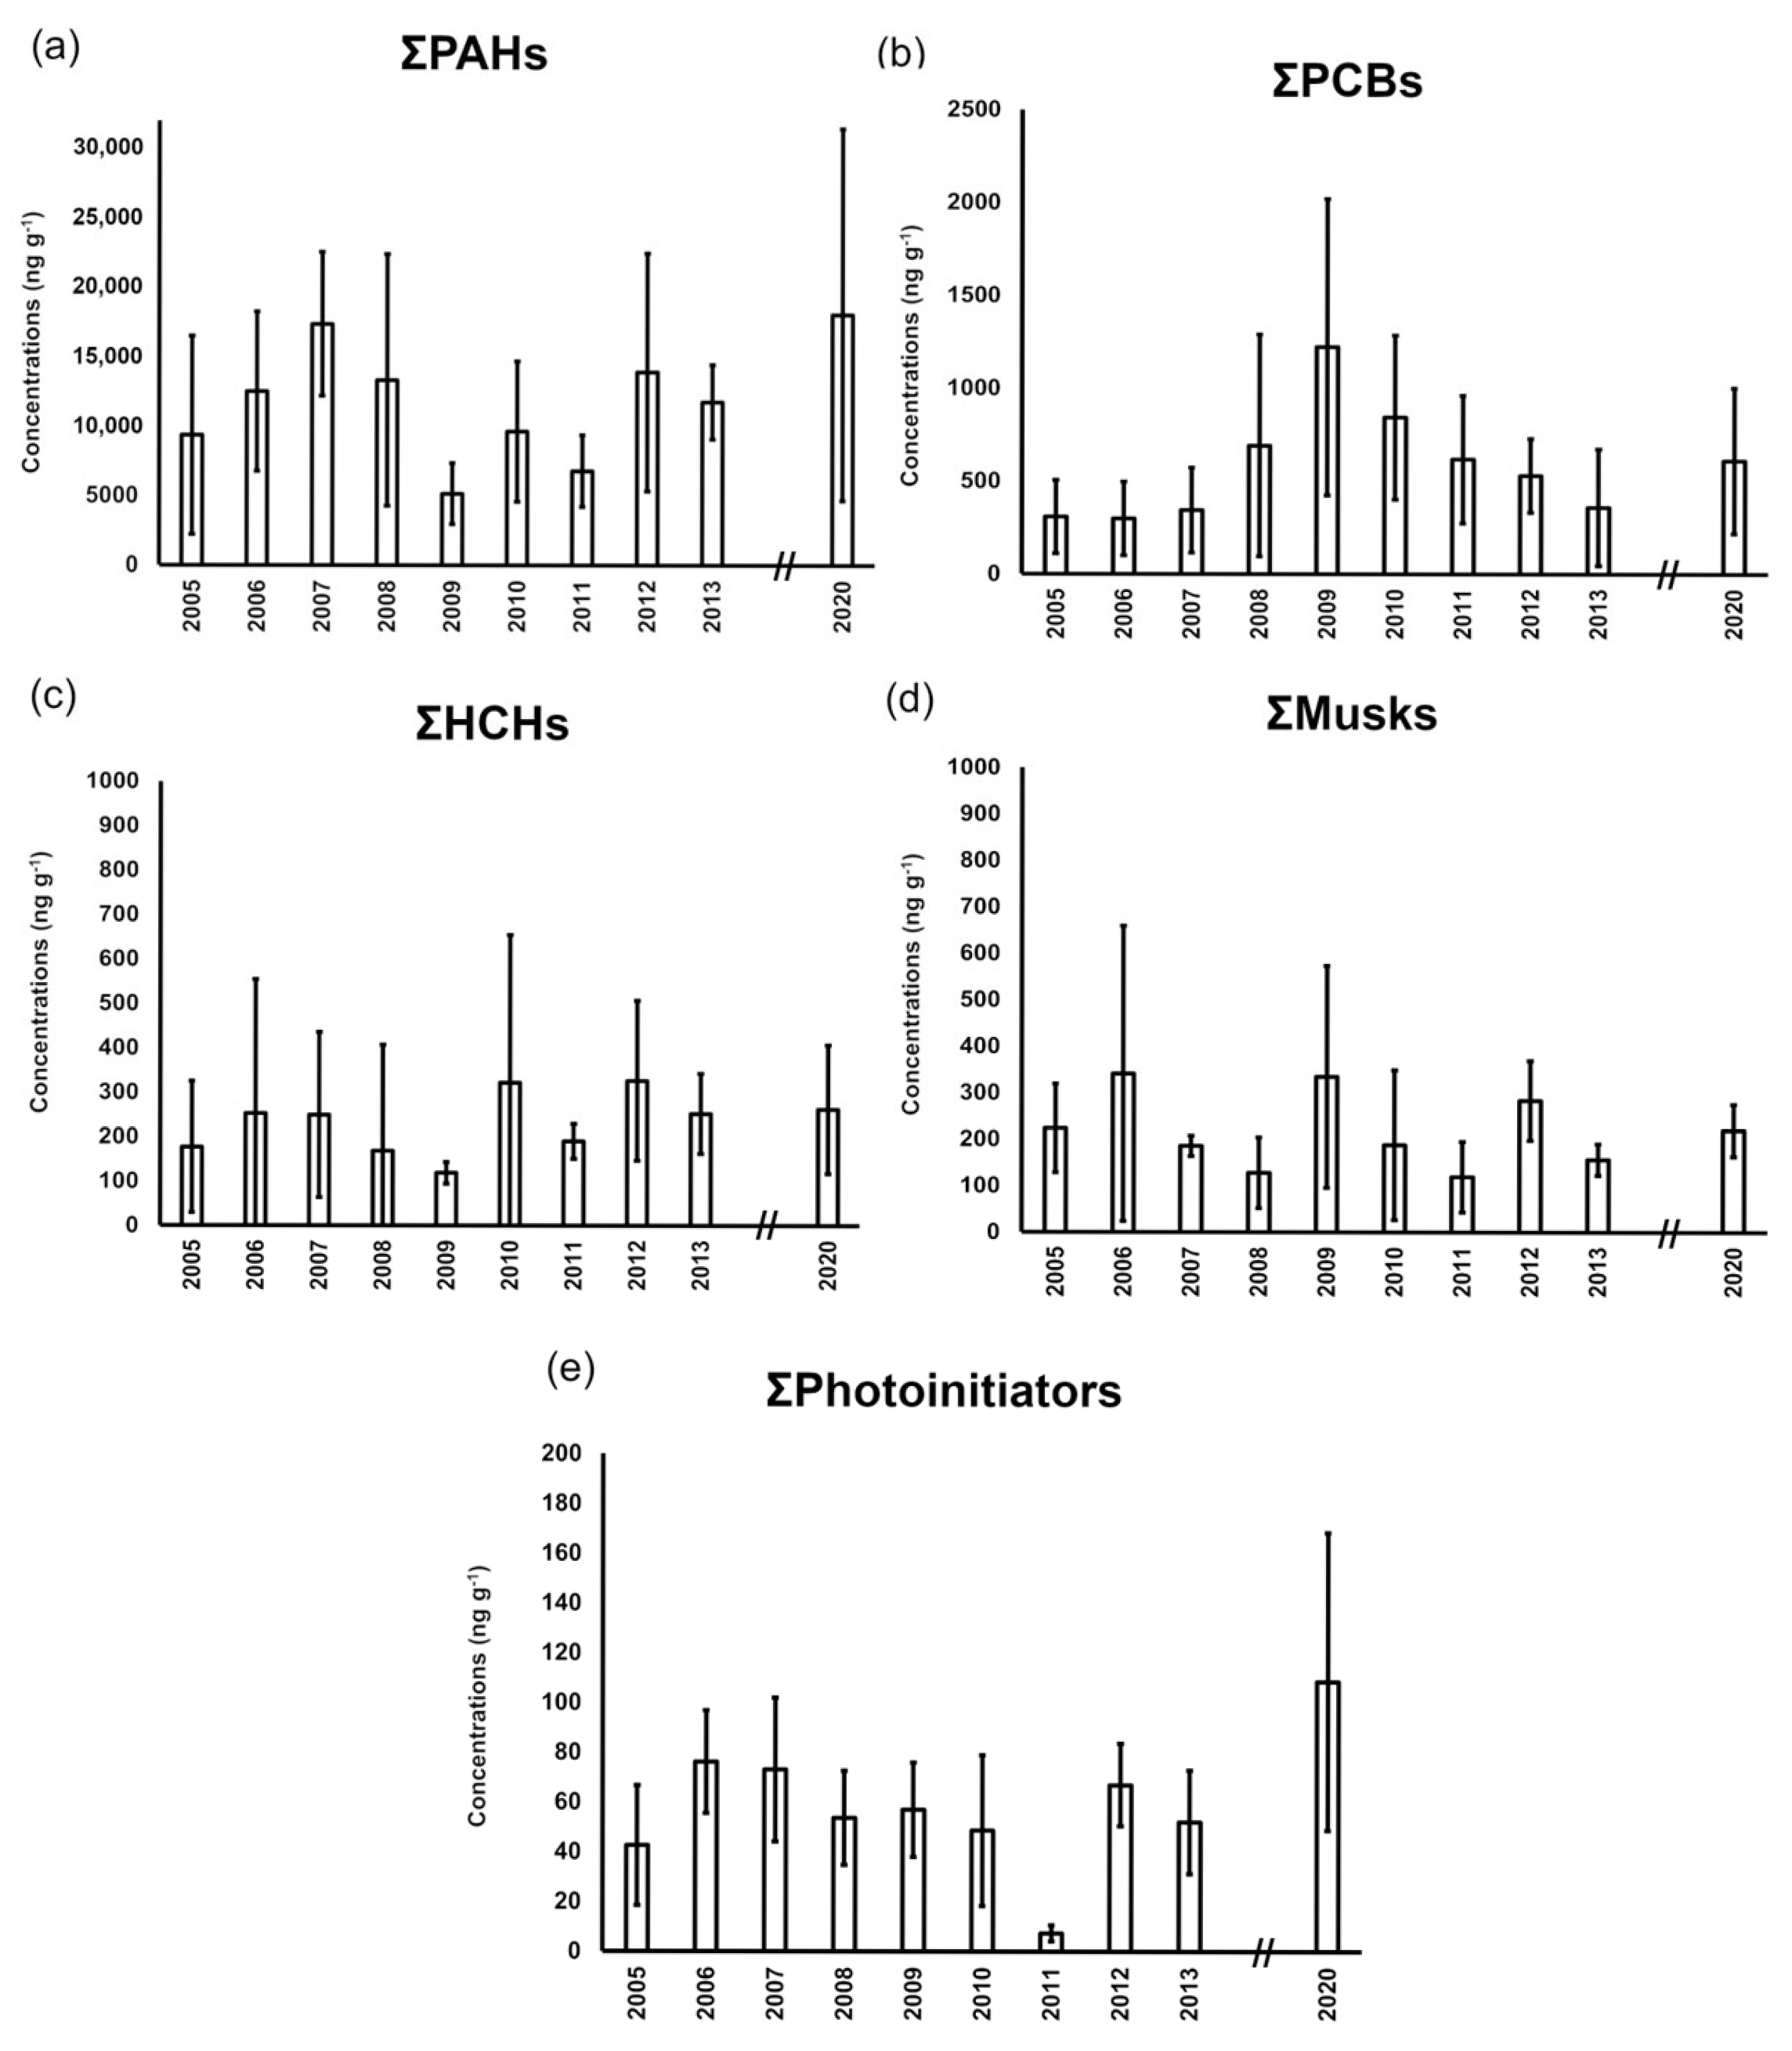
The results of the monitoring over the years 2005 to 2013 and 2020 for organic pollutants indicated that PAHs, PCBs, HCHs, fragrances and photoinitiators were ubiquitous in the estuarine sediments (Figure 5). The highest concentration of total PAHs was found in 2020 and the lowest ones between 2009 and 2011 (Figure 5a).
In the case of PCBs, a systematic behaviour was observed between 2005 and 2013, with the highest concentrations found in 2009 (Figure 5b) to decrease afterwards up to 2013.
As shown in Figure 5c, a decrease in HCHs was observed from 2007 to 2009, where the lowest concentrations were found. However, no further downward trend was observed after these years. In fact, the highest concentrations were measured in 2010 and 2012.
Fragrances did not show any significant trend (Figure 5d). The concentration of the photoinitiators were rather constant along the studied period (Figure 5e), with the exception of 2020, when a significantly higher concentration was measured. Concentrations found in 2011 were surprisingly low but, in this case, only one of the compounds was above the limit of quantification.

3.3. Ecological Risk Assessment

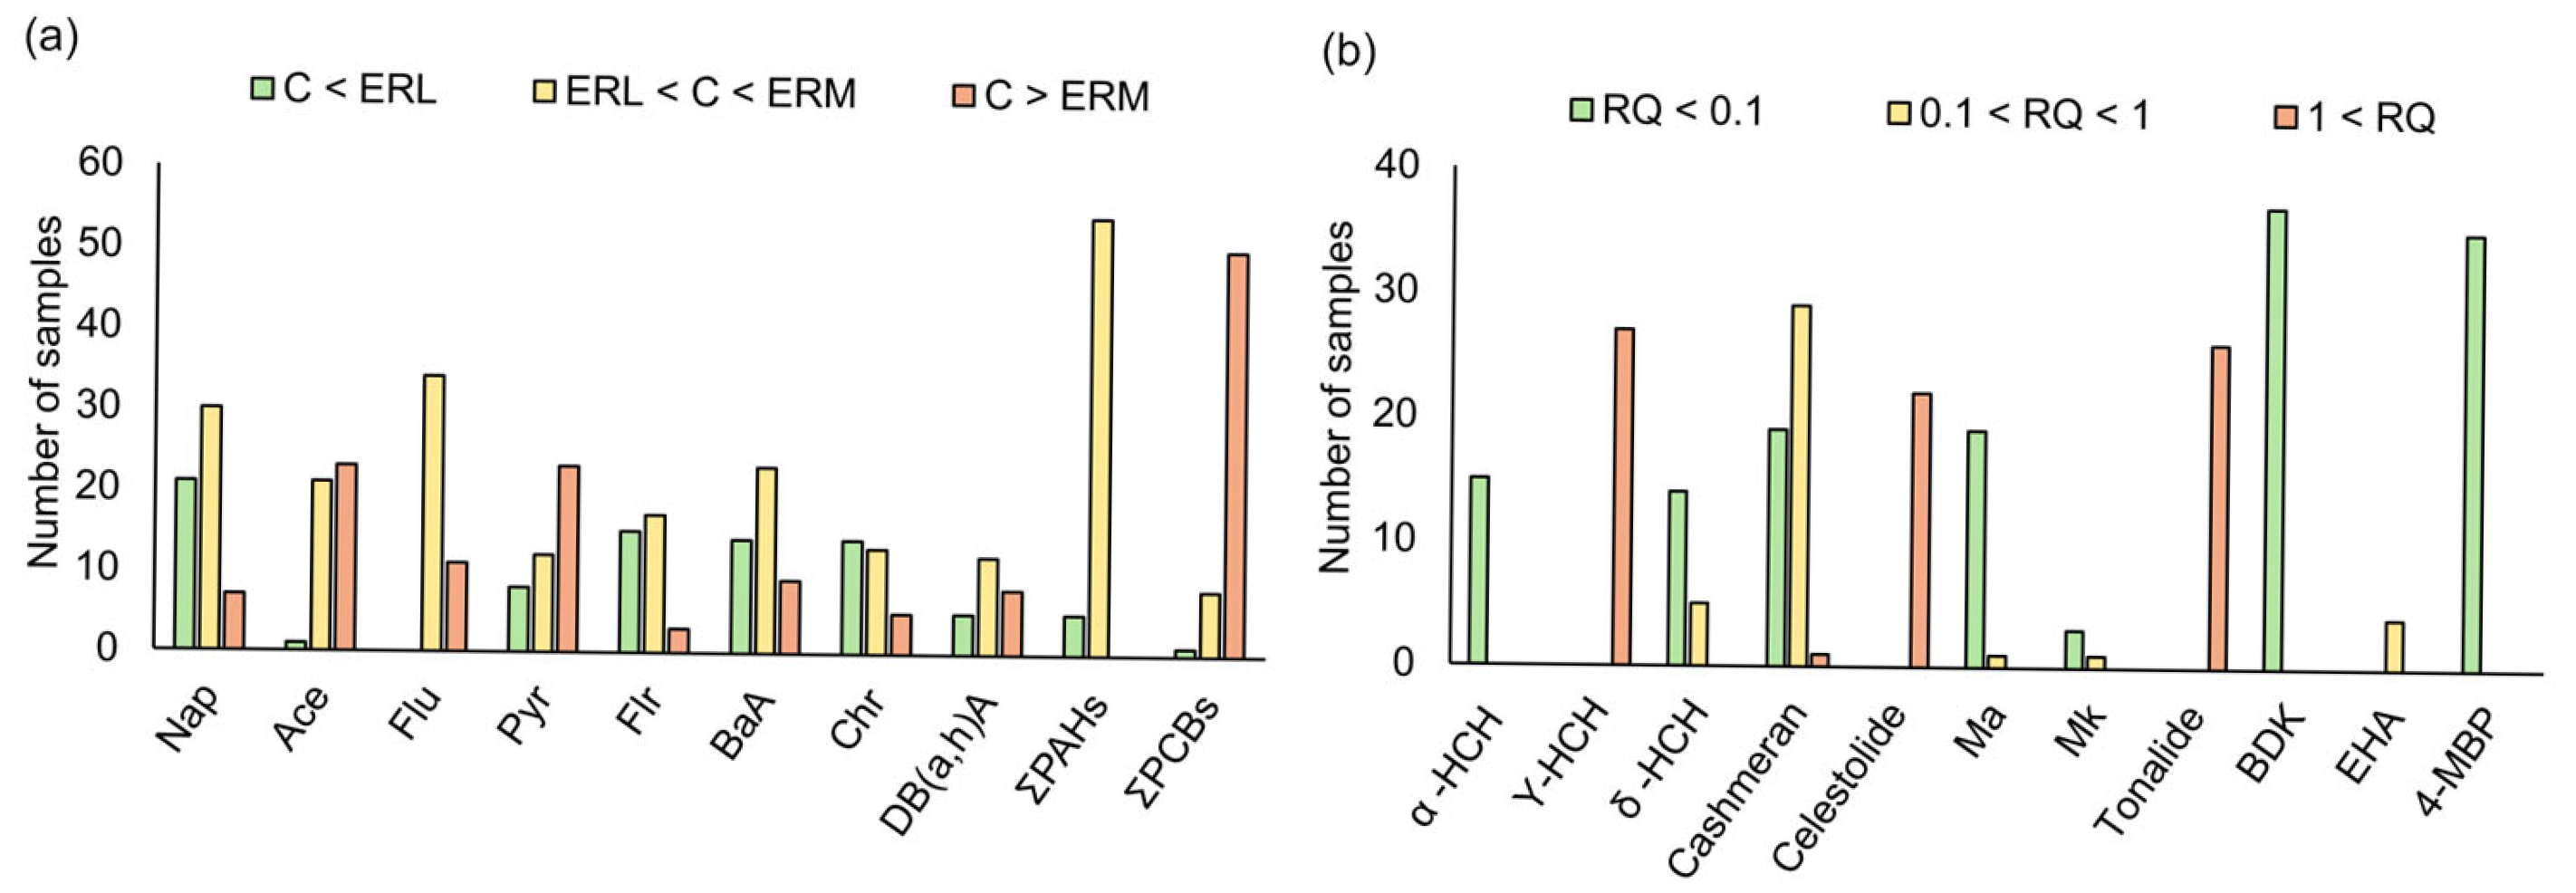
Concentrations of ∑PAHs never exceeded the ERM value, being mostly found between effect range low (ERL) and effect range median (ERM) (Figure 6a). Considering the individual PAHs, most of the samples were between the ERL and ERM values, with few samples having concentrations above the ERM values, except in the cases of Acenaphthene and Pyrene, where a considerable part of the samples exceeded the ERM value. However, in the case of ∑PCBs, concentrations exceed the ERM value in almost all the sites and all the campaigns (Figure 6a).
RQs were estimated for the detected insecticides (α-HCH, γ-HCH, and δ–HCH), musks (cashmeran, celestolide, musk ambrette, and tonalide) and photoinitiators (4-methylbenzophenone and 2,2-dimethoxy-2-phenylacetophenone). As can be seen in Figure 6b, compounds such as γ-HCH, celestolide and tonalide exceed the threshold, while the other compounds do not exceed this threshold.

4. Discussion

4.1. SVOC Levels and Spatial Distribution in Sediment Samples

In general, the concentrations found were higher than those reported in other estuaries [6,28,29,30,31]. As summarized in Section 3.1 (Table 1), UD had the highest levels of PAHs (mean 16,000 ng g−1 dw), consistent with previous observations at this site [14,17]. The high concentrations of PAHs observed could be due to industrial emissions from the surrounding area, as well as the large population living nearby and the associated intense road traffic [32]. In this context, the spatial distribution suggests similar sources of PAHs throughout the estuary, suggesting a predominance of pyrogenic sources. Consequently, biomass and coal combustion appear to be the predominant sources of PAHs in the study area [27].
Although PCBs were commonly used in commercial mixtures known as Aroclors [32], the congener profiles observed in sediment samples from the Nerbioi-Ibaizabasl estuary do not clearly correspond to any specific Aroclor formulation. The variability between sampling stations probably reflects environmental degradation, transport and accumulation processes [33]. As this study is based on a limited number of congeners, the characterization of the PCBs present is partial. Therefore, it would be advisable to extend the analysis to more congeners to future works, which would allow for a more detailed evaluation.
γ-HCH was the most abundant isomer (Table S3). This is not unexpected, as these compounds are still present in the different environmental compartments of the estuary due to the presence of pollution hotspots around the estuary [34,35,36].
As for PCPs, their presence in estuarine sediments may be due to the extensive use of everyday products, such as soaps, detergents, creams, sunscreen products, etc., that contain these compounds among their components [37] and end up in the estuary through domestic or industrial effluents [38]. Consequently, they would be expected to be found in significantly higher quantities in the vicinity of the wastewater treatment plant outlets, which is not the case in our study.
The values of photoinitiators in sediments were similar to those reported in the Pearl River Delta [39], with values similar to those found in this study. These compounds are widely used, among others, in the manufacture of paints and inks, an activity widely present in the Nerbioi-Ibaizabal river estuary [33].

4.2. Temporal Distribution Characteristics in Sediments

The highest concentration of total PAHs was found in 2020 and the lowest ones between 2009 and 2011 (Figure 5a). The low concentrations of total PAHs measured in the period between 2009 and 2011 (Figure 5a) may tentatively be associated with the great economic recession that started in 2008, since social and industrial activity drastically decreased and which could have led to a reduction in the emissions of many pollutants (PAHs among them) to the atmosphere [40].
In the case of PCBs, the decrease in the concentrations after 2009 (Figure 5b) might be due to the deadline (2010) designated by the Spanish government for the elimination of sources and exposure to these compounds [41]. However, the systematic detection of PCBs after 2010 (also in 2020) confirms the strong impact they continue to have on the estuary due to their intense use in the past and their high stability [19].
A similar trend would be expected for HCHs, as all uses of HCHs were banned in 2008 [42] but as shown in Figure 5c, a decrease was observed from 2007 to 2009, where the lowest concentrations were found. However, no further downward trend was observed after these years. In fact, the highest concentrations were measured in 2010 and 2012. The decrease in concentrations was observed in the first years of the implementation of the ban, which coincided with the onset of the great economic recession. However, discharges that were improperly deposited in landfills and poor waste management [36] probably caused significant leaching of these compounds into the estuary, hence the continued accumulation of HCHs in the Nerbioi-Ibaizabal estuary. This situation could explain the persistence of HCH and the fluctuations observed in sediments over the years. This is reflected in the results of the Mann–Kendall test, which indicates a weakly increasing trend (τ = 0.222) but not significant (p = 0.466), suggesting that HCH concentrations do not show consistent changes over time.

4.3. Ecological Risk Assessment

In terms of ERL and ERM values, according to the classification proposed [23], adverse biological effects would be expected to occur occasionally due to the presence of PAHs in the sediments of the Nerbioi-Ibaizabal estuary. However, in the case of ∑PCBs, the presence of PCBs in the sediments might result in frequent adverse biological effects.
It should be noted that these values help to identify samples and areas in which chemical concentrations are high enough to be potentially toxic; therefore, a more detailed assessment is necessary in future studies. In relation to the RQ, compounds such as lindane, celestolide and tonalide exceed the threshold, posing a significantly high risk, while the other compounds do not exceed this threshold and the samples are in the low risk range. However, this assessment is based on the individual analysis of each compound and does not consider possible combined effects resulting from simultaneous exposure to multiple pollutants. Therefore, the overall risk could be underestimated, and additional studies incorporating combined approaches would be necessary to obtain a more comprehensive assessment of ecological risk.

5. Conclusions

This study investigated the spatial and temporal distribution and ecological risks of 33 SVOCs determined in sediments of the Nerbioi-Ibaizalabal estuary. The results of this study show that the sediment bed of the Nerbioi-Ibaizabal estuary still contains significant amounts of priority contaminants.
The concentrations of PAHs found were below the ERM value, and, according to Long et al. (1995) [23], the probability that PAHs present in the sediments cause harmful effects is quite low. Among the PAHs, the four-ring PAHs stand out in terms of their compositional patterns. For the study of the potential sources of PAHs, molecular diagnostic ratios proposed by Yunker et al. 2002 [27] were considered, in which it could be observed that biomass and coal combustion could be the predominant source. However, the identification of sources based on diagnostic molecular ratios should be considered preliminary; further studies are needed to characterize PAH sources in the area more accurately. Regarding the temporal profile, PAHs showed a decrease between 2009 and 2011 probably due to a decrease in industrial activity during the great economic recession during those years. Interestingly, the highest concentrations of PCBs were found in 2009, and it was from that year onwards that a downward trend was observed, probably due to the ban on the production of this family of compounds. It is remarkable the high concentration of lindane (significantly higher RQ value, more than one) was found in most of the sediments, even though its production and use have been banned and faced out since 2008. Its ubiquitous presence in the estuary could be explained, at least in part, by filtration processes associated with potentially improperly managed deposits present in the territory [37].
The presence of legacy pollutants in the sediments of the Nerbioi-Ibaizabal estuary shows the need to monitor the compounds studied in order to be able to evaluate the regulatory processes that have been carried out over the years. As for PCPs, the presence of fragrances and UV filters in the estuary sediments shows the use of products containing these compounds that reach the estuary sediments through wastewater discharges or recreational activities, which results in compounds such as celestolide, whose RQ value could mean a high risk of adverse health effects.
It should be taken into account that there is a lack of data between 2013 and 2020, which has prevented continuous and comprehensive monitoring of the accumulation of these compounds in sediments. Therefore, additional studies are needed to more accurately assess their temporal evolution and accumulation pattern.

Supplementary Materials

The following supporting information can be downloaded at https://www.mdpi.com/article/10.3390/jmse14060537/s1, Table S1: Compounds included in this study (name, abbreviation, family, molecular formula, supplier, solvent used for stock preparation and log Kow); Table S2: Quality assurance parameters in terms of absolute and apparent recoveries (Rabs and Rappar, %), RSD (%) and instrumental and procedural limits of quantification (LOQins and LOQproc); Table S3: Data of toxicity at three trophic levels (algae, invertebrates and fish) in mg L−1 of the target compounds; Table S4. Individual concentrations (ng/g dry weigth) of PAH, PCB, HCH, musk and photoinitiators found in sediments from the Nerbioi-Ibaizabal estuary.

Author Contributions

Conceptualization, U.U.-M., L.M., J.F.A.-C. and A.d.D.; writing—original draft preparation, U.U.-M.; methodology, U.U.-M. and L.M.; writing—review and editing, J.F.A.-C. and A.d.D.; visualization, U.U.-M., L.M., J.F.A.-C. and A.d.D.; supervision, L.M., J.F.A.-C. and A.d.D.; project administration, A.d.D. All authors have read and agreed to the published version of the manuscript.

Funding

This work has been financially supported by the Spanish Ministry of Science and Innovation (MCIN) project PLASTEMER (PID2020-118685RB-I00) and by the Basque Government project “Consolidated Research Group 2022–2025 (IT1446-22) U.U.-M. thanks the Consolidate Group (IT1446-22) project from the Basque Government for her predoctoral contract.

Data Availability Statement

The data can be available on request.

Conflicts of Interest

The authors declare no conflicts of interest.

Abbreviations

The following abbreviations are used in this manuscript:
PAHPolycyclic Aromatic Hydrocarbon
PCBPolychlorinated Biphenyls
OCPOrganochlorine Pesticide
HCHHexachlorocyclohexane
SQGSediment Quality Guideline
RQRisk Quotient
SVOCSemi-Volatile Organic Compound
PCPPersonal Care Product
CECContaminant of Emerging Concern
GOGobela
UDUdondo
GAGalindo
KAKadagua
BABallonti
ASAsua
AZAlde Zaharra
FUSLEFocused Ultrasound Solid–Liquid Extraction
EIElectron Ionization
SIMSelected Ion Monitoring
LOQLimits Of Quantification
RSDRelative Standard Deviation
CRMCertified Reference Material
PNECPredicted No-Effect Concentration
EPMEquilibrium Partitioning Method
AFAssessment Factor
NOECNo Observed Effect Concentration
DDTDichlorodiphenyltrichloroethane
LMWLow Molecular Weight
HMWHigh Molecular Weight
BghiPBenzo[ghi]perylene
FlrFluoranthene
IcdPIndeno [1,2,3-cd]pyrene
PyrPyrene
ERLEffects Range Low
ERMEffects Range Median

References

  1. Karpińska, J.; Kotowska, U. Removal of Organic Pollution in the Water Environment. Water 2019, 11, 2017. [Google Scholar] [CrossRef] [Scilit]
  2. Pérez-Carrera, E.; León, V.M.L.; Parra, A.G.; González-Mazo, E. Simultaneous Determination of Pesticides, Polycyclic Aromatic Hydrocarbons and Polychlorinated Biphenyls in Seawater and Interstitial Marine Water Samples, Using Stir Bar Sorptive Extraction–Thermal Desorption–Gas Chromatography–Mass Spectrometry. J. Chromatogr. A 2007, 1170, 82–90. [Google Scholar] [CrossRef] [Scilit]
  3. Weschler, C.J.; Nazaroff, W.W. Semivolatile Organic Compounds in Indoor Environments. Atmos. Environ. 2008, 42, 9018–9040. [Google Scholar] [CrossRef] [Scilit]
  4. Kennish, M.J. Environmental Threats and Environmental Future of Estuaries. Envirn. Conserv. 2002, 29, 78–107. [Google Scholar] [CrossRef] [Scilit]
  5. Directive 2013/39/EU of the European Parliament and of the Council of 12 August 2013 Amending Directives 2000/60/EC and 2008/105/EC as Regards Priority Substances in the Field of Water Policy Text with EEA Relevance; European Union: Brussels, Belgium, 2013; Volume 226.
  6. Azaroff, A.; Miossec, C.; Lanceleur, L.; Guyoneaud, R.; Monperrus, M. Priority and Emerging Micropollutants Distribution from Coastal to Continental Slope Sediments: A Case Study of Capbreton Submarine Canyon (North Atlantic Ocean). Sci. Total Environ. 2020, 703, 135057. [Google Scholar] [CrossRef] [Scilit]
  7. Wang, F.; Xiang, L.; Sze-Yin Leung, K.; Elsner, M.; Zhang, Y.; Guo, Y.; Pan, B.; Sun, H.; An, T.; Ying, G.; et al. Emerging Contaminants: A One Health Perspective. Innovation 2024, 5, 100612. [Google Scholar] [CrossRef] [Scilit]
  8. Burton, G.A., Jr. Sediment Quality Criteria in Use around the World. Limnology 2002, 3, 65–76. [Google Scholar] [CrossRef] [Scilit]
  9. Larreta, J.; Solaun, O.; Menchaca, J.G.; Rodríguez, V. Estudio de La Contaminación En Los Sedimentos de Los Estuarios Del País Vasco (1998–2001/2009–2012); Elaborado por AZTI-Tecnalia para URA: Bizkaia, Spain, 2012; p. 223. [Google Scholar]
  10. Gredilla, A.; Fdez-Ortiz de Vallejuelo, S.; Arana, G.; de Diego, A.; Madariaga, J.M. Long-Term Monitoring of Metal Pollution in Sediments from the Estuary of the Nerbioi-Ibaizabal River (2005–2010). Estuar. Coast. Shelf Sci. 2013, 131, 129–139. [Google Scholar] [CrossRef] [Scilit]
  11. Leorri, E.; Cearreta, A.; Irabien, M.J.; Yusta, I. Geochemical and Microfaunal Proxies to Assess Environmental Quality Conditions during the Recovery Process of a Heavily Polluted Estuary: The Bilbao Estuary Case (N. Spain). Sci. Total Environ. 2008, 396, 12–27. [Google Scholar] [CrossRef] [Scilit]
  12. Landajo, A.; Arana, G.; de Diego, A.; Etxebarria, N.; Zuloaga, O.; Amouroux, D. Analysis of Heavy Metal Distribution in Superficial Estuarine Sediments (Estuary of Bilbao, Basque Country) by Open-Focused Microwave-Assisted Extraction and ICP-OES. Chemosphere 2004, 56, 1033–1041. [Google Scholar] [CrossRef] [Scilit]
  13. Wawrzynkowski, P.; Bustamante, M.; Tajadura, F.J.; Becerro, M.A. Evaluating Ocean Health and Restoration Success: A Comprehensive Study of the Benthic Quality Index in the Bilbao Estuary. Estuar. Coast. Shelf Sci. 2023, 292, 108454. [Google Scholar] [CrossRef] [Scilit]
  14. Bartolomé, L.; Tueros, I.; Cortazar, E.; Raposo, J.C.; Sanz, J.; Zuloaga, O.; de Diego, A.; Etxebarria, N.; Fernández, L.A.; Madariaga, J.M. Distribution of Trace Organic Contaminants and Total Mercury in Sediments from the Bilbao and Urdaibai Estuaries (Bay of Biscay). Mar. Pollut. Bull. 2006, 52, 1111–1117. [Google Scholar] [CrossRef] [Scilit] [PubMed]
  15. Garmendia, M.; Fdez-Ortiz de Vallejuelo, S.; Liñero, O.; Gredilla, A.; Arana, G.; Soto, M.; de Diego, A. Long Term Monitoring of Metal Pollution in Sediments as a Tool to Investigate the Effects of Engineering Works in Estuaries. A Case Study, the Nerbioi-Ibaizabal Estuary (Bilbao, Basque Country). Mar. Pollut. Bull. 2019, 145, 555–563. [Google Scholar] [CrossRef] [Scilit] [PubMed]
  16. Montero, N.; Belzunce-Segarra, M.J.; Menchaca, I.; Garmendia, J.M.; Franco, J.; Nieto, O.; Etxebarria, N. Integrative Sediment Assessment at Atlantic Spanish Harbours by Means of Chemical and Ecotoxicological Tools. Environ. Monit. Assess. 2013, 185, 1305–1318. [Google Scholar] [CrossRef] [Scilit]
  17. Prieto, A.; Zuloaga, O.; Usobiaga, A.; Bartolomé, L.; Fernández, L.A.; Etxebarria, N.; Ciprain, E.; Alonso, A. Levels and Spatial Distribution of Inorganic and Organic Contaminants in Sediments along the Bilbao Estuary. Mar. Pollut. Bull. 2008, 56, 2094–2099. [Google Scholar] [CrossRef] [Scilit]
  18. Rodriguez-Iruretagoiena, A.; Elejoste, N.; Gredilla, A.; Fdez-Ortiz De Vallejuelo, S.; Arana, G.; Madariaga, J.M.; De Diego, A. Occurrence and Geographical Distribution of Metals and Metalloids in Sediments of the Nerbioi-Ibaizabal Estuary (Bilbao, Basque Country). Mar. Chem. 2016, 185, 82–90. [Google Scholar] [CrossRef] [Scilit]
  19. Cearreta, A.; Irabien, M.J.; Leorri, E.; Yusta, I.; Croudace, I.W.; Cundy, A.B. Recent Anthropogenic Impacts on the Bilbao Estuary, Northern Spain: Geochemical and Microfaunal Evidence. Estuar. Coast. Shelf Sci. 2000, 50, 571–592. [Google Scholar] [CrossRef] [Scilit]
  20. García-Barcina, J.M.; Oteiza, M.; de la Sota, A. Modelling the Faecal Coliform Concentrations in the Bilbao Estuary. In Proceedings of the Nutrients and Eutrophication in Estuaries and Coastal Waters: 31st Symposium of the Estuarine and Coastal Sciences Association (ECSA), Bilbao, Spain, 3–7 July 2000; Orive, E., Elliott, M., de Jonge, V.N., Eds.; Springer: Dordrecht, The Netherlands, 2002; pp. 213–219. ISBN 978-94-017-2464-7. [Google Scholar]
  21. Errekatxo, A.; Prieto, A.; Zuloaga, O.; Usobiaga, A.; Etxebarria, N.; Fernández, L.A. Simultaneous Extraction of Several Persistent Organic Pollutants in Sediment Using Focused Ultrasonic Solid-Liquid Extraction. Anal. Bioanal. Chem. 2008, 392, 1471–1478. [Google Scholar] [CrossRef] [Scilit]
  22. Mijangos, L.; Bilbao, D.; Lopez-Herguedas, N.; Ortueta, N.; Olivares, M.; Zuloaga, O.; Etxebarria, N.; Prieto, A. Development of an Analytical Method for the Simultaneous Determination of 50 Semi-Volatile Organic Contaminants in Wastewaters. MethodsX 2023, 11, 102252. [Google Scholar] [CrossRef] [Scilit]
  23. Long, E.R.; Macdonald, D.D.; Smith, S.L.; Calder, F.D. Incidence of Adverse Biological Effects within Ranges of Chemical Concentrations in Marine and Estuarine Sediments. Environ. Manag. 1995, 19, 81–97. [Google Scholar] [CrossRef] [Scilit]
  24. Abreu, F.E.L.; Martins, S.E.; Fillmann, G. Ecological Risk Assessment of Booster Biocides in Sediments of the Brazilian Coastal Areas. Chemosphere 2021, 276, 130155. [Google Scholar] [CrossRef] [Scilit] [PubMed]
  25. ECETOC. Guidance on a Framework for Deriving Environmental (Aquatic) Soil and Sediment Quality Benchmarks, TR 092; European Centre for Ecotoxicology and Toxicology of Chemicals: Brussels, Belgium, 2014; Available online: https://www.ecetoc.org/wp-content/uploads/2014/08/ECETOC-TR-092.pdf (accessed on 10 March 2026).
  26. Lopez-Herguedas, N.; González-Gaya, B.; Castelblanco-Boyacá, N.; Rico, A.; Etxebarria, N.; Olivares, M.; Prieto, A.; Zuloaga, O. Characterization of the Contamination Fingerprint of Wastewater Treatment Plant Effluents in the Henares River Basin (Central Spain) Based on Target and Suspect Screening Analysis. Sci. Total Environ. 2022, 806, 151262. [Google Scholar] [CrossRef] [Scilit] [PubMed]
  27. Yunker, M.B.; Macdonald, R.W.; Vingarzan, R.; Mitchell, R.H.; Goyette, D.; Sylvestre, S. PAHs in the Fraser River Basin: A Critical Appraisal of PAH Ratios as Indicators of PAH Source and Composition. Org. Geochem. 2002, 33, 489–515. [Google Scholar] [CrossRef] [Scilit]
  28. Lu, M.; Zeng, D.-C.; Liao, Y.; Tong, B. Distribution and Characterization of Organochlorine Pesticides and Polycyclic Aromatic Hydrocarbons in Surface Sediment from Poyang Lake, China. Sci. Total Environ. 2012, 433, 491–497. [Google Scholar] [CrossRef] [Scilit]
  29. Monaco, D.; Chianese, E.; Riccio, A.; Delgado-Sanchez, A.; Lacorte, S. Spatial Distribution of Heavy Hydrocarbons, PAHs and Metals in Polluted Areas. The Case of “Galicia”, Spain. Mar. Pollut. Bull. 2017, 121, 230–237. [Google Scholar] [CrossRef] [Scilit]
  30. Kim, A.W.; Vane, C.H.; Moss-Hayes, V.; Engelhart, S.E.; Kemp, A.C. PAH, PCB, TPH and Mercury in Surface Sediments of the Delaware River Estuary and Delmarva Peninsula, USA. Mar. Pollut. Bull. 2018, 129, 835–845. [Google Scholar] [CrossRef] [Scilit]
  31. Pérez-Fernández, B.; Viñas, L.; Franco, M.Á.; Bargiela, J. PAHs in the Ría de Arousa (NW Spain): A Consideration of PAHs Sources and Abundance. Mar. Pollut. Bull. 2015, 95, 155–165. [Google Scholar] [CrossRef] [Scilit]
  32. Registro de Emisiones y Fuentes Contaminantes: PRTR. Available online: https://www.miteco.gob.es/es/calidad-y-evaluacion-ambiental/temas/sostenibilidad-industrial/registro-de-emisiones-y-fuentes-contaminantes-prtr.html (accessed on 2 December 2025).
  33. Phan, K.; Otim, O. Aroclor Speciation by Unsupervised Exploratory Analysis of Congener Proportions in Multivariate Space: A Southern California Bight Sediment and Fish Study. Sci. Total Environ. 2025, 958, 178080. [Google Scholar] [CrossRef] [Scilit]
  34. Directive 2000/60/EC of the European Parliament and of the Council of 23 October 2000 Establishing a Framework for Community Action in the Field of Water Policy; European Union: Brussels, Belgium, 2000; Volume 327.
  35. Directorate-General for Internal Policies of the Union (European Parliament). ERA-Consult Madrid Lindane (Persistant Organic Pollutant) in the EU; Publications Office of the European Union: Luxembourg, 2016; ISBN 978-92-846-0328-2. [Google Scholar]
  36. Vijgen, J.; De Borst, B.; Weber, R.; Stobiecki, T.; Forter, M. HCH and Lindane Contaminated Sites: European and Global Need for a Permanent Solution for a Long-Time Neglected Issue. Environ. Pollut. 2019, 248, 696–705. [Google Scholar] [CrossRef] [Scilit]
  37. Montes-Grajales, D.; Fennix-Agudelo, M.; Miranda-Castro, W. Occurrence of Personal Care Products as Emerging Chemicals of Concern in Water Resources: A Review. Sci. Total Environ. 2017, 595, 601–614. [Google Scholar] [CrossRef] [Scilit]
  38. González-Gaya, B.; Lopez-Herguedas, N.; Santamaria, A.; Mijangos, F.; Etxebarria, N.; Olivares, M.; Prieto, A.; Zuloaga, O. Suspect Screening Workflow Comparison for the Analysis of Organic Xenobiotics in Environmental Water Samples. Chemosphere 2021, 274, 129964. [Google Scholar] [CrossRef] [Scilit]
  39. He, Y.; Pan, Z.; Liang, X.; Xie, R.; Sun, Y.; Li, J.; Wang, Y.; Zeng, L. Distribution Characteristics of Photoinitiators and Their Flux Estimation from the Pearl River Delta to the Coastal Waters of the South China Sea. J. Environ. Sci. 2023, 128, 71–80. [Google Scholar] [CrossRef] [Scilit]
  40. Ballester, J.; Robine, J.-M.; Herrmann, F.R.; Rodó, X. Effect of the Great Recession on Regional Mortality Trends in Europe. Nat. Commun. 2019, 10, 679. [Google Scholar] [CrossRef] [Scilit]
  41. Ministerio de la Presidencia Real Decreto 1378/1999, de 27 de Agosto, Por El Que Se Establecen Medidas Para La Eliminación y Gestión de Los Policlorobifenilos, Policloroterfenilos y Aparatos Que Los Contengan; Boletín Oficial del Estado (BOE): Madrid, Spain, 1999; Volume BOE-A-1999-18193, pp. 31911–31914.
  42. Regulation (EC) No 850/2004 of the European Parliament and of the Council of 29 April 2004 on Persistent Organic Pollutants and Amending Directive 79/117/EEC; Publications Office of the European Union: Luxembourg, 2004; Volume 158.
Figure 1. Map with the location of the sampling sites: Gobela (GO, 43°19′4.98″ N 2°59′34.45″ W), Udondo (UD, 43°18′54.39″ N 2°59′31″ W), Ballonti (BA, 43°18′21.40″ N 3°0′01.50″ W), Galindo (GA, 43°18′13.08″ N 2°58′57.17″ W), Asua (AS, 43°17′34.68″ N 2°58′13.82″ W), Kadagua (KA, 43°16′27.28″ N 2°58′37.11″ W) and Alde Zaharra (AZ, 43°15′39.90″ N 2°55′29.60″ W) from the Bilbao estuary (adapted from [15]).
Jmse 14 00537 g001
Figure 2. PAH distribution by structural rings in sediment samples collected from Nerbioi-Ibaizabal estuary.
Jmse 14 00537 g002
Figure 3. Bivariate plot of PAH diagnostic ratios in Nerbioi-Ibaizabal sediments; within year average ratios for each sampling site are shown in the plot. Identification of PAH sources by [27]: Flr/(Flr + Pyr) < 0.4: petroleum, 0.4 < Flr/(Flr + Pyr) < 0.5: petroleum combustion, Flr/(Flr + Pyr) > 0.5: biomass and coal combustion; IcdP/(IcdP + BghiP) < 0.2: petroleum, 0.2 < Ind/(IcdP + BghiP) < 0.5: petroleum combustion, IcdP/(IcdP + BghiP) > 0.5: biomass and coal combustion.
Jmse 14 00537 g003
Figure 4. Spatial variation in the relative contribution of PCB homologues for sediments from Nerbioi-Ibaizabal estuary.
Jmse 14 00537 g004
Figure 5. Change over time in the within-site mean sum of concentrations for: (a) PAHs, (b) PCBs, (c) HCHs, (d) musks, and (e) photoinitiatoirs in Nerbioi-Ibaizabal estuary. Error bars represent standard deviations.
Jmse 14 00537 g005
Figure 6. Comparison of the compounds quantified in the samples with respect to (a) the ERL/EMR values (ng/g), and (b) calculated RQs.
Jmse 14 00537 g006
Table 1. Mean (±SD) total concentrations and detection frequencies of each family compound at the different sampling sites.
Site CodeSampling SiteΣPAHs aΣPCBs bΣHCHs cΣFragrances dΣUV Filter and Photoinitiators e
(ng/g dry wt)
GOGobela9400 ±4800720 ± 470100 ± 60300 ± 25050 ± 27
UDUdondo16,000 ± 12,000530 ± 220220 ± 150170 ± 9048 ± 25
GAGalindo12,000 ± 7000620 ± 300290 ± 200210 ± 19052 ± 28
BABaionti11,000 ± 62001200 ± 660220 ± 270240 ± 22052 ± 8
ASAsua13,000 ± 8300840 ± 750400 ± 200200 ± 8066 ± 19
KAKadagua11,000 ± 5400350 ± 480310 ± 240220 ± 1047 ± 20
AZAlde Zaharra7500 ± 3300350 ± 250210 ±170250 ± 17055 ± 38
Min750035010017048
Max16,000120040030066
Mean
frequency (%)
7146354142
a sum of concentrations of 12 compounds; b sum of concentration of 11 congeners; c sum of γ-HCH, δ-HCH and α-HCH; d sum of 5 compounds; e sum of concentrations of 2 compounds.
Disclaimer/Publisher’s Note: The statements, opinions and data contained in all publications are solely those of the individual author(s) and contributor(s) and not of MDPI and/or the editor(s). MDPI and/or the editor(s) disclaim responsibility for any injury to people or property resulting from any ideas, methods, instructions or products referred to in the content.