Article

Experimental Study on Hydrodynamic Response Characteristics of a Novel Pontoon-Type Array Offshore Floating Photovoltaic Structure

1
State Key Laboratory of Hydraulic Engineering Intelligent Construction and Operation, Tianjin University, Tianjin 300350, China
2
School of Civil Engineering, Tianjin University, Tianjin 300350, China
3
School of Ocean Energy, Tianjin University of Technology, Tianjin 300384, China
4
China Renewable Energy Engineering Institute, Beijing 100011, China
5
School of Water Conservancy and Hydroelectric Power, Hebei University of Engineering, Handan 056038, China
*
Author to whom correspondence should be addressed.
J. Mar. Sci. Eng. 2026, 14(3), 322; https://doi.org/10.3390/jmse14030322
Submission received: 6 January 2026 / Revised: 31 January 2026 / Accepted: 5 February 2026 / Published: 6 February 2026
(This article belongs to the Section Ocean Engineering)

Abstract

This study presents a series of hydrodynamic experiments on a novel pontoon-type offshore floating photovoltaic (OFPV) structure, designed to improve wave attenuation performance and platform stability in marine environments. Using a 1:14 Froude-scaled physical model capable of representing different connector stiffness levels, nine structural configurations were tested, covering four array scales, three stiffness levels, and two floater sizes. Experiments were conducted under regular wave conditions, with structural responses measured at three representative positions: wave-facing front (T1), mid-array (T2), and leeward side (T3). Recorded parameters included surge acceleration, heave acceleration, pitch angle, and heave displacement. Results show that increasing array scale consistently reduced motion amplitudes at all positions, with heave acceleration at T3 substantially decreased compared with the smallest array. Enhancing connector stiffness significantly suppressed dynamic motions, particularly downstream, while larger floaters notably reduced heave responses under short-period waves. Despite variations in magnitude, response trends with respect to wave period remained broadly consistent across configurations. These findings provide quantitative evidence and engineering guidance for optimizing array configuration, connector stiffness, and floater dimensions to enhance the hydrodynamic performance and operational reliability of large-scale offshore FPV platforms.

1. Introduction

Global energy demand continues to rise with societal development. Despite fossil fuels remaining dominant in the energy market, growing concerns over greenhouse gas emissions and resource depletion have expedited the transition to cleaner and more sustainable energy sources [1]. While hydropower was once the fastest-growing renewable energy source, solar energy has now surpassed it and is receiving increasing global attention [2].
Solar energy technologies are primarily divided into photovoltaic (PV) and solar thermal systems. Among these, PV technology, which directly converts solar radiation into electricity through semiconductor materials, has gained widespread adoption due to its scalability, modularity, and rapidly decreasing costs [3]. Recent studies have further explored system-level approaches to enhance photovoltaic energy utilization efficiency through advanced optical and thermal management concepts, demonstrating that improving PV performance remains an active research focus beyond conventional module-level optimization [4]. However, land-based PV systems typically require large land areas, which may disrupt terrestrial ecosystems, while distributed PV installations generally offer limited generation capacity. In contrast, the abundance of coastal and inland water resources in many countries makes floating photovoltaic (FPV) systems an attractive solution to land-use limitations [5].
Compared to land-based PV installations, FPV systems offer several key advantages. First, PV panels placed on water are naturally cooled, improving conversion efficiency and extending equipment lifespan [6]. Second, shading from the arrays reduces light penetration, suppresses algal growth, and helps maintain better water quality [7]. Third, FPV systems lower surface water temperatures and reduce evaporation losses in reservoirs and ponds [8]. Additionally, the open environment of water bodies simplifies array layout and installation [9]. Finally, FPV platforms can be integrated with offshore wind or wave energy converters to create hybrid renewable systems that share mooring and power conditioning infrastructure, enhancing space utilization and total energy output [10].
Currently, FPV systems are primarily deployed in freshwater environments, such as lakes, reservoirs, and wastewater treatment ponds [11]. However, concerns about land use and ecological impact in sensitive freshwater areas have shifted focus to the vast potential of marine environments [12]. Recent review studies have highlighted that offshore and nearshore FPV is increasingly viewed as a strategic direction for large-scale renewable energy deployment, especially in coastal waters where space is abundant and hybridization with other marine energy systems is feasible [13]. At the same time, these studies also emphasize that FPV still faces significant engineering barriers to full offshore commercialization, including survivability under harsh wave and wind conditions, mooring reliability, corrosion resistance, and long-term maintainability [14,15]. Large-scale commercial deployment in open seas has not yet been achieved, and current projects remain in the prototype testing and small-scale demonstration phases [14]. Nevertheless, the maturity of land-based PV systems provides valuable technical insights and design references for the development of offshore FPV [16].
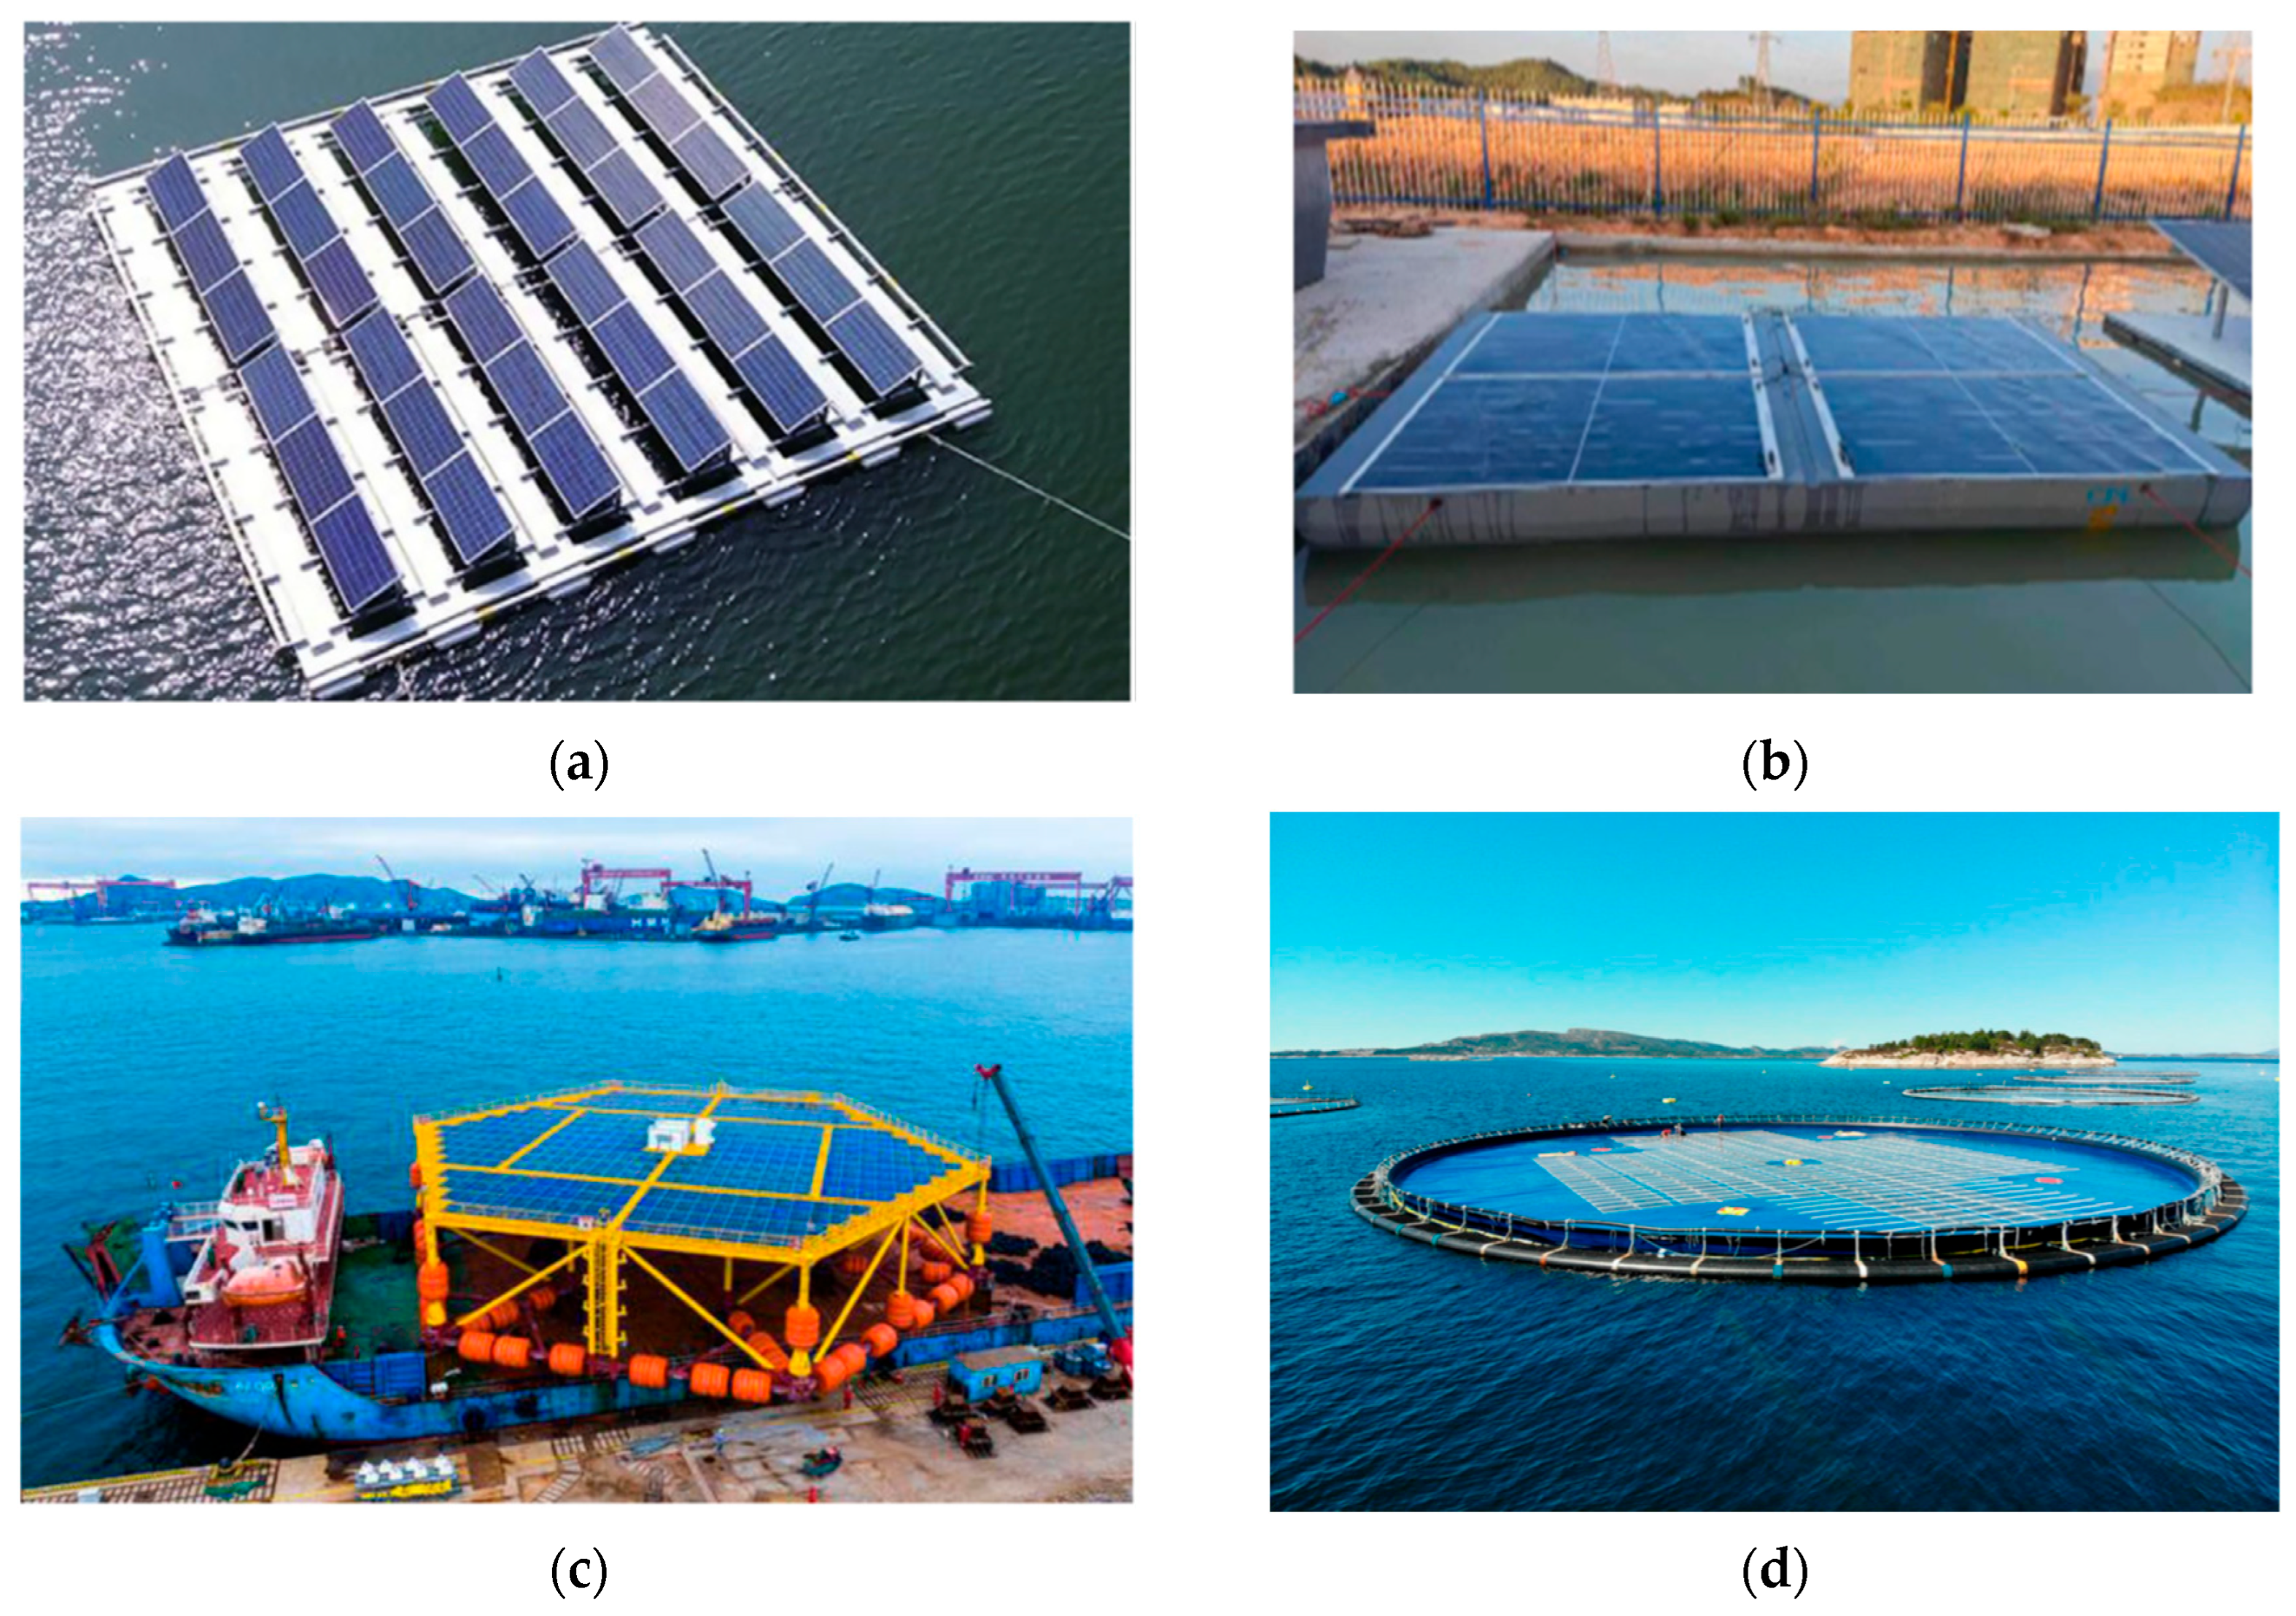
Marine FPV systems are generally categorized into four main structural types: (1) pontoon-type or tubular float structures, (2) high-performance concrete floaters, (3) semi-submersible truss platforms, and (4) flexible membrane structures. Figure 1 presents representative examples of these platforms currently in use [17,18,19], and Table 1 summarizes their main advantages and disadvantages [17].
Recent studies on dynamic response and safety evaluation of engineering structures under complex environmental loading have emphasized the critical role of coupled response mechanisms in determining system stability, which is directly relevant to offshore floating photovoltaic arrays subjected to wave excitation [20].
Numerical studies have significantly advanced the understanding of offshore FPV system dynamics and design. Chen et al. [21] developed a coupled hydrodynamic–structural model using the finite element method and static condensation, achieving high computational efficiency and improved accuracy for large floating arrays. Ou et al. [22] employed computational fluid dynamics (CFD) to assess the seakeeping performance of box-shaped and catamaran-type pontoons, demonstrating that catamaran configurations enhance station-keeping and reduce mooring forces under wave action. Song et al. [23] investigated single-row FPV systems subjected to combined wind, wave, and current loads, finding that wave forces dominate the dynamic response, with resonance occurring when the wavelength approaches the system length. Jifaturrohman et al. [24] analyzed multibody single-row FPV configurations under various wave spectra, showing that increasing the number of floating modules effectively reduces heave, pitch, and roll, thereby improving overall platform stability. Xiong et al. [19] numerically demonstrated that membrane-type FPV systems maintain good seakeeping and stability under coupled wave–current conditions. Magkouris et al. [25] used the boundary element method (BEM) to investigate catamaran-type FPV systems in different water depths, revealing that wave-induced motion can lead to up to a 15% variation in power output depending on sea state. Xu et al. [26] constructed a fully coupled wind–wave–current model to evaluate array layouts, concluding that rectangular configurations offer superior system stability. Shi et al. [27] adopted the beam-connected rigid body module (BCDM) method in the frequency domain to analyze hydroelastic responses, highlighting significant motion amplitudes of internal floaters under certain wave conditions. In terms of connection optimization, Ma et al. [28] found that rigid pontoon connectors improve deployment feasibility and load transfer compared to conventional polyester rope. He et al. [29] validated a flexible multibody connection scheme using smooth particle hydrodynamics (SPH) simulations and experiments, confirming its adaptability to wave action. Finally, Wang et al. [30] proposed a novel star-type FPV system and found that its mooring response is more sensitive to wave conditions than to connector stiffness variations.
Physical model experiments have provided crucial insights into the hydrodynamic performance of offshore FPV systems. Friel et al. [31] conducted tests on horizontally semi-submerged cylindrical FPV structures and observed that surge forces increase with wave steepness, with dual-cylinder configurations experiencing greater loads. Yang et al. [32] compared conventional flat-type and catamaran-type FPV platforms in wave flume tests, demonstrating that the catamaran design offers better wave resistance in long-wave conditions and, when combined with breakwaters, significantly reduces wave-induced motions and mooring loads. Xue et al. [33] evaluated the dynamic response of a PV support platform equipped with a U-shaped tuned liquid column damper (TLCD), finding that the TLCD effectively suppresses vibrations near the system’s natural frequency. Saw et al. [34] investigated mechanical loads on FPV platforms through physical testing and proposed an improved stress measurement methodology. Zhang et al. [18] analyzed the hydrodynamic impact of different mooring configurations for membrane-type FPV systems, concluding that both the number and length of mooring chains substantially affect platform motions and mooring forces.
Although studies on pontoon-type offshore floating photovoltaic (FPV) structures began earlier than those on other FPV configurations, most have focused on the dynamics of single floaters or basic array arrangements. Systematic analysis of the coupled effects of key structural parameters, such as array scale, connection stiffness, and floater size, with wave period is still lacking. Moreover, most existing studies primarily rely on numerical simulations and lack sufficient validation through physical experiments.
Despite these efforts, significant hydrodynamic research gaps remain. Current studies seldom quantify how array scale influences collective motion modes, how connector stiffness modifies load transfer and damping behavior, or how floater size governs motion responses and overtopping risks across different wave conditions. Additionally, the absence of large-scale physical validation limits confidence in the applicability of numerical results to offshore deployment. Addressing these gaps is critical for developing reliable design guidelines for offshore FPV systems.
To address these research gaps, this study investigates the hydrodynamic performance of a novel pontoon-type offshore FPV structure through physical model experiments. The experimental setup is designed to systematically examine the effects of array scale, connector stiffness, and floater size on platform motion responses. Furthermore, wave overtopping events were visually recorded, and overtopping frequency maps were generated for different array regions, enabling the quantitative evaluation of overtopping behavior.

2. Theoretical Basis

2.1. Similarity Criteria

For conventional offshore engineering structures, motions in the ocean are generally regarded as rigid-body motions. However, for box-type floating arrays, hydroelastic responses are highly significant and even dominate the overall dynamic behavior of the structure. This requires the experimental model to satisfy geometric similarity, hydrodynamic similarity, and structural similarity. Only under these similarity conditions can the correct hydrodynamic response data of the structure be obtained. In the following description, the subscript p denotes the prototype quantities, while m denotes the model quantities.
(1) Geometric similarity
Geometric similarity means that a fixed proportional relationship exists between the linear variables of the prototype and the model, i.e., the ratio of corresponding linear dimensions remains constant. Thus, the length scale ratio is
λ l = l p l m ,
where l is the geometric length. From this, the area and volume scale ratios can be derived.
(2) Hydrodynamic similarity
For fluids dominated by gravitational forces, the Froude similarity criterion must be satisfied:
v p g p l p = v m g m l m ,
where v is velocity, g is gravitational acceleration, and l is the characteristic length.
For periodic unsteady flows associated with wave motions, the Strouhal similarity criterion must also be satisfied:
v p T p l p = v m T m l m ,
where v is velocity, T is wave period, and l is the characteristic length.
(3) Structural similarity
For novel pontoon-type floating arrays, it is necessary to ensure deflection similarity between the prototype and the model, which yields
Y p Y m = λ ,
Y F L 3 E I ,
where Y is deflection, F is structural load, E is elastic modulus, and I is moment of inertia.
Through dimensional analysis, it follows that
E p I p E m I m = λ 5 ,
In the box-type array structure, the boxes are connected by ear plates without gaps. The loads on the ear plates are provided by the relative rotation and sidewall deformation of the connected boxes. Therefore, the structural model must also satisfy the similarity of sidewall elastic deformation:
Δ l p Δ l m = λ ,
Δ l F L E A ,
Through dimensional analysis, it follows that
E p A p E m A m = λ 3 ,
where Δl is compressive deformation, F is structural load, E is elastic modulus, and A is cross-sectional area.
Based on the above similarity criteria, the model scale relationships can be derived, and they are summarized in Table 2.

2.2. Wave Generation Theory

In the description of regular waves, linear wave kinematics is generally adopted as the basis. Linear theory assumes small wave steepness and incompressible fluid under potential flow conditions, and it presents the free surface as
η ( x , t ) = ζ cos ( k x ω t ) = H 2 cos ( k x ω t ) ,
where ζ is the wave amplitude, k = 2π/L is the wave number, ω = 2π/T is the angular frequency, L is the wavelength, and T is the wave period. These parameters satisfy the dispersion relation:
ω 2 = g k tan h ( k d ) ,
where d is the water depth and g is the gravitational acceleration. This relationship is employed to convert between period and wavelength, providing the basis for the unified coordinate system used in subsequent results.
However, considering that the box-type array investigated in this study is located in intermediate and shallow water, with relatively large wave steepness, the linear theory alone is insufficient to capture the asymmetry between crests and troughs. To better reproduce realistic conditions, second-order Stokes wave theory is applied for the generation of regular waves. The free surface elevation is expressed as
η ( x , t ) = H 2 cos ( k x ω t ) + π H 2 4 L ( 1 + 3 2 s i n h 2 ( k d ) ) cot h ( k d ) cos ( 2 ( k x ω t ) ) ,
where H is the wave height, and the other parameters are the same as above. The first term represents the primary linear component, while the second term is the second-order correction, reflecting the nonlinear characteristics of the wave profile.
Therefore, in this study, the conversion between wavelength and period still follows the linear dispersion relation, whereas the incident wave profiles are generated based on the second-order Stokes approximation. This ensures geometric similarity while more accurately reproducing nonlinear wave features under intermediate and shallow water conditions.

2.3. Response Amplitude Operator (RAO)

The Response Amplitude Operator (RAO) is defined under the assumption of a linear relationship between the hydrodynamic response of a floating system and the incident wave excitation. Specifically, when subjected to monochromatic (regular) waves, the RAO is expressed as the ratio of the response amplitude of the system to the incident wave amplitude at the corresponding wave period. For the novel offshore floating photovoltaic (FPV) box-type array considered in this study, the RAO can be applied to different response components, including floater motion responses, connector stresses, and mooring line tensions. The general definition is given by
RAO x = f ( T ) = x T A T ,
where xT is the amplitude of the system dynamic response (e.g., surge, heave, pitch, connector stress, or mooring tension), AT is the incident wave amplitude, and T denotes the incident wave period.
This formulation provides a normalized, dimensionless transfer function that characterizes the frequency-dependent response behavior of the FPV platform. By analyzing RAOs, the dynamic amplification, resonant features, and energy dissipation mechanisms of the structure can be systematically evaluated under different wave conditions.

2.4. Simplified Chain Model of the Pontoon Array

The tested arrays consist of multiple pontoons arranged in columns, with the transverse number fixed while the longitudinal array length is gradually increased (e.g., 5, 10, 15, 20 units). Under regular wave excitation aligned with the array’s longitudinal axis, transverse effects are relatively weak, and the measurement stations are located along the wave incidence direction. Hence, the global dynamics of the system can be reasonably approximated by a one-dimensional chain representation, where each pontoon column is modeled as a rigid body and the inter-column lugs are represented as torsional springs.
In this one-dimensional mass–torsional spring chain model, each unit is characterized by its effective rotational inertia Ie about the hinge axis, and adjacent units are connected by rotational springs with stiffness kθ. The mooring system at both ends is simplified as fixed boundary conditions.
For a chain of N units with fixed–fixed boundaries, the angular frequency of the m-th mode ωm (m = 1, 2, …, N) is given by
ω m = 2 k θ I e sin ( m π 2 ( N + 1 ) ) ,
This simplified chain model provides a clear description of the longitudinal modal characteristics and offers a practical reference for subsequent comparison with finite-element predictions and experimental observations. Nevertheless, the chain-model framework is used here as a qualitative interpretative tool to explain length-dependent response trends rather than to provide a full modal identification for each array configuration.

3. Physical Model

3.1. Experimental Conditions

The experiments were carried out at the State Key Laboratory of Hydraulic Engineering Intelligent Construction and Operation, Tianjin University. The wave flume used in this study measures 90 m × 2 m × 2 m, with a maximum effective water depth of 1.5 m. It is equipped with a wave generator that produces stable and repeatable waves, covering periods from 0.5 s to 5 s and wave heights up to 0.5 m.
During the experiments, BG-type wave gauges (Waterborne Transport Research Institute, Beijing, China;measuring range: 40 cm; accuracy: 0.2 mm) were used to record free surface elevations, ensuring precise capture of incident and transmitted wave conditions. The attitude and acceleration of the floating boxes were measured by a BWT901CL nine-axis wireless gyroscope (WitMotion, Shenzhen, China). The gyroscope provided an acceleration range of ±16 g and angular ranges of ±180° (X and Z axes) and ±90° (Y axis), with an angular resolution of 0.0055°/LSB and an acceleration resolution of 0.5 mg/LSB. This high-resolution sensor arrangement allowed for comprehensive monitoring of the six-degree-of-freedom motion of the floating units. Measurement data were transmitted in real time to a host computer via Bluetooth, with the sampling frequency adjustable from 0.2 to 200 Hz, enabling flexible acquisition under different wave conditions. Heave displacement was measured separately using a video-based tracking system, while the gyroscopes were used specifically for acceleration and rotational measurements.
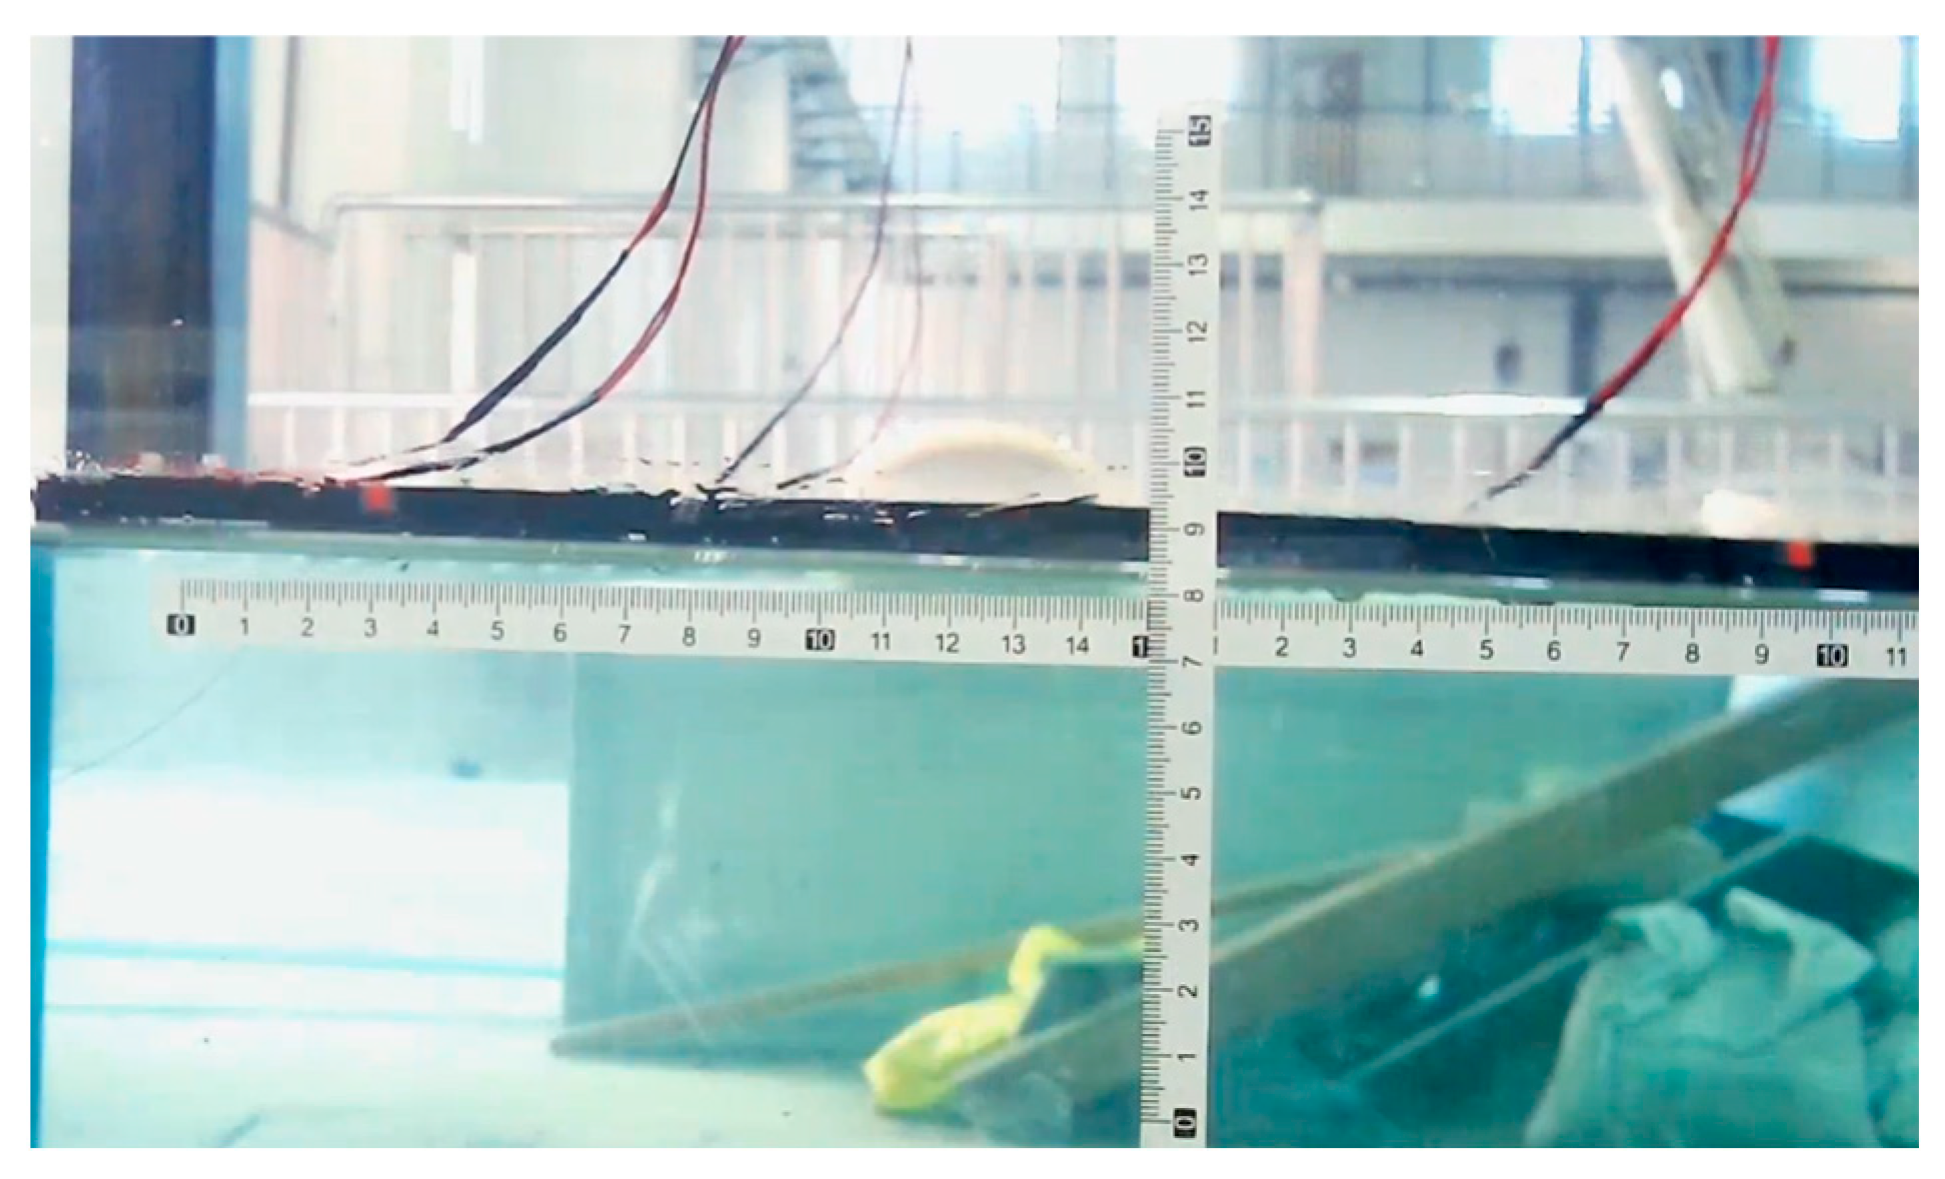
To accurately measure the heave response, visual markers were attached to the sidewalls of the floating box. A side-view camera (Nikon, Tokyo, Japan), positioned perpendicular to the array with its optical axis aligned horizontally at waterline level, continuously recorded box motion, and displacement data were extracted from the video frames using automated image recognition and calibration techniques. This visual approach provided an independent and reliable method to validate gyroscope data and ensured high spatial and temporal resolution for displacement analysis. A representative video frame used for measurement is shown in Figure 2.

3.2. Experimental Model

This study focuses on a novel pontoon-type offshore photovoltaic structure. The key prototype parameters are summarized in Table 2. The hydroelastic model of the pontoon-type array was designed to satisfy both geometric and structural similarity requirements. Geometric similarity ensures consistent scaling between the prototype and the physical model. Since the thickness of the connecting lugs is much smaller than their length or the box height, and because they provide inter-unit stiffness without directly interacting with water, scaling the lug thickness is not required in the model, as calculations have confirmed that its influence on the overall structural response can be neglected, and it is sufficient to satisfy the similarity of bending stiffness.
For structural similarity, it is essential that the flexural rigidity of the floating boxes be much greater than that of the connection lugs (see Table 2), so that the global flexural deformation of the array is governed primarily by the bending of the lugs, while the deformation of the boxes themselves can be neglected, as confirmed by preliminary calculations. The deflection of each lug depends on its own bending stiffness and the local compressive stiffness at the lug-to-box joint. To accurately replicate the prototype behavior, both parameters must be properly scaled in the physical model.
Since the thickness of the connection lugs is not scaled, it is not necessary to match the Young’s modulus or moment of inertia exactly between the model and the prototype. Although this leads to some differences in stress–strain response, the bending moment, which is used here as the primary structural metric, still meets the similarity requirements. This approach simplifies material selection and fabrication of the model.
To achieve the required flexural rigidity for the connection lugs, high-density polyethylene (HDPE) was selected for its ease of processing. With an elastic modulus of 0.9 GPa, and considering manufacturing constraints, a scale ratio of 1:14 was adopted. The model lugs were designed with a width of 2.2 cm and a thickness of 0.1 cm, corresponding to a prototype cross-section of 30 cm by 3.4 cm. This configuration satisfies the flexural rigidity requirements while remaining practical for fabrication. The chosen scale also ensures that multiple floating boxes can be accommodated in the wave flume, supporting effective model testing.

3.2.1. Connection Lugs and Floating Box Model of the Novel Offshore FPV Structure

(1) Connection Lug Model
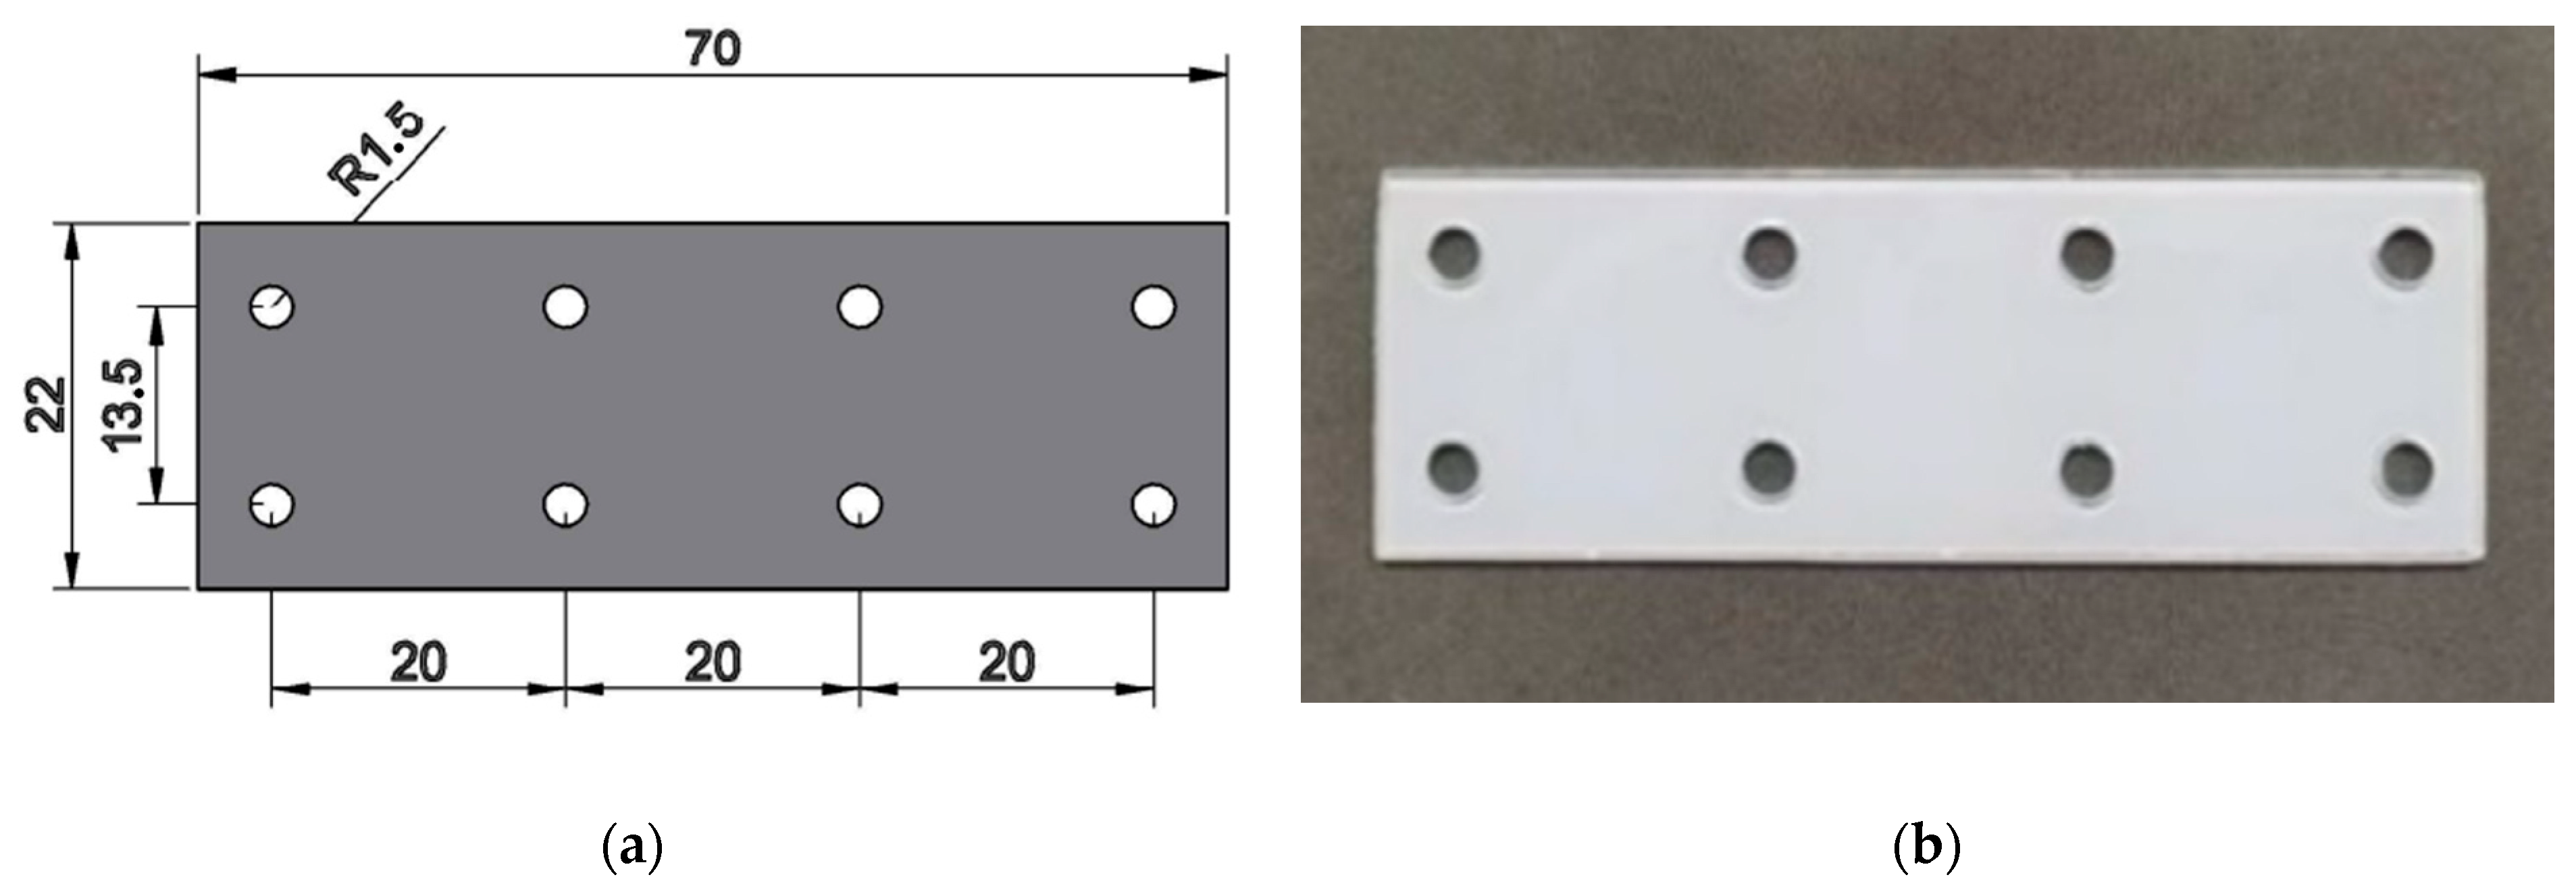
The connection lugs were made from high-density polyethylene (HDPE) with a Young’s modulus of 0.9 GPa. To facilitate practical fabrication and to reasonably reproduce the intended rotational compliance of the scaled connections, several candidate effective free lengths were considered based on preliminary equivalent-stiffness estimates, and an effective free length of approximately 1 mm was finally selected as the most suitable value. Each lug has a cross-sectional dimension of 2.2 cm in width and 0.1 cm in thickness, resulting in a flexural rigidity of 1.65 × 10⁻³ N·m2. This value is consistent with the bending stiffness similarity requirement based on the prototype flexural rigidity of 894.10 N·m2 and the λ5 scaling law (λ = 14). To accommodate mounting bolts and strain gauges, the planar dimensions of the lugs were slightly increased, as shown in Figure 3a. A photograph of the fabricated lug is presented in Figure 3b.
(2) Floating Box Model
The floating box models were scaled at a ratio of 1:14 according to the prototype dimensions, as detailed in Table 3, and the main geometric dimensions of the model are summarized in Table 4. The prototype is a thin-walled hollow structure with internal compartments, but at this scale, it is impractical to replicate all internal features. Therefore, the experimental model uses a solid floating block to represent the box, retaining the external geometry while omitting internal compartments. The model material was chosen to achieve the same average density as the prototype, thereby satisfying the requirements for buoyancy and mass similarity in the physical model tests.
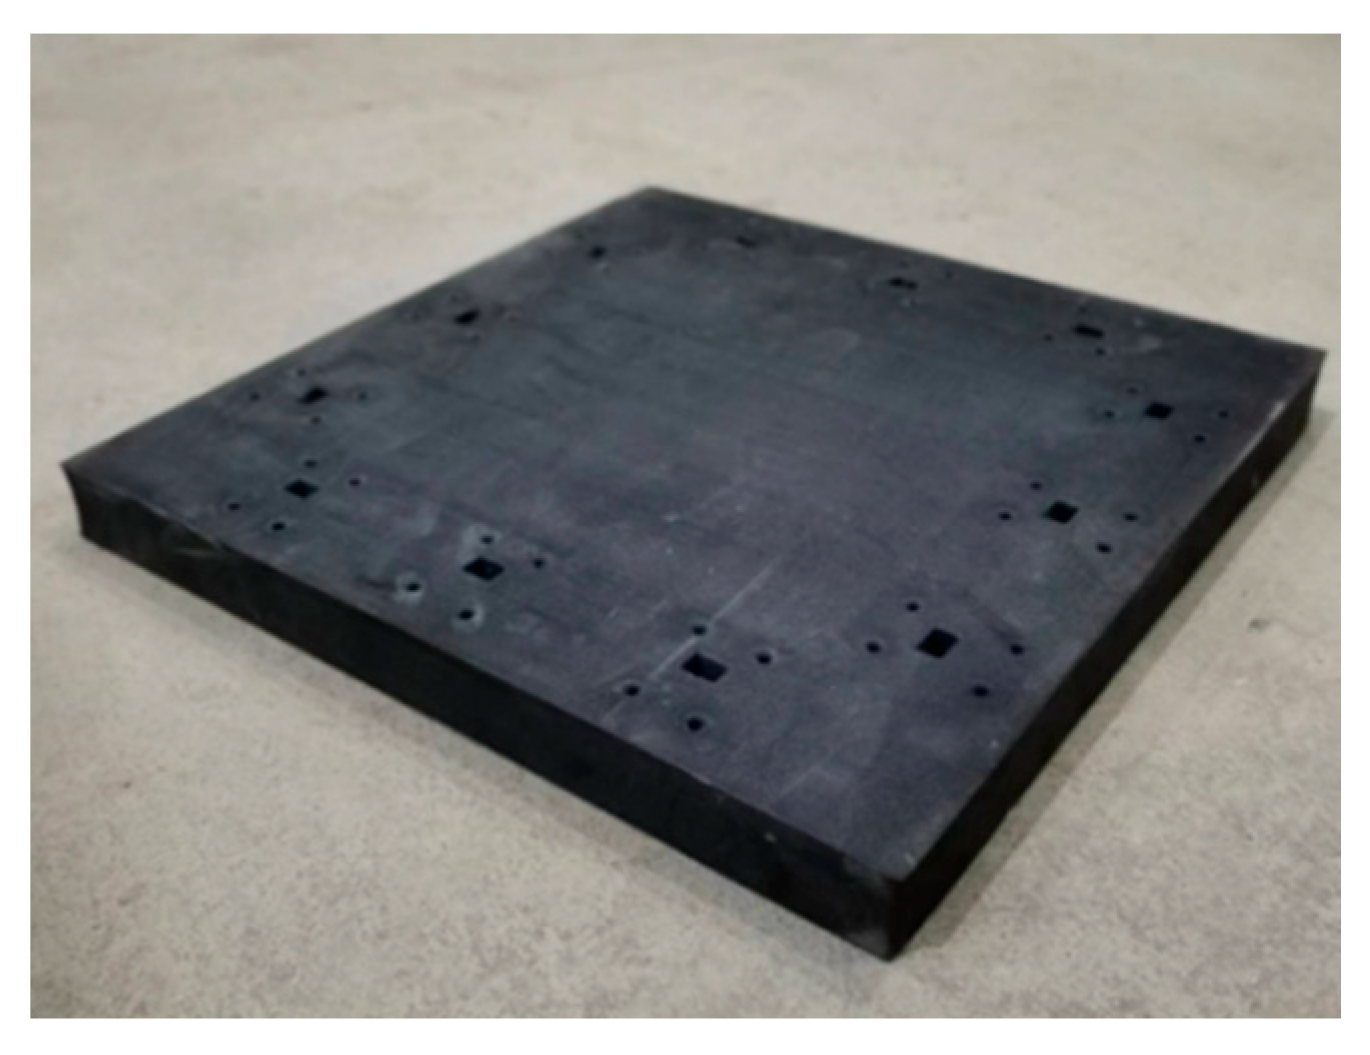
The compressive deformation of the box sidewalls is caused by the relative rotation between adjacent units under wave loading. Because the prototype uses a shell structure while the experimental model adopts solid blocks, the required Young’s modulus for structural similarity cannot be determined analytically. To resolve this, finite element analysis (FEA) was performed in ABAQUS using the shell representation of the prototype as the reference. A unit rotational displacement was applied under linear elastic conditions, and the corresponding reaction forces of the shell model were used as the benchmark. The Young’s modulus of the solid model was then iteratively adjusted until its response matched that of the shell model. This procedure yielded an equivalent modulus of approximately 7.2 MPa, which was adopted in subsequent analyses to ensure structural similarity between prototype and model. Although a formal sensitivity study of the equivalent Young’s modulus was not conducted, the modulus was calibrated to ensure that the floating boxes remain significantly stiffer than the connector lugs, so that the global flexibility of the array is governed primarily by lug compliance. Under this stiffness hierarchy, moderate variations in the equivalent modulus are not expected to qualitatively affect the dominant modal characteristics or the main RAO trends. Based on this, polyurethane foam with a density of 71.69 kg/m3 and an elastic modulus near 7.2 MPa was chosen for the floating box models. The foam blocks were machined to the specified dimensions, with through-holes on all four sides for bolted connections to the lugs. Each side was drilled with three sets of holes to allow flexible adjustment of the number of lugs. A photograph of the finished model is presented in Figure 4. Although the unscaled lug thickness and the solid-block replacement may indeed affect the local stress distribution around the connectors, the present study primarily focuses on the influence of connector stiffness on the global motion responses of the OFPV array.

3.2.2. Design and Fabrication of Floating Box Arrays

For clarity, the array layout is described using the terms “column” and “row,” where the column direction is defined as transverse (perpendicular to the direction of wave propagation), and the row direction is defined as longitudinal (parallel to wave propagation). The number of columns and rows are denoted by m and n, respectively, so the array configuration is represented as m × n. In this study, a range of experimental array models was developed to systematically examine how key structural parameters, including array scale, connection stiffness between units, floating box size, and the arrangement of mooring points, affect the hydrodynamic response of the pontoon-type offshore photovoltaic structure. These experimental designs enable a comprehensive evaluation of both local and overall motion behaviors, laying the groundwork for subsequent analysis of response mechanisms under different wave conditions.
(1) Array Scale of Floating Boxes
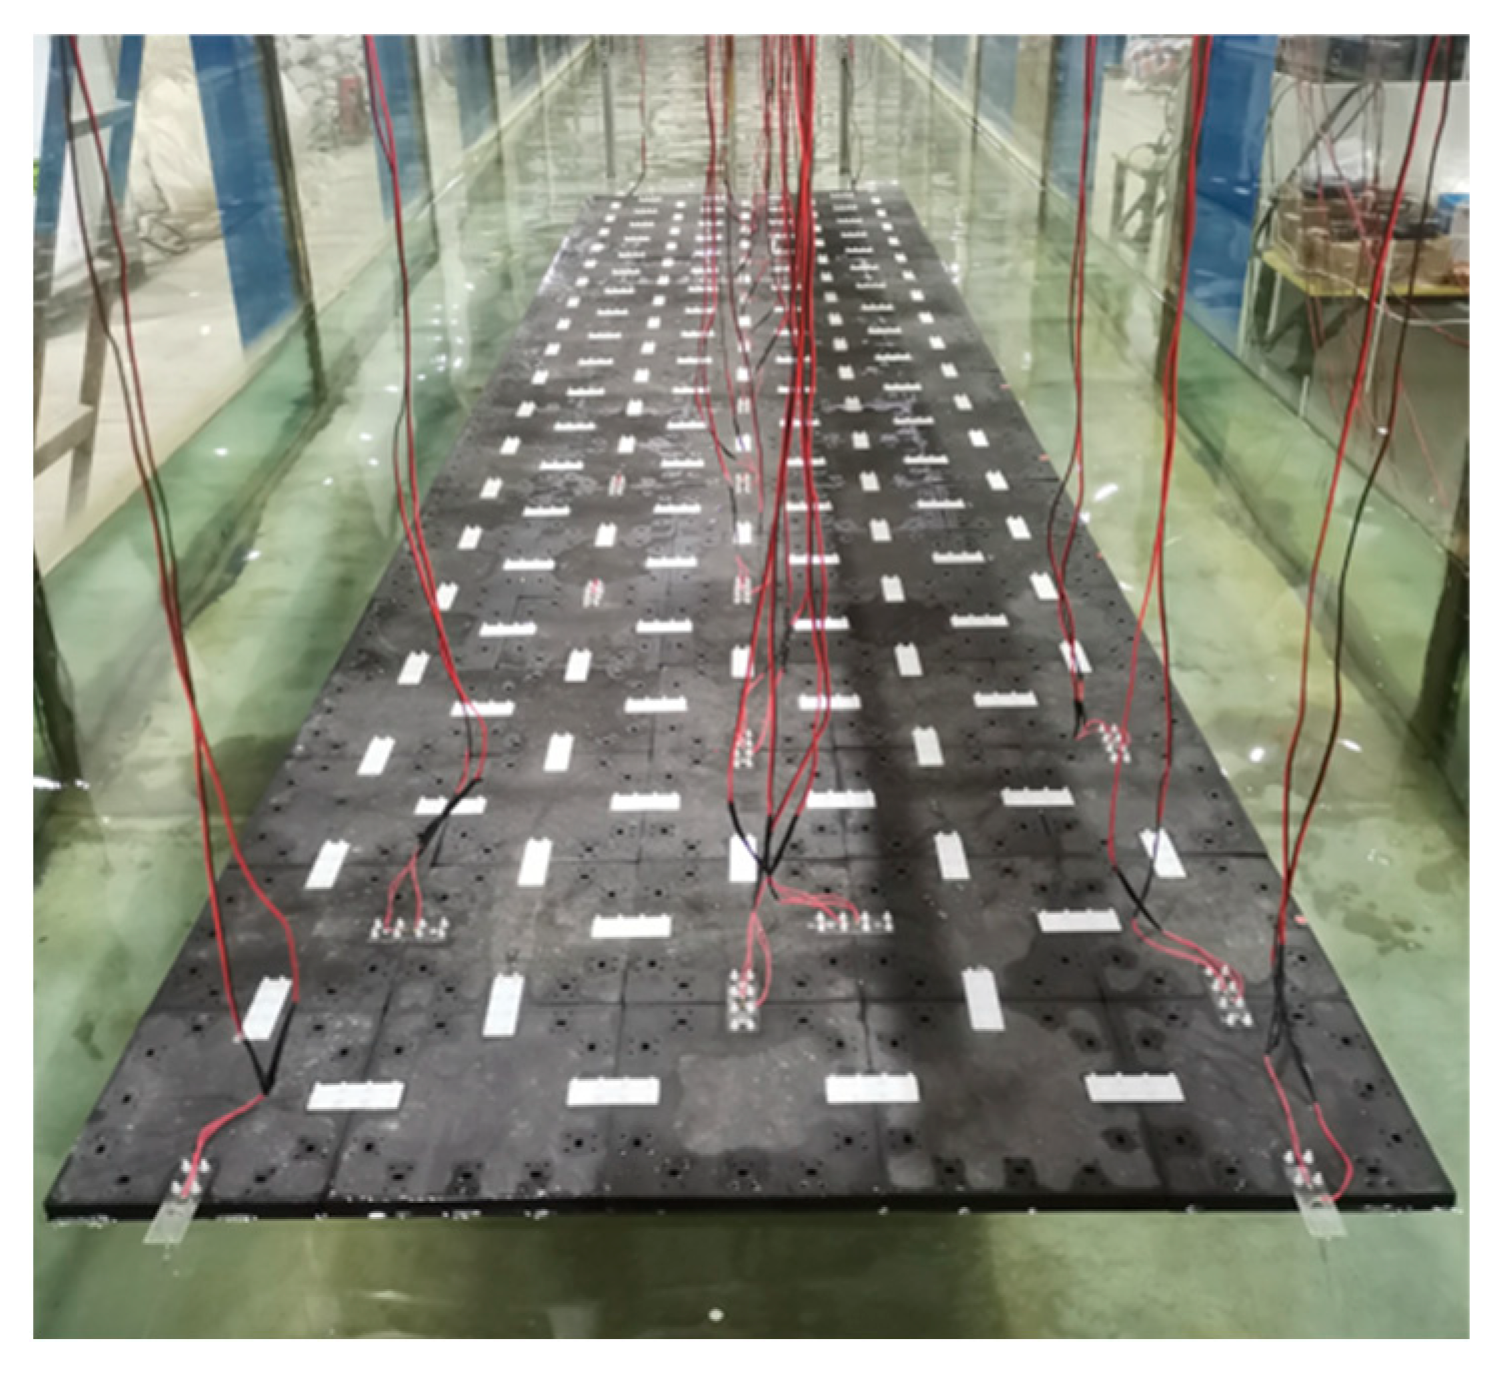
To investigate the influence of array scale on hydrodynamic response, the experiments were performed under unidirectional wave conditions, with only the array length in the direction of wave propagation being varied. The minimum array consisted of five floating boxes arranged longitudinally, serving as the basic test unit. Four array configurations were systematically studied: 5 × 5, 5 × 10, 5 × 15, and 5 × 20. By varying the number of floating boxes along the wave direction, the shielding effect and cumulative deformation characteristics could be assessed across different scales. This approach allows for a detailed analysis of how increasing array length impacts motion attenuation and overall structural dynamics. The configuration of the 5 × 20 floating box array is illustrated in Figure 5.
(2) Connection Stiffness Between Floating Boxes
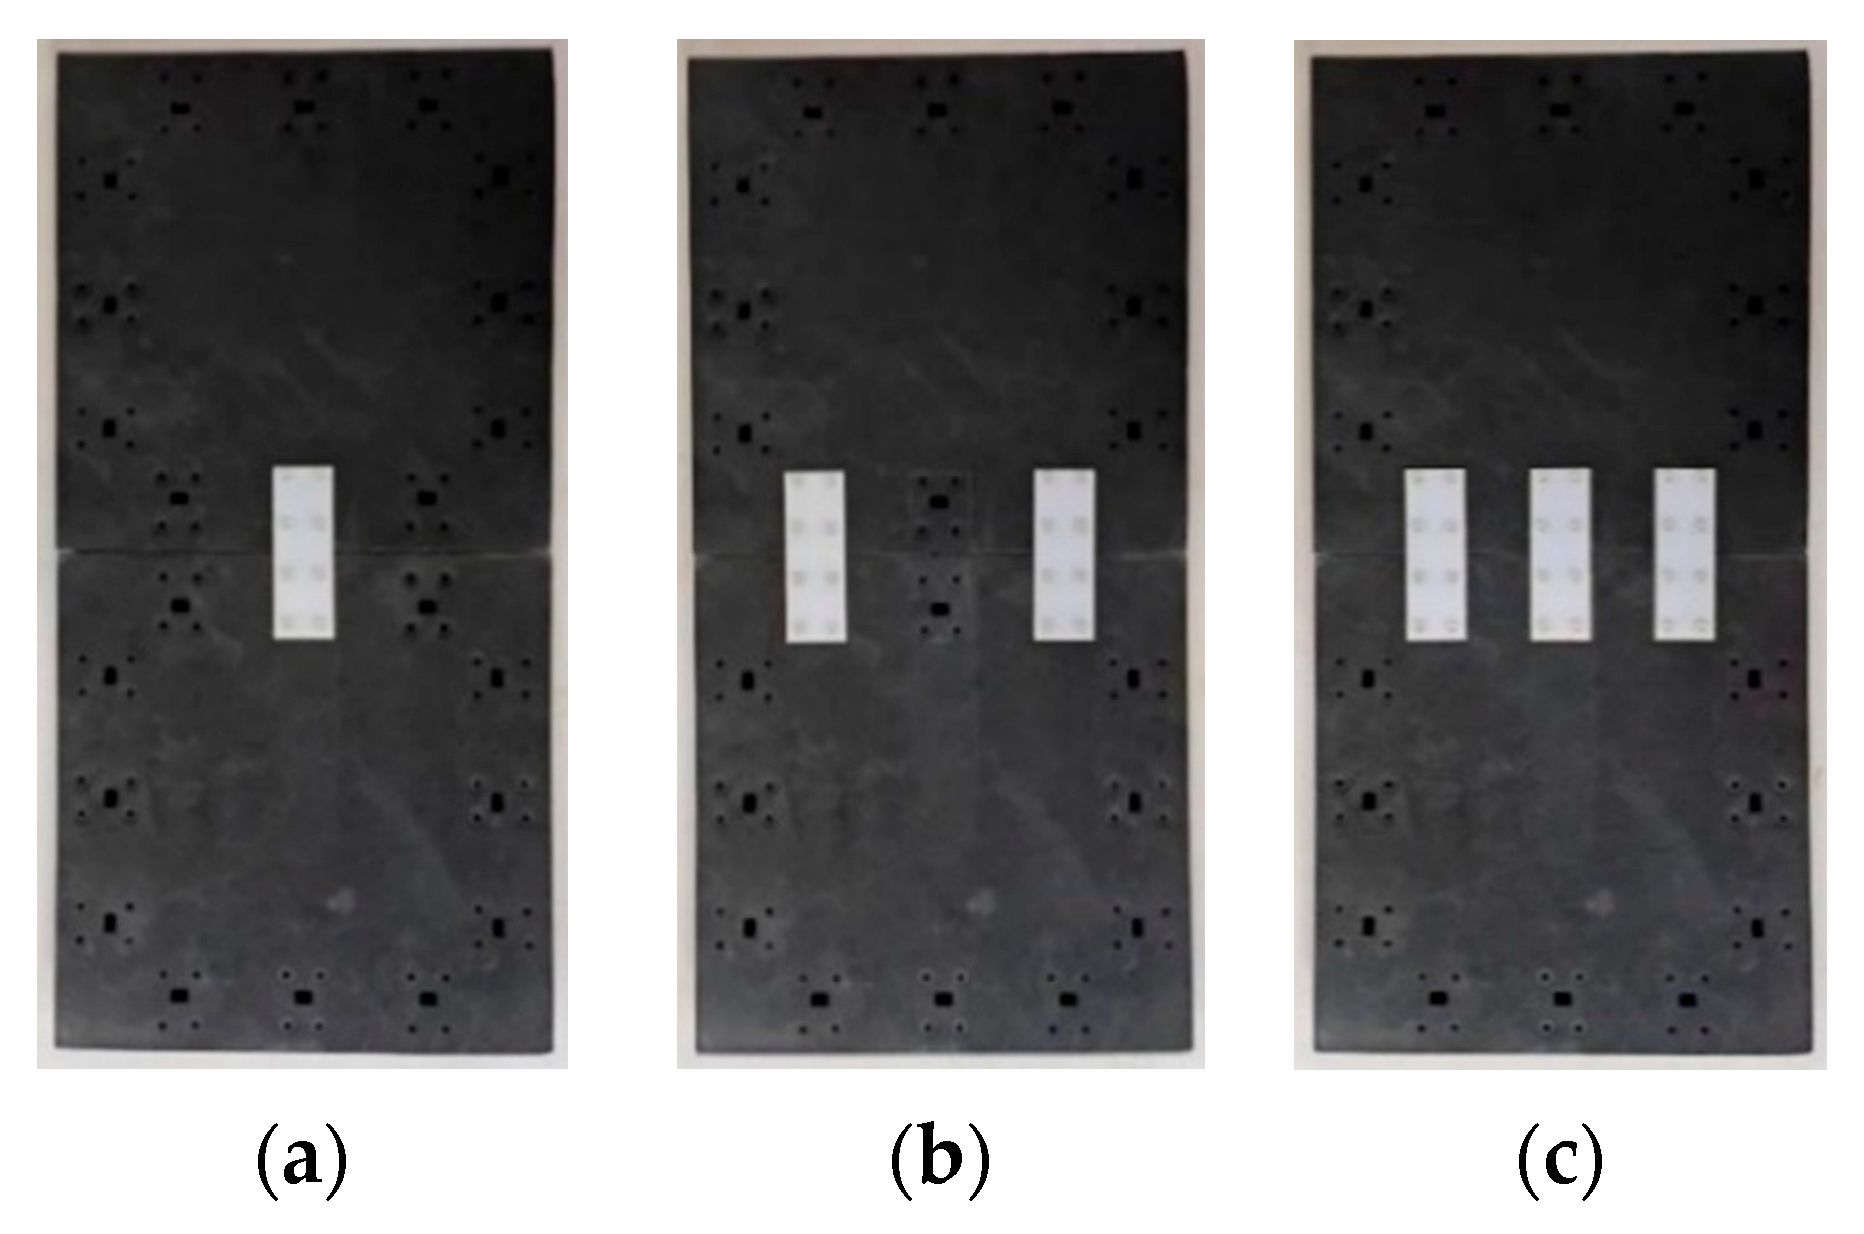
The connection stiffness between adjacent floating boxes was controlled by adjusting the number of lugs linking each pair of units. As shown in Figure 6, three levels of connection stiffness were examined: single lug (1×), double lugs (2×), and triple lugs (3×) per connection. All connection stiffness tests used a 3 × 12 array configuration, as employing three columns helped minimize lateral hydrodynamic interactions between adjacent rows. During preliminary trials, it was observed that longer arrays with narrower widths were prone to skewing due to asymmetric mooring forces or wave loads. A 12-unit longitudinal array provided sufficient stability and alignment with the incident waves for consistent measurement. Across all stiffness configurations, the method for connecting boxes was kept uniform to ensure comparability.
(3) Floating Box Size
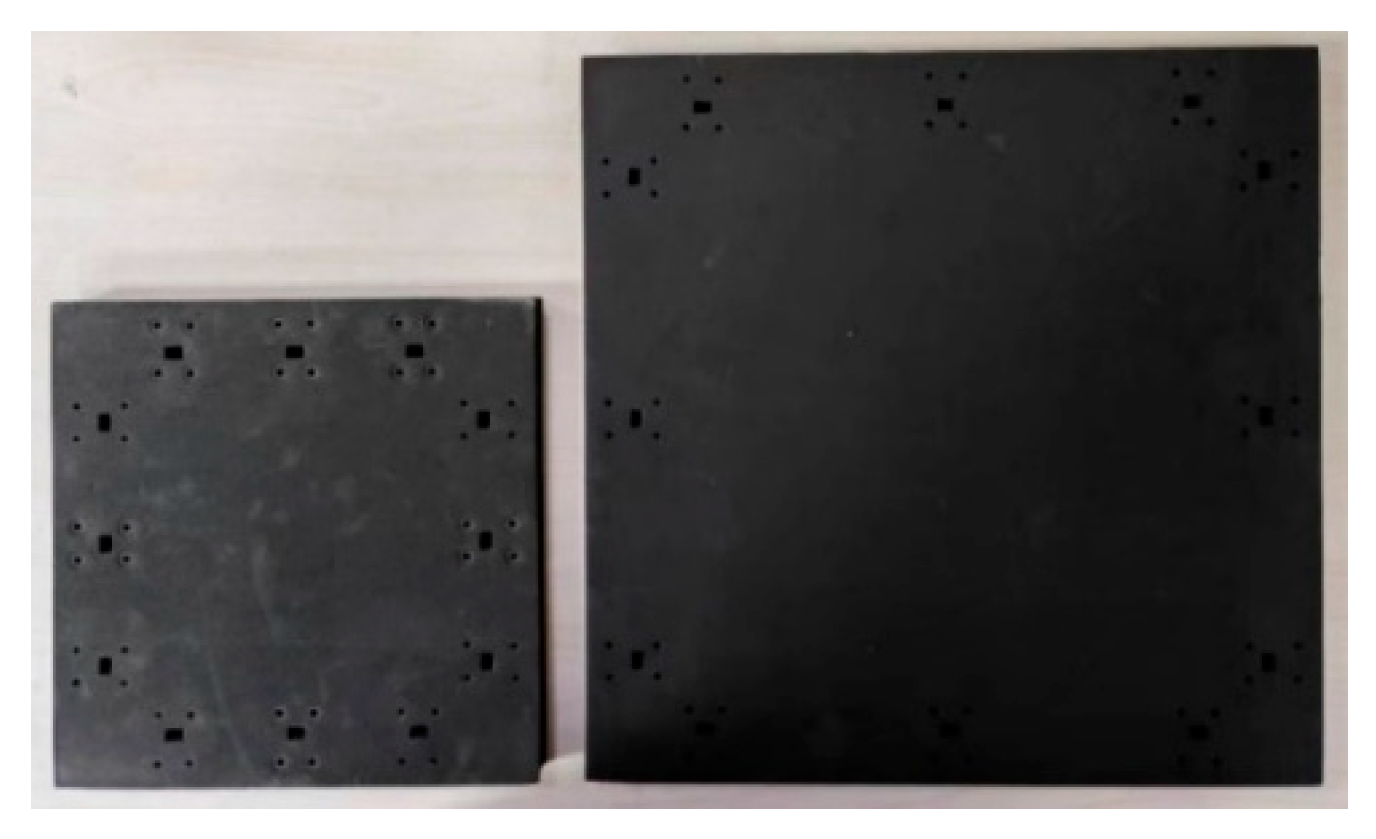
To evaluate the effect of floating box size on array dynamics, a set of large-box models was fabricated, each with a length and width 1.5 times greater than those of the standard design. The large-box array was arranged in a 2 × 9 configuration, chosen so that its overall scale matched that of the standard 3 × 12 small-box array. This parallel design ensured a fair and direct comparison between the two configurations under identical testing conditions. Schematics of both the small and large floating box models used in the experiments are shown in Figure 7.
The footprint-equivalent configurations are intentionally adopted to isolate practical array-scale effects. Under this controlled comparison framework, the observed differences represent the combined structural and hydrodynamic behavior of realistic FPV layouts rather than a purely geometric size effect, but the purpose of this comparison is to assess the overall response change at the array level under comparable footprint conditions.

3.2.3. Modal Validation of the Scaled Model

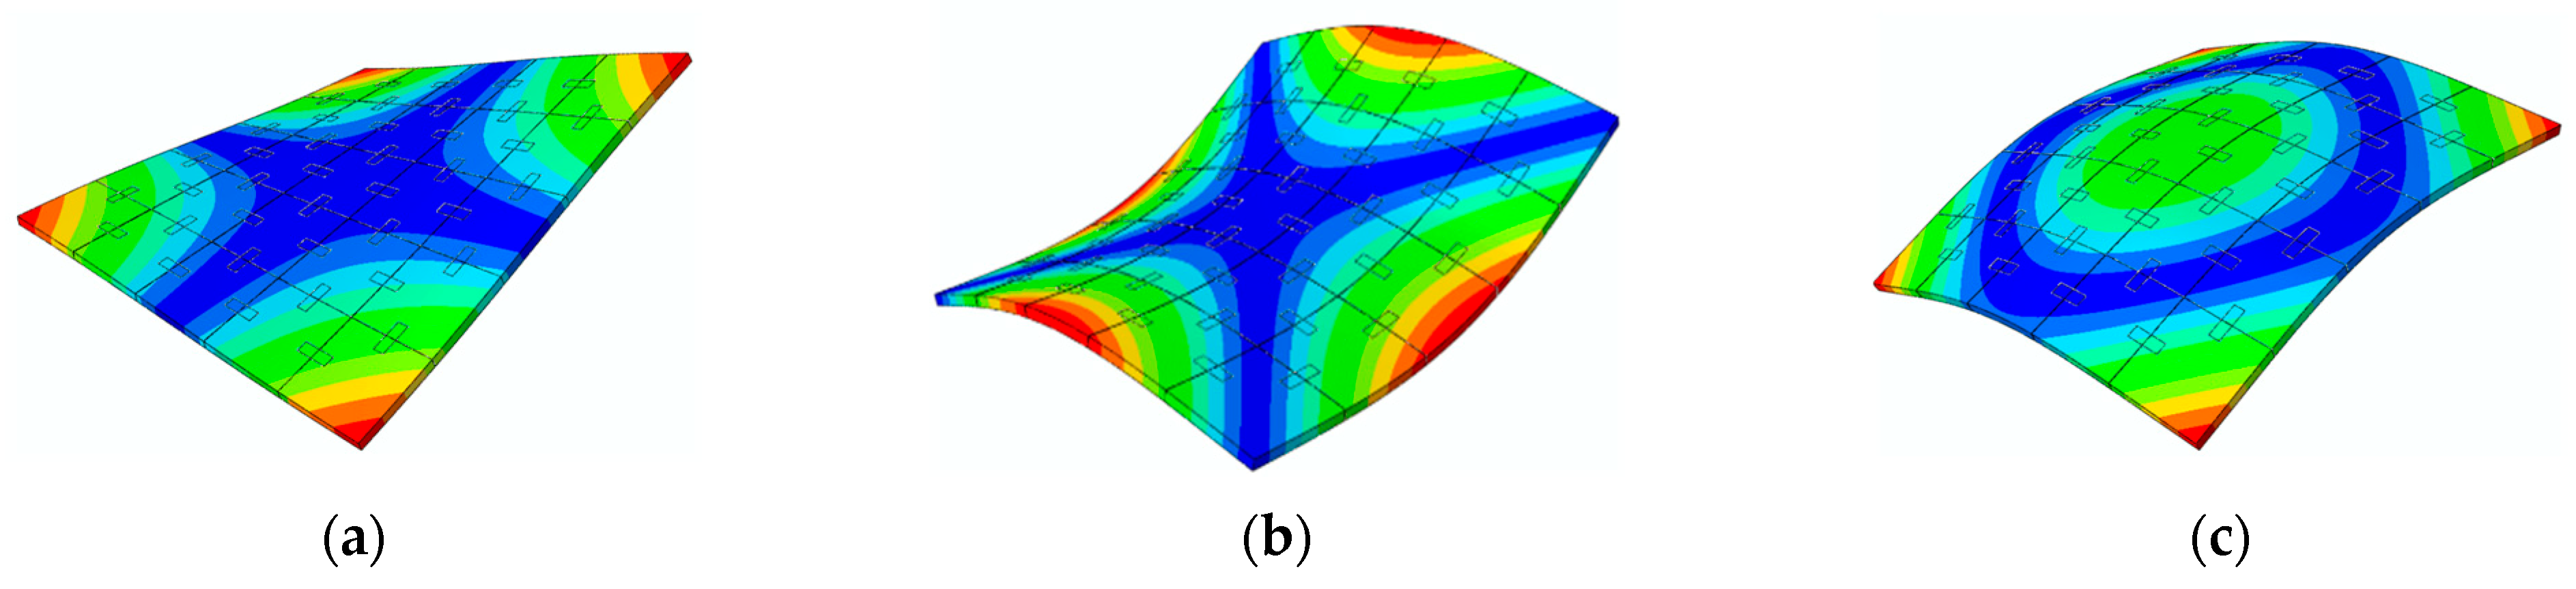
To confirm that the scaled physical model accurately reproduces the stiffness distribution of the prototype, modal analysis was conducted on a representative 5 × 5 floating box array using the ABAQUS 2017 finite element software. Both the natural frequencies and mode shapes were calculated for the prototype and the scaled model. This comparative analysis was essential for ensuring that the dynamic characteristics of the physical model faithfully reflect those of the full-scale structure. The resulting mode shapes and frequencies for both cases are presented in Figure 8 and Figure 9.
Comparison of the mode shapes shows that, while the prototype uses a shell structure resulting in some minor local plate deformations, these do not significantly affect the overall modal behavior. The global mode shapes of the scaled model closely match those of the prototype. After applying the appropriate scaling laws, the difference in the first natural frequency between model and prototype is within 5%, and the second and third modes differ by approximately 10–15%. These results confirm that the fabricated model successfully reproduces the stiffness characteristics of the prototype, validating its suitability for use in dynamic response experiments.

3.2.4. Comparison Between the Simplified Model and FE Results

To validate the one-dimensional torsional chain model introduced in Section 2.4, its predictions are compared with finite-element (FE) results. For an array of five pontoons, each pontoon has a mass of m = 0.0593 kg, length L = 0.200 m, and height H = 0.0214 m. The effective rotational inertia about the mid-height hinge axis at the end face is obtained using the parallel-axis theorem:
I e = 1 12 m ( L 2 + H 2 ) + m ( L 2 ) 2 7.93 × 10 4   kg m 2 ,
With lug bending rigidity EI = 1.65 × 10⁻³ N·m2 and effective free length Le = 1.0 mm, the joint stiffness is
k θ = E I L e 1.65   N m / rad ,
Substituting into the chain model,
ω m = 2 k θ I e s i n ( m π 2 ( N + 1 ) ) ,
for N = 5 and m = 1, the first natural frequency is
f 1 = ω 1 2 π 3.76   Hz ,
The FE analysis gave f1 = 3.64 Hz, with less than 5% deviation, confirming that the simplified chain model reasonably captures the longitudinal dynamic characteristics of the pontoon array.

3.3. Experimental Design and Test Conditions

3.3.1. Experimental Model Setup

The experimental investigation was conducted in a wave flume. To clearly describe the layout and motion of the floating box array, two coordinate systems were established: a fixed reference frame (O–XYZ) for the entire array and a moving frame (o–xyz) attached to each floating box, as illustrated in Figure 10.
The fixed coordinate system was defined with its origin at the midpoint of the wave-facing edge of the array, while the moving coordinate system was centered at the geometric centroid of the floating box being measured. Both systems use a common x-axis, aligned with the wave propagation direction, and a z-axis pointing vertically upward. Here, “front” and “rear” correspond to the incoming and outgoing wave directions, respectively. The y-axis is set as the transverse direction, perpendicular to wave propagation, while the x-axis serves as the longitudinal direction, parallel to the waves.
As waves passed through the flume and interacted with the model, partial reflection led to a superposition of incident and reflected wave components. To accurately assess wave attenuation, it was necessary to separate these components. Although a wave-absorbing beach was installed downstream to reduce reflections, complete absorption could not be achieved. Therefore, six wave gauges (W1–W6) were placed, three upstream and three downstream of the model, and the three-point method was used for wave separation. Specific spacings were set between the gauges, and all models were positioned symmetrically between W3 and W4, with a 3 m gap between the model and the nearest gauges, ensuring accurate measurement of both incident and transmitted waves. The measured wave reflection coefficients remained below approximately 0.15 both with and without the model, indicating that residual wave reflections were small and had a negligible influence on the RAO estimates reported herein.
The test water depth was set at 0.4 m, corresponding to the prototype’s high-tide condition after scaling. All floating box models were secured using a symmetric four-point mooring system. To focus on the effects of structural parameters, a horizontal mooring arrangement was adopted, restricting surge motion while permitting other degrees of freedom. The measured mooring tensions remained at a very low level, especially under longer wave periods, indicating that mooring dynamics did not significantly influence the motion responses and RAOs reported herein. Mooring points were positioned at the four corners of the array, with anchor points offset by 0.54 m (scaled) and mooring lines set to 0.82 m in length, providing 0.28 m of slack under still-water conditions. The overall experimental configuration, illustrated for the 5 × 20 array, is shown in Figure 10b.

3.3.2. Sensor Arrangement

The motion responses of the floating boxes were measured using wireless gyroscopes placed at three key locations along the wave propagation direction: the front, middle, and rear of the array. For example, in the 5 × 15 array, three floating boxes spaced evenly along the central column were instrumented. Gyroscopes T1, T2, and T3 were mounted to record the motion at the wave-facing (front), central, and leeward side (rear) positions, respectively. The monitoring point layout is illustrated in Figure 11.

3.3.3. Experimental Objectives

To systematically evaluate how array scale, connection stiffness, and floating box size affect the hydrodynamic response of the novel offshore floating photovoltaic structure, a series of physical model tests was conducted under controlled wave conditions.
To accurately assess the sensitivity of the structure to key parameters, all experiments were carried out using regular waves as the excitation source. Regular waves provide stable and repeatable test conditions, with fixed wave parameters and unidirectional propagation, minimizing spectral dispersion and coherence variability present in irregular waves. This approach ensures that observed variations in response can be directly attributed to changes in structural parameters. Additionally, the use of regular waves allows a clear analysis of how response amplitudes relate to wave period, enabling detailed study of wave–structure interactions.
In all model tests, each configuration was subjected to 8–10 groups of regular wave conditions, with each group lasting approximately 20 stable wave periods. To minimize reflection effects from the flume boundaries, the total wave-making duration was limited to about 40 s for each run. It was observed that the motion amplitudes became nearly constant over the selected 20 wave periods, with the peak-to-peak variation typically within approximately 5–10% of the mean value, indicating that the resulting RAOs were statistically stable. The motion responses, connector strains, and mooring forces were recorded and subsequently converted into RAOs. All response parameters were obtained by averaging over the stable portion of each time history, which effectively suppresses random fluctuations and ensures the repeatability of the measured results. The consistency across repeated wave runs confirmed the robustness of the processed data.
The experiments were divided into three groups according to the structural parameters being studied: (1) array scale tests, which assessed the impact of varying the number of units in the wave direction on hydrodynamic response; (2) connection stiffness tests, where the number of connecting lugs was changed to control overall array flexibility; and (3) box size tests, which examined how changes in unit dimensions affect array density and stiffness. To maintain comparability, all tests used regular waves with a constant height of 4 cm, while the wave period was varied over nine representative values to investigate structural responses across different wavelengths. The measured responses included surge acceleration, heave acceleration, pitch angle, and heave displacement. The specific sensor layout for data collection is provided in Section 3.3.2.

3.3.4. Wave Conditions

The regular wave conditions used in the experiments were selected to match the characteristic wave periods typical of the target offshore site. A constant wave height of 4 cm was maintained throughout to ensure small-amplitude wave conditions. The target and measured values for wave height and period are summarized in Table 5.
The regular wave conditions adopted in this study were intentionally selected as a controlled excitation tool to facilitate a systematic investigation of the effects of array length, connection stiffness, and floater size on the hydrodynamic responses of the OFPV array and their dependence on wave period.
The chosen wave height corresponds to a moderate sea state at the target offshore site, while the tested wave periods cover a representative range of commonly occurring wave periods. Regular waves were employed to enable clear identification of response trends and peak-shift behaviors. While irregular waves are more representative of real offshore environments, their use would obscure the response trends of the parameters investigated in this study. It is acknowledged that regular-wave experiments cannot capture broadband spectral effects, stochastic energy accumulation, or extreme-response amplification under realistic sea states, which constitutes a limitation when extrapolating the present results to irregular wave conditions.

4. Hydrodynamic Response Analysis of the Novel Offshore FPV Box Array Structure

4.1. Coupled Effects of Array Scale and Wave Period on Floating Box Motion

4.1.1. Variation in Motion Responses at Identical Locations with Array Scale

This section analyzes the motion responses of floating boxes at three representative positions, namely the wave-facing (T1), mid-array (T2), and leeward (T3), under regular wave conditions. The focus is on how the responses at these locations change with different array lengths and wave periods. The measured motion parameters include surge acceleration, heave acceleration, pitch angle, and heave displacement.
Based on the experimental configurations, four array scales (5 × 5, 5 × 10, 5 × 15, and 5 × 20) were tested. For each scale, motion responses at the designated monitoring points were recorded under various regular wave periods. The 5 × 5 array had only one monitoring location; considering both its absolute and relative position, this point served as a reference for characteristic locations in larger arrays. Thus, its responses were compared with those at T1, T2, and T3 in the other configurations to provide a comprehensive understanding of the influence of array length and position on dynamic behavior.
All experiments used regular waves, and the average peak values of the response signals were used to quantify motion intensity. For heave motion, the average peak displacement was taken as the evaluation metric. Because array length was a key variable, wave period was converted to wavelength, so that all results could be analyzed with wavelength as the horizontal axis.
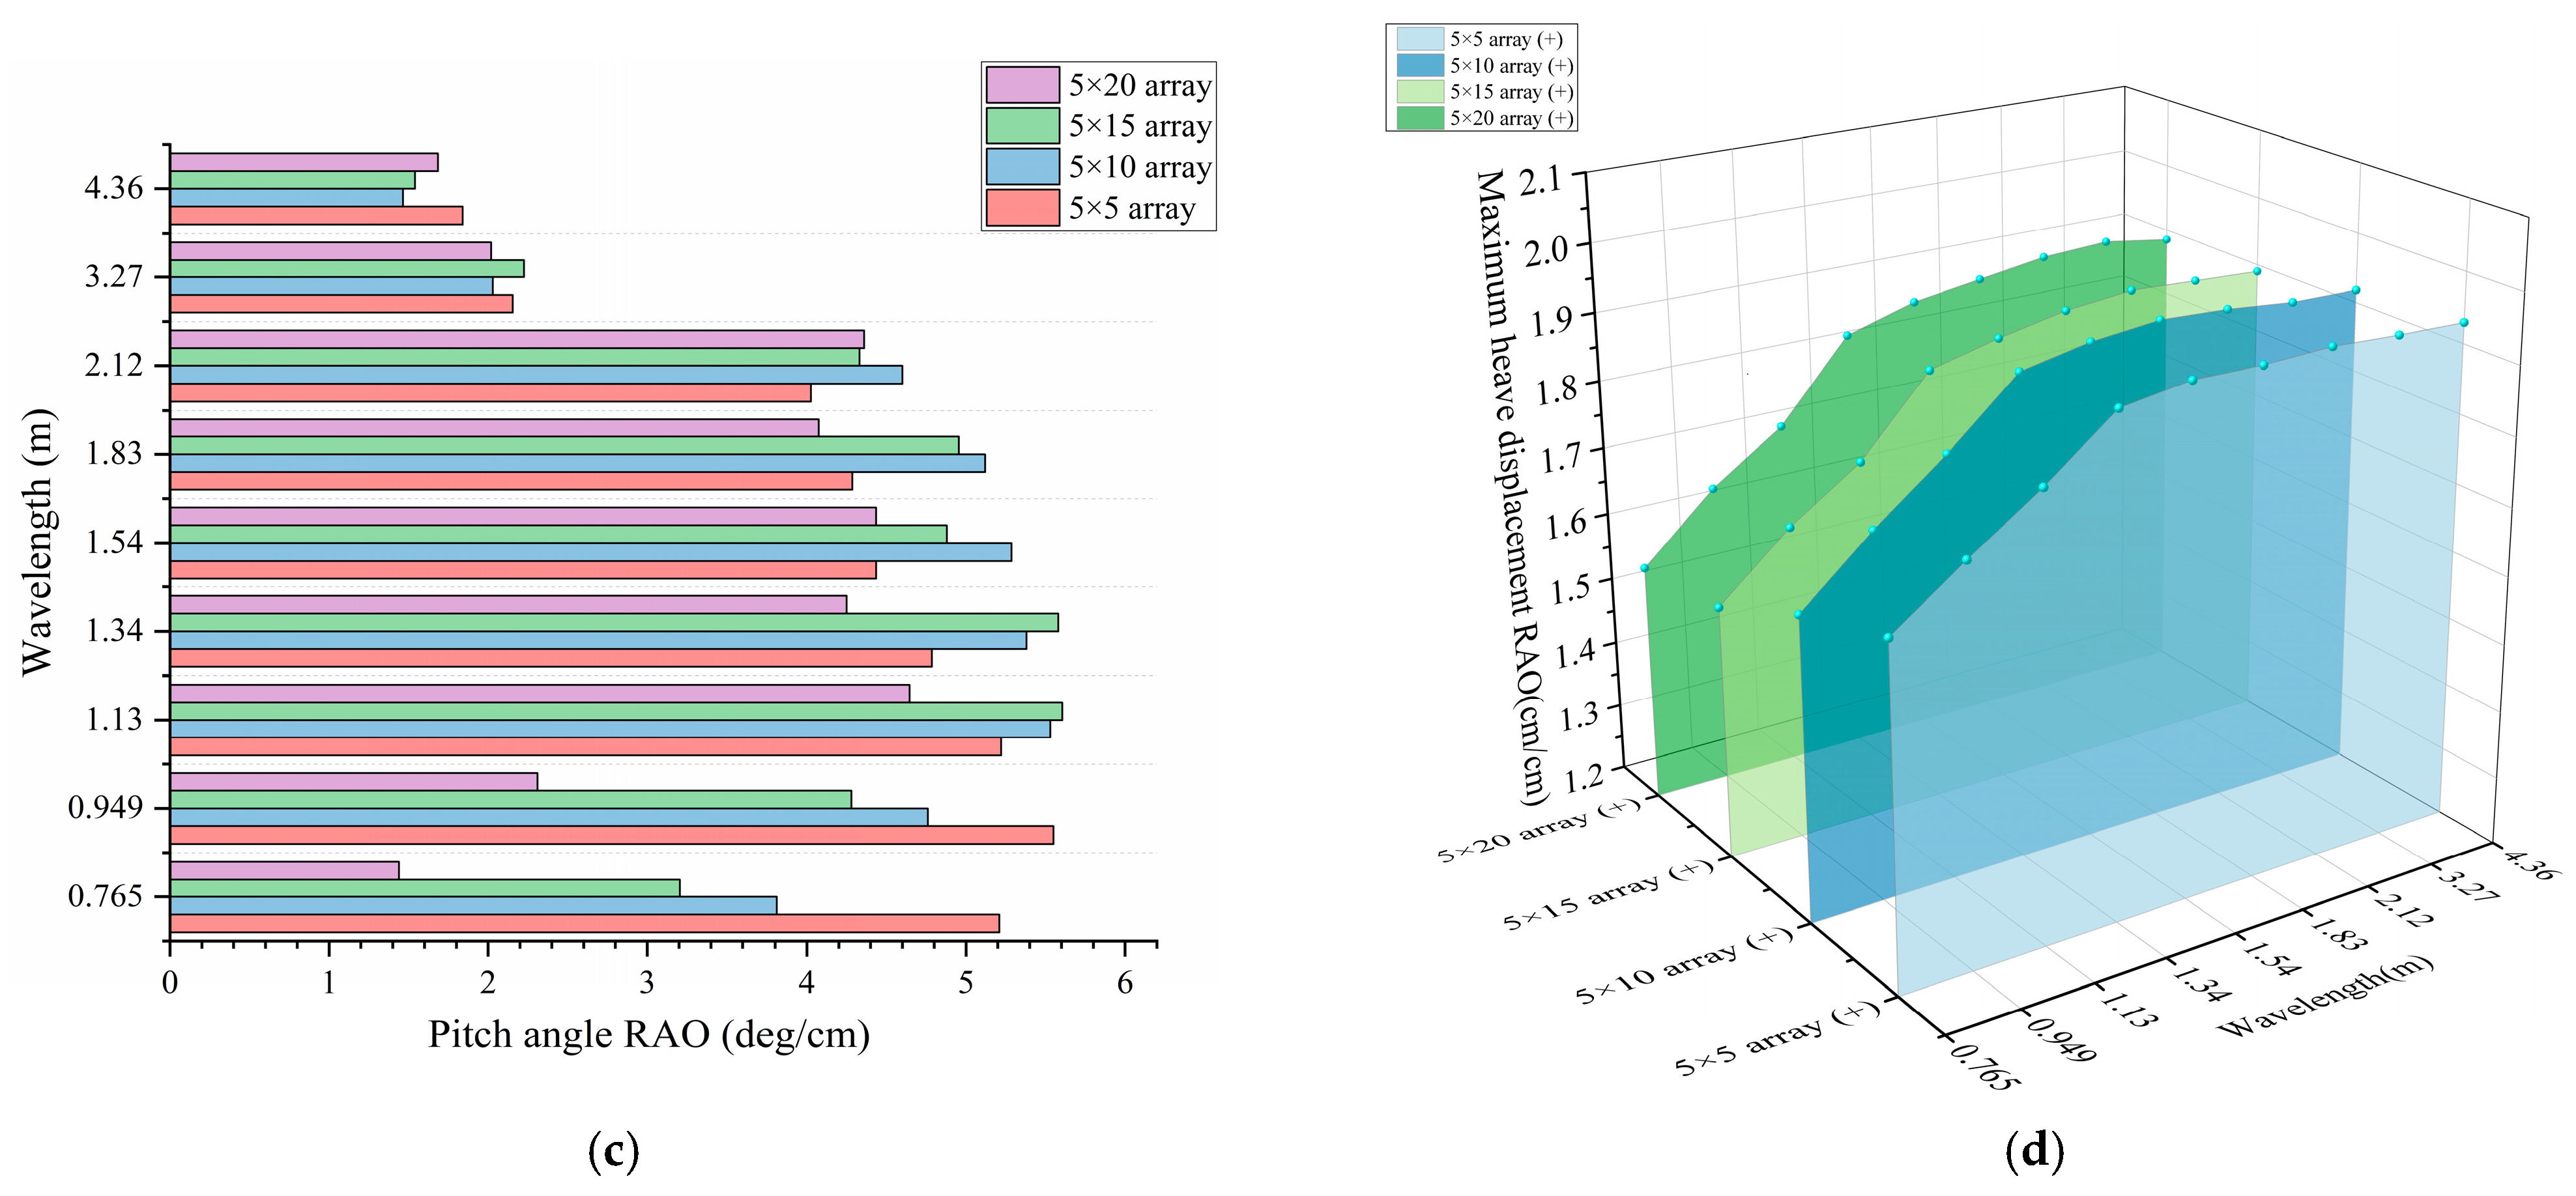
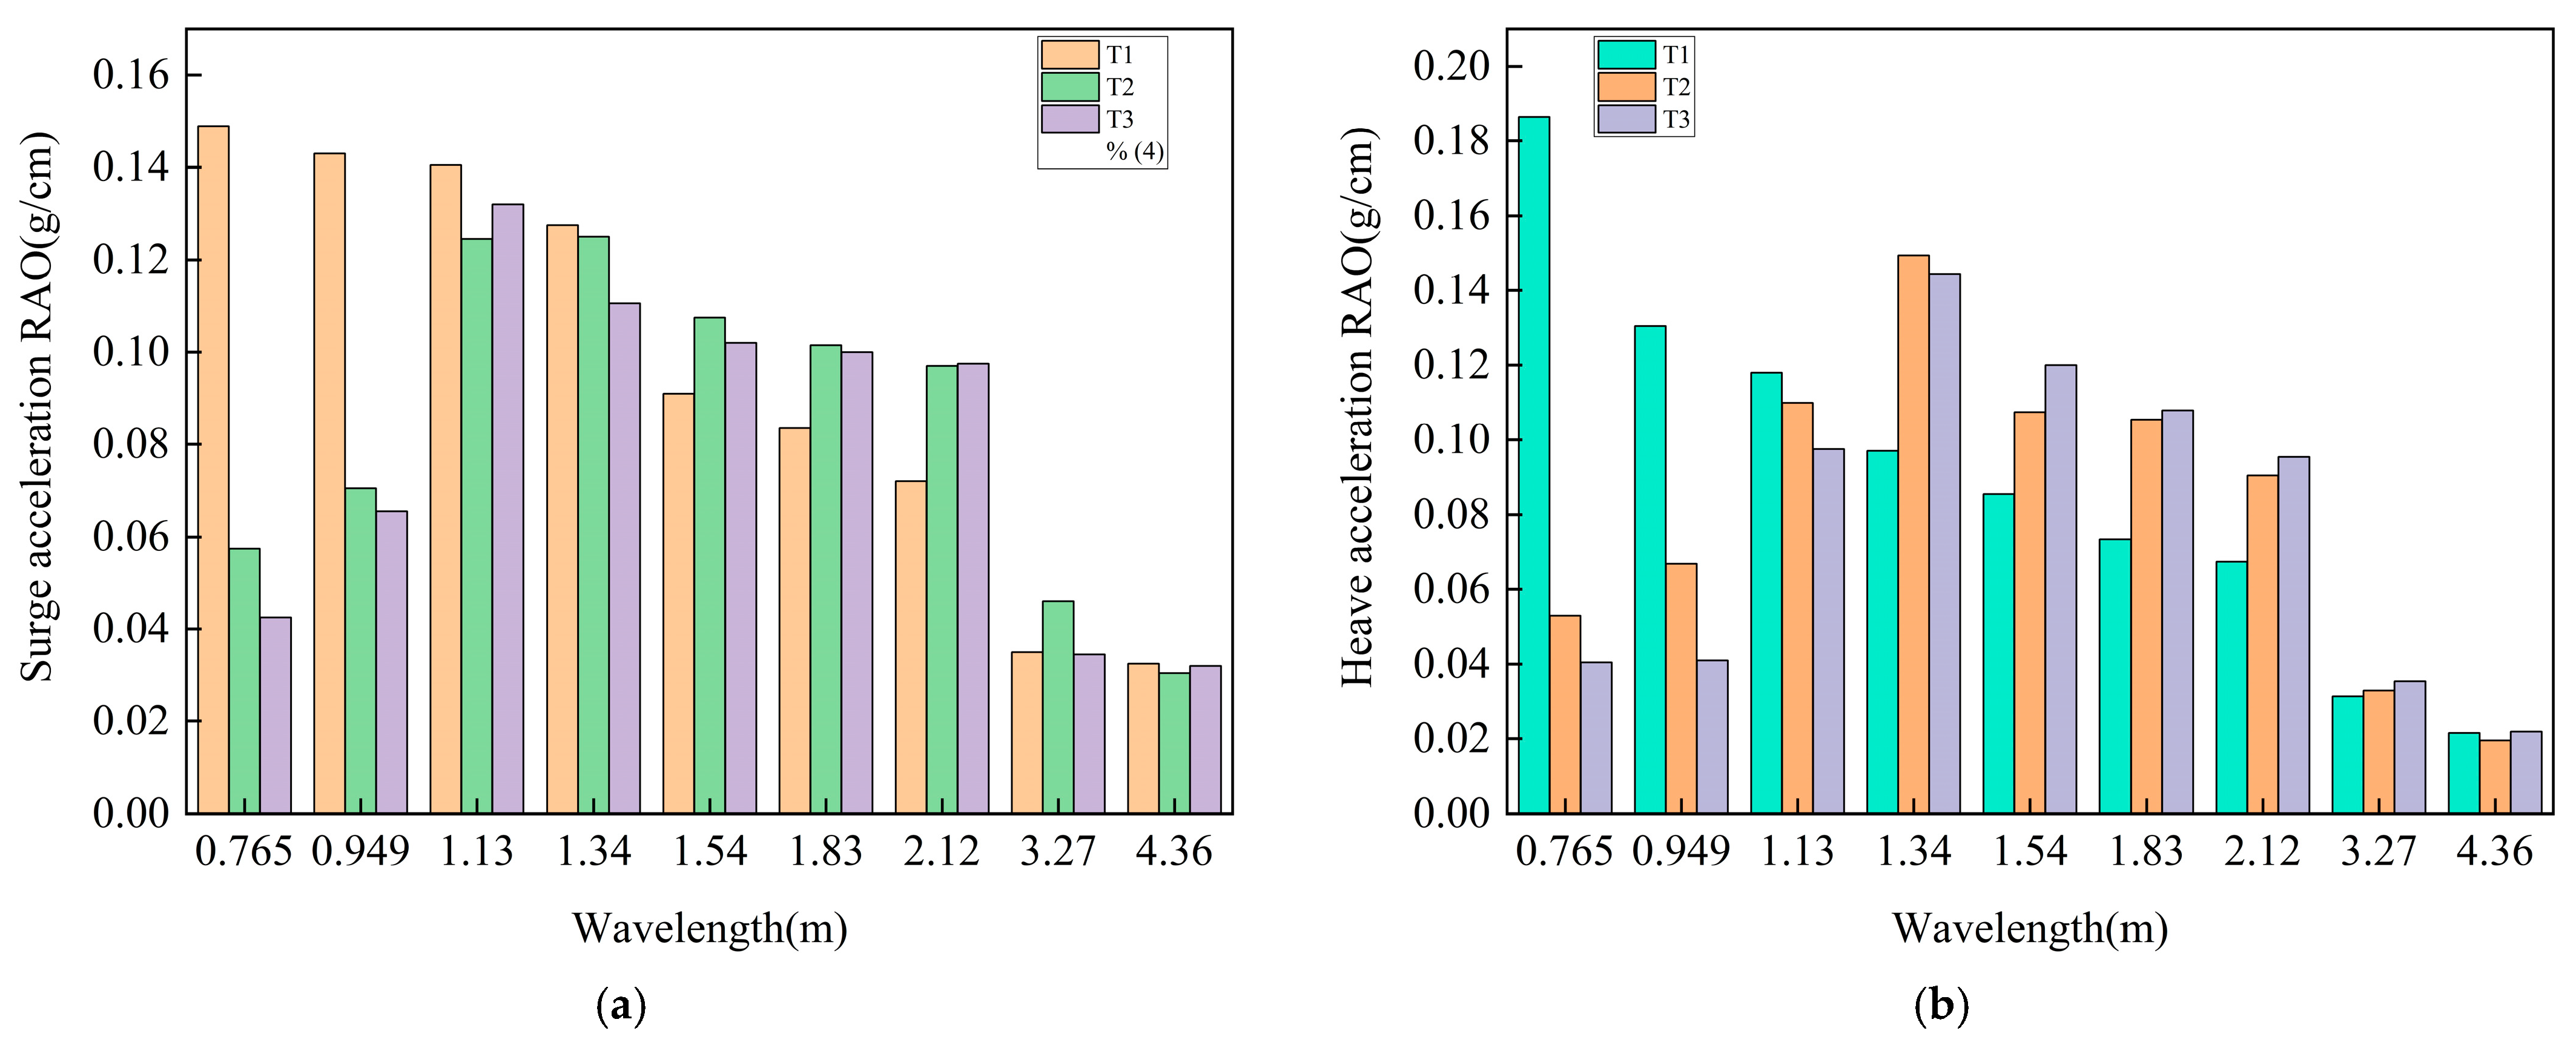
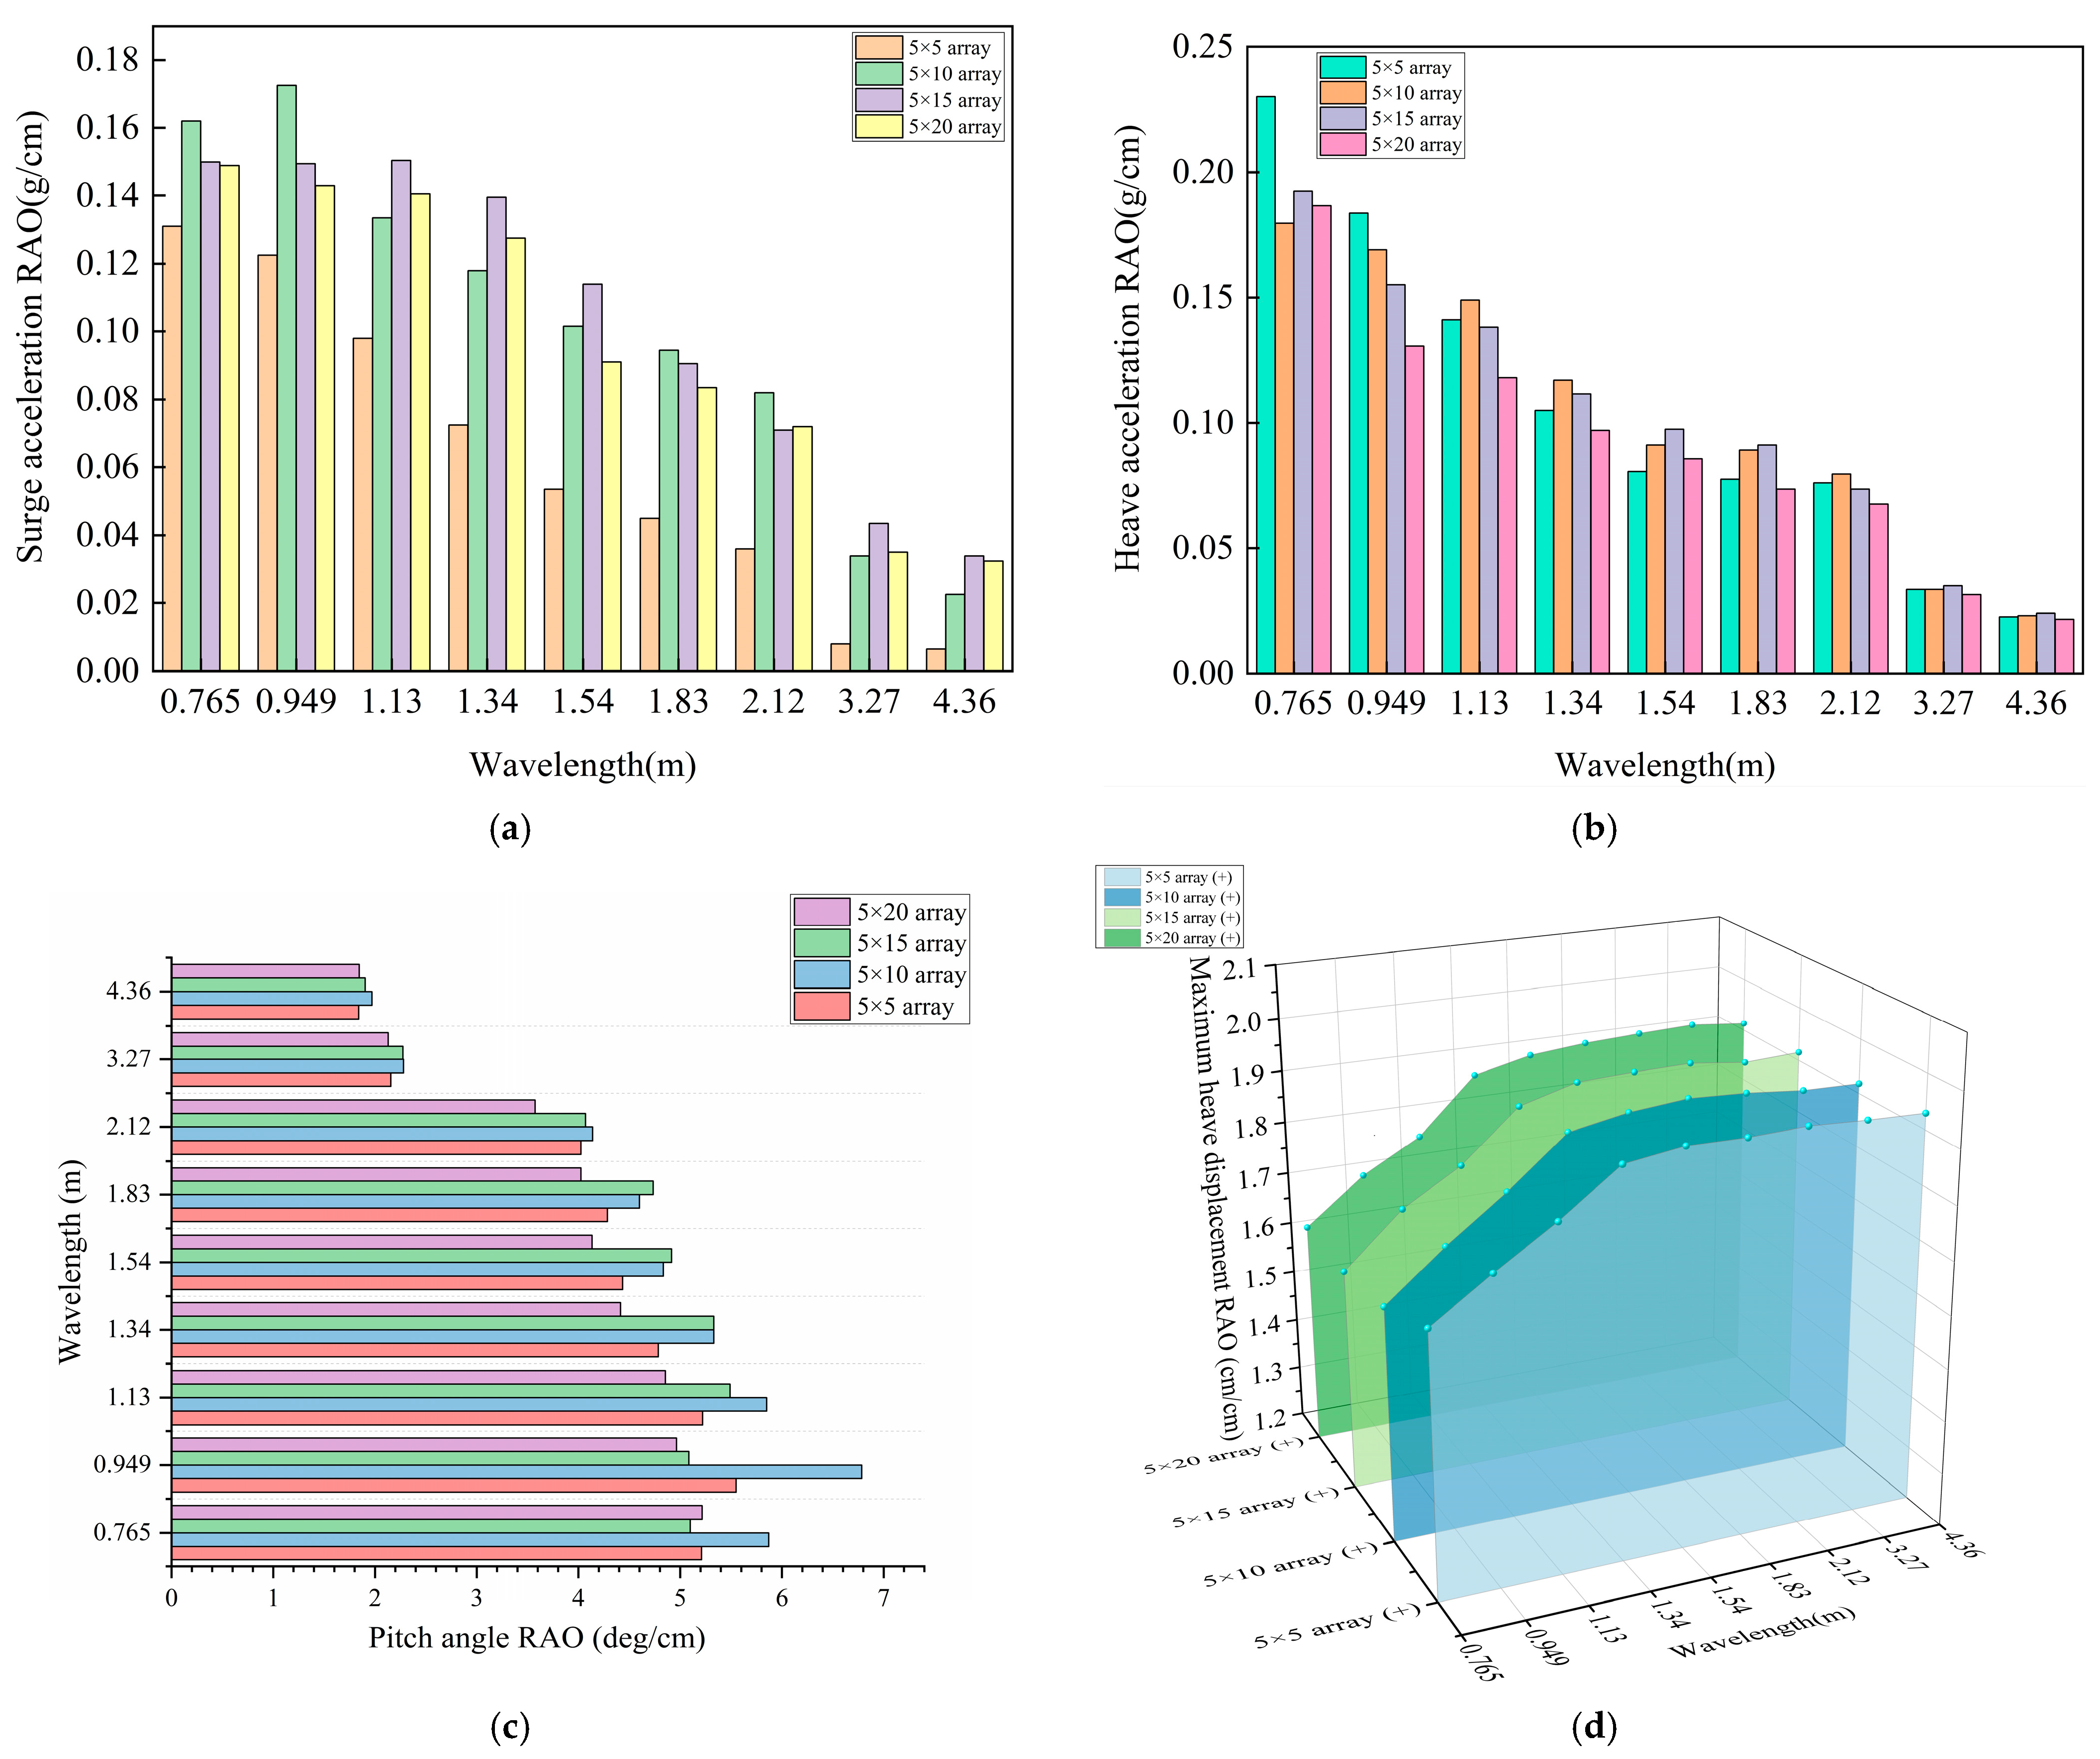
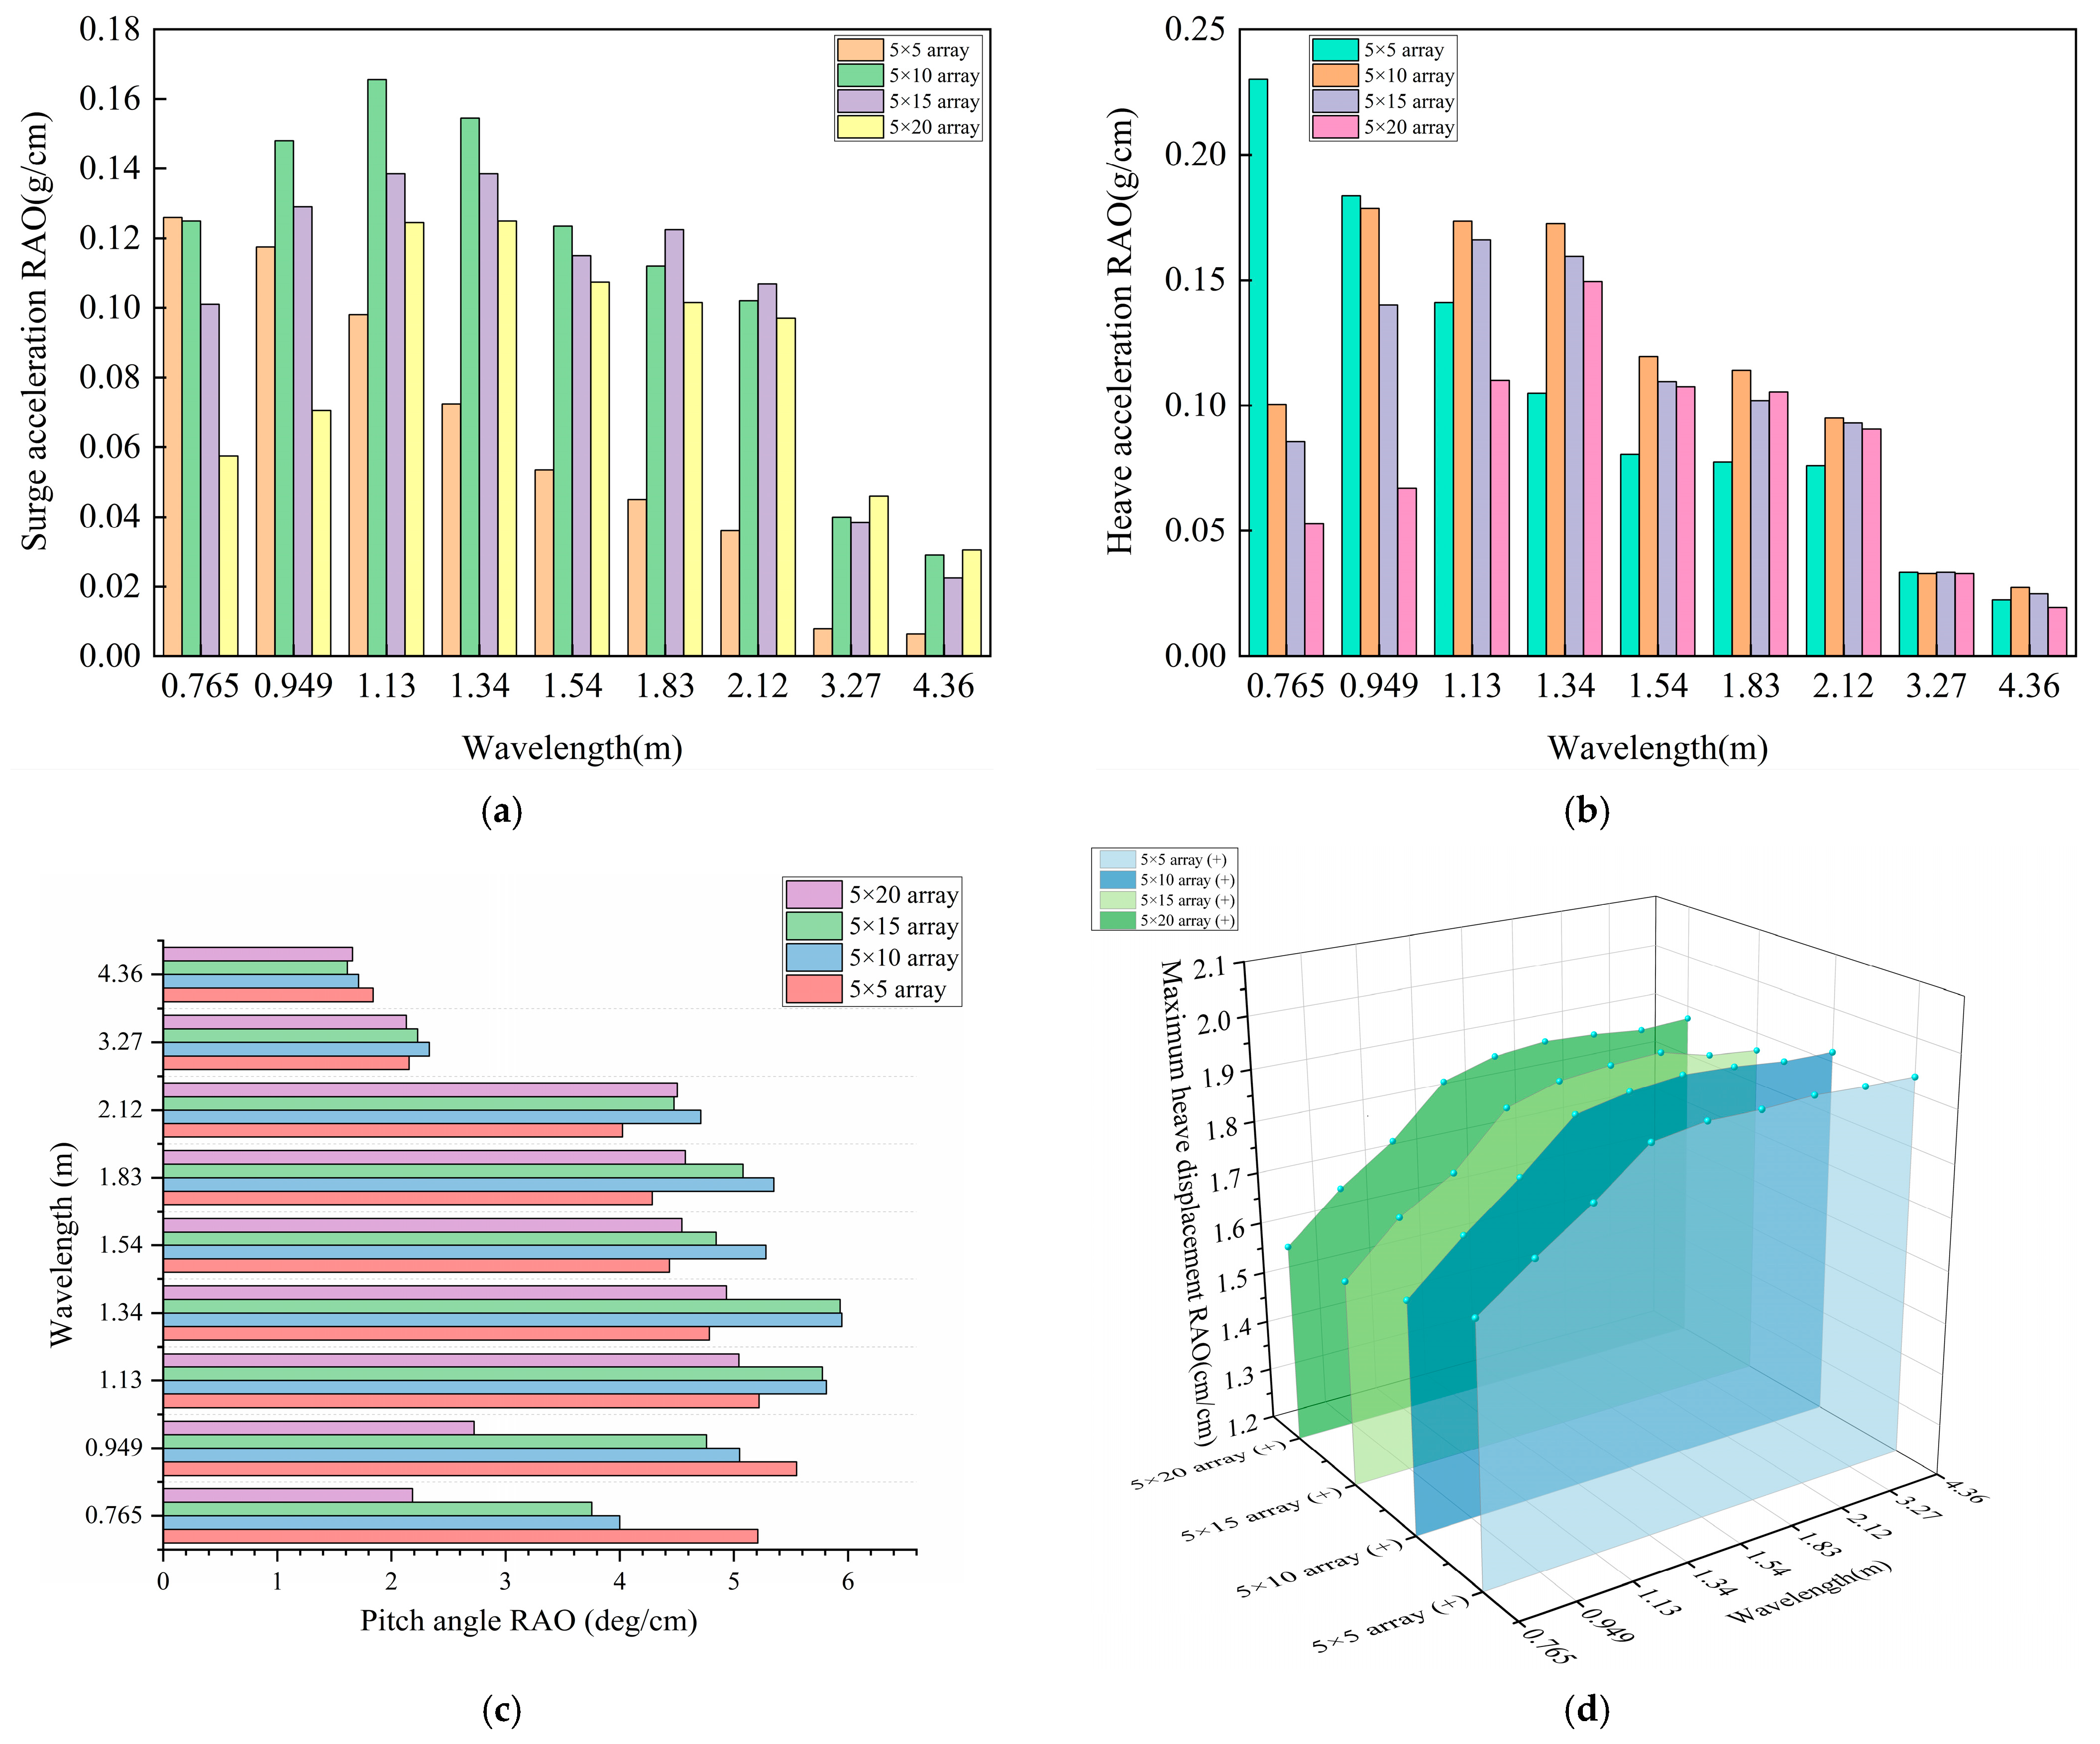
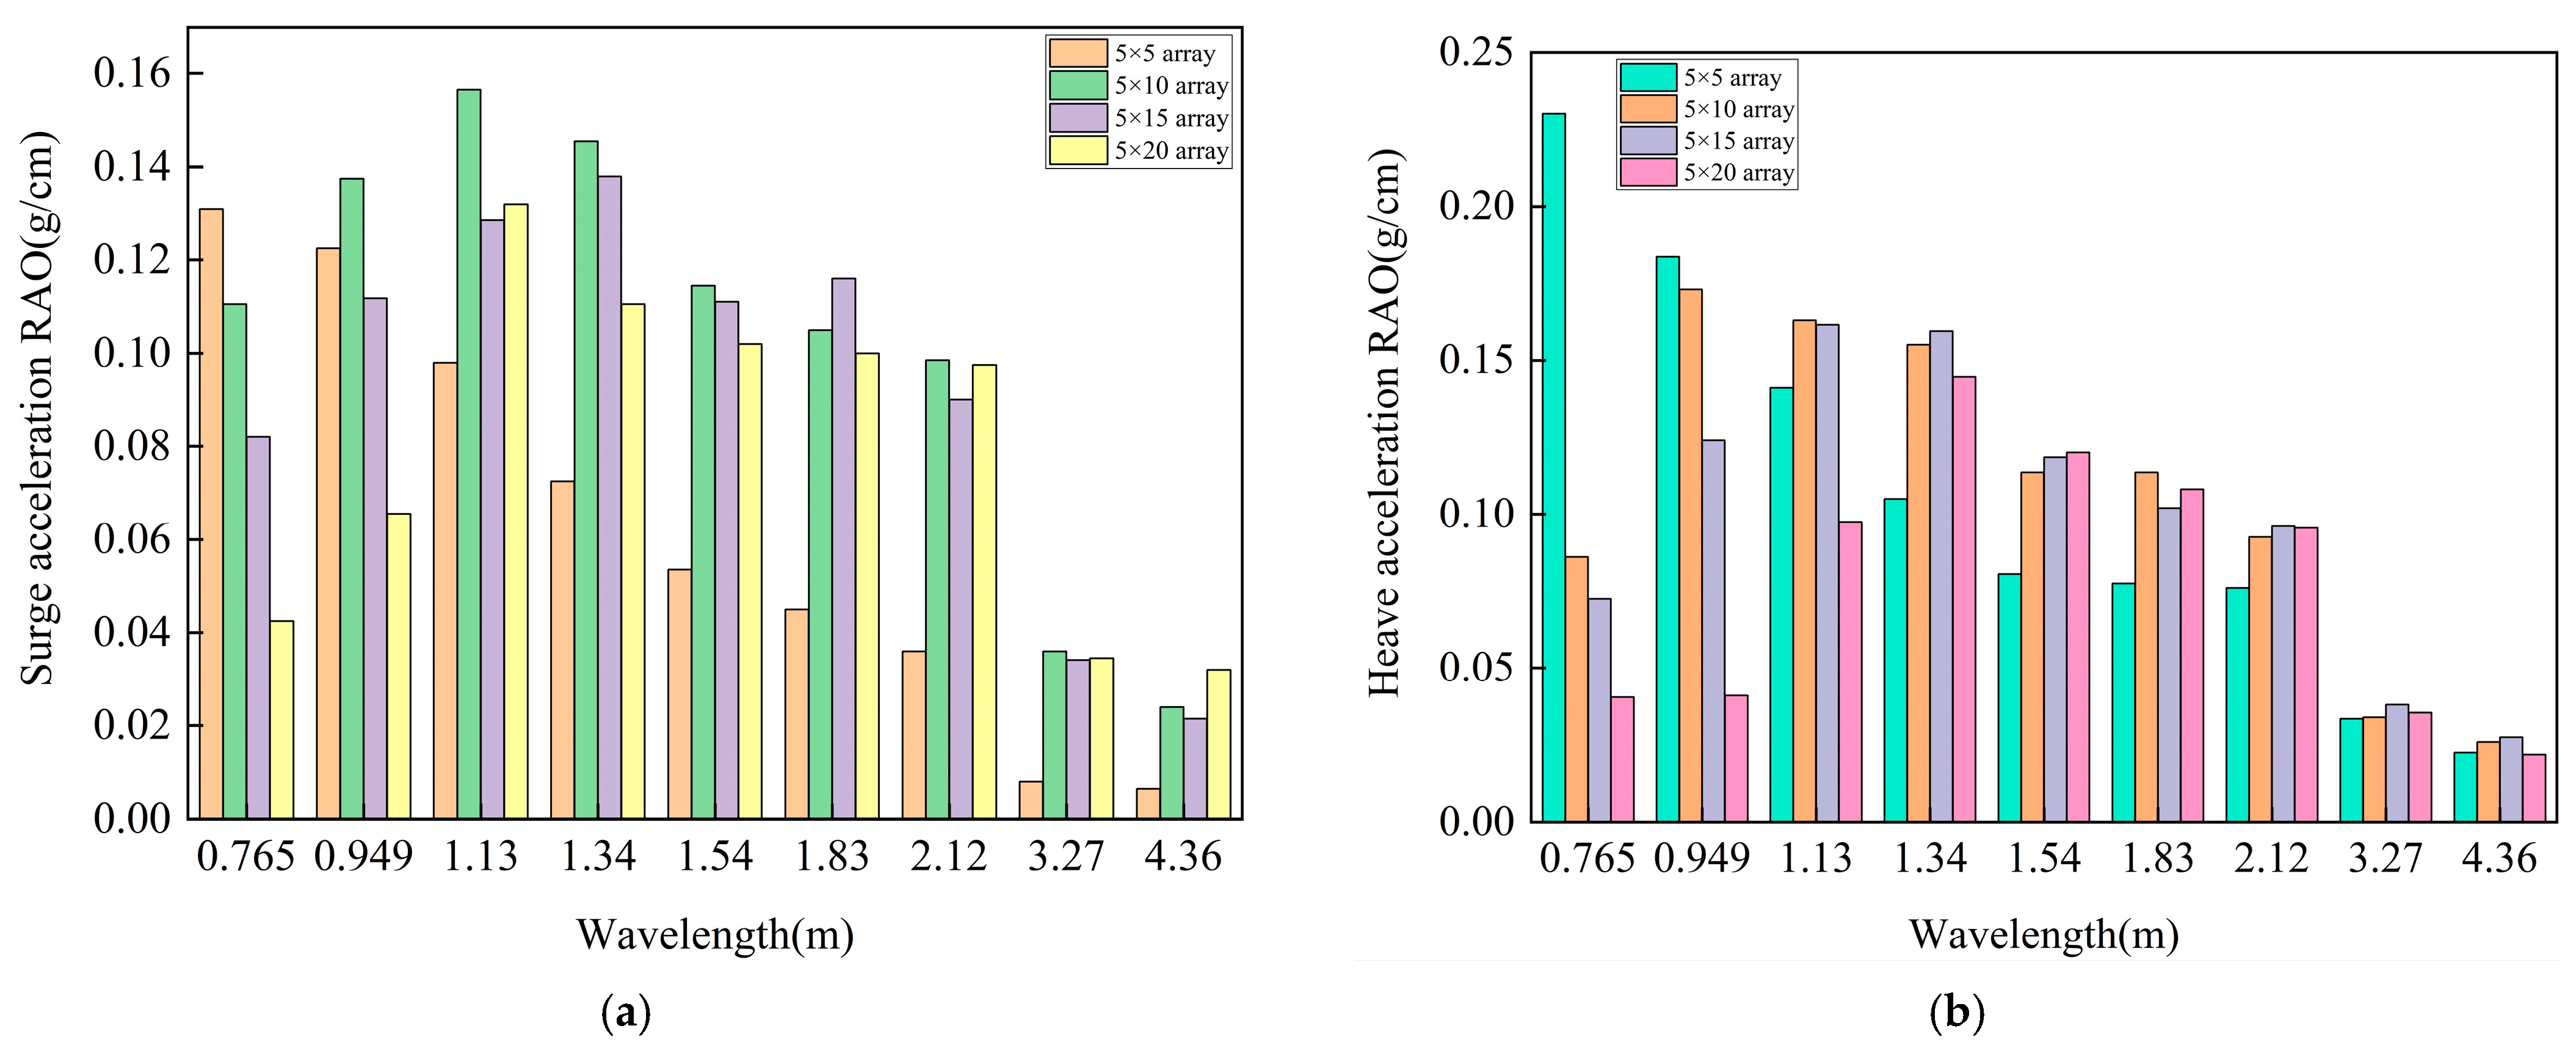
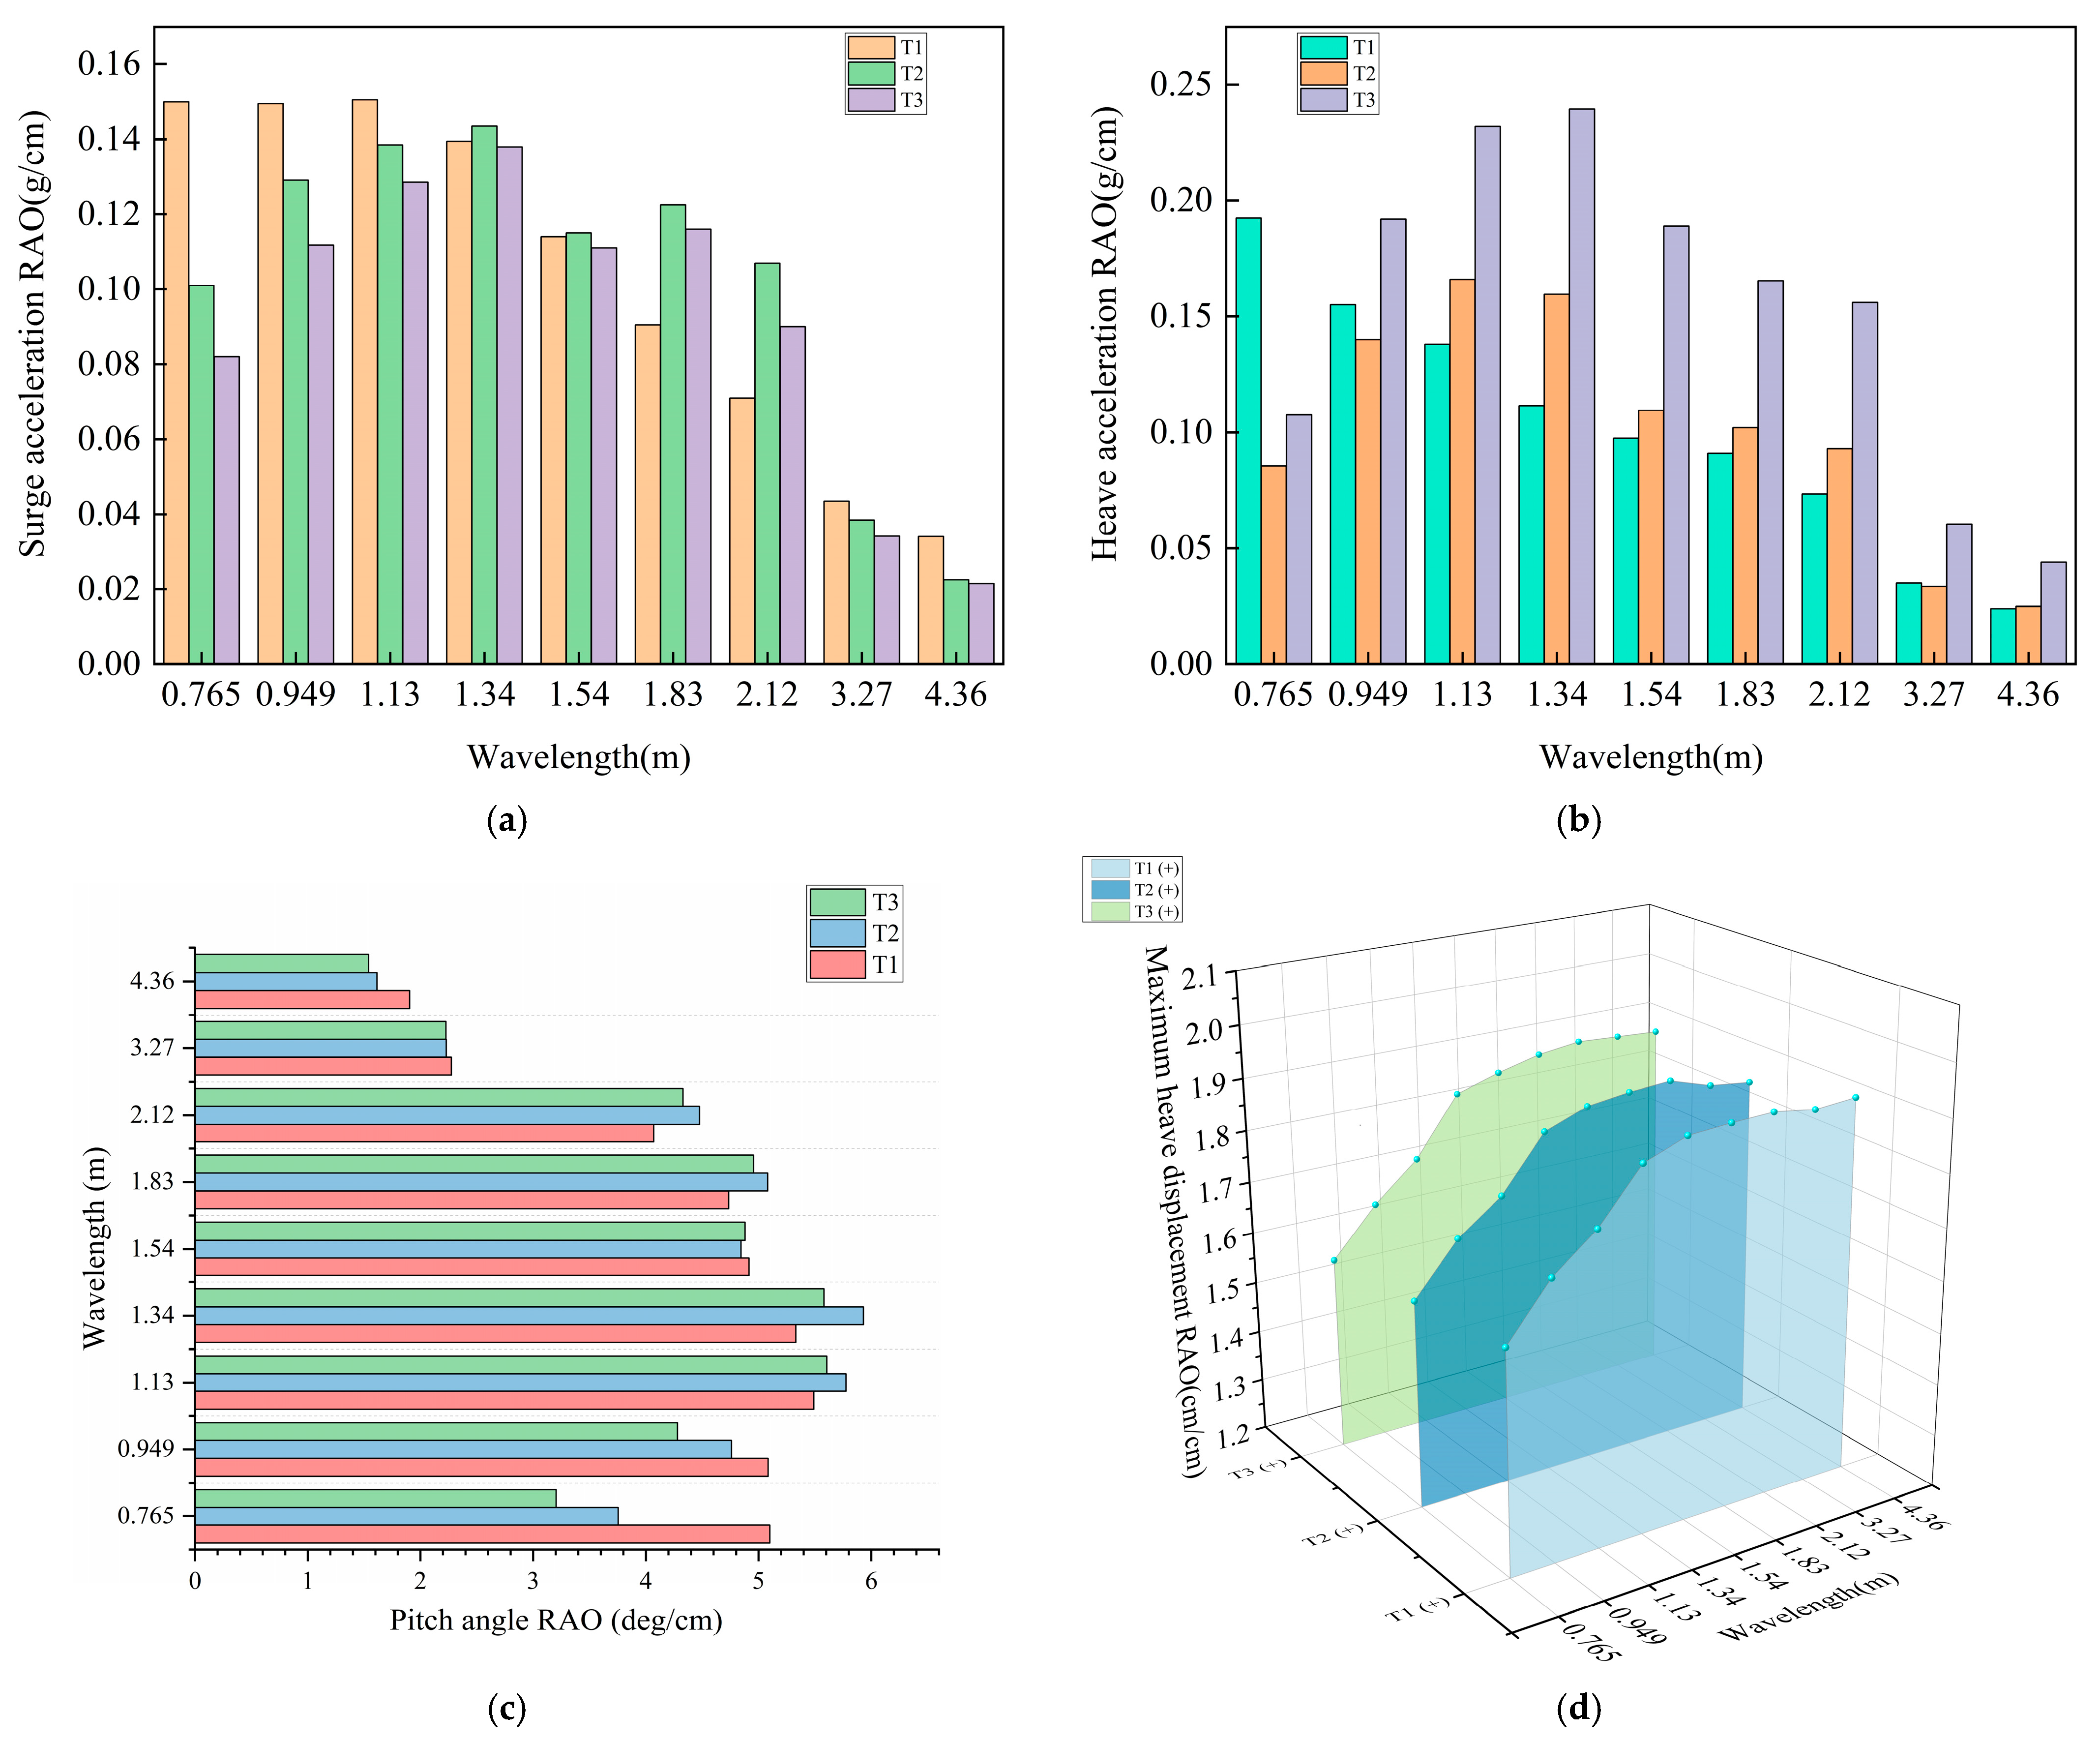
Figure 12, Figure 13 and Figure 14 show the trends in motion responses at different monitoring points for the four array scales, plotted as functions of wave wavelength.
At the wave-facing location, T1, the motion responses of different array scales exhibit nearly identical wavelength-dependent trends. Surge acceleration, heave acceleration, and pitch decrease monotonically with increasing wavelength, whereas heave displacement shows only weak sensitivity to array length.
Excluding the 5 × 5 case, the response amplitudes at T1 generally decrease slightly as the array length increases, while the differences among the 5 × 10, 5 × 15, and 5 × 20 arrays remain minor. This indicates that T1 lies within a wave-facing response region dominated by direct incident wave forcing, where upstream shielding is minimal and the local response is primarily governed by the absolute position at the array front.
The relatively high accelerations observed in the 5 × 5 array are attributed to its short length, which places the entire array within the wave-facing region and eliminates downstream boundary effects. In longer arrays, elastic deformation of downstream units modifies the effective boundary conditions through both horizontal shielding and vertical constraints, thereby slightly reducing surge and heave responses at T1.
Once the array length exceeds the spatial extent of the wave-facing region, further downstream extension has little influence on the T1 response, and the differences among the 5 × 10, 5 × 15, and 5 × 20 arrays become negligible. Pitch responses remain nearly unchanged across all scales, indicating that rotational motion at the wave-facing edge is governed mainly by local wave loading and immediate neighboring units.
At downstream positions T2 and T3, the array length exerts a dominant influence on the motion responses. Across the 5 × 10, 5 × 15, and 5 × 20 arrays, all four motion parameters exhibit consistent wavelength-dependent trends, with response amplitudes decreasing systematically as the array becomes longer, particularly under short-wavelength conditions. A key feature is the systematic migration of the heave-acceleration peaks toward longer wavelengths as the array length increases.
The tested wave periods were selected to cover representative site conditions rather than to intentionally excite structural resonance; therefore, the observed peaks cannot be regarded as natural frequencies. Nevertheless, the modal properties of the array still govern the backbone of the frequency response. As the array length increases, the natural frequencies decrease, causing the entire response spectrum to shift toward longer periods. As a result, even though the experimental peaks represent forced-response maxima rather than strictly resonance-dominated free vibrations, their migration toward longer wavelengths reflects the length-dependent shift in the array’s dynamic response characteristics predicted by the chain-model framework.
The observed attenuation arises from two coupled mechanisms. First, the addition of upstream units modifies the effective boundary conditions at a given downstream location through cumulative structural flexibility and localized deformation. Second, wave energy is progressively dissipated and redistributed as it propagates through the array, resulting in a weakened wave field downstream.
Collectively, these results demonstrate that the number of upstream floating boxes exerts a dominant control over the downstream motion responses, especially at the mid-array (T2) and leeward (T3) positions. Longer arrays not only reduce response amplitudes but also shift the dominant forced-response amplification toward lower frequencies, even in the absence of strict resonance. Accordingly, the observed peaks correspond to forced-response maxima under harmonic excitation rather than exact natural frequencies.
The terms “wave-facing” and “non-wave-facing” regions are introduced here only as qualitative descriptors to facilitate the discussion of the spatial response patterns along the array, rather than as rigorously defined zonal classifications.

4.1.2. Influence of Array Scale on Relative Motion Responses at Different Locations

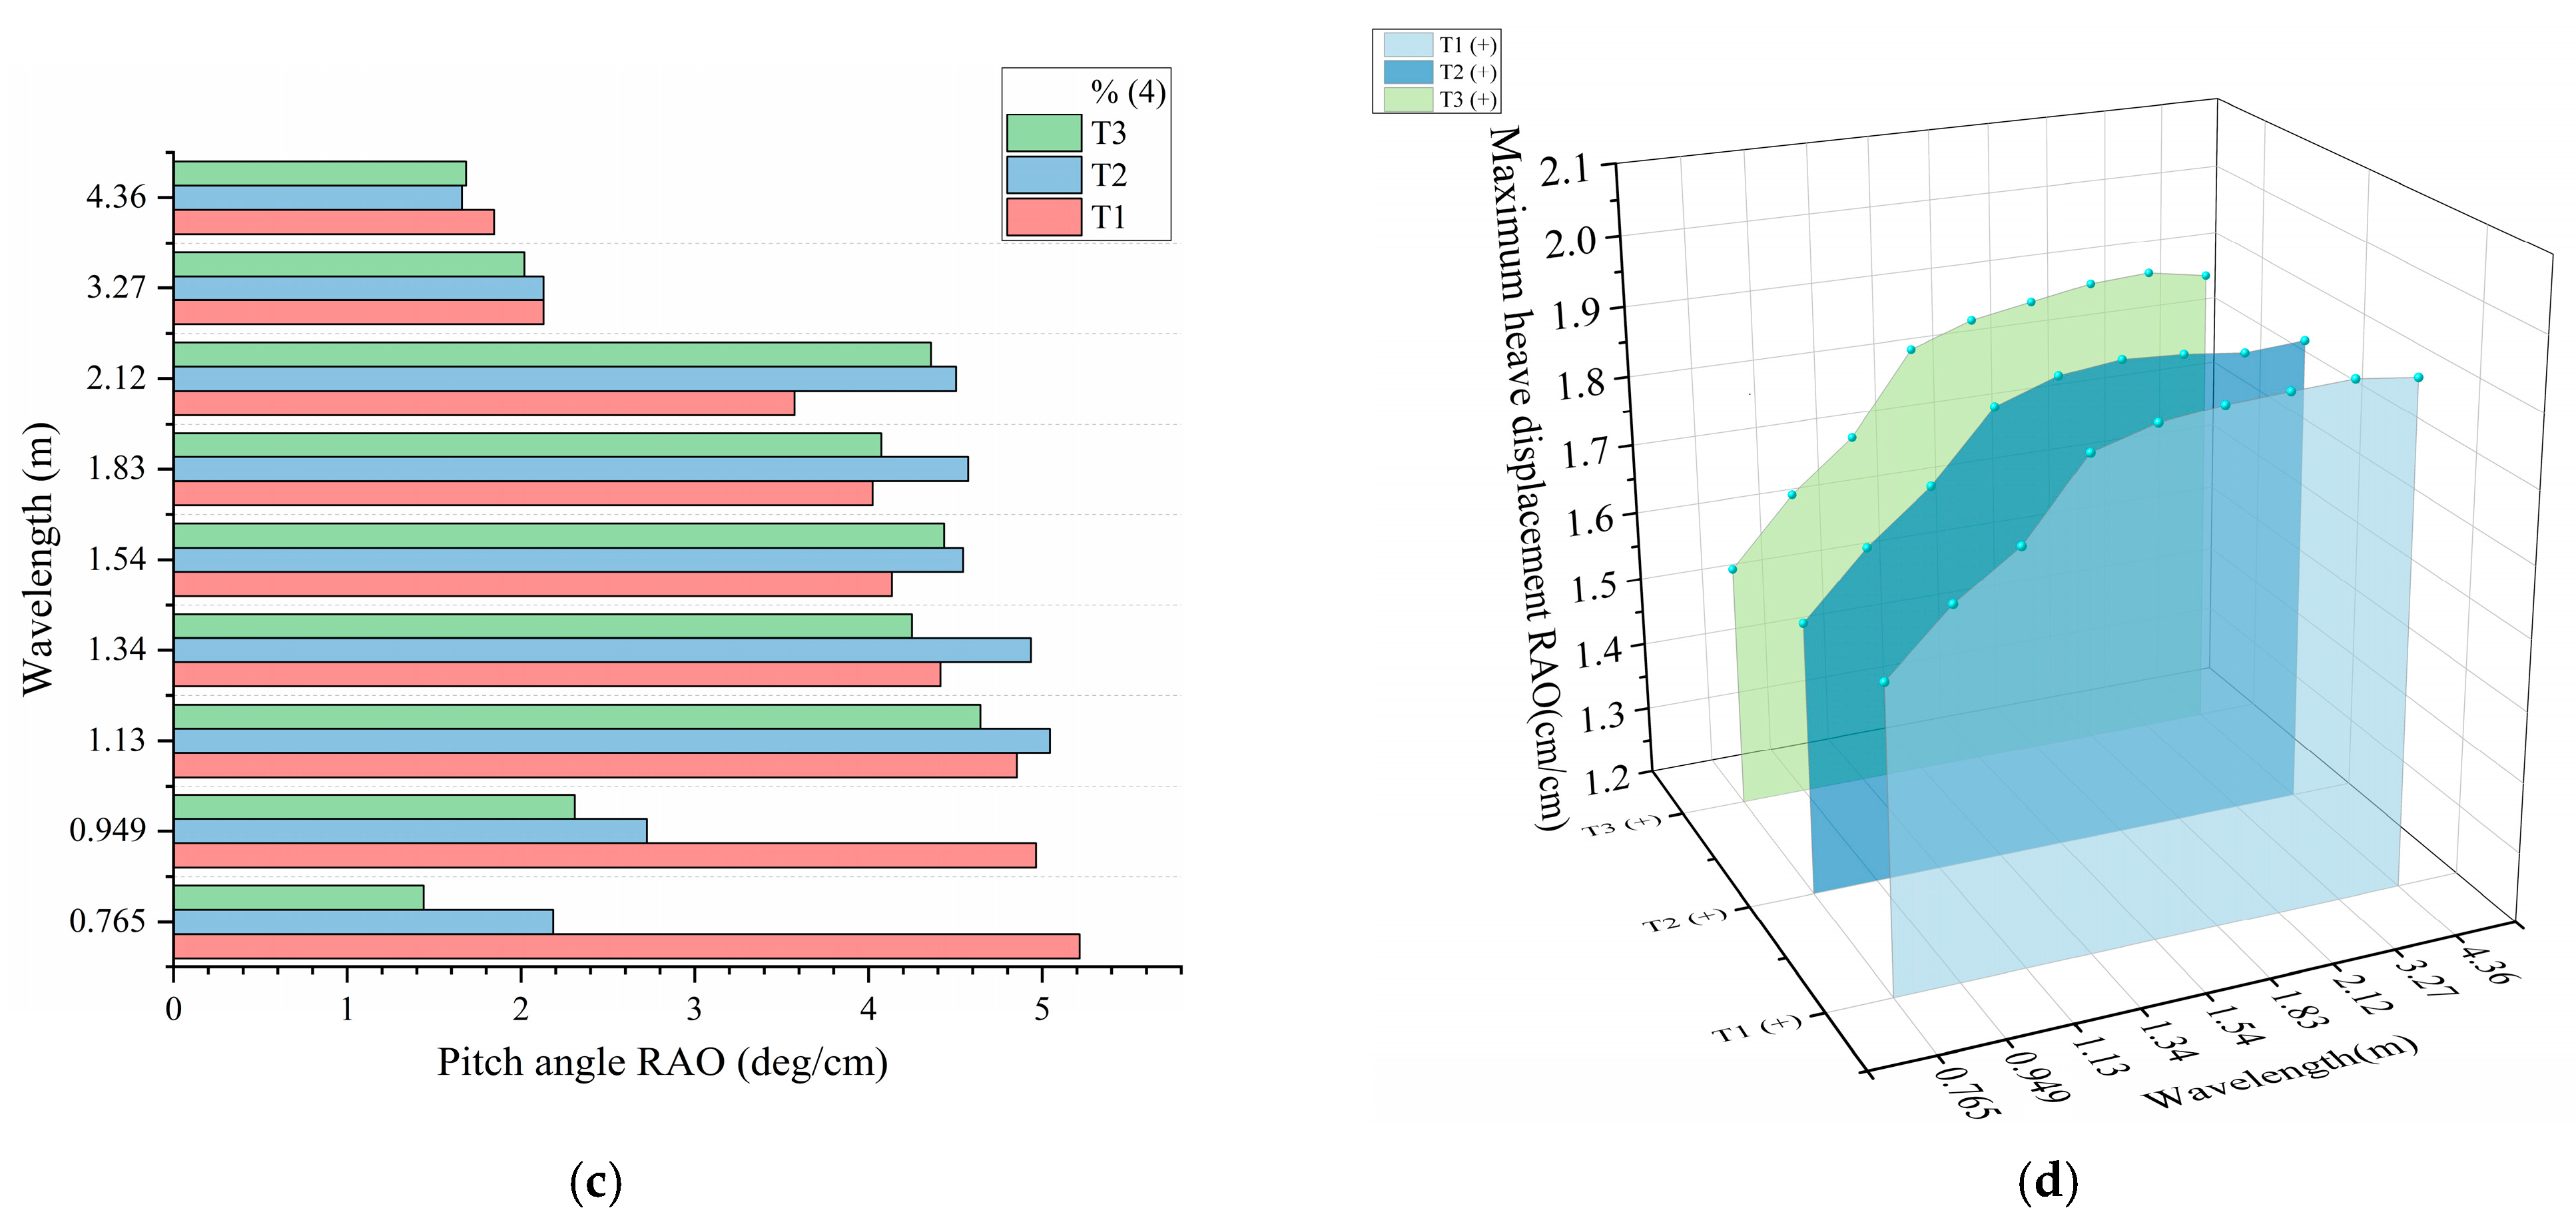
To further explore how array scale affects the motion behavior of individual boxes, the relative responses at different monitoring points within the 5 × 15 and 5 × 20 arrays were compared, as illustrated in Figure 15 and Figure 16.
Figure 15 and Figure 16 show that the relative motion relationships among T1, T2, and T3 in the 5 × 15 and 5 × 20 arrays are largely consistent. In summary, the motion response characteristics of the floating box array exhibit a pronounced distinction between the wave-facing and non-wave-facing regions, each governed by different dynamic mechanisms.
These results have direct implications for engineering design and model testing. Increasing the array scale reduces the absolute motion responses, especially at mid-array and leeward locations, and enhances the shielding and energy dissipation effects provided by upstream units. However, if the array is too short and entirely within the wave-facing region, the observed motion may be unrepresentatively high, potentially leading to conservative or non-representative design estimates. Therefore, for both physical and numerical modeling, it is essential to ensure that the array length exceeds the spatial extent of the wave-facing region; this can be assessed by comparing the motion responses of the front and rear boxes. Only when their behaviors converge can the model be considered sufficiently long to reflect full-scale offshore performance, ensuring the reliability of hydrodynamic evaluation and the practical relevance of test results.

4.2. Coupled Effects of Connection Stiffness and Wave Period on Floating Box Motion

It is important to note that the range of connection stiffness tested in these experiments did not change the fundamental characteristics of the floating box array. Specifically, the flexural rigidity of the floating boxes was about three orders of magnitude greater than that of the connector lugs. Based on the lug geometry and an effective free length of about 1 mm, the rotational stiffness per joint can be estimated as
k θ = E I l e = 1.65 × 10 3 1.0 × 10 3 1.65   N m / r a d
for a single lug. For two and three lugs in parallel, the values increase proportionally to 3.30 and 4.95 N·m/rad, respectively.
This is evident in the heave response curves, which show that the vertical motion of the boxes always closely follows the wave profile, regardless of connection stiffness. The array’s hydroelastic deformation is similar to or even greater than the draft of the floating boxes, confirming that the structure consistently behaves as a vertically flexible floating structure (VFFS). In this study, the term “vertically flexible floating structure (VFFS)” is used in a descriptive sense to denote a floating array whose global vertical deformation is governed by the flexibility of inter-unit connections. Therefore, the observed trends related to stiffness variation remain robust across the tested parameter range.
For the structural design of floating box arrays, the two key parameters are the geometry of the floating box and the flexural stiffness of the connector lugs. The size and shape of the boxes are usually dictated by photovoltaic module dimensions, which limits design flexibility. In contrast, the stiffness of the connectors can be more easily adjusted. Based on the sensitivity of motion responses to stiffness changes, it can be concluded that when the connectors’ flexural rigidity is much lower than that of the boxes, and VFFS behavior is ensured, the effect of connection stiffness on the overall response becomes minimal at longer wavelengths. Nonetheless, stiffness still plays a clear role in response amplitudes, making it a practical design variable for tuning local dynamics.
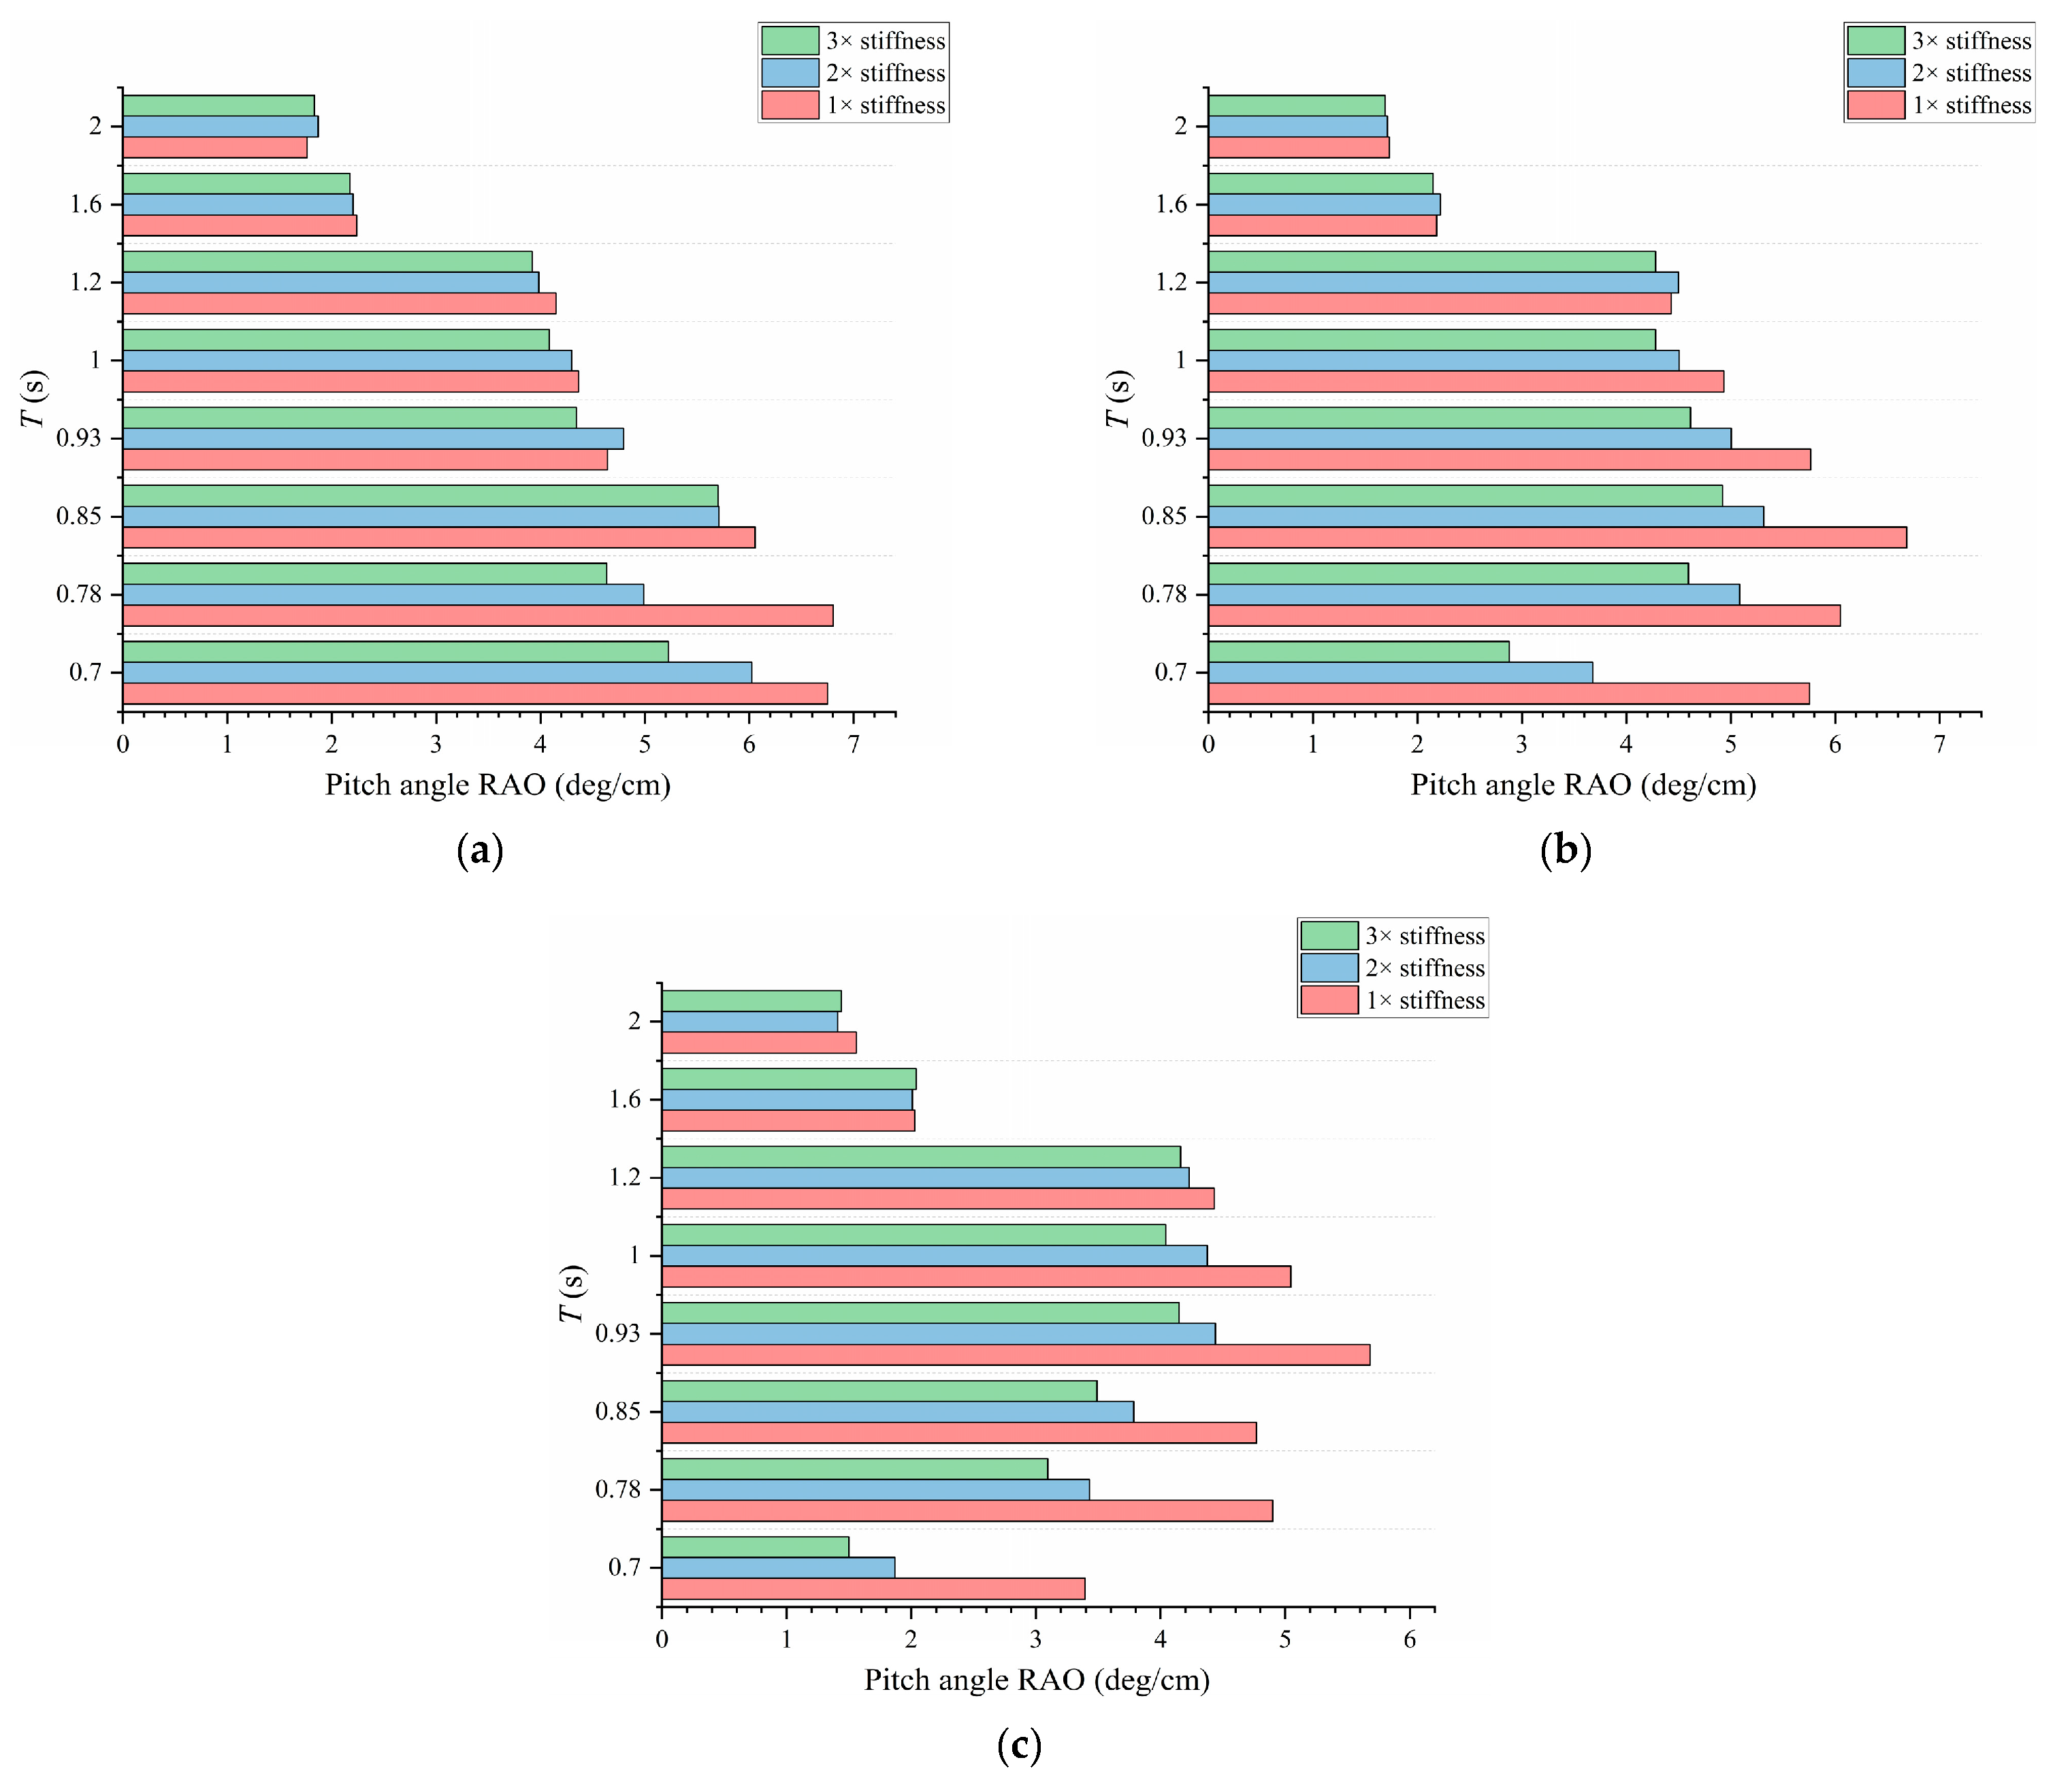
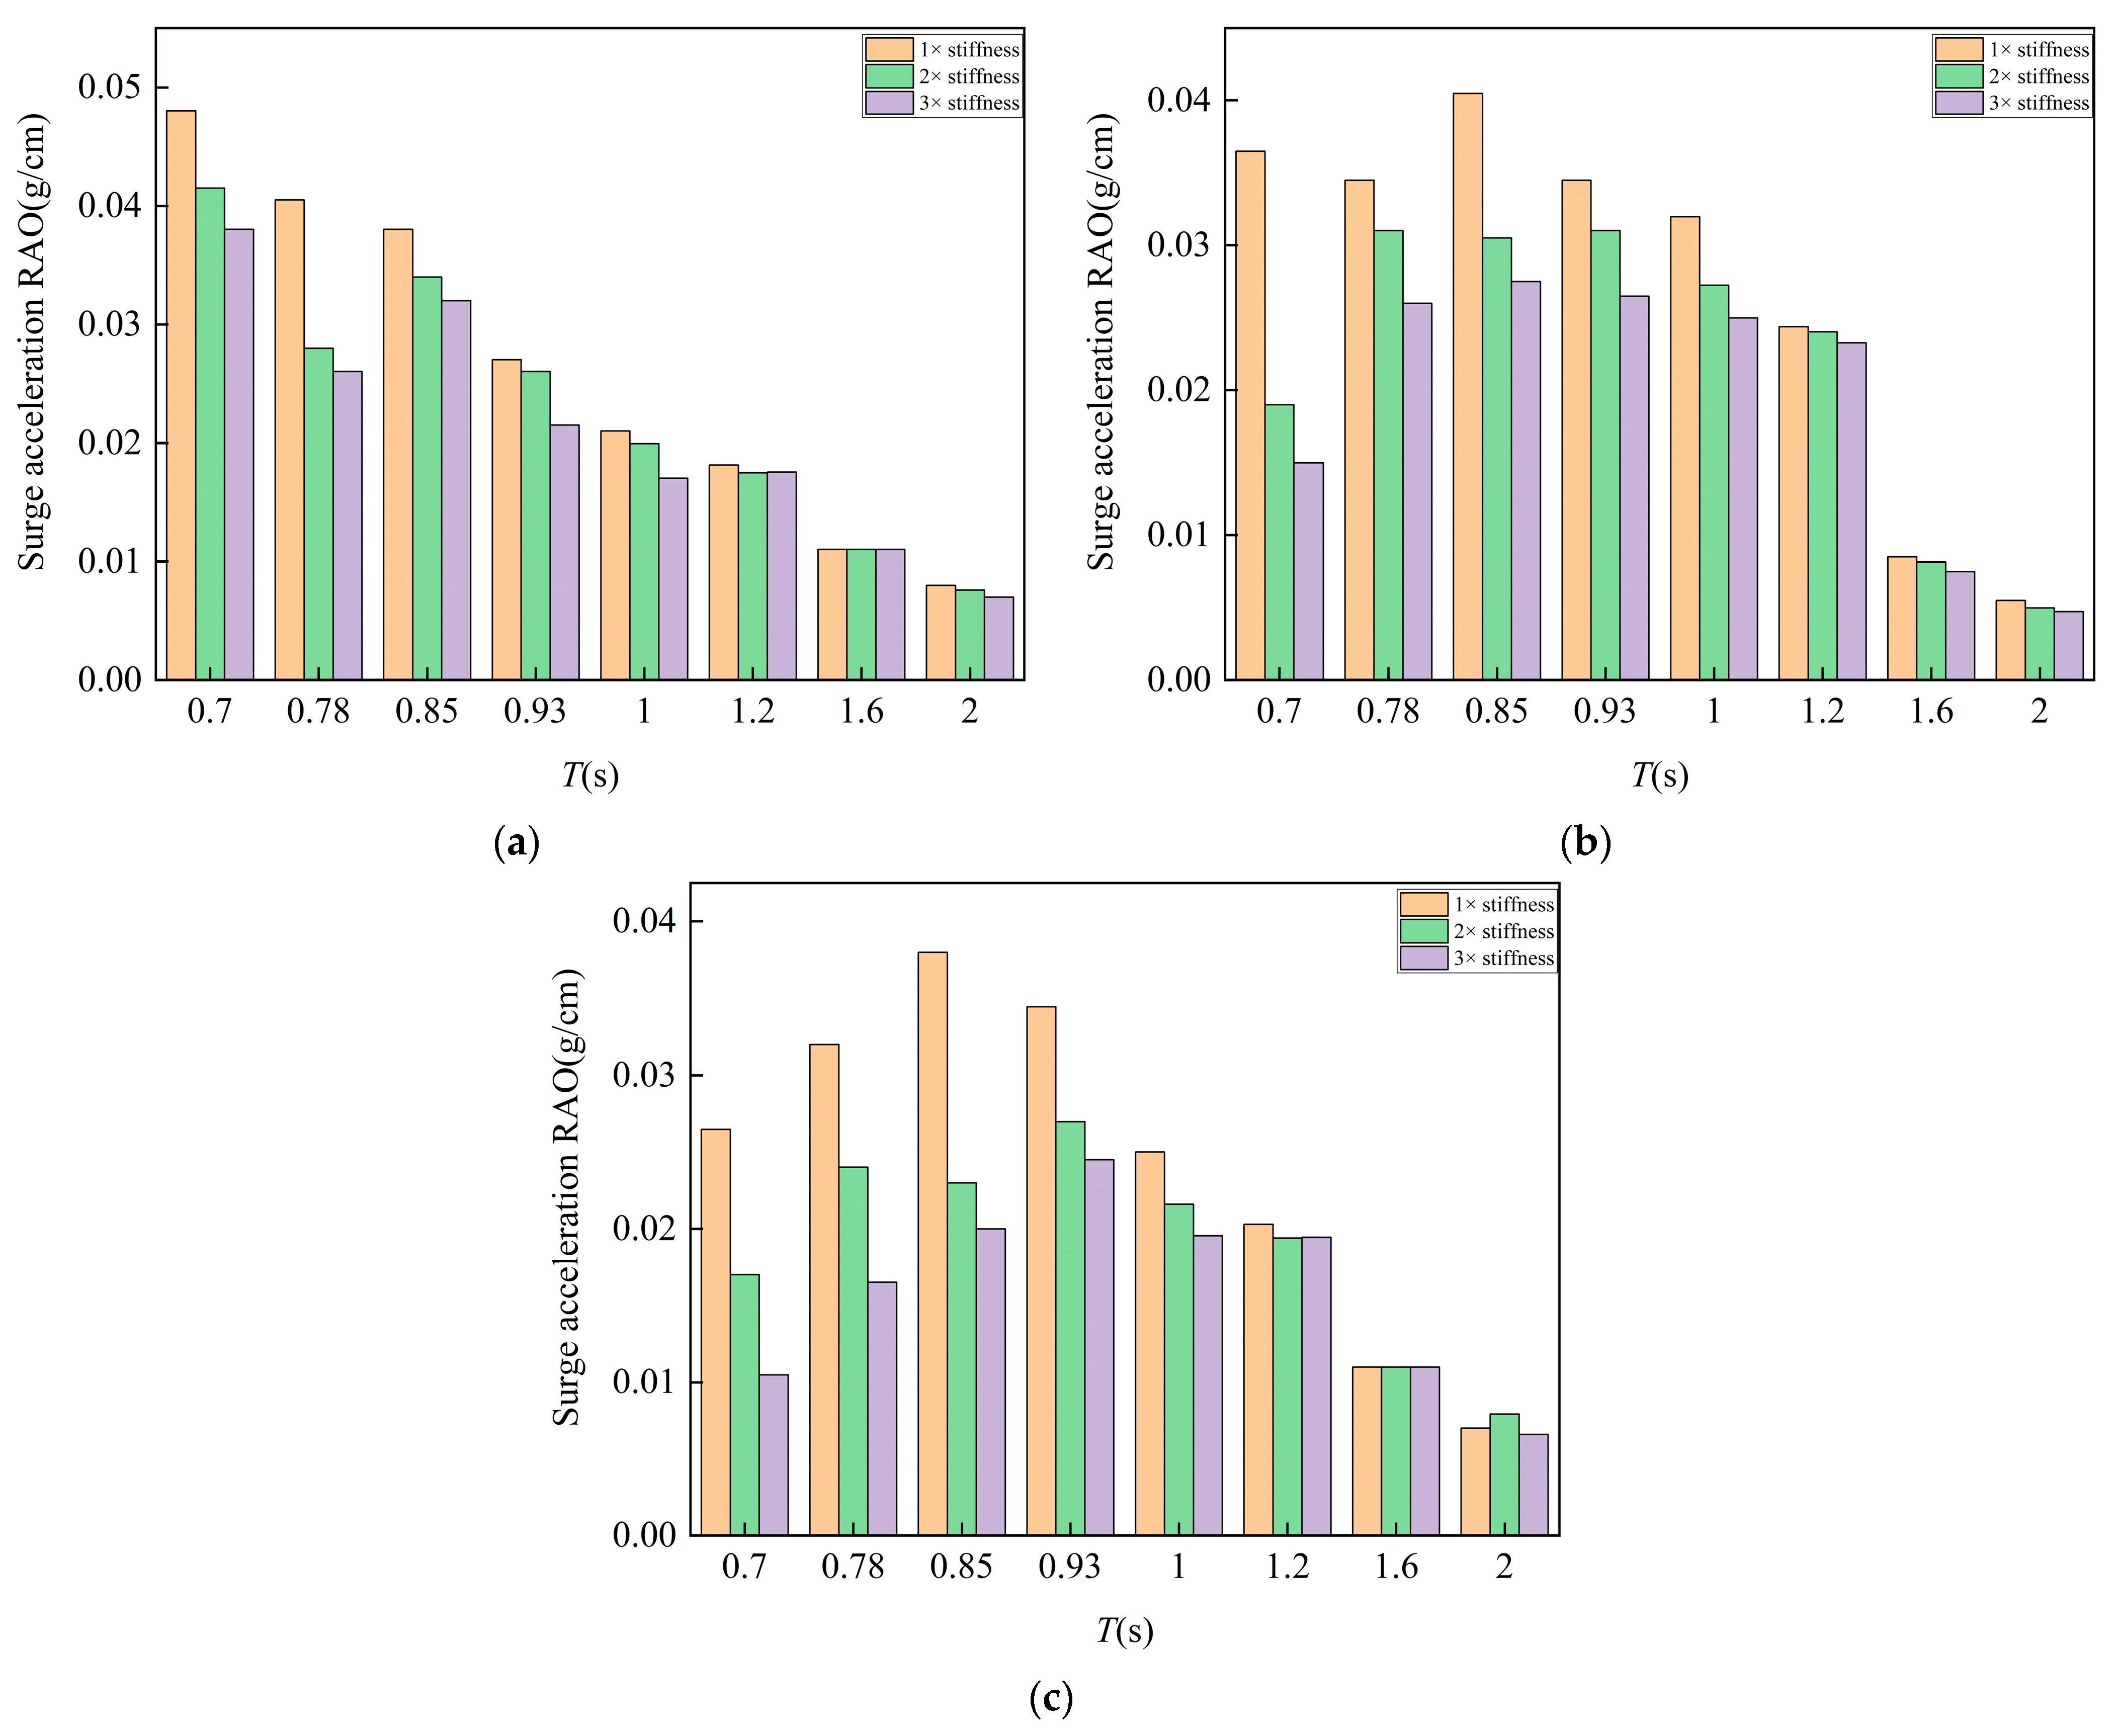
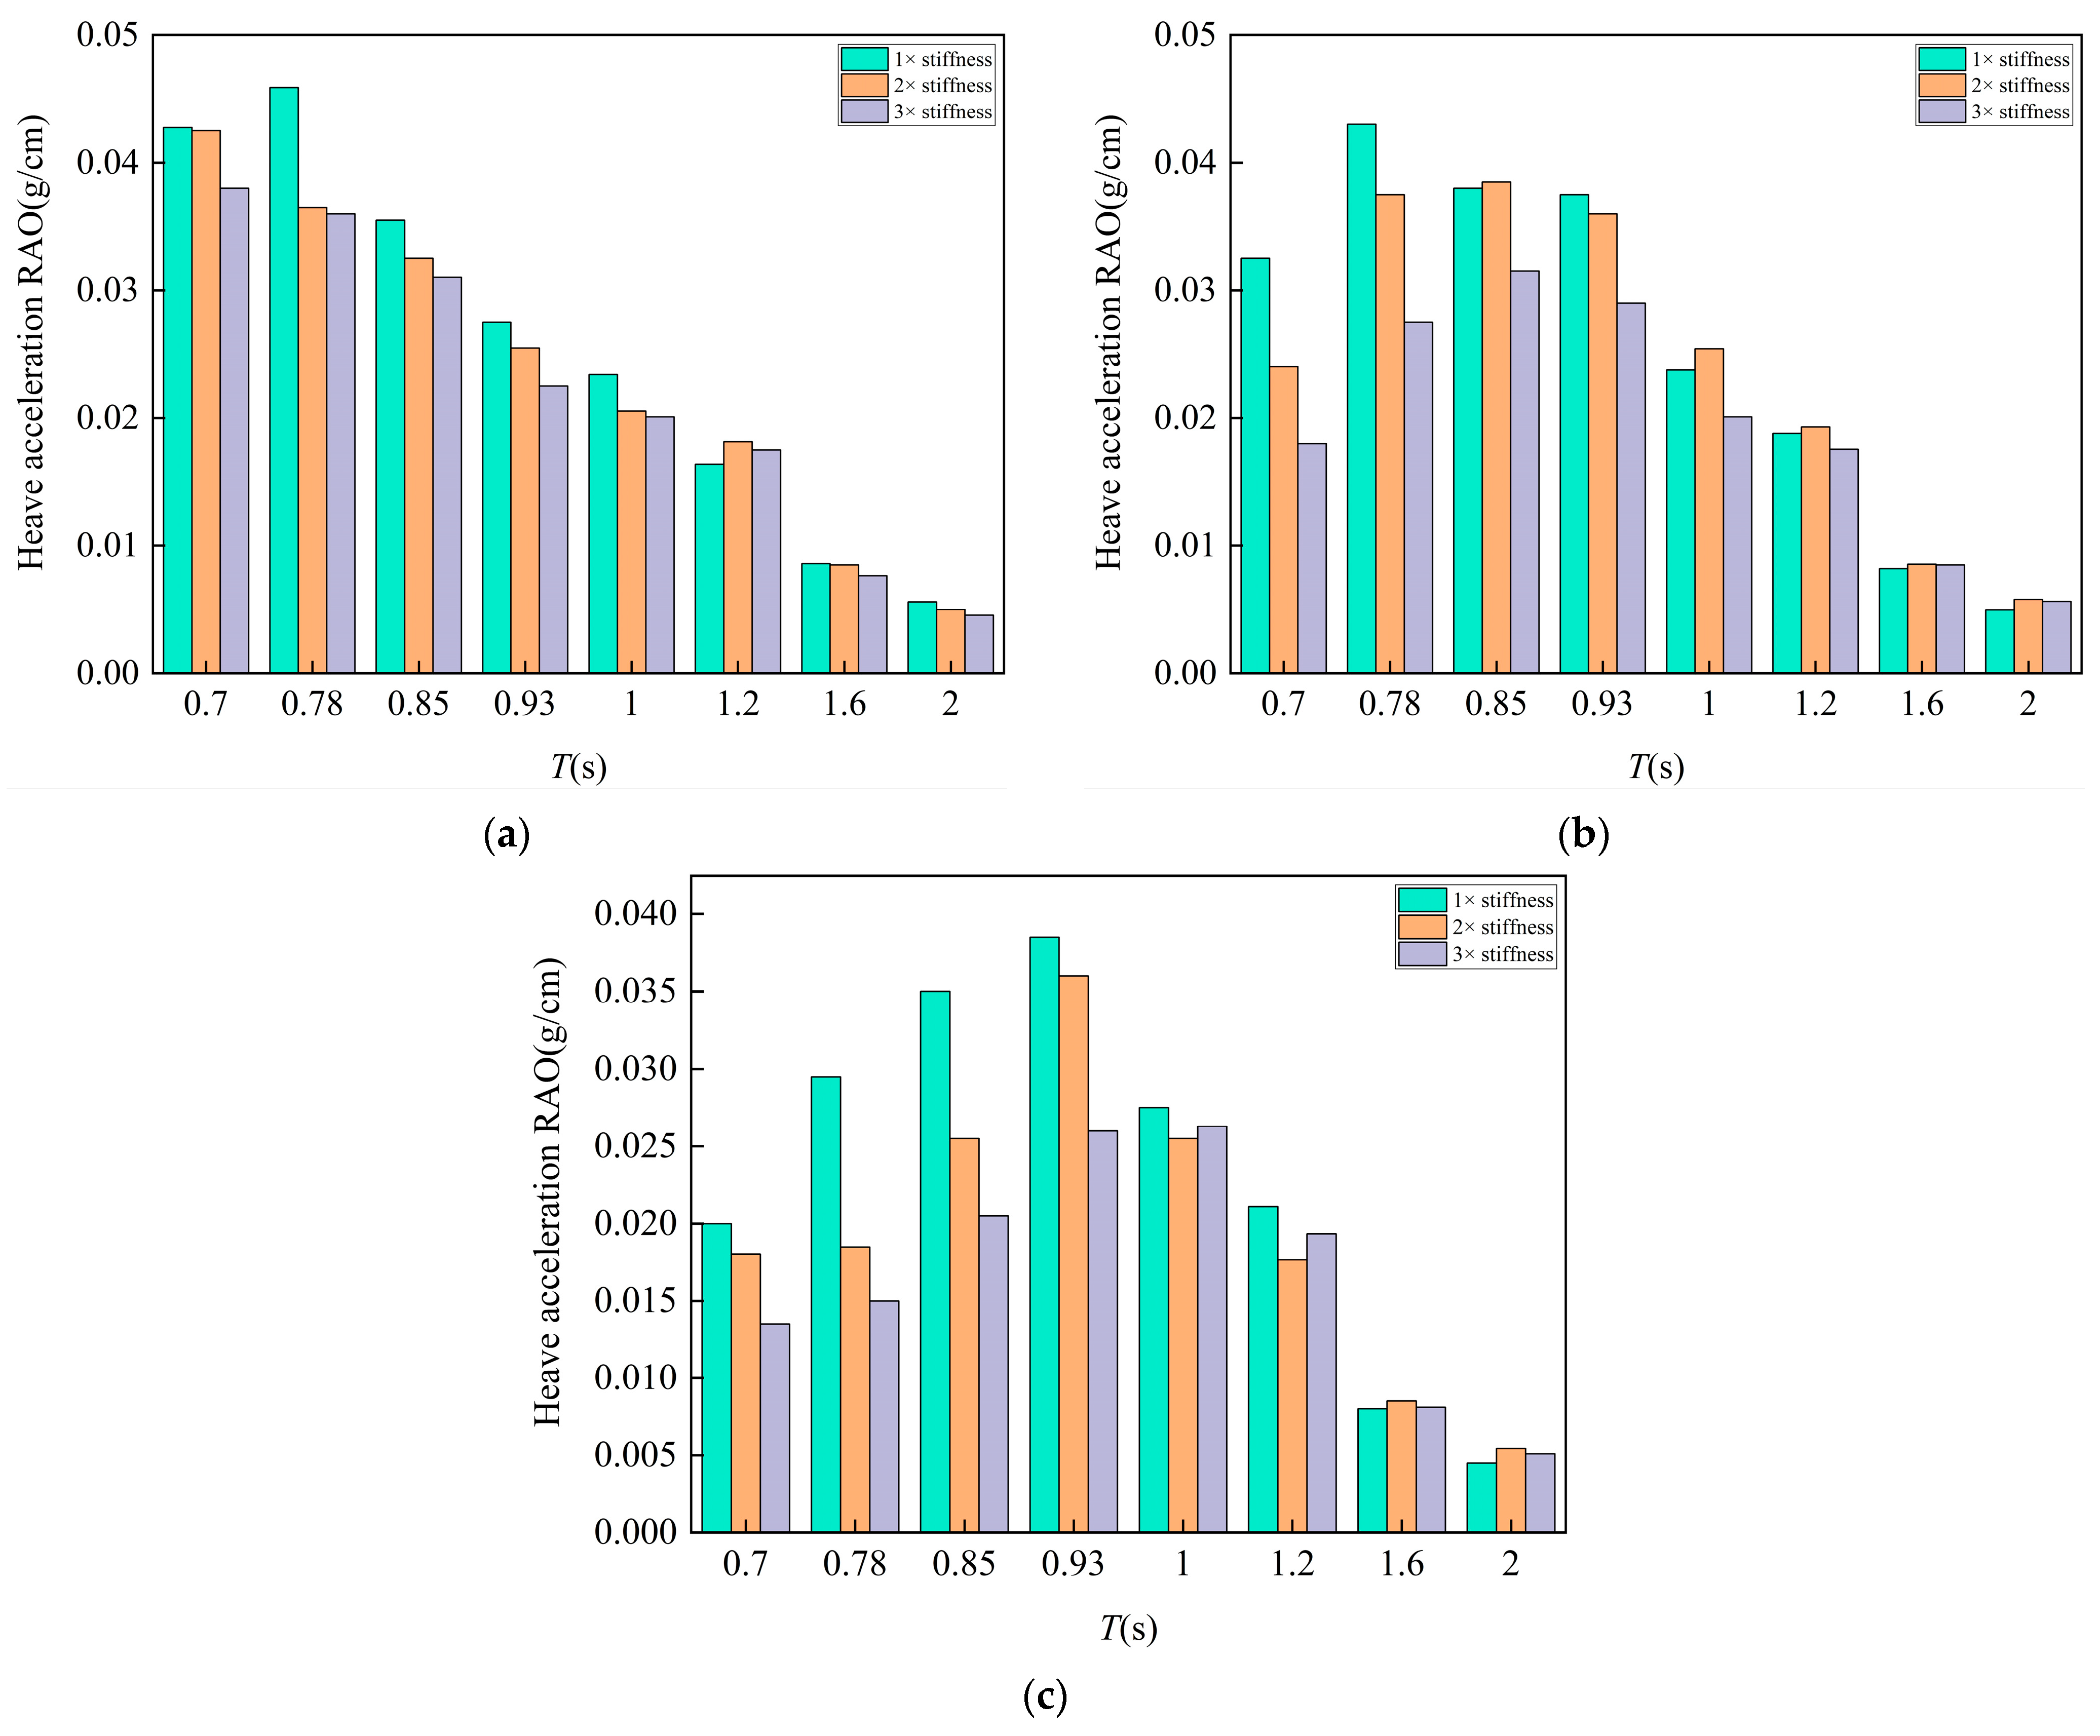
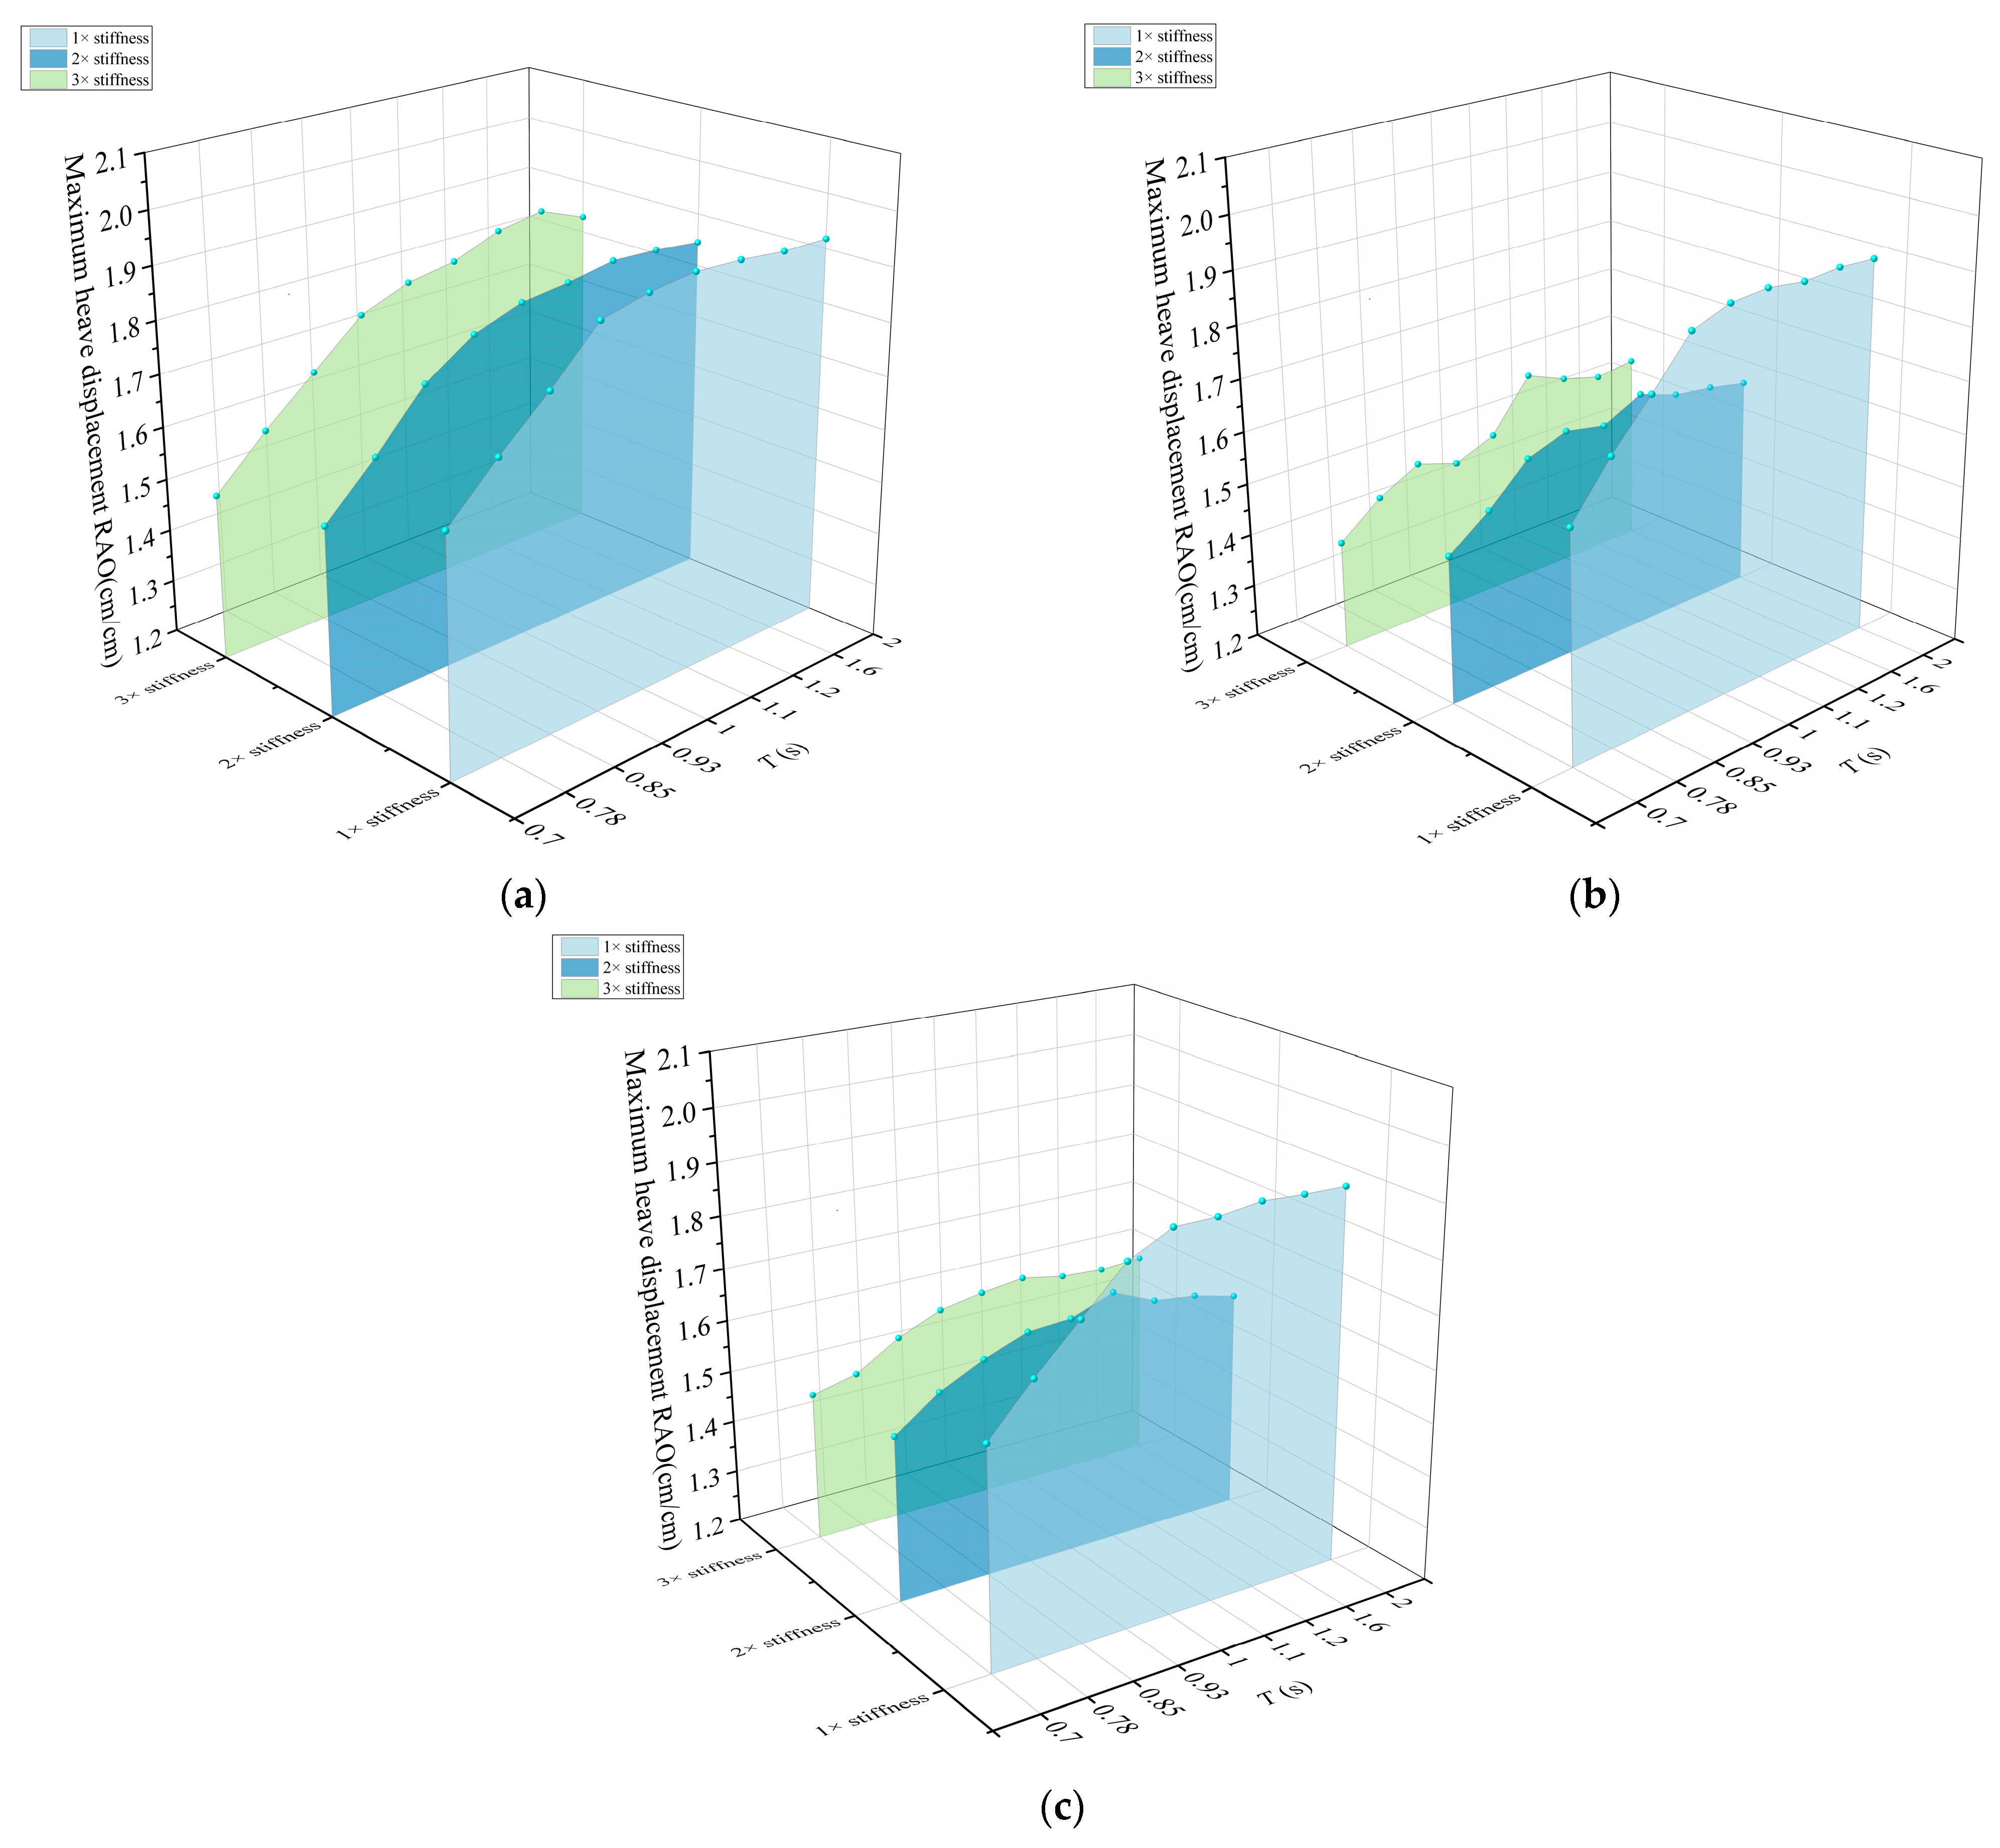
Figure 17, Figure 18, Figure 19 and Figure 20 show the changes in surge acceleration, heave acceleration, pitch angle, and heave displacement at T1, T2, and T3 under regular wave conditions for arrays with single, double, and triple connection stiffness. All tests used the same array configuration, allowing the influence of connection stiffness to be isolated across different wave periods.
Figure 17, Figure 18, Figure 19 and Figure 20 illustrate the influence of connection stiffness on surge acceleration, heave acceleration, pitch angle, and heave displacement. Across all responses, increasing stiffness reduces amplitudes, with the strongest improvements obtained when stiffness increases from single to double, while the difference between double and triple stiffness is minor. The overall frequency-dependent trends remain similar, confirming that stiffness primarily affects amplitudes rather than shifting response patterns.
In terms of differences among motion types, surge acceleration is most sensitive at T2 under short-period waves, while heave acceleration shows the strongest reduction at T3, highlighting the downstream amplification of stiffness effects. Pitch responses decrease moderately with stiffness, with downstream locations again more affected than the wave-facing T1. For heave displacement, T1 shows the largest amplitudes but minimal sensitivity to stiffness, whereas T2 and T3 display smaller amplitudes but stronger relative suppression, indicating that downstream regions benefit more from stiffness tuning.
The spatial variation in stiffness sensitivity can be attributed to different governing mechanisms along the array. At the wave-facing T1, responses are dominated by direct incident forcing, so the influence of local connector stiffness is relatively weak. By contrast, at T2 and T3, wave energy has already interacted with multiple units, and the cumulative structural flexibility becomes increasingly important. In these downstream regions, higher stiffness more effectively suppresses deformation and motion, explaining the stronger sensitivity observed.
These findings highlight that connector stiffness should be treated as a tunable parameter, with optimization focused on downstream regions where structural flexibility and cumulative wave–array interactions make its influence most pronounced. Within the discrete stiffness levels examined in the present experiments, excessive stiffening yields limited hydrodynamic benefits while adding fabrication and installation challenges, so a balanced stiffness design is recommended.

4.3. Coupled Effects of Floater Size and Wave Period on Floating Box Motion

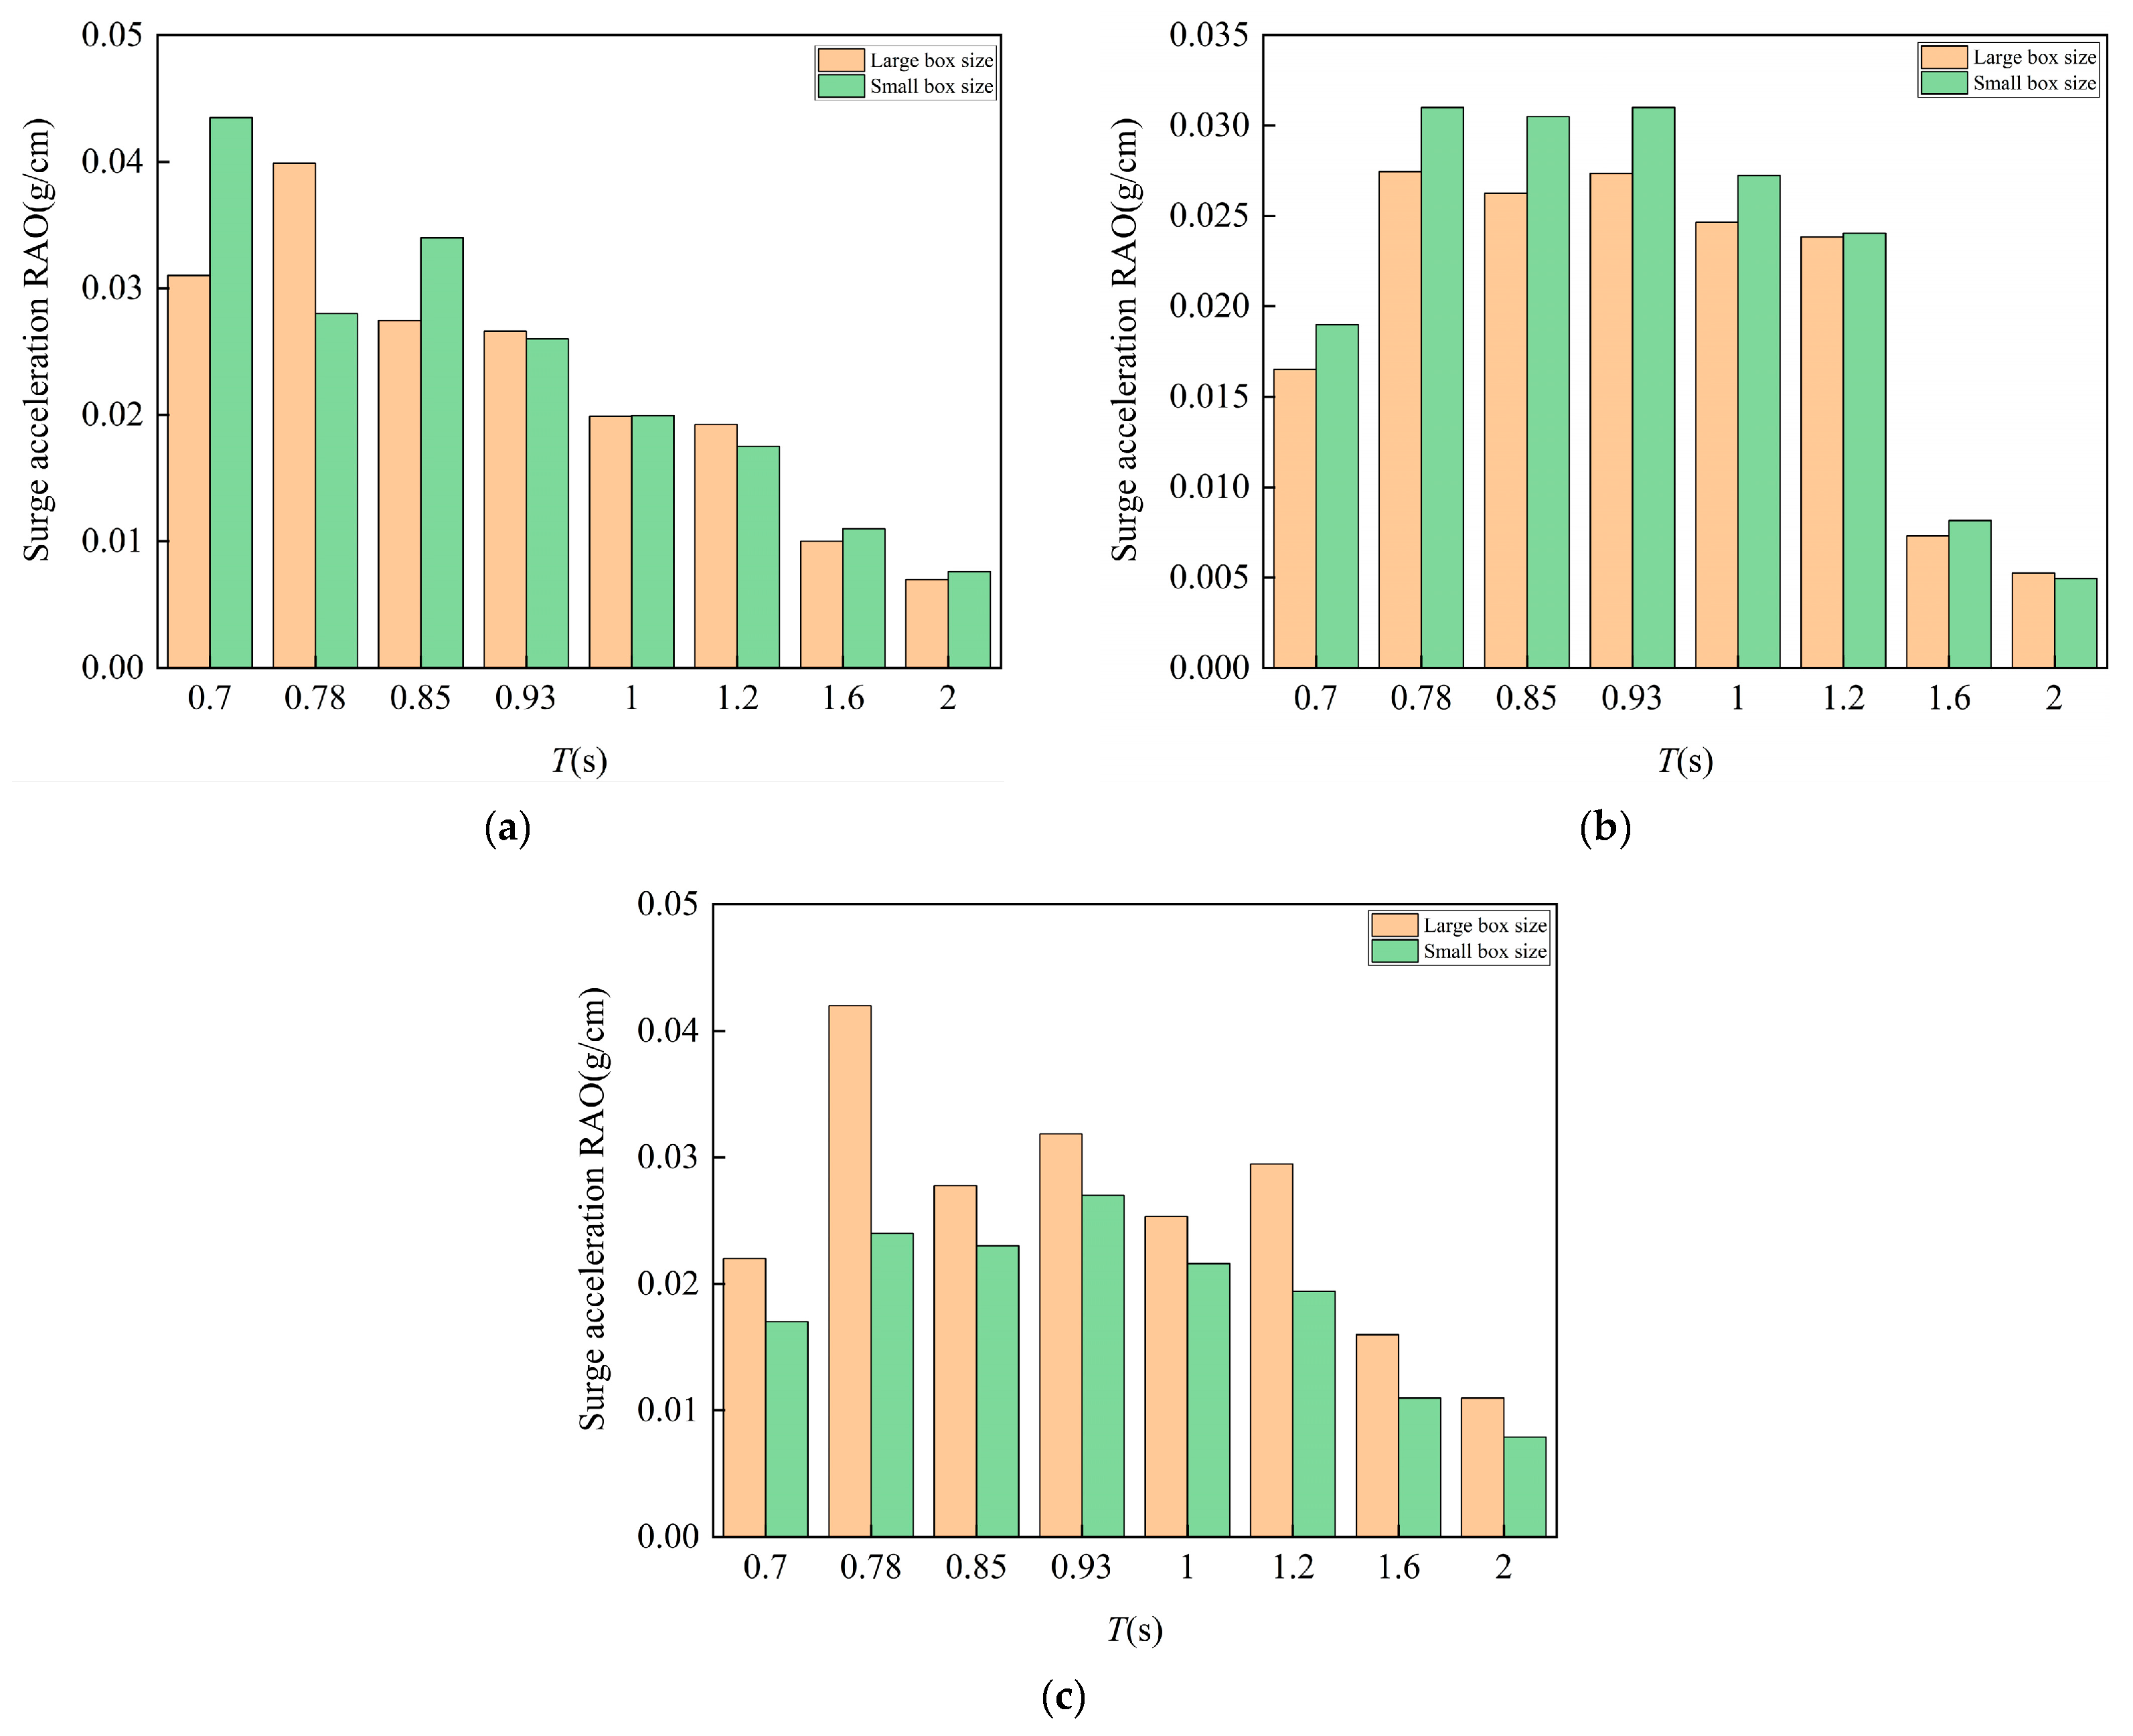
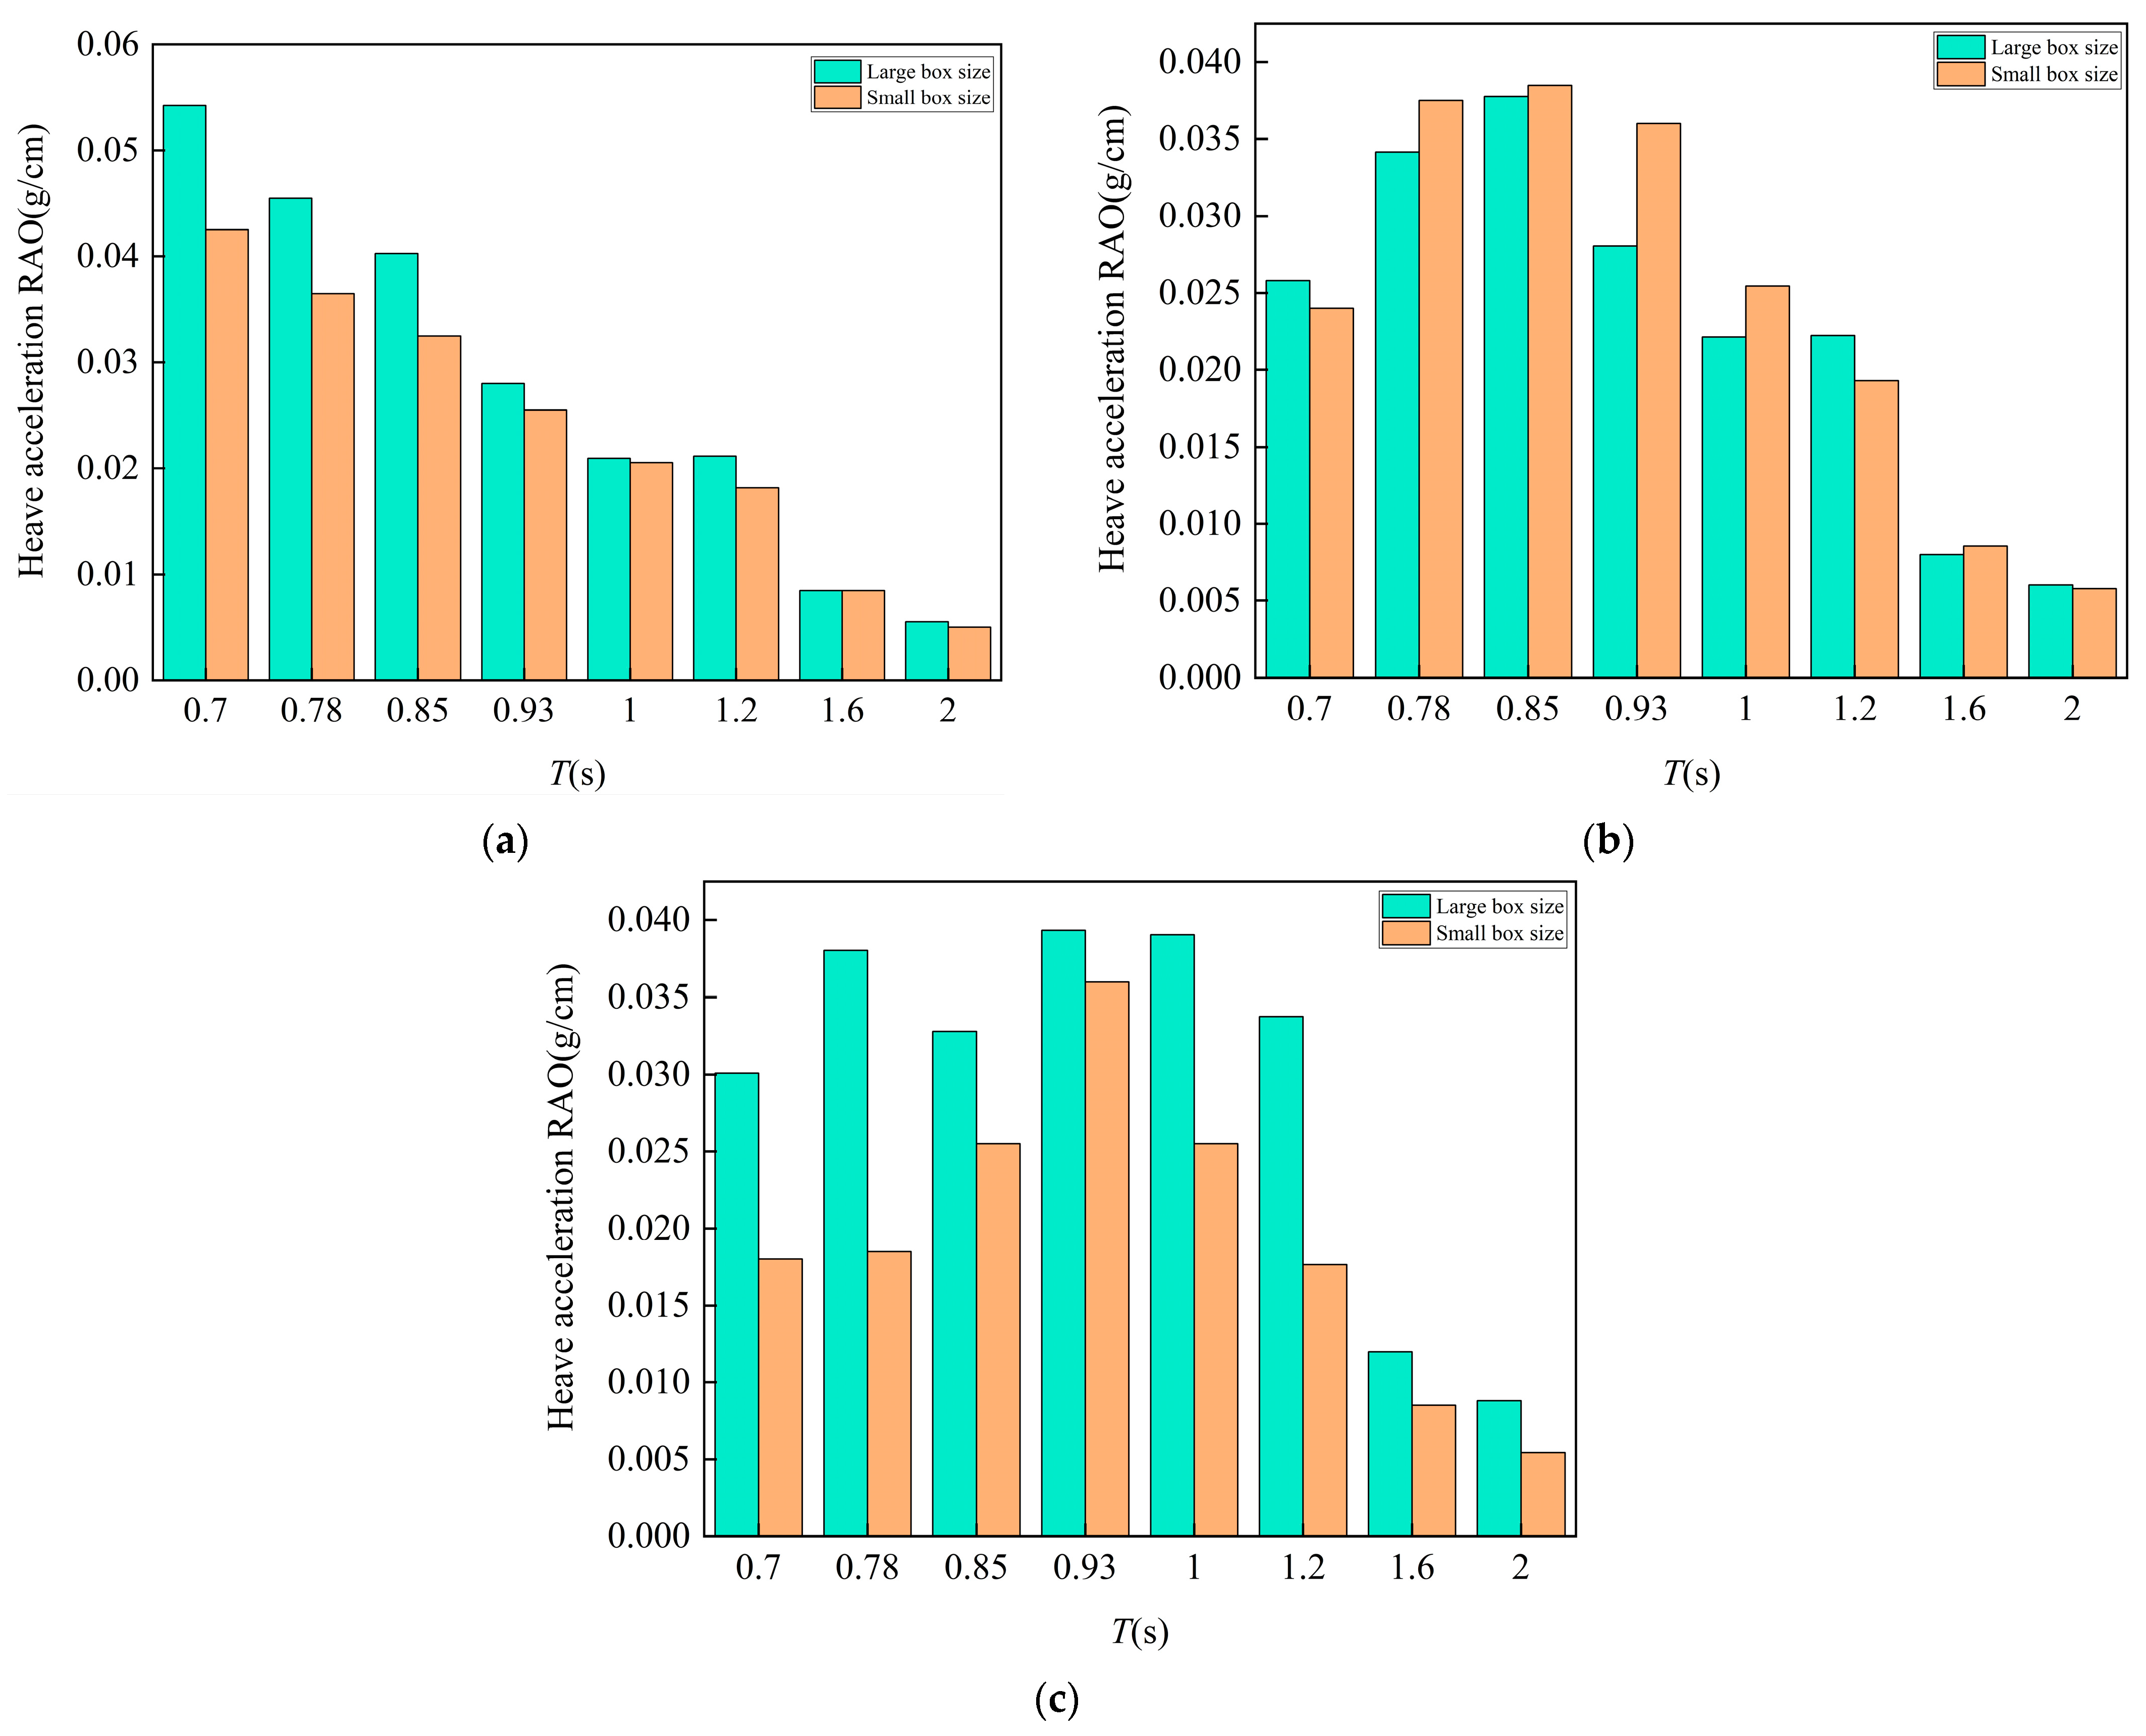
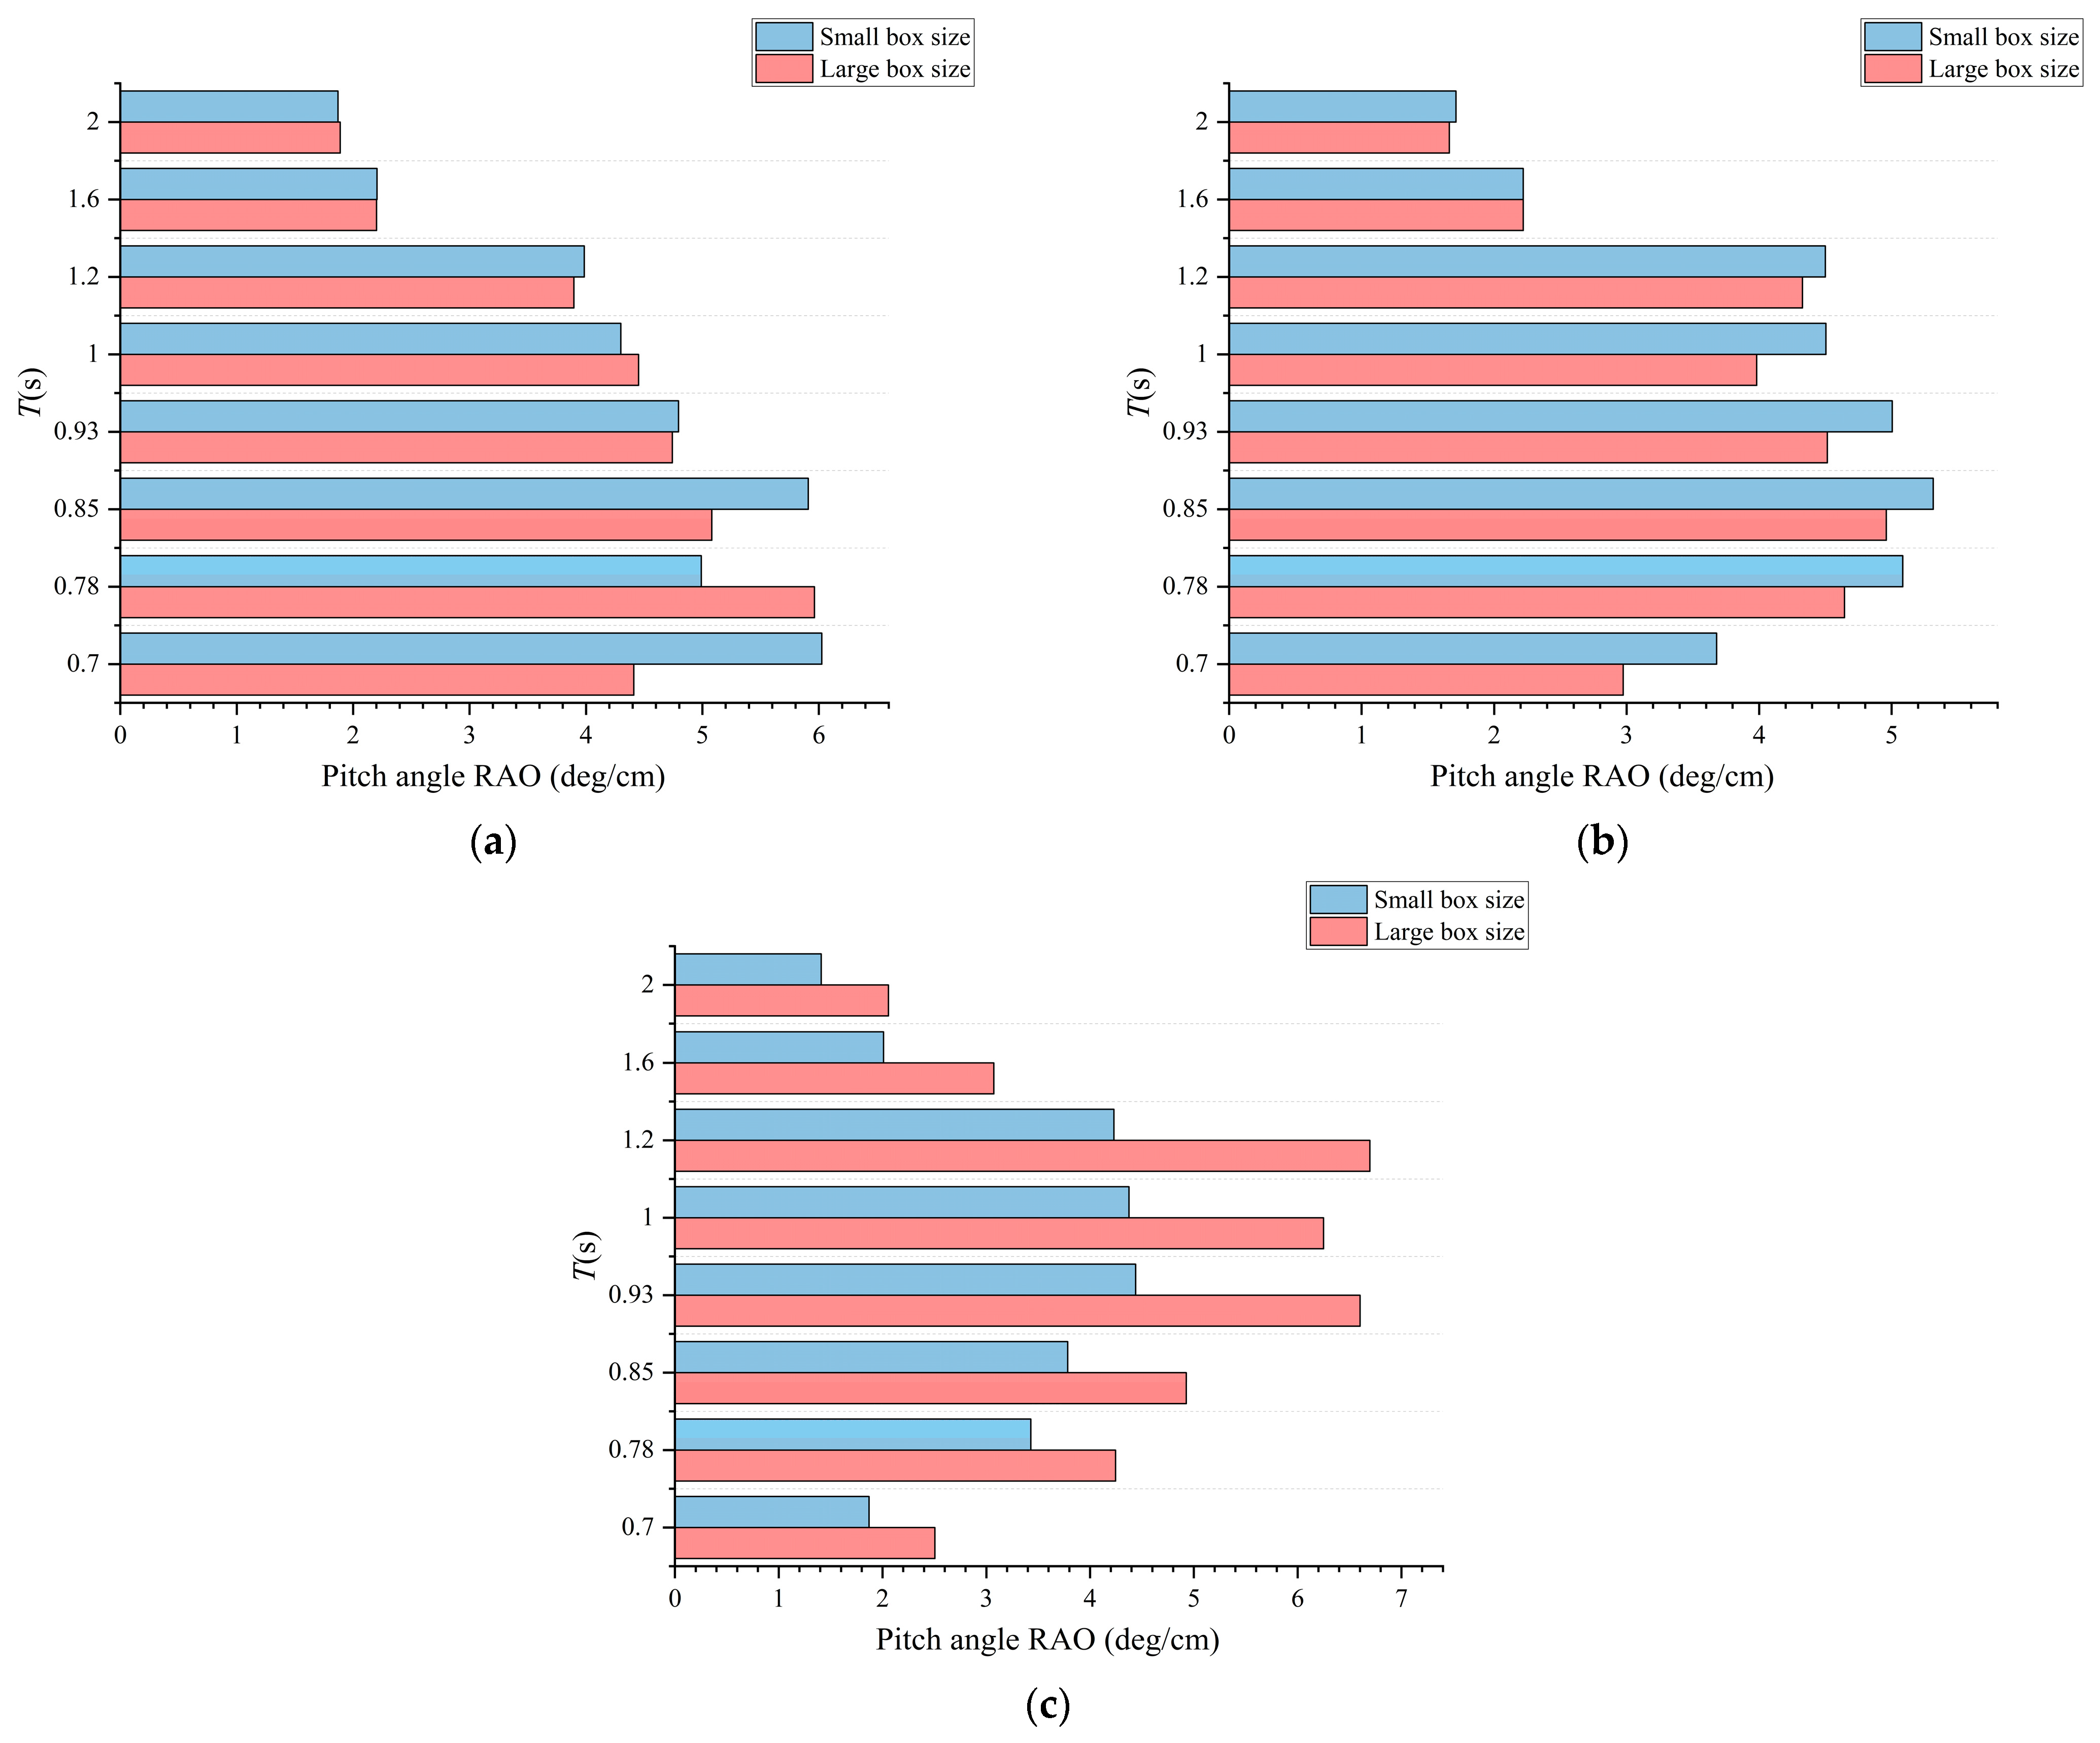
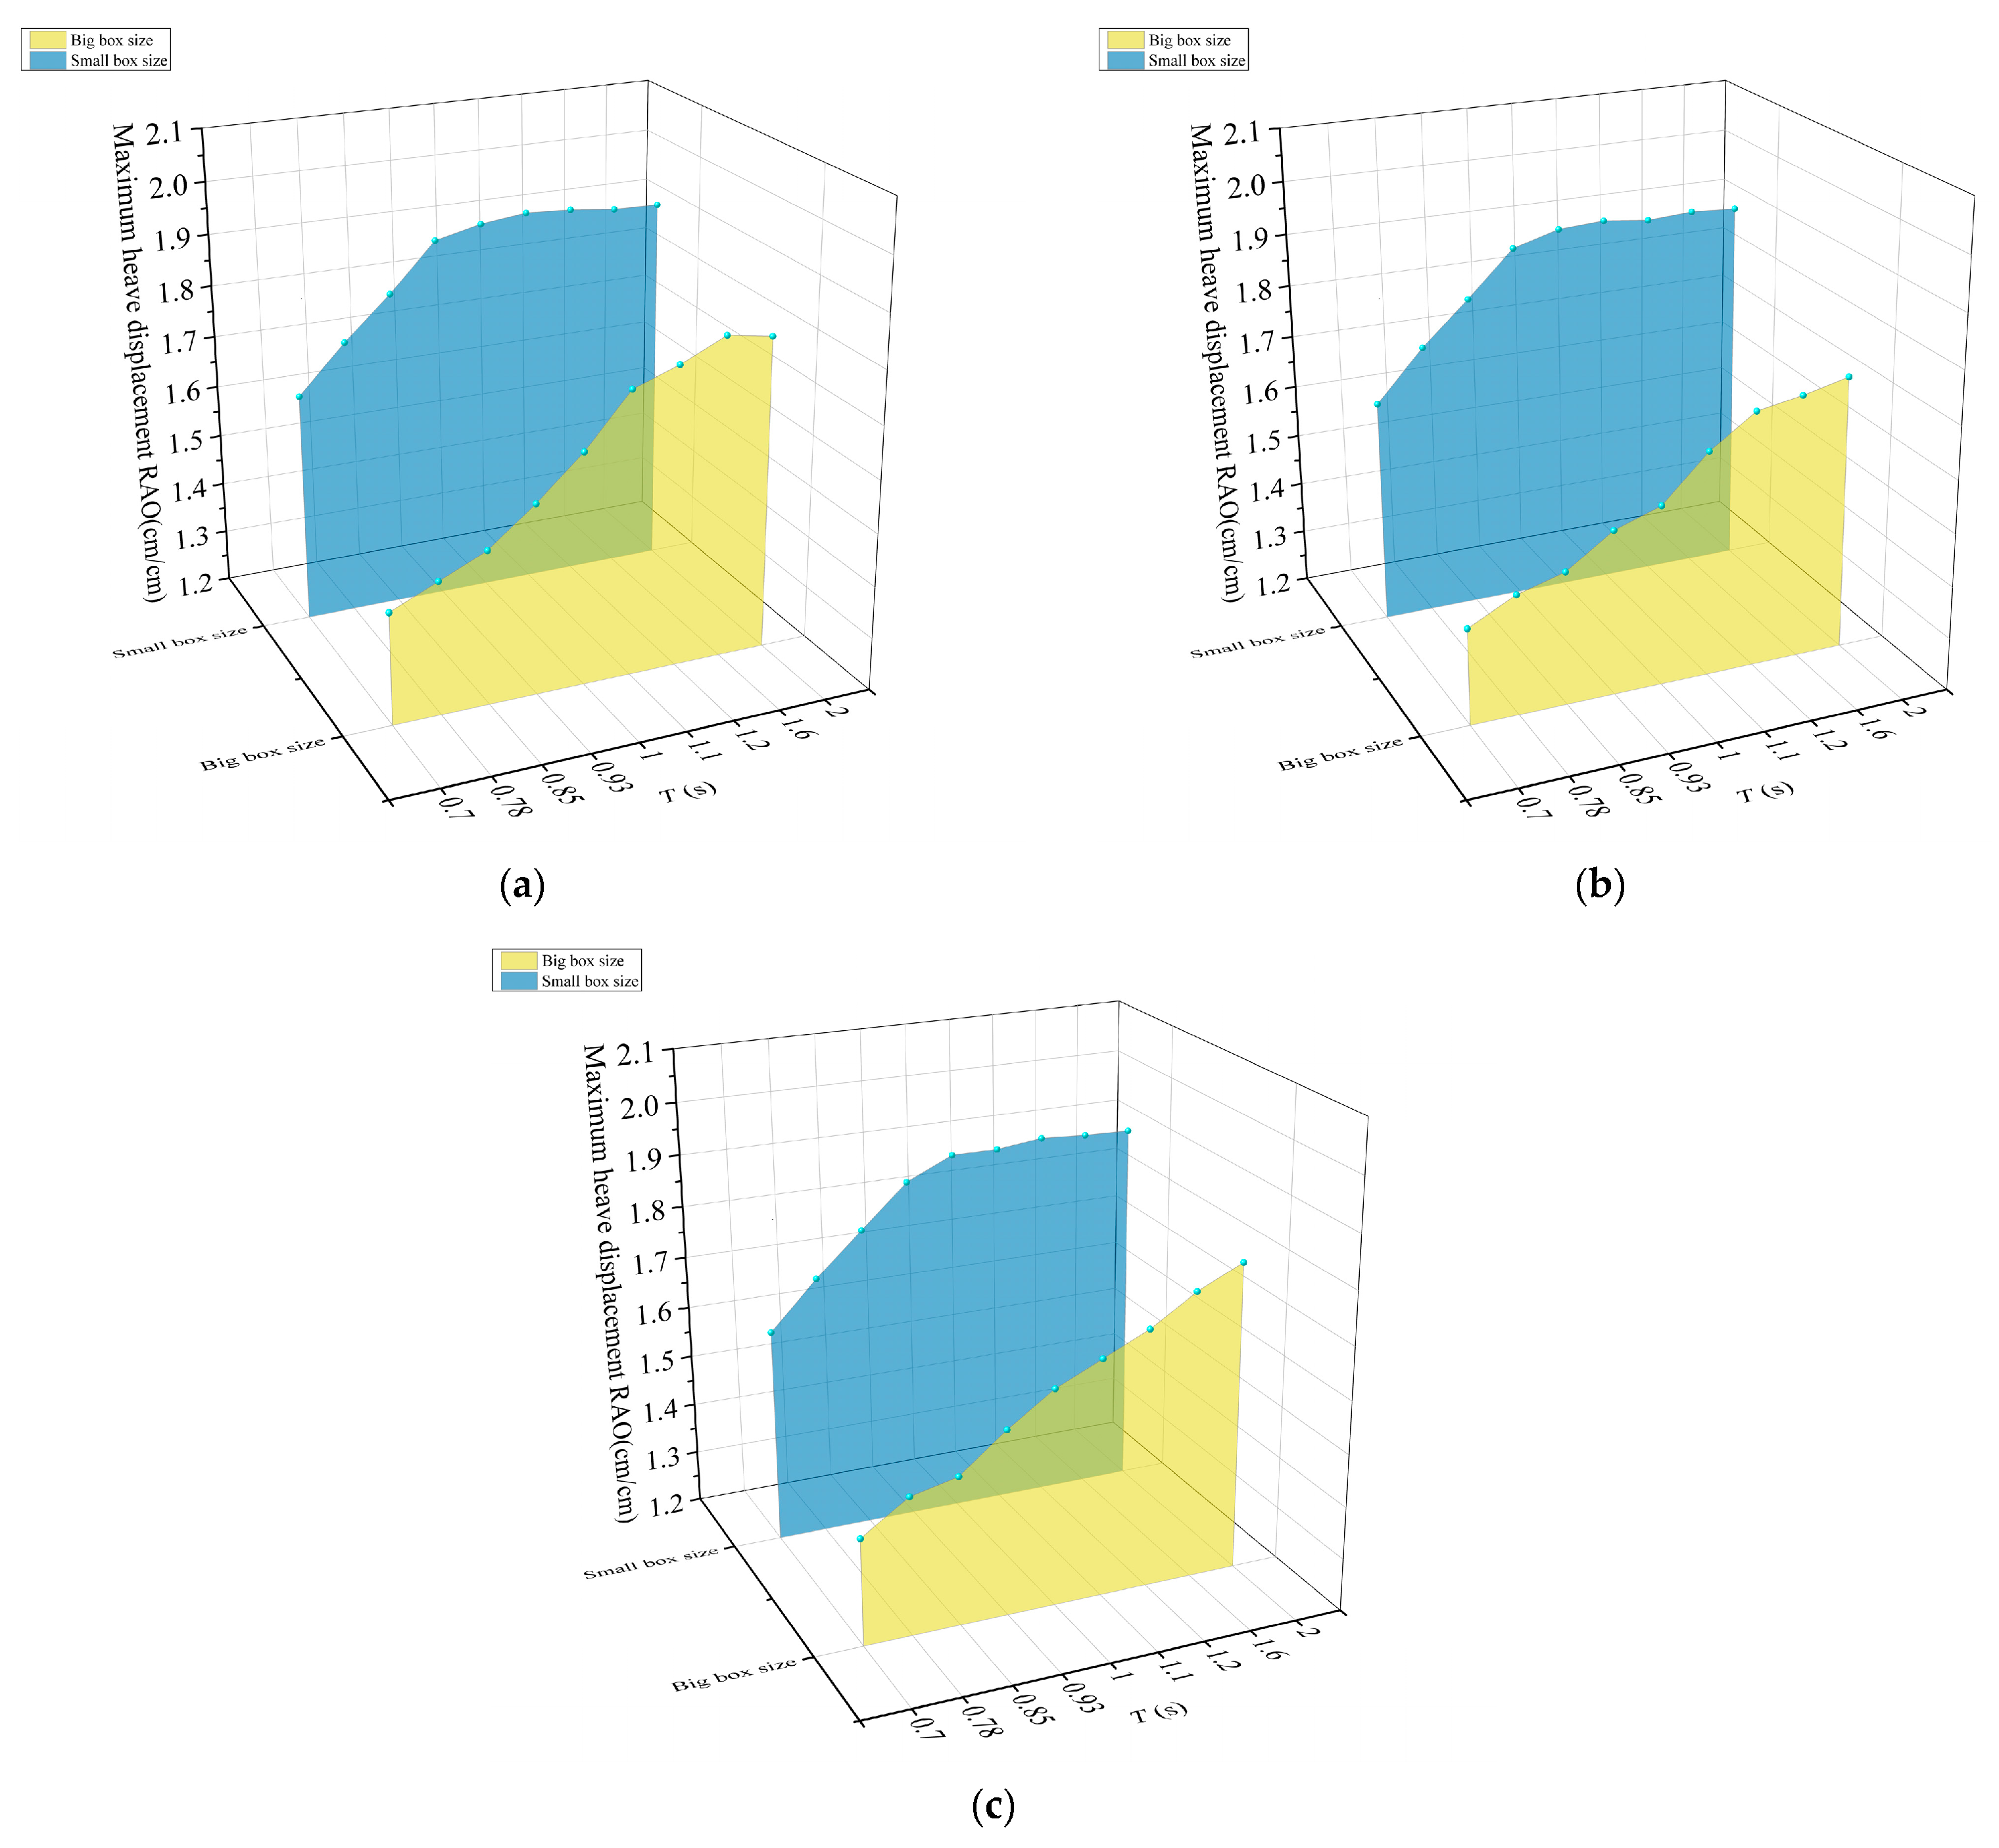
Figure 21, Figure 22, Figure 23 and Figure 24 present the variations in surge acceleration, heave acceleration, pitch angle, and heave displacement at measurement points T1, T2, and T3 under regular wave conditions for both large and small floating box models.
Figure 21, Figure 22, Figure 23 and Figure 24 compare the responses of arrays composed of small and large floating boxes under regular waves. While the surge acceleration and pitch angle responses of large floating boxes follow trends similar to their smaller counterparts, the response amplitudes are generally lower—particularly for heave-related motions, where substantial differences are observed.
These differences become increasingly evident at downstream positions (e.g., T3), where resonance peaks in small boxes are largely suppressed in the large-box configurations.
These disparities primarily stem from structural and hydrodynamic factors. For a given array footprint, using larger floaters reduces the total number of connection points, which significantly increases the overall flexural stiffness of the array. This enhanced stiffness effectively suppresses hydroelastic deformation, particularly under short-period wave conditions where structural rigidity is most influential. Additionally, the increased hydrodynamic scale of large floaters offers stronger wave resistance and greater inertia, further contributing to reduced motion responses under identical wave environments.
Notably, the influence of floater size is more prominent in vertical motion components than in horizontal or rotational responses. This suggests that vertical flexibility and wave-following behavior are especially sensitive to the structural continuity and stiffness properties introduced by floater scaling. These findings suggest that increasing floater size is an effective means of reducing vertical motion responses in offshore FPV arrays, particularly in downstream regions, within the two representative floater scales examined here.
However, it is important to acknowledge that these findings are based solely on regular wave tests in a controlled flume environment. In real offshore deployments, the dynamic behavior of floating arrays is affected by a broader set of environmental forces, including irregular wave spectra, wind loads, and currents, as well as mooring-induced constraints. These factors may alter both the magnitude and nature of structural responses observed here.
In addition, preliminary examination of the measured mooring and connector load data indicates that configurations exhibiting reduced motion responses generally correspond to lower structural load levels. Based on this initial analysis, the load variations are strongly influenced by local connection geometry and load redistribution effects, so the relationship is not strictly proportional to the global motion amplitudes.
Therefore, future studies should aim to incorporate irregular wave conditions and multi-directional loadings through both advanced numerical simulations and in situ field measurements. Such work is essential for validating the observed trends, refining structural designs, and improving the long-term stability and operational reliability of large-scale offshore FPV systems.

5. Conclusions

This study presented a comprehensive series of physical model experiments on a novel floating pontoon-type offshore photovoltaic (OFPV) structure. The investigation systematically explored how key structural parameters, including array scale, connection stiffness, and floater size, influence the hydrodynamic responses of the array under wave loading. The principal findings and engineering implications are summarized as follows:
  • The floating box array exhibited pronounced spatial non-uniformity in its dynamic responses under wave loading, allowing the structure to be classified into two distinct zones, the wave-facing region and the non-wave-facing region, each characterized by fundamentally different motion mechanisms. In the wave-facing region, where floaters are directly exposed to incident waves with minimal upstream shielding, the response amplitudes decreased monotonically as wavelength increased, without distinct resonance peaks. By contrast, in the non-wave-facing region, interference and wave transformation caused by upstream floaters led to response amplitudes that initially increased with wavelength, reached a prominent peak, and subsequently decreased, indicative of resonance-like behavior. Under short-period waves, motion responses were generally more pronounced in the wave-facing region, whereas under long-period wave conditions, the zone of dominant response shifted downstream into the non-wave-facing region.
  • Expanding the array scale significantly reduced the motion responses of the structure, mainly due to the effective shielding and energy dissipation provided by upstream floaters, a phenomenon that was especially evident under short-period wave conditions. Compared with the 5 × 5 array, the downstream (T3) heave-acceleration RAOs under short-period wave conditions were reduced by approximately 30–70% for the 5 × 15 array and by 30–80% for the 5 × 20 array, with the largest reductions occurring at the shortest tested wavelengths. In contrast, smaller-scale arrays, which may be entirely confined within the wave-facing region, lacked upstream hydrodynamic interaction, thus limiting the representativeness of their observed responses for full-scale applications. For engineering practice, this implies that the array length should be sufficiently increased so that part of the system extends into the non-wave-facing zone, thereby improving overall motion stability and ensuring more reliable offshore performance.
  • Increasing the connection stiffness between adjacent floating boxes was shown to effectively attenuate the amplitude of motion responses while maintaining the vertically flexible floating structure (VFFS) behavior of the array. Although variations in stiffness had only a minor effect on the overall response trends, the sensitivity of motion reduction varied spatially, with the non-wave-facing region exhibiting greater responsiveness to stiffness changes. Increasing the connection stiffness from the baseline level to approximately twice the baseline reduced the downstream (T3) heave-acceleration RAOs by about 20–35% under short-period wave conditions, whereas further stiffening to three times the baseline provided no systematic additional reduction and in some cases even led to marginal increases, demonstrating a clear diminishing-return effect.
  • Significant differences in vertical motion responses were observed between large and small floating boxes, while horizontal motion responses remained largely comparable. Comparative tests demonstrated that both types followed similar trends in surge acceleration and pitch angle across different wave periods, with large boxes consistently exhibiting lower amplitudes. However, for vertical motions, particularly heave displacement, large floating boxes showed a clear advantage by suppressing resonance-like peaks observed in small-box arrays, especially under short-period wave conditions. Under short-period wave conditions, the large floaters reduced the downstream (T3) steady-state heave amplitude by approximately 13–17% relative to the small-floater configuration, with the most pronounced reductions occurring in the period range of 0.85–0.93 s. These effects highlight the superior capability of large floaters to reduce vertical motion instabilities and improve overall structural stability.
From an engineering-design perspective, a minimum array length exceeding the spatial extent of the wave-facing region is required to ensure representative hydrodynamic behavior. In the present experiments, arrays longer than 5 × 10 floating units exhibited response convergence between front and rear boxes and substantially reduced downstream motions. With respect to connection stiffness, increasing stiffness from the baseline level to approximately twice the baseline yields the most pronounced motion reduction, whereas further stiffening provides only marginal hydrodynamic benefits, indicating an optimal stiffness range and the need to avoid over-stiffness. Moreover, increasing floater size is more effective than increasing connection stiffness for suppressing vertical motion responses, particularly under short-period wave conditions. Floater scaling enhances hydrostatic restoring forces and inertia, whereas stiffness tuning mainly serves as a secondary parameter for fine-scale adjustment of downstream flexibility.
In summary, this study quantitatively examined the influence of array scale, connector stiffness, and floater size on the hydrodynamic responses of pontoon-type offshore FPV platforms. The results clarify the mechanisms underlying response characteristics across different structural configurations and provide useful reference data for guiding array design in engineering applications. Under the regular-wave excitation considered here, the response behavior is primarily governed by frequency-controlled wave forcing, whereas irregular excitation and additional environmental effects such as wind loading and mooring dynamics are expected to modify the spectral distribution of array responses. Future work will consider irregular waves, combined wind–wave–current effects, and long-term operational conditions to further support the design and assessment of offshore FPV systems in realistic marine environments.


Author Contributions

Conceptualization, J.L.; Methodology, J.L., N.S. and Z.W.; Data curation, J.L., X.D. and X.L.; Formal analysis, G.Z. and W.L.; Investigation, W.L., X.D., N.S. and X.L.; Validation, J.Z., N.S. and Z.W.; Supervision, P.L. and J.Z.; Writing—review and editing, G.Z. and P.L. All authors have read and agreed to the published version of the manuscript.

Funding

This research was funded by the Hebei Natural Science Foundation (Grant No. E2025402113, No. E2024402142) and the National Natural Science Foundation of China (Grant No. 52409085).

Data Availability Statement

The experimental data supporting the findings of this study are available from the corresponding author upon reasonable request. The data are not publicly available due to their large volume and because they form part of an ongoing research program. Selected datasets can be shared for academic research purposes.

Conflicts of Interest

The authors declare no conflicts of interest.

References

  1. Oliveira-Pinto, S.; Stokkermans, J. Marine floating solar plants: An overview of potential, challenges and feasibility. Proc. Inst. Civ. Eng. Marit. Eng. 2020, 173, 120–135. [Google Scholar] [CrossRef] [Scilit]
  2. Ramanan, C.J.; Lim, K.H.; Kurnia, J.C.; Roy, S.; Bora, B.J.; Medhi, B.J. Towards sustainable power generation: Recent advancements in floating photovoltaic technologies. Renew. Sustain. Energy Rev. 2024, 194, 114322. [Google Scholar] [CrossRef] [Scilit]
  3. Kabir, E.; Kumar, P.; Kumar, S.; Adelodun, A.A.; Kim, K.H. Solar energy: Potential and future prospects. Renew. Sustain. Energy Rev. 2018, 82, 894–900. [Google Scholar] [CrossRef] [Scilit]
  4. Wang, G.; Liu, J. Design and performance evaluation of a novel photovoltaic and concentrated solar thermal system using parabolic trough-shaped spectrum filter. Energy Sources Part A Recovery Util. Environ. Eff. 2025, 47, 6918–6933. [Google Scholar] [CrossRef] [Scilit]
  5. Li, H.J.; Liu, F.S.; Du, J.F.; Chang, A.T.; Li, L.; Xu, K.; Chen, X.G.; Hou, H.M.; Song, H. Development trend and technical challenges of ocean engineering. Coast. Eng. 2022, 41, 283–300. [Google Scholar] [CrossRef]
  6. El Hammoumi, A.; Chalh, A.; Allouhi, A.; Motahhir, S.; El Ghzizal, A.; Derouich, A. Design and construction of a test bench to investigate the potential of floating PV systems. J. Clean. Prod. 2021, 278, 123917. [Google Scholar] [CrossRef] [Scilit]
  7. Pringle, A.M.; Handler, R.M.; Pearce, J.M. Aquavoltaics: Synergies for dual use of water area for solar photovoltaic electricity generation and aquaculture. Renew. Sustain. Energy Rev. 2017, 80, 572–584. [Google Scholar] [CrossRef] [Scilit]
  8. Rosa-Clot, M.; Tina, G.M.; Nizetic, S. Floating photovoltaic plants and wastewater basins: An Australian project. Energy Procedia 2017, 134, 664–674. [Google Scholar] [CrossRef] [Scilit]
  9. Cazzaniga, R.; Rosa-Clot, M. The booming of floating PV. Sol. Energy 2021, 219, 3–10. [Google Scholar] [CrossRef] [Scilit]
  10. Wei, Y.; Khojasteh, D.; Windt, C.; Huang, L. An interdisciplinary literature review of floating solar power plants. Renew. Sustain. Energy Rev. 2025, 209, 115094. [Google Scholar] [CrossRef] [Scilit]
  11. Zhang, C.; Dai, J.; Ang, K.K.; Lim, H.V. Development of compliant modular floating photovoltaic farm for coastal conditions. Renew. Sustain. Energy Rev. 2024, 190, 114084. [Google Scholar] [CrossRef] [Scilit]
  12. Esparza, I.; Olábarri Candela, Á.; Huang, L.; Yang, Y.; Budiono, C.; Riyadi, S.; Hetharia, W.; Hantoro, R.; Setyawan, D.; Utama, I.K.A.P.; et al. Floating PV systems as an alternative power source: Case study on three representative islands of Indonesia. Sustainability 2024, 16, 1345. [Google Scholar] [CrossRef] [Scilit]
  13. Huang, G.; Tang, Y.; Chen, X.; Chen, M.; Jiang, Y. A comprehensive review of floating solar plants and potentials for offshore applications. J. Mar. Sci. Eng. 2023, 11, 2064. [Google Scholar] [CrossRef] [Scilit]
  14. Kumar, M.; Niyaz, H.M.; Gupta, R. Challenges and opportunities towards the development of floating photovoltaic systems. Sol. Energy Mater. Sol. Cells 2021, 233, 111408. [Google Scholar] [CrossRef] [Scilit]
  15. Huang, L.; Elzaabalawy, H.; Sarhaan, M.; Sherif, A.; Ding, H.; Ou, B.; Yang, D.; Cerik, B.C. Developing reliable floating solar systems on seas: A review. Ocean Eng. 2025, 322, 120525. [Google Scholar] [CrossRef] [Scilit]
  16. Huang, L.; Pan, B.; Wang, S.; Dong, Y.; Mou, Z. Review on maximum power point tracking control strategy algorithms for offshore floating photovoltaic systems. J. Mar. Sci. Eng. 2024, 12, 2121. [Google Scholar] [CrossRef] [Scilit]
  17. Fan, S.; Ma, Z.; Liu, T.; Zheng, C.; Wang, H. Innovations and development trends in offshore floating photovoltaic systems: A comprehensive review. Energy Rep. 2025, 13, 1950–1958. [Google Scholar] [CrossRef] [Scilit]
  18. Zhang, P.; Ren, J.; Xiong, L.; Le, C.; Ding, H. Comparative analysis on the hydrodynamic characteristics of offshore floating photovoltaic systems based on membrane structures under different mooring configurations. J. Renew. Sustain. Energy 2024, 16, 063501. [Google Scholar] [CrossRef] [Scilit]
  19. Xiong, L.; Le, C.; Zhang, P.; Ding, H. Hydrodynamic characteristics of floating photovoltaic systems based on membrane structures in maritime environment. Ocean Eng. 2025, 315, 119827. [Google Scholar] [CrossRef] [Scilit]
  20. Chen, Z.; Wang, F.; Zhang, H.; Chen, Z.; He, Q. Performance and safety evaluation of rack vehicle in mountainous regions under pulsating wind loads. Mech. Based Des. Struct. Mach. 2025, 1–22. [Google Scholar] [CrossRef] [Scilit]
  21. Chen, M.; Jiang, Y.; Zhou, Y.; Li, C.B.; Tang, Y.; Chen, Z.; Shu, J.; Zou, M.; Han, Z.; Choo, Y.S.; et al. Advancing the efficient computation of flexible interconnected multi-floater photovoltaic platforms by coupled hydrodynamic–structural model. Phys. Fluids 2025, 37, 037167. [Google Scholar] [CrossRef] [Scilit]
  22. Ou, B.; Cerik, B.C.; Huang, L. Seakeeping analysis of catamaran and barge floats for floating solar arrays: A CFD study with experimental validation. Ocean Eng. 2025, 326, 120970. [Google Scholar] [CrossRef] [Scilit]
  23. Song, J.; Imani, H.; Yue, J.; Yang, S. Hydrodynamic characteristics of floating photovoltaic systems under ocean loads. J. Mar. Sci. Eng. 2023, 11, 1813. [Google Scholar] [CrossRef] [Scilit]
  24. Jifaturrohman, M.I.; Utama, I.K.A.P.; Putranto, T.; Setyawan, D.; Huang, L. A study into the correlation between single array-hull configurations and wave spectrum for floating solar photovoltaic systems. Ocean Eng. 2024, 312, 119312. [Google Scholar] [CrossRef] [Scilit]
  25. Magkouris, A.; Belibassakis, K.; Rusu, E. Hydrodynamic analysis of twin-hull structures supporting floating PV systems in offshore and coastal regions. Energies 2021, 14, 5979. [Google Scholar] [CrossRef] [Scilit]
  26. Xu, W.; Sun, Y.; He, Z. Hydrodynamic performance study of floating photovoltaic arrays with multiple floating bodies. Appl. Ocean Res. 2024, 153, 104286. [Google Scholar] [CrossRef] [Scilit]
  27. Shi, Y.; Wei, Y.; Tay, Z.Y.; Chen, Z. Hydroelastic analysis of offshore floating photovoltaic based on frequency-domain model. Ocean Eng. 2023, 289, 116213. [Google Scholar] [CrossRef] [Scilit]
  28. Ma, G.; Zhang, C.; Chen, H.; Hou, W.; Wang, W.; Zhang, J. Hydrodynamic analysis of floating photovoltaic system constrained with rigid connectors. Sci. Rep. 2024, 14, 29920. [Google Scholar] [CrossRef] [Scilit]
  29. He, M.; Liang, D.; Ren, B.; Li, J.; Shao, S. Wave interactions with multi-float structures: SPH model, experimental validation, and parametric study. Coast. Eng. 2023, 184, 104333. [Google Scholar] [CrossRef] [Scilit]
  30. Wang, B.; Li, Y.; Huang, L.; Yao, Y.; Qin, Y. Dynamic analysis of a novel star-type floating photovoltaic system with flexible connectors. Ocean Eng. 2024, 304, 117854. [Google Scholar] [CrossRef] [Scilit]
  31. Friel, D.; Karimirad, M.; Whittaker, T.; Doran, J. Experimental hydrodynamic assessment of a cylindrical-type floating solar system exposed to waves. J. Ocean Eng. Sci. 2023, 8, 461–473. [Google Scholar] [CrossRef] [Scilit]
  32. Yang, Y.; Mi, C.; Ou, B.; Wong, A.; Duffy, J.G.; Wood, T.; Utama, I.K.A.P.; Chen, W.; Huang, L. A comparative experimental study on the hydrodynamic performance of two floating solar structures with a breakwater in waves. Sol. Energy 2024, 284, 113029. [Google Scholar] [CrossRef] [Scilit]
  33. Xue, M.A.; Hu, X.; Hu, Y.A.; Yuan, X. Experimental and numerical study on dynamic response of a photovoltaic support structural platform with a U-shaped tuned liquid column damper. Ocean Eng. 2024, 311, 118908. [Google Scholar] [CrossRef] [Scilit]
  34. Saw, M.H.; Heng, S.L.; Leow, S.W.; Nairi, A.; Pravettoni, M. Reliability of floating photovoltaics (FPV): Evaluating the effects of hydrodynamic mechanical loads on photovoltaic modules. Jpn. J. Appl. Phys. 2025, 64, 04SP50. [Google Scholar] [CrossRef] [Scilit]
Figure 1. Representative configurations of offshore floating photovoltaic (FPV) platforms. (a) Pontoon-type structure; (b) high-performance concrete float; (c) semi-submersible truss structure platform; (d) flexible membrane floating structure.
Jmse 14 00322 g001
Figure 2. Snapshot of video used for measuring heave motion.
Jmse 14 00322 g002
Figure 3. Connection lug model. (a) Lug dimensions. (b) Fabricated lug.
Jmse 14 00322 g003
Figure 4. Floating box model with pre-drilled bolt holes.
Jmse 14 00322 g004
Figure 5. Schematic of a 5 × 20 floating box array.
Jmse 14 00322 g005
Figure 6. Configurations of 1×, 2×, and 3× connection stiffness. (a) Single lug; (b) Double lugs; (c) Triple lugs.
Jmse 14 00322 g006
Figure 7. Schematics of two floating box sizes.
Jmse 14 00322 g007
Figure 8. First three vibration modes of the 5 × 5 scaled model. (a) First mode, f = 3.644 Hz; (b) Second mode, f = 5.522 Hz; (c) Third mode, f = 7.182 Hz.
Jmse 14 00322 g008
Figure 9. First three vibration modes of the 5 × 5 prototype. (a) First mode, f = 0.994 Hz; (b) Second mode, f = 1.368 Hz; (c) Third mode, f = 1.636 Hz.
Jmse 14 00322 g009
Figure 10. Schematic diagrams of experimental setup. (a) Definition of coordinate systems; (b) Experimental layout of the 5 × 20 floating box array under horizontal mooring.
Jmse 14 00322 g010
Figure 11. Schematic of monitoring point layout for the 5 × 15 floating box array.
Jmse 14 00322 g011
Figure 12. Comparison of motion responses at the T1 position for different array scales as a function of wavelength. (a) Surge acceleration; (b) Heave acceleration; (c) Pitch angle; (d) Maximum heave displacement.
Jmse 14 00322 g012
Figure 13. Comparison of motion responses at the T2 position for different array scales as a function of wavelength. (a) Surge acceleration; (b) Heave acceleration; (c) Pitch angle; (d) Maximum heave displacement.
Jmse 14 00322 g013
Figure 14. Comparison of motion responses at the T3 position for different array scales as a function of wavelength. (a) Surge acceleration; (b) Heave acceleration; (c) Pitch angle; (d) Maximum heave displacement.
Jmse 14 00322 g014aJmse 14 00322 g014b
Figure 15. Motion responses at three characteristic measurement points within the 5 × 15 floating box array as a function of wavelength. (a) Surge acceleration; (b) Heave acceleration; (c) Pitch angle; (d) Maximum heave displacement.
Jmse 14 00322 g015
Figure 16. Motion responses at three characteristic measurement points within the 5 × 20 floating box array as a function of wavelength. (a) Surge acceleration; (b) Heave acceleration; (c) Pitch angle; (d) Maximum heave displacement.
Jmse 14 00322 g016aJmse 14 00322 g016b
Figure 17. Variation in surge acceleration response with wave period. (a) T1 position; (b) T2 position; (c) T3 position.
Jmse 14 00322 g017
Figure 18. Variation in heave acceleration response with wave period. (a) T1 position; (b) T2 position; (c) T3 position.
Jmse 14 00322 g018
Figure 19. Variation in pitch angle with wave period. (a) T1 position; (b) T2 position; (c) T3 position.
Jmse 14 00322 g019
Figure 20. Variation in maximum heave displacement with wave period. (a) T1 position; (b) T2 position; (c) T3 position.
Jmse 14 00322 g020
Figure 21. Variation in surge acceleration response with wave period. (a) T1 position; (b) T1 position; (c) T1 position.
Jmse 14 00322 g021
Figure 22. Variation in heave acceleration response with wave period. (a) T1 position; (b) T1 position; (c) T1 position.
Jmse 14 00322 g022
Figure 23. Variation in pitch angle with wave period. (a) T1 position; (b) T1 position; (c) T1 position.
Jmse 14 00322 g023
Figure 24. Variation in maximum heave displacement with wave period. (a) T1 position; (b) T1 position; (c) T1 position.
Jmse 14 00322 g024
Table 1. Comparative advantages and disadvantages of different types of offshore floating photovoltaic (FPV) platforms.
Type of Floating StructureAdvantagesDisadvantages
pontoon-type structureLow cost; early development; mature technology; widely appliedMany connectors; poor corrosion resistance; low resistance to wind and waves
high-performance concrete floatLow cost; good corrosion resistancePoor structural stability; limited wave resistance
semi-submersible truss structure platformHigh structural strength; strong wave resistance; protects PV panels from overwash; good corrosion resistanceHigh cost; demanding material and strength requirements
flexible membrane floating structureGood wind resistance due to flexibility; close to sea surface helps cool PV modules; low mooring loadsHigh cost; prone to overwash; drainage and biofouling issues; lower durability and maintainability
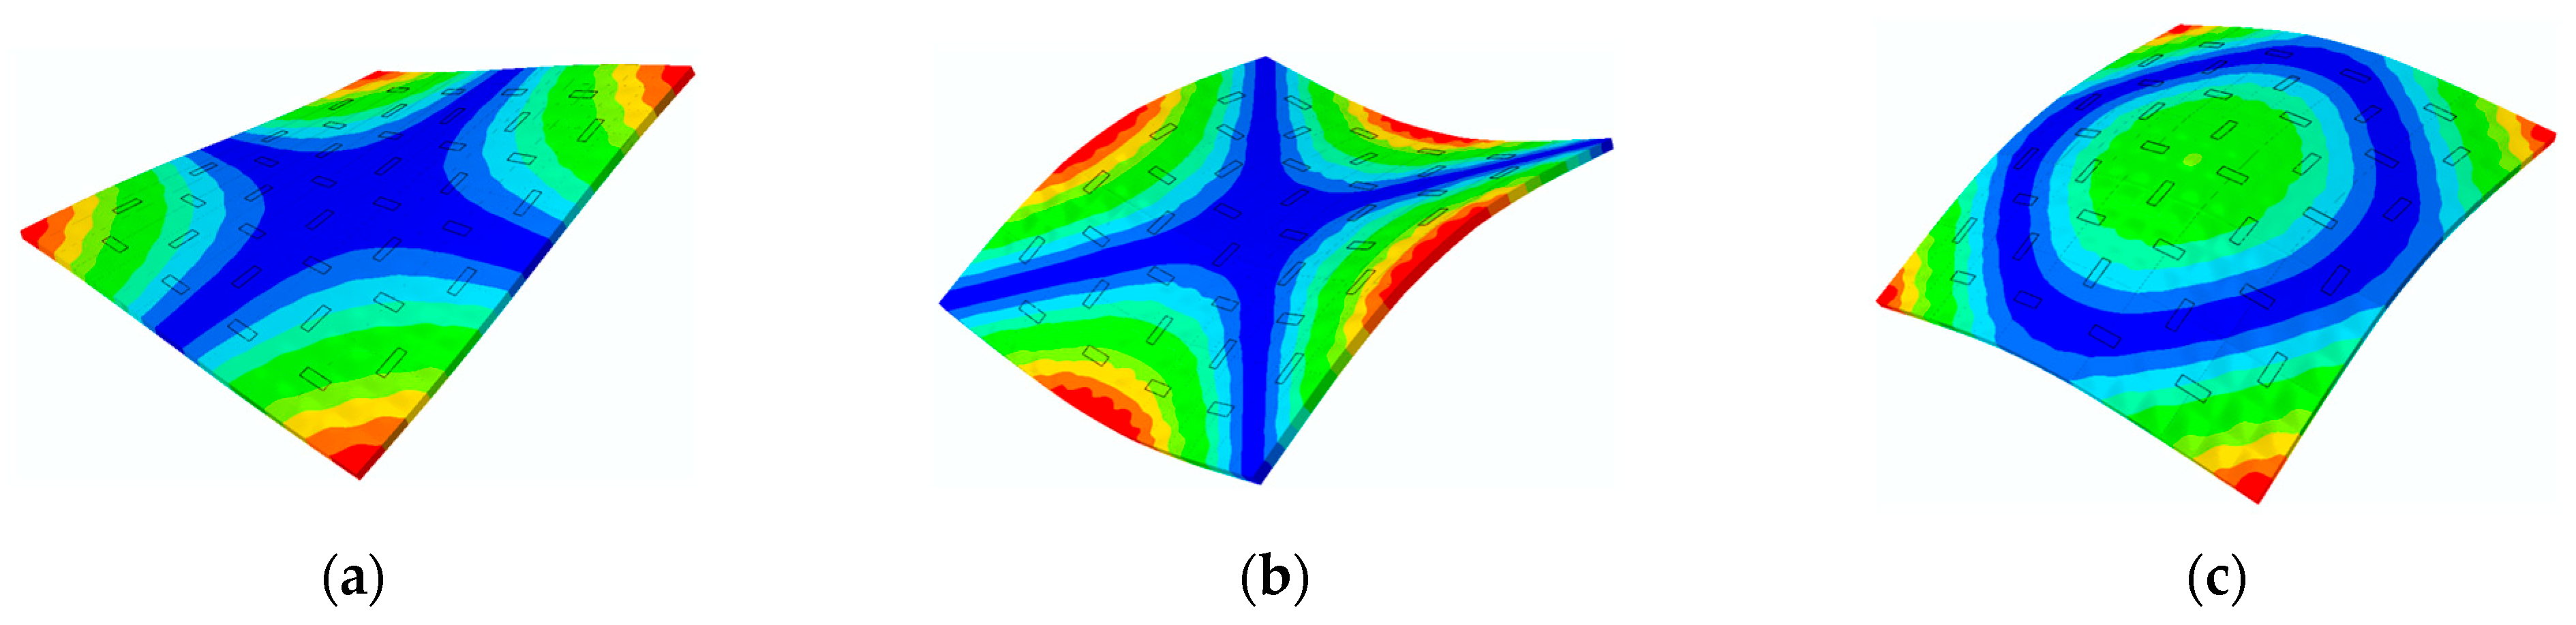
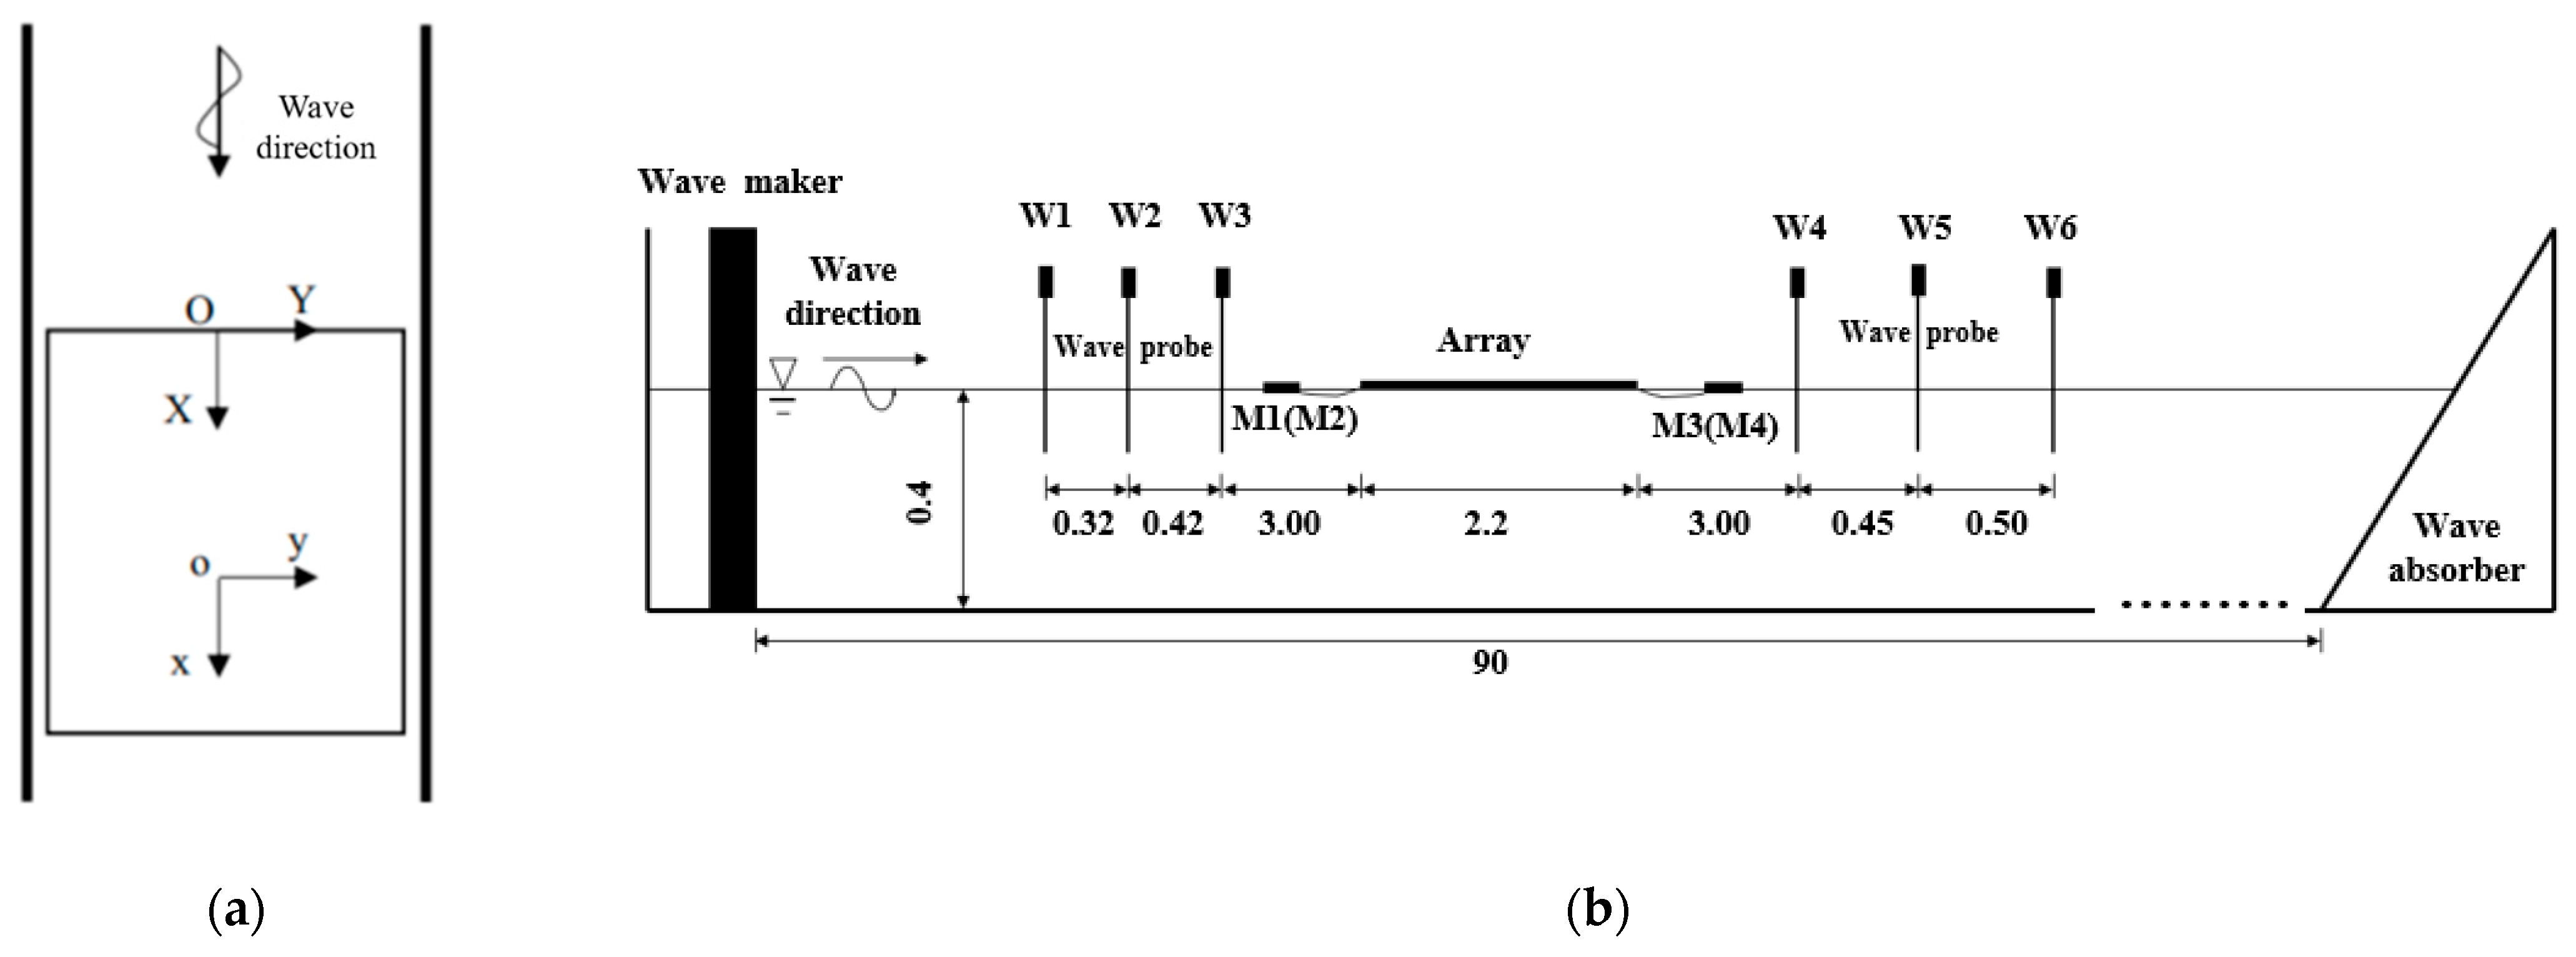
Table 2. Model scaling relationships.
QuantitySymbol RatioScale RelationshipQuantitySymbol RatioScale Relationship
Linear dimensionlp/lmλPeriodTp/Tmλ0.5
Angular dimensionφp/φm1Frequencyfp/fmλ−0.5
Stressσp/σmλMassmp/mmγ*λ3
Accelerationap/am1ForceFp/Fmγλ3
Linear velocityvp/vmλ0.5MomentMp/Mmγλ4
Angular velocityθp/θm1Moment of inertiaIp/Imλ4
Bending stiffnessksp/ksmλ5Compressive stiffnesskcp/kcmλ3
* In the table, γ denotes the fluid density ratio. Unless otherwise specified, the seawater-to-freshwater density ratio is taken as γ = 1.025.
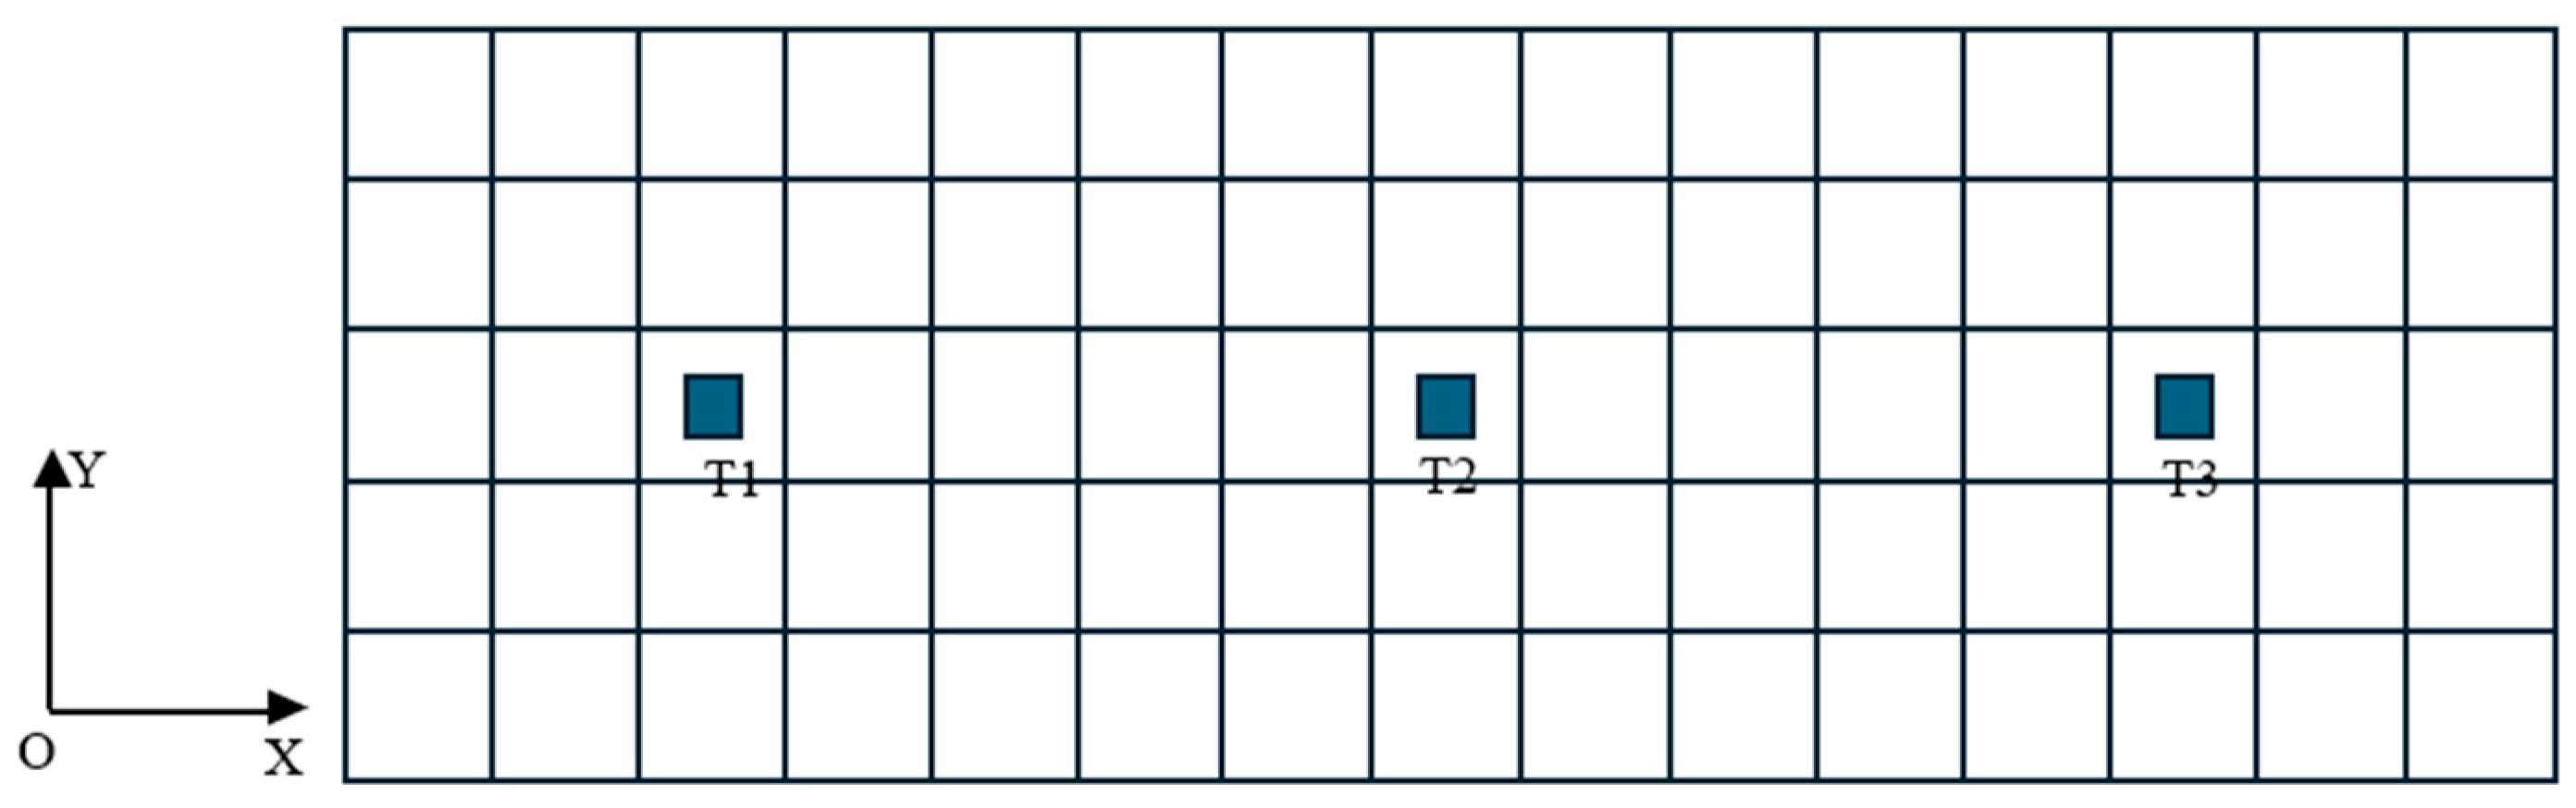
Table 3. Prototype Parameters of the FPV Unit.
ParameterValueParameterValue
Box width2700 mmAverage density of floating unit71.69 kg/m3
Box length2800 mmDraft21.51 mm
Box height300 mmFlexural rigidity of lug894.10 N·m2
Total box and component weight162.60 kgBox flexural rigidity2.77 × 106 N·m2
Weight of a single PV module70.60 kgMooring cable length11.5 m
Table 4. Floating box model parameters.
ParameterValueParameterValue
Box width193 mmDraft1.54 mm
Box length200 mmFlexural rigidity5.15 N·m2
Box height21.4 mmAverage density71.69 kg/m3
Box unit weight59.3 g
Table 5. Wave conditions used in the hydrodynamic tests of the novel floating box array.
No.Target Wave Height (cm)Measured Wave Height (cm)Target Period (s)Measured Period (s)
143.960.70.701
244.150.780.782
343.910.850.852
443.830.930.930
544.201.01.000
644.151.11.100
744.191.21.200
844.021.61.604
944.032.01.998
Disclaimer/Publisher’s Note: The statements, opinions and data contained in all publications are solely those of the individual author(s) and contributor(s) and not of MDPI and/or the editor(s). MDPI and/or the editor(s) disclaim responsibility for any injury to people or property resulting from any ideas, methods, instructions or products referred to in the content.