Article

Spatiotemporal Characteristics of Offshore Wind Energy Availability in the China Seas and Adjacent Waters over the Past Several Decades


1
Dalian Naval Academy, Dalian 116018, China
2
Mechanical and Electrical Engineering, Beijing University of Chemical Technology, Beijing 100029, China
3
Preparation Office of Zhangzhou Base of National Marine Technology Center, Xiamen 361007, China
4
College of Mathematics and Statistics, Sichuan University of Science & Engineering, Yibin 644000, China
*
Authors to whom correspondence should be addressed.
These authors contributed equally to this work.
J. Mar. Sci. Eng. 2026, 14(3), 320; https://doi.org/10.3390/jmse14030320
Submission received: 1 December 2025 / Revised: 30 January 2026 / Accepted: 2 February 2026 / Published: 6 February 2026
(This article belongs to the Special Issue Marine Renewable Energy and Environment Evaluation)

Abstract

Current wind energy planning in the China Seas and adjacent waters generally focuses on wind speed or wind power density (WPD), yet lacks sufficient understanding of the long-term climatic evolution patterns and climatic driving mechanisms of effective wind speed occurrence (EWSO) and its correlation with climate oscillations. Based on the ERA5 10 m sea surface wind reanalysis data from the European Centre for Medium-Range Weather Forecasts (ECMWF) and multiple key climate index datasets from 1941 to 2020, this study systematically analyzed spatiotemporal distribution characteristics, long-term variation trends, and correlations with climate oscillations of EWSO in the China Seas and adjacent waters. The results indicated the following: (1) There are discrepancies between the distribution of EWSO and mean wind speed. (2) Over the past 80 years, EWSO across the study area has shown an overall significant increasing trend with pronounced regional disparities, among which the Yellow–Bohai Sea area has exhibited a significant decreasing trend. (3) The interannual variability of EWSO is regulated by climate oscillations such as ENSO. This study demonstrates that incorporating EWSO as an independent indicator separate from wind speed into the wind energy resource assessment system is crucial for identifying offshore wind power generation risks and more accurately evaluating the actual operational duration of wind farms in China’s offshore waters and adjacent sea areas. The correlation between EWSO and climate oscillations such as ENSO provides an important scientific basis for improving seasonal prediction models of wind energy resources.

1. Introduction

Currently, the global supply of traditional fossil energy is under severe strain, endangering the foundations of economic stability and social functioning [1]. Against this backdrop, offshore wind power, with its advantages of abundant reserves [2,3], high power generation efficiency [4,5] and zero carbon emissions [6,7], has emerged as one of the pivotal solutions for safeguarding energy security and advancing green transition [8]. The global offshore wind power industry is experiencing robust growth [8]. China’s cumulative installed offshore wind power capacity has reached 41.8 GW, accounting for 50% of the global total [9]. Such large-scale, rapid-paced development has imposed higher standards for the accurate assessment of wind energy potential in China’s offshore waters and adjacent sea areas [10].
However, current mainstream assessment methodologies rely primarily on mean wind speed or wind power density (WPD) [11], which are deficient in characterizing wind energy availability, thus failing to meet the exigencies of refined development and scientific planning. High-quality offshore wind energy assessment is a critical prerequisite for the development of the offshore wind energy industry [12]. Existing studies have made significant progress in revealing the spatiotemporal distribution characteristics of wind energy, but most focus on energy intensity indicators such as mean wind speed or WPD [13,14,15]. In relevant studies, reanalysis data have been proven to exhibit excellent performance in WPD assessments at global or regional scales [16,17,18]. Notably, although the evaluation system constructed by Zheng et al. [19] incorporated EWSO reflecting wind energy availability and affirmed its significant advantages in identifying wind energy availability in low-latitude regions, the long-term climatic evolution patterns and driving mechanisms of this indicator in China’s offshore waters and adjacent sea areas have not been fully investigated. The long-term volatility and climatic risks of wind energy resources have also emerged as core focus areas of current research [15,17,20]. Trend analysis based on long-term time-series data constitutes a pivotal method for assessing the fluctuation characteristics of wind energy resources [21,22,23]. Existing studies have confirmed that large-scale climate oscillations such as ENSO are key driving factors modulating the interannual variability of marine renewable energy, including wind energy and wave energy [21,22,23]. However, most of these studies have either focused on the impacts of climate oscillations on WPD or mean wind speed [24,25] or on the response patterns of other forms of marine energy, such as wave energy [26]. The response mechanism of EWSO to climate oscillations such as ENSO remains unclear. This issue holds critical guiding significance for the planning and design of next-generation offshore wind power technologies [27,28]. These technologies are more sensitive to resource fluctuations, including floating offshore wind farms [29,30,31,32]. China’s offshore waters and adjacent sea areas are jointly influenced by multiple climate modes, including ENSO [33,34,35], the Atlantic multidecadal oscillation (AMO) [36], the Pacific decadal oscillation (PDO) [37,38], and the South Asian monsoon (SAM) [39,40,41]. At present, research on the climatic-scale evolution patterns of EWSO in this sea area remains a research gap.
To address the aforementioned research gaps, this study conducts the first systematic investigation of the effective wind speed occurrence (EWSO) in the China Seas and adjacent waters from a climatic perspective, based on 80-year high-resolution reanalysis data. It aims to (1) reveal the spatiotemporal evolution characteristics of EWSO across multiple time scales (monthly, seasonal, and annual); (2) quantify its long-term trends and regional disparities; and (3) determine the correlations between EWSO and major climate indices (e.g., NINO3, SOI, AMO, PDO and SAMI). The findings are expected to enhance the predictability of variations in wind energy availability linked to climatic oscillations.
The remaining manuscript is structured as follows: Section 2 describes the data and methodologies adopted in the study; Section 3 uncovers the spatiotemporal distribution characteristics of EWSO; Section 4 quantifies the long-term variation trends and regional disparities of EWSO; Section 5 analyzes the correlations between EWSO and major climate indices and explores the underlying physical mechanisms. Finally, the main conclusions of the study are summarized, and their scientific and application values are discussed.

2. Materials and Methods

2.1. Data

The ERA5 hourly data for single levels from 1940 to the present constitute a high-resolution reanalysis product released by the ECMWF. These datasets provide hourly atmospheric reanalysis data (0.25° × 0.25°). ERA5 improves data assimilation models and integrates global multi-source observational data for four-dimensional variational (4DVar) assimilation. ERA5 data has been successfully applied to wind energy resource assessment by numerous research teams worldwide. Soares et al. [42] used it to establish the latest benchmark for WPD in global exclusive economic zones. Hayes et al. [43] developed a power generation model for European offshore wind farms based on ERA5 data, increasing the prediction accuracy by 16%. In regions with scarce observational data, such as the Colombian Caribbean Sea, ERA5 has also proven to be a reliable data source for conducting high-quality wind energy potential assessments [44]. However, because of the constraints of horizontal resolution and land–sea boundary effects, the absolute accuracy of ERA5 near complex coastlines may be lower than that in open ocean areas [45,46]. This does not compromise its capability to characterize large-scale spatial distribution patterns and long-term relative variation trends, which constitute the core focus of this study.
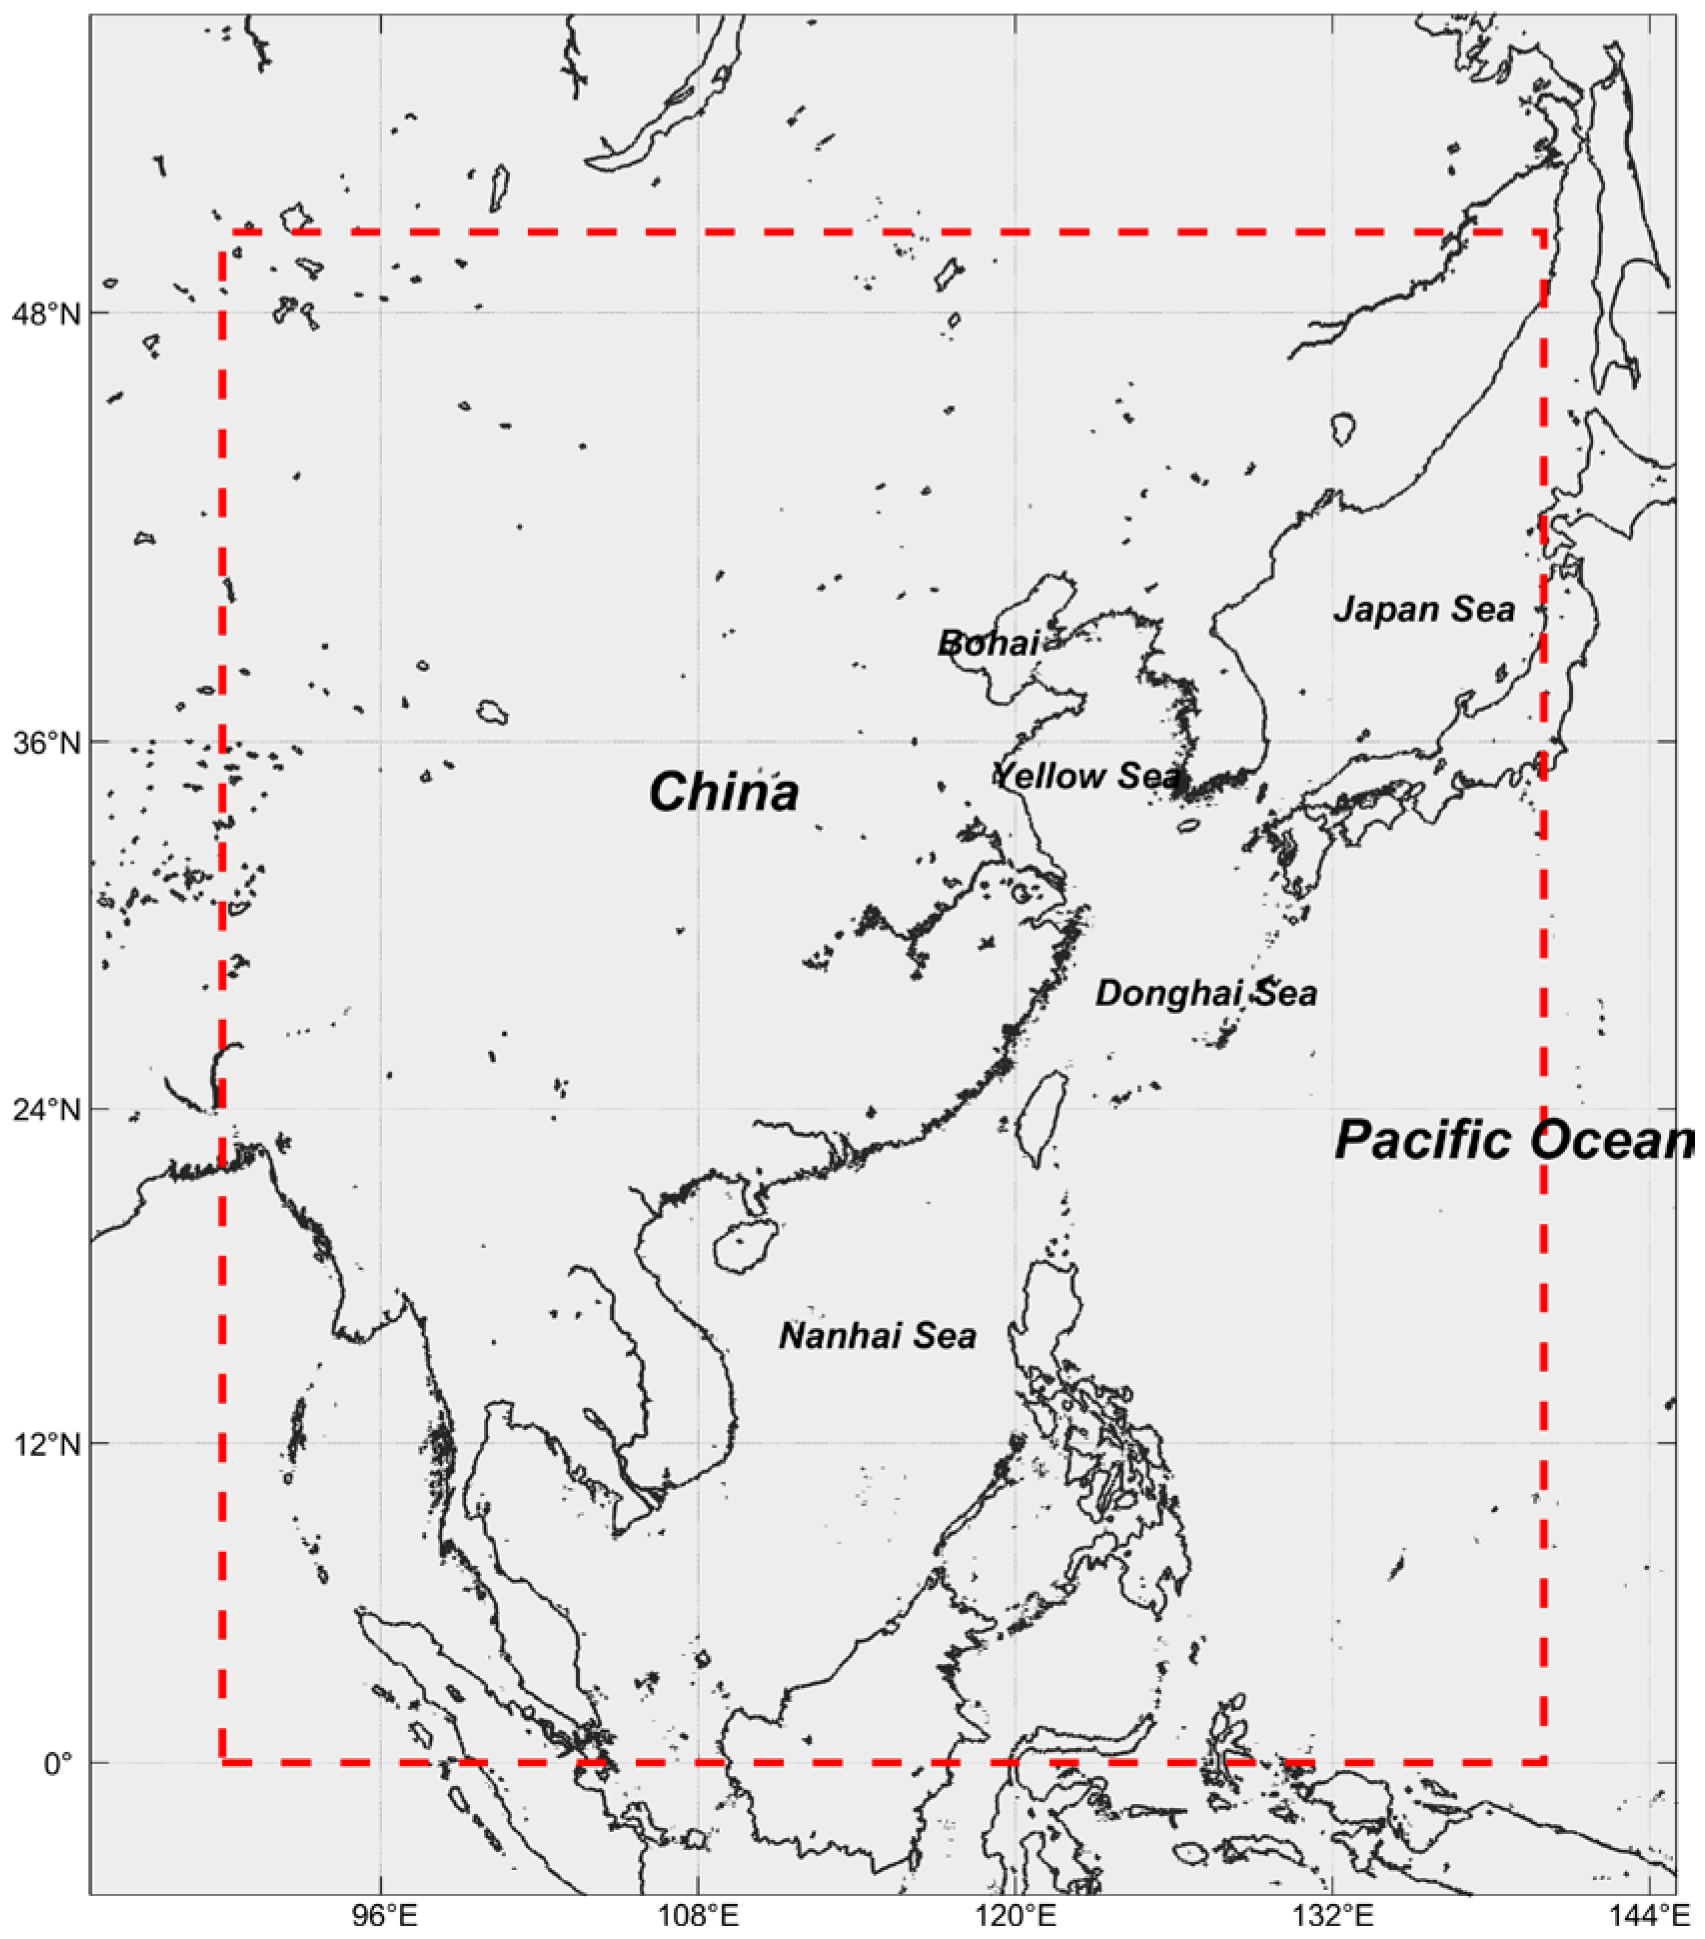
In this study, the ERA5 10 m u-component wind and v-component wind were used, with units of m/s. Specifically, 10 m wind serves as the internationally accepted benchmark for wind energy resource assessment and is commonly used as an input parameter for large-scale wind energy trend and climatological analyses [47]. In regional wind energy assessments, the adoption of uniform 10 m height wind data ensures a basis for spatiotemporally consistent comparison of analysis results, enabling effective revelation of climatological patterns of wind energy resources. For practical engineering design and the micro-siting of wind farms, corrections should be made using standard vertical extrapolation methods for boundary layer wind speed in accordance with the specific hub height of wind turbines [48,49]. Data spanning from 1 January 1941 to 31 December 2020 were used in this study, with a six-hourly temporal resolution (00:00, 06:00, 12:00, and 18:00 each day). The spatial range was 0–50° N and 90° E–140° E, with a spatial resolution of 0.25° × 0.25°. The land–sea masking process was applied to focus on the sea surface wind. Data processing and figure generation were performed using MATLAB (version 2023a). Figure 1 denotes the scope of the China Seas and adjacent waters investigated.

2.2. Methodology

In wind energy exploitation, the 10 m wind speed of 5–25 m/s, which is conducive to wind energy harvesting and conversion, is defined as the effective wind speed [16,19,50]. Therefore, in this study, the spatiotemporal characteristics and variation trends of EWSO in the China Seas and the adjacent waters were comprehensively analyzed.
Firstly, based on the ERA5 wind data and the EWSO method, six-hourly wind speed data at each 0.25° × 0.25° grid point from January 1941 to December 2020 were derived. The vector averaging method was used to calculate the wind speed. Specifically, the wind vector is expressed as U = ( u , v ) , where u denotes the 10 m u-component wind and v denotes the 10 m v-component wind. The mean values of u and v are calculated as
u = 1 n × i = 1 n u i , v = 1 n × i = 1 n v i
The resultant wind speed is synthesized as v e l ¯ = u ¯ 2 + v ¯ 2 , where v e l ¯ represents the mean surface wind speed. By preserving all of the vector information in the samples, the vector averaging method not only eliminates any statistical biases caused by excluding zero wind speed but also avoids any calculation errors associated with 0° wind directions when directly using arithmetic averaging.
EWSO is calculated as
E W S O = t 1 T × 100 %
with units of %. In the expression, t 1 denotes the frequency of the wind speeds ranging from 5 m/s to 25 m/s, and T denotes the total frequency of all wind speeds. Based on this, the annual and monthly averages of the wind speed and EWSO for each 0.25° × 0.25° grid point were calculated.
Secondly, based on the yearly and monthly EWSO time series { Y t }   ( t = 1,2 , , T ) ( T denotes the corresponding time index) of each 0.25° × 0.25° grid point, the ordinary least squares (OLS) method was applied to fit the linear trend model:
Y t = β 0 + β 1 × t + ϵ t
where β 0 is the intercept, β 1 is the slope (the growth rate of EWSO), and ϵ t is the residual. The estimation formulas for the growth rate β 1 is given as follows:
β ^ 1 = t = 1 T ( t t ¯ ) ( Y t Y ¯ ) t = 1 T ( t t ¯ ) 2
t ˉ and Y ˉ are the sample means of the time index and EWSO. To test the statistical significance of the trend, the F statistic is calculated as follows:
F = M S R M S E = t = 1 T ( Y ^ t Y ¯ ) 2 / 1 t = 1 T ( Y t Y ^ t ) 2 / ( T 2 )
M S R refers to the mean square of regression, M S E refers to the mean square of error, and Y ^ t denotes the model-predicted value. The significance of the trend is judged by the p-value of the F statistic. This study uses p < 0.05 as the threshold for statistical significance. The p-value is calculated with a calculator via the cumulative distribution function of the F-distribution. Based on yearly and monthly time series, this study calculated the growth trend and significance of changes for the overall average across the study area.
Finally, based on the yearly and monthly EWSO time series { Y t } for each 0.25° × 0.25° grid point and the time series { X t } of five climate indices (AMO, NINO3, SOI, PDO, SAMI), the Pearson correlation coefficient r is calculated to quantify their linear correlation as follows:
r = t = 1 T   ( X t X ¯ ) ( Y t Y ¯ ) t = 1 T   ( X t X ¯ ) 2 t = 1 T   ( Y t Y ¯ ) 2
Correlation analyses were conducted between EWSO and each index with a 95% confidence test. This analysis process covered all of the months, the annual scale, and all five indices.

2.3. Climate Index

NINO3, AMO, and PDO data were taken from the climate index data in the ERSST v5 dataset developed by the Physical Sciences Laboratory (PSL) and released by the United States National Centers for Environmental Information (NCEI) of the National Oceanic and Atmospheric Administration (NOAA). The SOI data from the Climate Data Guide of the National Center for Atmospheric Research (NCAR) were also used in this study.
The South Asian Monsoon Index (SAMI) describes South Asian monsoon trends through zonal wind variations in the monsoon region [51]. Webster et al. [52] proposed a method for calculating the SAMI using zonal wind data at 850 hPa and 200 hPa isobaric surfaces in the South Asian monsoon region, with the following formula:
S A M I = U 850 U 200
In the expression, U 850 and U 200 are derived from the spatial averages of the zonal wind data on the 850 hPa and 200 hPa isobaric surfaces, within the spatial domain of 40° E–110° E, 5° N–20° N in the South Asian monsoon region. In this study, the zonal wind data at the 850 hPa and 200 hPa isobaric surfaces from the ERA5 dataset (1 January 1941 to 31 December 2020) were used to calculate the SAMI.

3. Spatiotemporal Characteristics of Wind Speed and EWSO in the China Seas and Adjacent Waters

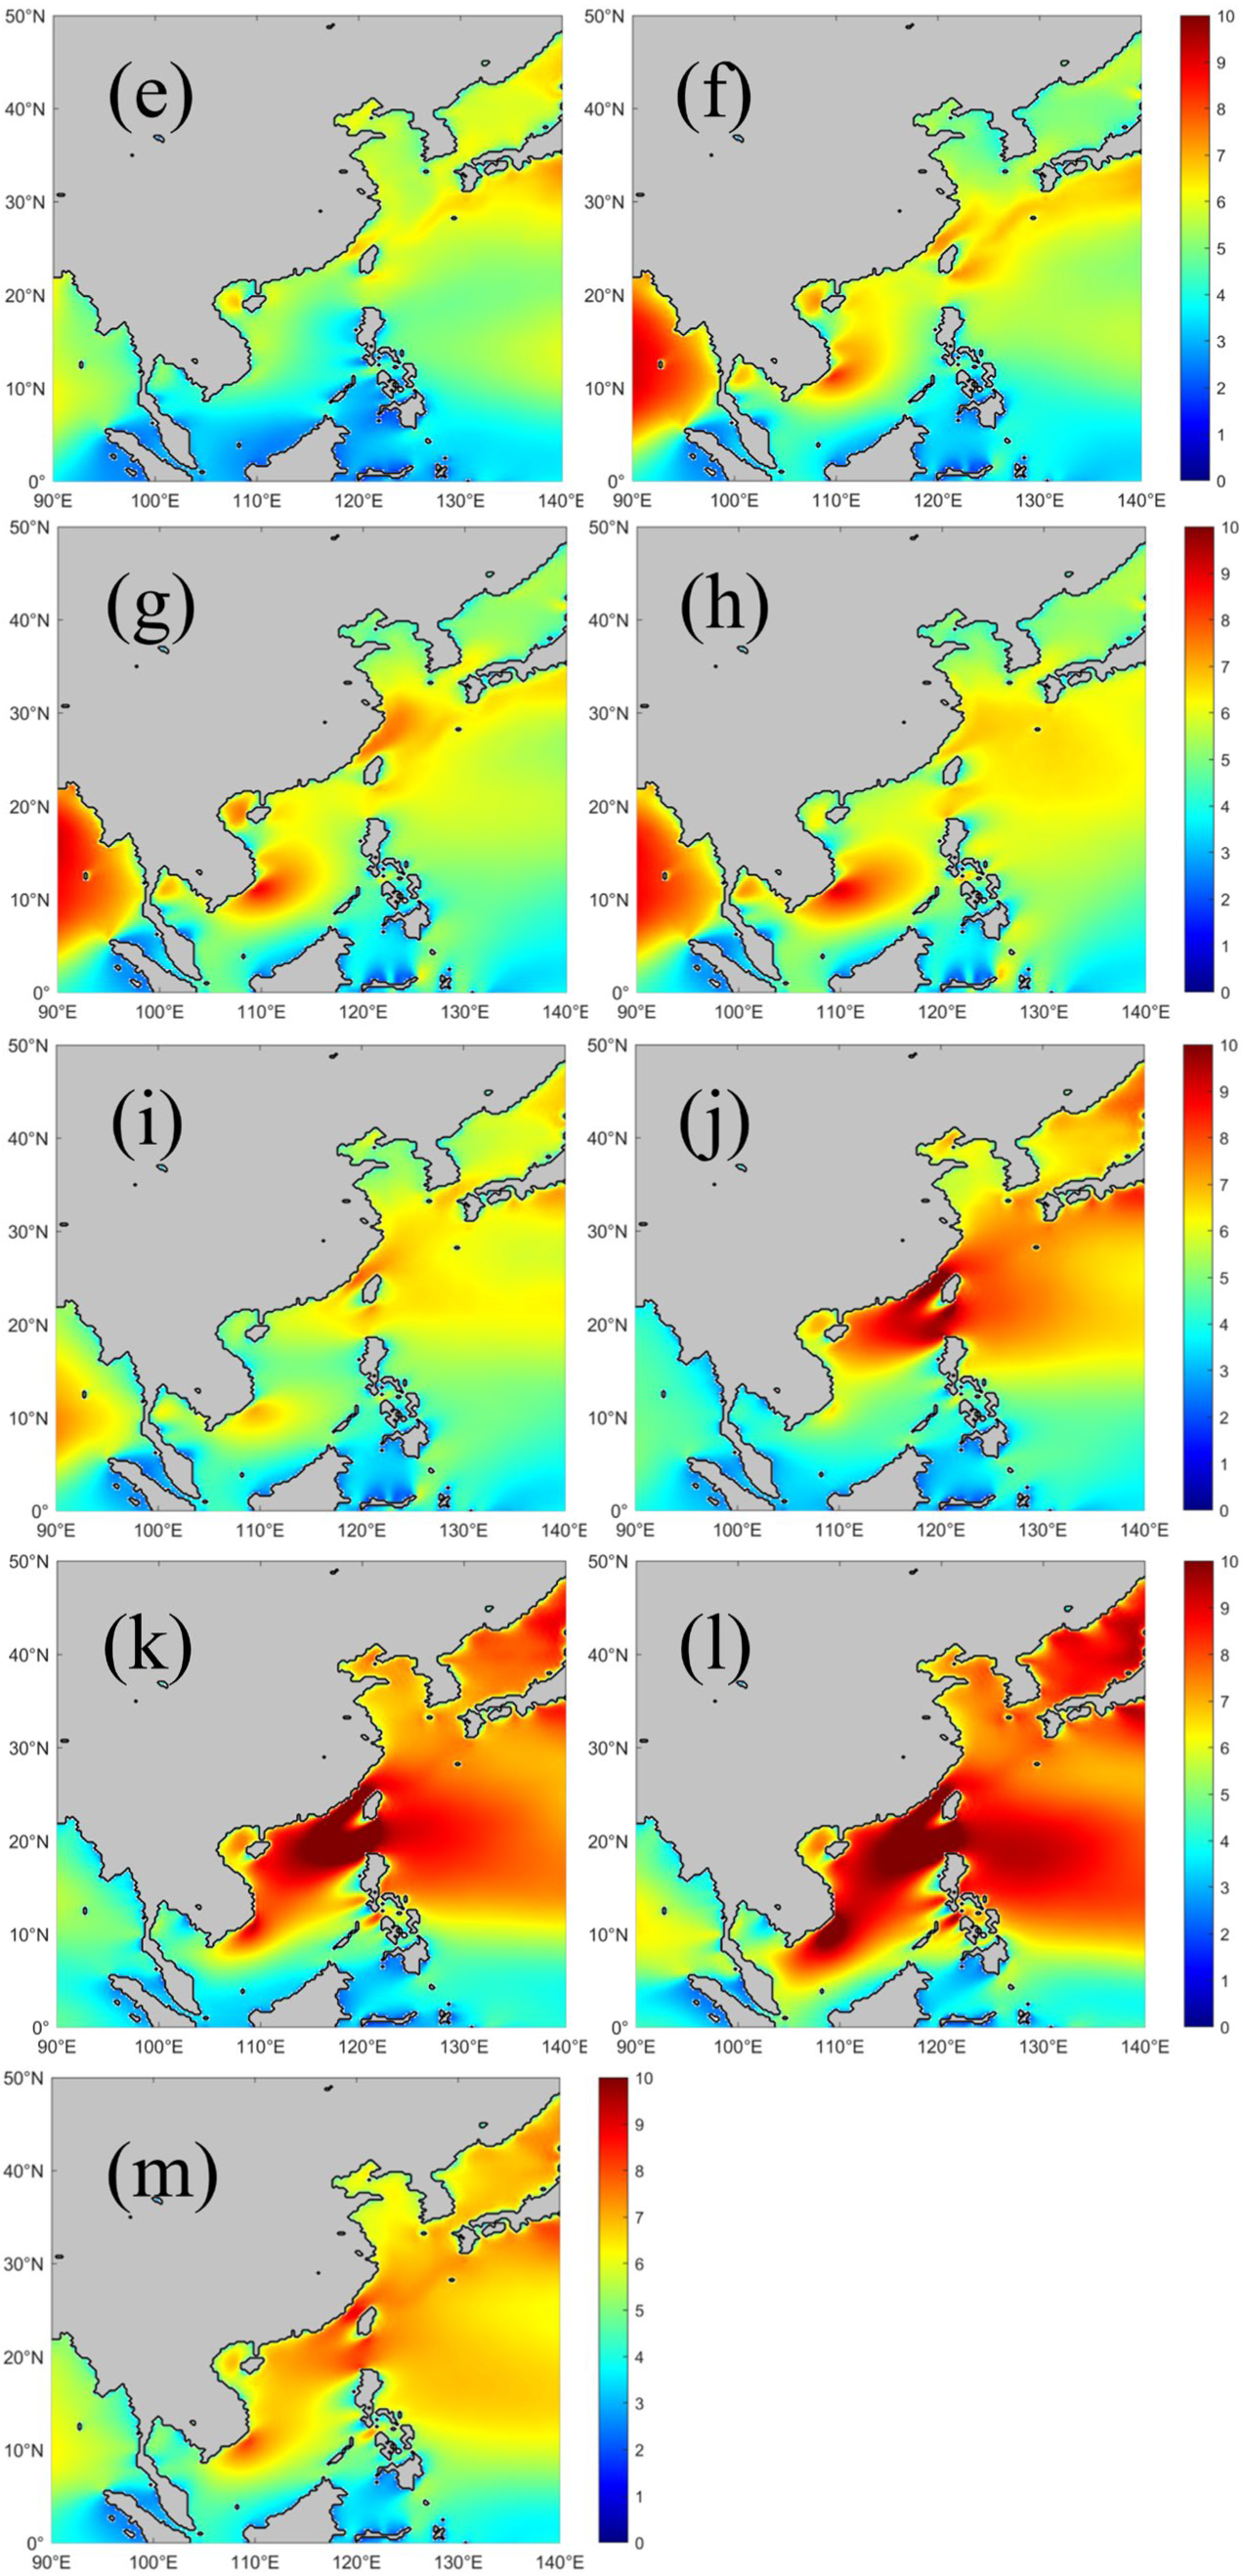
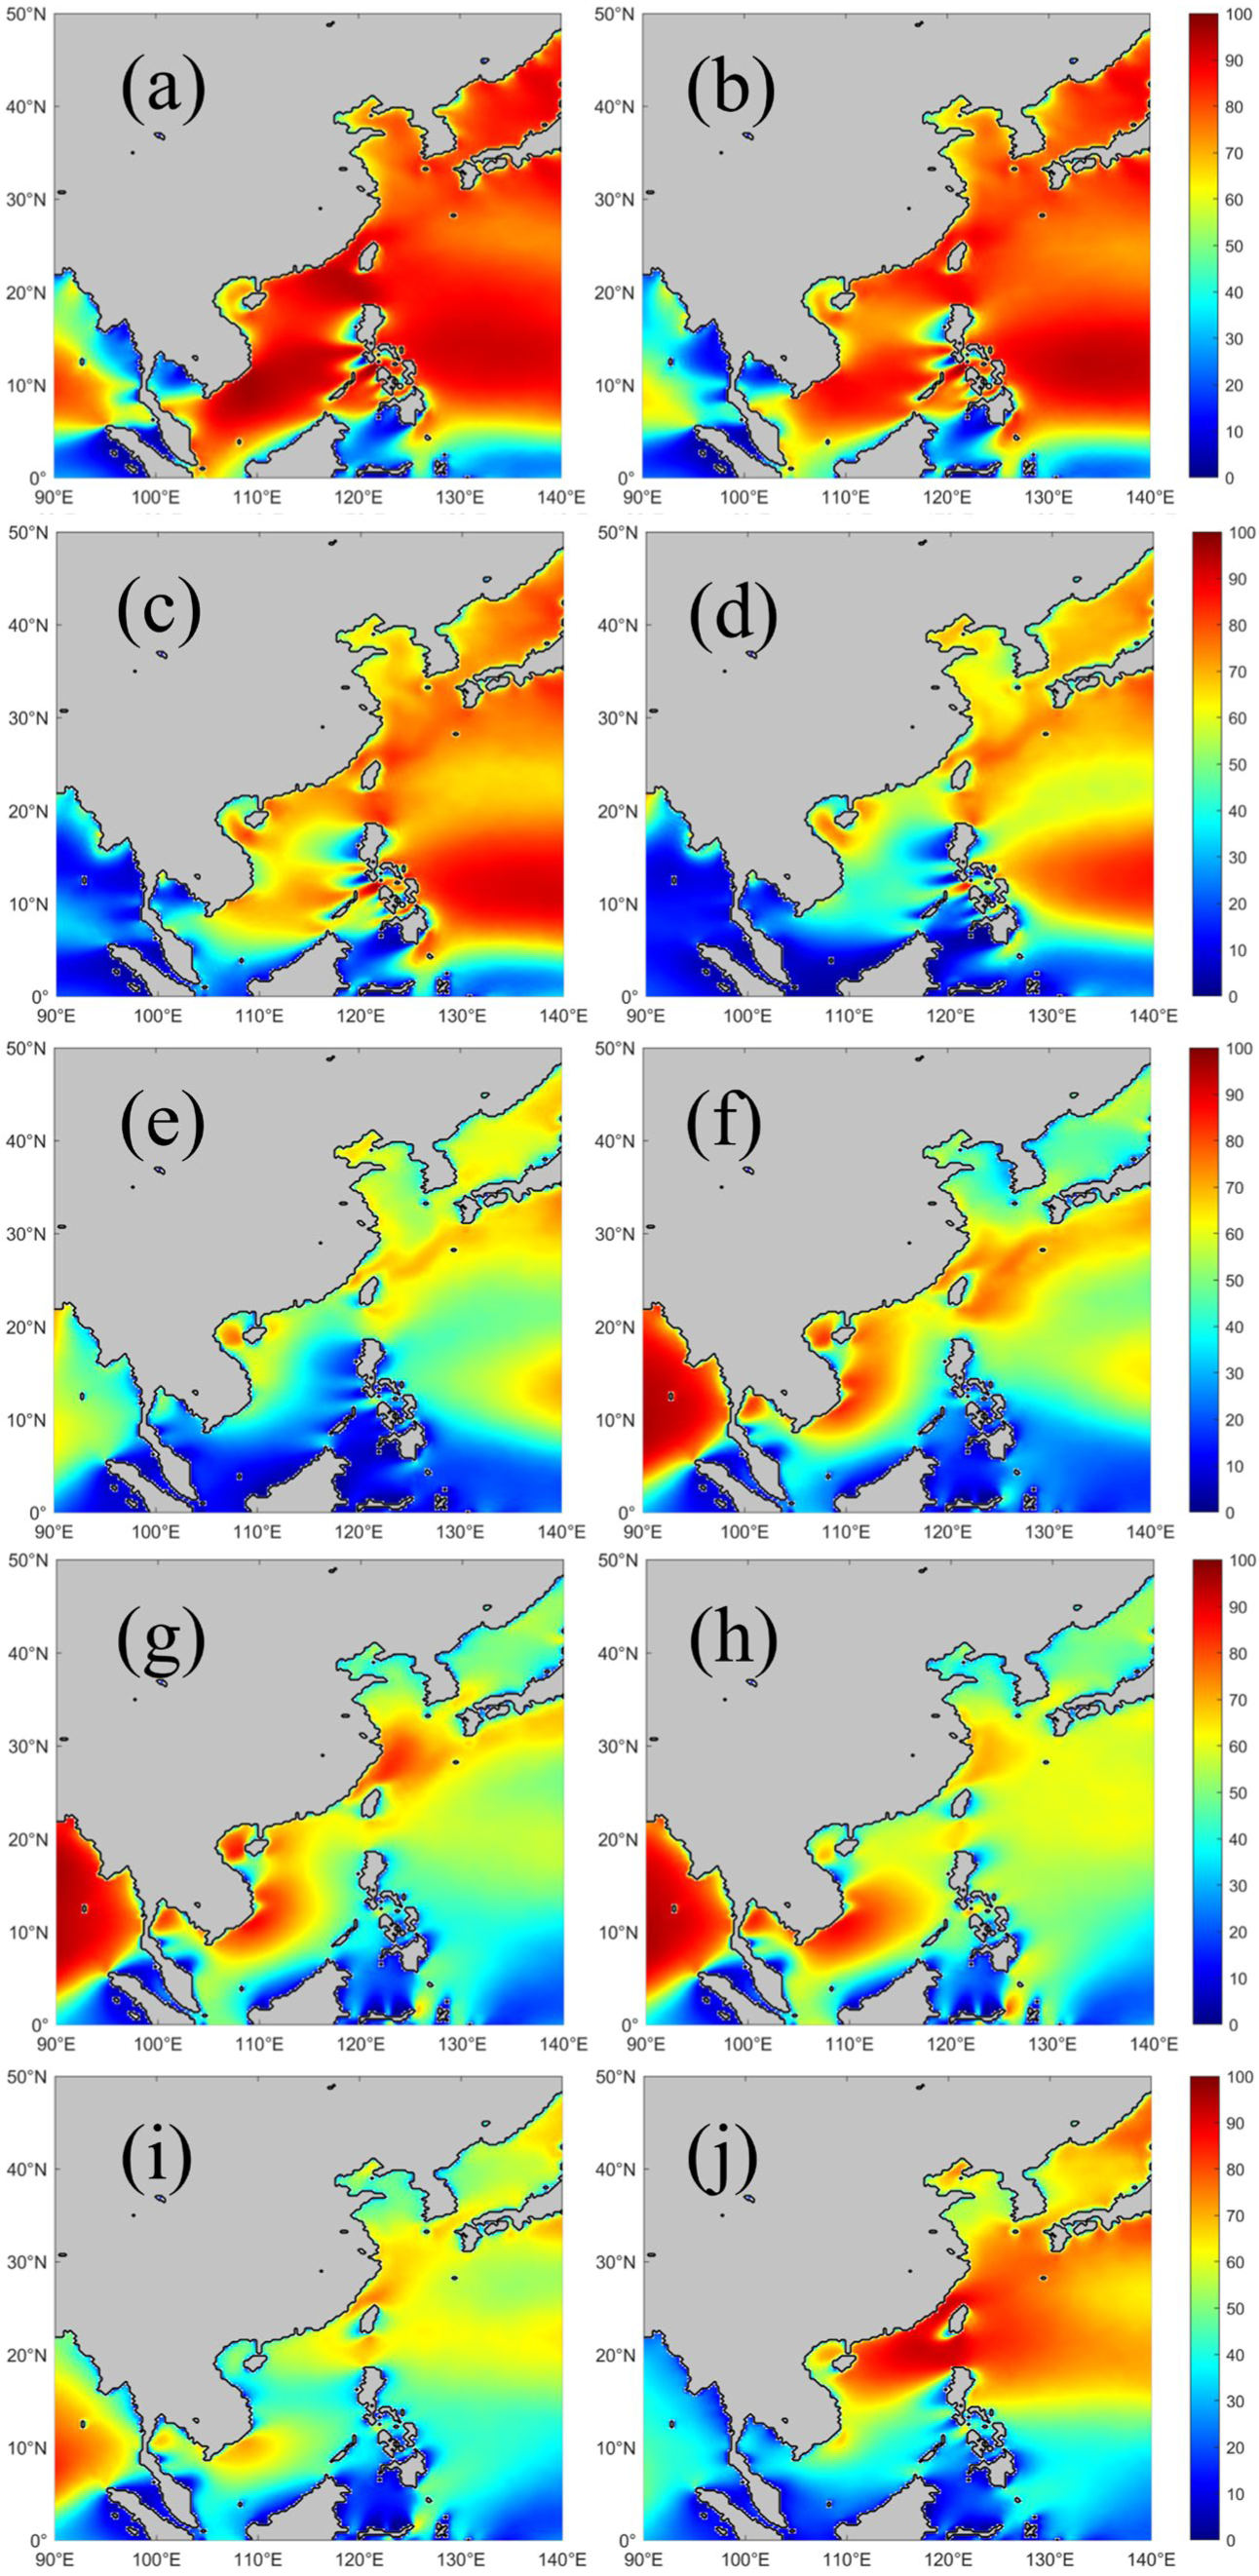
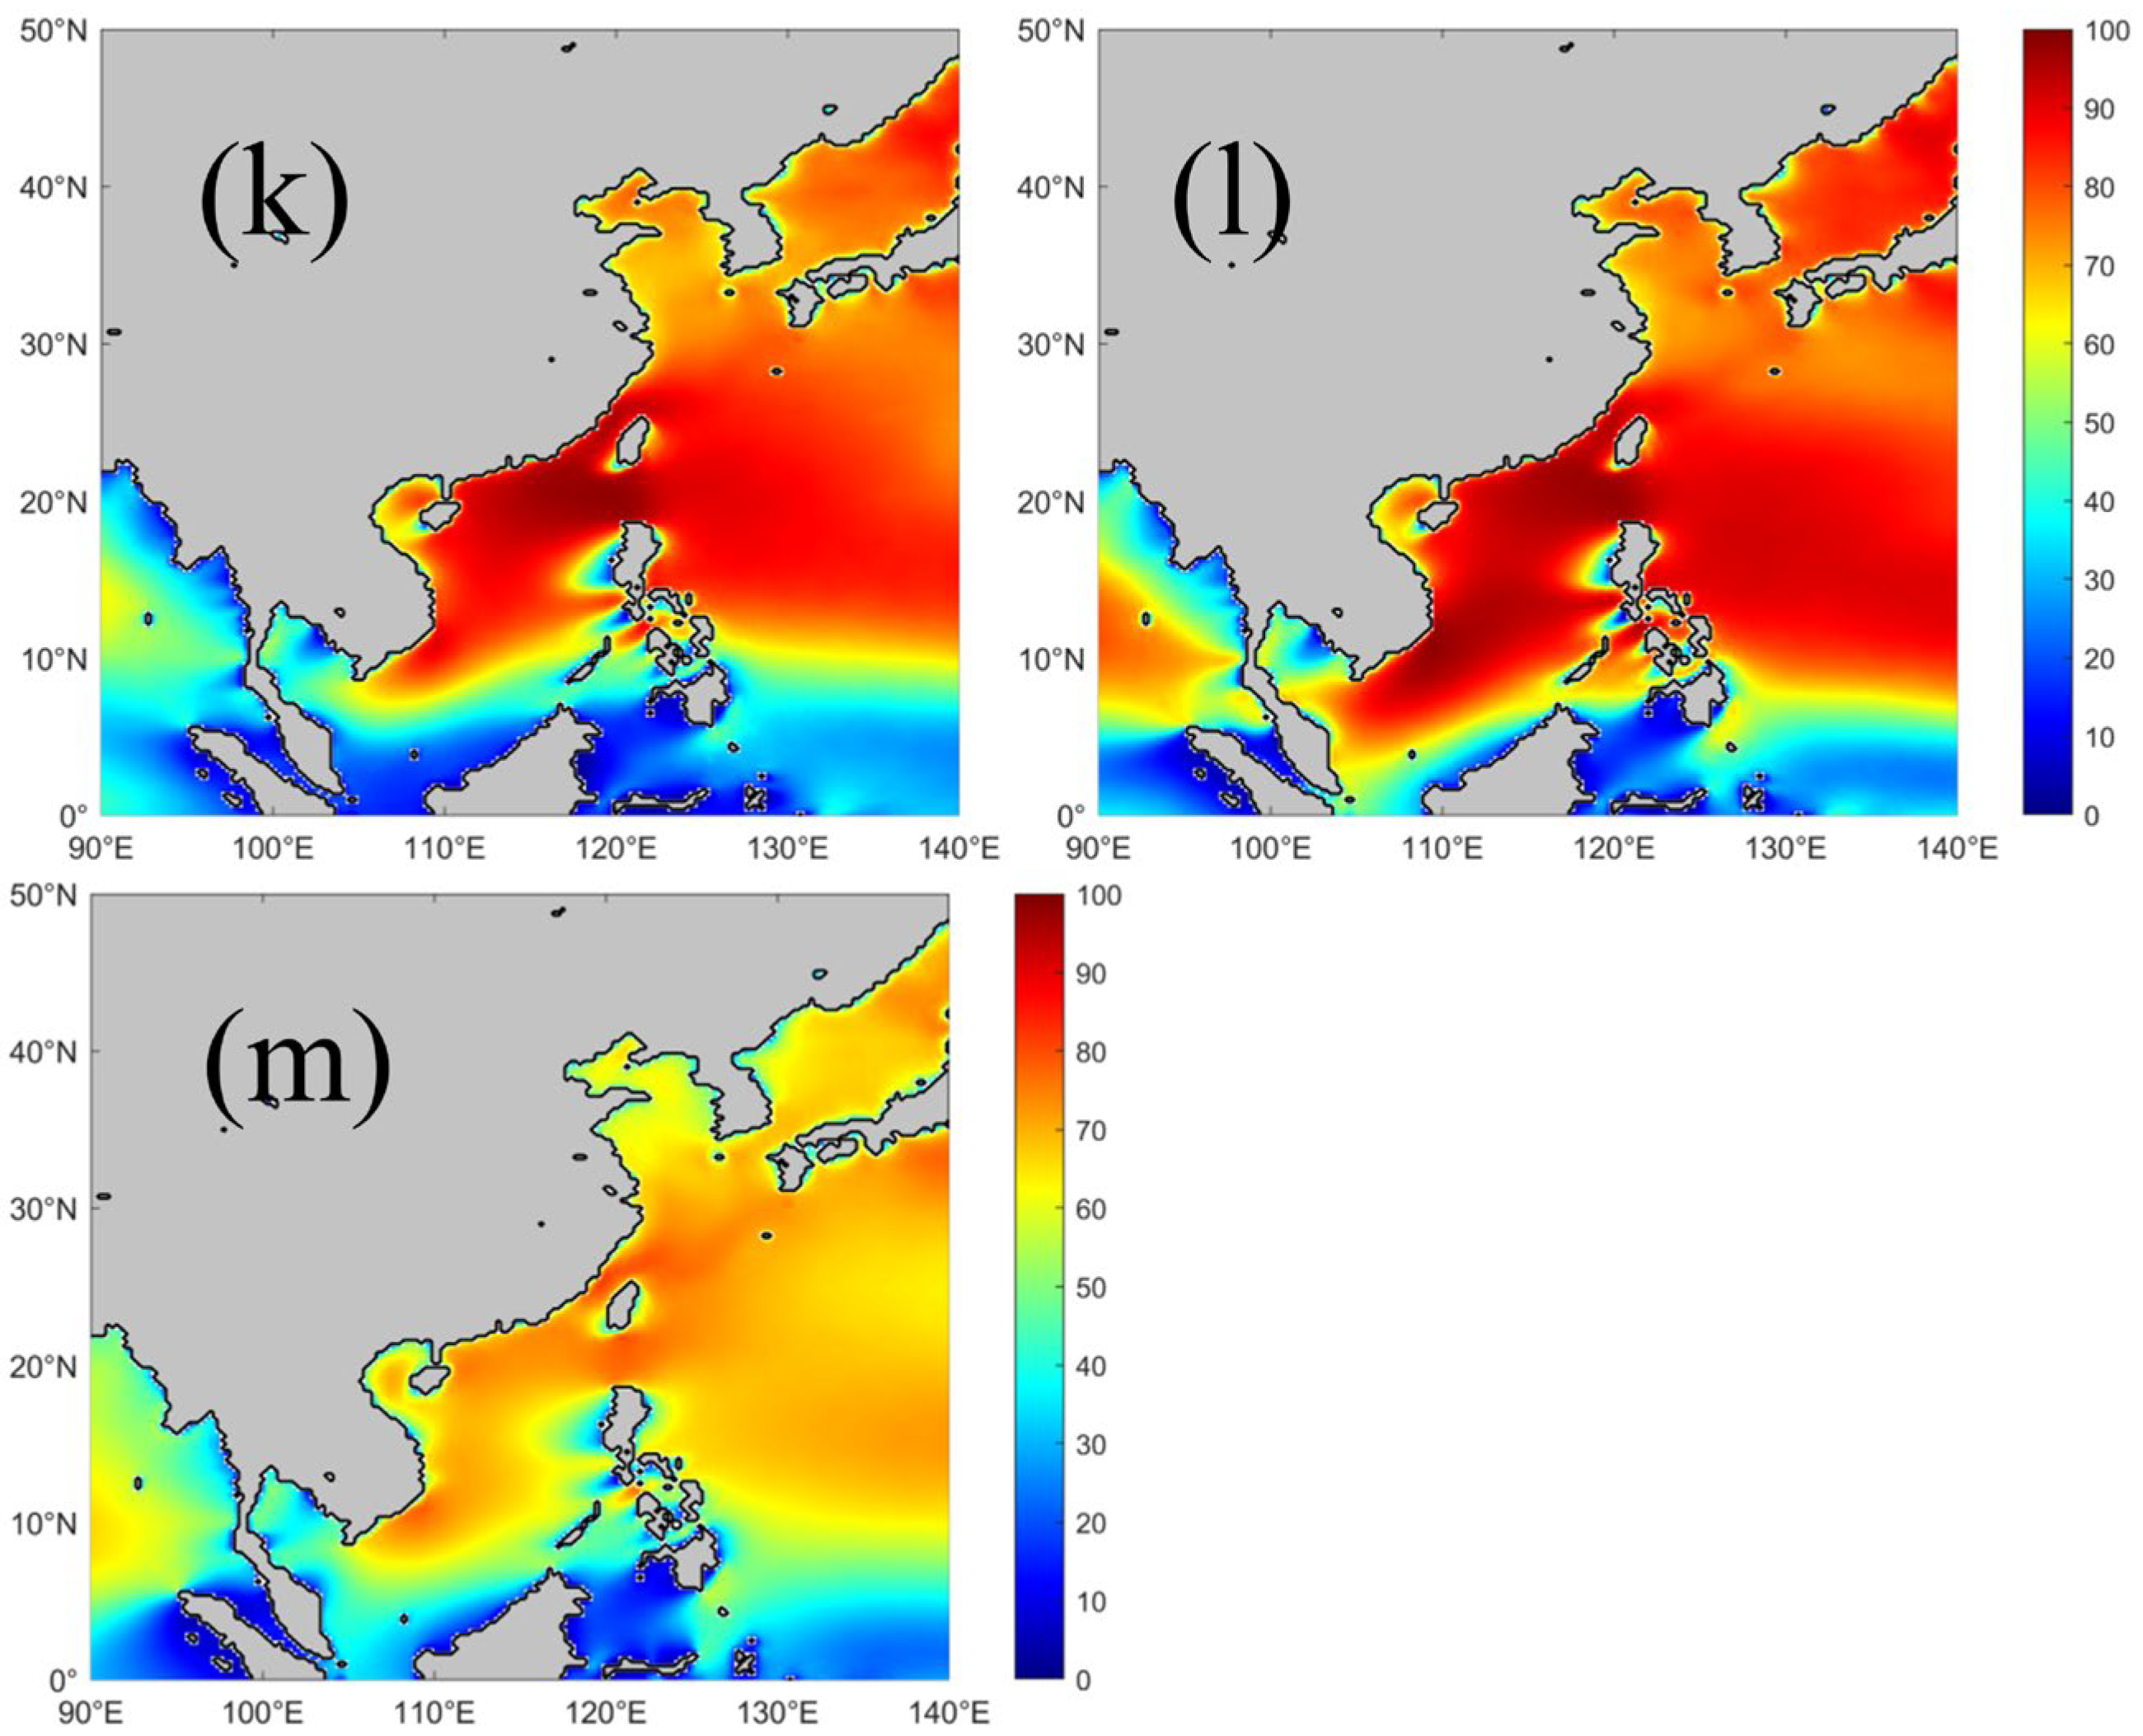
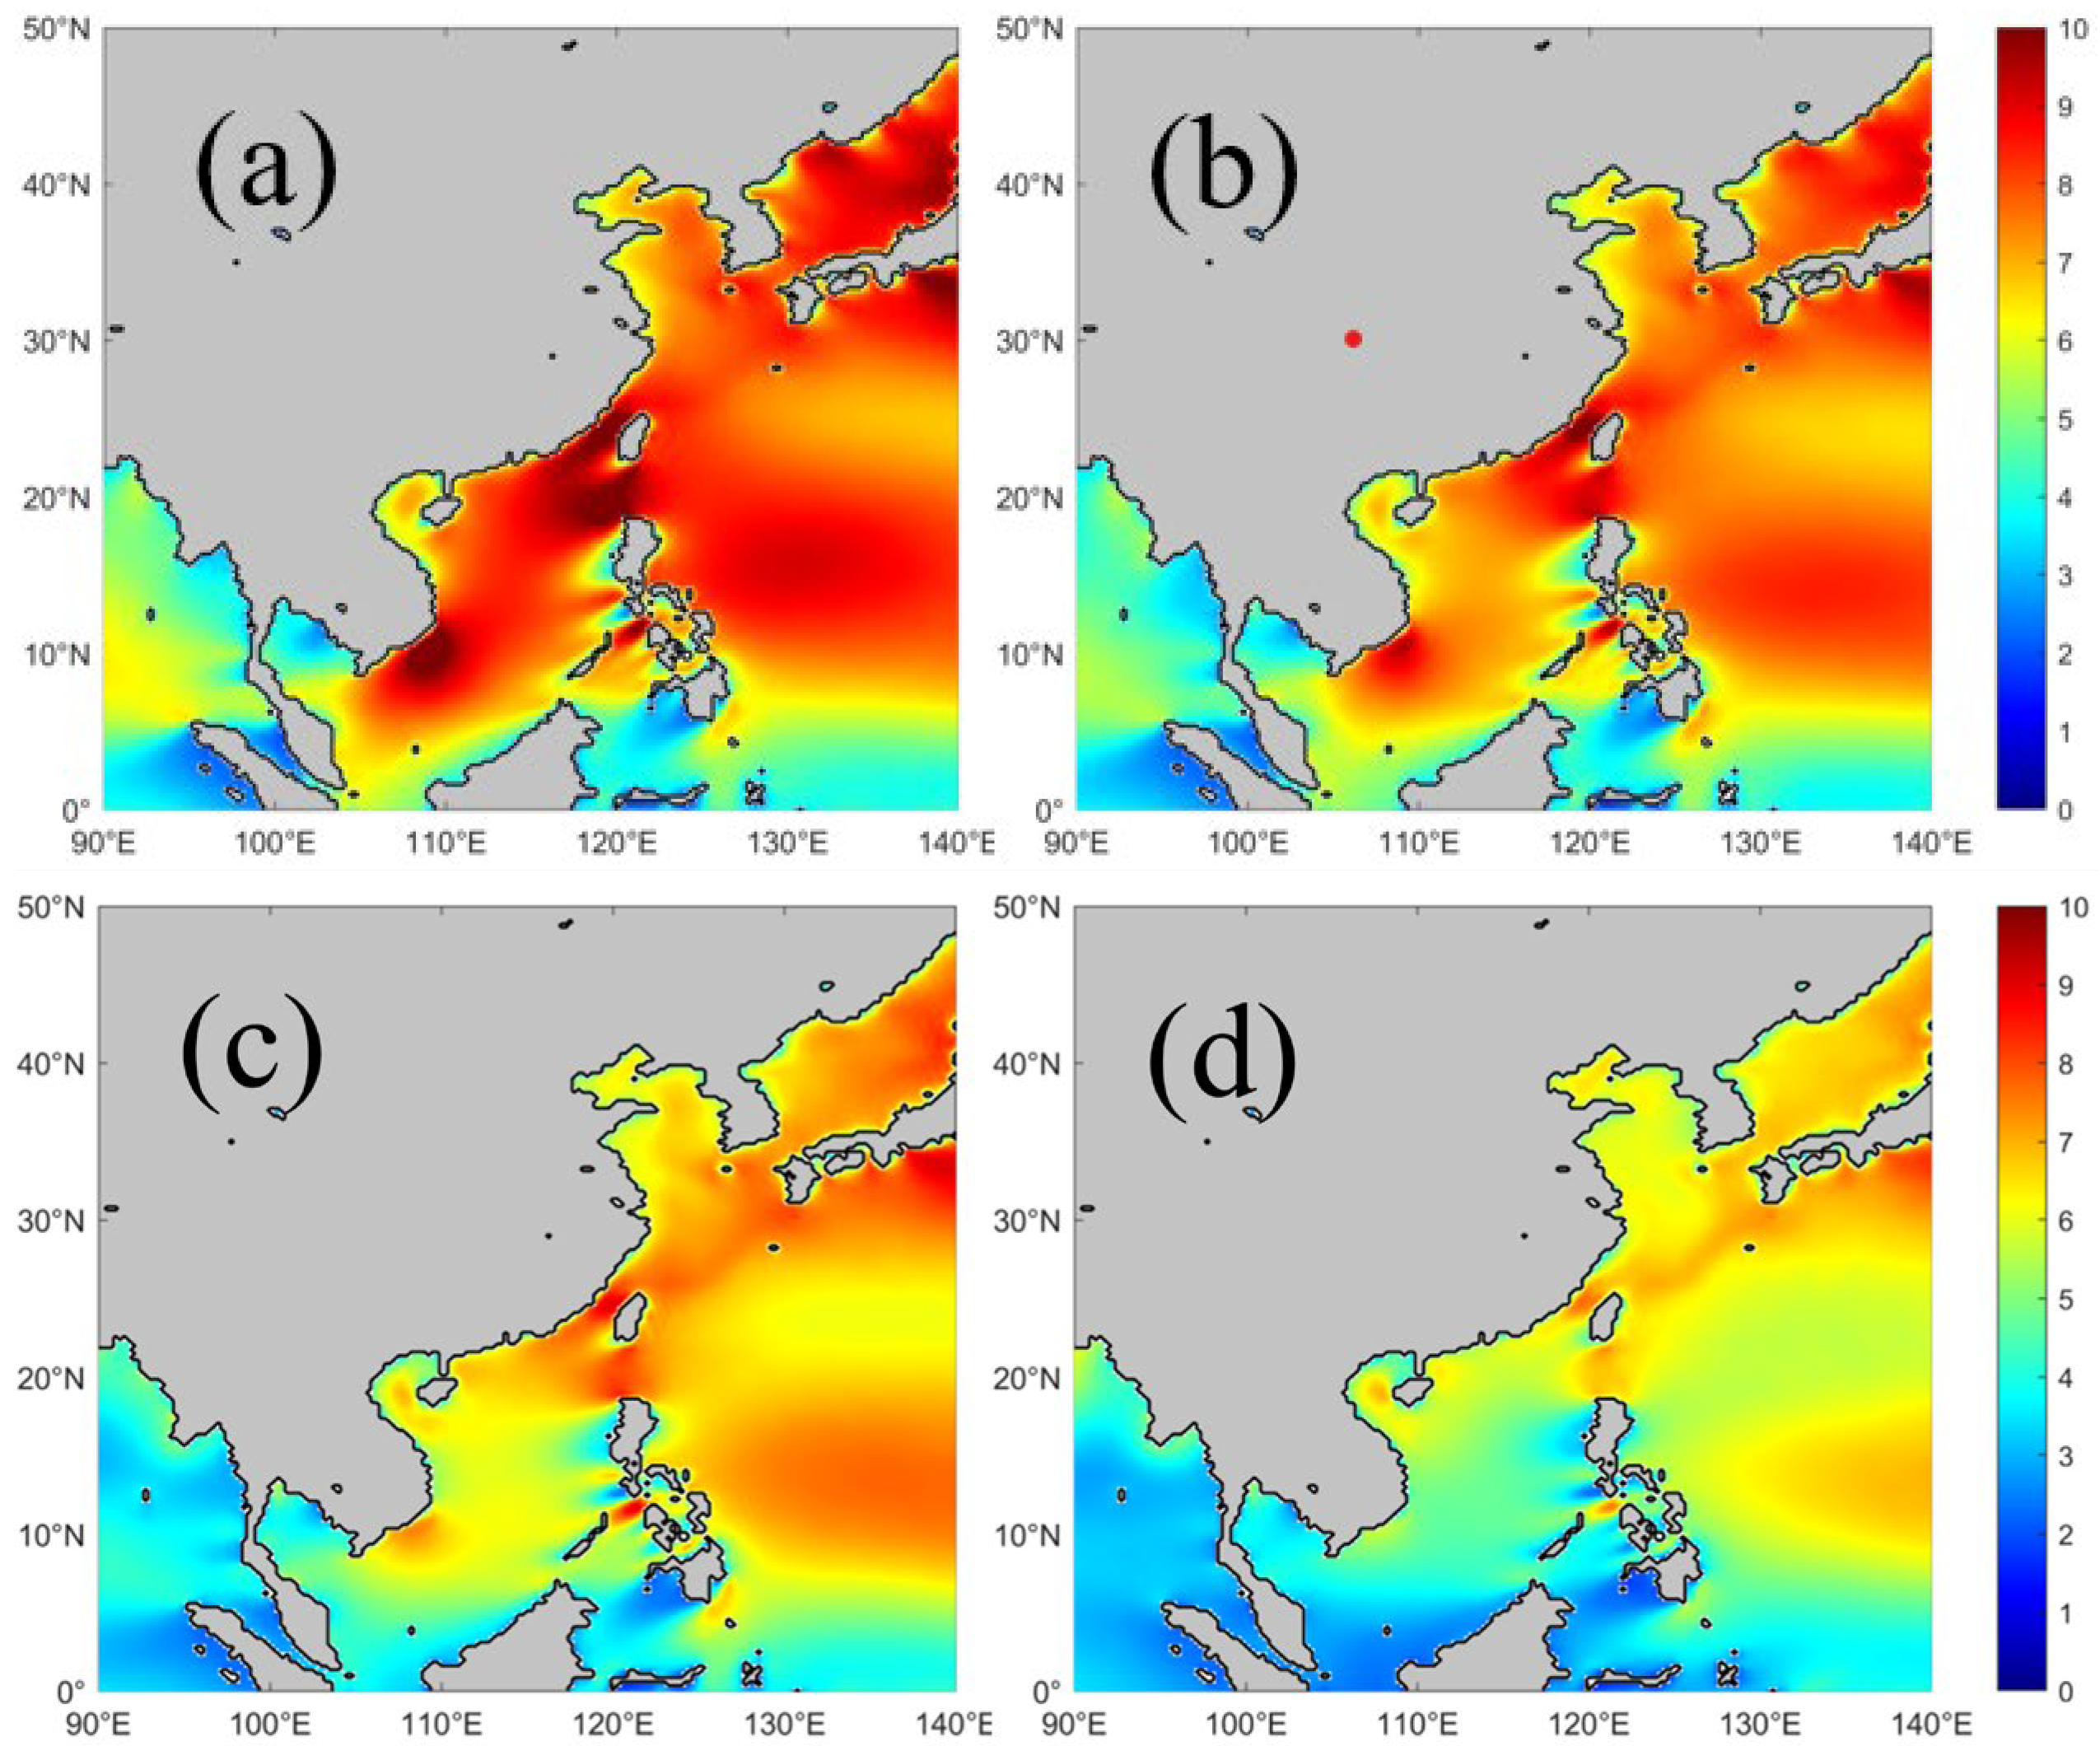
Figure 2 and Figure 3 illustrate the spatiotemporal distribution characteristics of yearly and monthly average wind speed and EWSO over the China Seas and adjacent waters. From an annual comprehensive perspective, the high-value areas of wind speed and EWSO were mainly distributed in the junction of the southern Donghai Sea and northern Nanhai Sea, hereafter referred to as the coastal core area. The multi-year average wind speed in this region exceeded 7 m/s, and EWSO exceeded 70%. Another smaller high-value area was located near 10° N in the Nanhai Sea, hereafter referred to as the Nanhai Sea high-value area, where the multi-year average wind speed also exceeded 7 m/s and EWSO exceeded 70%. The low-value areas of the wind speed and EWSO were mainly distributed in the sea area south of 6° N at the southernmost tip of the Nanhai Sea and parts of the sea area west of the Philippines, collectively referred to as the Nanhai Sea low-value area hereafter. Their formation was mainly influenced by the combined effects of the local wind belts and topographic conditions. In general, the identification of the above-mentioned high-value and low-value areas in this study was consistent with Zheng’s judgment of areas with wind energy density occurrence greater than 200 W/m2 in China’s coastal waters [53]. The high wind energy density areas in his study can also be divided into the coastal core area and the Nanhai Sea high-value area.
Figure 2 and Figure 3 further illustrate the multi-year average distribution characteristics of the wind speed and EWSO from January to December, indicating that the high-value periods for the wind speed and EWSO were mainly concentrated in winter (December–February). During these three months, the wind speed exceeded 7 m/s and EWSO exceeded 70% in almost the entire area. The coastal core area attained its maximum spatial extent in winter, and in December, the wind speed across the entire region exceeded 10 m/s, with EWSO being over 90%. The Nanhai Sea high-value area also attained its intensity peak in winter, with the wind speed exceeding 9 m/s and EWSO being over 90% in December. It should be noted that the wind speed and EWSO across the entire Japan Sea were also at relatively high levels in winter, with the wind speed exceeding 9 m/s and EWSO being over 90%. Overall, the wind speed and EWSO in spring (March–May), summer (June–August), and autumn (September–November) were weaker than those in winter. It is worth noting that the Nanhai Sea low-value area entered the period of the scarcest wind energy resources from April to June. The wind speed was lower than 4 m/s, and EWSO in the region was less than 20%. In summer, the entire Donghai Sea and the Nanhai Sea high-value area exhibited a slight recovery, with the wind speed close to 7 m/s and EWSO exceeding 70%. The characteristic of a secondary summer high-value in the Nanhai Sea high-value area was consistent with the research findings of Sun’s comparison of summer and winter wind speeds in the Nanhai Sea [54]. Sun’s study noted that although the overall wind speed in the Nanhai Sea was lower in summer than in winter, the Nanhai Sea high-value area still maintained a relatively high wind speed, with the wind speed being only about 2 m/s lower than in winter. This was consistent with the results of this study. EWSO in this region in summer was 10–15% lower than in winter. Liu et al. [55] found that the WPD and the effective wind speed hours in the Yellow Sea exhibited significant winter–summer differentiation (strong in winter and weak in summer), which is consistent with the assessment of the wind energy potential in the Yellow–Bohai Sea in this study.
In summary, the wind speed and wind energy availability in China’s coastal and adjacent waters were generally favorable, with significant temporal variations in their annual distribution. The coastal core area and the Donghai Sea and Nanhai Sea high-value areas were determined to be more suitable for wind farm construction. Wind energy availability was highly concentrated in winter and relatively weak in other seasons. Thus, the Donghai Sea and Nanhai Sea high-value areas are more suitable for wind farm development than the coastal core area. Their shared characteristic of a secondary summer high-value balances the temporal distribution of regional wind energy availability, which aligns with the seasonal pattern of China’s coastal power demand.

4. Long-Term Variation Trends of EWSO in the China Seas and Adjacent Waters

4.1. Overall Variation Trends

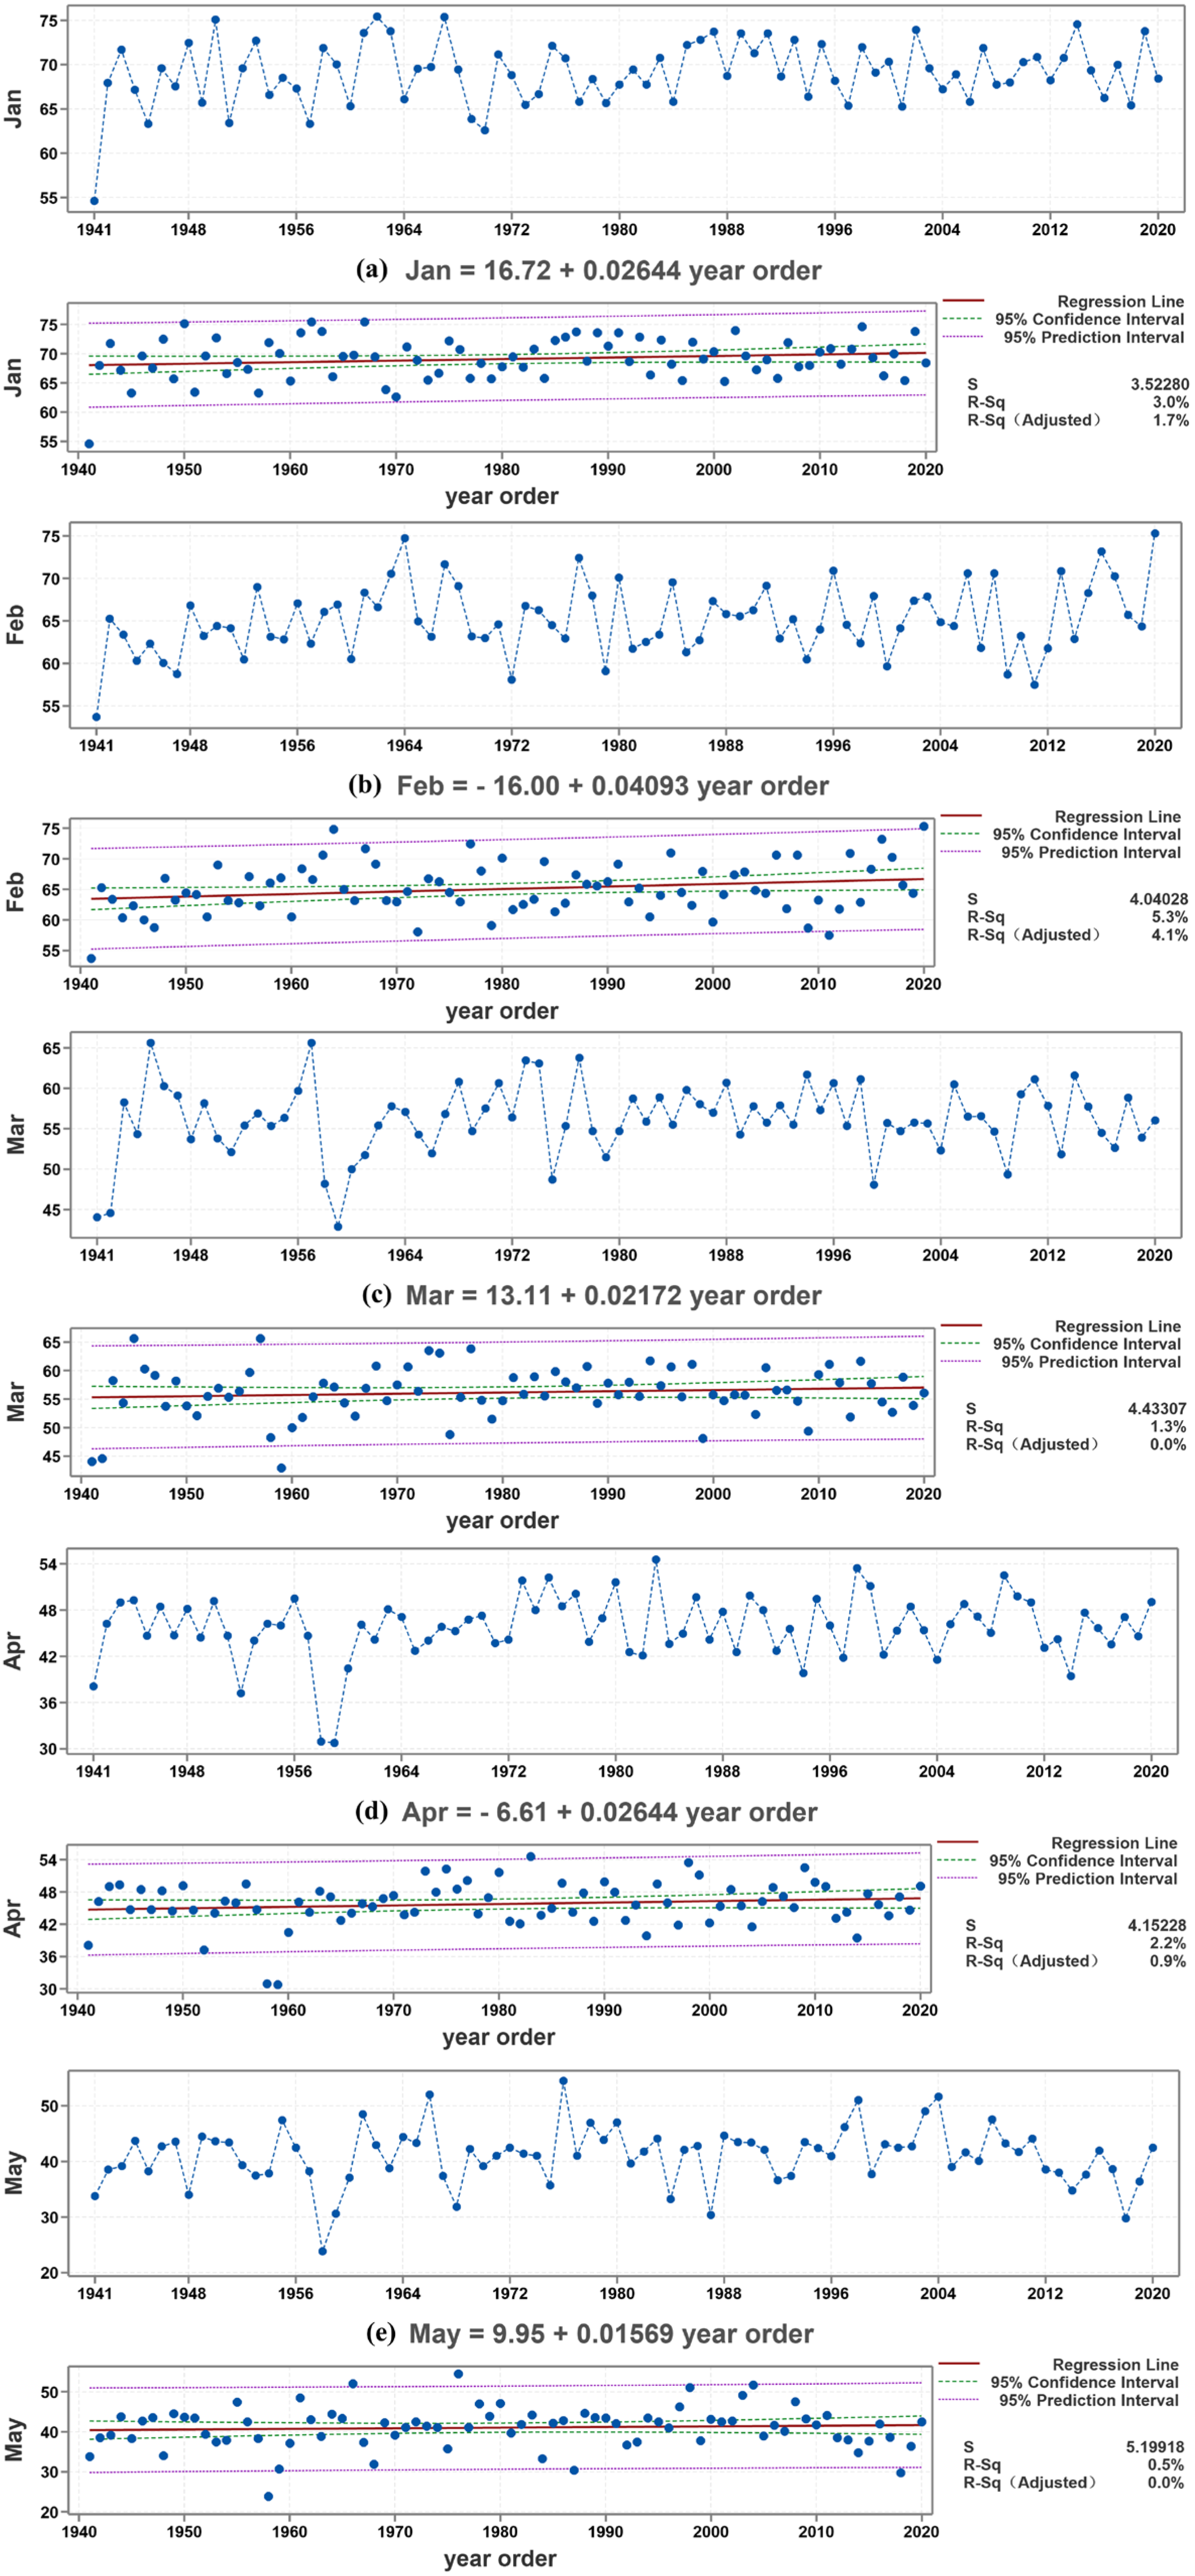
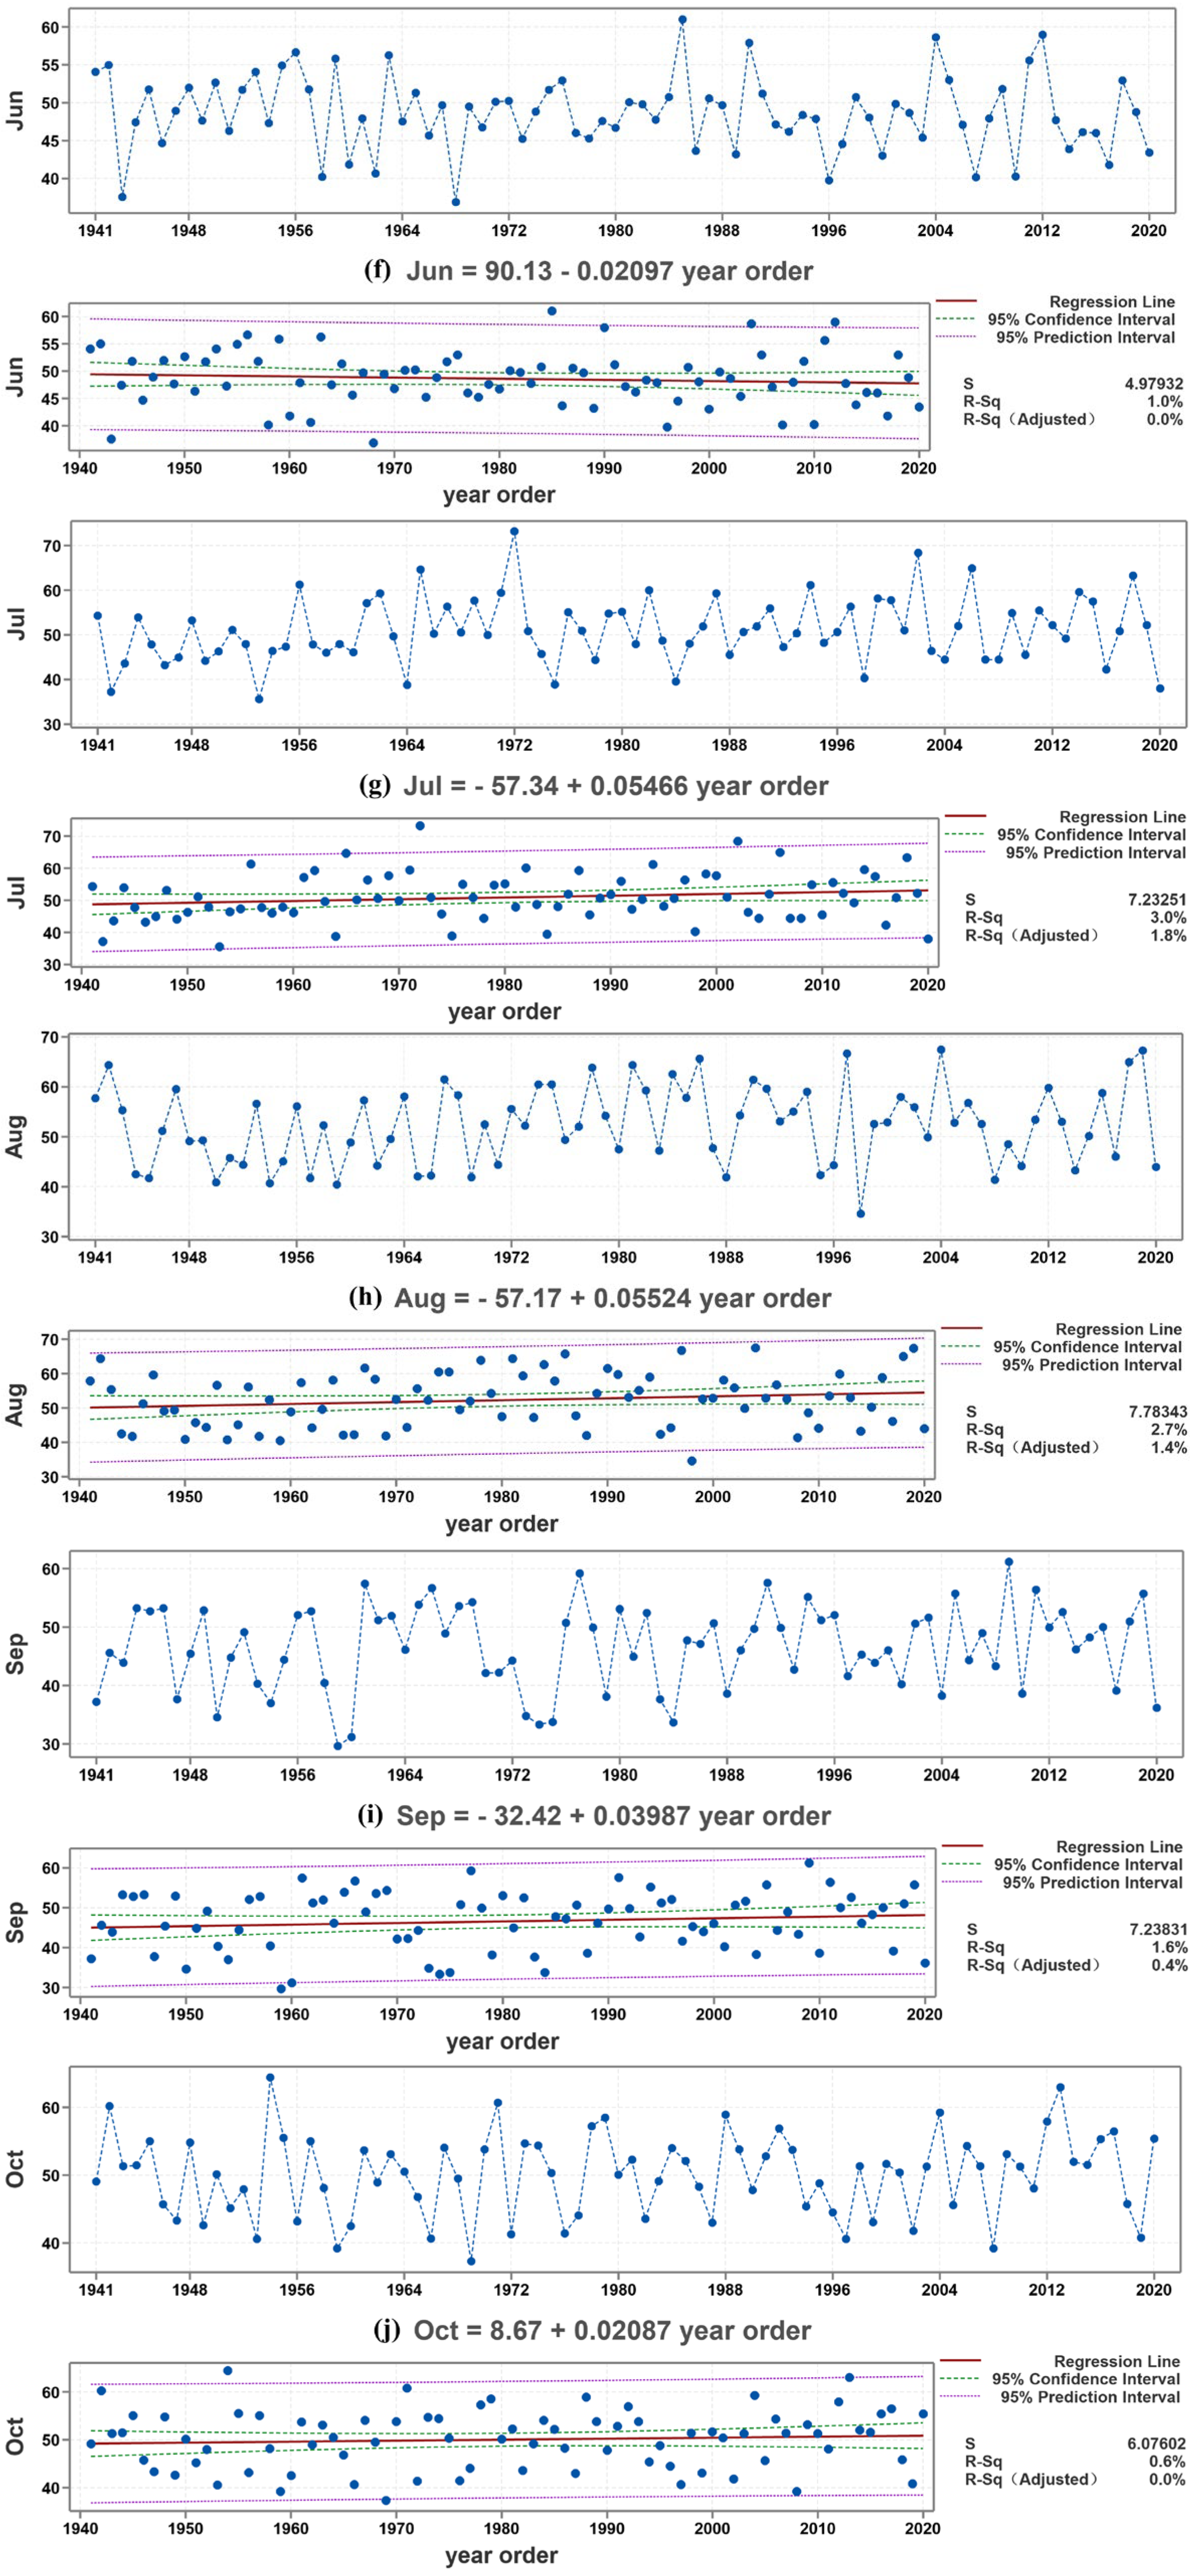
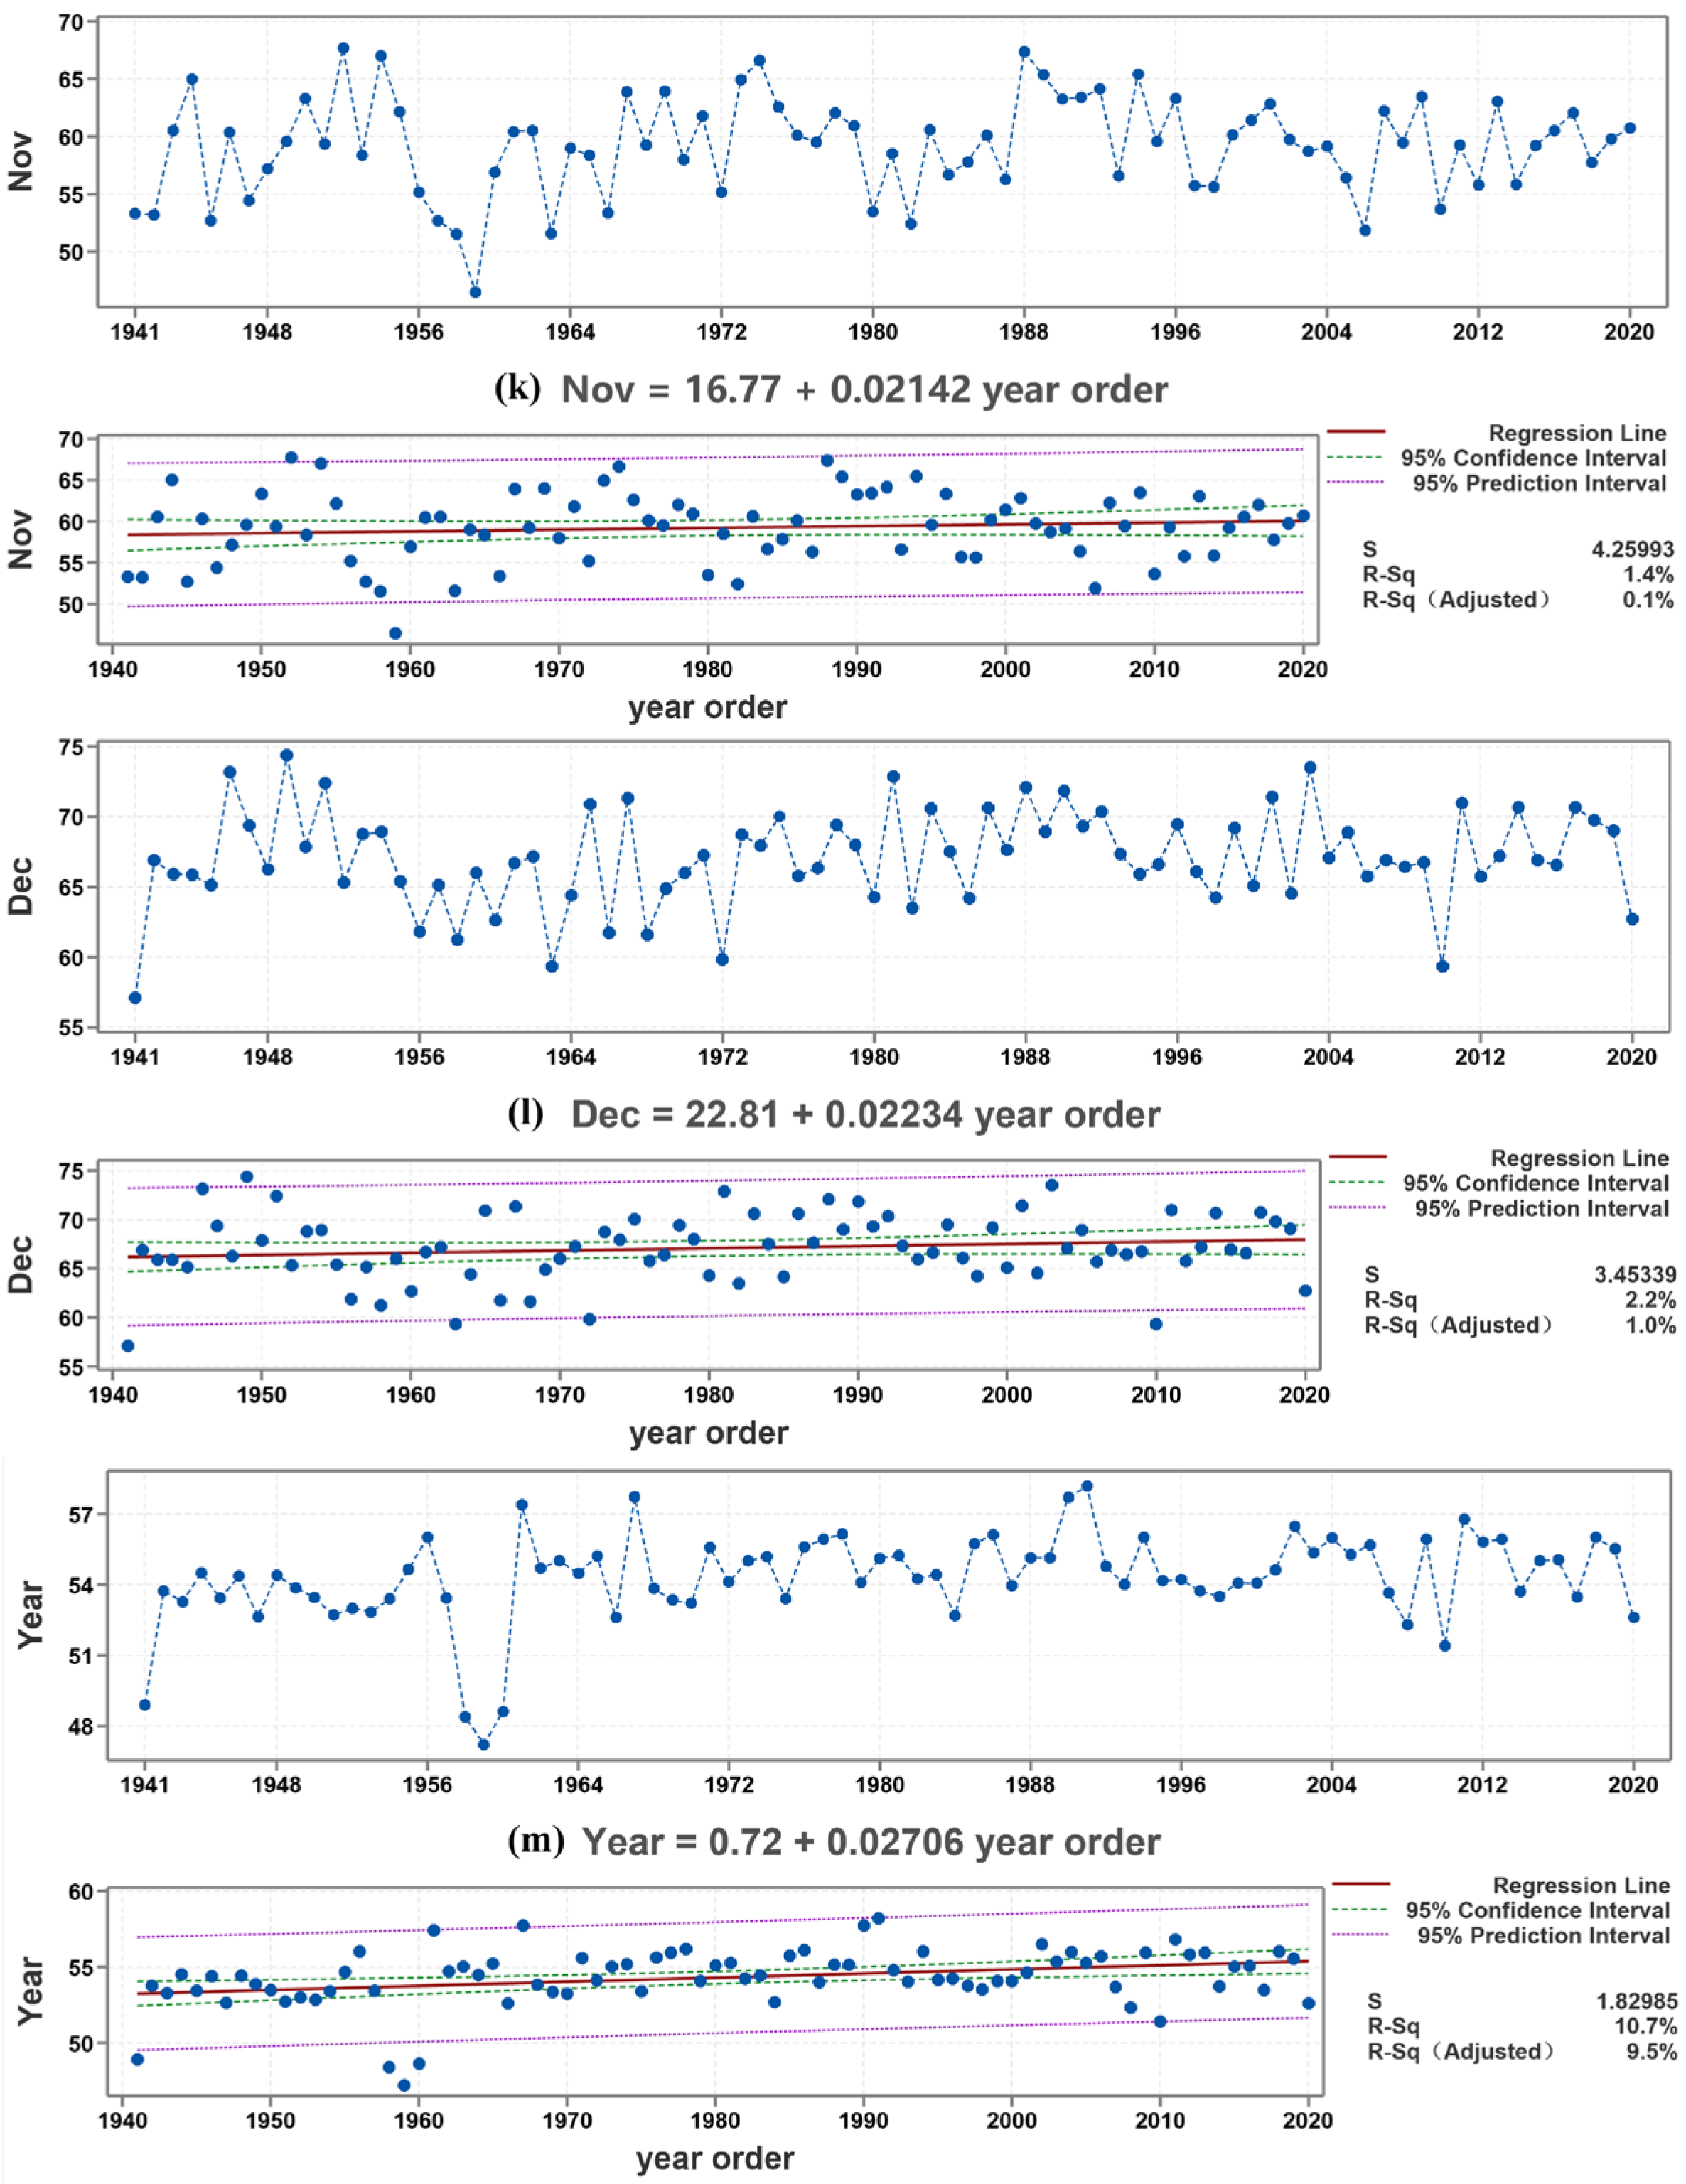
Based on nearly 80 years of yearly and monthly average time-series data for EWSO, Figure 4 illustrates the long-term overall regional variation trends of EWSO for January–December and the entire year in the China Seas and adjacent waters. Table 1 presents the linear growth rates and their statistical significance (p-values) of EWSO for January–December and the entire year.
As shown in Table 1, the annual mean EWSO exhibited a statistically significant increasing trend at the 95% confidence level, with a growth rate of 0.027%/yr. This indicates a significant enhancement in wind energy availability at the climatic scale. At the monthly scale, only February showed a statistically significant increasing trend of 0.041%/yr at the 95% confidence level. The trends in all other months were not statistically significant, a result largely constrained by pronounced interannual variability. Although the linear trends in all other months did not reach the 95% statistical significance threshold (p > 0.05), the magnitude of these trends carries potential physical significance and therefore retains considerable research value. July (0.055%/yr) and August (0.055%/yr) had the highest growth rates. This may imply that the summer circulation pattern is undergoing long-term changes. For instance, alterations in the intensity or position of the subtropical high could create more favorable conditions for the occurrence of effective wind speeds. These characteristics derived from trend magnitudes, despite their insufficient statistical significance, provide crucial observational clues for investigating the seasonally differential responses of wind energy resources to climate variability and climate change.
As shown in Figure 4, EWSO was concentrated within the 95% prediction interval, which validated the model’s ability to capture long-term trends. EWSO exhibited distinct periodic fluctuation patterns, with pronounced deviations in 1955–1968, 1989–1995, and 2006–2020. January, March, June, and December exhibited periodic fluctuations, whereas the other months showed relatively stable variations (±7–14%). Occasionally, the outliers deviated by 7–10% from the monthly averages in specific years. The strong interannual signal underscores the importance of investigating the climatic drivers of EWSO, which is the focus of the following section on its correlation with major climate indices.

4.2. Spatiotemporal Characteristics of Variation Trends

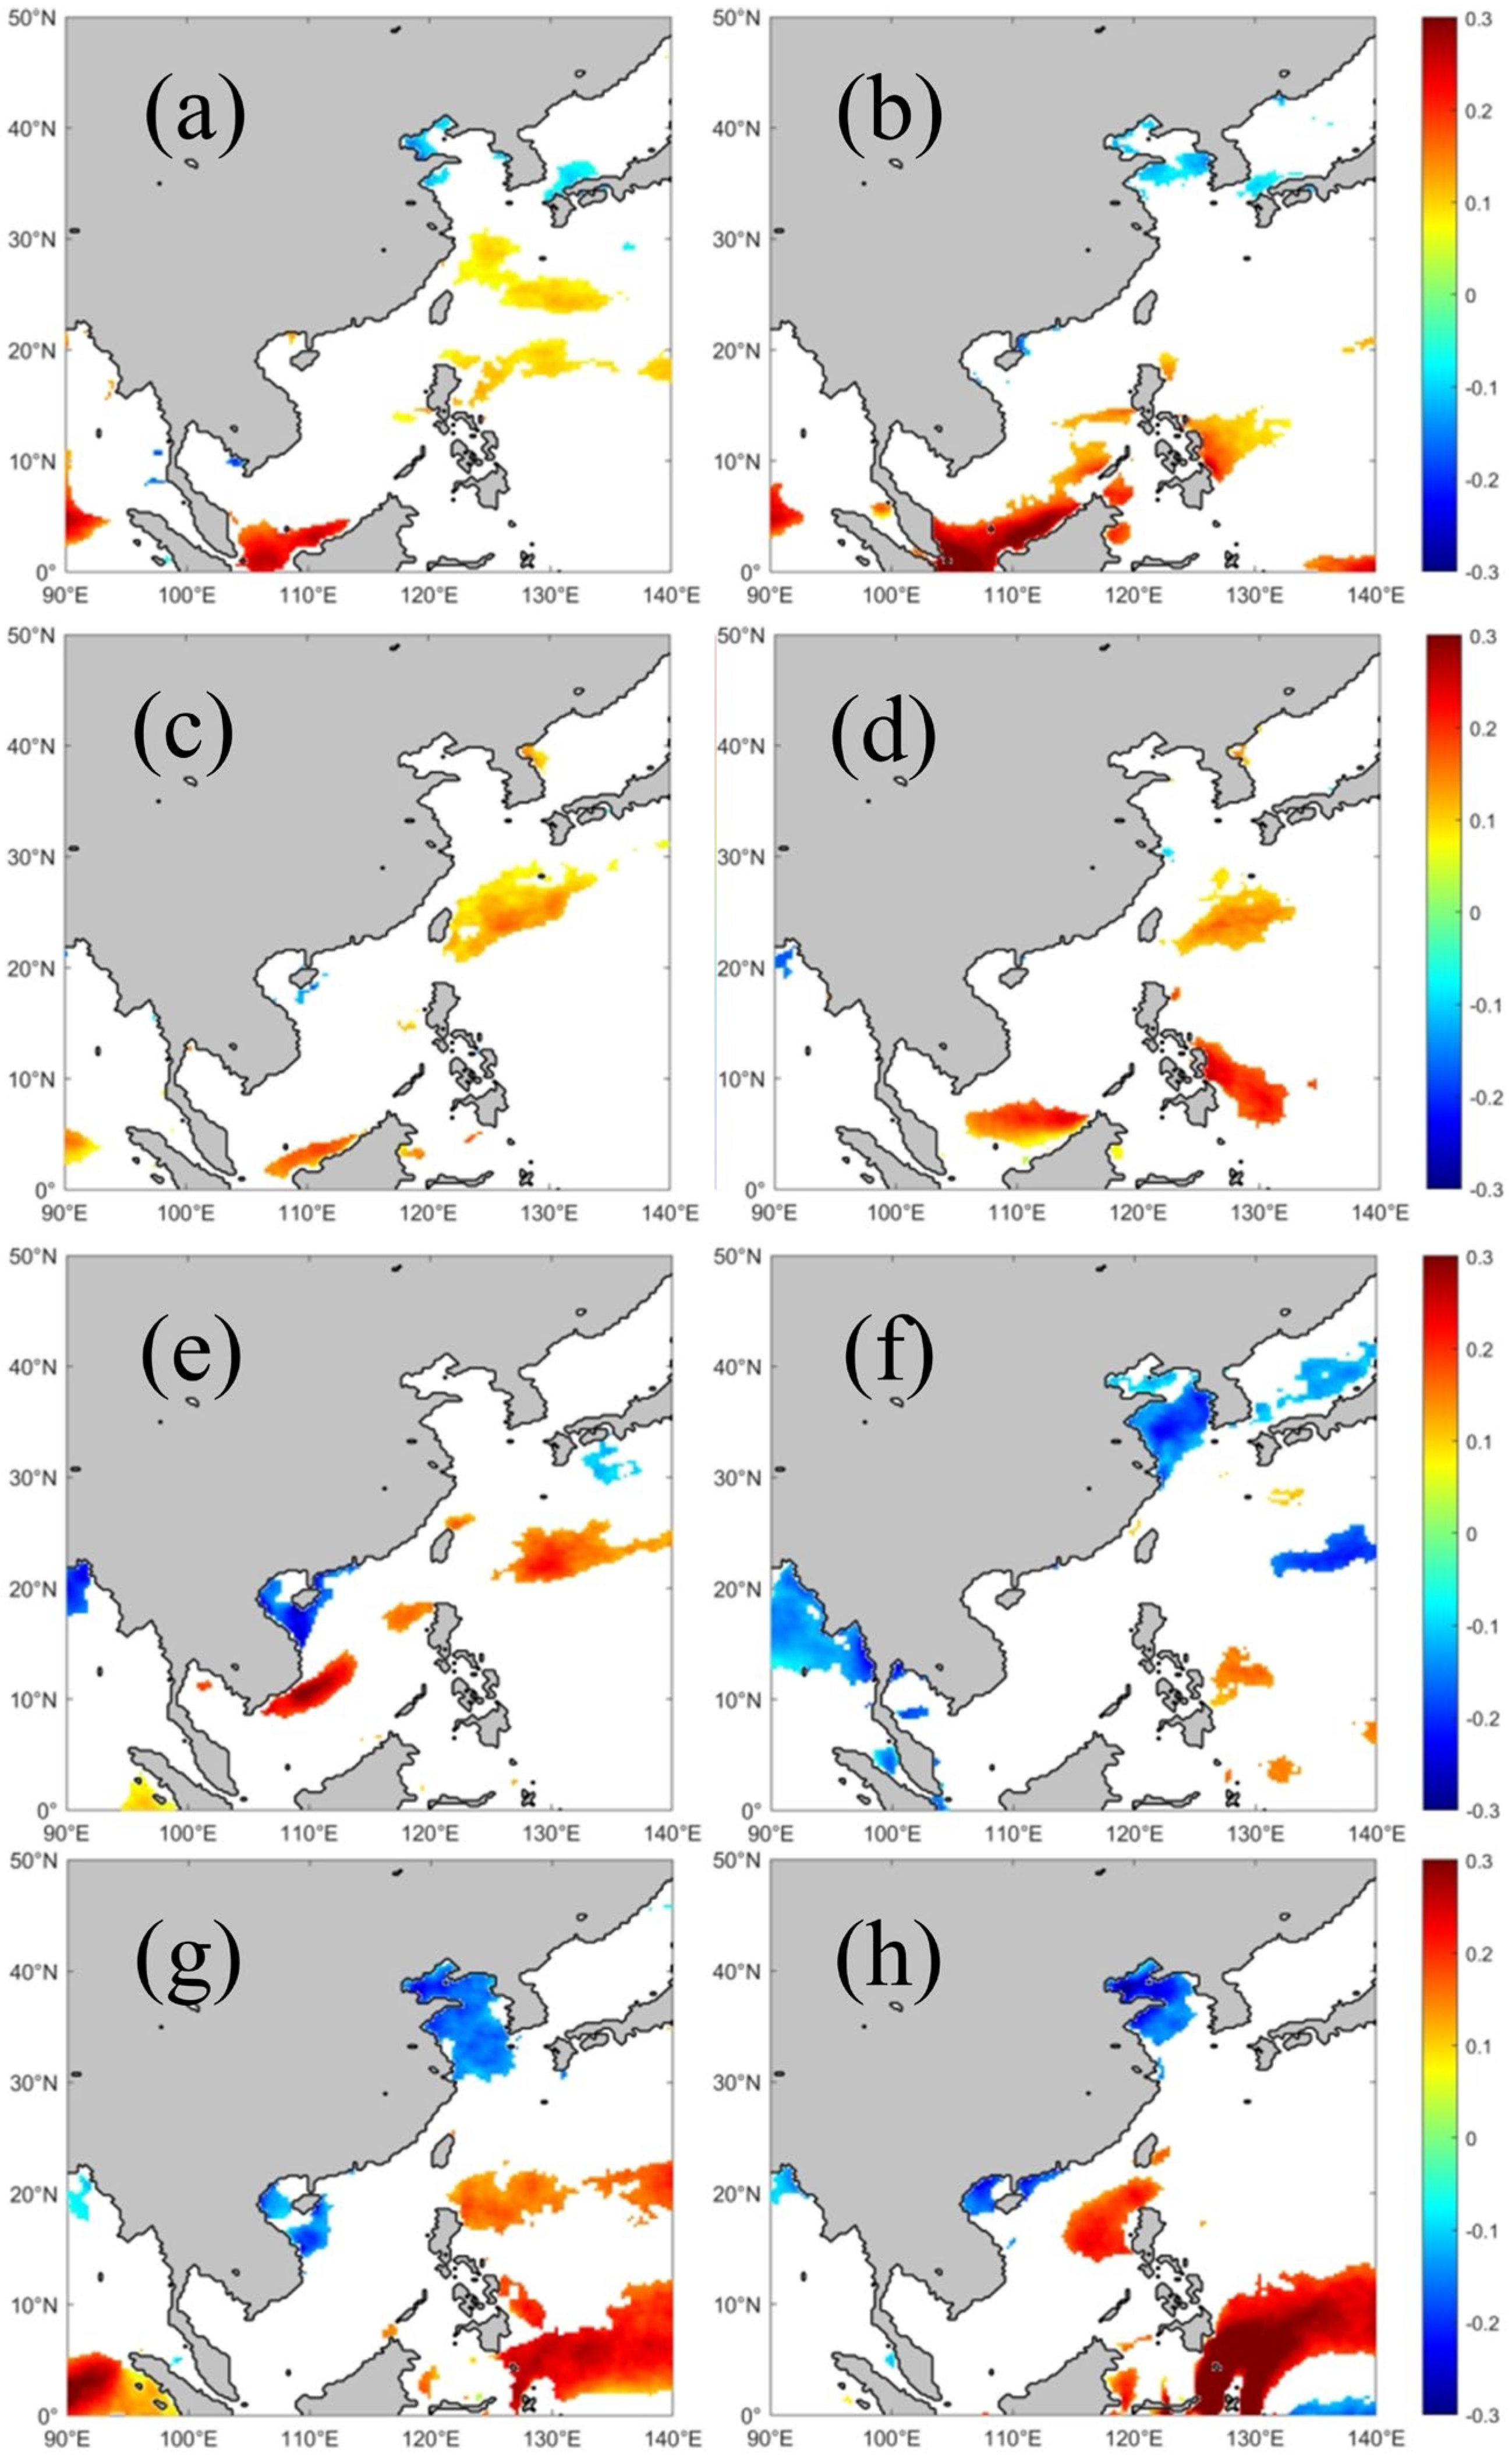
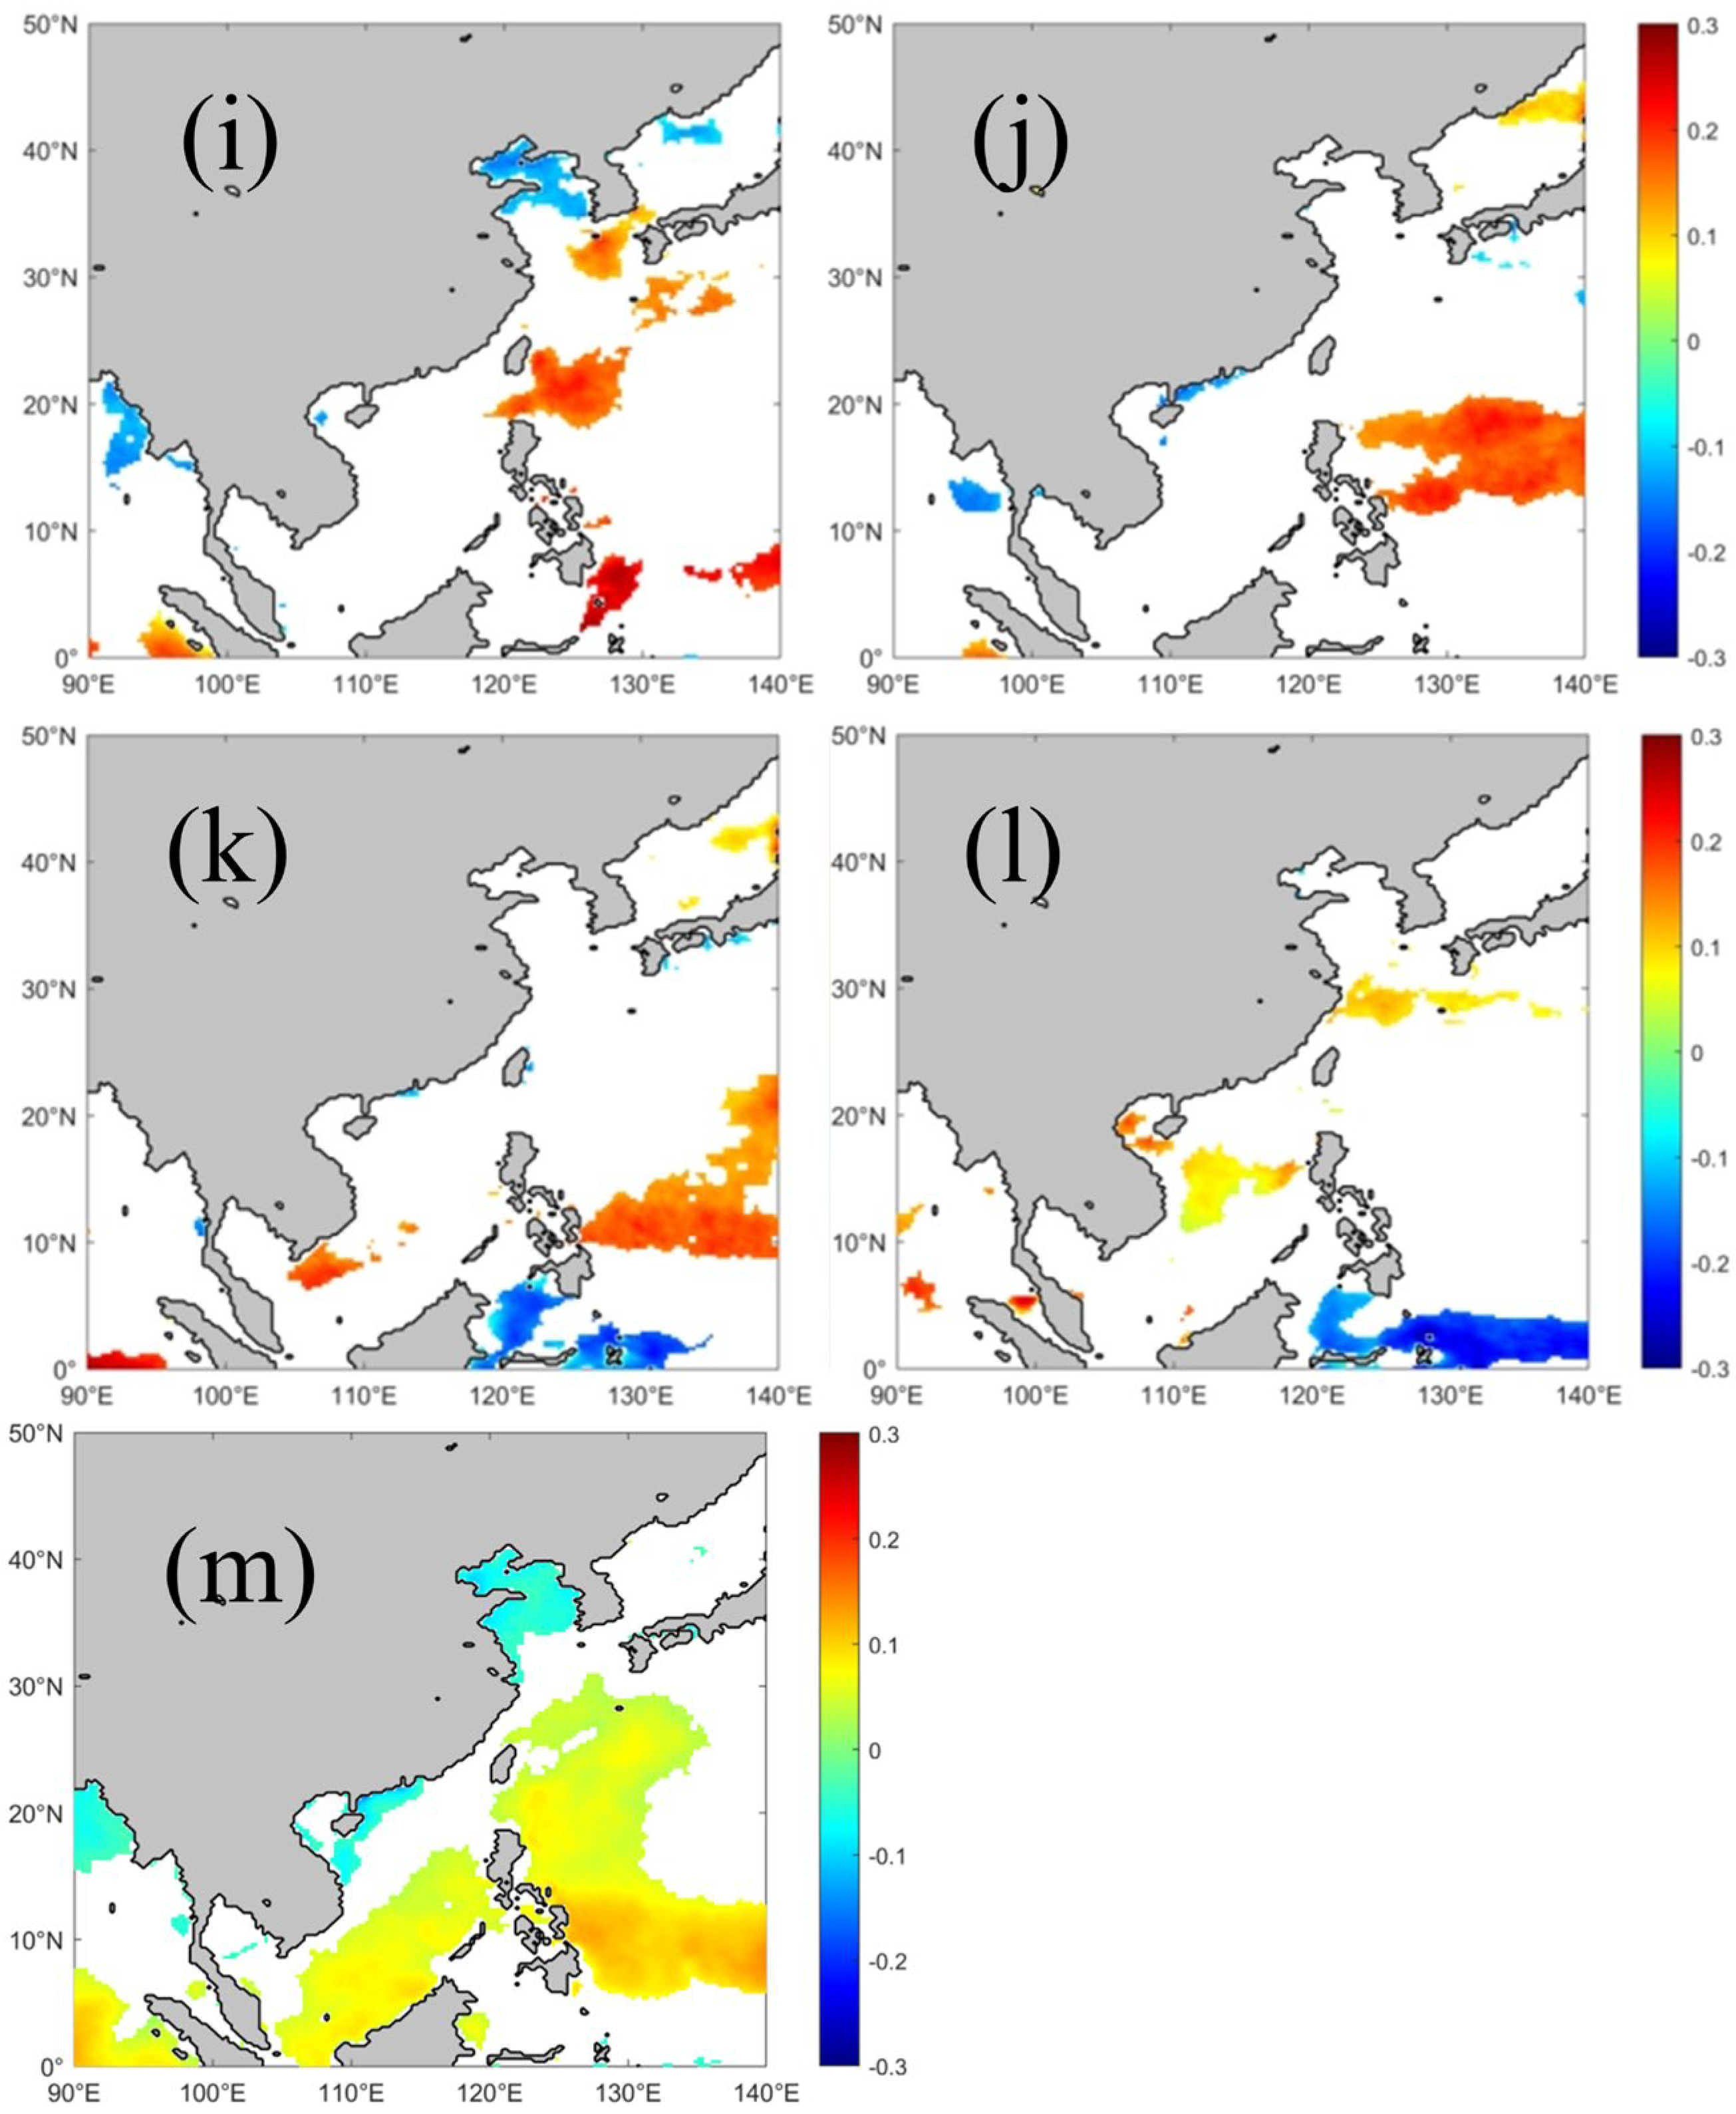
Figure 5 illustrates the spatiotemporal distribution characteristics of yearly and monthly long-term variation trends of EWSO in the China Seas and adjacent waters. These figures were generated by calculating the variation trend at each 0.25° × 0.25° grid point based on nearly 80 years of yearly and monthly average EWSO data, with colored areas indicating trends significant at the 95% confidence level.
As shown in Figure 5, EWSO exhibited a spatial pattern of inshore decline and offshore increase. Zheng et al. [56] identified a similar upward trend in their study of global offshore wind speed changes from 1988 to 2011. The Yellow–Bohai Sea and the waters surrounding Hainan Island exhibited a significant declining trend of −0.06%/yr, whereas the southeastern Nanhai Sea and the Donghai Sea showed significant increasing trends of 0.20–0.25%/yr. Ren et al. [57] found that the wind speed in the Bohai Sea exhibited a significant declining trend during 1950–2011, which was consistent with the findings of this study. This study revealed variations in the annual EWSO trends.
For the Japan Sea, approximately one-third of its waters had a significant declining trend of 0.10%/yr in June. The Yellow–Bohai Sea exhibited significant declining trends of 0.10–0.15%/yr from January to February and 0.10–0.30%/yr in most regions from June to September. This phenomenon might be attributable to the weakening of the East Asian monsoon against the backdrop of global warming. The Donghai Sea exhibited a significant increasing trend, with the entire region rising at a rate of 0.08%/yr from December to January and partial regions showing an increasing trend of 0.15%/yr in September. The central–southern Nanhai Sea exhibited an increasing trend of 0.10–0.30%/yr from November to May, its eastern part exhibited an increasing trend of 0.20%/yr in August, and the regions near Hainan Island exhibited a declining trend of 0.10–0.30%/yr in May and from July to August.

5. Correlation Between EWSO and Major Climate Indices in China Seas and Adjacent Waters

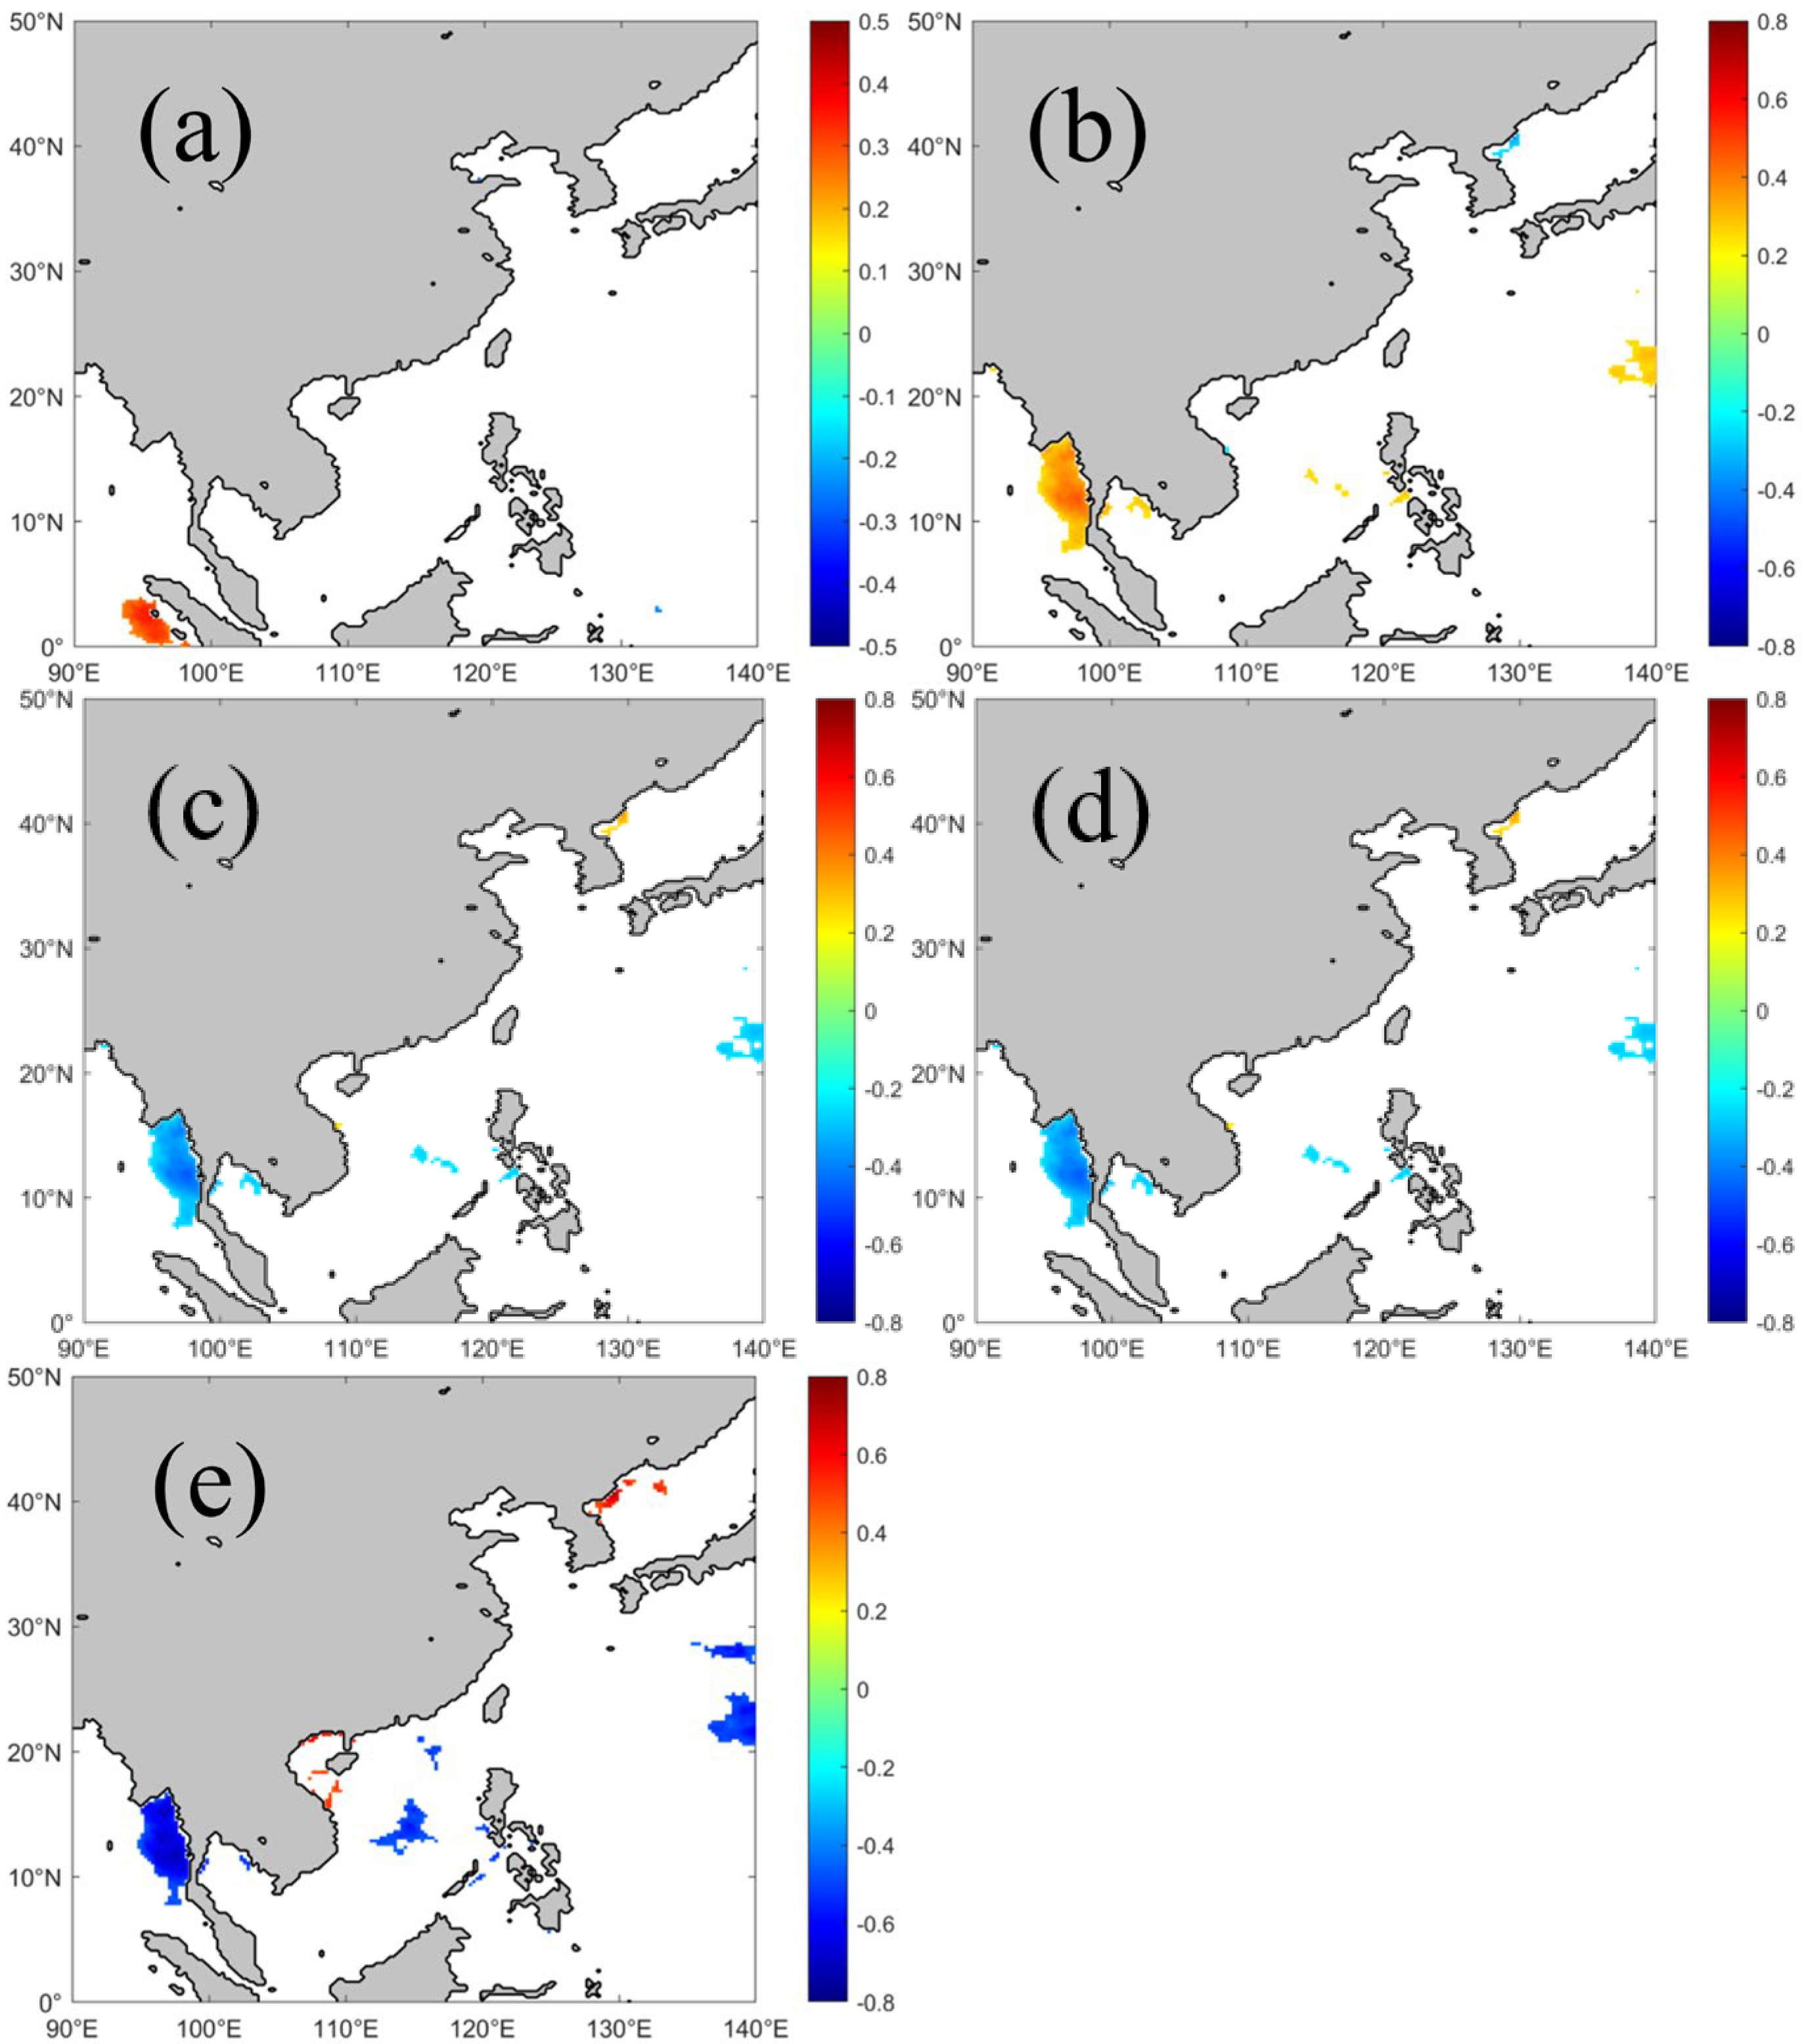
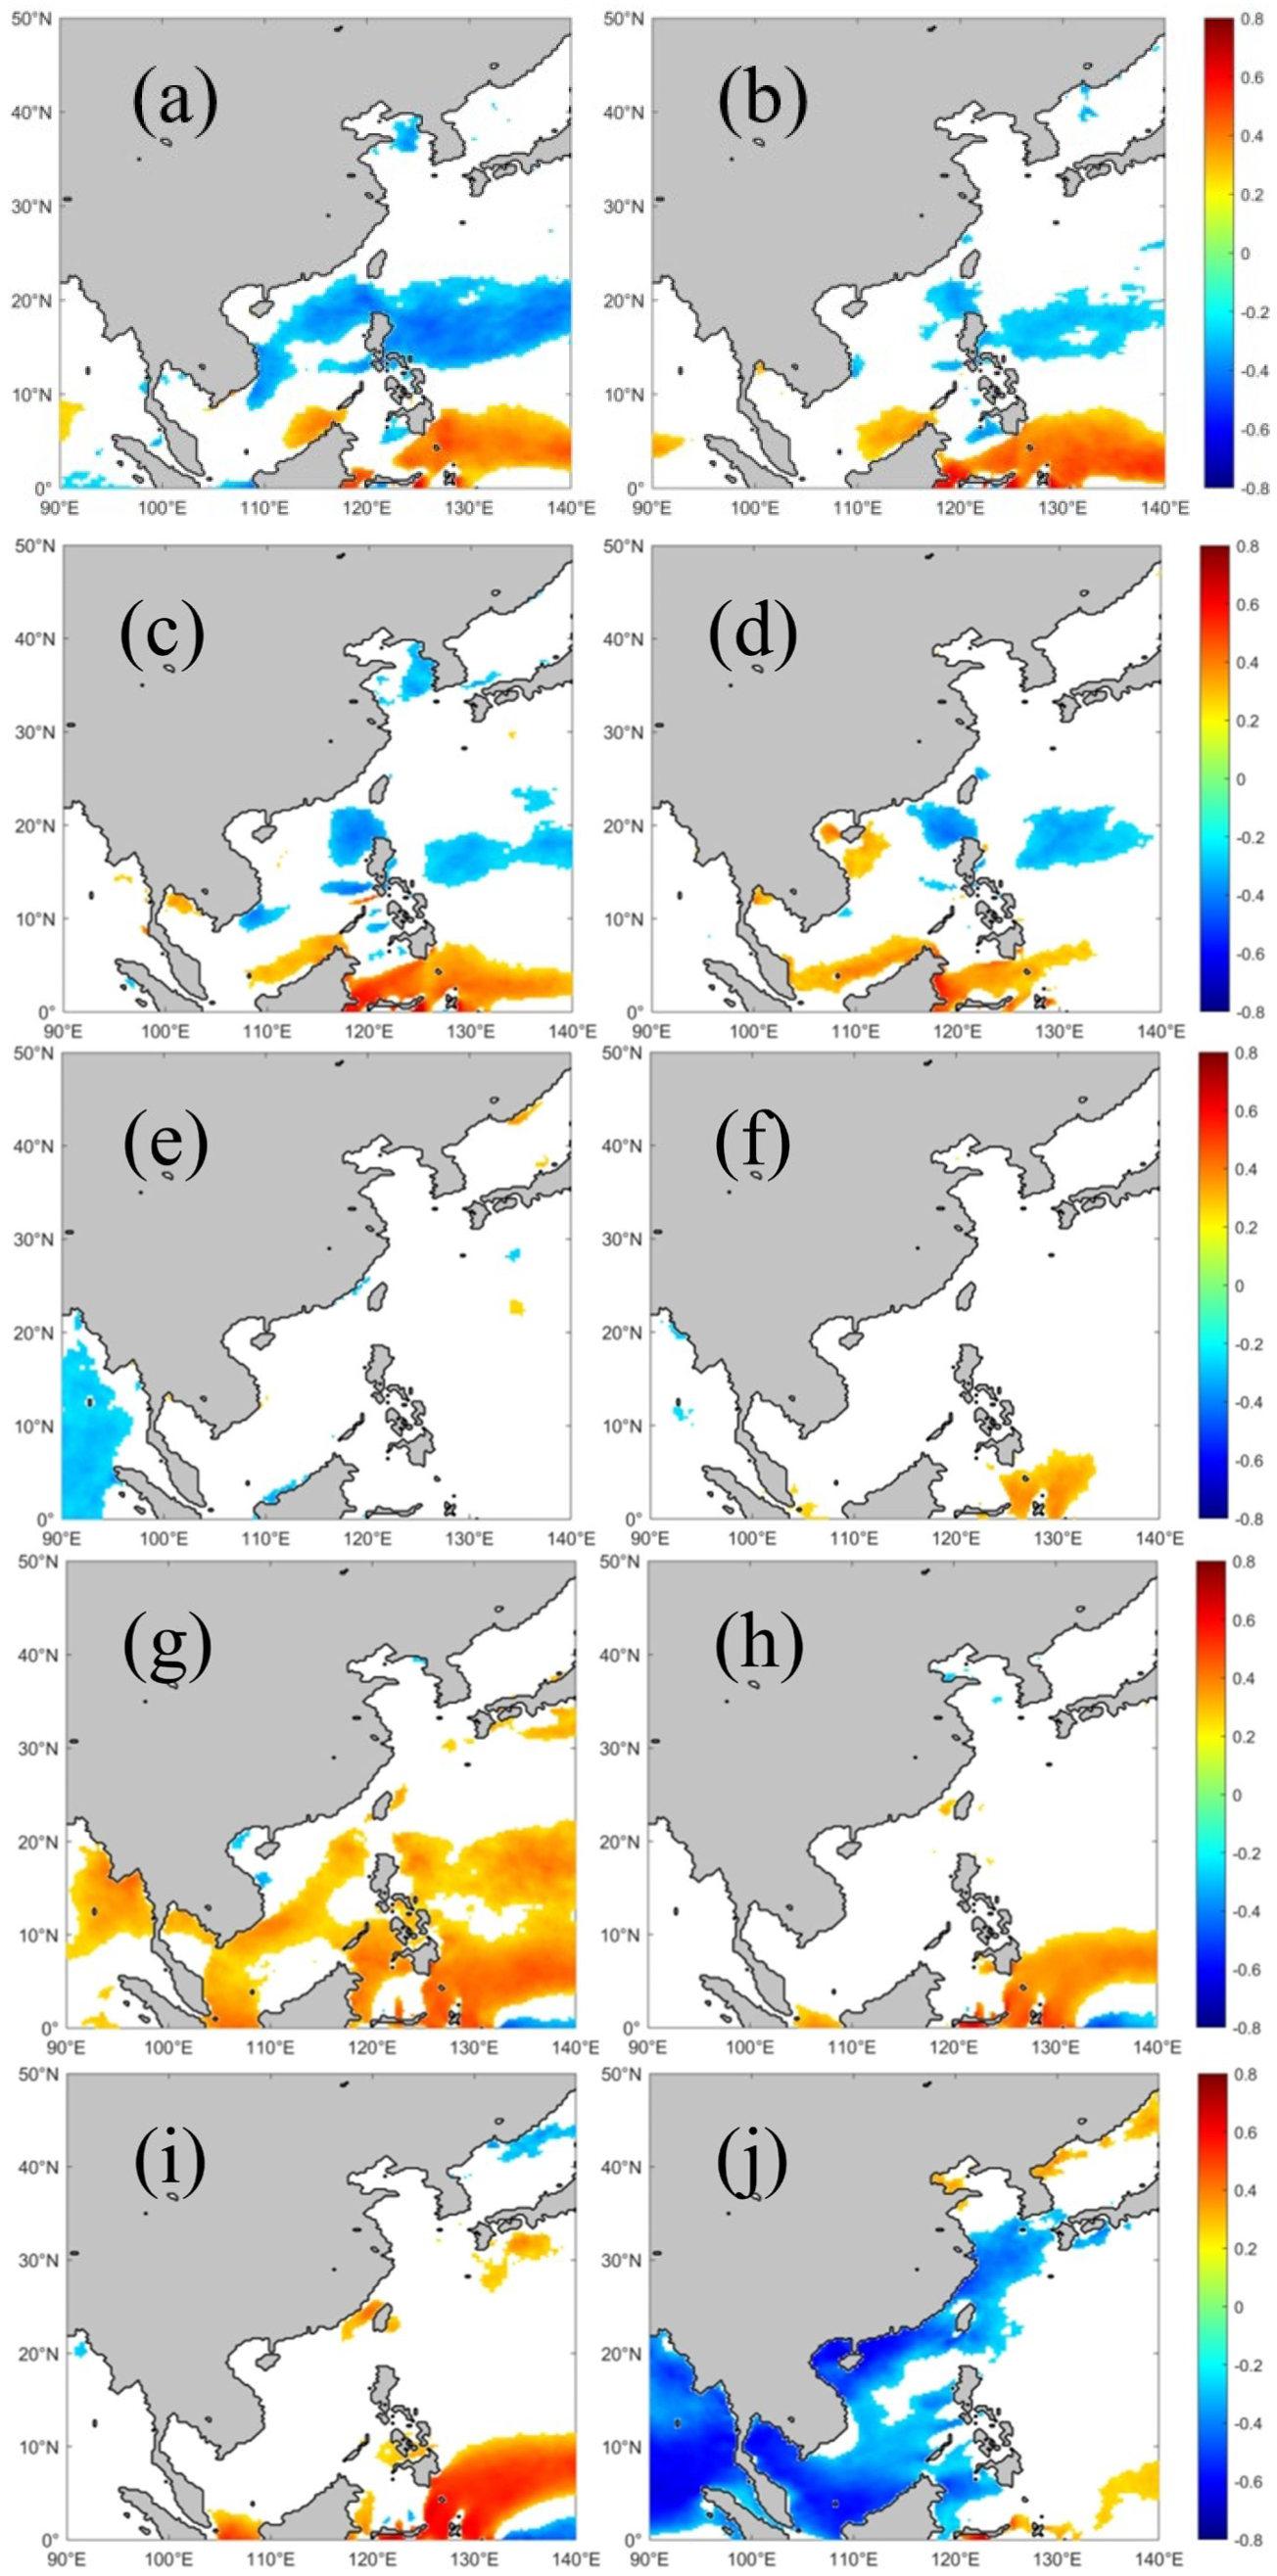
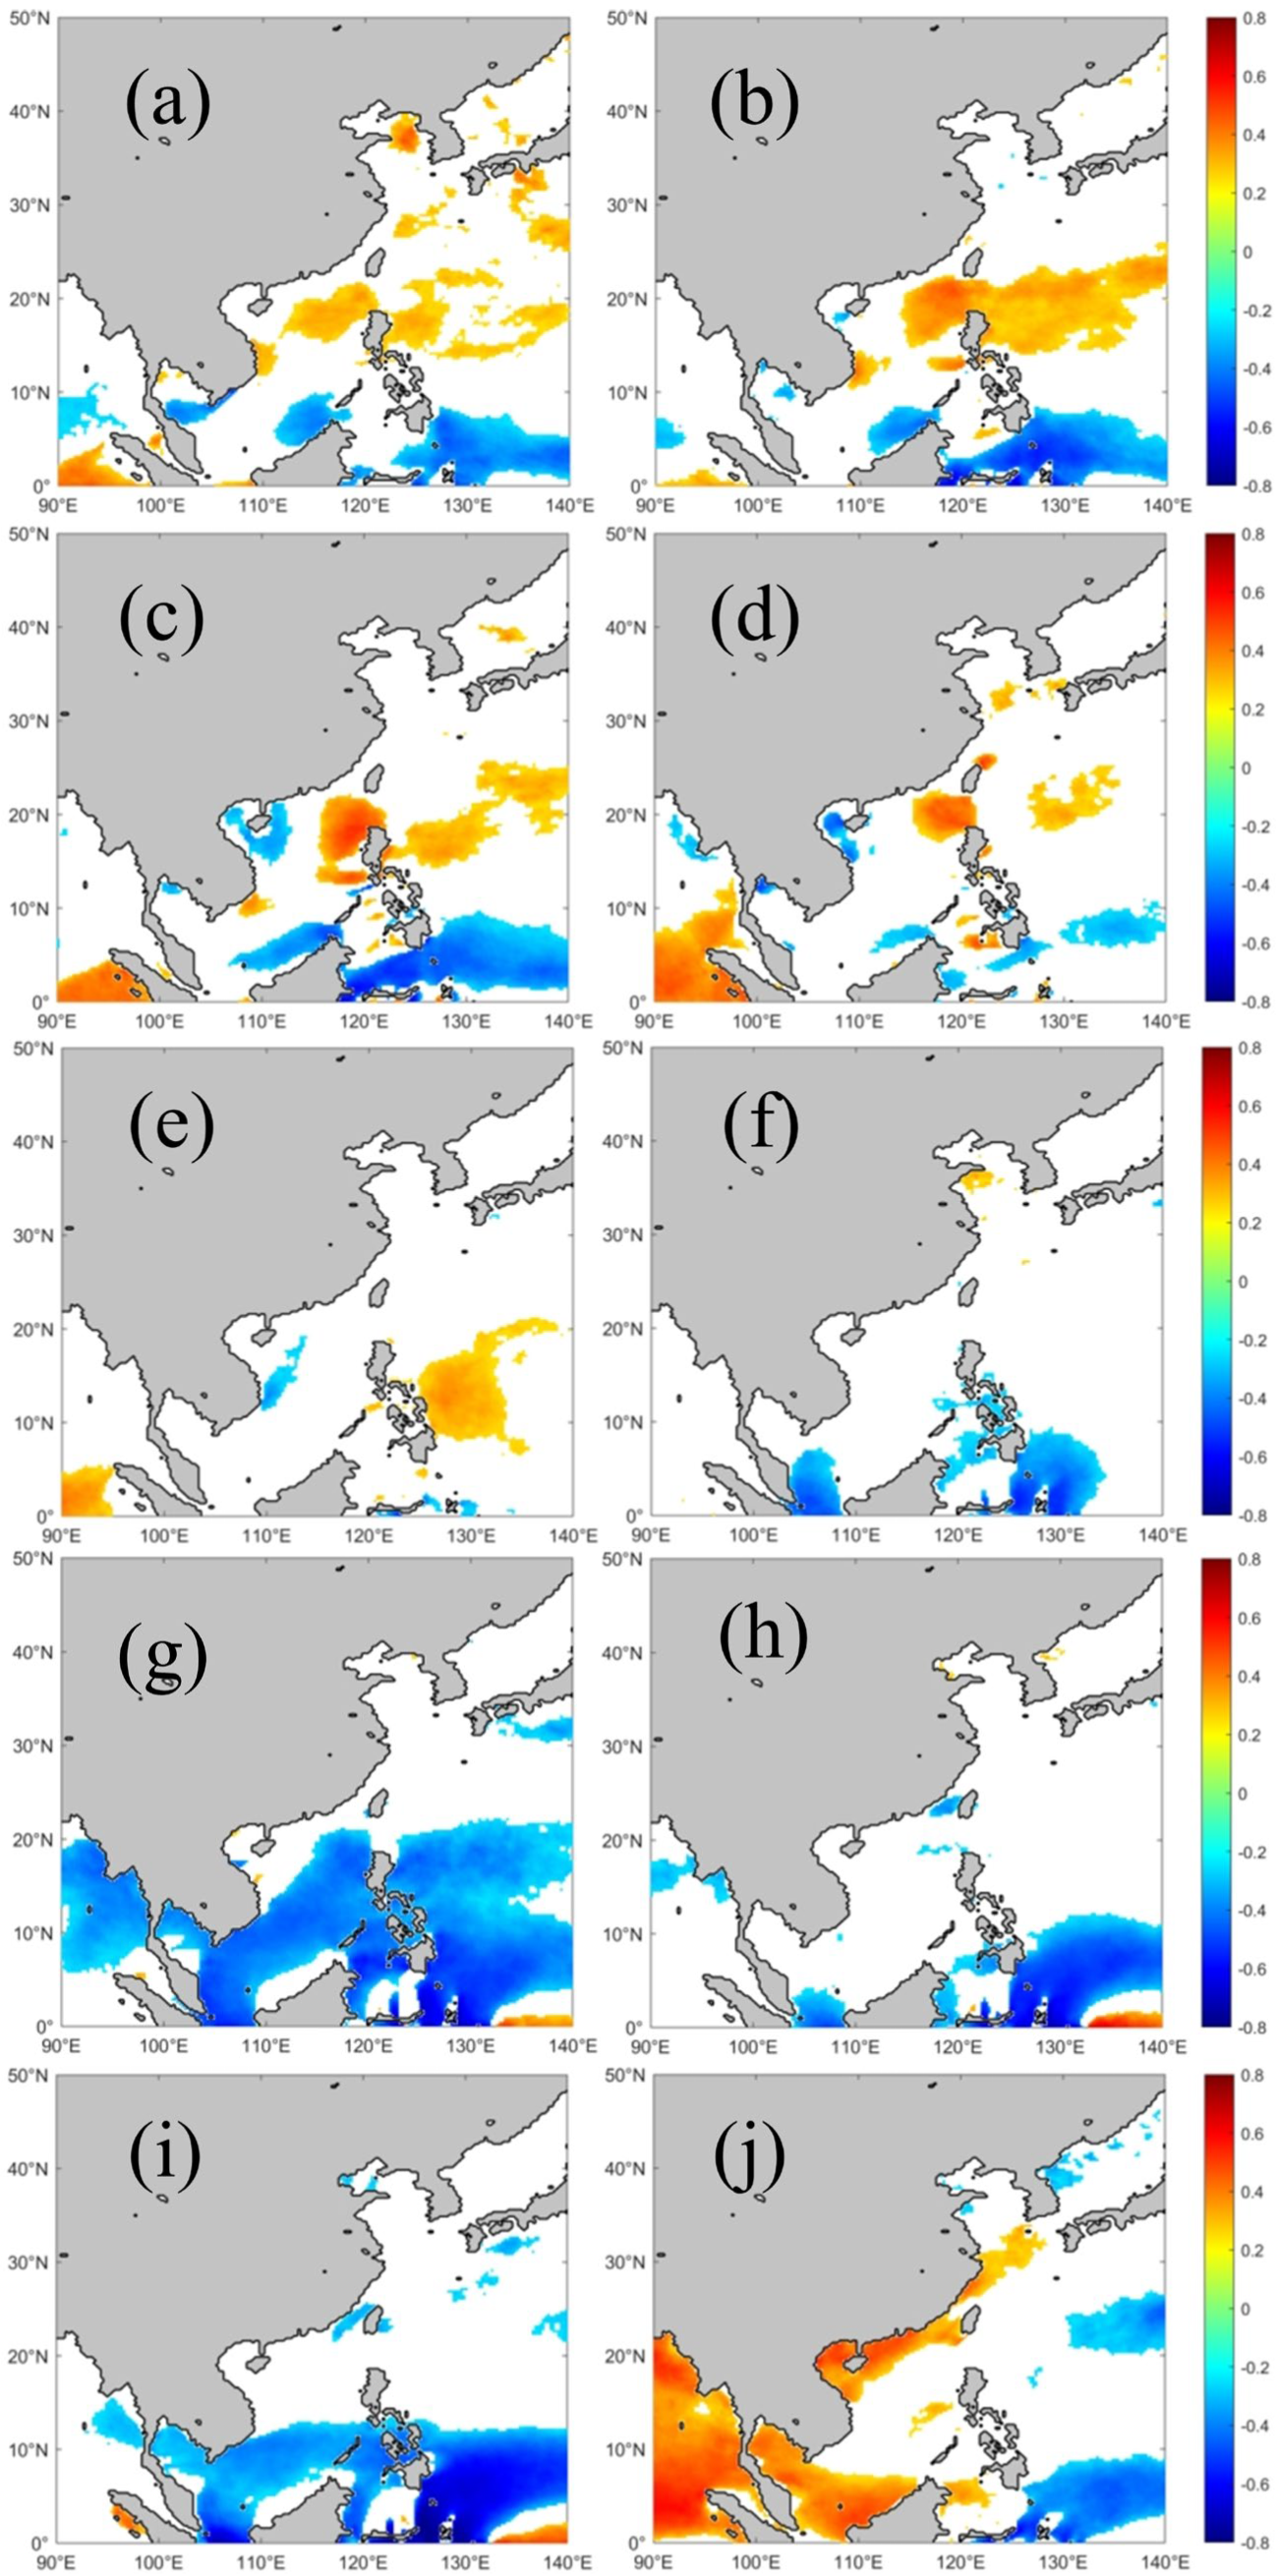
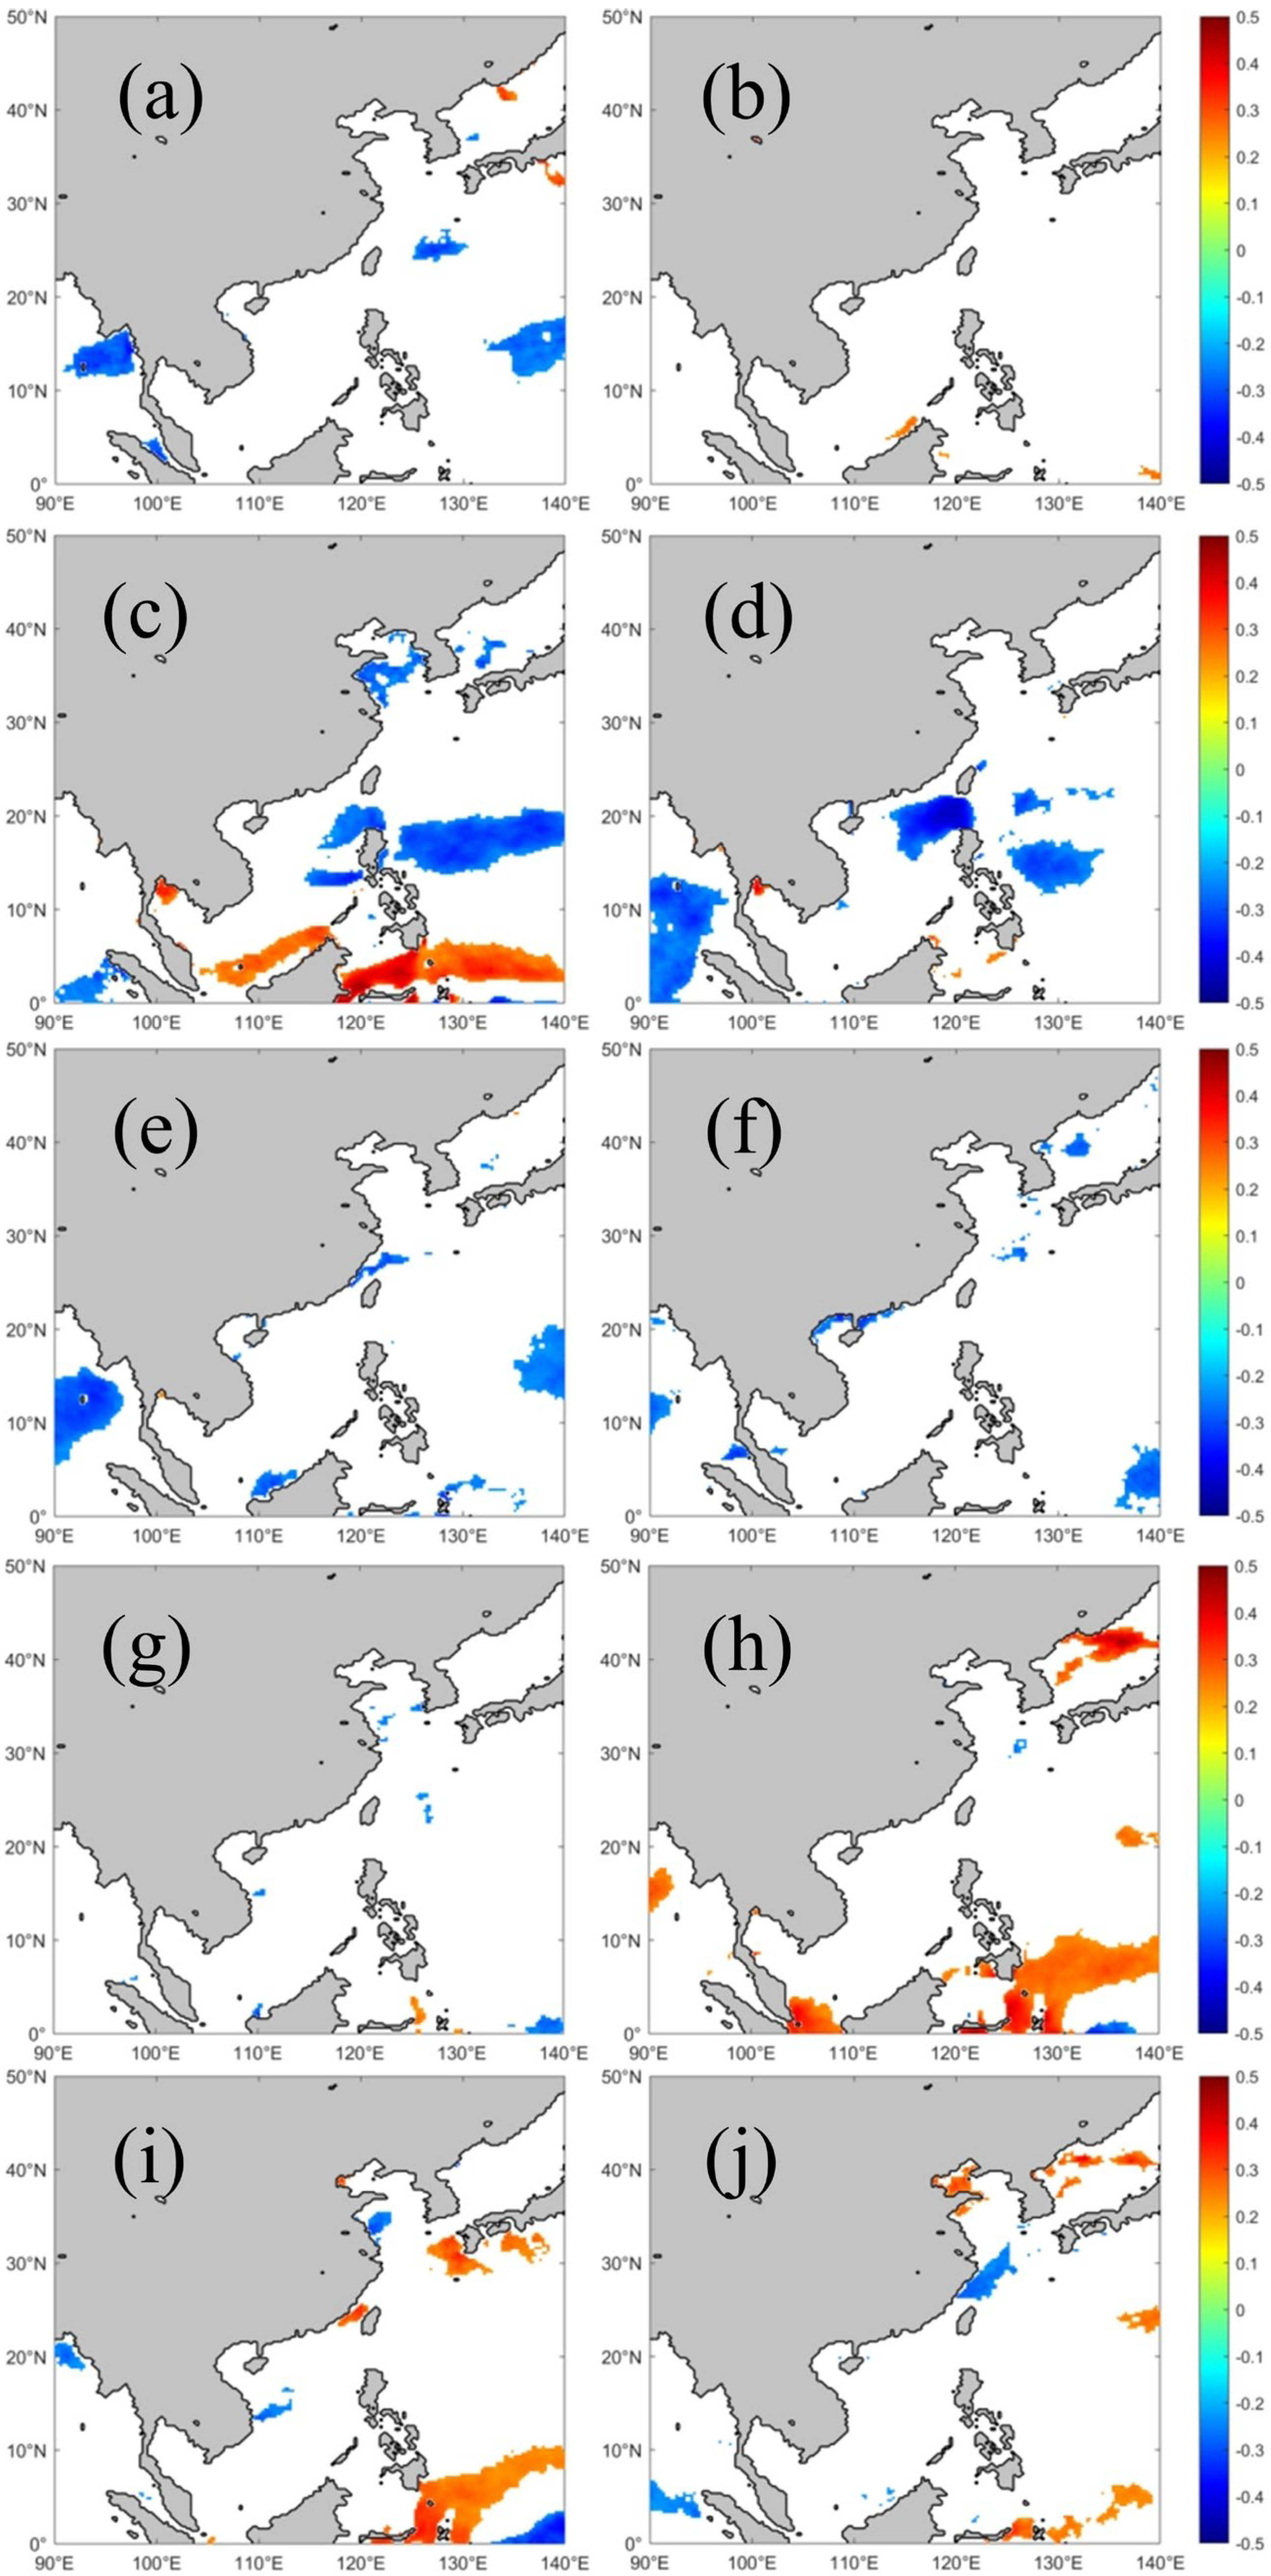
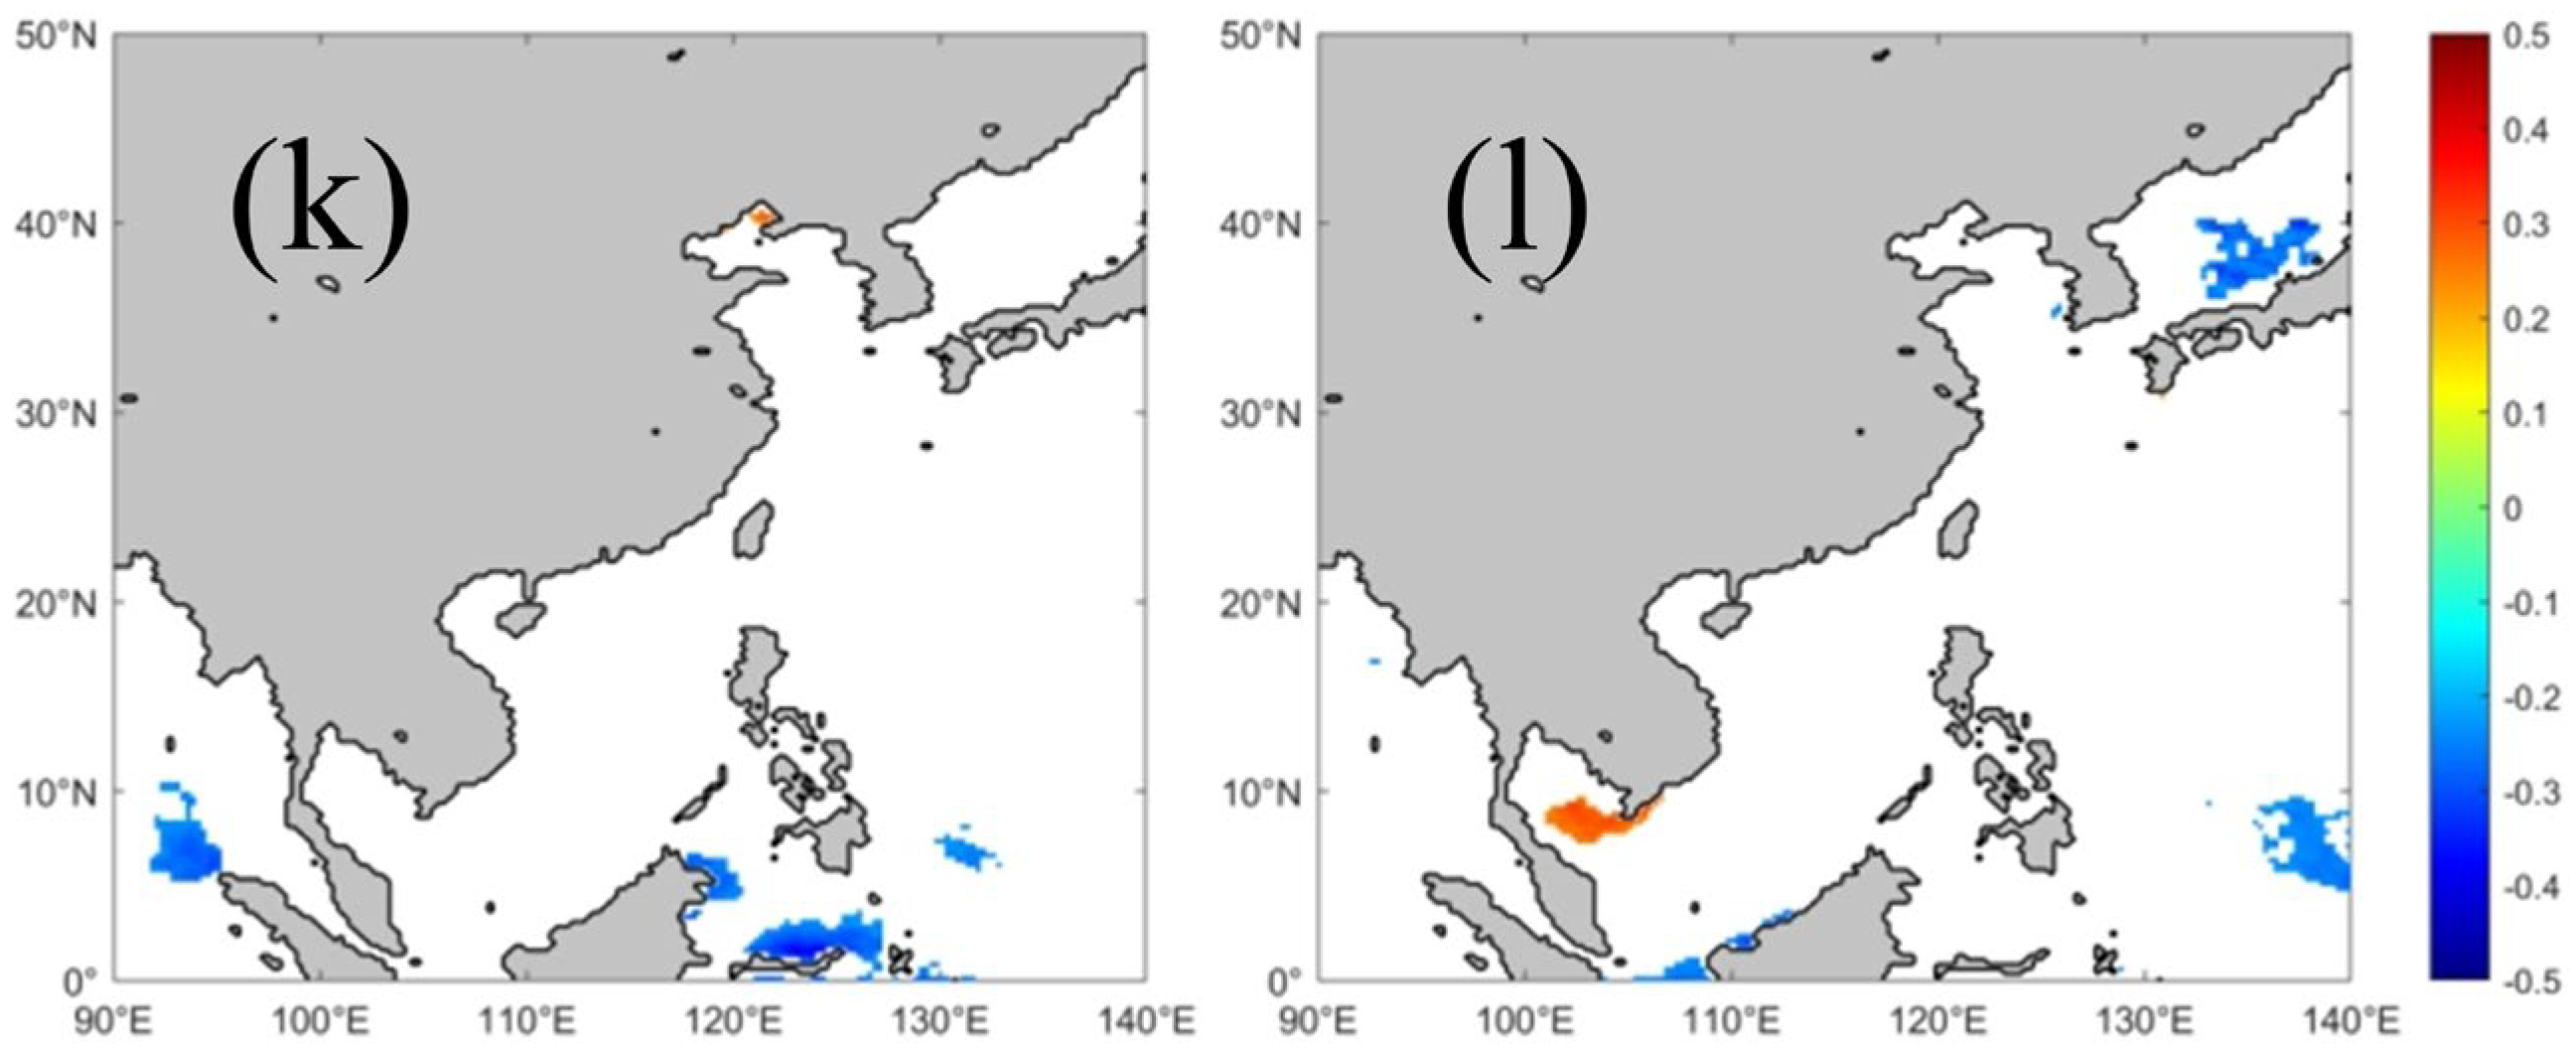
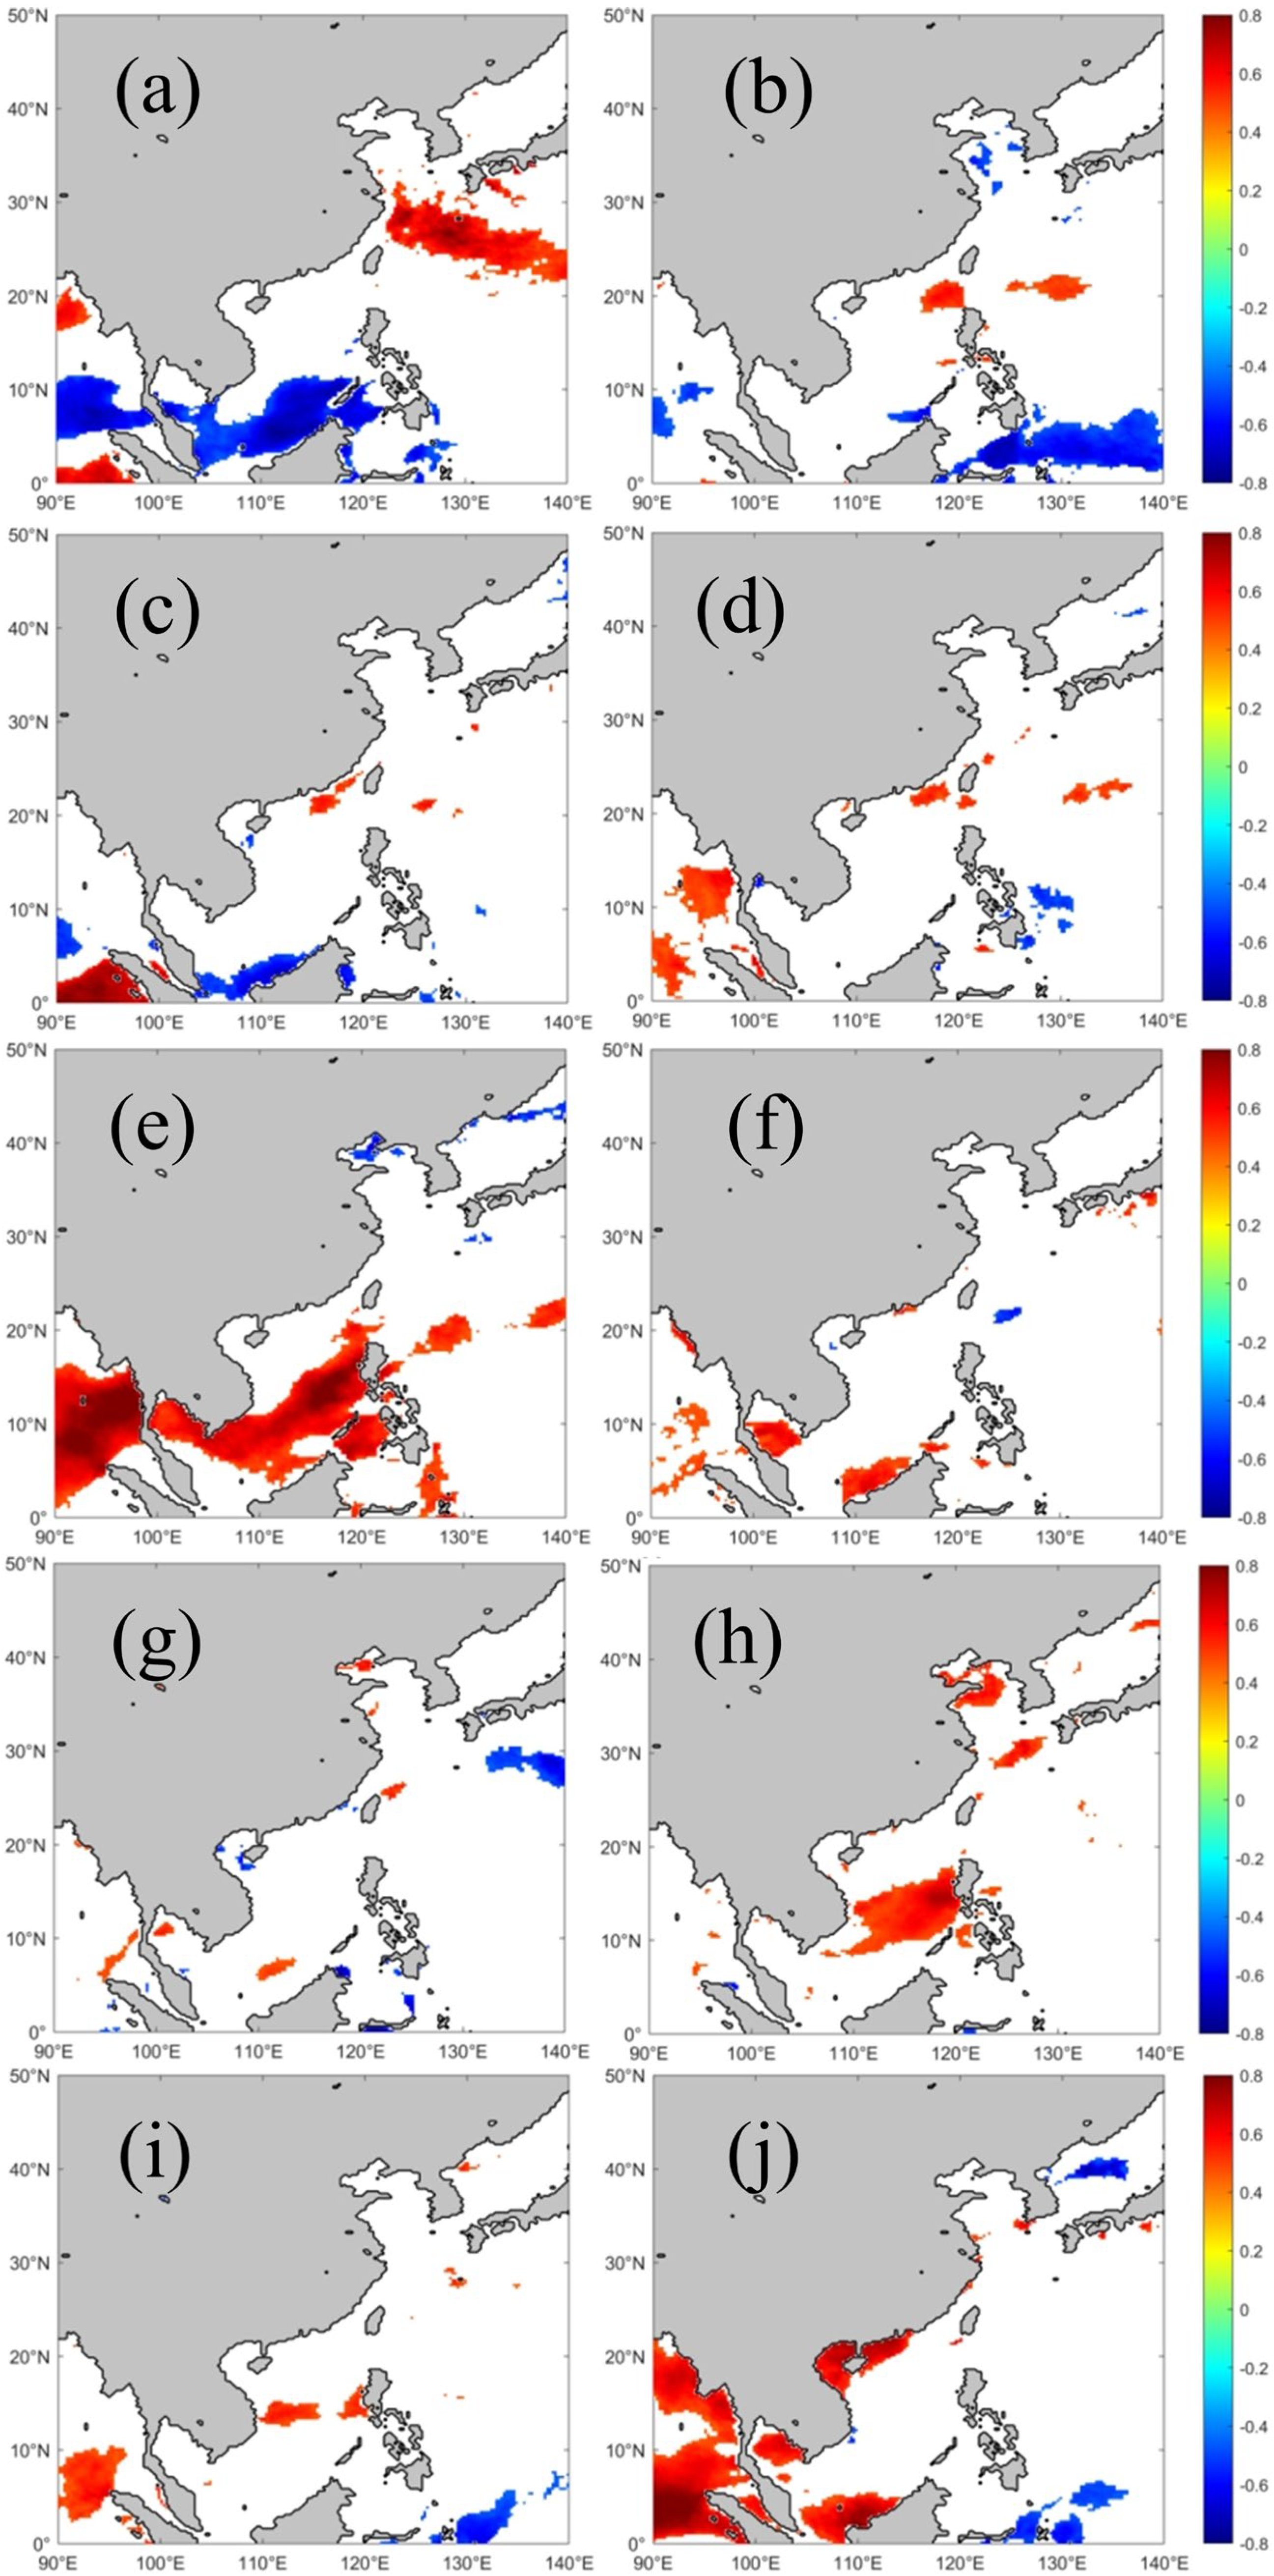
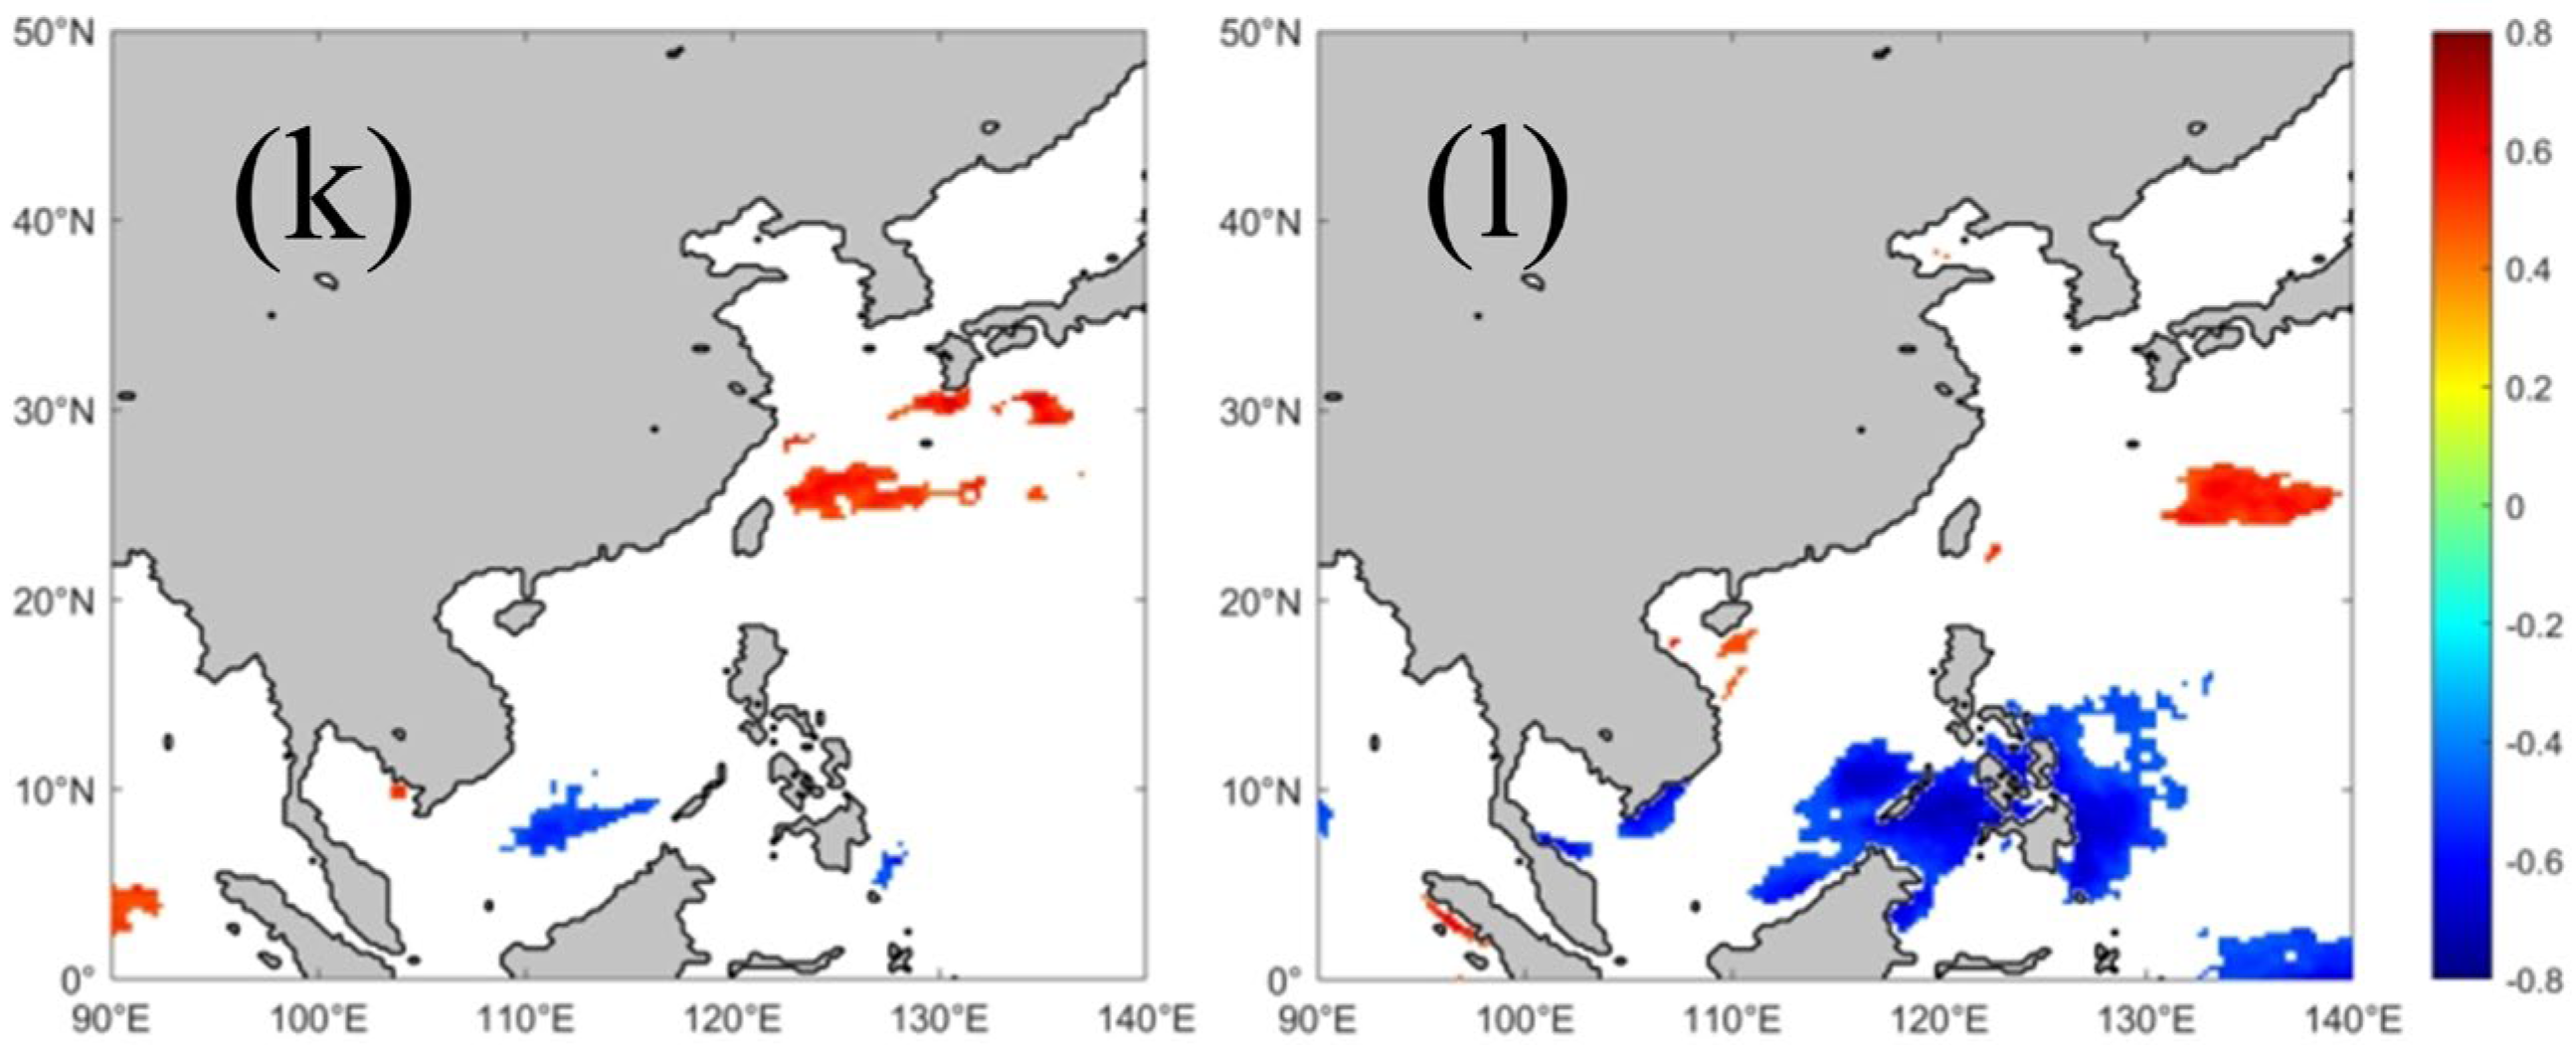
To investigate the climatic drivers, the Pearson correlation coefficients between EWSO and the five major climate indices (AMO, NINO3, SOI, PDO, and SAMI) for each 0.25° × 0.25° grid point from 1941 to 2020 in the China Seas and the adjacent waters were assessed at the 95% confidence level. The spatiotemporal distribution characteristics of the significant correlations between the annual EWSO and the five climate indices are shown in Figure 6. No statistically significant correlations exist between the annual averaged EWSO and any of the five climate indices. This indicates that the integrated climatic signals over a full year are too weak to dominate the strong interannual variability of EWSO. Therefore, when studying the correlations between EWSO and major climate indices, it is necessary to focus on typical months. The spatial patterns of significant monthly correlations, organized by climate index, are presented systematically in Figure 7, Figure 8, Figure 9, Figure 10 and Figure 11. Table 2 provides a concise summary, listing the key months and regions where EWSO exhibits statistically significant correlations with each climate index.

5.1. EWSO and AMO

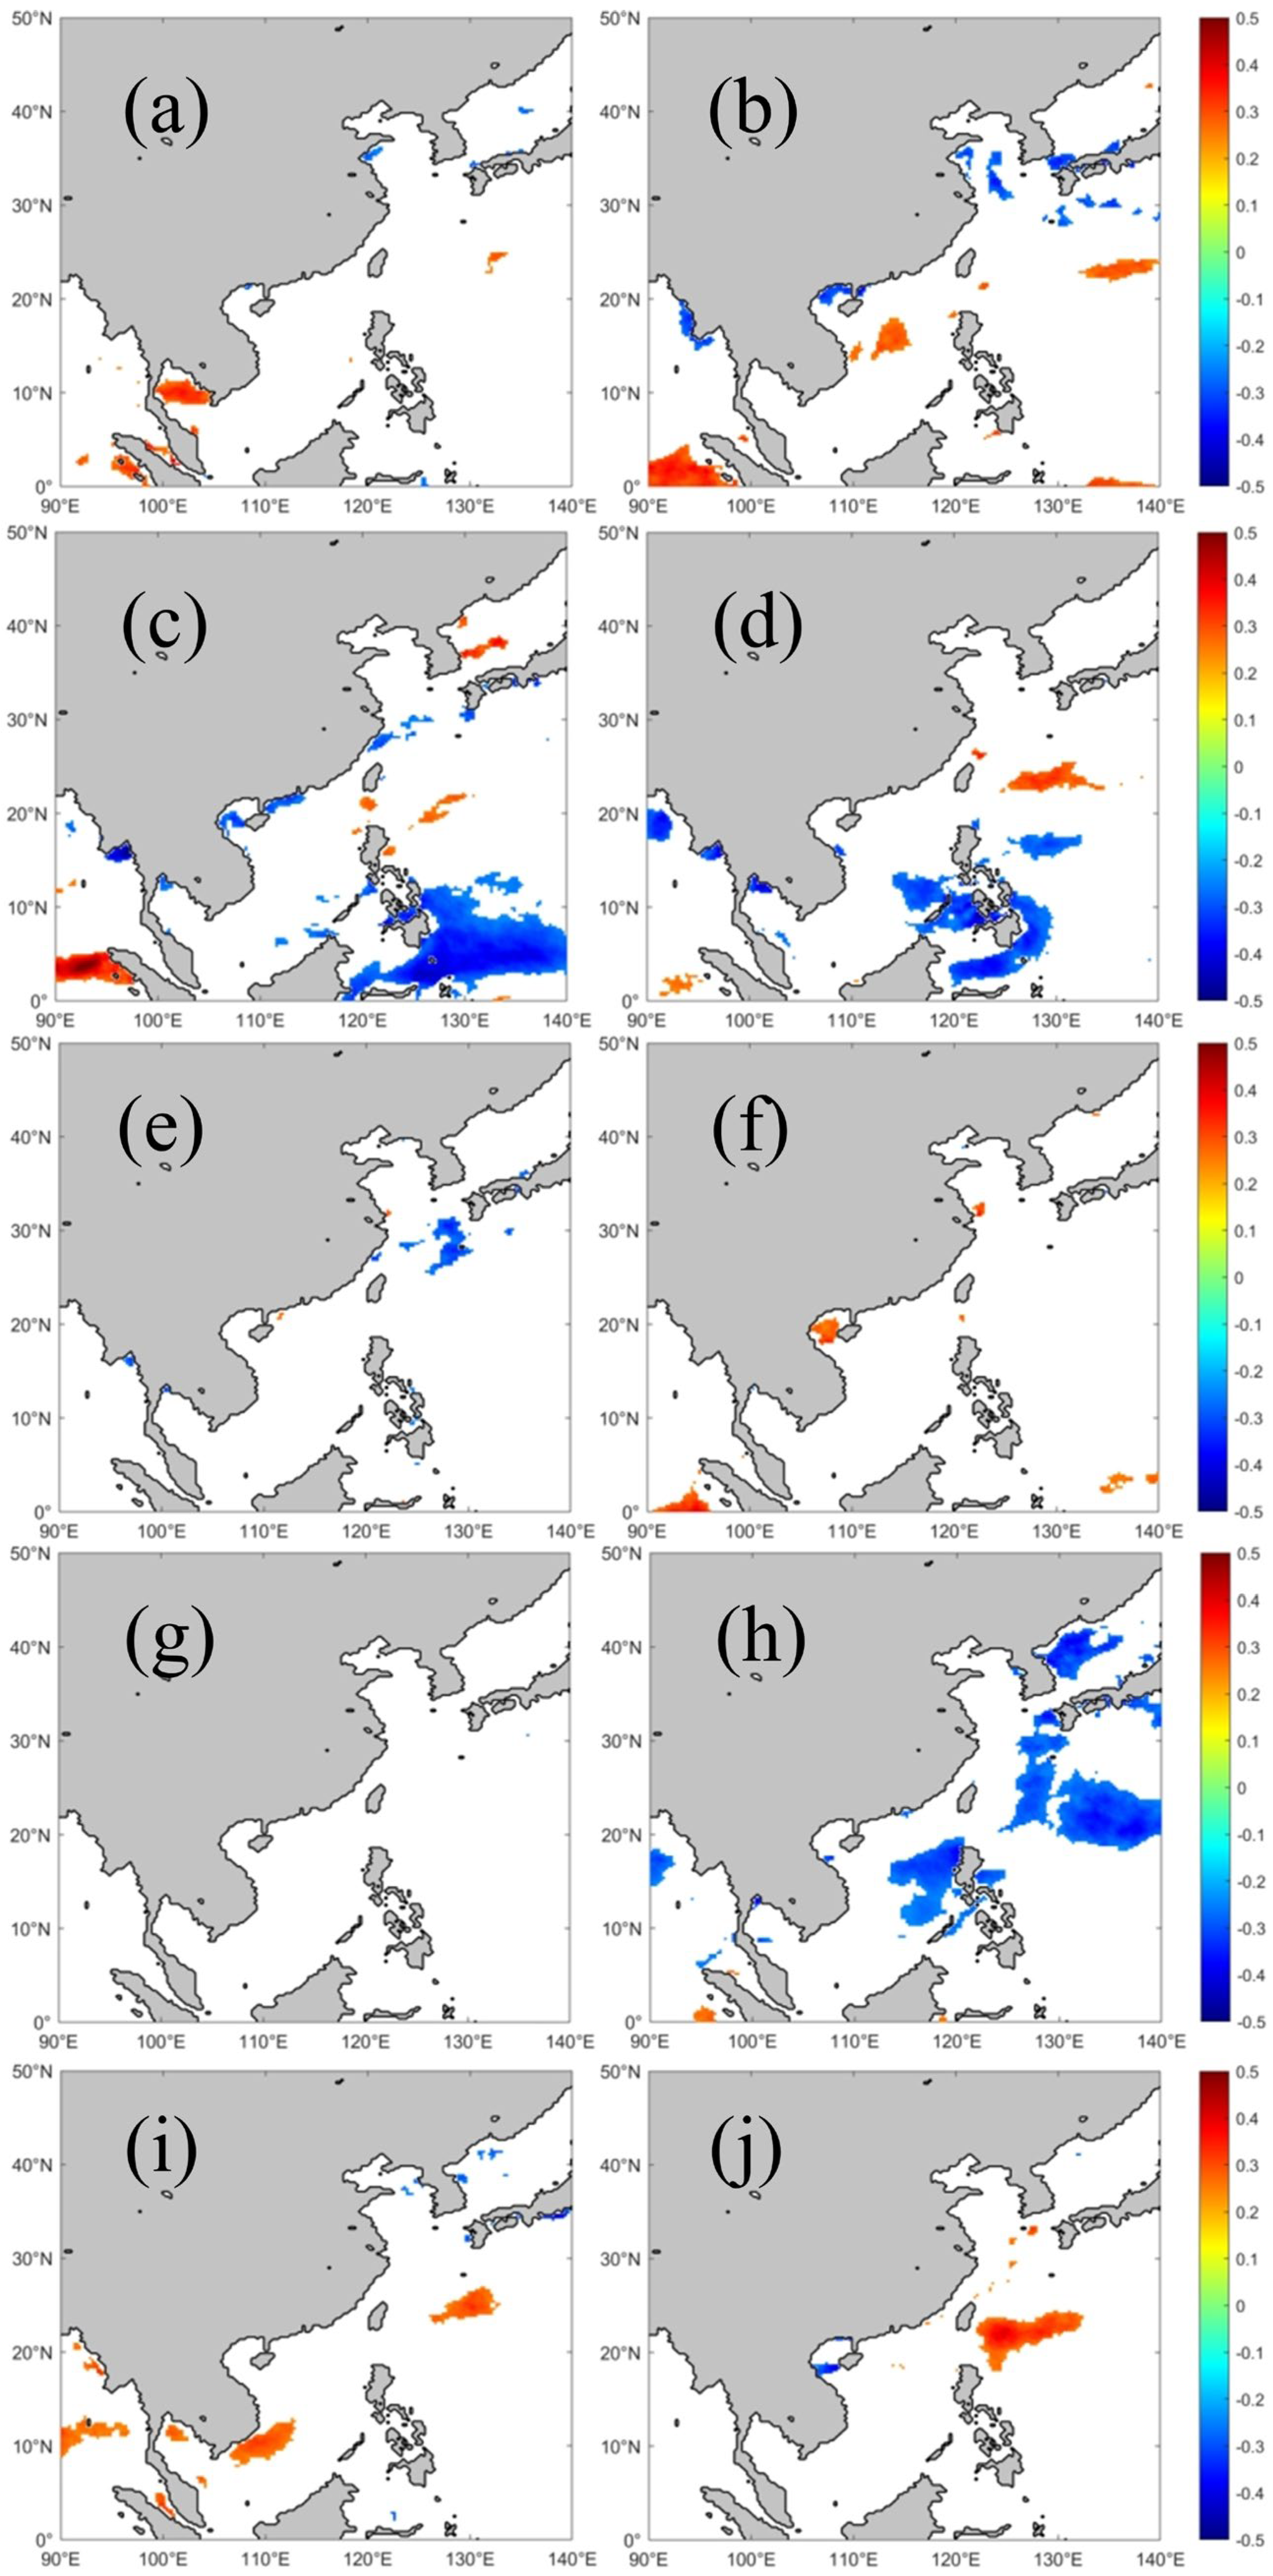
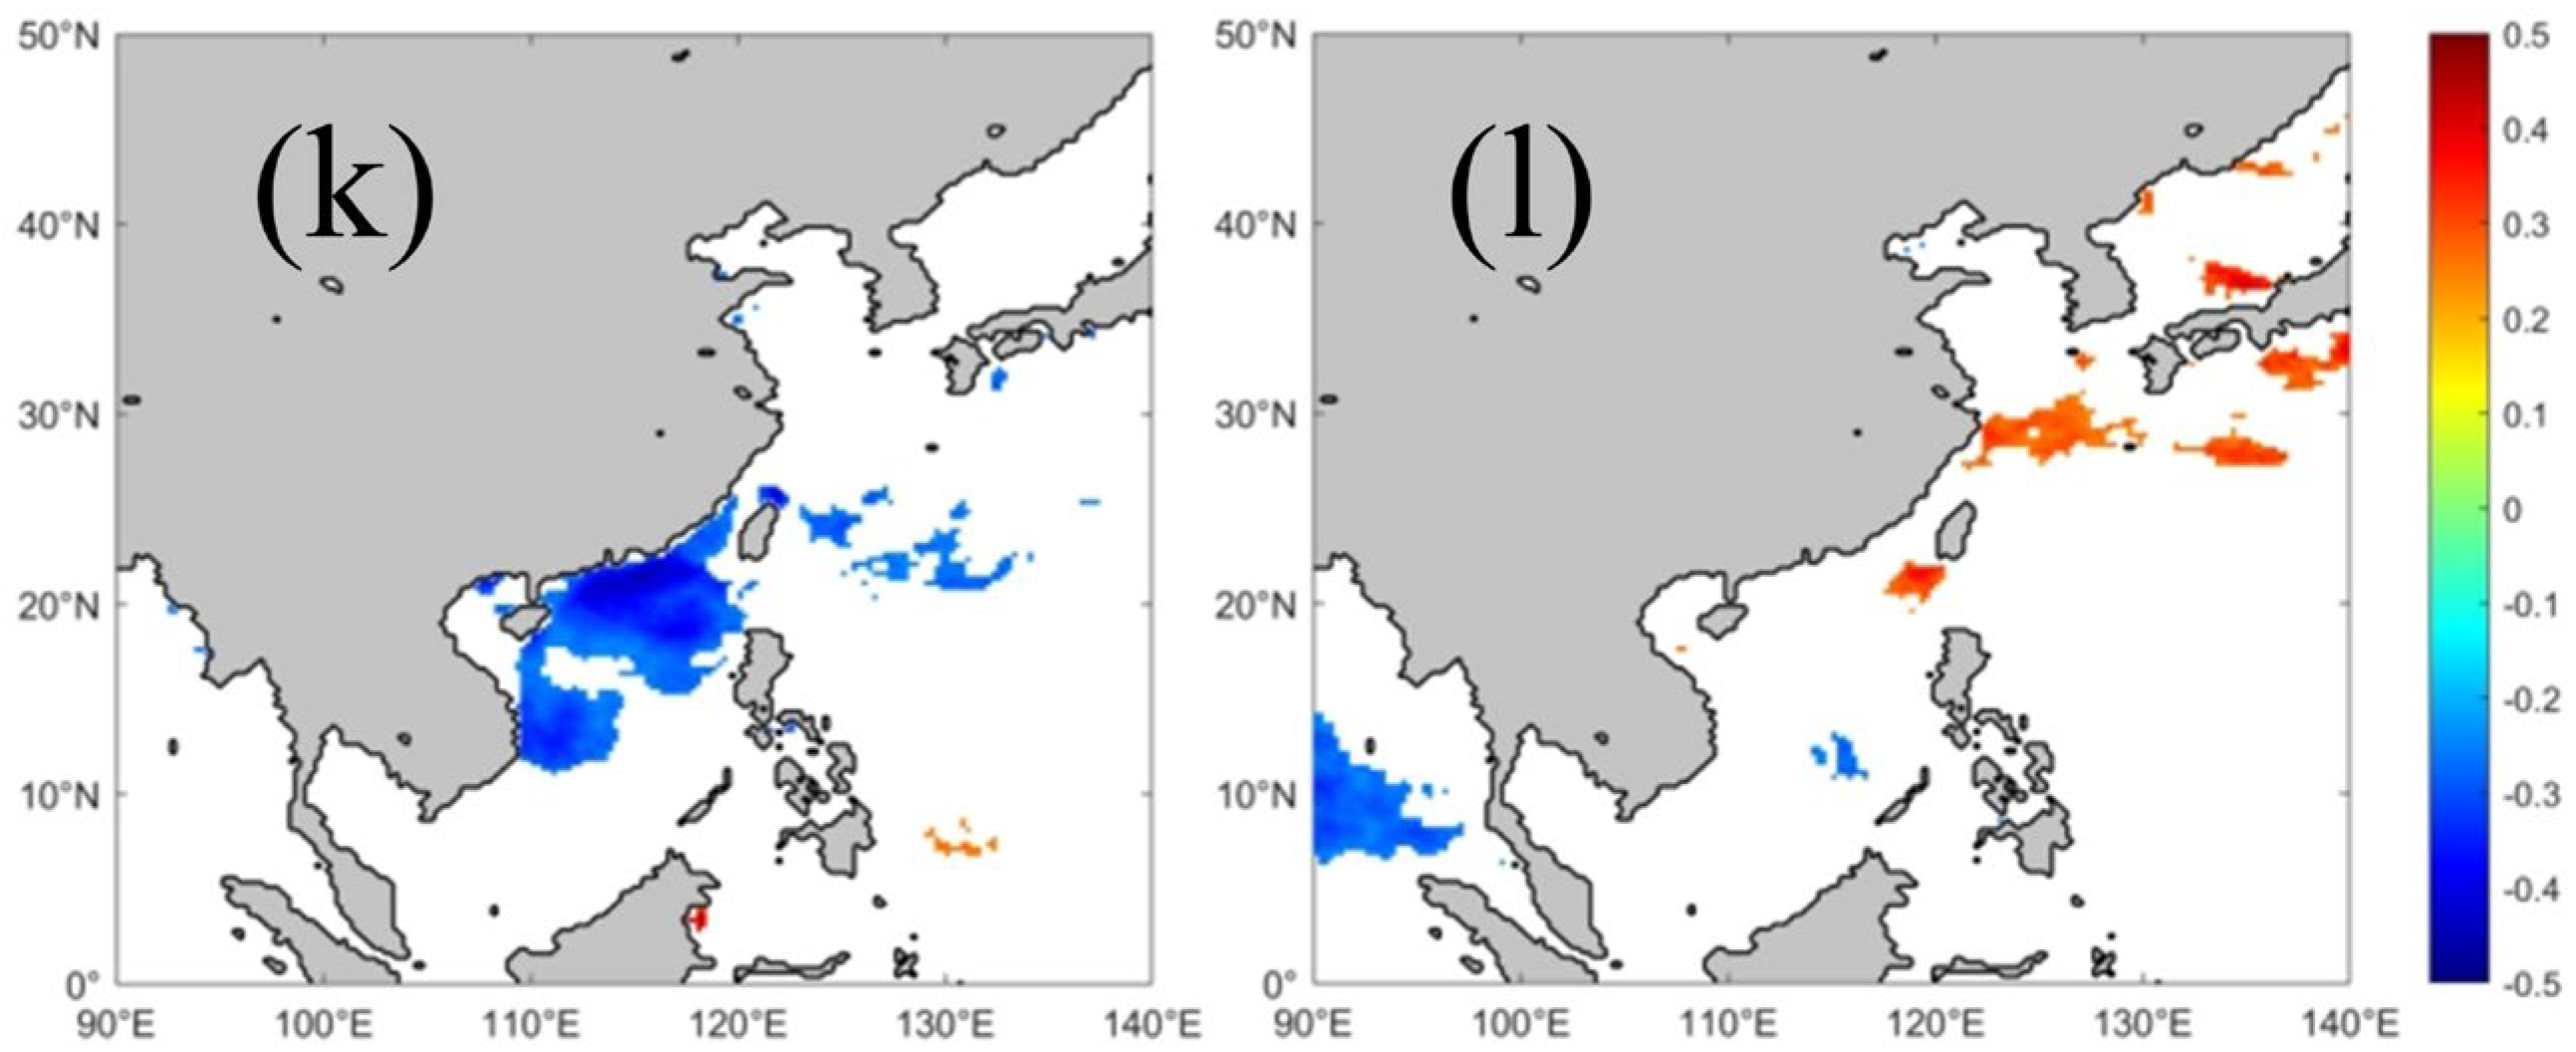
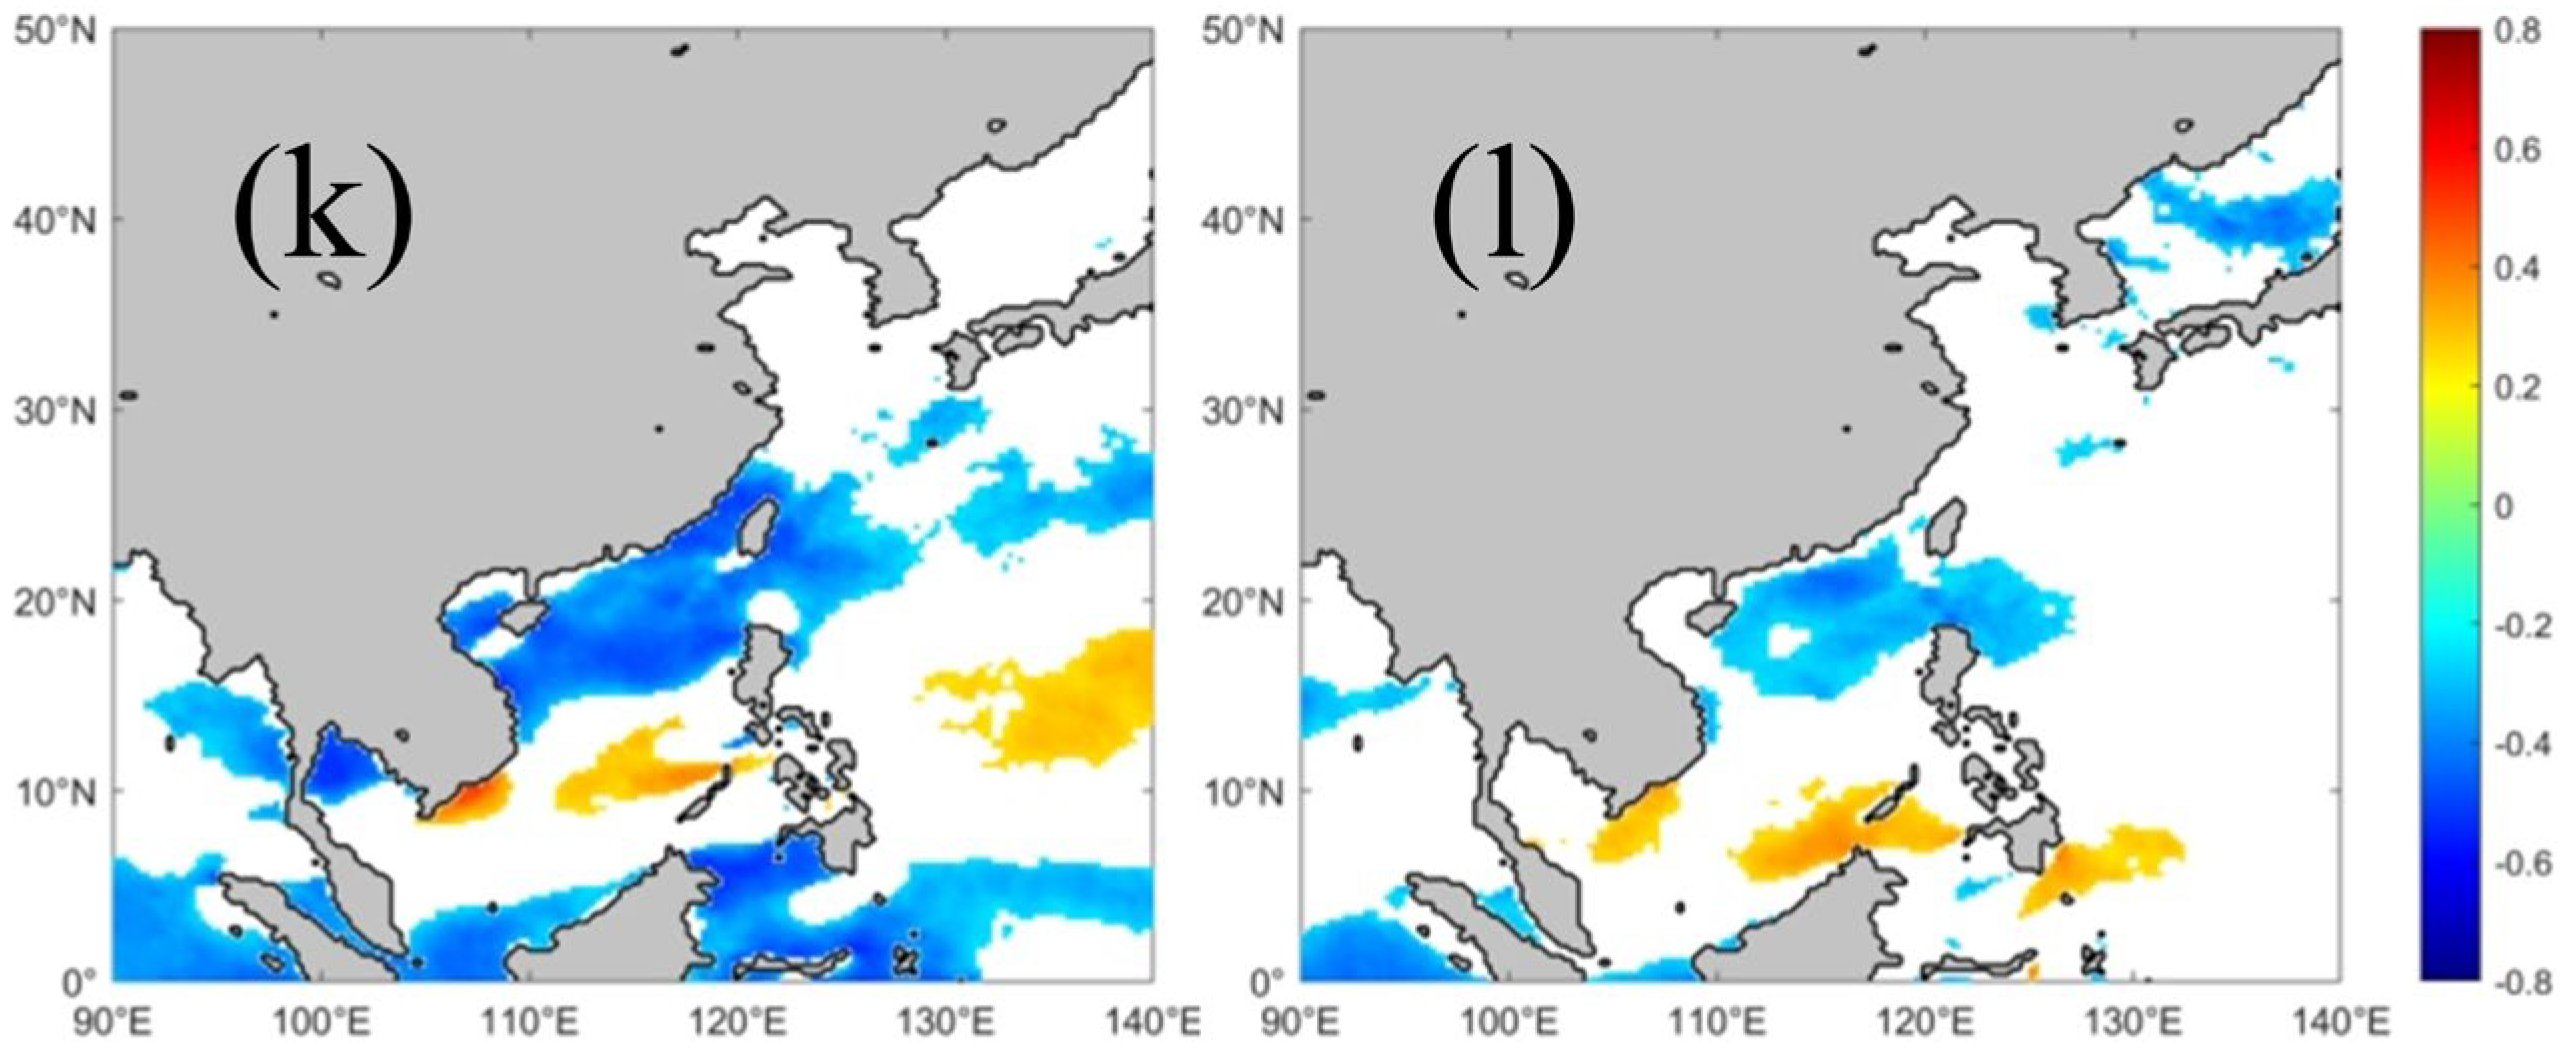
Figure 7 presents the regional distribution of the significant correlations between EWSO and AMO for January–December. As shown in Figure 7, the analysis indicates that AMO exhibits a predominantly significant negative correlation with EWSO. Such significant correlations are concentrated during seasonal transition periods (March–April, August and November). Spatially, AMO primarily affects the northern Nanhai Sea, the eastern Donghai Sea, and the Japan Sea. Among these, the strongest negative correlation is detected in the northern Nanhai in November, suggesting that wind energy availability in this region is sensitive to the phase of AMO.
As a multidecadal cold–warm oscillation with a period of 60–80 years, AMO modulates the intensity and position of the East Asian westerly jet stream by triggering teleconnection wave trains, thereby influencing the climate over the coastal waters of East Asia [36]. The correlation signals observed in this study are concentrated during seasonal transition periods, most likely because strong seasonal circulations such as the East Asian monsoon are in a state of intermittence or weakening during these intervals. This allows the circulation anomalies dominated by AMO to manifest more clearly, thus exerting a detectable impact on EWSO.

5.2. EWSO and NINO3

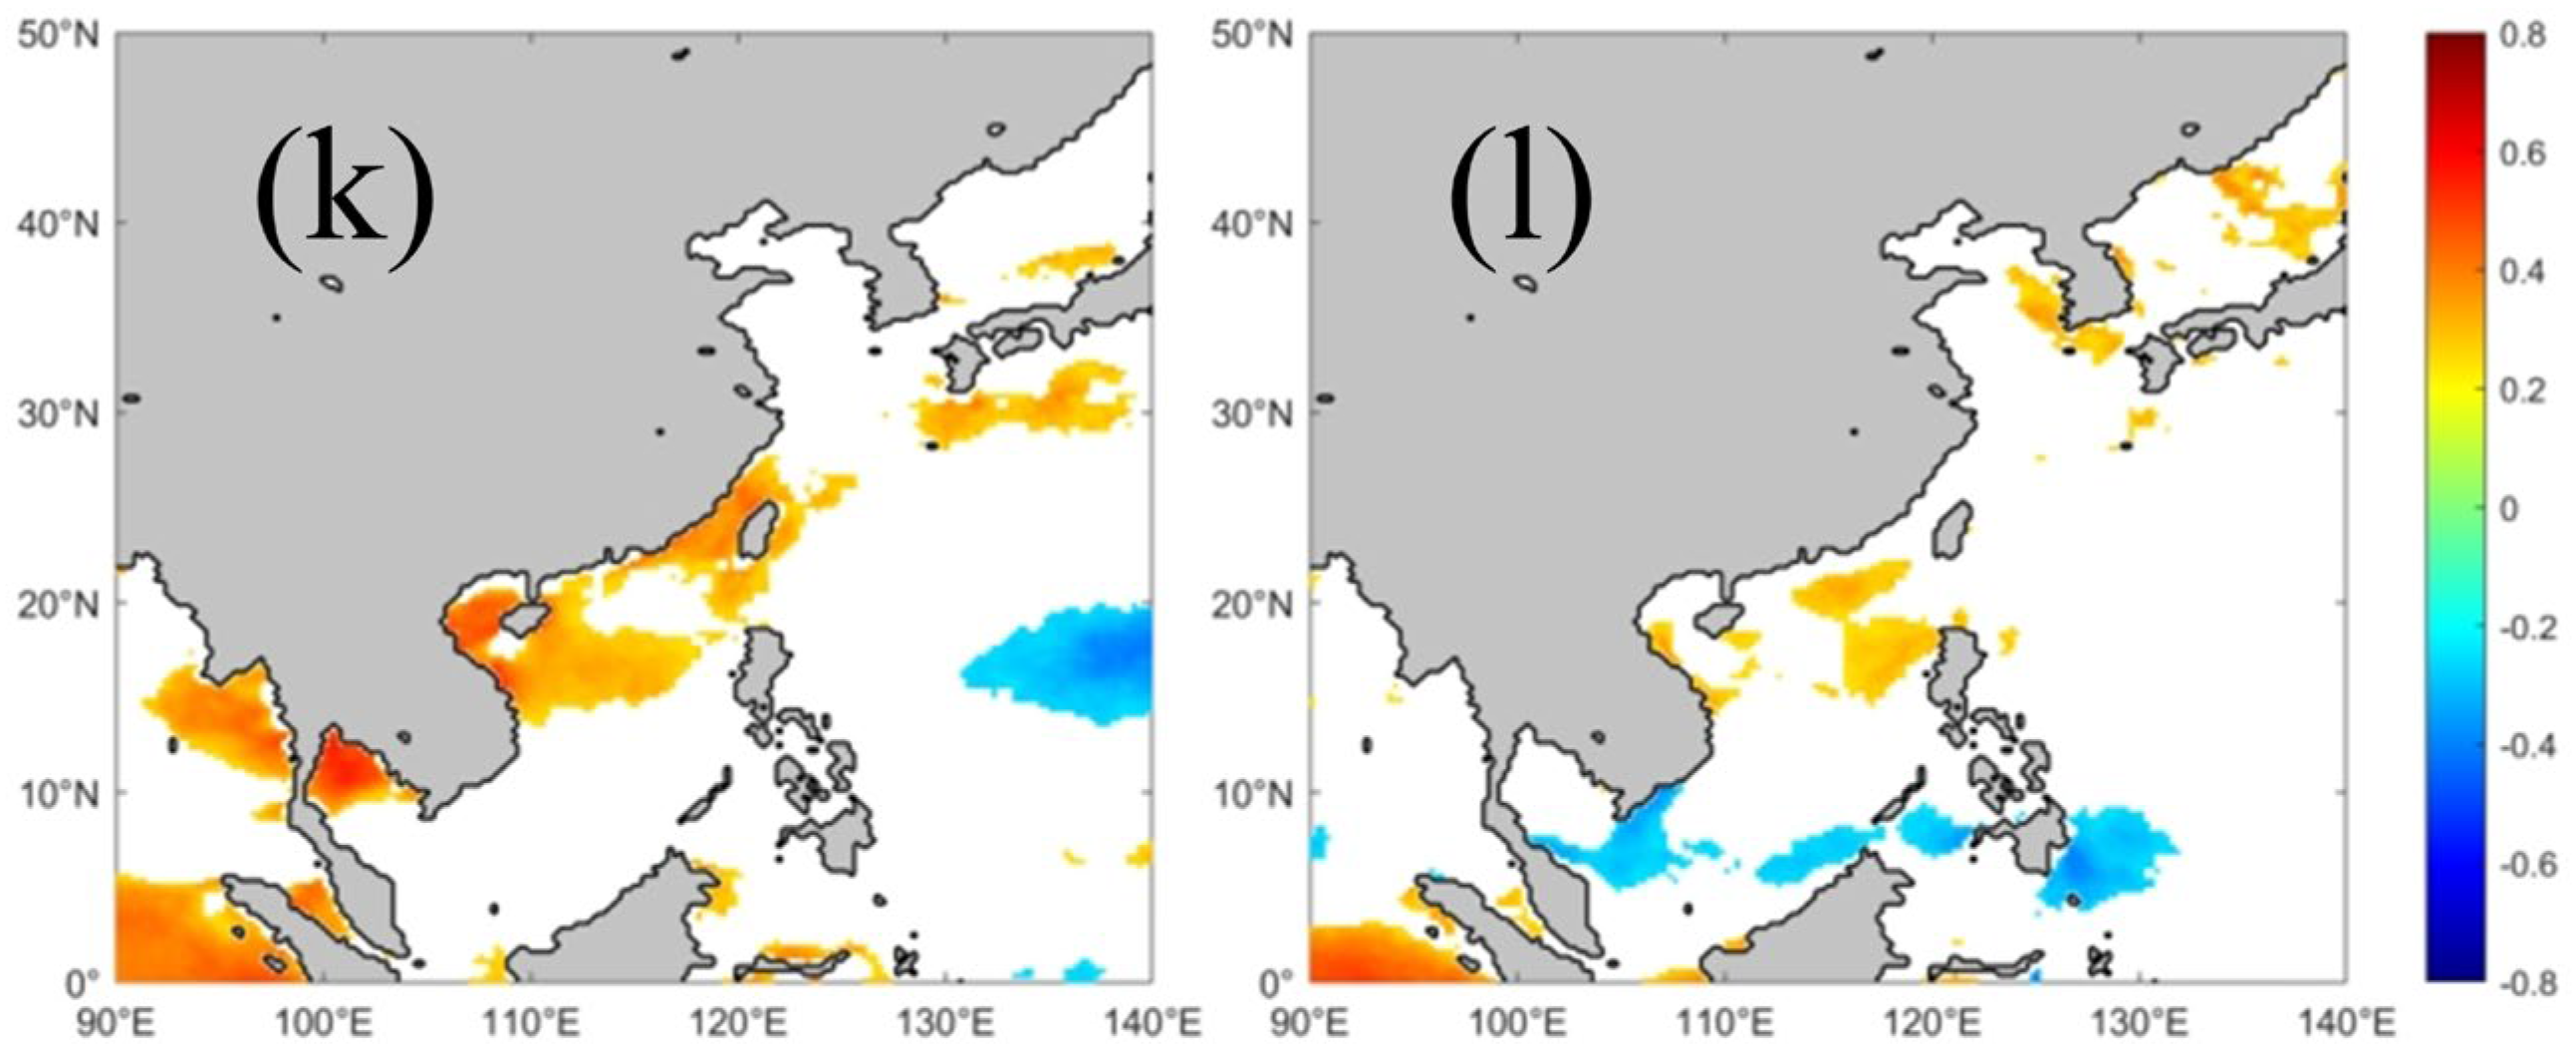
Figure 8 presents the regional distribution of the significant correlations between EWSO and NINO3 for January–December. As shown in Figure 8, the correlations between the monthly EWSO and NINO3 exhibited significant seasonal reversal characteristics. From December to April, significant negative correlations are present from the northern Nanhai to the Donghai Sea, while positive correlations dominate the central and southern Nanhai Sea. From July to September, the correlation shifts to uniformly significant positive correlations across the entire domain, with the most significant correlations detected in the waters east of the Philippines in September. From October to November, the correlation rapidly reverses to widespread significant negative correlations. These seasonally alternating teleconnection signals primarily originate from sea surface temperature anomalies in the western Pacific warm pool region, triggered by NINO3 anomalies [34]. By regulating teleconnection wave trains, including the Walker circulation, such anomalies further exert seasonal modulation on the East Asian monsoon and the western Pacific subtropical high, ultimately leading to alternating significant positive and negative responses of EWSO in sea areas at different latitudes [35].

5.3. EWSO and SOI

Figure 9 presents the regional distribution of the significant correlations between EWSO and SOI for January–December. As shown in Figure 9, seasonal reversal is observed, which is in opposite phase to the correlation pattern with NINO3. From December to April, significant positive correlations exist. The regions north of 10° N exhibit significant positive correlations, whereas the regions south of 10° N exhibit significant negative correlations. From June to September, negative coefficients strengthen and become dominant. From October to November, the pattern reverses again to widespread significant positive correlations, most pronounced in the Nanhai Sea.

5.4. EWSO and PDO

Figure 10 presents the regional distribution of the significant correlations between EWSO and PDO for January–December. As shown in Figure 10, the areas with significant correlations between the monthly EWSO and PDO are primarily distributed in offshore areas distant from the coast. In March, positive correlation coefficients are observed in the southern Nanhai Sea and the southern Philippine waters. From August to September, significant positive correlations exist in the southeastern Philippine waters. The distribution patterns of the significant correlation areas for the PDO during these periods align with those of NINO3, confirming the synergistic relationship between the PDO and ENSO proposed by Huang et al. [58]. During positive PDO phases, the ENSO events may exacerbate significant wind variations in the northern Pacific.

5.5. EWSO and SAMI

Figure 11 presents the regional distribution of the significant correlations between EWSO and SAMI for January–December. Figure 11 presents the regional distribution of the significant correlations between EWSO and SAMI for January–December. As shown in Figure 10, the significant correlations between the monthly EWSO and SAMI are predominantly distributed in the Nanhai Sea in January–March, May, August, October, and December. Although the areas with significant correlations are relatively small, they exhibit high-magnitude coefficients. In January, significant positive correlations exist in the Donghai Sea and adjacent waters, whereas significant negative correlations exist in the southern Nanhai Sea. In May, significant positive correlations exist in the southern Nanhai Sea. In August, significant positive correlations exist in the southern Nanhai Sea. In October, significant positive correlations exist in the northwestern Nanhai Sea and the nearshore waters of the southern Nanhai Sea. In December, significant negative correlations exist in the waters near the Philippines.

6. Conclusions and Prospects

Based on the high-resolution ERA5 reanalysis data from 1941 to 2020, this study systematically analyzed the evolution patterns of effective wind speed occurrence (EWSO) in the China Seas and adjacent waters from a climatic perspective for the first time. The main results are summarized as follows.
(1) There exist systematic discrepancies between the spatial distribution and seasonal evolution of EWSO and the characteristics of mean wind speed, indicating that wind energy availability is not entirely coupled with the seasonal distribution of wind field intensity. The phenomenon that high wind speed zones correspond to relatively low EWSO values suggests that relying solely on mean wind speed or wind power density (WPD) is insufficient to accurately assess wind energy availability. The probability distribution characteristics of wind speed are the key determinants of EWSO; therefore, future research needs to shift the focus from examining the average state of wind energy resources to analyzing their distribution characteristics.
(2) EWSO across the study area exhibited an overall significant increasing trend of 0.03%/yr, with pronounced regional disparities. Among these regions, the Yellow–Bohai Sea showed a significant decreasing trend, with a reduction rate of −0.25%/yr in summer. The interannual trends of monthly EWSO presented high variability, indicating that research on the evolution of wind energy resources at the climatic scale must rely on long-term time-series data to filter out the interference of high-frequency climatic fluctuations. The significant decreasing trend of EWSO in the Yellow–Bohai Sea stands in stark contrast to the overall increasing trend of EWSO across the entire study area, which serves as an important warning for offshore wind energy development. For future offshore wind energy development initiatives in the Yellow–Bohai Sea, it is imperative to fully account for the potential implications of this downward trend and accordingly implement scientific, rational planning and design.
(3) The interannual variability of EWSO is primarily regulated by large-scale climate oscillation modes such as ENSO, with distinct seasonal and spatial heterogeneities in such regulatory effects. These impacts stem from the physical mechanisms by which ENSO influences the East Asian climate: ENSO modulates the East Asian monsoon and subtropical high systems through atmospheric teleconnection processes by altering the thermal conditions and convective activities in the western Pacific warm pool, ultimately determining the wind speed probability distribution in China’s offshore waters and adjacent sea areas. It is through this physical impact chain that the response of EWSO to ENSO exhibits seasonal differences. The quantitative analysis results of this study provide empirical evidence from the perspective of wind energy availability for the teleconnection effects of climate oscillations such as ENSO on the East Asian climate. The established quantitative relationships between EWSO in key sea areas and major climate indices can be directly applied as the basis for seasonal wind energy availability prediction models, thereby offering crucial data support for the advancement of wind energy climate forecasting technologies.
This study has several limitations. First, the conclusions rely on ERA5 reanalysis data, and using 10 m wind speed to represent wind speed at the wind turbine hub height may introduce errors. Future research should integrate satellite observations, buoy data, and high-resolution atmospheric boundary layer simulation data for verification. Second, the threshold setting of EWSO is based on the relevant schemes proposed by previous researchers; the optimal thresholds for specific turbine models and their impacts require further analysis. Third, this study has only revealed the statistical correlations between EWSO and climate indices. It is necessary to clarify the underlying dynamic mechanisms in future studies.

Author Contributions

Conceptualization, Q.L.; Validation, F.Z.; Formal analysis, R.S.; Investigation, Y.L. and R.S.; Resources, L.W.; Writing—original draft, Y.L.; Writing—review & editing, F.Z., Z.Q. and L.W.; Visualization, Y.L. and Z.Q.; Supervision, Q.L.; Project administration, Q.L. and L.W. All authors have read and agreed to the published version of the manuscript.

Funding

This work was supported by the open fund project of Shandong Provincial Key Laboratory of Ocean Engineering, Ocean University of China (No. kloe201901), and the Open Research Fund of State Key Laboratory of Estuarine and Coastal Research (Grant number SKLEC-KF201707).

Data Availability Statement

The original contributions presented in this study are included in the article. Further inquiries can be directed to the corresponding author.

Acknowledgments

The authors would also like to thank the ECMWF, NOAA and NCAR for providing the data, accessed on 1 December 2022.

Conflicts of Interest

The authors declare no conflict of interest.

Nomenclature

AbbreviationsDefinitions
4DVarFour-Dimensional Variational Assimilation Technique
AMOAtlantic Multidecadal Oscillation
ECMWFEuropean Centre for Medium-Range Weather Forecasts
ENSOEl Niño-Southern Oscillation
EWSOEffective Wind Speed Occurrence
ERA5The Fifth-Generation Global Atmospheric Reanalysis Dataset
GWECGlobal Wind Energy Council
IEAInternational Energy Agency
NCEIUnited States National Centers for Environmental Information
NCARNational Center for Atmospheric Research
NINO3Niño 3 Index
NOAANational Oceanic and Atmospheric Administration
OLSOrdinary Least Squares
PDOPacific Decadal Oscillation
PSLPhysical Sciences Laboratory
RMIRocky Mountain Institute
SAMSouth Asian Monsoon
SAMISouth Asian Monsoon Index
SOISouthern Oscillation Index
WPDWind Power Density
Greek SymbolsDefinitions
β0Intercept term of the linear trend model
β1Slope term of the linear trend model
εₜResidual term of the linear trend model
rPearson correlation coefficient
SubscriptsDefinitions
U 850 Zonal wind speed on the 850 hPa isobaric surface
U 200 Zonal wind speed on the 200 hPa isobaric surface
u10Eastward horizontal velocity at the 10 m altitude
v10Northward horizontal velocity at the 10 m altitude
Y t EWSO time series (t denotes the time index, t = 1,2, …, T)
X t Climate index time series (t denotes the time index)
t 1 Frequency of wind speeds ranging from 5 m/s to 25 m/s
SuperscriptsDefinitions
u ¯ 2 Square of the average value of the 10 m u-component wind
v ¯ 2 Square of the average value of the 10 m v-component wind

References

  1. International Energy Agency (IEA). World Energy Outlook 2024; IEA: Paris, France, 2025; Available online: https://www.iea.org/reports/world-energy-outlook-2024 (accessed on 30 November 2025).
  2. Esteban, M.D.; Diez, J.J.; López, J.S.; Negro, V. Why Offshore Wind Energy? Renew. Energy 2011, 36, 444–450. [Google Scholar] [CrossRef] [Scilit]
  3. Choti, J.; Xydis, G. Harnessing Offshore Wind Energy in East Africa: The next Big Move to Lighting up the Continent. Proc. Inst. Civ. Eng. Civ. Eng. 2022, 175, 31–38. [Google Scholar] [CrossRef] [Scilit]
  4. Jeffrey, H.; Jay, B.; Winskel, M. Accelerating the Development of Marine Energy: Exploring the Prospects, Benefits and Challenges. Technol. Forecast. Soc. Change 2013, 80, 1306–1316. [Google Scholar] [CrossRef] [Scilit]
  5. Zheng, C.W.; Pan, J. Assessment of the Global Ocean Wind Energy Resource. Renew. Sustain. Energy Rev. 2014, 33, 382–391. [Google Scholar] [CrossRef] [Scilit]
  6. Tumse, S.; Bilgili, M.; Yildirim, A.; Sahin, B. Comparative Analysis of Global Onshore and Offshore Wind Energy Characteristics and Potentials. Sustainability 2024, 16, 6614. [Google Scholar] [CrossRef] [Scilit]
  7. Li, Y.; Huang, X.; Tee, K.F.; Li, Q.; Wu, X.-P. Comparative Study of Onshore and Offshore Wind Characteristics and Wind Energy Potentials: A Case Study for Southeast Coastal Region of China. Sustain. Energy Technol. Assess. 2020, 39, 100711. [Google Scholar] [CrossRef] [Scilit]
  8. Enevoldsen, P.; Xydis, G. Examining the Trends of 35 Years Growth of Key Wind Turbine Components. Energy Sustain. Dev. 2019, 50, 18–26. [Google Scholar] [CrossRef] [Scilit]
  9. RMI. 2025 China Power Market Outlook: 10 Key Trends for Market Players; Rocky Mountain Institute: Beijing, China, 2025; Available online: https://rmi.org.cn/insights/2025powermarketreviewandoutlook/ (accessed on 30 November 2025).
  10. Zheng, C. Macro-and microscale classifications of wind energy in the 21st Century Maritime Silk Road. J. Harbin Eng. Univ. 2024, 45, 1258–1265. (In Chinese) [Google Scholar]
  11. Zheng, C. A Positive Trend in the Stability of Global Offshore Wind Energy. Acta Oceanol. Sin. 2024, 43, 123–134. [Google Scholar] [CrossRef] [Scilit]
  12. Global Wind Energy Council (GWEC). Global Wind Report 2025; GWEC: Hanoi, Vietnam, 2025. [Google Scholar]
  13. de Castro, M.; Costoya, X.; Salvador, S.; Carvalho, D.; Gómez-Gesteira, M.; Sanz-Larruga, F.J.; Gimeno, L. An Overview of Offshore Wind Energy Resources in Europe under Present and Future Climate. Ann. N.Y. Acad. Sci. 2019, 1436, 70–97. [Google Scholar] [CrossRef] [Scilit]
  14. Diaconita, A.I.; Andrei, G.; Rusu, L. An Overview of the Offshore Wind Energy Potential for Twelve Significant Geographical Locations across the Globe. Energy Rep. 2022, 8, 194–201. [Google Scholar] [CrossRef] [Scilit]
  15. Zheng, C.; Li, X.; Luo, X.; Chen, X.; Qian, Y.; Zhang, Z.; Gao, Z.; Du, Z.; Gao, Y.; Chen, Y. Projection of Future Global Offshore Wind Energy Resources Using CMIP Data. Atmos.-Ocean. 2019, 57, 134–148. [Google Scholar] [CrossRef] [Scilit]
  16. Soukissian, T.; Denaxa, D.; Karathanasi, F.; Prospathopoulos, A.; Sarantakos, K.; Iona, A.; Georgantas, K.; Mavrakos, S. Marine Renewable Energy in the Mediterranean Sea: Status and Perspectives. Energies 2017, 10, 1512. [Google Scholar] [CrossRef] [Scilit]
  17. Zheng, C.; Xiao, Z.; Peng, Y.; Li, C.; Du, Z. Rezoning Global Offshore Wind Energy Resources. Renew. Energy 2018, 129, 1–11. [Google Scholar] [CrossRef] [Scilit]
  18. Wen, Y.; Kamranzad, B.; Lin, P. Assessment of Long-Term Offshore Wind Energy Potential in the South and Southeast Coasts of China Based on a 55-Year Dataset. Energy 2021, 224, 120225. [Google Scholar] [CrossRef] [Scilit]
  19. Zheng, C.; Yi, C.; Shen, C.; Yu, D.; Wang, X.; Wang, Y.; Zhang, W.; Wei, Y.; Chen, Y.; Li, W.; et al. A Positive Climatic Trend in the Global Offshore Wind Power. Front. Energy Res. 2022, 10, 867642. [Google Scholar] [CrossRef] [Scilit]
  20. Zhang, S.; Li, X. Future Projections of Offshore Wind Energy Resources in China Using CMIP6 Simulations and a Deep Learning-Based Downscaling Method. Energy 2021, 217, 119321. [Google Scholar] [CrossRef] [Scilit]
  21. Martinez, A.; Murphy, L.; Iglesias, G. Evolution of Offshore Wind Resources in Northern Europe under Climate Change. Energy 2023, 269, 126655. [Google Scholar] [CrossRef] [Scilit]
  22. Martinez, A.; Iglesias, G. Climate-Change Impacts on Offshore Wind Resources in the Mediterranean Sea. Energy Convers. Manag. 2023, 291, 117231. [Google Scholar] [CrossRef] [Scilit]
  23. Carreno-Madinabeitia, S.; Ibarra-Berastegi, G.; Sáenz, J.; Ulazia, A. Long-Term Changes in Offshore Wind Power Density and Wind Turbine Capacity Factor in the Iberian Peninsula (1900–2010). Energy 2021, 226, 120364. [Google Scholar] [CrossRef] [Scilit]
  24. Xu, Q.; Li, Y.; Cheng, Y.; Ye, X.; Zhang, Z. Impacts of Climate Oscillation on Offshore Wind Resources in China Seas. Remote Sensing 2022, 14, 1879. [Google Scholar] [CrossRef] [Scilit]
  25. Hamlington, B.D.; Hamlington, P.E.; Collins, S.G.; Alexander, S.R.; Kim, K.-Y. Effects of Climate Oscillations on Wind Resource Variability in the United States. Geophys. Res. Lett. 2015, 42, 145–152. [Google Scholar] [CrossRef] [Scilit]
  26. Shen, R.-Z.; Yi, C.-T.; Liu, Y.-N.; Wang, L.; Wu, K.; Chen, M.-Y.; Zheng, C.-W. The Spatial–Temporal Characteristics of Wave Energy Resource Availability in the China Seas. JMSE 2025, 13, 1042. [Google Scholar] [CrossRef] [Scilit]
  27. Yang, H.-S.; Alkhabbaz, A.; Lee, Y.-H. Toward Reliable FOWT Modeling: A New Calibration Approach for Extreme Environmental Loads. Energies 2025, 18, 5545. [Google Scholar] [CrossRef] [Scilit]
  28. Soares-Ramos, E.P.P.; De Oliveira-Assis, L.; Sarrias-Mena, R.; Fernández-Ramírez, L.M. Current Status and Future Trends of Offshore Wind Power in Europe. Energy 2020, 202, 117787. [Google Scholar] [CrossRef] [Scilit]
  29. Wu, X.; Hu, Y.; Li, Y.; Yang, J.; Duan, L.; Wang, T.; Adcock, T.; Jiang, Z.; Gao, Z.; Lin, Z.; et al. Foundations of Offshore Wind Turbines: A Review. Renew. Sustain. Energy Rev. 2019, 104, 379–393. [Google Scholar] [CrossRef] [Scilit]
  30. Hamzah, H.; Alkhabbaz, A.; Koprulu, A.; Jasim, L.M.; Alzubaidi, I.K.; Yaseen, A.H.; Yang, H.-S.; Lee, Y.-H. Integrated CFD and ANN Approach for Predicting Blade Deformation and Aerodynamic Response. Wind 2025, 5, 33. [Google Scholar] [CrossRef] [Scilit]
  31. Yang, H.-S.; Alkhabbaz, A.; Lee, Y.-H. Integrated CFD and Hydrodynamic Correction Approach for Load Response Analysis of Floating Offshore Wind Turbine. Ocean. Eng. 2025, 328, 121007. [Google Scholar] [CrossRef] [Scilit]
  32. Alkhabbaz, A.; Hamzah, H.; Hamdoon, O.M.; Yang, H.-S.; Easa, H.; Lee, Y.-H. A Unique Design of a Hybrid Wave Energy Converter. Renew. Energy 2025, 245, 122814. [Google Scholar] [CrossRef] [Scilit]
  33. McPhaden, M.J.; Zebiak, S.E.; Glantz, M.H. ENSO as an Integrating Concept in Earth Science. Science 2006, 314, 1740–1745. [Google Scholar] [CrossRef] [Scilit]
  34. Alizadeh, O. A Review of ENSO Teleconnections at Present and under Future Global Warming. WIREs Clim. Change 2024, 15, e861. [Google Scholar] [CrossRef] [Scilit]
  35. Wang, B.; An, S. A Mechanism for Decadal Changes of ENSO Behavior: Roles of Background Wind Changes. Clim. Dyn. 2002, 18, 475–486. [Google Scholar] [CrossRef] [Scilit]
  36. Luo, N.; Ding, R. The Impact of the AMO on Wintertime Surface Wind Speed Reversal in Northeast Asia. Environ. Res. Lett. 2025, 20, 014068. [Google Scholar] [CrossRef] [Scilit]
  37. Naoto, I.; Kobashi, F.; Kawai, Y. Variations in the Central Mode Water in the North Pacific as a Manifestation of the Pacific Decadal Oscillation. J. Oceanogr. 2024, 80, 251–272. [Google Scholar] [CrossRef] [Scilit]
  38. Deng, K.; Azorin-Molina, C.; Minola, L.; Zhang, G.; Chen, D. Global Near-Surface Wind Speed Changes over the Last Decades Revealed by Reanalyses and CMIP6 Model Simulations. J. Clim. 2021, 34, 2219–2234. [Google Scholar] [CrossRef] [Scilit]
  39. Turner, A.G.; Annamalai, H. Climate Change and the South Asian Summer Monsoon. Nat. Clim Change 2012, 2, 587–595. [Google Scholar] [CrossRef] [Scilit]
  40. Lau, K.M.; Yang, S. Climatology and Interannual Variability of the Southeast Asian Summer Monsoon. Adv. Atmos. Sci. 1997, 14, 141–162. [Google Scholar] [CrossRef] [Scilit]
  41. Stowasser, M.; Annamalai, H.; Hafner, J. Response of the South Asian Summer Monsoon to Global Warming: Mean and Synoptic Systems. J. Clim. 2009, 22, 1014–1036. [Google Scholar] [CrossRef] [Scilit]
  42. Soares, P.M.M.; Lima, D.C.A.; Nogueira, M. Global Offshore Wind Energy Resources Using the New ERA-5 Reanalysis. Environ. Res. Lett. 2020, 15, 1040a2. [Google Scholar] [CrossRef] [Scilit]
  43. Hayes, L.; Stocks, M.; Blakers, A. Accurate Long-Term Power Generation Model for Offshore Wind Farms in Europe Using ERA5 Reanalysis. Energy 2021, 229, 120603. [Google Scholar] [CrossRef] [Scilit]
  44. Ruiz, S.A.G.; Barriga, J.E.C.; Martínez, J.A. Wind Power Assessment in the Caribbean Region of Colombia, Using Ten-Minute Wind Observations and ERA5 Data. Renew. Energy 2021, 172, 158–176. [Google Scholar] [CrossRef] [Scilit]
  45. Gualtieri, G. Reliability of ERA5 Reanalysis Data for Wind Resource Assessment: A Comparison against Tall Towers. Energies 2021, 14, 4169. [Google Scholar] [CrossRef] [Scilit]
  46. Kuang, F.; Zhang, Y.; Zhang, J.; Jia, C. Comparison and evaluation of three sea surface wind products in Taiwan Strait. Haiyang Xuebao 2015, 37, 44–53. (In Chinese) [Google Scholar] [CrossRef]
  47. Zheng, C.W.; Li, C.Y. Research on offshore wind energy classification: Bottlenecks and countermeasures. Bull. Chin. Acad. Sci. 2023, 38, 654–665. (In Chinese) [Google Scholar] [CrossRef]
  48. Sleptsov, A.; Ryzhov, A.; Luchnikov, I.; Hosseinloo, A.H.; Ouerdane, H.; Bischi, A. Controlled Adjustments of Indoor Microclimate Parameters for Building’s Energy Demand Management. Energy Rep. 2021, 7, 216–224. [Google Scholar] [CrossRef] [Scilit]
  49. Bañuelos-Ruedas, F.; Angeles-Camacho, C.; Rios-Marcuello, S. Analysis and Validation of the Methodology Used in the Extrapolation of Wind Speed Data at Different Heights. Renew. Sustain. Energy Rev. 2010, 14, 2383–2391. [Google Scholar] [CrossRef] [Scilit]
  50. Miao, W.; Jia, H.; Wang, D.; Parkinson, S.; Crawford, C.; Djilali, N. Active Power Regulation of Wind Power Systems through Demand Response. Sci. China Technol. Sci. 2012, 55, 1667–1676. [Google Scholar] [CrossRef] [Scilit]
  51. Saji, N.H.; Goswami, B.N.; Vinayachandran, P.N.; Yamagata, T. A Dipole Mode in the Tropical Indian Ocean. Nature 1999, 401, 360–363. [Google Scholar] [CrossRef] [Scilit]
  52. Webster, P.J.; Yang, S. Monsoon and Enso: Selectively Interactive Systems. Q. J. R. Meteorol. Soc. 1992, 118, 877–926. [Google Scholar] [CrossRef]
  53. Zheng, C.; Pan, J.; Li, J. Assessing the China Sea Wind Energy and Wave Energy Resources from 1988 to 2009. Ocean. Eng. 2013, 65, 39–48. [Google Scholar] [CrossRef] [Scilit]
  54. Sun, S.; Fang, Y.; Liu, B.T. Coupling between SST and Wind Speed over Mesoscale Eddies in the South China Sea. Ocean. Dyn. 2016, 66, 1467–1474. [Google Scholar] [CrossRef] [Scilit]
  55. Liu, L.; Wu, M.; Mao, Y.; Zheng, L.; Xue, M.; Bing, L.; Liang, F.; Liu, J.; Liu, B. Offshore Wind Energy Potential in Shandong Sea of China Revealed by ERA5 Reanalysis Data and Remote Sensing. J. Clean. Prod. 2024, 464, 142745. [Google Scholar] [CrossRef] [Scilit]
  56. Zheng, C.W.; Pan, J.; Li, C.Y. Global Oceanic Wind Speed Trends. Ocean. Coast. Manag. 2016, 129, 15–24. [Google Scholar] [CrossRef] [Scilit]
  57. Ren, H.; Li, G.; Guo, T.; Zhang, Y.; Ouyang, N. Multi-scale Variability of Surface Wind Direction and Speed on the Bohai Sea in 1950-2011. Sci. Geogr. 2017, 37, 1430–1438. (In Chinese) [Google Scholar]
  58. Huang, C.; Liu, H.; Li, H.; Zuo, J.; Wang, R. Combined Effects of ENSO and PDO on Activity of Major Hurricanes in the Eastern North Pacific. Clim. Dyn. 2024, 62, 1467–1486. [Google Scholar] [CrossRef] [Scilit]
Figure 1. The China Seas and adjacent waters are outlined in red.
Jmse 14 00320 g001
Figure 2. (am) Yearly and monthly average wind speed in the China Seas and adjacent waters.
Jmse 14 00320 g002aJmse 14 00320 g002b
Figure 3. (am) Yearly and monthly average effective wind speed occurrence in the China Seas and adjacent waters.
Jmse 14 00320 g003aJmse 14 00320 g003b
Figure 4. (am) Time-series and regression plots of effective wind speed occurrence in the China Seas and adjacent waters on yearly and monthly scales.
Jmse 14 00320 g004aJmse 14 00320 g004bJmse 14 00320 g004c
Figure 5. (am) Growth rate of the effective wind speed occurrence in the China Seas and the adjacent waters on monthly and annual scales. Notes: Colored areas indicate statistically significant regions at the 95% confidence level.
Jmse 14 00320 g005aJmse 14 00320 g005b
Figure 6. (ae) Correlations between yearly EWSO and AMO (a), NINO3 (b), SOI (c), PDO (d), and SAMI (e) in the China Seas and adjacent waters. Notes: Colored areas indicate statistically significant regions at the 95% confidence level.
Jmse 14 00320 g006
Figure 7. (al) Monthly correlations between AMO and effective wind speed occurrence in the China Seas and adjacent. Notes: Colored areas indicate statistically significant regions at the 95% confidence level.
Jmse 14 00320 g007aJmse 14 00320 g007b
Figure 8. (al) Monthly correlations between the Niño 3 index and the effective wind speed occurrence in the China Seas and adjacent waters. Notes: Colored areas indicate statistically significant regions at the 95% confidence level.
Jmse 14 00320 g008aJmse 14 00320 g008b
Figure 9. (al) Monthly correlations between the Southern Oscillation Index and the effective wind speed occurrence in the China Seas and adjacent waters. Notes: Colored areas indicate statistically significant regions at the 95% confidence level.
Jmse 14 00320 g009aJmse 14 00320 g009b
Figure 10. (al) Monthly correlations between the Pacific Decadal Oscillation and the effective wind speed occurrence in the China Seas and adjacent waters. Notes: Colored areas indicate statistically significant regions at the 95% confidence level.
Jmse 14 00320 g010aJmse 14 00320 g010b
Figure 11. (al) Monthly correlations between the South Asian Monsoon Index and the effective wind speed occurrence in the China Seas and adjacent waters. Notes: Colored areas indicate statistically significant regions at the 95% confidence level.
Jmse 14 00320 g011aJmse 14 00320 g011b
Table 1. Linear growth rates and statistical significance (p-values) of the effective wind speed occurrence in the China Seas and adjacent waters.
MonthGrowth Rate (%/yr)p
Jan0.0260.125
Feb0.0410.040
Mar0.0220.315
Apr0.0260.192
May0.0160.535
Jun−0.0210.387
Jul0.0550.123
Aug0.0550.147
Sep0.0400.259
Oct0.0210.480
Nov0.0210.302
Dec0.0220.185
Year0.0270.003
Table 2. Summary of significant monthly correlations between EWSO and major climate indices in the China Seas and adjacent waters.
Climate IndexSignificant MonthKey RegionCorrelation (r)
AMOMarchthe northern offshore waters of the Nanhai−0.3
Aprilthe southeastern waters of the Nanhai−0.3
Augustthe Sea of Japan, the eastern Donghai, the eastern waters of the Nanhai−0.4
Novemberthe northern waters of the Nanhai−0.4
NINO3December–Aprilthe waters of the Nanhai north of 10° N−0.3~−0.5
the waters of the Nanhai south of 10° N0.3~0.4
Julythe waters south of 20° N0.3~0.4
Augustthe waters east of the Philippines0.4
Septemberthe waters east of the Philippines0.6
Octoberthe waters from the northern Donghai to the southern Nanhai−0.3~−0.5
Novemberthe southern Donghai and the northern Nanhai−0.4
SOIDecember–Aprilthe waters of the Nanhai north of 10° N0.3~0.5
the waters of the Nanhai south of 10° N−0.3~−0.4
Junethe waters southeast of the Philippines−0.3~−0.4
Julythe waters south of 20° N−0.4~−0.6
Augustthe waters southeast of the Philippines−0.6
Septemberthe southern Nanhai−0.4
October–Novemberthe western Donghai, the northwestern and southern Nanhai0.6
PDOMarchthe southern Nanhai and the waters south of the Philippines0.4
August–Septemberthe waters southeast of the Philippines0.3
SAMIJanuarythe Donghai and its adjacent sea areas0.7
the southern Nanhai−0.8
February–Marchthe local waters of the northern Nanhai0.7
Maythe southern Nanhai0.5~0.8
Augustthe southern Nanhai0.6
Octoberthe northwestern Nanhai0.7
the coastal waters of the southern Nanhai0.5
Decemberthe waters near the Philippines−0.8
Disclaimer/Publisher’s Note: The statements, opinions and data contained in all publications are solely those of the individual author(s) and contributor(s) and not of MDPI and/or the editor(s). MDPI and/or the editor(s) disclaim responsibility for any injury to people or property resulting from any ideas, methods, instructions or products referred to in the content.