Article

Trajectory-Control-Based Analysis of Winch Traction Dynamics in Ship-Borne Aircraft Operations

School of Energy and Power Engineering, University of Shanghai for Science and Technology, Shanghai 200093, China
*
Author to whom correspondence should be addressed.
J. Mar. Sci. Eng. 2026, 14(2), 170; https://doi.org/10.3390/jmse14020170
Submission received: 9 December 2025 / Revised: 9 January 2026 / Accepted: 9 January 2026 / Published: 13 January 2026
(This article belongs to the Section Ocean Engineering)

Abstract

Aiming to address the problems of the violent fluctuation of winch traction rope and tire forces and the high safety risk caused by coupling ship motions (rolling, pitching, and heaving), wind loads, and deck space limitations in carrier-based aircraft, this paper focuses on a multi-winch traction system on a small deck. A fully coupled dynamic model of an aircraft landing gear–tire–rope–winch system is constructed, ADAMS2020 and MATLAB/Simulink (MATLAB R2021b) co-simulations are used to develop the three-winch and five-winch traction system models, and a Fiala tire model and a telescopic landing gear model are adopted to build a precise mechanical model of the aircraft. The PID control strategy is proposed, based on the Bessel curve, to control the driving trajectory of the aircraft, and the quantitative influence of ship motion, winch number, and preset trajectory on traction dynamic characteristics is systematically studied. Compared to without trajectory control, the peak force of the winch rope before the start-up phase of the three-winch system is reduced by 54.9%, and the five-winch system is reduced by 57.6%. The fluctuation amplitude of the lateral force of the rear wheel is greater than that of the front wheel, up to a maximum of 215% of the front wheel. The correlation coefficient between the theoretical model and the simulation results is 0.91~0.97, and the error is less than 12%. The PID control strategy based on the Bessel trajectory can significantly improve the steadiness and security of the carrier-based aircraft winch traction system on a small deck. The study delivers the requisite theory and engineering means for the optimized design of carrier-based aircraft traction systems.

1. Introduction

Winch traction has been recognized as a suitable method for moving carrier-based aircraft on small flight decks. In this scheme, winches stationed on the deck pull the aircraft into the hangar via multi-point ropes; during outbound movement, the originally passive winches switch to active mode while the formerly active ones become passive, thus ensuring bidirectional and stable transfer. Therefore, investigating winch traction dynamics in the ship environment is essential for the safe and stable operation of carrier aircraft transfer systems [1].
At present, some scholars have built various models of the aircraft traction system and analyzed the dynamic characteristics of the system. Wang et al. [2] established the dynamic model of the aircraft traction system whose safety performance was studied in the process of braking. Zhang et al. [3] studied the maneuvering problems of the front-wheel drive aircraft by constructing a model of the airframe, the landing gears, and the tire, and by designing a controller for aircraft ground + front-wheel drive aircraft. The research showed that a controller based on Deep Reinforcement Learning (DRL) is superior to traditional controllers. Xing et al. [4] built a simplified model of the tractor without a towbar and performed Finite Element Analysis (FEA). Linn D R et al. [5] presented a helicopter landing gear tire model for numerical simulation based on the HeliMan system, and full-scale experiments were conducted to validate the simulation results. With the rapid development of artificial intelligence, a robotic aircraft-towing system for planning motion paths has been developed [6]. Wang et al. [7] established a dynamic model of a multi-body system including the vessel, the aircraft, and the landing gear, considering the deck motion and the sea wind. A. Sharma [8] proposed an integrated model of helicopter landing capability under consideration of the complex wind load based on first principles in physics. Li et al. [9] developed a multi-body dynamic model of tilt rotor aircraft, carried out numeric simulations, and validated the calculation results by applying the data of xv-15. Thota et al. [10] established a mathematical model of the front landing gear of an aircraft with two wheels to analyze the effect of collocation on system vibration. Yan et al. [11] developed a formula to test the relative angle between the tractor and the front wheel by using the value of the aircraft tire.
Trajectory control has an essential influence on aircraft dynamics, and much research on the control of aircraft trajectory has been conducted in recent years. He et al. [12] designed a trajectory controller capable of tracking the vehicles by adjusting the steering angle of the nose wheel. Dong et al. [13] simulated the trajectory of changing lanes by designing a back propagation (BP) neural network. Xu et al. [14] optimized the trajectory control strategy of Unmanned Aerial Vehicle (UAV)-assisted Mobile Edge Computing (MEC) by improving a Deep Deterministic Policy Gradient (DDPG) algorithm. Trajectory tracking and control have been deeply and comprehensively investigated by many researchers [15,16]. Shao et al. [17] researched the trajectory design and control of an Unmanned Aerial Helicopter (UAH) by applying the Prescribed Performance Method (PPM), and error control was performed by the function of transformation performance.
Aircraft traction safety is also an extremely important problem in engineering. Sybanev et al. [18] analyzed the load mode of the landing gear to assess the life based on the Finite Element Analysis (FEA). Jiang et al. [19] studied the effect of Coulomb friction for the front landing gear on the oscillatory stability under a time-varying load. Wang et al. [20] applied Anti-lock Braking System (ABS) to reduce the vibration of the landing gear by means of the model predict control. Some studies have also been conducted pertaining to the traction rope. Ye et al. [21] investigated the stress and strain of the marine handling rope on a winch in order to evaluate the performance of the rope and adjust its adaptability. Lee et al. [22] established a rope slip model to study the mechanical behaviors between the rope and the winch, and validated the accuracy of the model by the tensile experiments. The shipboard winch-rope system is inherently subject to wave-induced tension and speed fluctuations. In the conductivity–temperature–depth (CTD) winch test, Carral et al. [23] found that deck heave can make the cable tension jump by 50% and induce multiple snap loads, thus confirming that real-time compensation of speed/tension is an effective means to maintain the stability of high sea state traction, and also provides a direct reference for the trajectory control traction system of carrier-based aircraft in this paper. Zhao et al. [24] confirmed by the hydrodynamic control coupling model that the constant tension strategy can significantly reduce the peak load of the cable, and the ‘following the mother ship’ mode can further smooth the tension, but it is necessary to avoid the cable compression caused by excessive recovery. Their research on control strategy, multi-body coupling modeling, and limit condition simulation provides a reference method for the deck–winch traction dynamics in naval aircraft. Chen et al. [25] constructed a ‘tug–cable–fan’ coupling model, and pointed out that active correction can inhibit lateral drift, but it is necessary to prevent cable relaxation and tension mutation caused by correction that is too fast. Its tension control and trajectory maintenance strategy provides an effective reference for the winch traction system of carrier-based aircraft.
The scholars have conducted a lot of research on the traction of large decks, such as the helicopter, the tire, rope modeling, and the trajectory control strategy, but for the modeling of a small deck winch traction system, the published articles are scarce, and these current studies have certain limitations. In view of the urgent needs of this project problem, a whole-system winch traction model consisting of a helicopter, a landing gear, a tractor, a tire, a rope, and a traction system is established, and a control strategy based on proportional–integral–derivative (PID) and joint simulation is proposed to study the steadiness and security of the winch tow, and the issue of the lack of traction technology of the small deck winch will be solved. Compared with other research, this paper is innovative in joint control strategy and the modeling of the whole-system winch traction. This work is crucial for the steadiness and security of carrier-based plane winch traction.
Although there are many factors affecting the traction control strategy of winches, the main factors include the ship movement, the number of winches, and the driving trajectory. Ship movements influenced by complex sea conditions includes the roll, the pitch, the heave, and the mutual coupling; this complex movement causes a potential threat to the safety of winch traction. As three-winch and five-winch systems are more common in engineering, the two traction modes are studied to compare their advantages and disadvantages; the study of driving trajectories aims to reserve alternative traction routes for preventing the influence of unconventional obstacles on the winch traction. A comparison of the various alternative routes is carried out to optimize the tire force and the rope forces for higher safety and stability of system. Therefore, this study aims to investigate the traction dynamics and safety characteristics of ship-borne aircraft winch towing on small decks under complex sea conditions. By developing a fully coupled aircraft–landing gear–tire–rope–winch dynamic model and implementing a Bezier-curve-based PID trajectory control strategy through ADAMS–MATLAB/Simulink co-simulation, the study focuses on clarifying the load characteristics and safety limits of winch ropes and aircraft tires under different ship motions, winch configurations, and driving trajectories. The results provide quantitative insights into traction route planning, trajectory optimization, and safety assessment, and lay a foundation for future experimental validation and further improvement of towing stability and safety in complex marine environments.
To achieve the objectives of this study, the structure of this paper has been carefully organized. Section 2 describes the ADAMS–MATLAB/Simulink co-simulation framework. Section 3 presents the modeling of the aircraft landing gear–tire–rope–winch system and the proposed Bezier-curve-based PID trajectory control strategy. Section 4 analyzes the dynamic characteristics and safety of the traction system under different traction modes and environmental conditions. Section 5 provides a discussion of the main results. Section 6 draws conclusions, summarizes the limitations of this study, and outlines directions for future work. In existing studies, the focus is usually on either a single theoretical model or experimental validation. However, this paper proposes a new analytical approach that involves a comparative analysis between a simplified theoretical model in MATLAB/Simulink and a multi-body dynamics model in ADAMS. The primary goal of this study is to assess the internal consistency between these two simulation models, rather than simply validating the ADAMS model. This comparison lays the foundation for further validation of the model’s effectiveness using experimental data or authoritative engineering benchmarks.

2. Software Tools and Simulation Framework

Based on the research background of the ship-borne aircraft traction system, a three-dimensional solid model of the telescopic landing gear of the aircraft was established using CATIA V5.
The CATIA model was then imported into the multi-body dynamics software ADAMS2020, where the constraints, the force elements (such as shock absorbers), the actuations, and contact forces were assigned to the landing gear components to construct a virtual prototype suitable for dynamic analysis. Meanwhile, a theoretical control model of the traction system was developed in MATLAB/Simulink (MATLAB R2021b). Finally, the dynamic characteristics of the entire system were studied through co-simulation using the ADAMS–MATLAB/Simulink interface, focusing on the dynamic characteristics of the entire traction system.

3. Modeling of Aircraft-Winch Traction System

3.1. Multi-Body System Dynamics

The Lagrangian equation is the basis of the dynamic analysis by simulation and theoretical investigation. The ship-borne aircraft–winch traction system is a complicated multi-body dynamic system; the Lagrangian method is used to develop the mathematical model of the system, as follows:
d d t T q ˙ + E k q = F
where q is the generalized coordinates, Ek represents the system’s motion energy, and F denotes the generalized force.
E k = 1 2 q ˙ T M q ˙
The dynamic governing equation of the ith body is written as follows:
M i q ¨ + K i q i = F i , i = 1 , 2 , …… , n b
where q ¨ represents the generalized acceleration of the ith body, Mi is the mass of the ith body, Ki is the stiffness of the ith body, Fi is the generalized force of the ith body, and nb represents the total number of bodies in the system. After the system is assembled together by constraints, the dynamic control equation of the system is obtained by the multiplier method, as follows:
M q ¨ + K i q i + C T λ = F
The constraint equation is written as follows:
C q , t = 0
where λ represents the Lagrange multiplier and C is the constraint matrix.

3.2. Modeling of Landing Gear and Tire

3.2.1. Force Analysis of Aircraft Landing Gear System

The load of the aircraft fuselage acts on the landing gear and transmits on the ground through the tire. Therefore, the landing gear and the tire can be studied as a whole model, and the dynamic model has an important influence on the winch traction dynamics. In order to establish the overall model of the landing gear–tire system, the force analysis should be carried out firstly. The vertical force of the pillar for the landing gear is as follows [26]:
F l = k l   d l + c l   d ˙ l
where kl is the pillar rigidity coefficient, cl is the resistance coefficient, dl is the displacement of the pillar, and d ˙ l is the strut’s speed. The specific parameters are shown in Table 1.
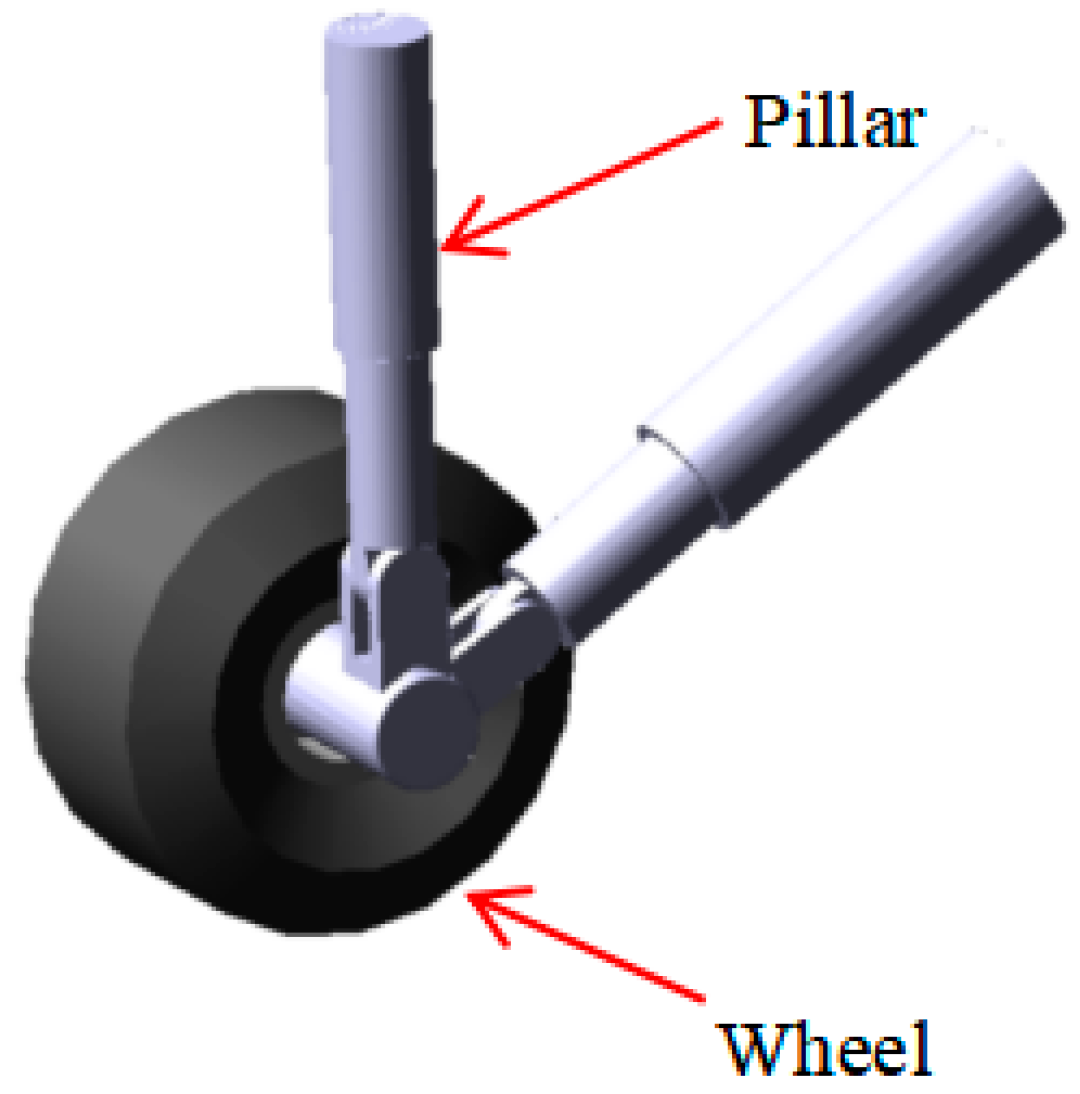
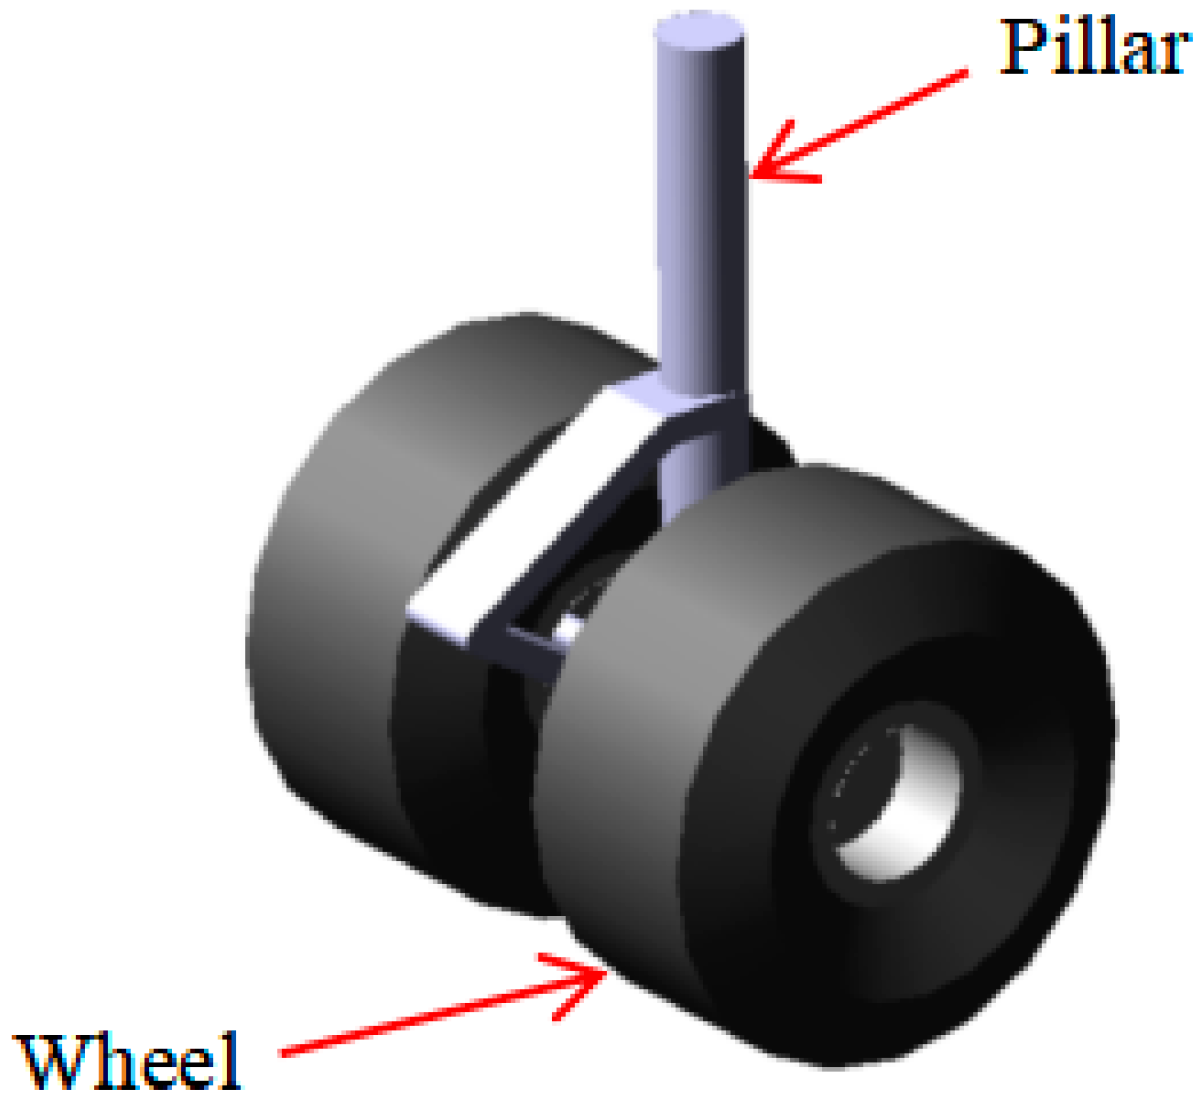
The landing gear and the tire are the contact mechanism between the ship-borne aircraft and the deck, and the dynamic models are very important for the study of the whole traction system. The main types of landing gear for the aircraft include the sliding tube undercarriage and pivot joint undercarriage; the sliding tube undercarriage is used for research in this study. The telescopic landing gear is generally composed of pillars, buffers, and wheels. Based on the related parameters (Table 2), the first three-point landing gear model is established by CATIA software, as shown in Figure 1 and Figure 2.

3.2.2. Tire Force

The Fiala tire model is used in this paper. In order to calculate the vertical, the radial, and the lateral forces of the tire, the following assumptions are made: the contact patch between the tire and the ground is rectangular, and the contact patch bears constant pressure; the relaxation effect of the tires is ignored. The parameters of aircraft tires are shown in Table 3. The vertical force of the tire can be expressed as follows [27]:
F z = min ( 0 , 0 , { F z k + F z c } )
where Fzk is the elastic force and Fzc is the damping force in the vertical direction.
The radial force of the tire Fx is dependent on the normal force Fz, the current friction coefficient U, the radial slip ratio Ss, and the sideslip angle Alpha. The current friction coefficient U is determined by the dynamic friction coefficient Umin, the static friction coefficient Umax, and the comprehensive slip rate SSAlpha = (Ss2 + tan2(Alpha))1/2. The definition of the current friction coefficient is U = Umax − (UmaxUmin) × SsAlpha. A key friction coefficient S_critical is defined in the longitudinal dynamics model of the tire.
S _ c r i t i c a l = U × F z 2 × C s l i p
In the state of elastic deformation, |Ss| < S_critical, the radial force of the tire can be expressed as
F X = C s l i p × S S
In the state of slip, |Ss| > S_critical, the radial force of the tire is expressed as
F X = sign ( S S ) ( F X 1 F X 2 )
where F X 1 = U × F Z , F X 2 = U × F Z F X 2 = ( U × F z ) 2 ( 4 × | S S | × C s l i p ) , Fz is the vertical force, U is the friction rate, Ss is the longitudinal slip rate, and Cslip is the longitudinal slip stiffness.
The tire side force Fy is dependent on the vertical force Fz and the current friction coefficient U. The key cornering angle Alpha_critical defined by the tire dynamics model can be written as
A l p h a _ c r i t i c a l = arctan ( 3 × U × F S C A L P H A )
In the state of elastic deformation, |Alpha| < Alpha_critica, the lateral force of the tire can be expressed as
F y = U × | F Z | × ( 1 H 3 ) × sign ( A l p h a )
H = 1 C A L P H A × tan ( A l p h a ) 3 × U × F S
where CALPHA is a factor of the lateral stiffness of the tire and is used to calculate the lateral force of the tire; sign (Alpha) is a mathematical function called a sign function. It is used to determine the symbol of a certain value. The function of sign (Alpha) is to determine the direction of the lateral force of the tire based on the positive or negative side deviation angle Alpha.
In the state of slip, |Alpha| > Alpha_critical, the tire side force can be expressed as
F y = U × | F S | × sign ( A l p h a )

3.3. Winch–Rope Dynamic Model

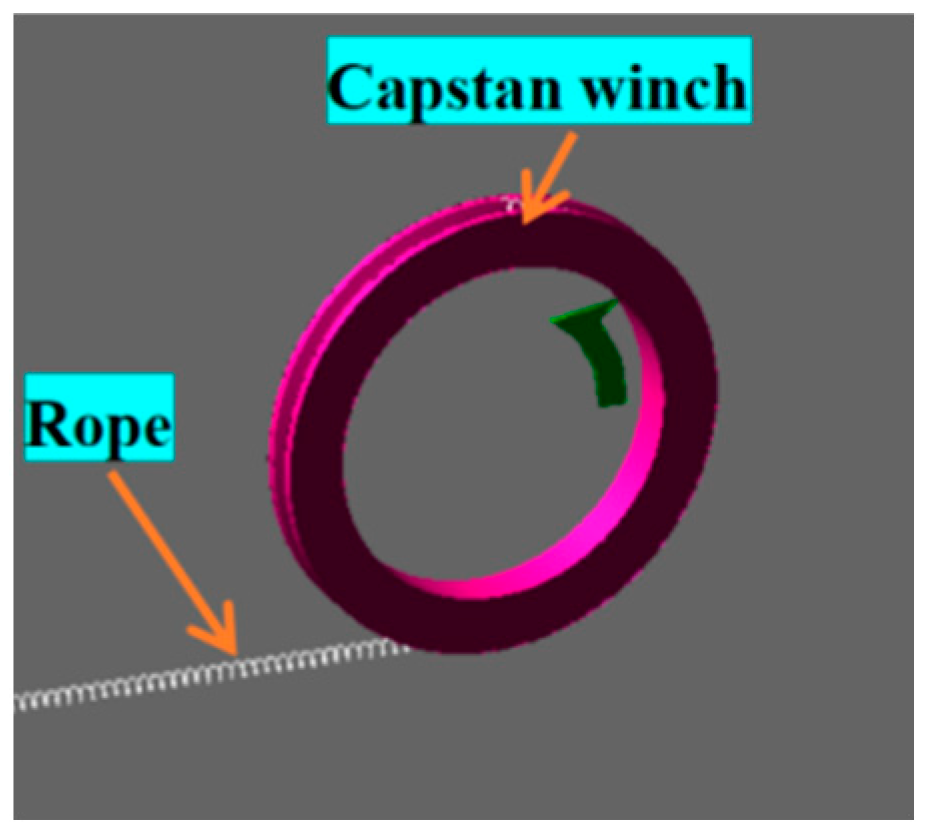
The winch plays a critical role in determining the traction force transmission and dynamic response of the aircraft–rope–winch system. In this study, the winch is modeled using the Cable module in ADAMS, which can accurately represent the flexibility of the rope, the contact behavior, and the frictional interaction between the rope and the traction drum. The rope is wound around a winch drum with a radius of 500 mm. The maximum rope force allowable in this study is limited to 105 N. Moreover, in this study, the towing speed of the carrier-based aircraft is controlled by prescribing the rotational speed of the winch.
The developed flexible winch model is shown in Figure 3, and was established in ADAMS. The drum is shown in purple, and the flexible rope is shown in gray. The rope parameters are obtained from an actual engineering project, and the detailed values are listed in Table 4.
The contact between the rope and the drum is described by a nonlinear friction model, in which the transmitted tension depends on the friction coefficient and the wrap angle. This configuration enables the winch model to capture the tension amplification and attenuation effects during traction and braking processes.
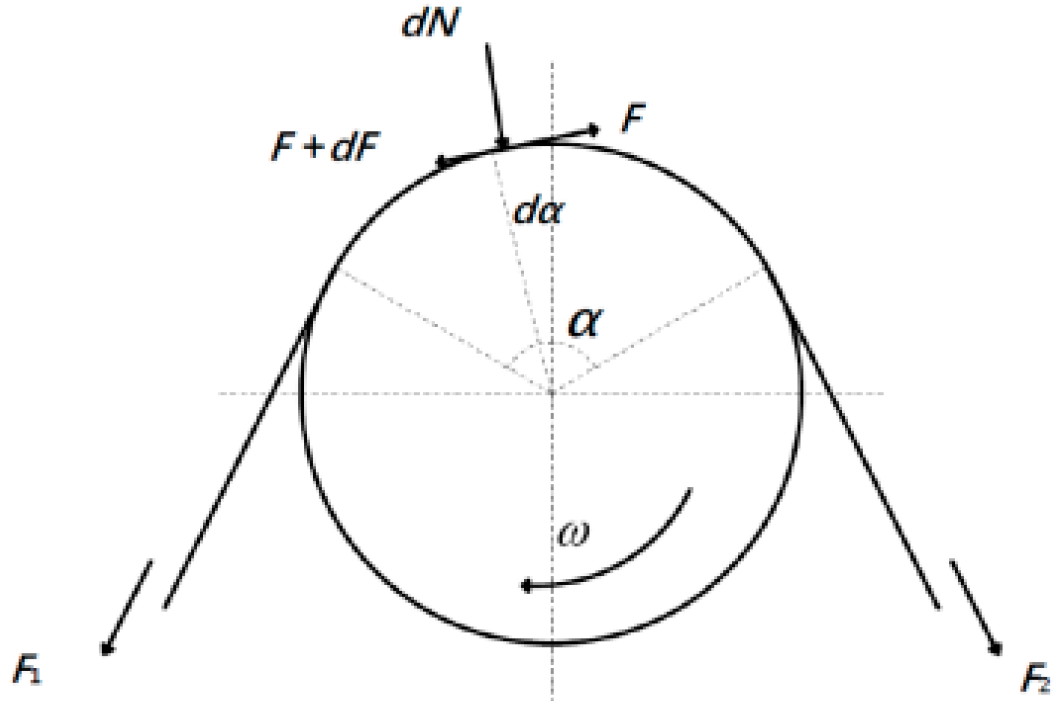
From a physical perspective, the winch influences the system dynamics mainly through the rope tension, which is governed by rope deformation, damping, and frictional transmission on the drum. Variations in winch rotational speed and rope contact conditions directly affect the instantaneous rope force, thereby influencing the aircraft acceleration, tire forces, and overall traction stability. The detailed theoretical formulation of the winch–rope force transmission, including the force equilibrium on the traction drum, is presented as follows.
The stress of the rope wound on the traction drum is shown in Figure 4, the cable is wound on the traction winch, a small section of cable corresponding to the micro-arc of on the winch is taken for force analysis, the winch is rotated clockwise, and the tension on the cable is F + dF through the friction of the micro-arc so that the tension is reduced dF, and the output tension is F; dF is the frontal pressure of the cable on the winch, and μ is the coefficient of friction between the cable and the winch rope groove. Solid lines represent the rope and tension directions, while dotted lines indicate the micro-arc segment used for the differential force analysis.
From Figure 4, it can be analyzed that
F + d F cos d α 2 = μ d N + F cos d α 2 F + d F sin d α 2 + F sin d α 2 = d N
The micro-element d α is smaller, i.e., there is sin d α 2 d α 2 , cos d α 2 1 , and it can be obtained by d F < F :
d F = μ d N F d α = d N
The division of the two expressions leads to
d F F = μ d α
By integrating the above formula, the tension force F1 is obtained:
F 1 = F 2 e μ α
In this formula, α represents the sliding package angle; F1 is the tension force on the tight side; and F2 is the tension force on the loose side.

3.4. Ship Motion

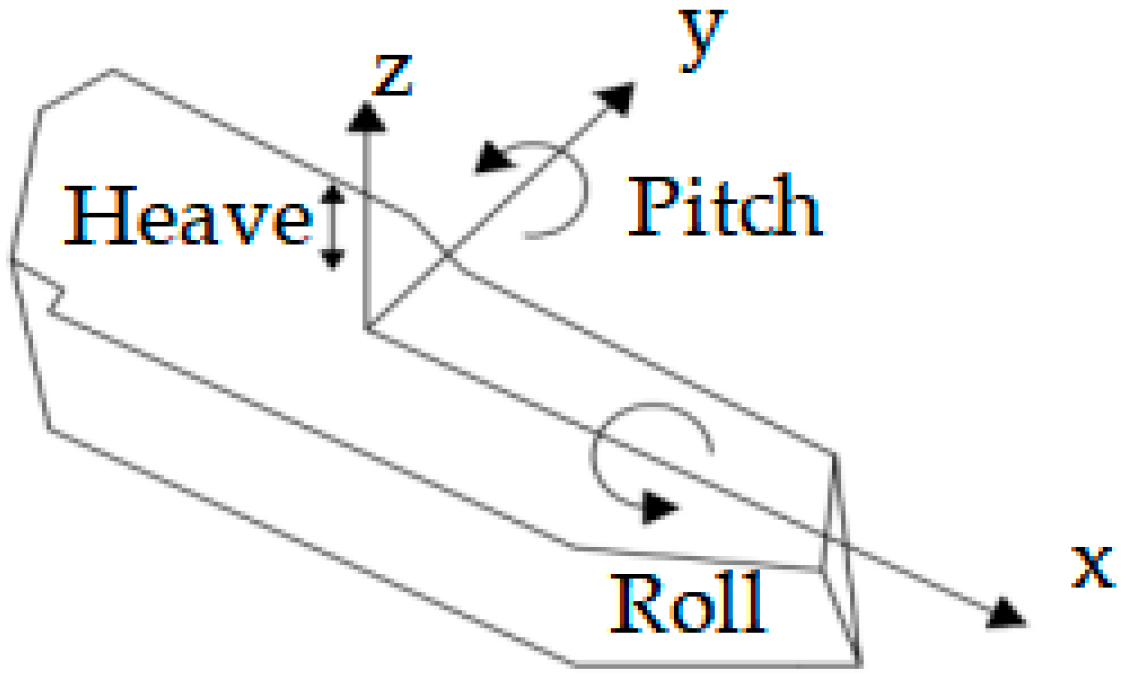
The marine environment has important influence on the ship motion which will affect the traction force of the aircraft–winch system. The motions of the ship have six degrees of freedom: the heaving, the swaying, the surging, the rolling, the pitching and the yawing motions. Among these, the surging, the swaying, and the yawing rarely appear in engineering practice, and they have less impact on our research focus of the winch traction dynamics; therefore, the roll (x-axis), the pitch (y-axis), and the heave (z-axis) are selected for analysis. Assuming that the center of gravity for the ship is the origin of the moving coordinate system, the expressions of the pitch, the roll and the heave motions can be written as follows [28,29]:
φ = φ 0 sin ( 2 π t / T φ + η φ ) θ = θ 0 sin ( 2 π t / T θ + η θ ) z = z 0 sin ( 2 π t / T z + η z )
where φ 0 , θ 0 , and z 0 are the peak roll, pitch, and heave displacements in turn; T φ , T θ , and T z are the periods of roll, pitch, and heave motion respectively; and η φ , η θ , and η z are the initial phase angles of the rolling, the pitching, and the heaving motions. The schematic diagram of the coordinate system and motions of ship is shown in Figure 5.

3.5. Wind Load

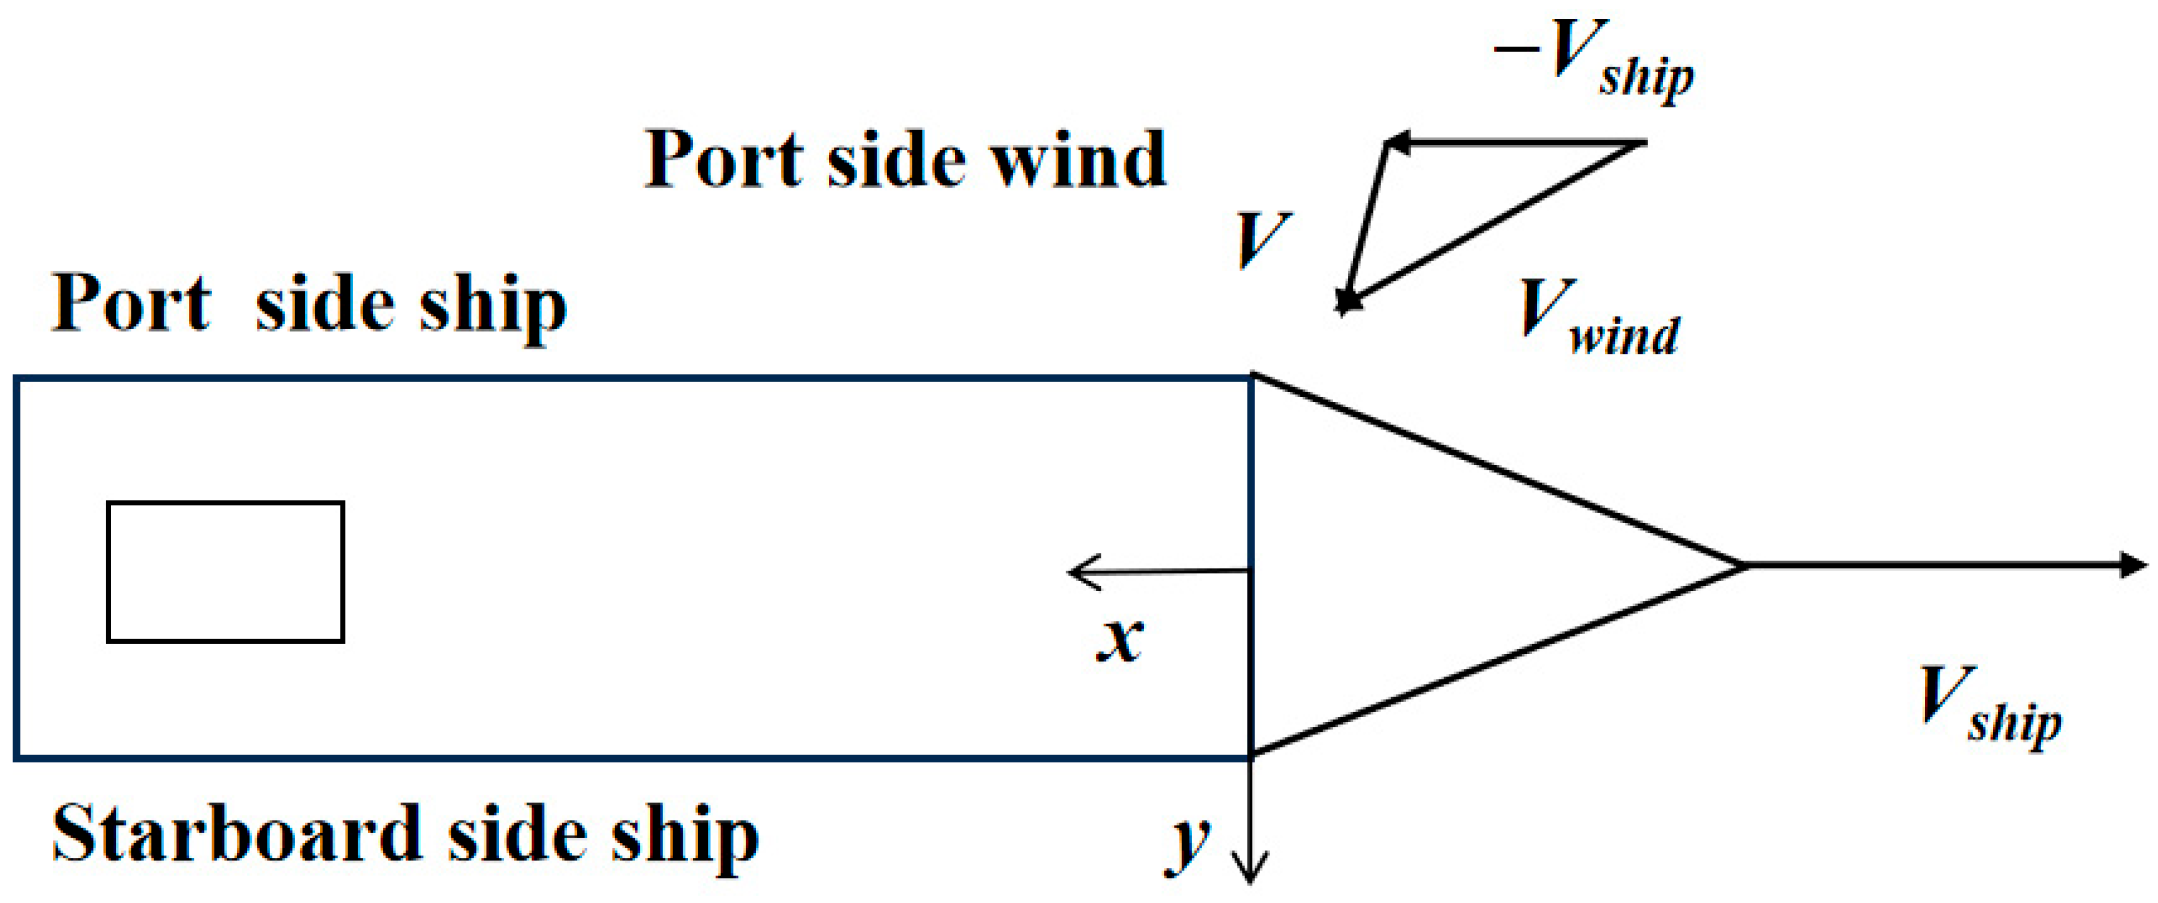
Carrier-based aircraft experience total wind loads that are largely attributable to the airflow produced by their own motion, the wind load produced by the navigation of the ship and the wind load at sea level. In the calculation, the action point of the wind load can be equivalent to the center of mass for the aircraft. Initially, the general expression for the wind load on the aircraft is based on aerodynamic principles, considering factors such as air density, wind speed, and reference area. The wind load expression is
Q = 1 / 2 × ρ × C × S × V 2
where ρ is the air density and its unit is kg/m3; C is the drag coefficient (dimensionless), dependent on the shape, surface roughness, attitude (such as the incidence angle), and flow state (Reynolds number); V is the wind speed and its unit is m/s; and S is the reference area and its unit is m2. Following the commonly adopted simplifications in ship-borne aircraft and deck operation studies [30,31], the aircraft is treated as a rigid body with a constant projected area, and the drag coefficient is assumed to be invariant with respect to small attitude variations during towing. Under these assumptions, the three-dimensional aerodynamic force can be equivalently represented by a single resultant force acting at the aircraft center of mass.
Therefore, the general wind load expression in Equation (20) can be reduced to the simplified form given in Equation (21), where the wind load is expressed as a function of the equivalent wind speed and the effective projected area perpendicular to the wind direction. This simplified representation is widely used in engineering-oriented dynamic analyses of ship-borne aircraft towing and deck operations. The wind load expression can therefore be reduced to
Q = 1676 × S × ( V / 100 ) 2
where Q is the combined force of the wind load which acts on the center of mass for the aircraft in the y direction, and its unit is N; and S is the area of the aircraft surface perpendicular to the wind direction, and its unit is m2; and V = V w i n d + V s h i p is the resultant wind speed, expressed in knots. The schematic diagram of the wind load synthesis is shown in Figure 6.

3.6. Bezier Curve

The definition of the Bezier curve is as follows: at the position vector Pi, where i = (0, 1, 2, 3, …, n) at n times of the Bezier curve with n reference points, the expression of the interpolation formula for a point on the Bezier curve is
P t = i = 0 n P i B i , n t ,                           t 0 , 1
where t is an independent variable implicitly expressed by the Bezier curve; Pi is the control point i of the Bezier curve; and Bi,n(t) is the n times Bernstein basis function, and its expression is written as
B i , n t = n ! i ! n 1 ! t i 1 t n 1 ,                       i = 0 , 1 , 2 , 3 , , n
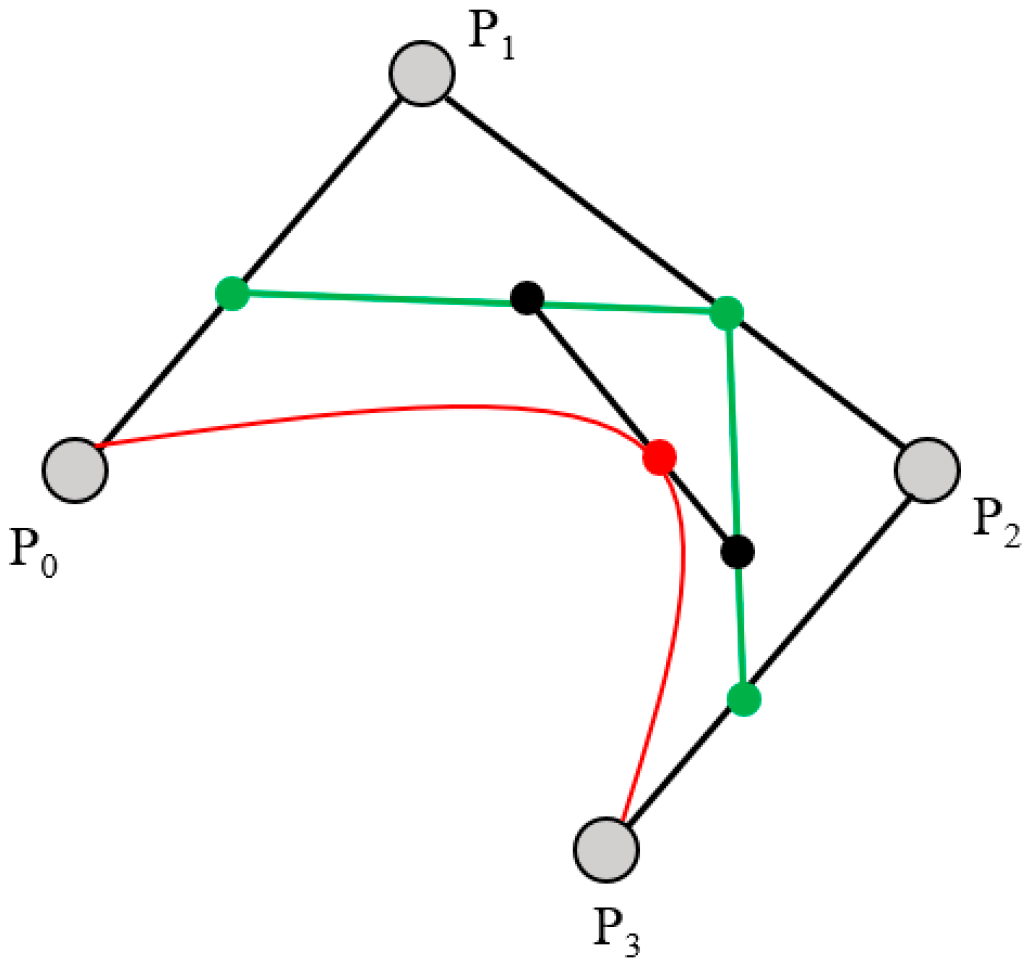
The shape of a Bezier curve is determined entirely by its control points. According to this principle, n control points form a Bezier curve of order n − 1. In this paper, a third-order Bezier curve is used, which consists of four control points, assuming that P0, P1, P2, P3, and P0, and P1, P2, and P3 all constitute the first order, as follows:
p 1 , 1 t = 1 t P 0 + t P 1 p 1 , 2 t = 1 t P 1 + t P 2 p 1 , 3 t = 1 t P 2 + t P 3
On the basis of the three first-order points generated, two second-order Bezier points can be generated:
p 2 , 1 t = 1 t p 1 , 1 + t p 1 , 2 p 2 , 2 t = 1 t p 1 , 2 + t p 1 , 3
On the basis of the two second-order points, the third-order Bezier points can be generated:
p 3 t = 1 t p 2 , 1 + t p 2 , 2
Therefore, the following can be obtained:
p 3 t = 1 t 3 P 0 + 3 t 1 t 2 P 1 + 3 t 2 1 t P 2 + t 3 P 3
The third-order Bezier curve is shown in Figure 7.

3.7. PID Control System

PID controller is widely applicable and can adapt to a variety of different types of control systems, such as steering control, speed control, position control and other fields. The trajectory control of the winch traction needs to control the steering angle, which is the field where PID control has more advantages than other control methods. PID control is used in the simulation system of carrier-based aircraft winch traction control in this research. The expression of the PID control is Equation (28). In the process of controlling the object, the controlled parameter tends to the expected value by adjusting the three parameters of the proportional coefficient, the integral time, and the differential time.
u ( t ) = k p [ e ( t ) + 1 T I 0 t e ( t ) d t + T D d e ( t ) d t ]
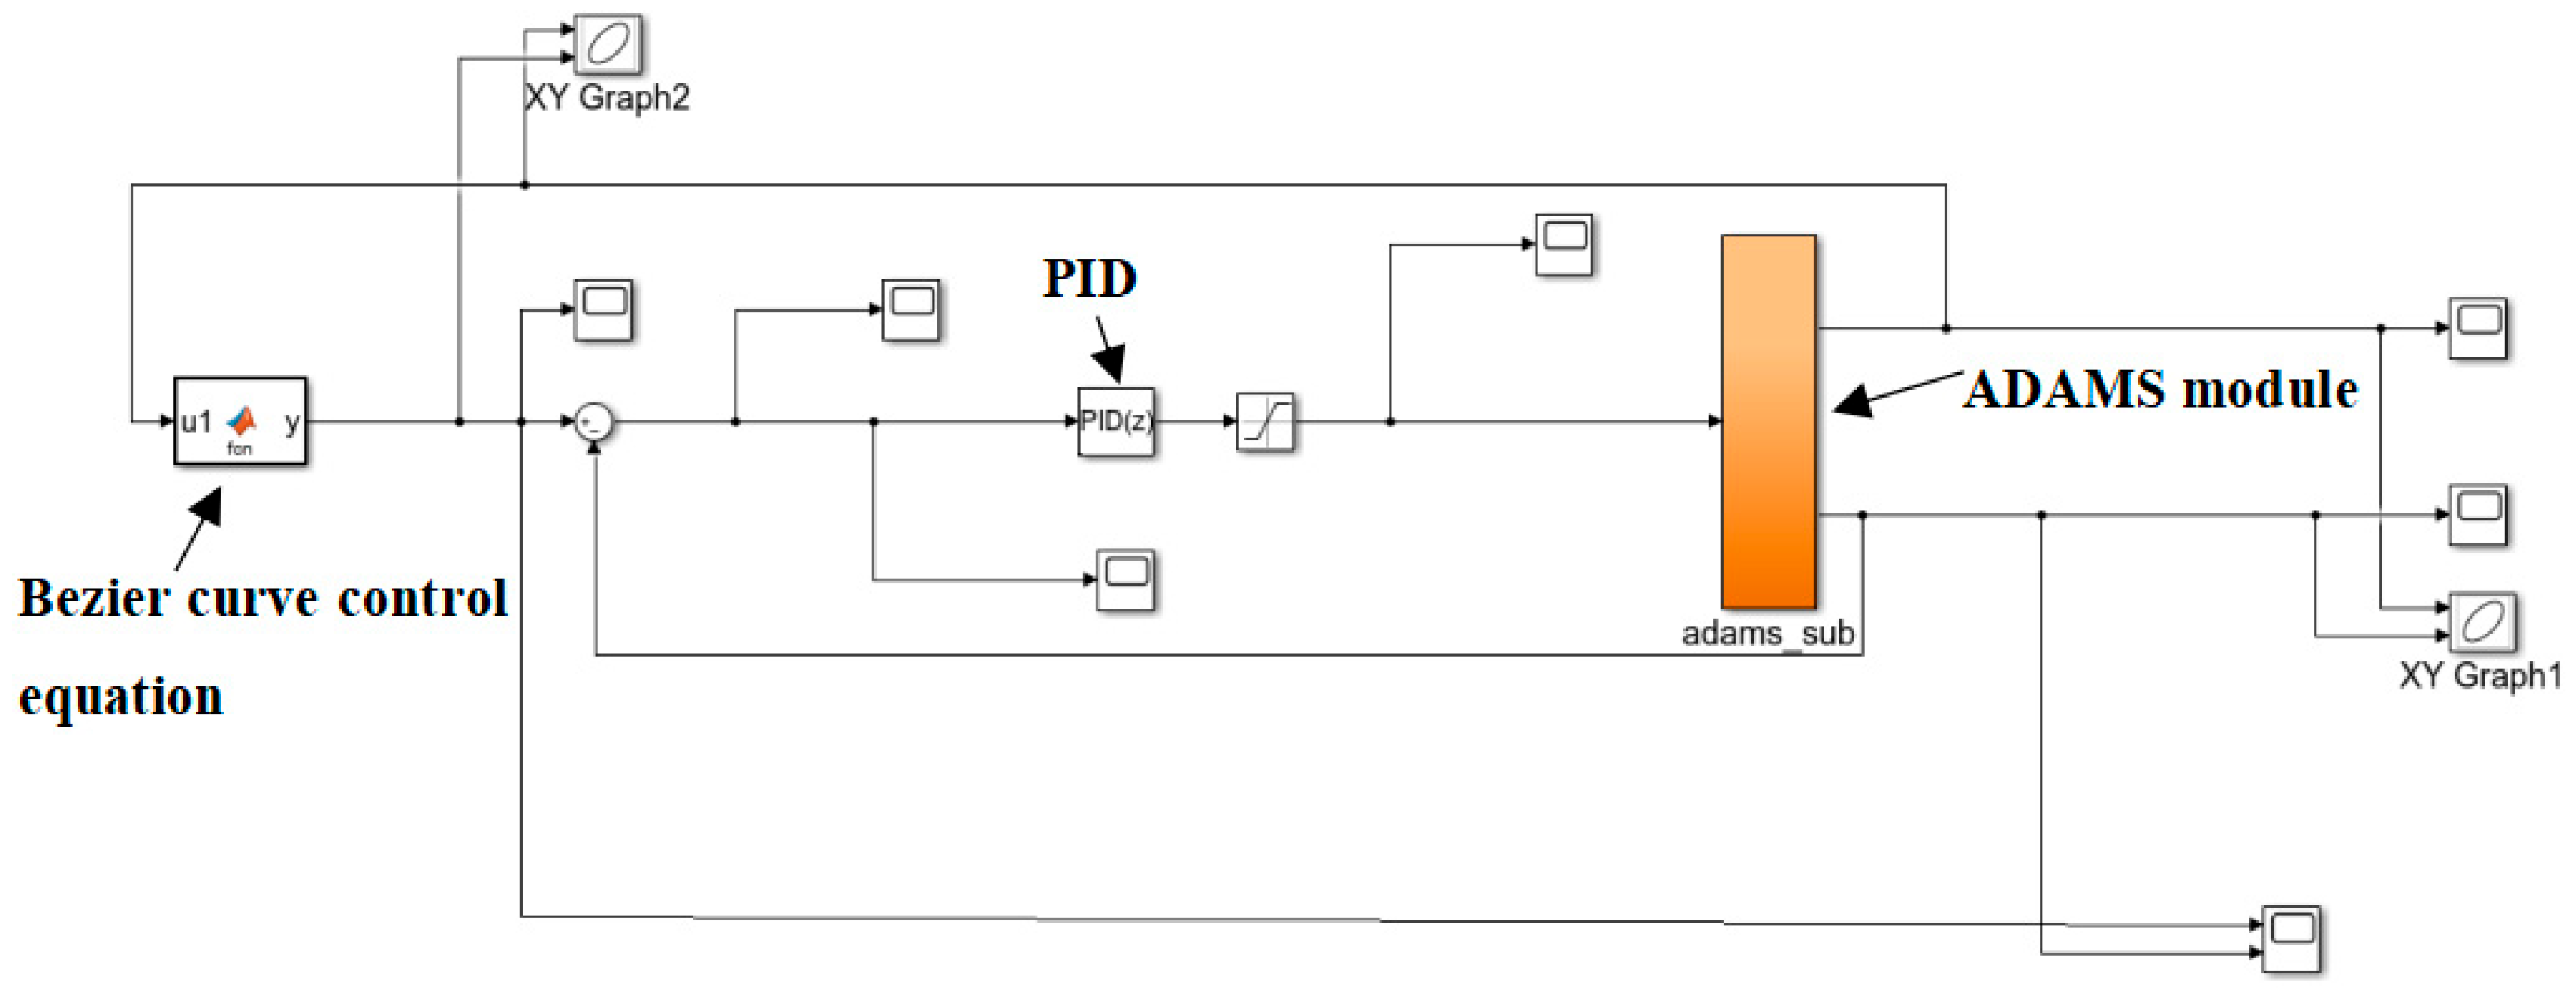
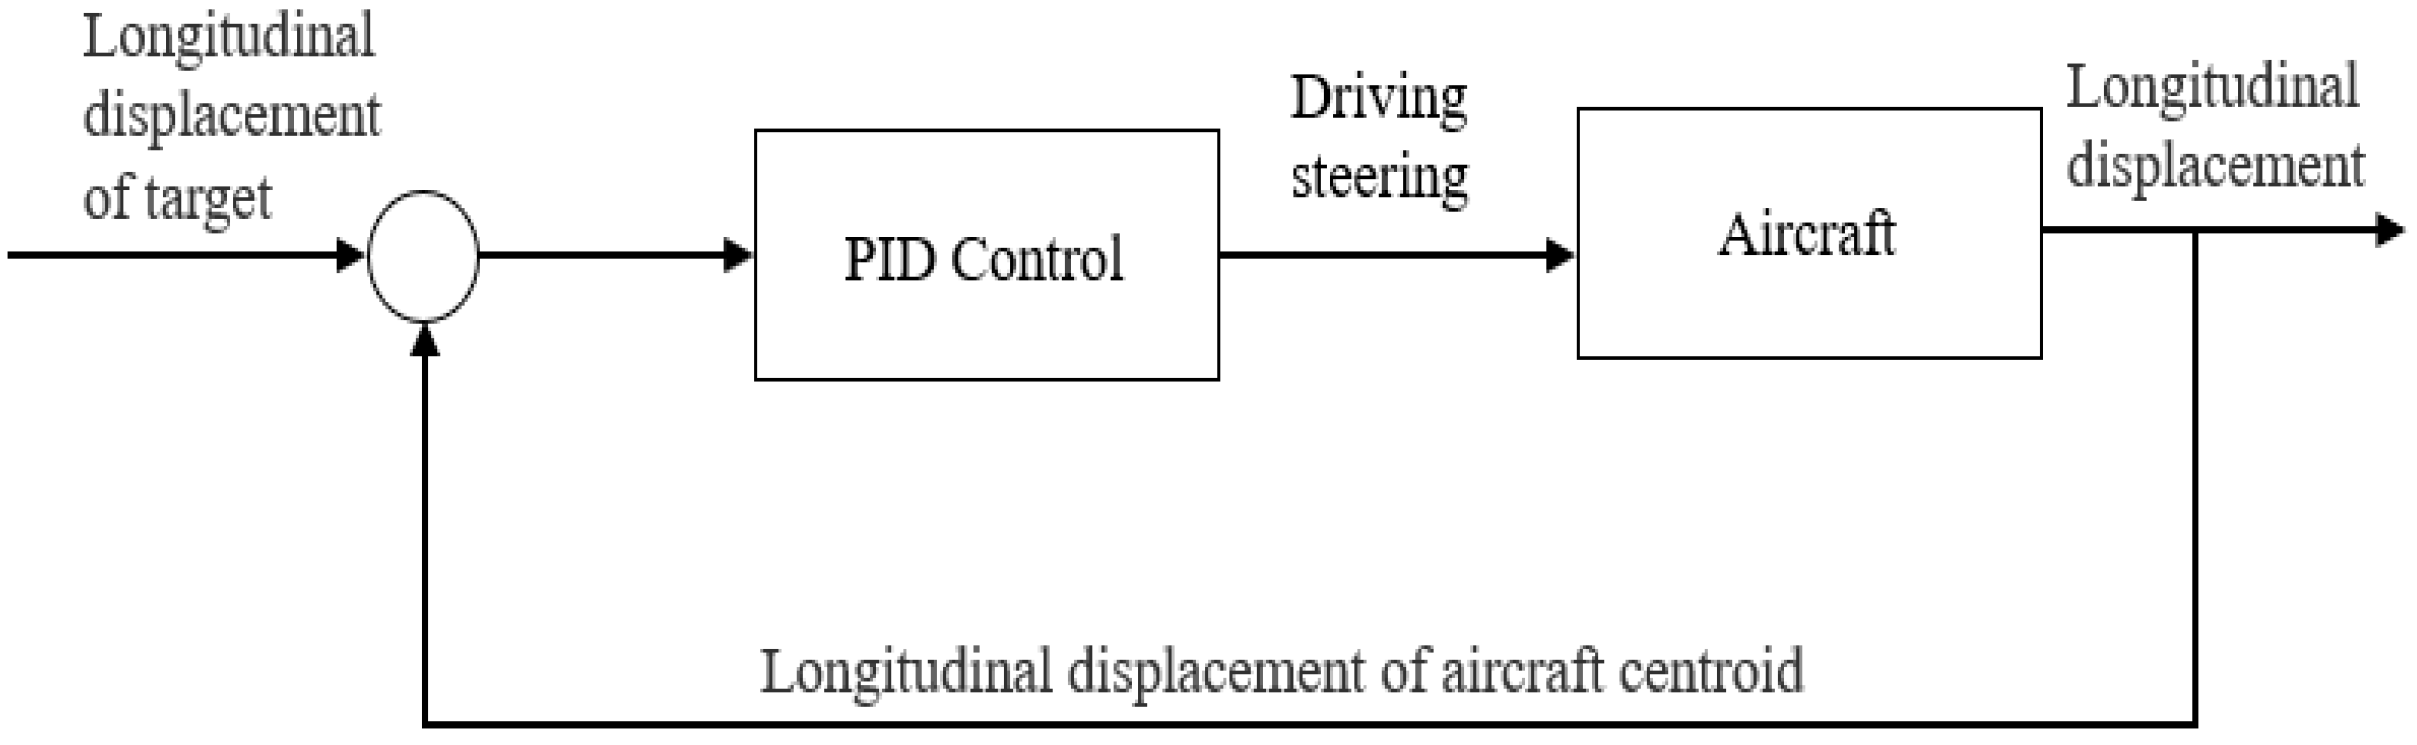
where kp is the proportional coefficient of the error linear combination; Ti is the time constant of the error integral; and TD is the error differential time constant. As shown in Figure 8, a classical negative feedback PID control structure is adopted, in which the lateral displacement error between the reference trajectory and the actual aircraft motion is fed into the PID controller to generate the steering command, driving the tracking error toward zero. The PID parameters are listed in Table 5.
According to the setting lateral displacement of the aircraft centroid ys and the actual lateral displacement of the aircraft centroid y, the control deviation is formed.
e ( t ) = y s ( t ) y ( t )
Through PID control, the parameters P, I, and D are adjusted to make the aircraft move along the setting Bezier curve.

4. Dynamics and Safety Analysis

Based on the carrier-based aircraft–winch dynamic model, the relevant parameters of the system are selected for the calculation example analysis. The front three-point aircraft is chosen and the mass of the aircraft is 13,000 kg, the coordinate of the mass center for the aircraft is (0, 0, 2.8), and the moment of inertia for the fuselage Ixx is 18,000 kg/m2, Iyy is 32,666.7 kg/m2, and Izz is 50,666.7 kg/m2. The rope system is the most important part of the winch traction in terms of safety, and its contact and rope parameters are shown in Table 5. Assuming that the deck is flat without pits or bulges, and the rolling angle of the ship is 5°, the pitching angle is 2° and the heaving amplitude is 0.019 m—other parameters are shown in Table 6; these parameters originate from actual test data acquired in experimental trials.

4.1. Without Trajectory Control

The carrier-based aircraft reaches the designated position through the winch traction, and its trajectory is not unique. Considering the different time and distance required for the various driving trajectories, the rope force and tire force with and without trajectory control (the driving trajectory of aircraft without the control is a straight line) are analyzed so as to provide technical support for the selection of actual driving trajectory and the safety of winch traction. The research in this paper comes from a real engineering project which involves three-winch traction and five-winch traction, and these two traction modes are used in the actual traction of carrier-based aircraft. The three-winch traction and five-winch traction will be investigated in the following sections.

4.1.1. Three-Winch System Without Trajectory Control

In the three-winch traction, the position of the winch and the position of the aircraft traction point are shown in Table 7. The origin of the coordinate is the projection of the aircraft centroid on the deck at initiation. Assuming that the winch pulls the aircraft at a speed of 5 km/h, the winch radius is 0.5 m and the rotate speed of the front winch can be calculated; it is 318.31°/s.
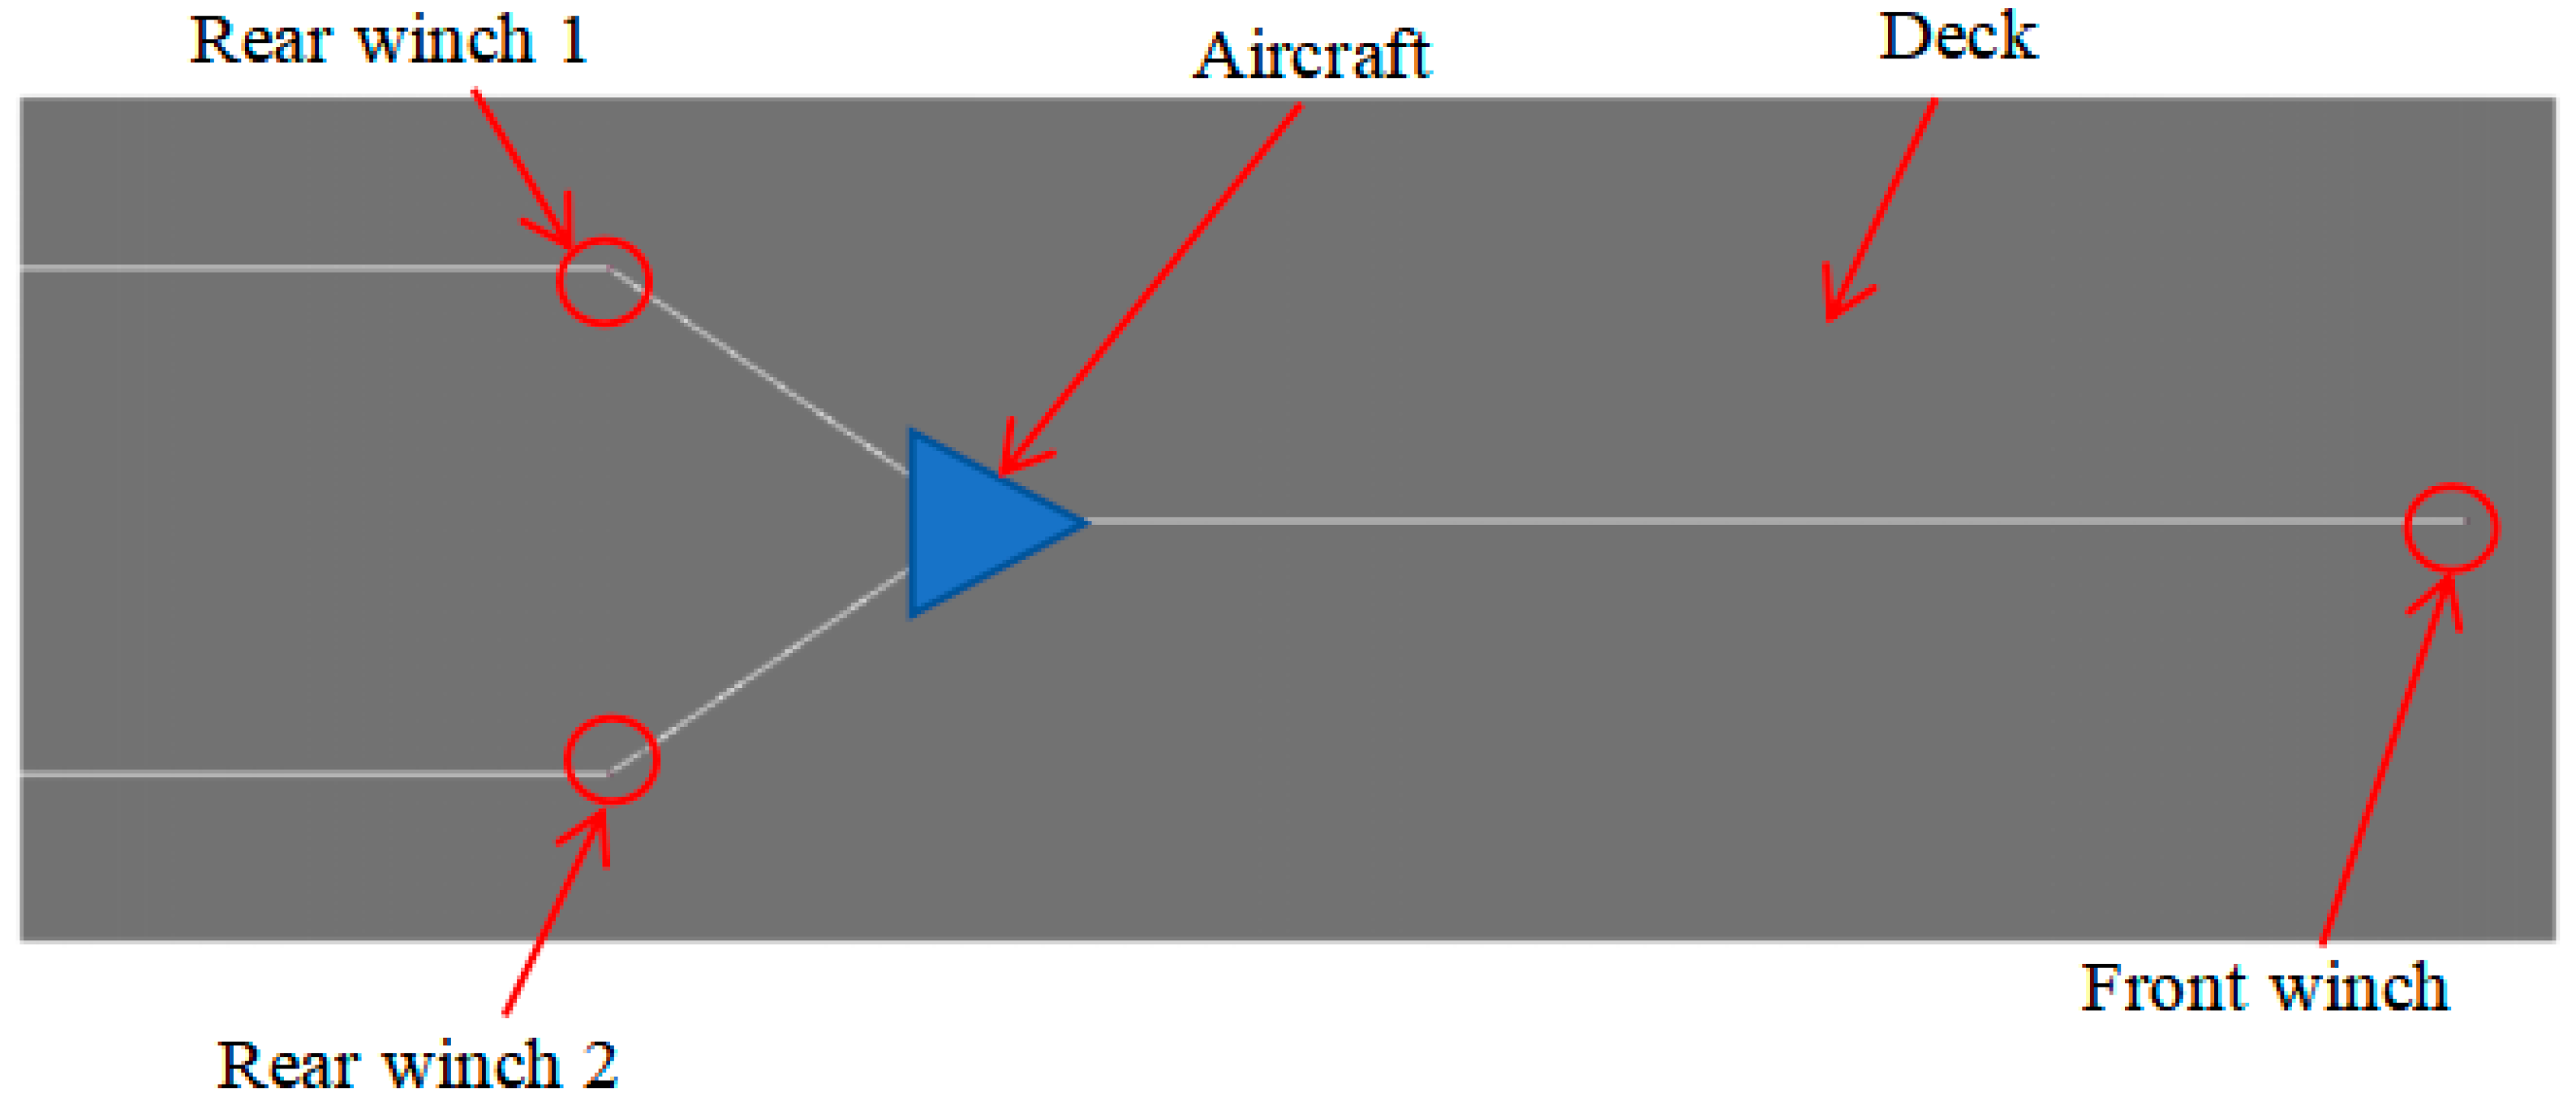
The ship-borne aircraft is towed by three winches, and the aircraft moves on the deck of the ship. As shown in Figure 9, during the three-winch traction, the three ropes are connected to the traction point on the aircraft, the forward winch couples to the tow point on the front landing gear of the ship-borne aircraft, and the rear two winches are connected to the traction points of the rear landing gear 1 and 2, respectively. When the aircraft goes into hangar, the front winch provides the traction force. In order to prevent the ship-borne aircraft from oscillation, the rear winch provides sufficient back traction forces. For studying the traction dynamics of the aircraft under the wind load and ship motion, the tire and rope forces without wind and ship motion should be calculated first. Without regard to the wind load and the ship motion, when the first three-point winch pulls the aircraft at the uniform motion in a straight line, the curves of the tire and rope forces over time are shown in Figure 10, Figure 11, Figure 12 and Figure 13. As shown in Figure 10, both the front and rear vertical tire forces exhibit pronounced transient fluctuations during the start-up phase, followed by convergence to steady values. This initial fluctuation is mainly caused by the sudden establishment of towing force, which induces vertical load transfer through the landing gear suspension. Figure 11 shows that the longitudinal force value of the rear wheel is nearly 2.4 times the front tire force value. During the acceleration stage, the longitudinal force increases rapidly as the winch traction overcomes inertial resistance and rolling friction. The higher longitudinal force on the rear wheels is primarily due to their proximity to the aircraft center of mass and the direct transmission of towing force through the rear traction points, resulting in a larger share of traction-induced friction demand. As illustrated in Figure 12, the lateral forces of the rear wheels dominate during the initial phase, while the front wheel lateral force becomes more significant after approximately 9 s. This behavior reflects the gradual adjustment of the aircraft yaw and lateral alignment during straight-line towing. In the early stage, minor asymmetries in rope tension and landing gear compliance lead to lateral force compensation mainly by the rear wheels. As the system reaches steady motion, the lateral load redistribution stabilizes, reducing the lateral force demand on the rear wheels. Figure 13 shows the time histories of rope forces for the front and rear winches under three-winch traction without wind and ship motion. A pronounced force peak is observed in the front winch rope during the start-up stage, whereas the rear winch rope forces remain comparatively lower. This behavior is primarily attributed to the functional roles of the winches: the front winch provides the main towing force required to overcome aircraft inertia and rolling resistance, while the rear winches mainly act to maintain longitudinal stability and suppress oscillations. During start-up, the sudden engagement of traction, combined with rope elasticity and aircraft inertia, leads to a transient force amplification in the front rope. These results indicate that the front winch rope is the most critical load-bearing component during the initiation of towing and should be the primary focus in strength design and safety assessment of the traction system.
Considering the wind load and the ship motion, the curves of the tire force and the rope force with time under the traction of three winches can be obtained, as shown in Figure 14, Figure 15, Figure 16 and Figure 17, where all force values fluctuate greatly in the initial stage and stabilize to a certain value after a short time; the value of the rear tire force is about 2.5 times of the front tire force, as seen in Figure 14. As can be observed from Figure 15, the longitudinal force also exhibits pronounced transient fluctuations during the start-up stage, and the fluctuation amplitude shows a certain periodic characteristic induced by ship motion. Compared with the static deck condition, both the peak and mean values of the longitudinal force are increased, indicating that wind load and ship motion significantly raise the traction force required to overcome inertia and friction. Figure 16 indicates that, under the combined effects of wind load and ship motion, the lateral tire forces exhibit the most pronounced fluctuations. As shown in Figure 17, the rope force exhibits a pronounced impact peak during the start-up stage, with the initial fluctuation amplitude of the front winch rope being much larger than that of the rear winches. This behavior is attributed to the fact that, at the moment of aircraft start-up, the traction system must overcome large inertial forces, tire friction forces, and the superimposed effects of wind load.
It can be seen from Figure 10, Figure 11, Figure 12, Figure 13, Figure 14, Figure 15, Figure 16 and Figure 17 that the ship movement and wind load will have a significant impact on the tire force and rope force. The vertical force, as the largest force in the tire force, increases by 15.5% in the wind load and ship movement when compared with no wind load and no ship movement, while the front rope force increases by 26%. Therefore, considering the ship movement, we should pay more attention to the strength limit of the front rope to ensure traction safety.

4.1.2. Five-Winch System Without Trajectory Control

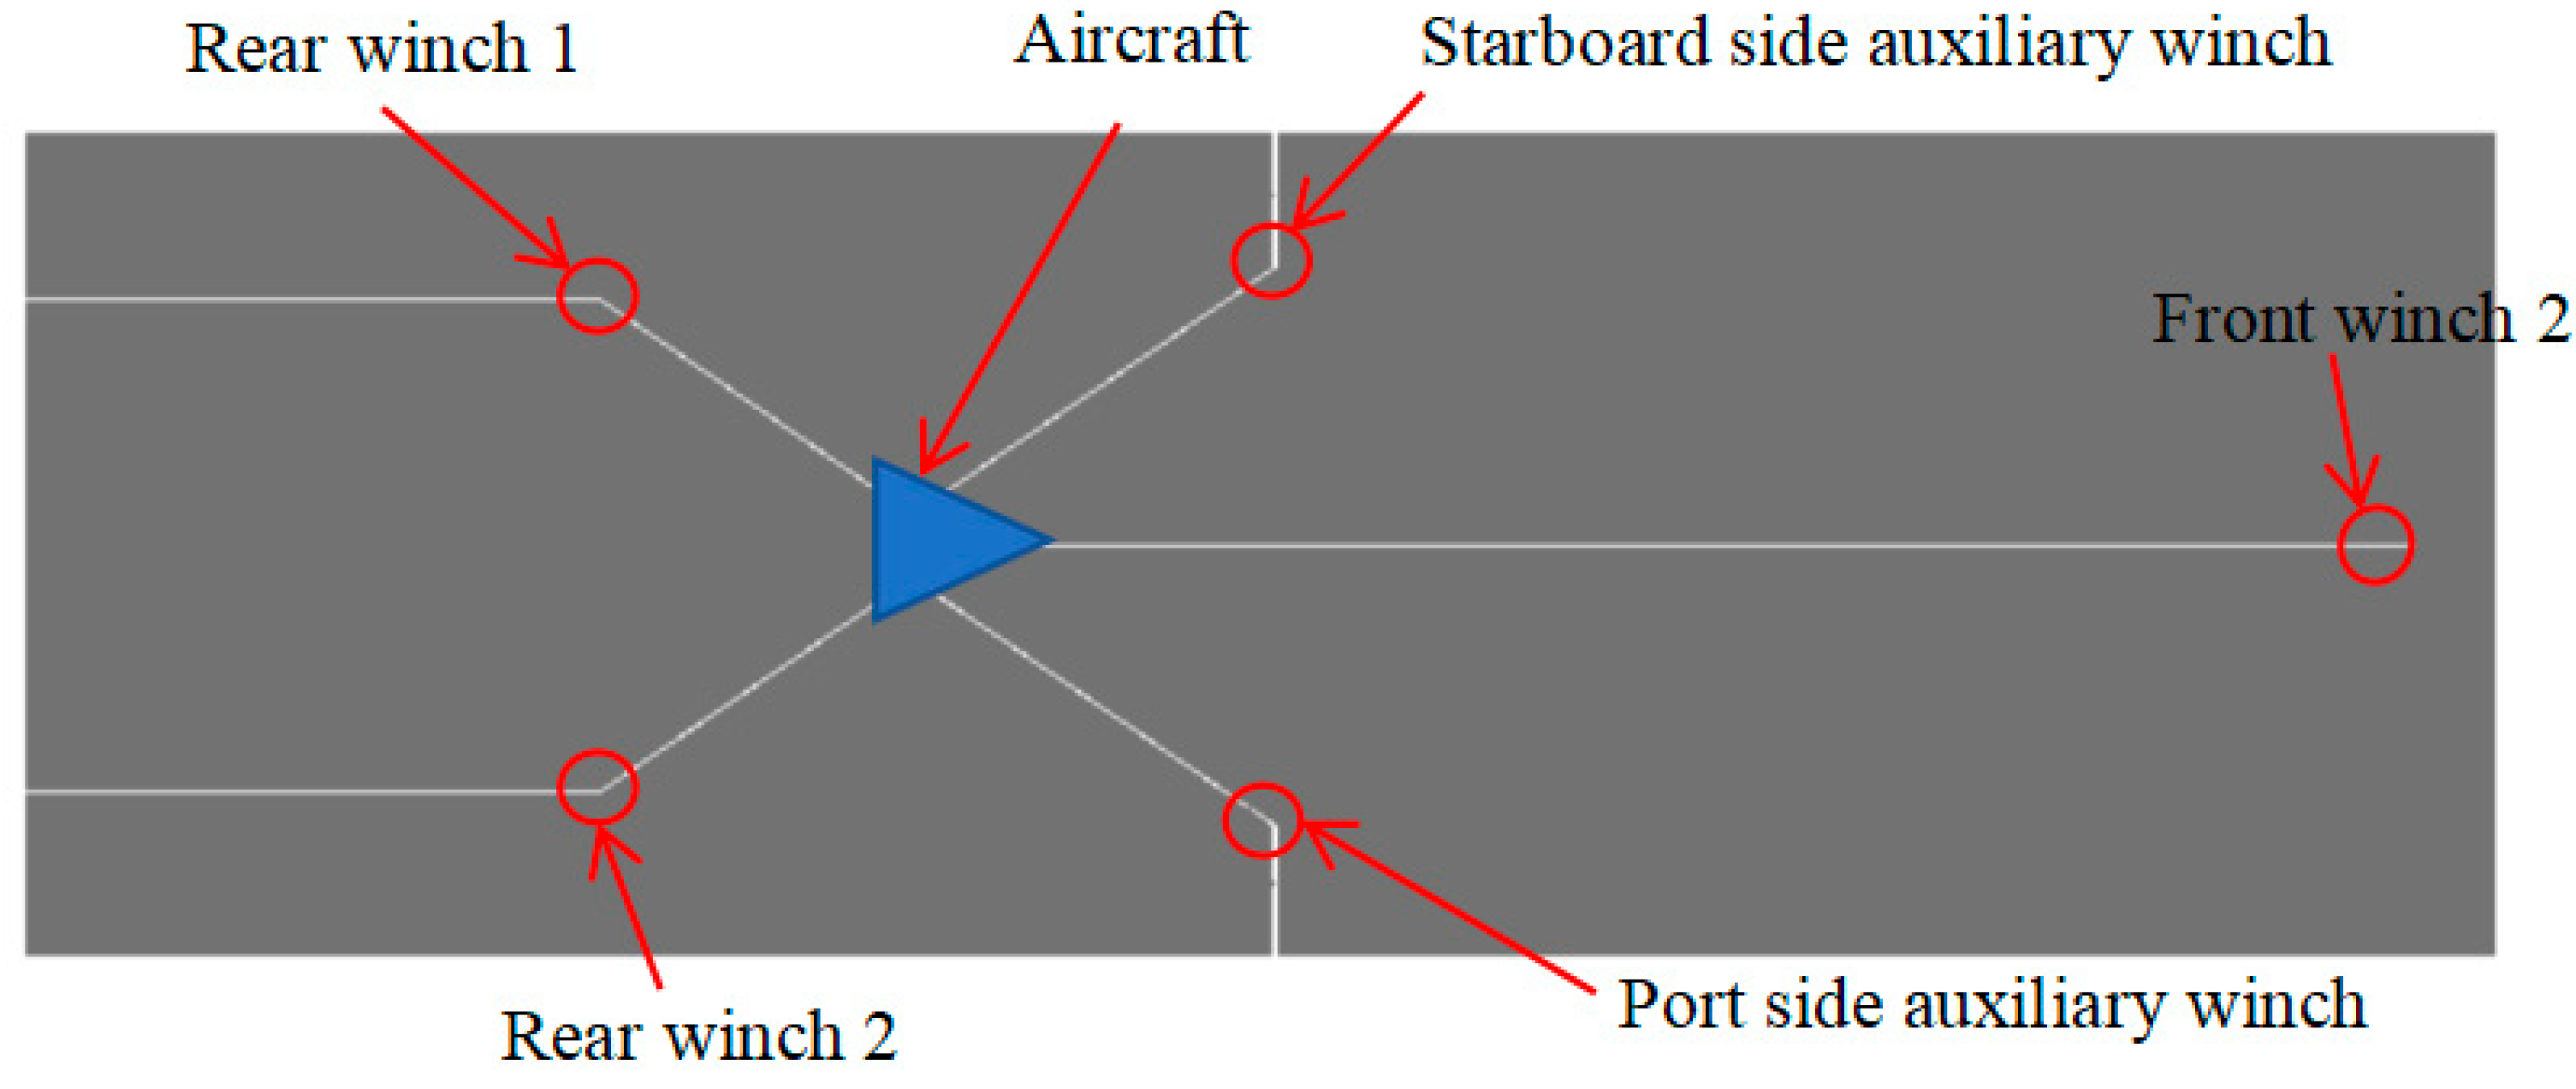
When the aircraft is pulled by five winches, the positions of the front winch and the two rear winches are similar to those of the three winches. The two additional auxiliary winches are located between the flight deck and the hangar, as shown in Figure 18. During the process of the traction, the cable of the forward winch couples to the tow point of the front landing gear, and the cables of the left and right auxiliary winches are connected to the corresponding traction points of the rear landing gears, respectively. When the ship-borne aircraft is towed on the flight deck, the front winch and two auxiliary winches provide the traction force, and the rear winch provides the back traction forces. The coordinates of the five winch traction points are shown in Table 8.
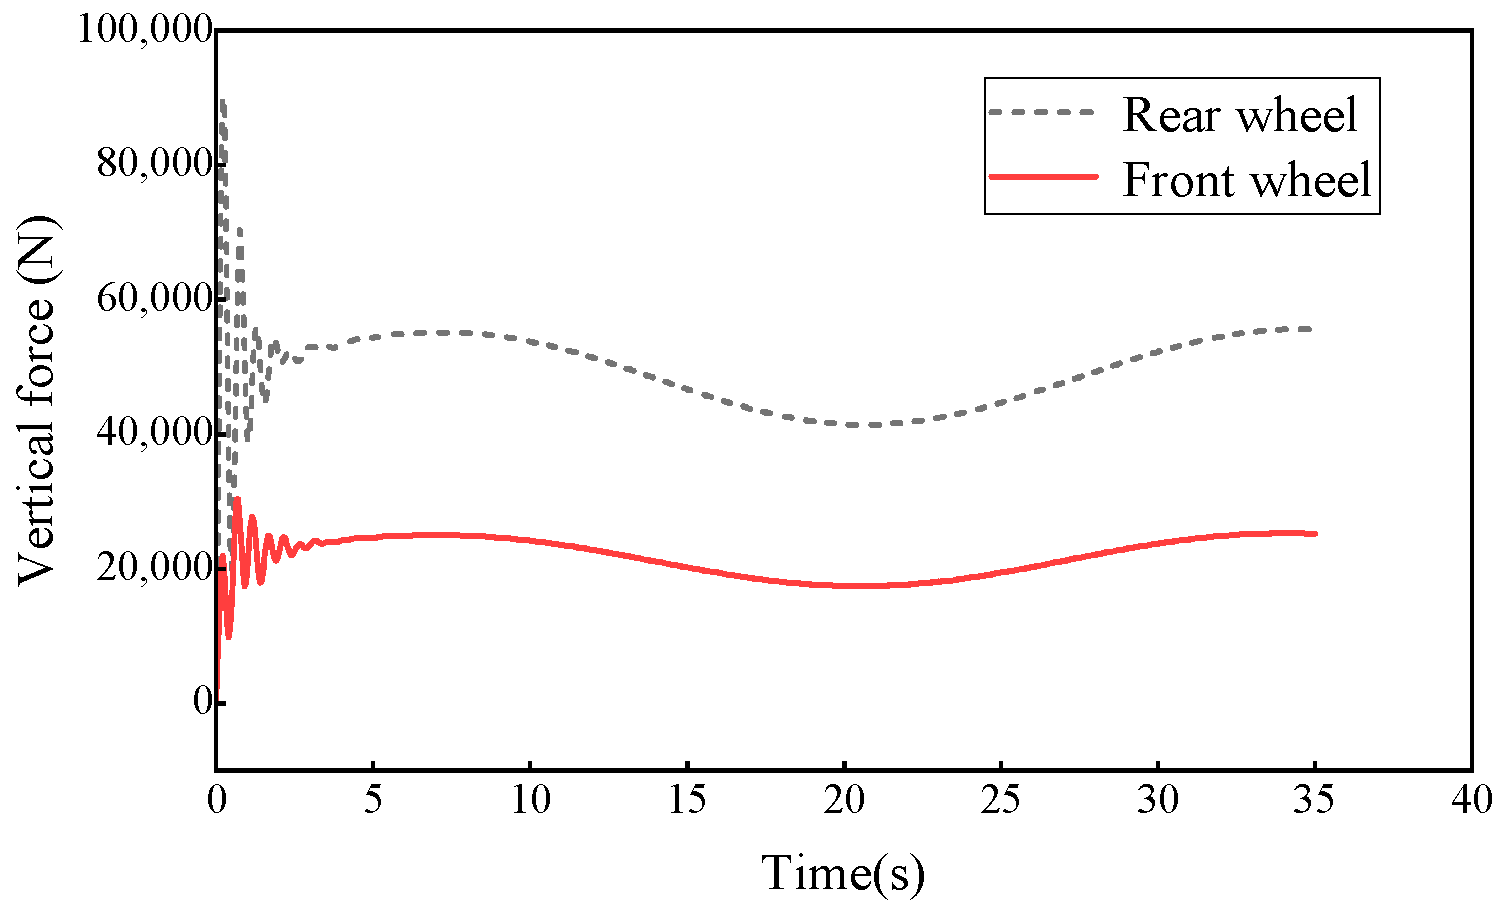
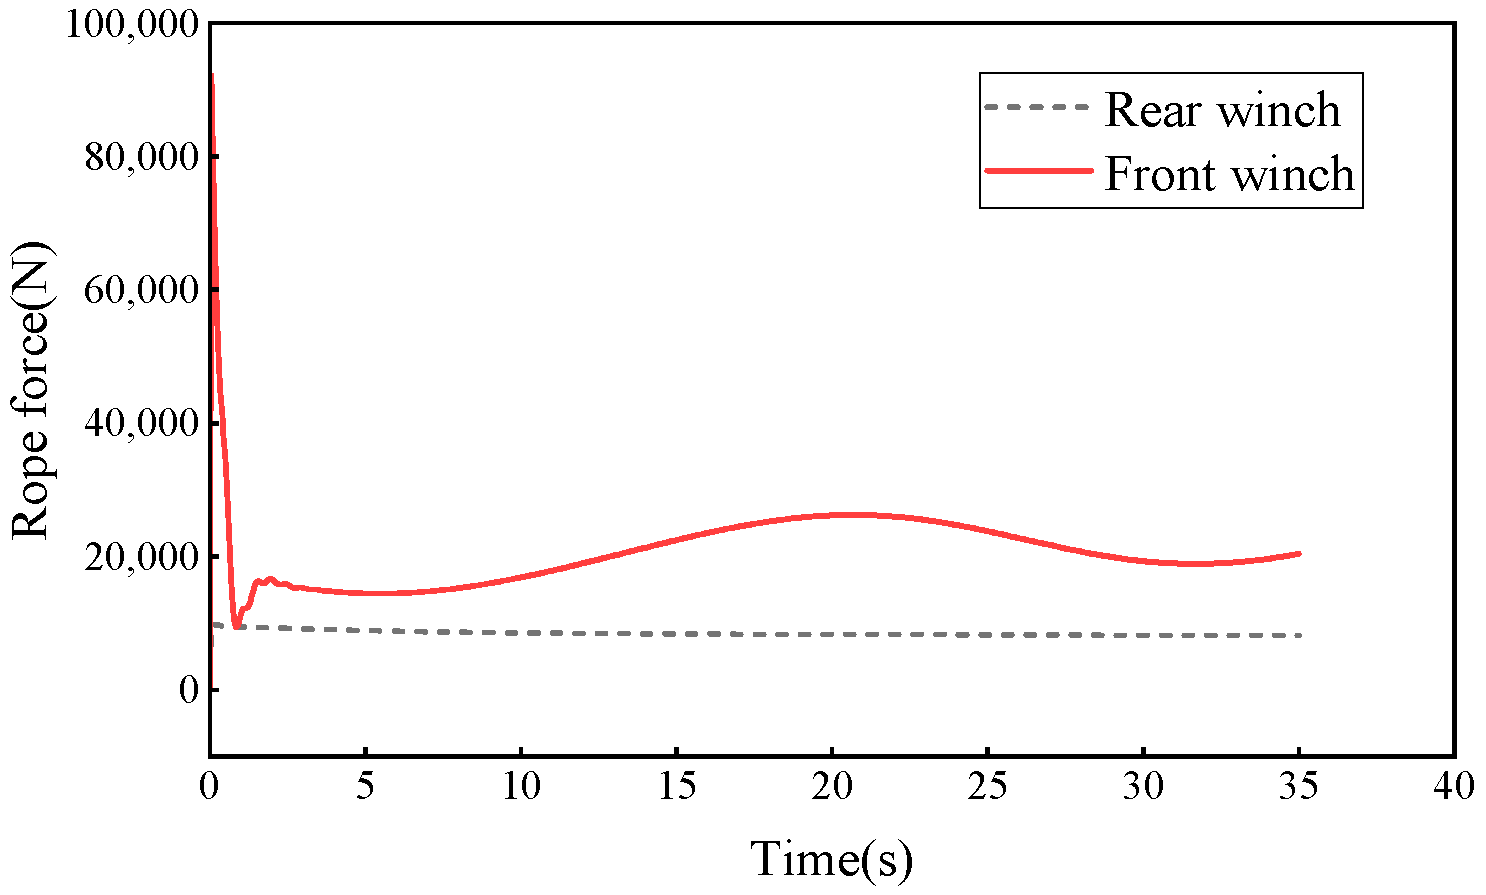
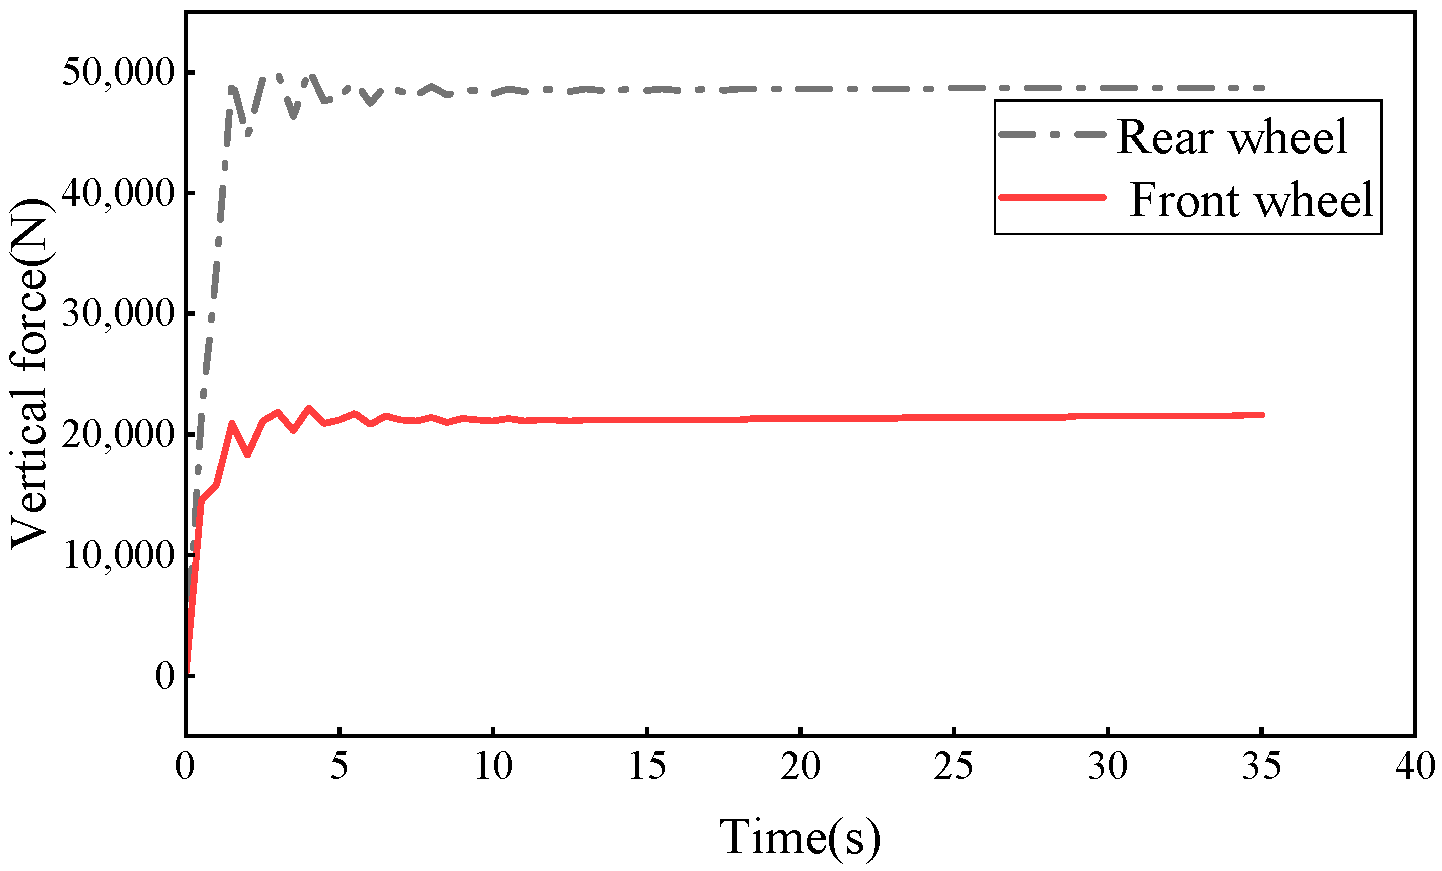
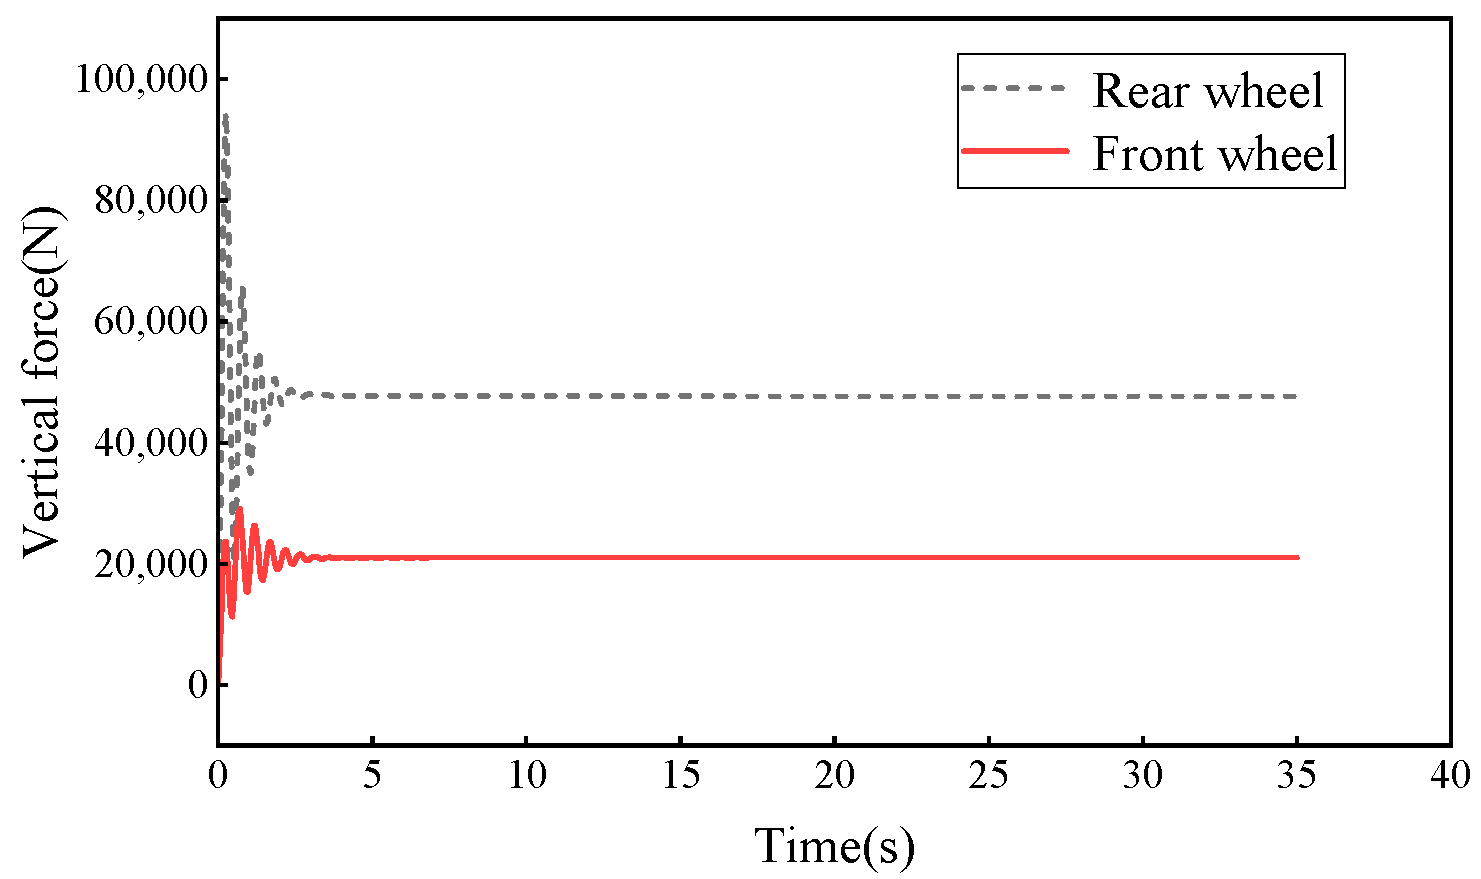
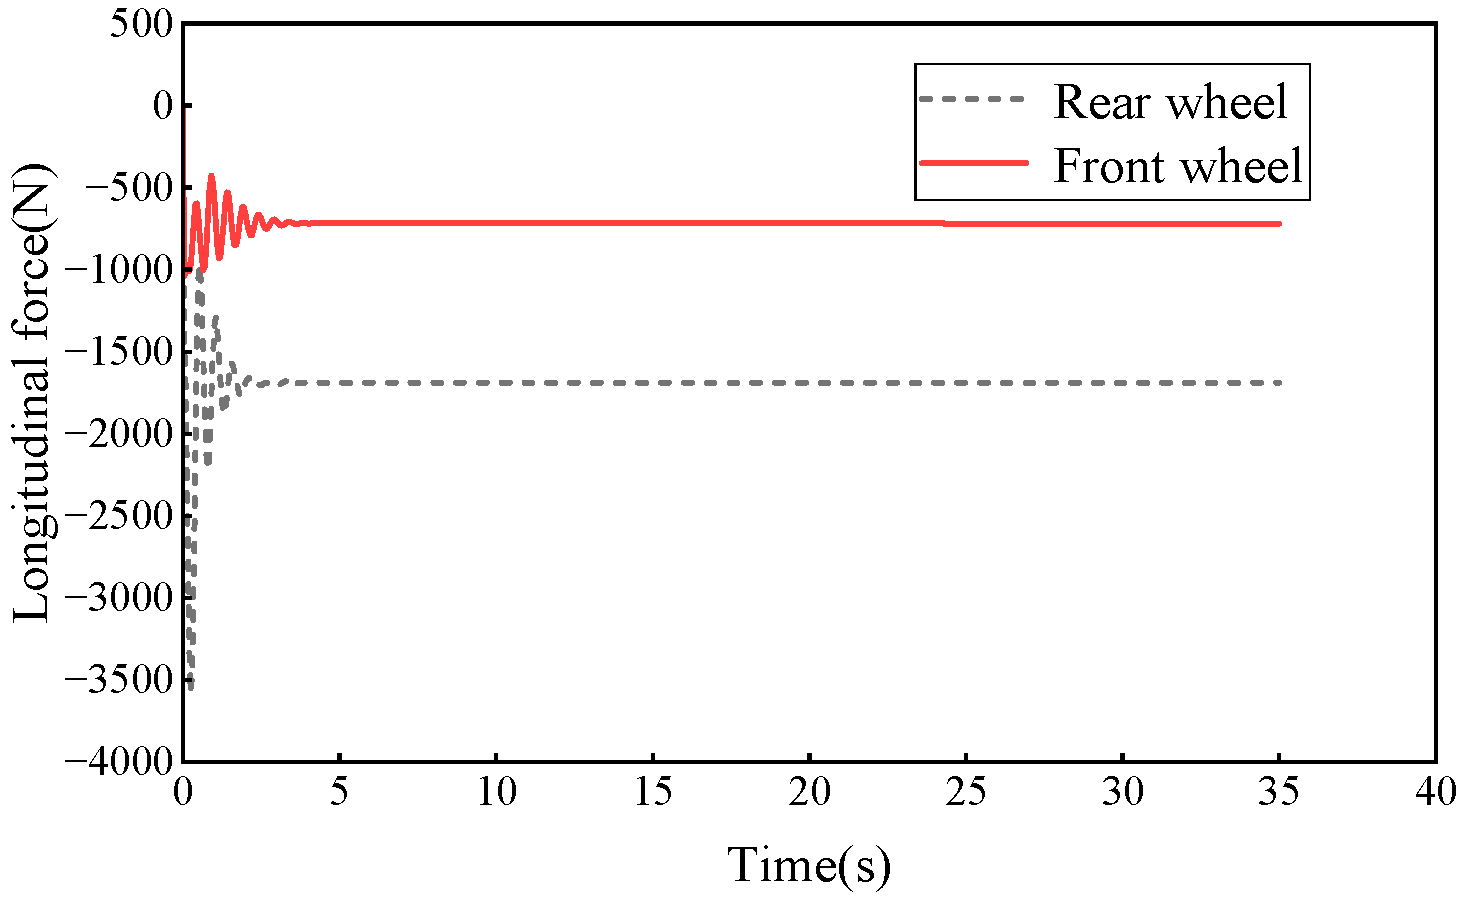
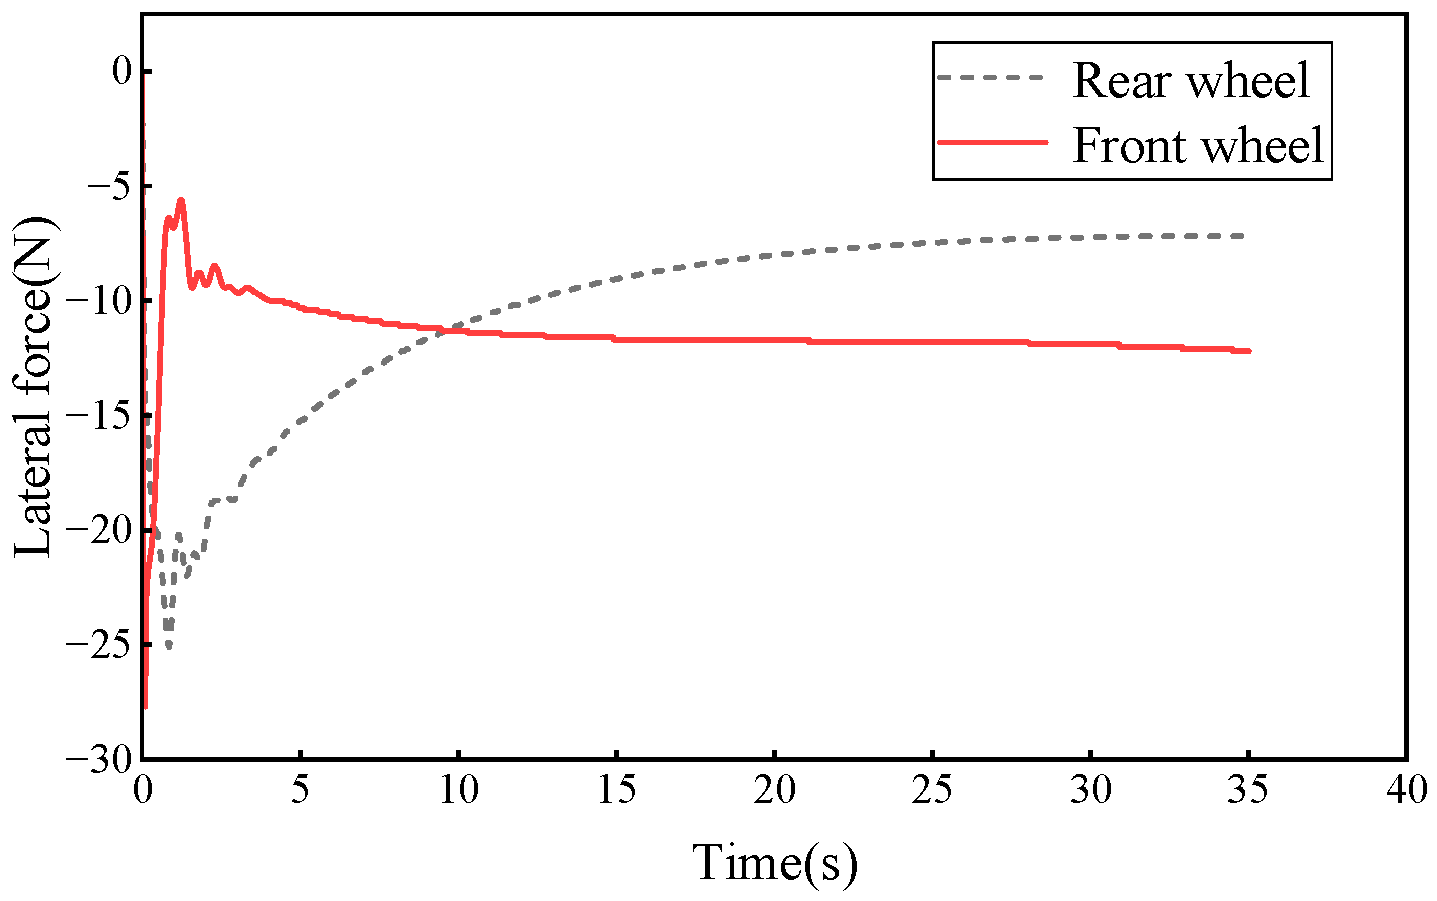
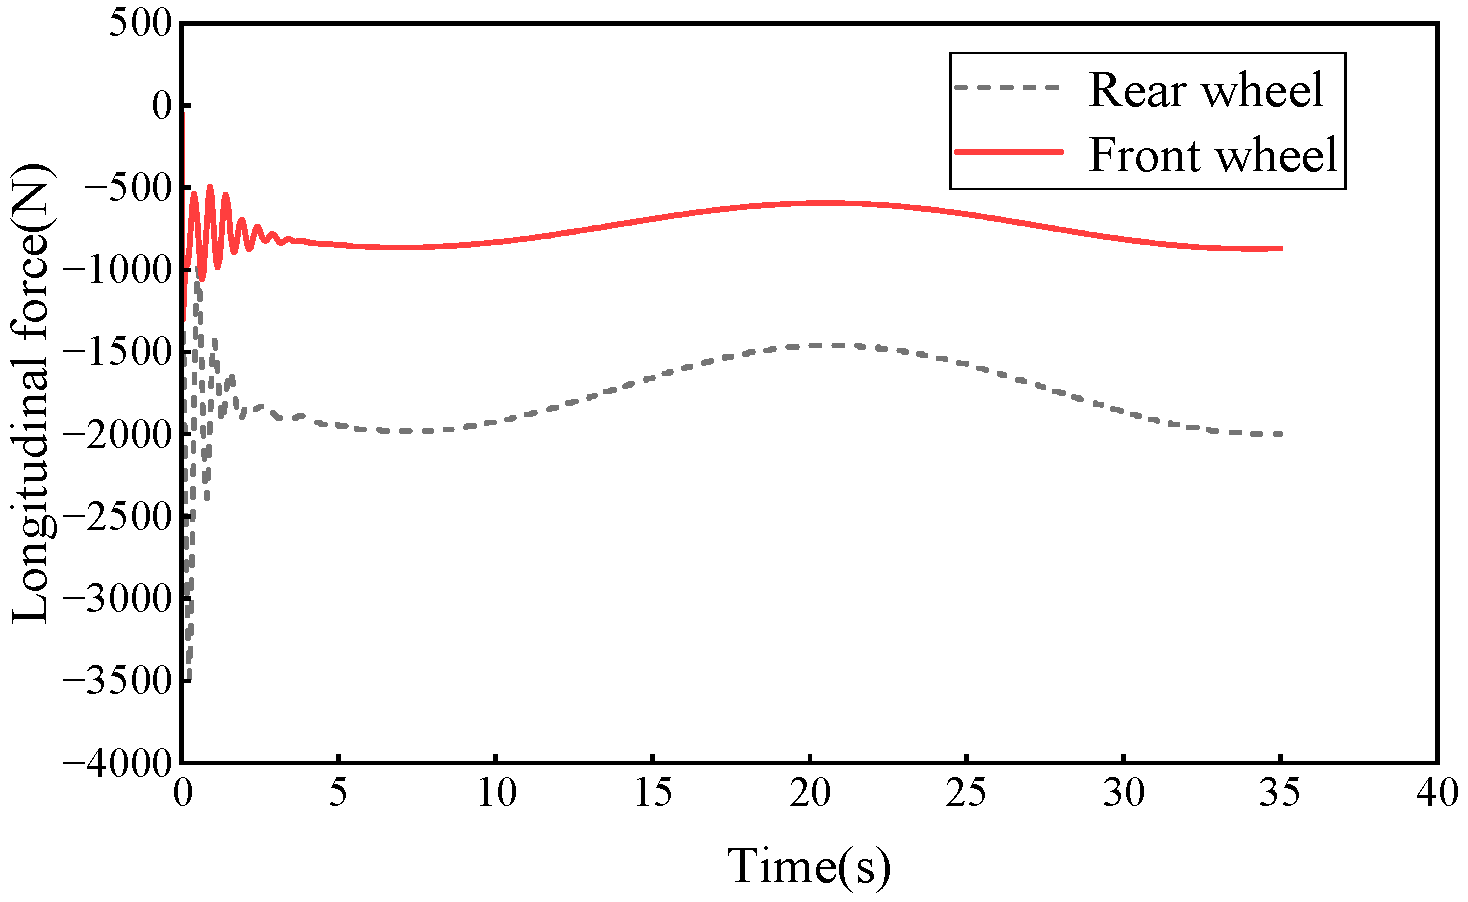
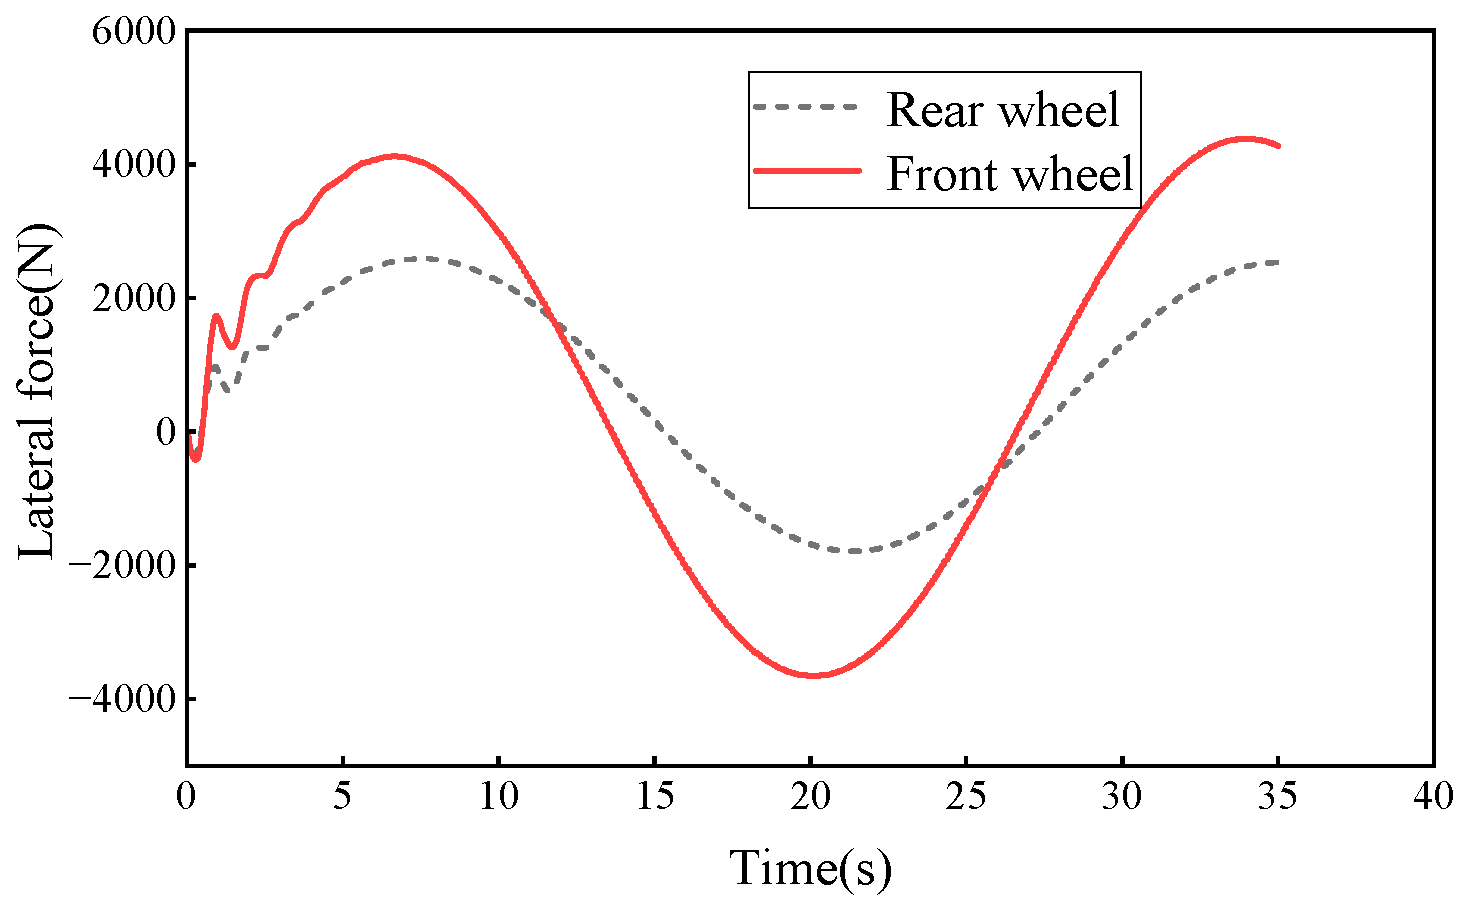
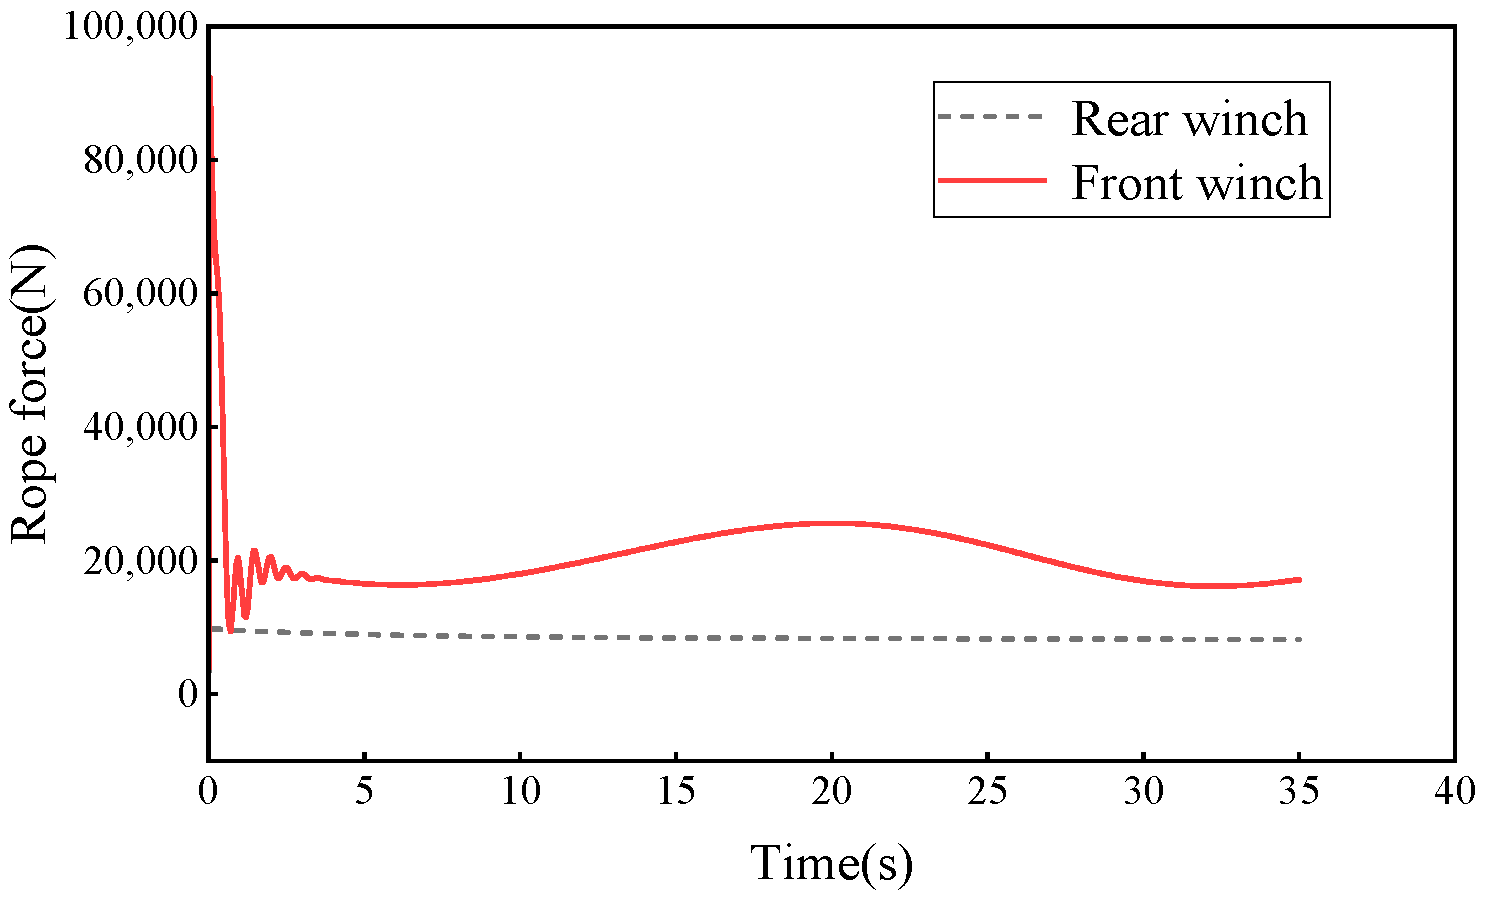
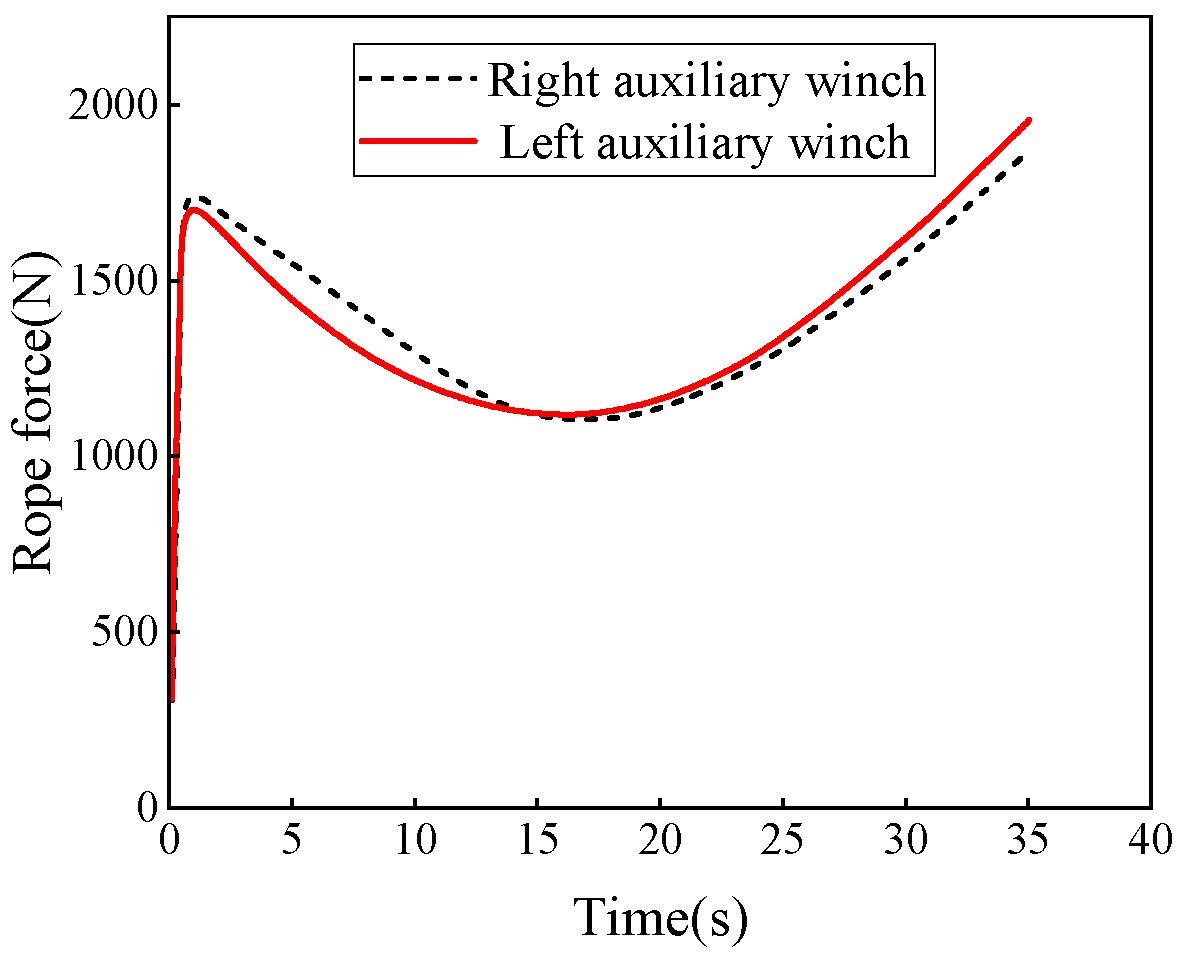
Taking the front three-point aircraft as an example, when the aircraft is dragged by five winches, the aircraft is moving in a straight line at a constant speed, and the curves of the tire and the rope forces with change in time are drawn under the wind load, as shown in Figure 19, Figure 20, Figure 21, Figure 22 and Figure 23, where it is shown that the vertical and longitudinal forces of the tire fluctuate greatly during the start-up stage. Figure 19 presents the time histories of the vertical tire forces acting on the front and rear wheels during five-winch traction. Both forces exhibit pronounced transient fluctuations at the start-up stage, followed by convergence to steady-state values. The initial fluctuations are mainly caused by the sudden establishment of towing force and the vertical load transfer through the landing gear suspension as the aircraft accelerates. In steady motion, the rear wheels carry significantly higher vertical loads than the front wheel, reaching nearly twice the front-wheel load. This load distribution is primarily due to the aircraft mass layout and the fact that multiple winch ropes are directly connected to the rear landing gears, increasing their vertical load contribution. These results indicate that the rear landing gears are the primary load-bearing components in the vertical direction during five-winch traction. Figure 20 shows the longitudinal tire forces of the front and rear wheels as functions of time. During the start-up phase, both forces increase rapidly as the winch system overcomes the aircraft inertia and rolling resistance. After this transient stage, the forces stabilize at relatively constant levels. The longitudinal force acting on the rear wheels is consistently larger than that on the front wheel. This behavior results from the traction point configuration of the five-winch system, in which the rear landing gears are directly subjected to both forward pulling forces from auxiliary winches and balancing forces from rear winches. Consequently, a larger portion of the traction-induced friction demand is borne by the rear wheels. The stable longitudinal force profiles in the steady state suggest that the five-winch configuration provides effective load sharing once coordinated towing is established. The vertical and longitudinal forces of the front tire fluctuate less. As can be seen in Figure 21, the fluctuation amplitude of the lateral force of the rear wheel is greater than that of the front wheel, maximizing at 215% of the front wheel. The results highlight the importance of the rear landing gears in resisting lateral loads and ensuring stable towing under multi-winch configurations. In Figure 22, when the speed of the traction aircraft is 5 km/h, the largest rope force of starting state is up to 90,000 N, but after a short self-balancing time (about 1 s), the rope force is stable between 10,000 N and 30,000 N. Compared with the three-winch traction, the fluctuation range of the front winch force becomes larger after adding two auxiliary winches. This transient peak arises from the combined effects of aircraft inertia, rope elasticity, and the simultaneous engagement of multiple winches at the onset of towing. Although the auxiliary winches share part of the traction load, the front winch remains the primary source of longitudinal towing force, resulting in a concentrated transient load during acceleration. In Figure 23, the force of the left auxiliary rope is very close to the force of the right auxiliary rope, and there is almost no difference; the auxiliary rope tension in the winch traction start stage increases in a very short time period (0~1 s), and as the aircraft moves forward, the auxiliary rope tension gradually decreases (1~17 s), and then increases (after 17 s). This is because the auxiliary rope provides the active pulling force, and then provides the back tension, and there is a critical value, namely, when the aircraft passes through a plane formed by the two auxiliary winches.

4.2. Under Setting Trajectory Control

4.2.1. Three-Winch Traction Under Trajectory Control

In this section, the three-winch traction is used and the front three-point aircraft is selected to carry out the co-simulation under the setting trajectory by MATLAB/SIMULINK (MATLAB R2021b) and ADAMS. The input is the angle of the steering wheel, and the output is the trajectory of the aircraft centroid. The Bezier curve is a classic trajectory for the carrier-based aircraft in hangar; therefore, the aircraft trajectory is controlled by the setting Bezier curve. In order to analyze the PID control effect of carrier-based aircraft with or without external excitation, each force’s variation curve and trajectory with the change in time in the process of motion is drawn, respectively. Figure 24 is the flow chart of the control module in SIMULINK. The system calculates the actual displacement of the carrier aircraft along the y-axis and compares this actual displacement with the target displacement along the y-axis in a predetermined trajectory (Bezier curve). Then, the obtained displacement difference is converted into the required steering angle of the carrier-based aircraft by adopting the PID control strategy.
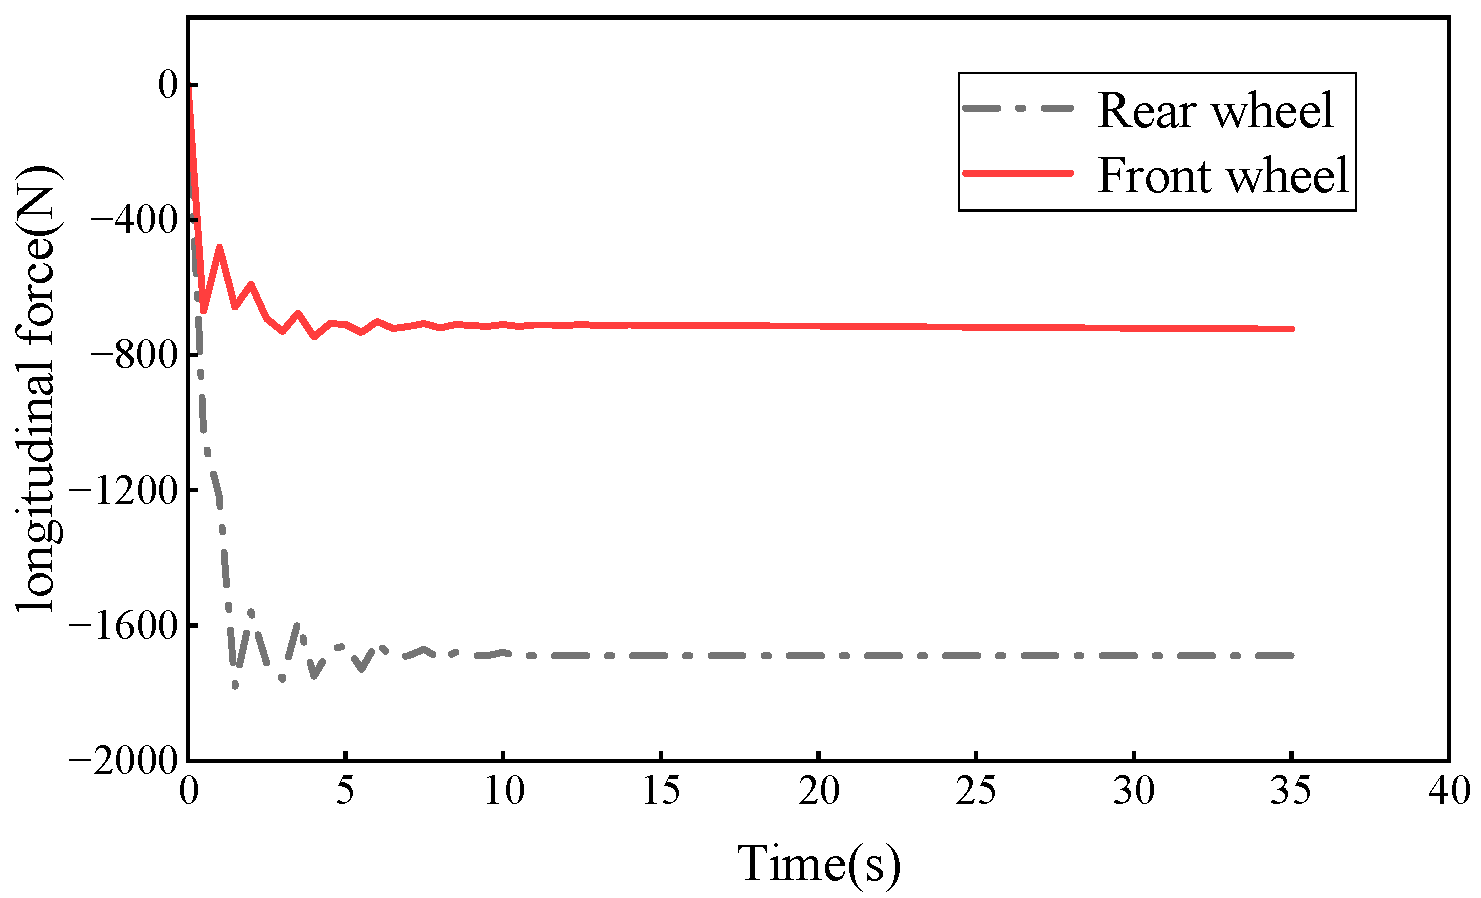
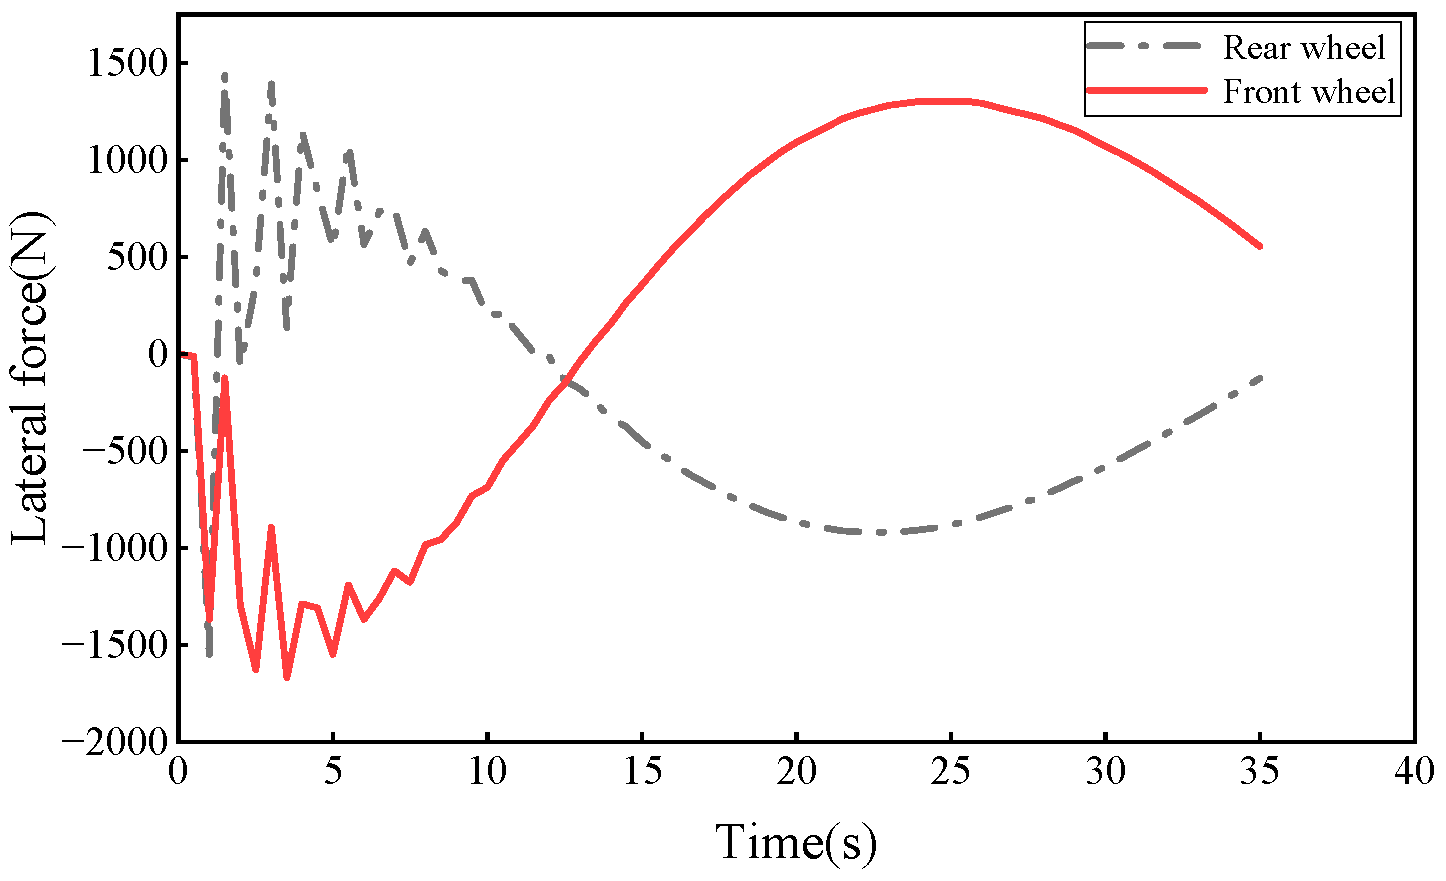
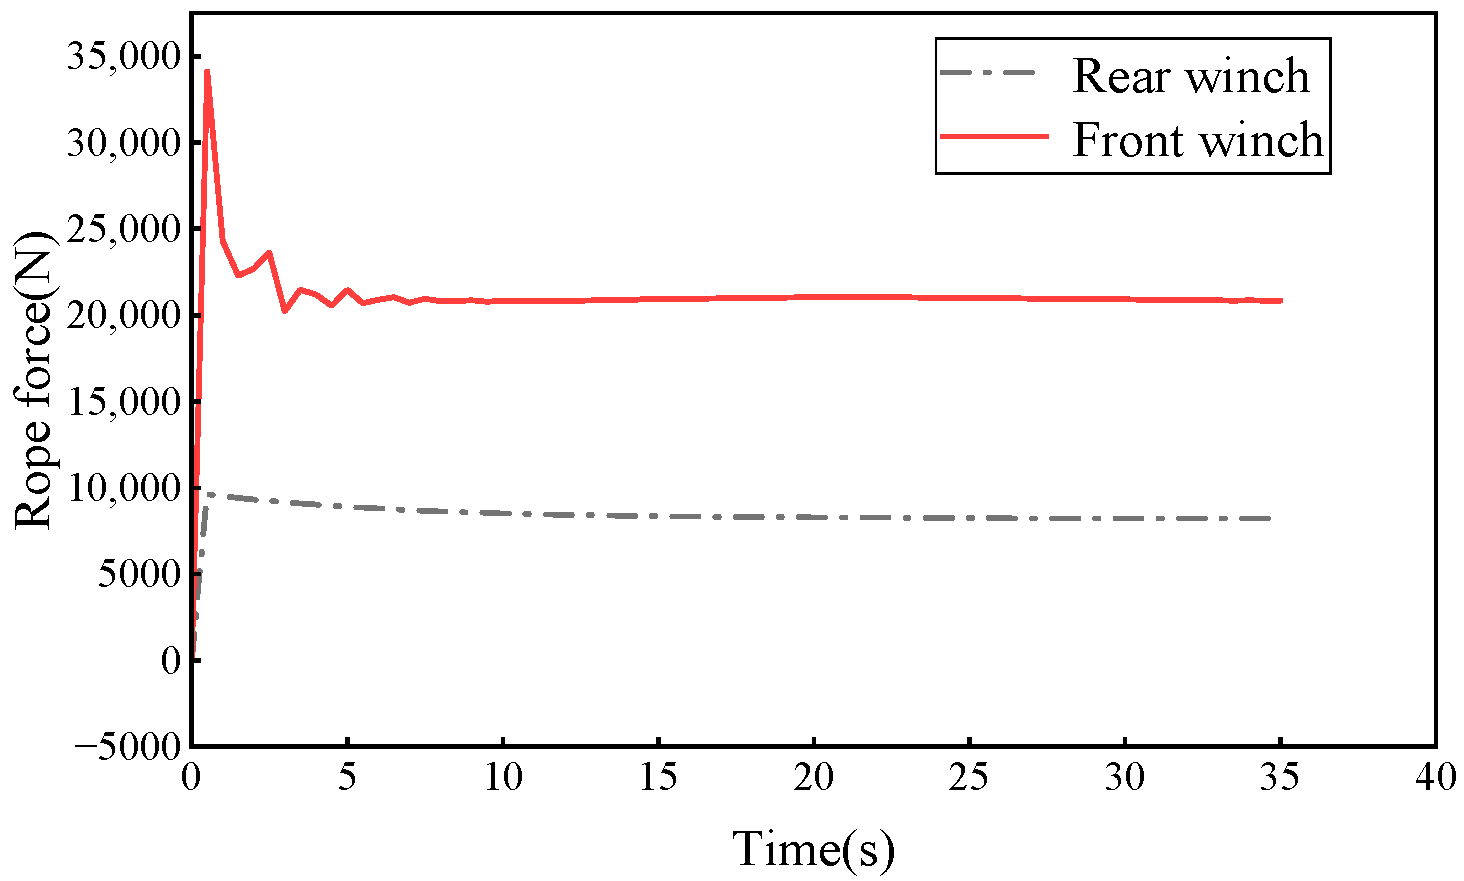
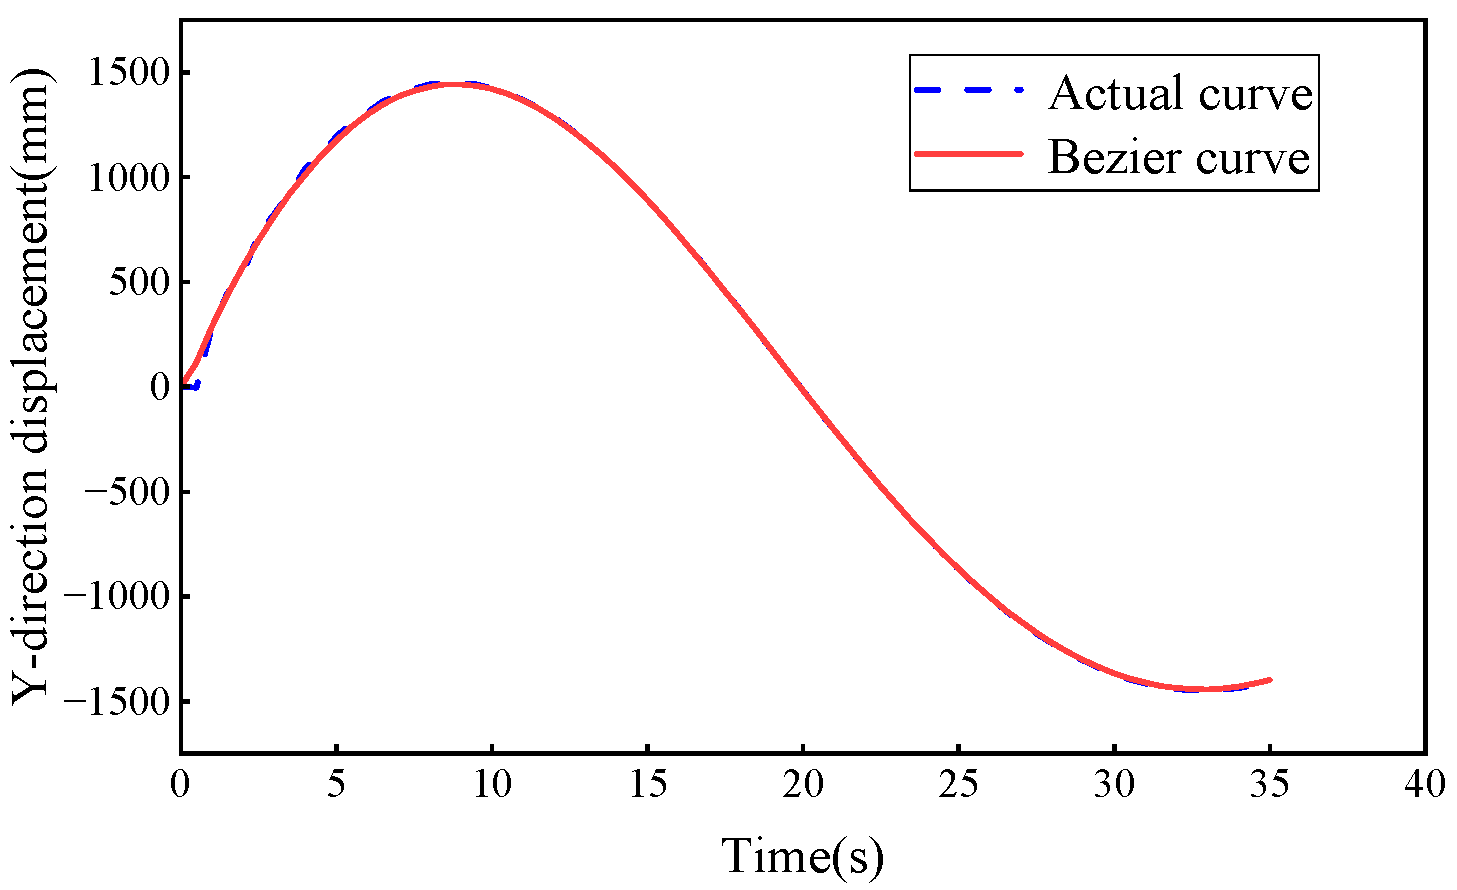
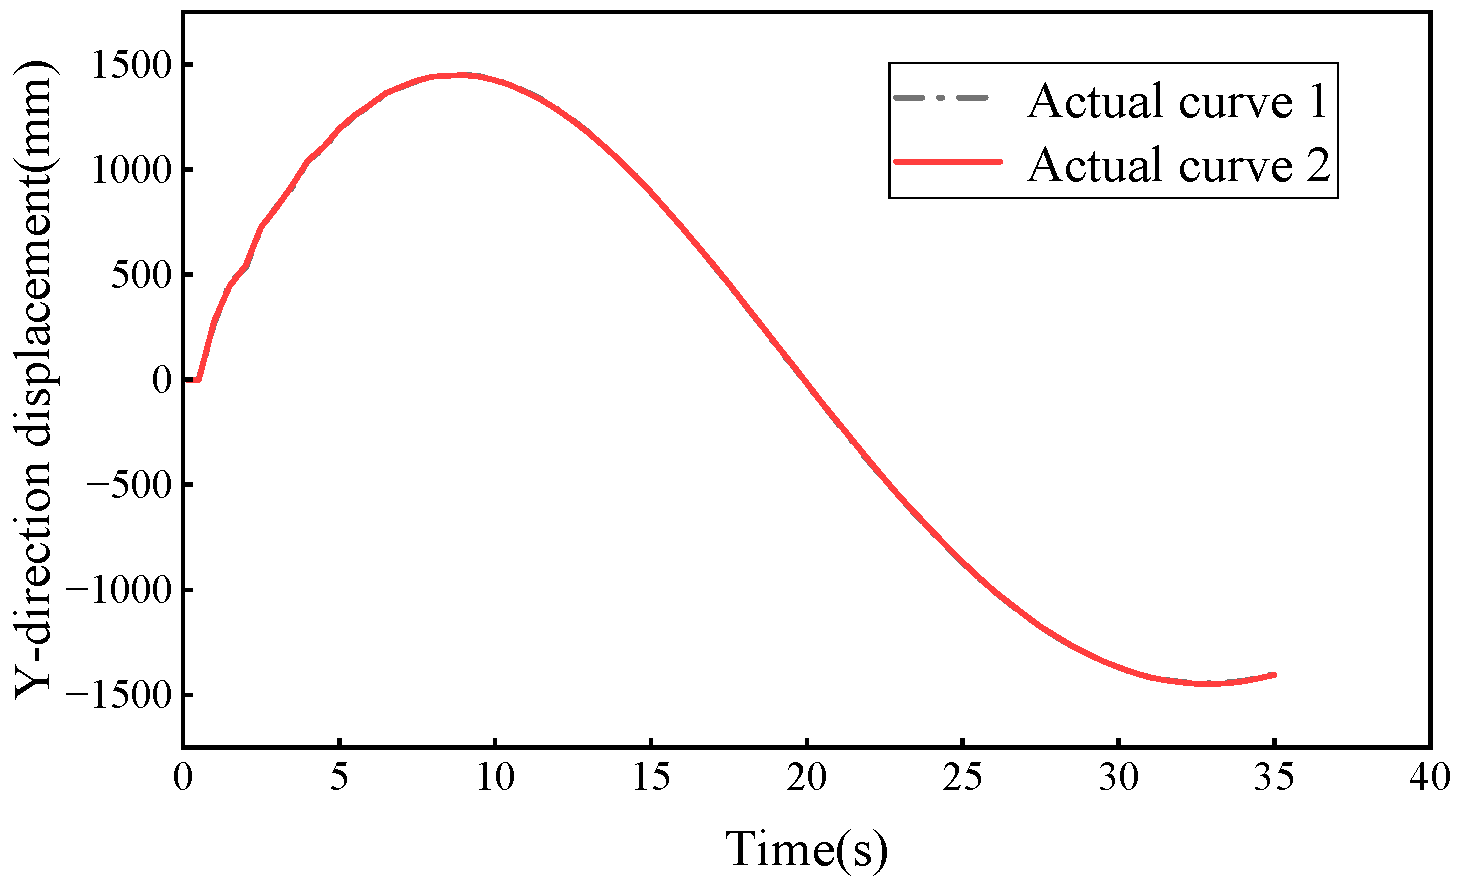
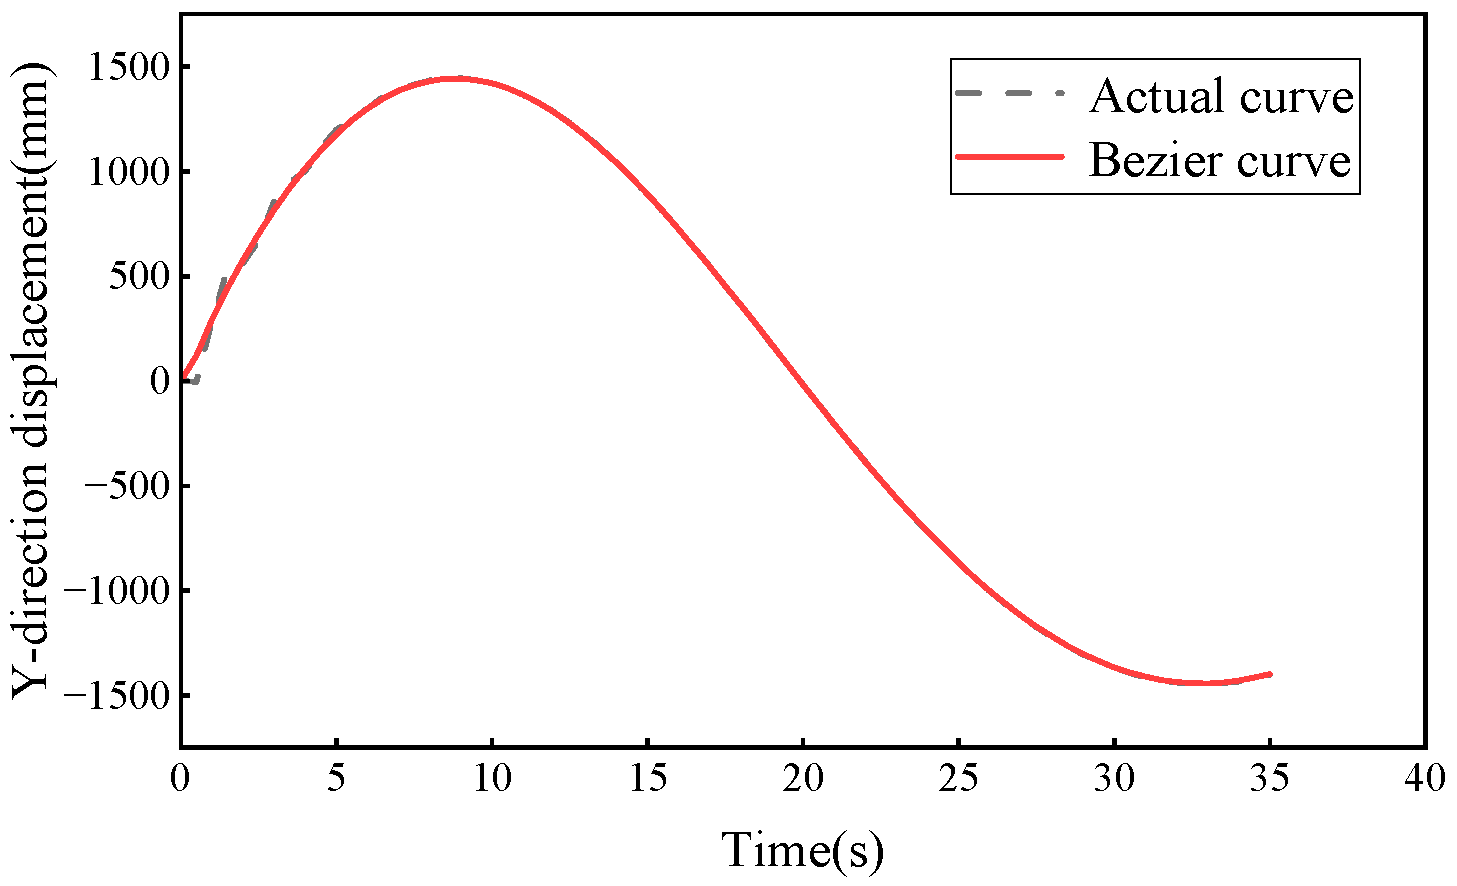
Figure 24, Figure 25, Figure 26 and Figure 27 are the curves of the tire and the rope forces over time without ship movement and wind load. In Figure 25, the vertical force of tire increases, fluctuates, and then remains unchanged. This is due to the self-equilibrium of the aircraft at the initial moment; the longitudinal force of tire and the rope force have a similar rule of change with the vertical force of tire, first increasing and then experiencing small fluctuations, and finally remaining constant, as seen in Figure 26 and Figure 28. In Figure 27, the direction of the lateral force for the tire changes at 12 s, which is related to the turning of the aircraft following the set trajectory. In general, except for the lateral force of the tire, all other forces will stabilize when there is no external excitation. Figure 29 shows the comparison of the setting trajectory (the red line is the pre-set Bezier trajectory) and the actual trajectory (the blue line is the real-time trajectory of aircraft motion) without ship movement and wind; Figure 30 shows the comparison of the trajectory diagrams without and with external excitation—their trajectory curves are very similar and there is little difference.
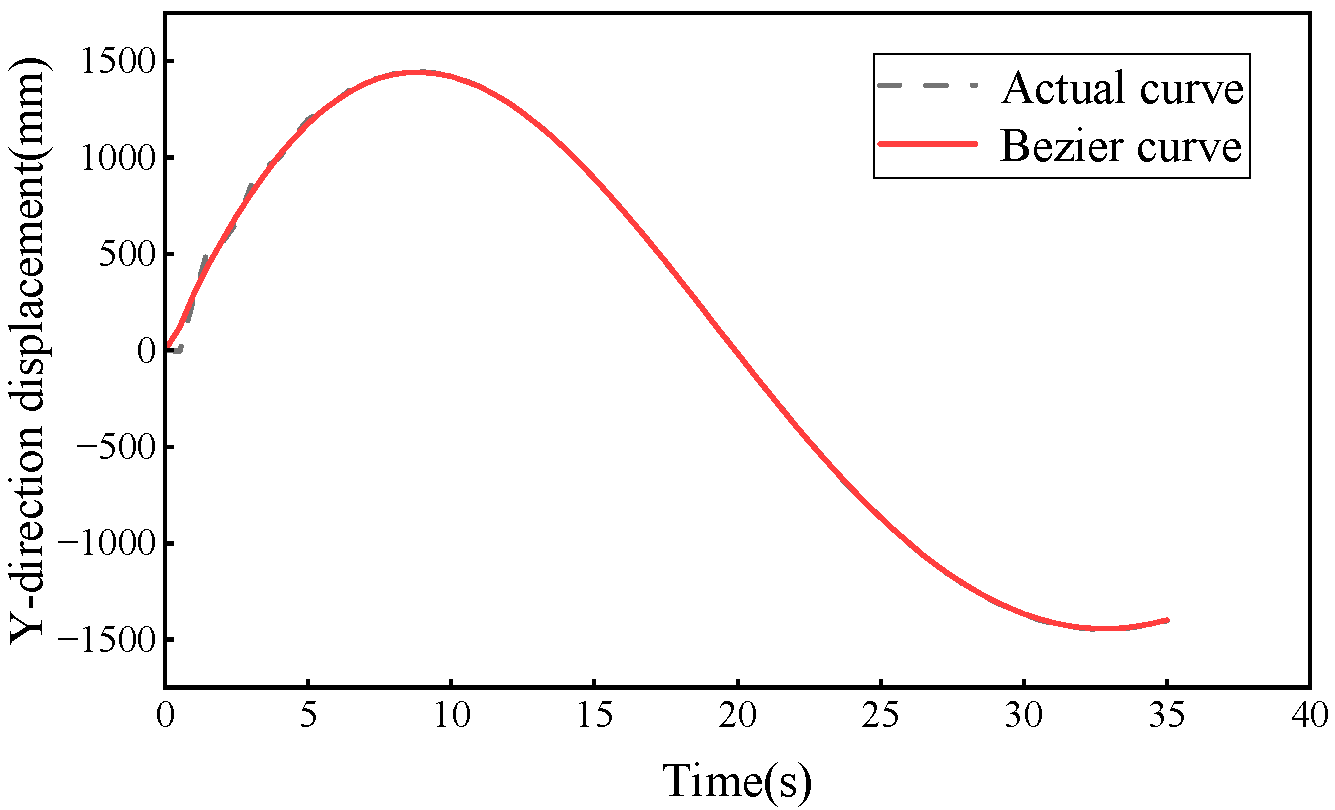
Figure 31 is the comparison between the actual trajectory and the setting trajectory with ship movement and wind. It can be seen from Figure 31 that the actual and the setting trajectories are very consistent to verify the effectiveness of the control method.
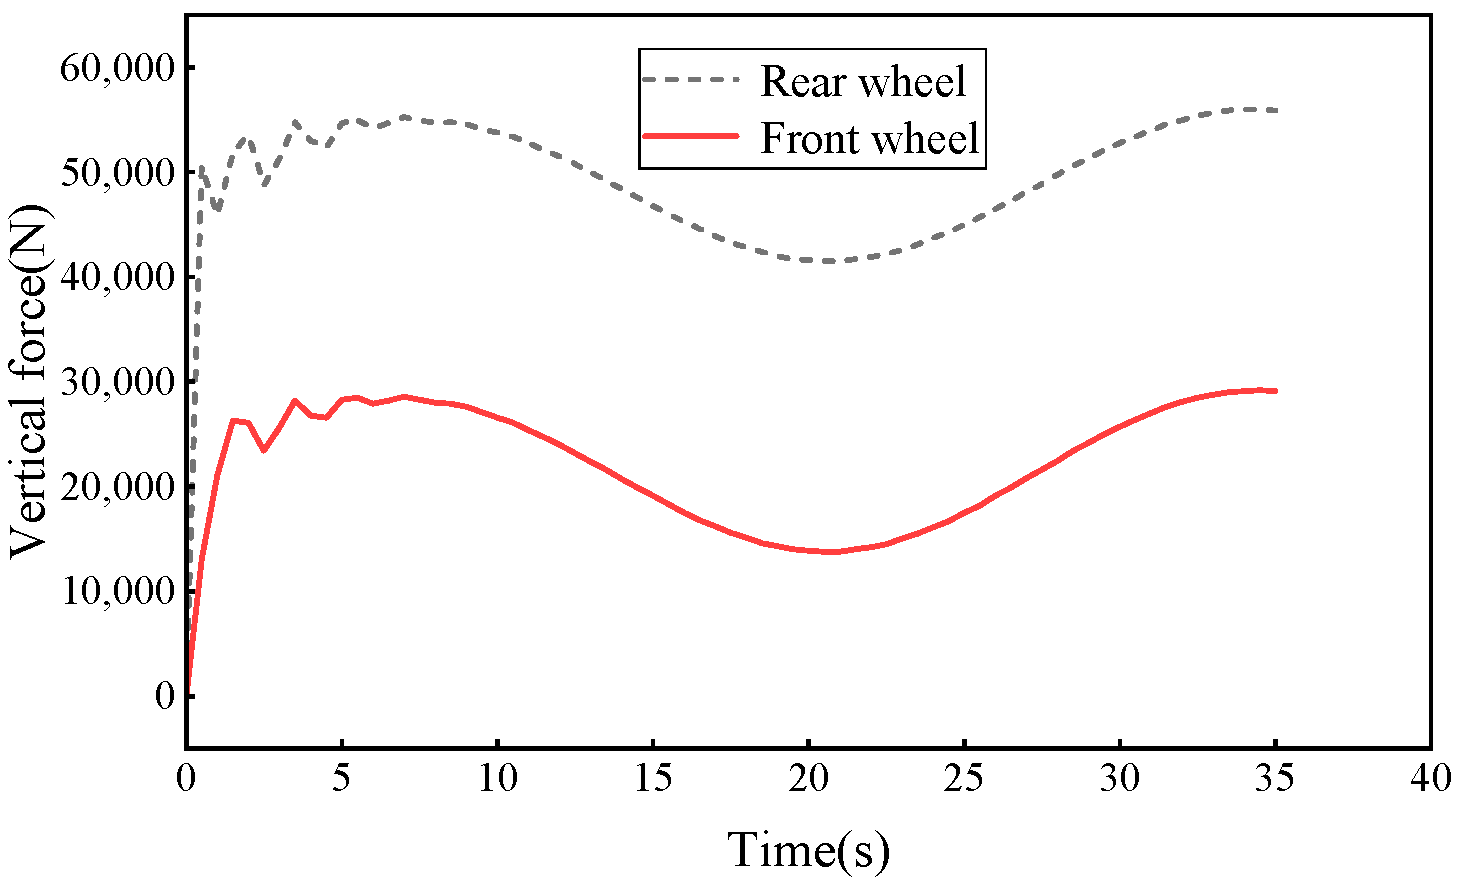
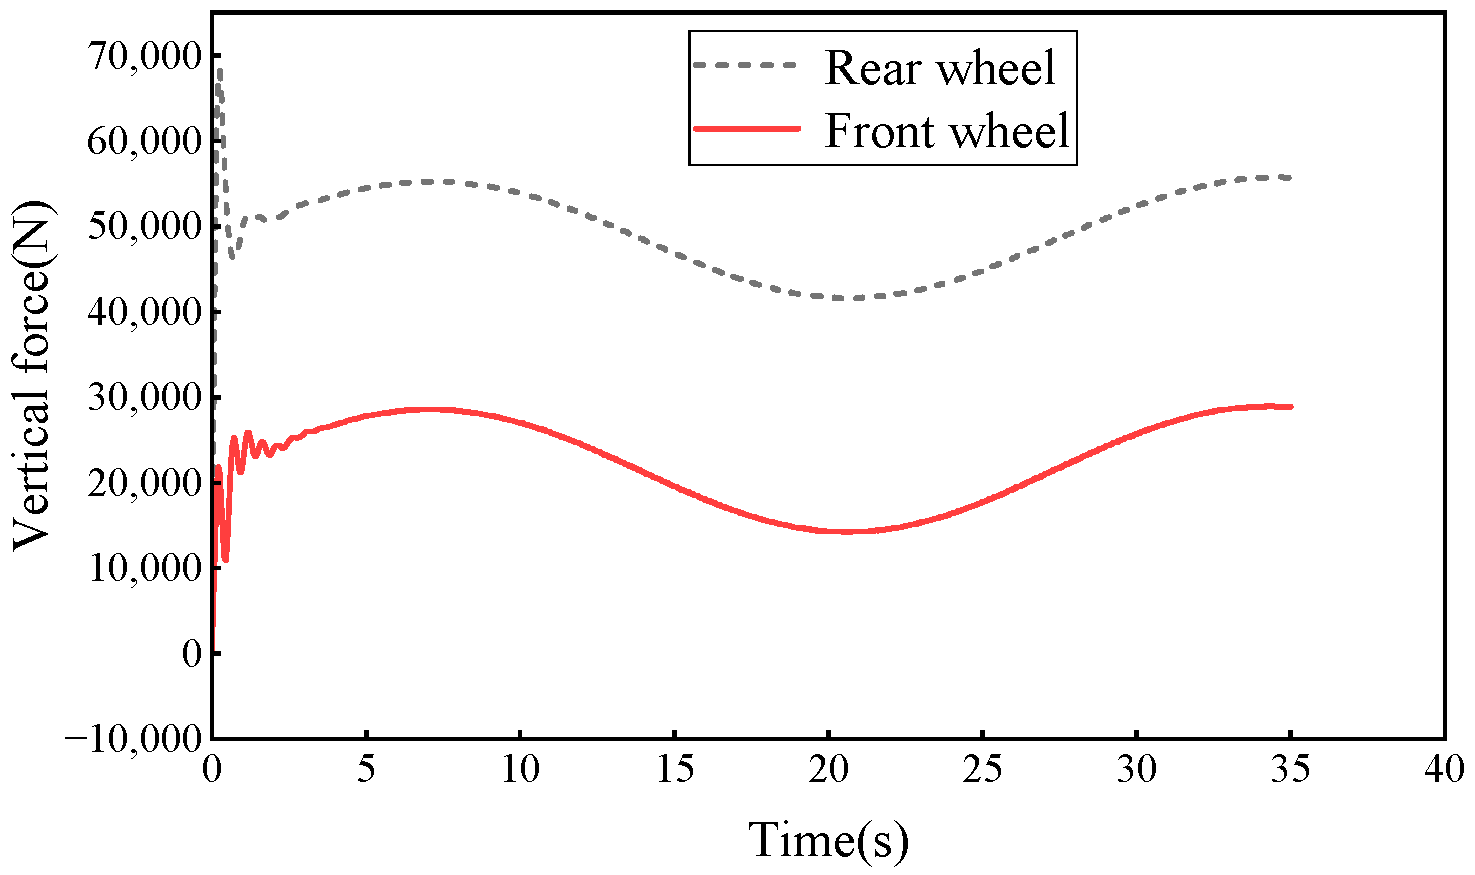
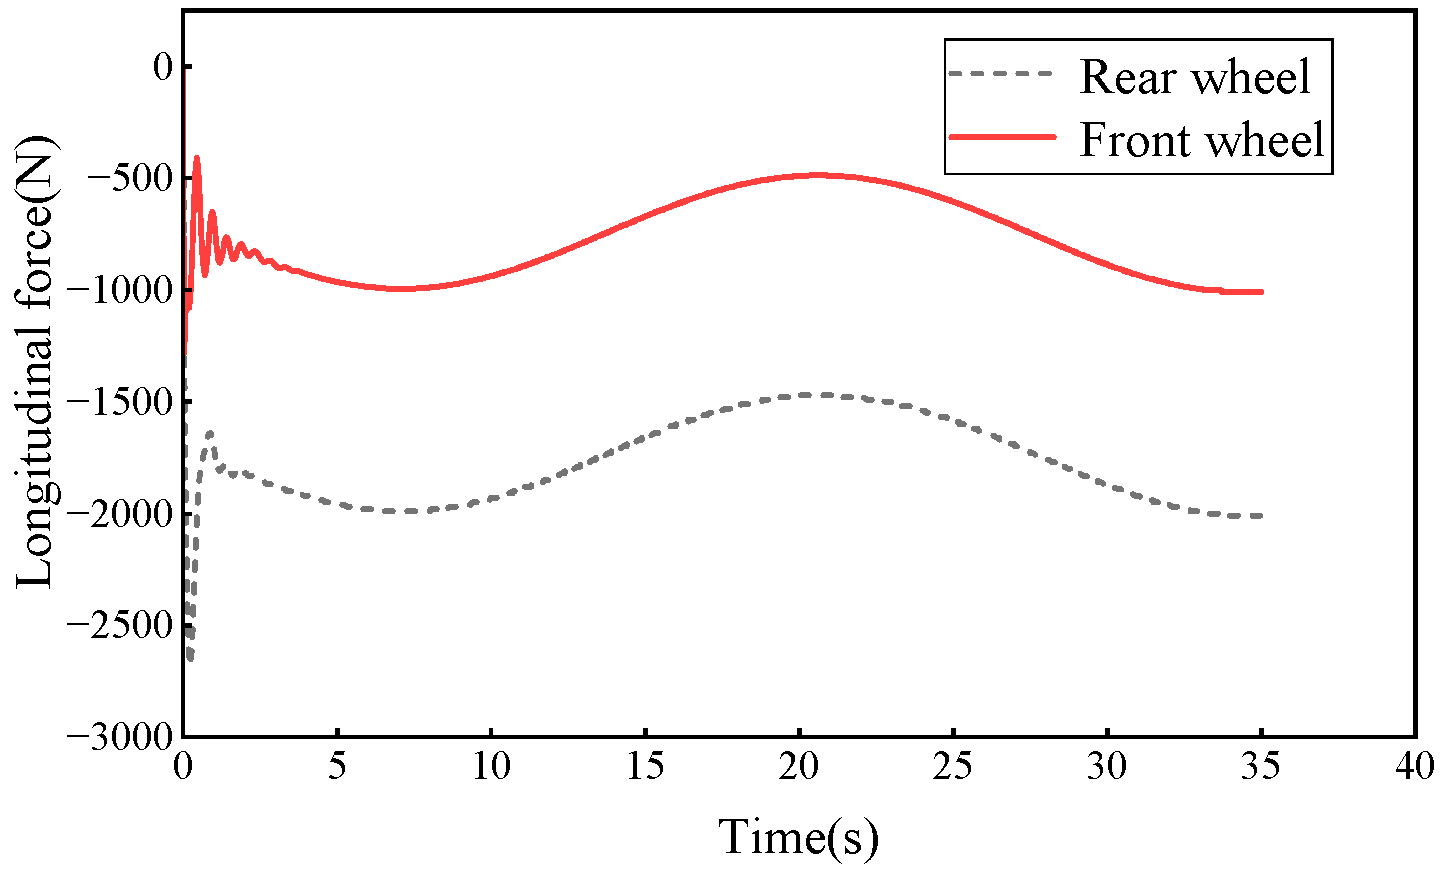
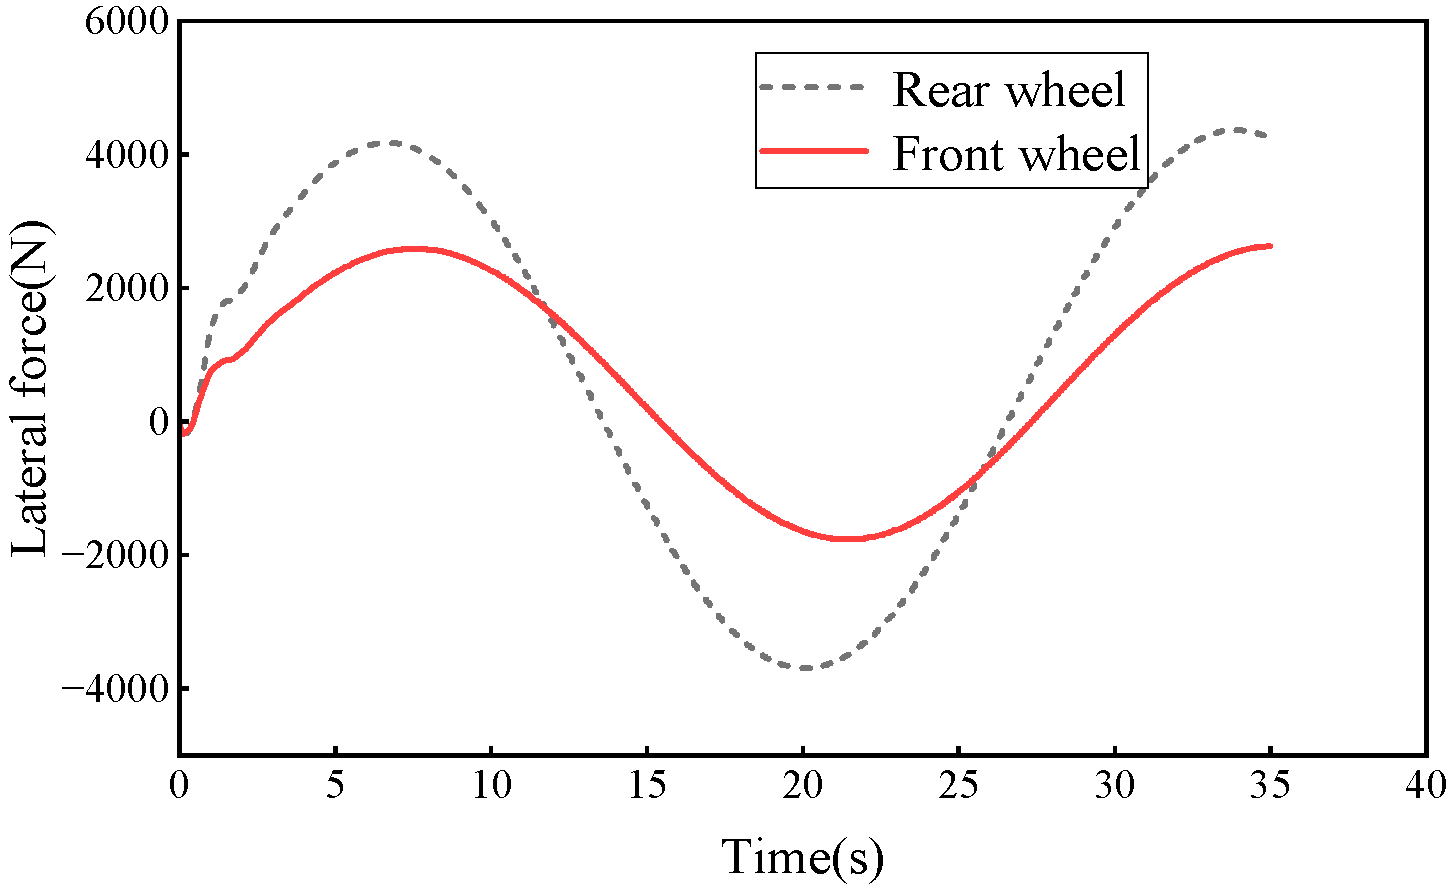
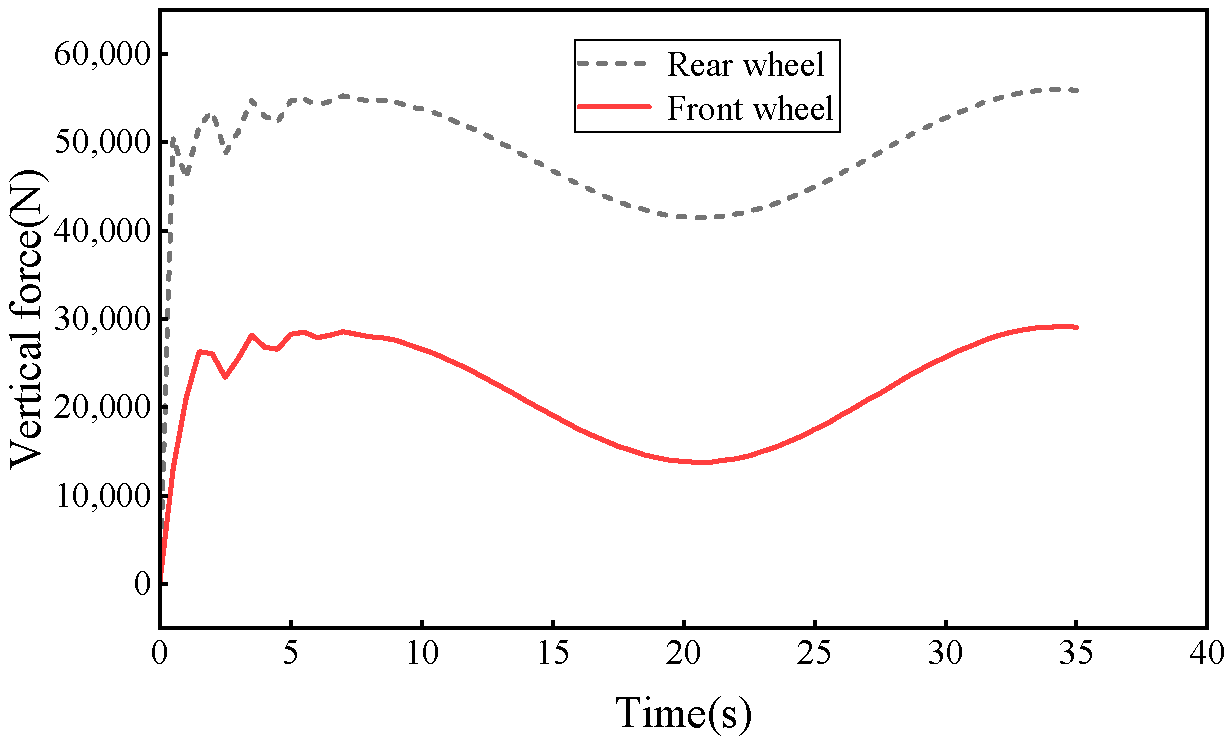
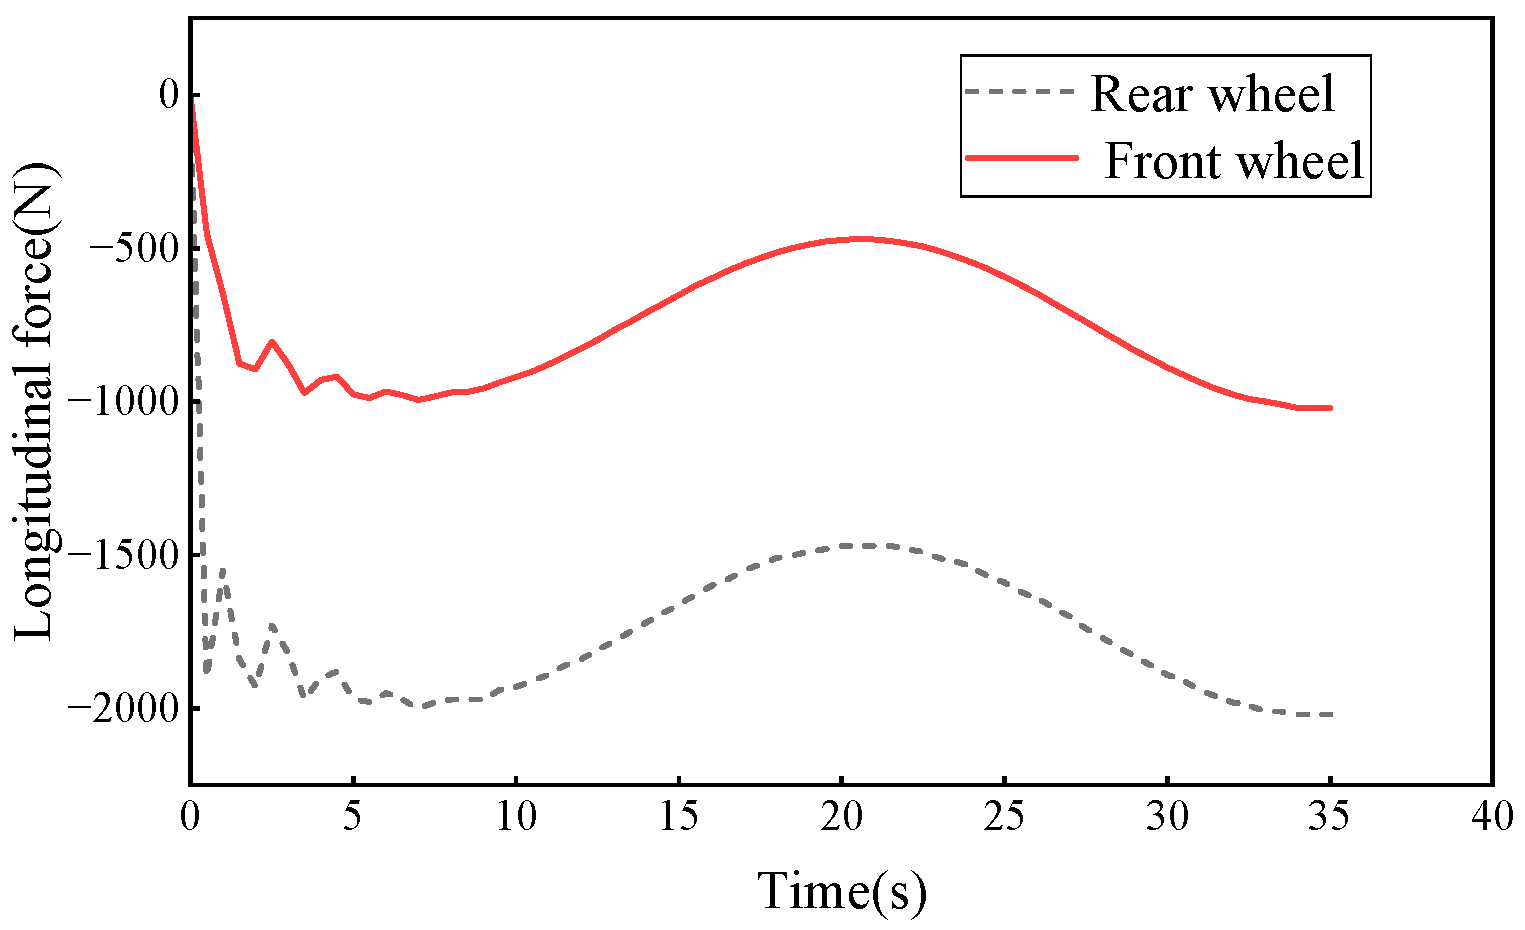
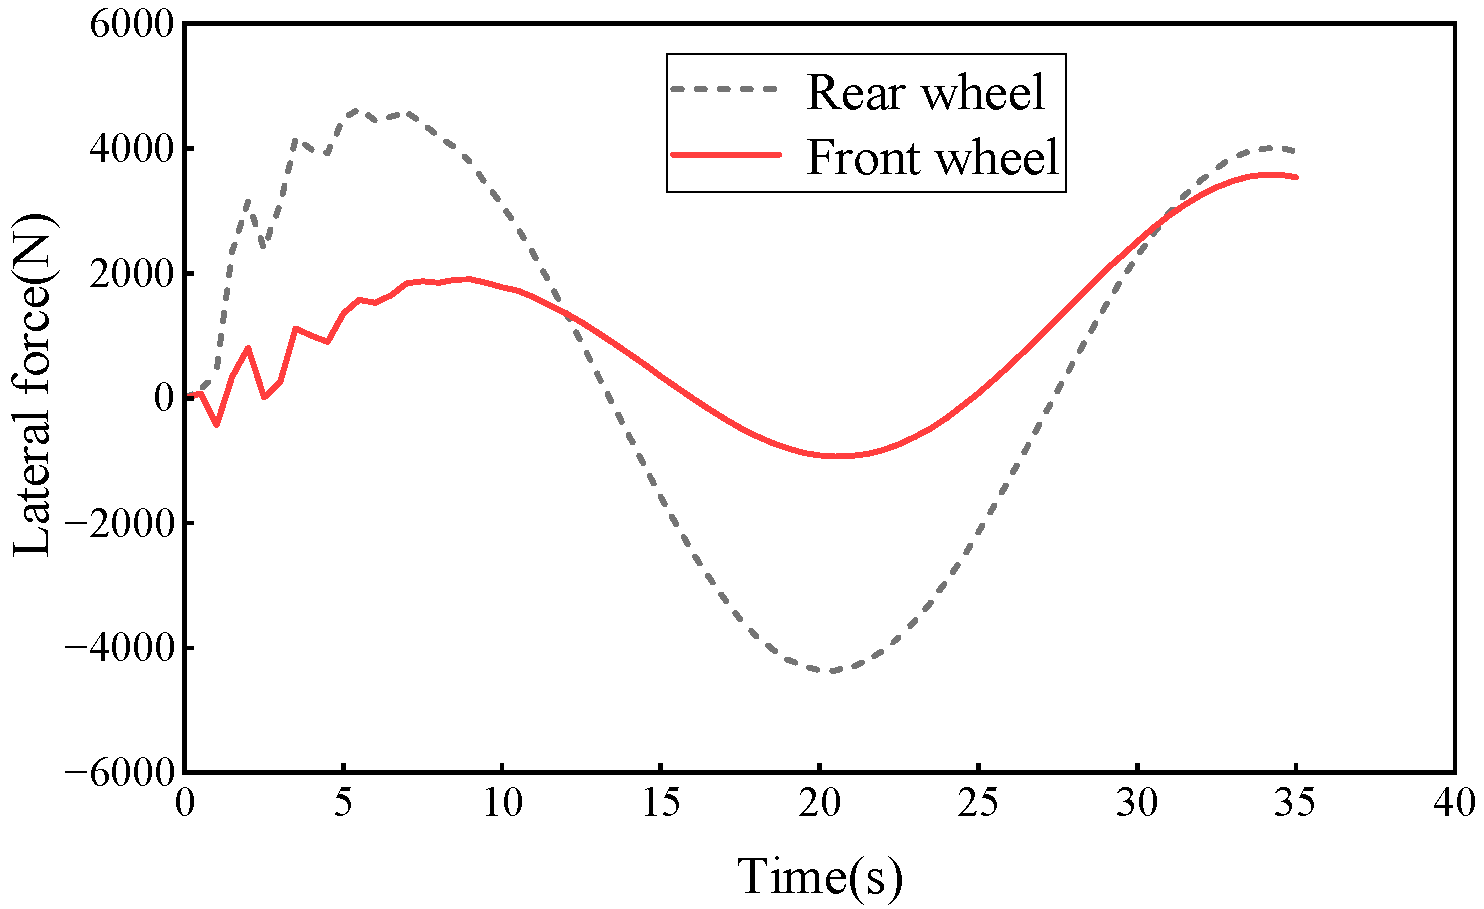
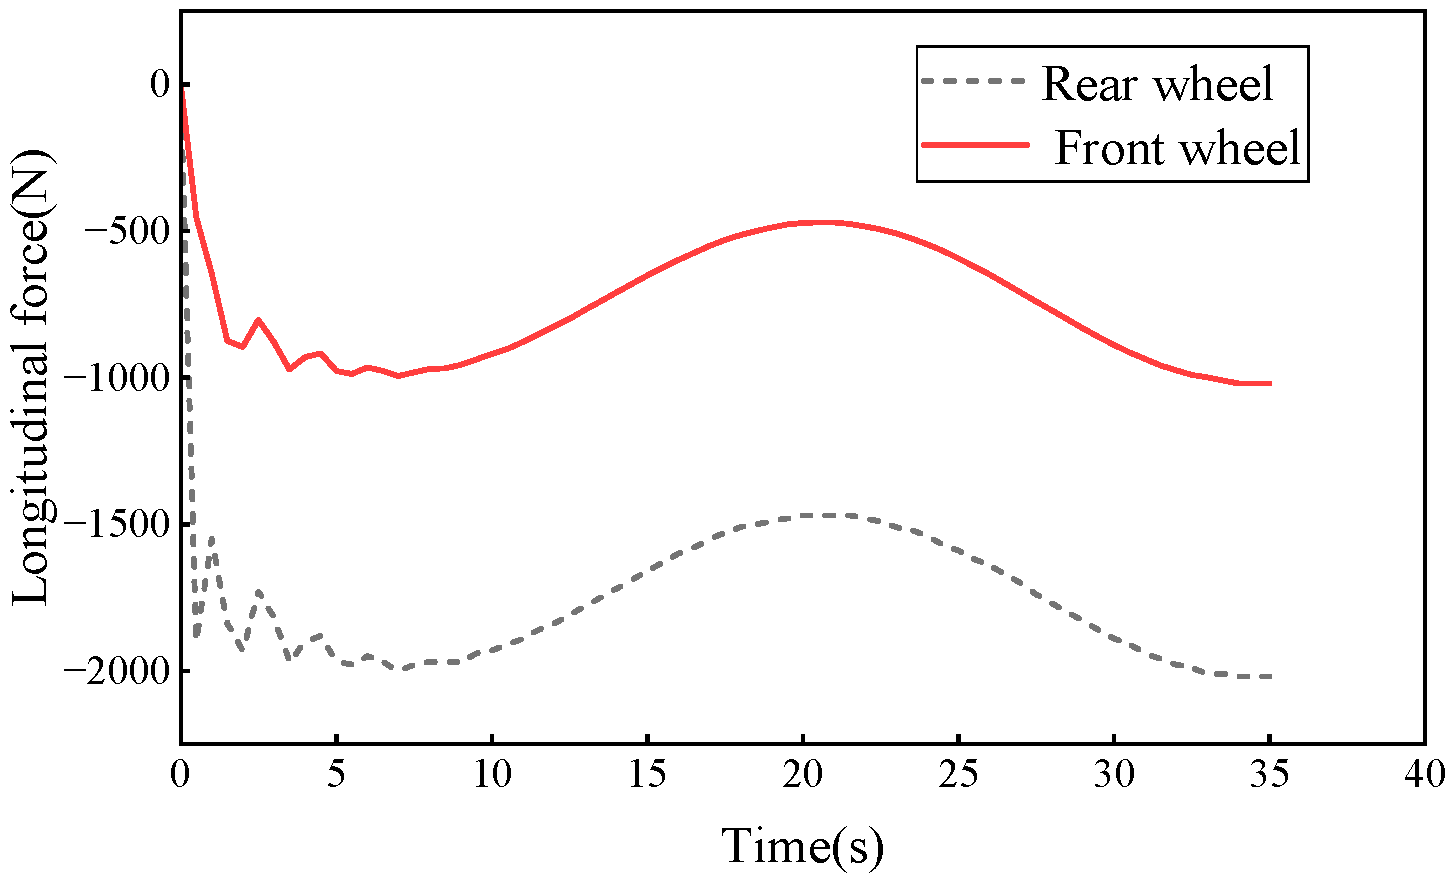
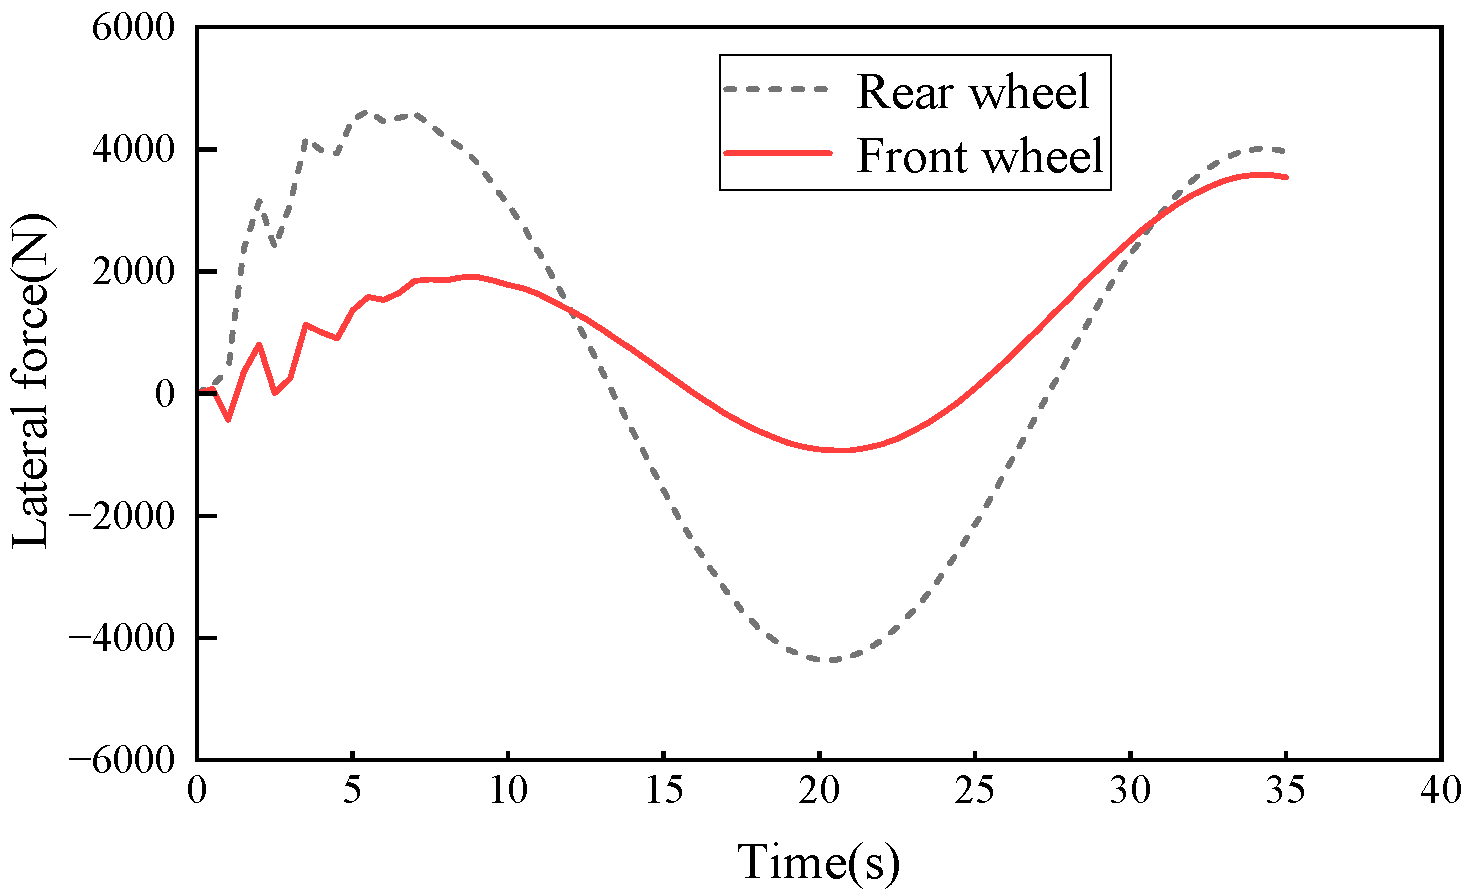
During the traction process of the carrier-based aircraft, according to the setting Bezier curve, the curves of each tire force with ship movement and wind changing with time are shown in Figure 32, Figure 33 and Figure 34. Figure 32 demonstrates that, under conditions of wind load and ship motion, trajectory control can significantly smooth the establishment process of the vertical loads on the front and rear wheels, thereby improving the overall stability of the system while preserving the original load distribution characteristics. Figure 33 indicates that, under complex sea conditions, trajectory control can effectively suppress the transient fluctuations of the longitudinal traction force, enabling a smooth establishment of the longitudinal forces on both the front and rear wheels, and maintaining the stability of the towing process. It can be seen that the vertical and longitudinal forces of the front/rear tires gradually increase from zero to a certain value and stabilize in a fixed interval, and the rear wheel is subjected to greater force than the front wheel. The fluctuation amplitude of the lateral force for the rear wheel is much larger than that of the front wheel, as shown in Figure 34.
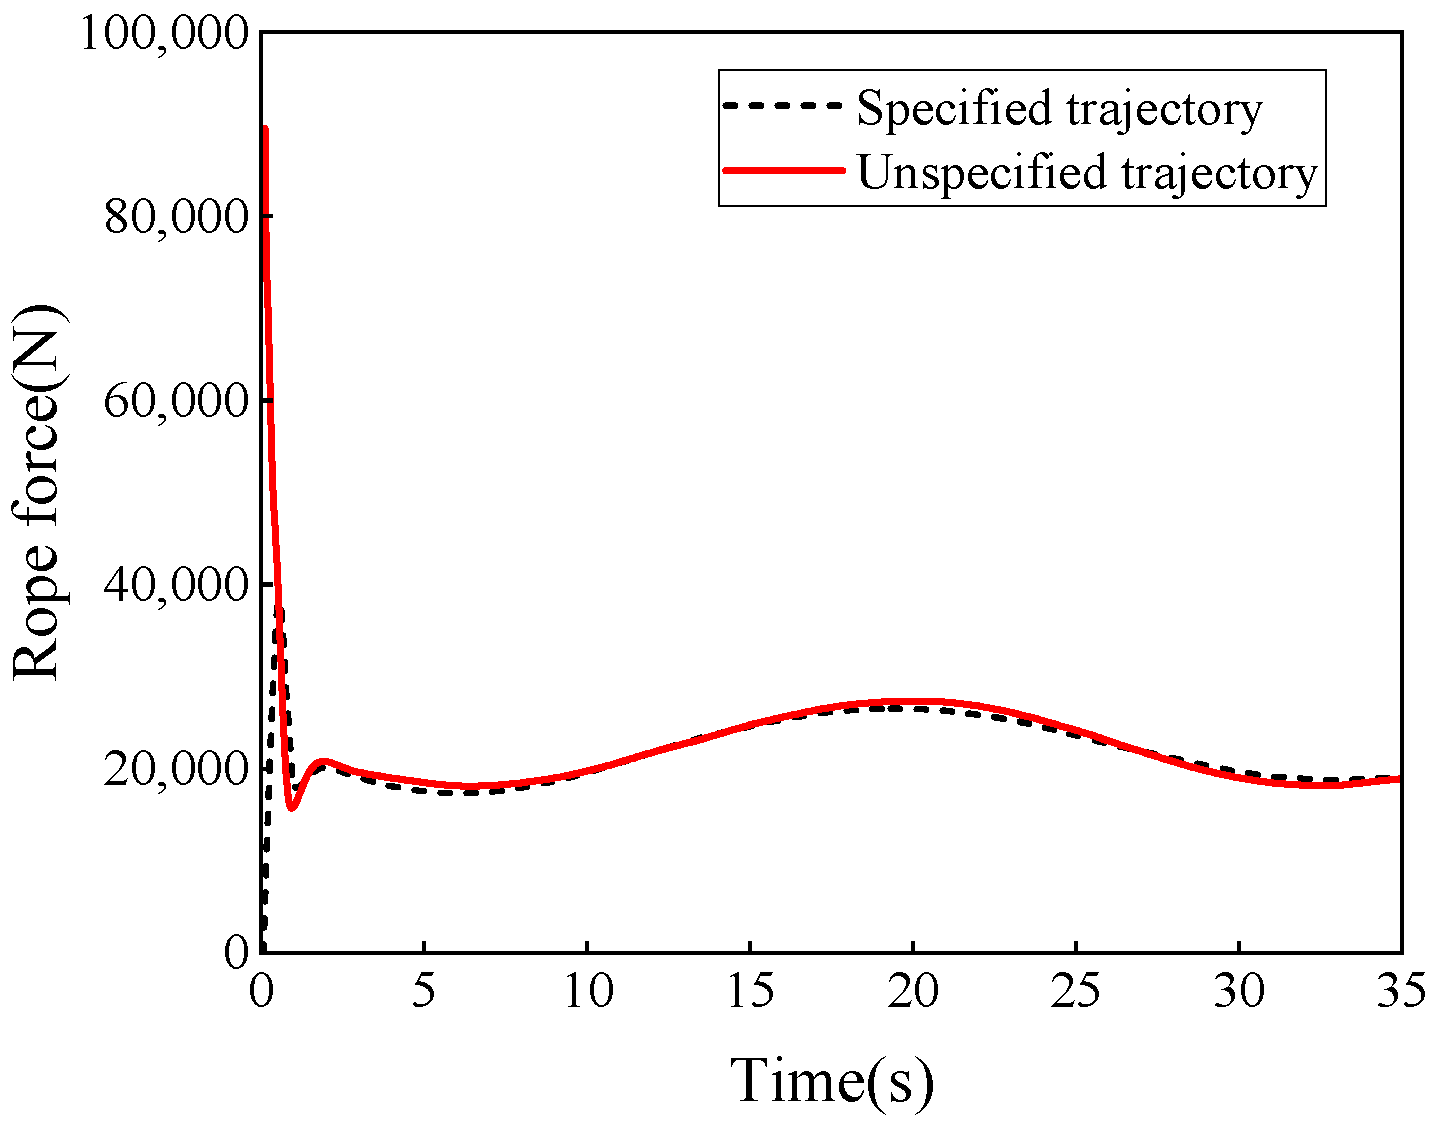
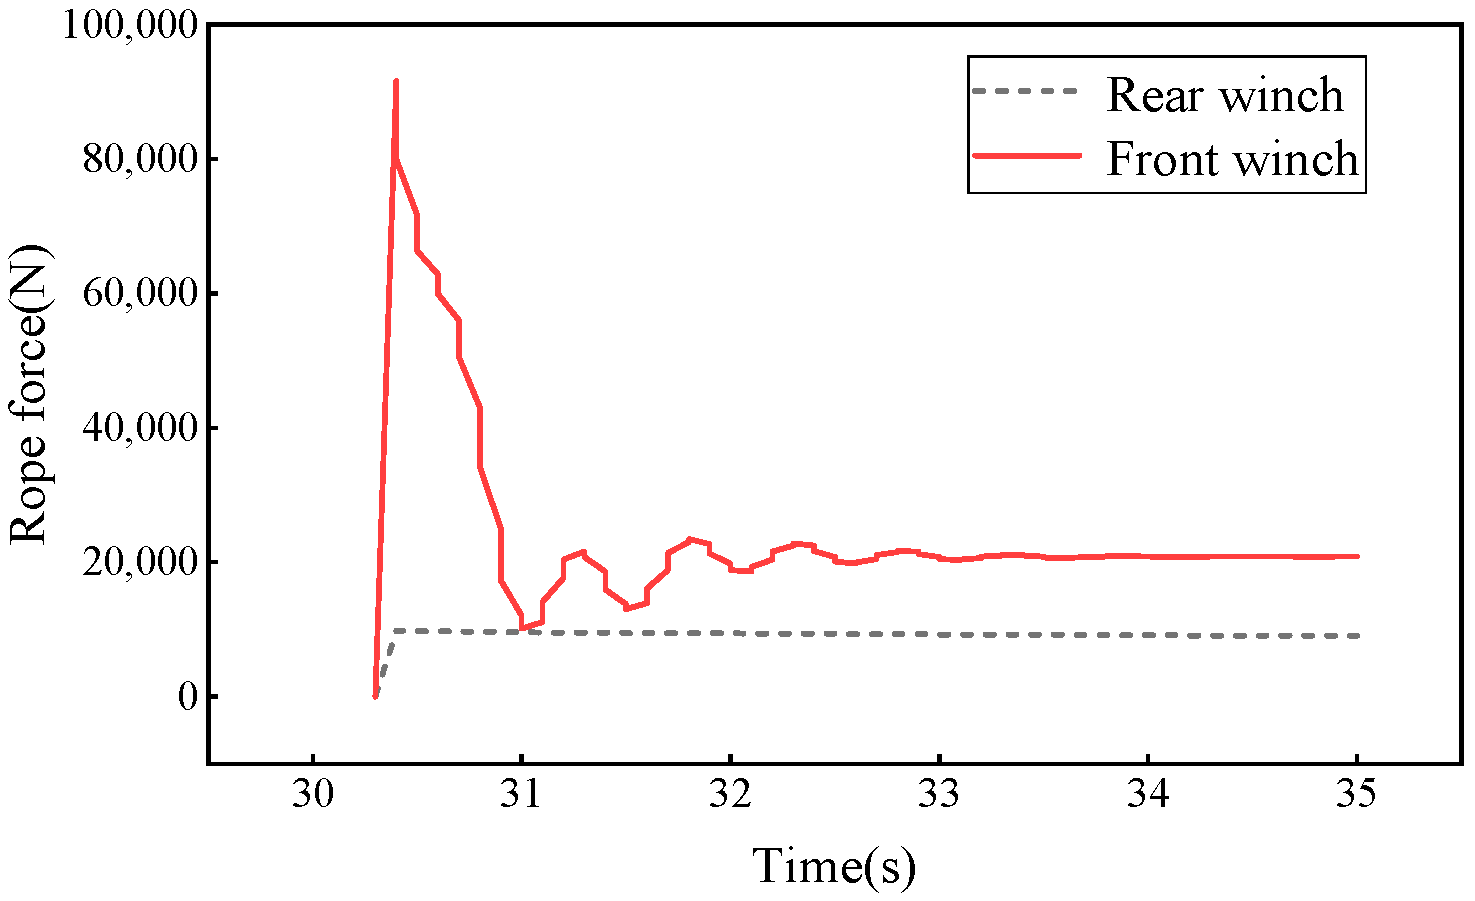
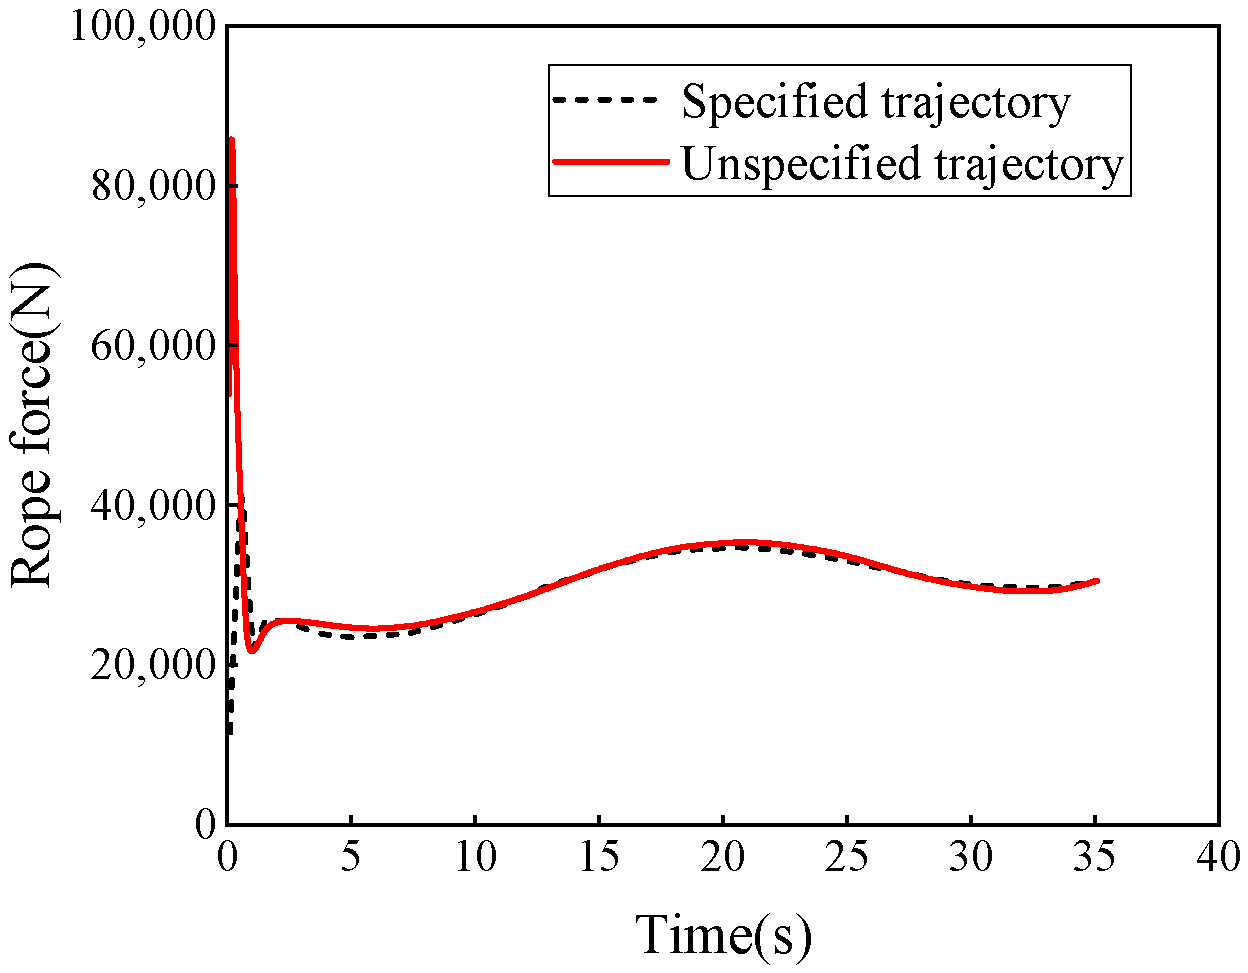
In order to compare the change in the related forces with and without trajectory control, the forward-winch haul load is calculated, as shown in Figure 35. It can be seen from Figure 35 that the force pulse in the initial range of 0~1.3 s is very large and the rope force without trajectory control is 89,821 N, while the rope force with trajectory control is 40,510 N; after a short transient process, the rope force fluctuates in the range of 17,245 N~26,634 N. The initial rope force value is much larger than that of the stability phase; this is mainly because the rope instantly provides the tension when the aircraft starts. To sum up, the initial value of the forward-winch tether tension with the trajectory control is much lower than that of without trajectory control—the decline is 54.9%—and the rope force decreases by 3.82% in the stability stage. It can be inferred that the safety of the rope under the trajectory control is greatly improved.

4.2.2. Five-Winch Traction Under Trajectory Control

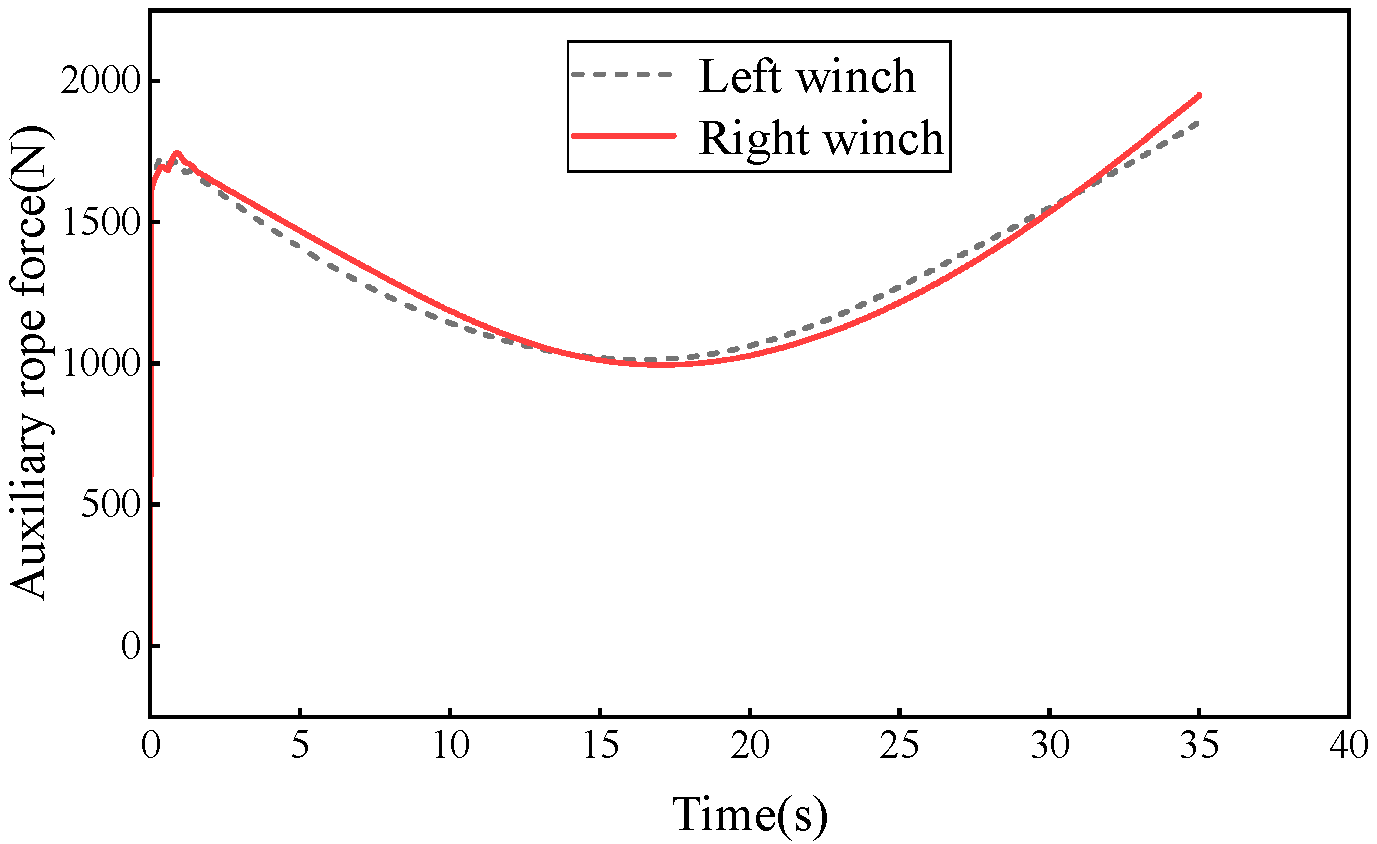
The following is a dynamic analysis of the five-winch traction; the other parameters are the same as above. Figure 36 is the comparison between the actual trajectory and the setting trajectory. Figure 37, Figure 38 and Figure 39 are the curves of the tire forces with change in time; Figure 40 is the curve of the rope force for the auxiliary winch with the change in time.
It can be seen from Figure 37 and Figure 38 that the vertical and longitudinal forces of the front and the rear tires gradually increase from zero to a certain value and stabilize in a fixed range, and the force of the rear wheel is much larger than that of the front wheel. This improvement is primarily attributed to the Bezier-curve-based trajectory, which enforces gradual changes in aircraft motion and effectively limits sudden acceleration at towing initiation. As a result, dynamic load transfer through the landing gear suspension and traction-induced inertial excitation are substantially reduced. In steady-state motion, the rear wheels consistently experience higher vertical and longitudinal forces than the front wheel. This load distribution reflects the inherent aircraft mass layout and winch configuration, and remains essentially unchanged by the trajectory control strategy. These results indicate that the proposed control method improves force smoothness and towing stability while preserving the fundamental load-sharing characteristics of the system. It can be seen from Figure 39 that the lateral force of the rear wheel fluctuates more than that of the front wheel, and the maximum peak is more than twice. It can be seen from Figure 40 that under the setting trajectory control, the rope forces of the left and the right auxiliary winches suddenly increase from 0 N to 1700 N in 0~1 s; at 1~15 s, both of the forces gradually decreases, and the force of the right auxiliary winch is greater than that of the left auxiliary winch; and at 15~35 s, the two forces gradually increase, and the force of the left auxiliary winch is greater than that of the right auxiliary winch. The smoother force profiles reflect the coordinated engagement of auxiliary winches under trajectory control, which prevents sudden load transfer and excessive tension buildup. The near-symmetry between the left and right auxiliary rope forces further demonstrates the balanced load distribution achieved by the proposed control strategy. Similarly, in order to clearly understand the rope force difference between with and without the trajectory control, the related figure is drawn, as shown in Figure 41. It is shown in Figure 41 that the force pulse initially is very large and after a short transient process, the rope force fluctuates in certain range; the maximum value of the rope force of the front winch with trajectory control is much lower than that without trajectory control. The decline is 57.6%, which is more than that of the three-winch, and the rope force decreases by 3.70% in the stability stage, indicating that the effect of the trajectory control on the limit force decline of the five-winch is better than that of the three-winch.
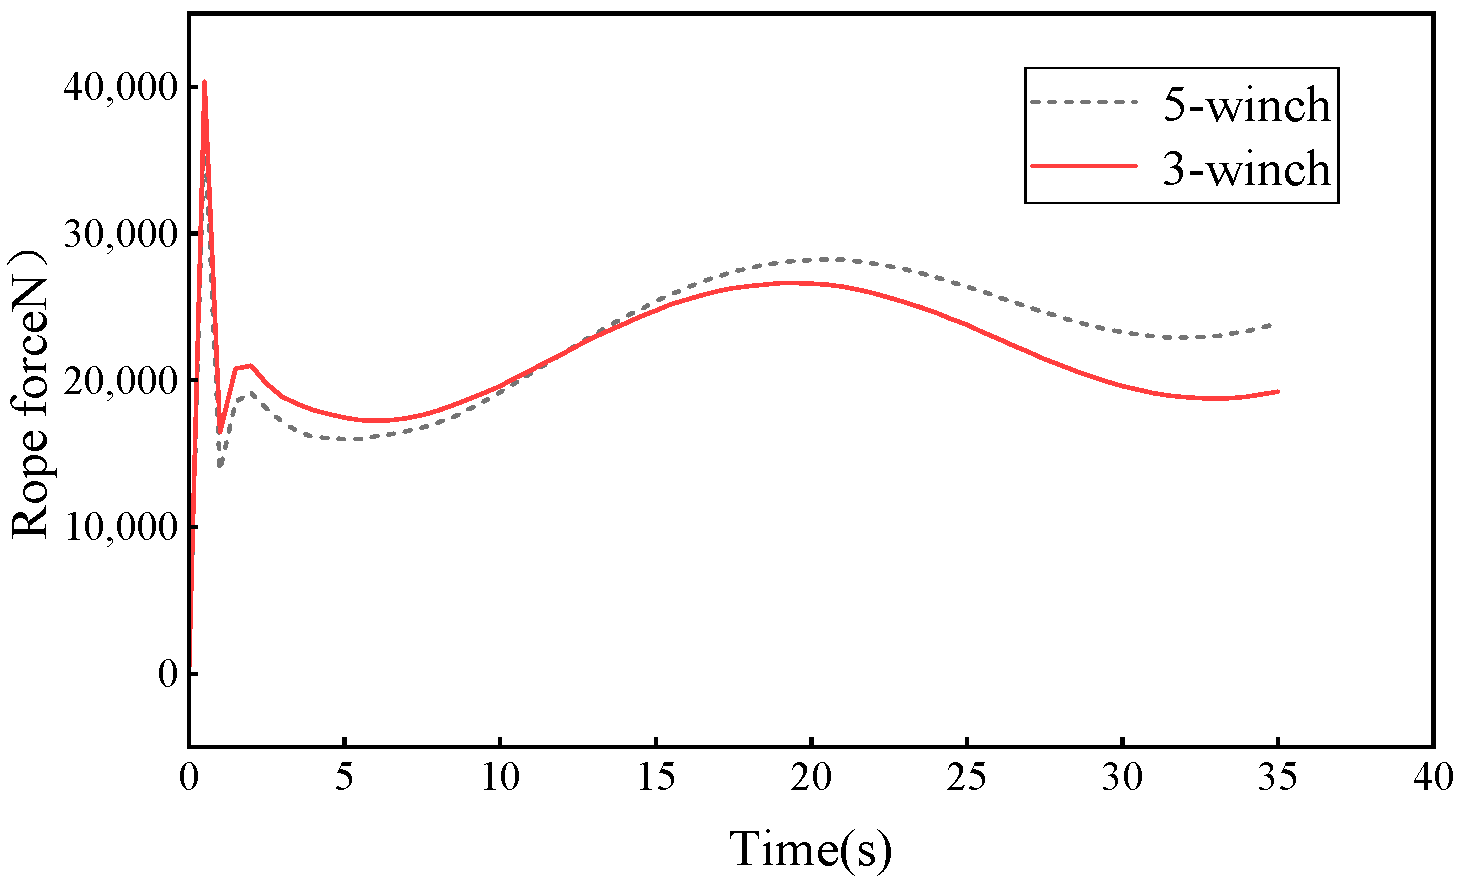
When the aircraft moves along the setting Bezier curve, the rope forces changes obviously compared with the original trajectory (straight line trajectory). In order to compare the force difference in three-winch and five-winch under the setting trajectory, the rope force of the front winch is calculated, as shown in Figure 42. It can be seen from Figure 42 that the fluctuation of the force is large at the initial time range of 0~1.3 s, and the maximum force is about 40,000 N; when the time is from 1.3 s to 12 s, the traction force of the five-winch is less than that of the three-winch, and the two fluctuation shapes are roughly the same; after 12 s, the traction force of the five-winch is greater than that of the three-winch. In summary, the rope force of the five-winch traction in the first 12 s is smaller than that of the three-winch traction, and then more than that of three-winch. This indicates that the auxiliary winch firstly provides the tension, and then provides the back tension, and the change has an effect on the rope force of front wheel.

4.3. Comparison with MATLAB Calculation Results

4.3.1. Modeling Based on MATLAB

(1)
Aircraft model
In the previous sections, the general simulation software ADAMS was adopted to analyze the winch traction system. In order to verify the correctness of the calculating results, the theoretical investigation is carried out in this section. If the motion vector of the center of mass in the inertial coordinate system is {Xpi}, the translational and rotational accelerations of the center of mass can be obtained by using the Newton–Euler method, as follows:
X ¨ p i = 1 m Σ F x i ; Σ F y i ; Σ F z i ω ˙ x = M p x + I p y I p z × ω y ω z / I p x ω ˙ y = M p y + I p z I p x × ω x ω z / I p y ω ˙ x = M p z + I p x I p y × ω x ω y / I p z
where m is the mass of the aircraft; Mpx, Mpy, and Mpz are moments around the x, y, and z directions, respectively; and ωx, ωy, and ωz are the rotational speeds around the x, y, and z directions, respectively. I = I p x ; I p y ; I p x is the rotational inertia matrix; Σ F x i ; Σ F y i ; Σ F z i is the combined external force acting on the aircraft system, including the forces of the horizontal and the vertical directions. The horizontal forces consist of the rope force, the friction forces between the tires and the deck, and the wind loads. The winch rope force acting on the aircraft system can be expressed as follows:
F r o p e = k r o p e × d + c r o p e × d ˙
F = k t d t + c t d ˙ t F < F f r i c μ F n F F f r i c
where krope is the stiffness of the rope; crope is the damping of the rope; d is the deformation length of the rope; d ˙ is the deformation speed of the rope; kt is the stiffness of the tire; ct is the damping of the tire; dt is the deformation of the tire; d ˙ t is the speed of the tire deformation; and Ffric is the static frictional force.
(2)
Rope model
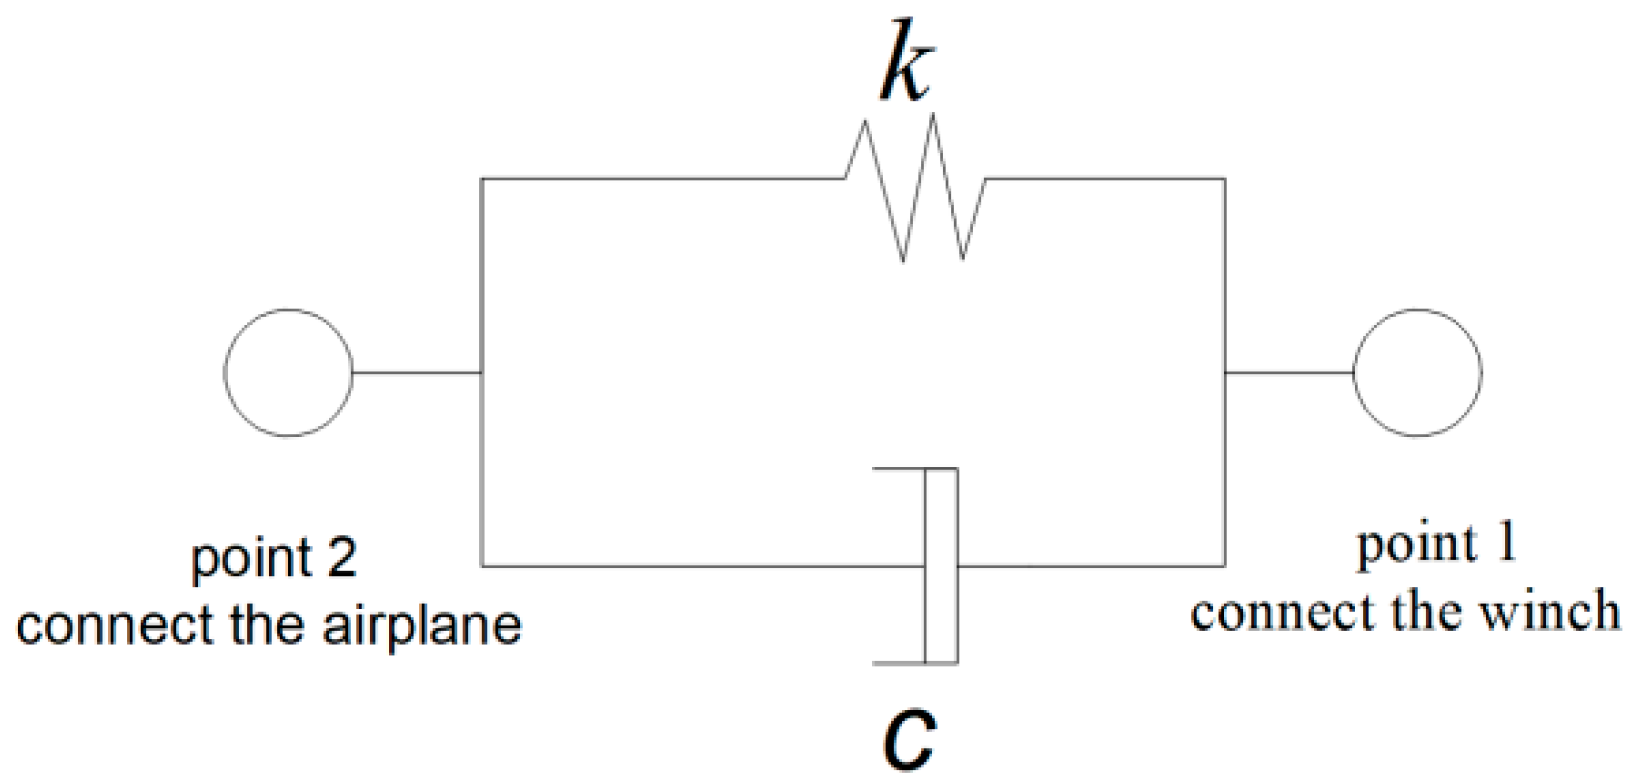
Rope is a typical flexible object; some scholars have studied the theoretical model of rope and proposed several effective methods, such as the spring–mass model, catenary, the particle system, physics-based modeling, etc. In this paper, the rope model is simplified to a spring model under ideal conditions, as shown in Figure 43.
Rope force is written as follows:
F r o p e = k × Δ L + c × Δ L ˙
where k is the stiffness of the rope, c is the damping of the rope, ΔL is the length of the rope deformation, and Δ L ˙ is the speed of the rope deformation.
(3)
Landing gear tire model
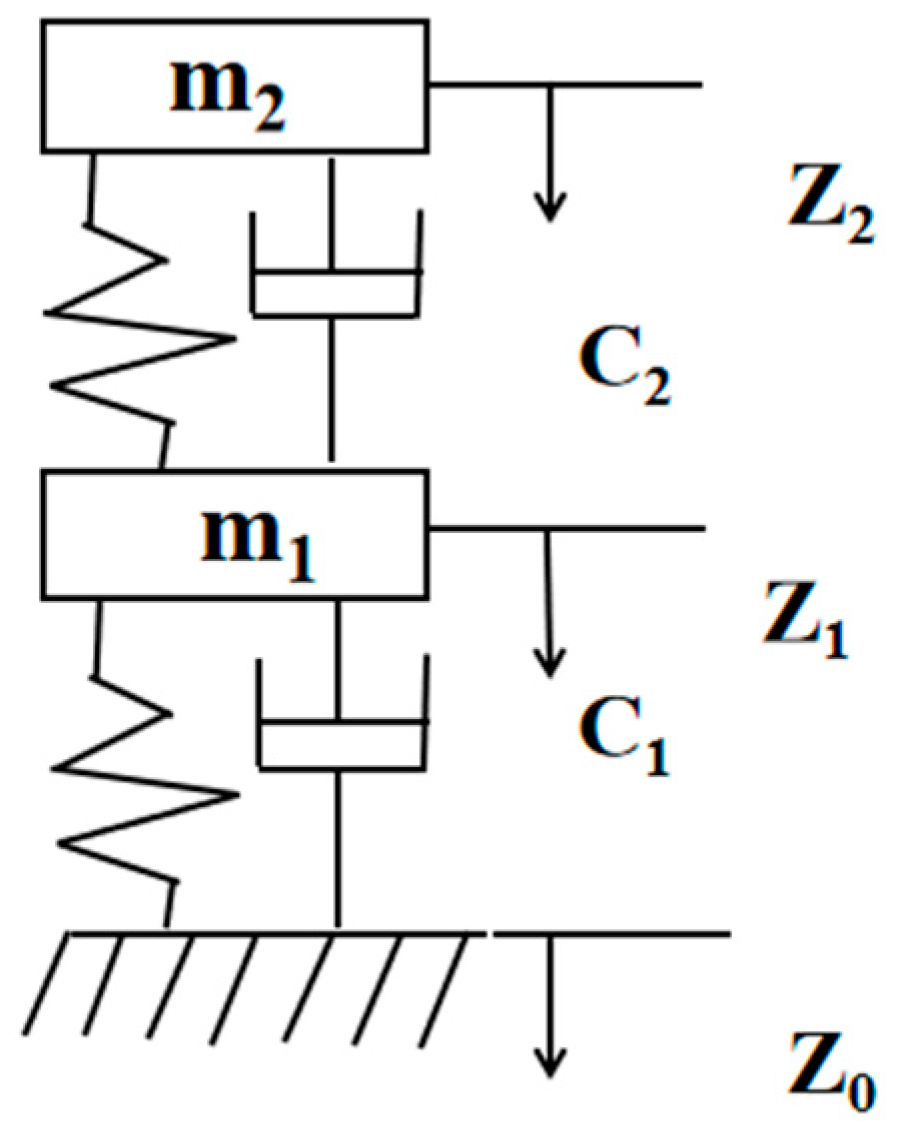
In order to study the vertical forces of the system, the dynamic model of the fuselage-landing gear-tire system should be established first. Figure 44 is the theoretical analytical model of the fuselage-landing gear-tire system developed in this research. The aircraft-landing gear-tire system can be equivalent to two lumped mass–spring-damping systems, where z0 represents the motion of the deck in the z direction, z1 represents the motion of the center of the wheel in the z direction, z2 represents the motion of the pillar in the z direction, m1 is the mass of the wheel, and m2 is the mass of the aircraft fuselage. The equation of motion for the fuselage-landing gear-tire system can be derived as follows:
m 1 z ¨ 1 = k 2 ( z 2 z 1 ) + c 2 ( z ˙ 2 z ˙ 1 ) k 1 ( z 1 z 0 ) c 1 ( z ˙ 1 z ˙ 0 ) m 1 g m 2 z ¨ 2 = k 2 ( z 2 z 1 ) c 2 ( z ˙ 2 z ˙ 1 ) m 2 g

4.3.2. Comparison Between Adams and MATLAB Results

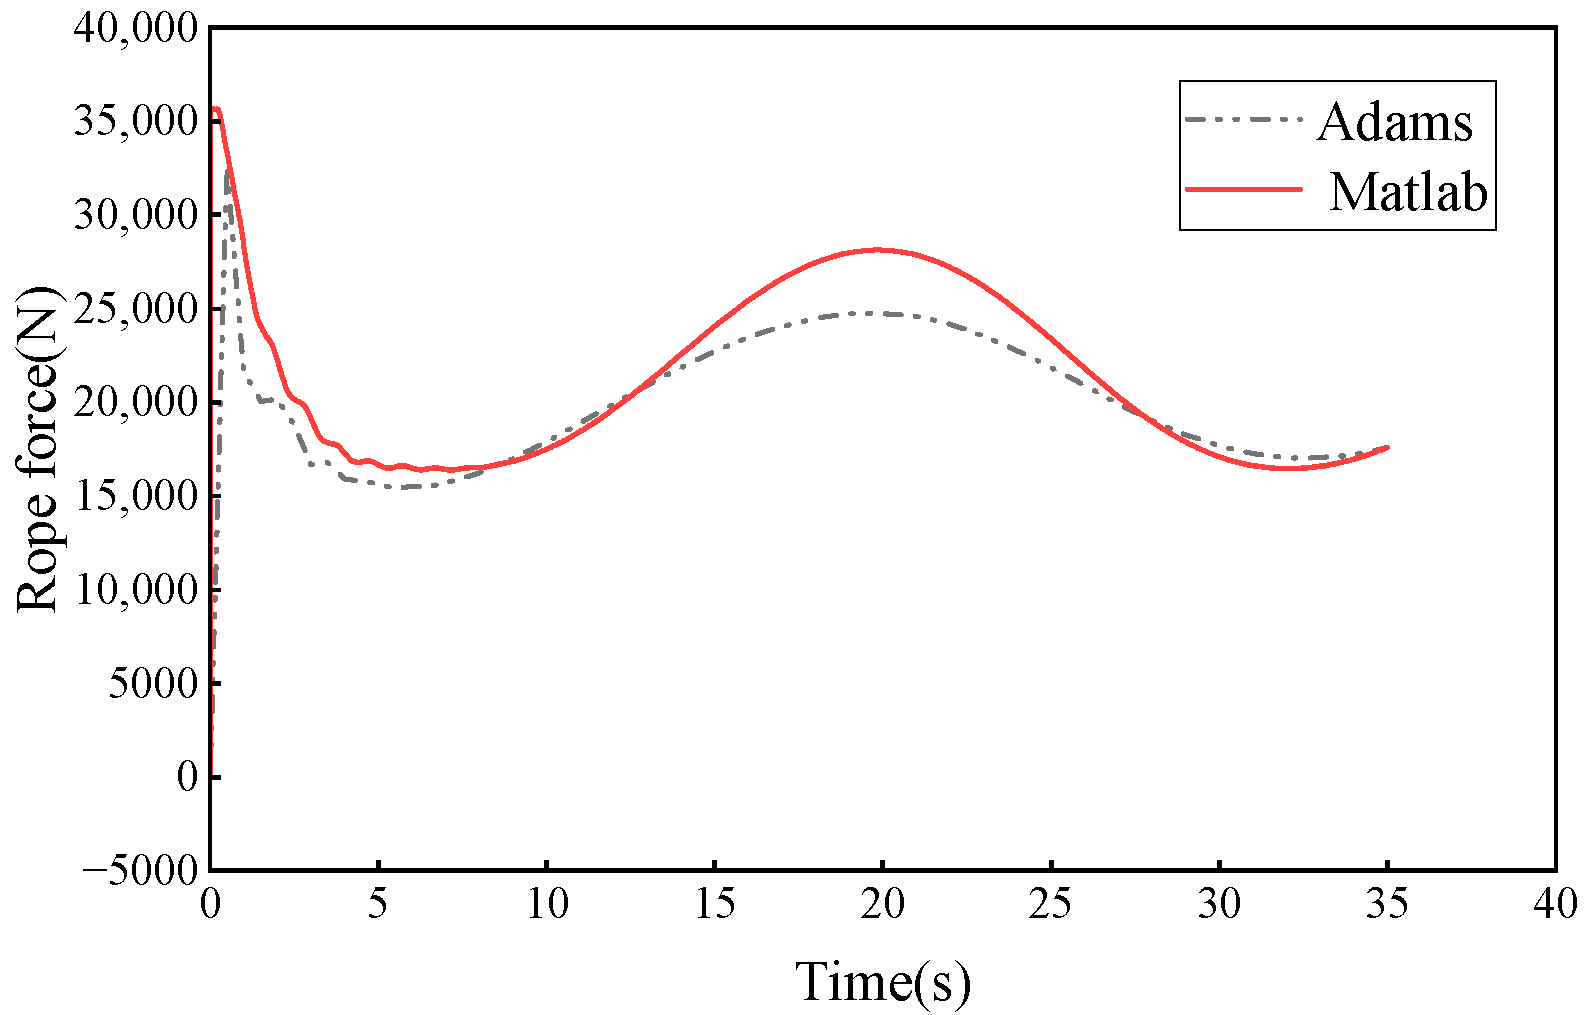
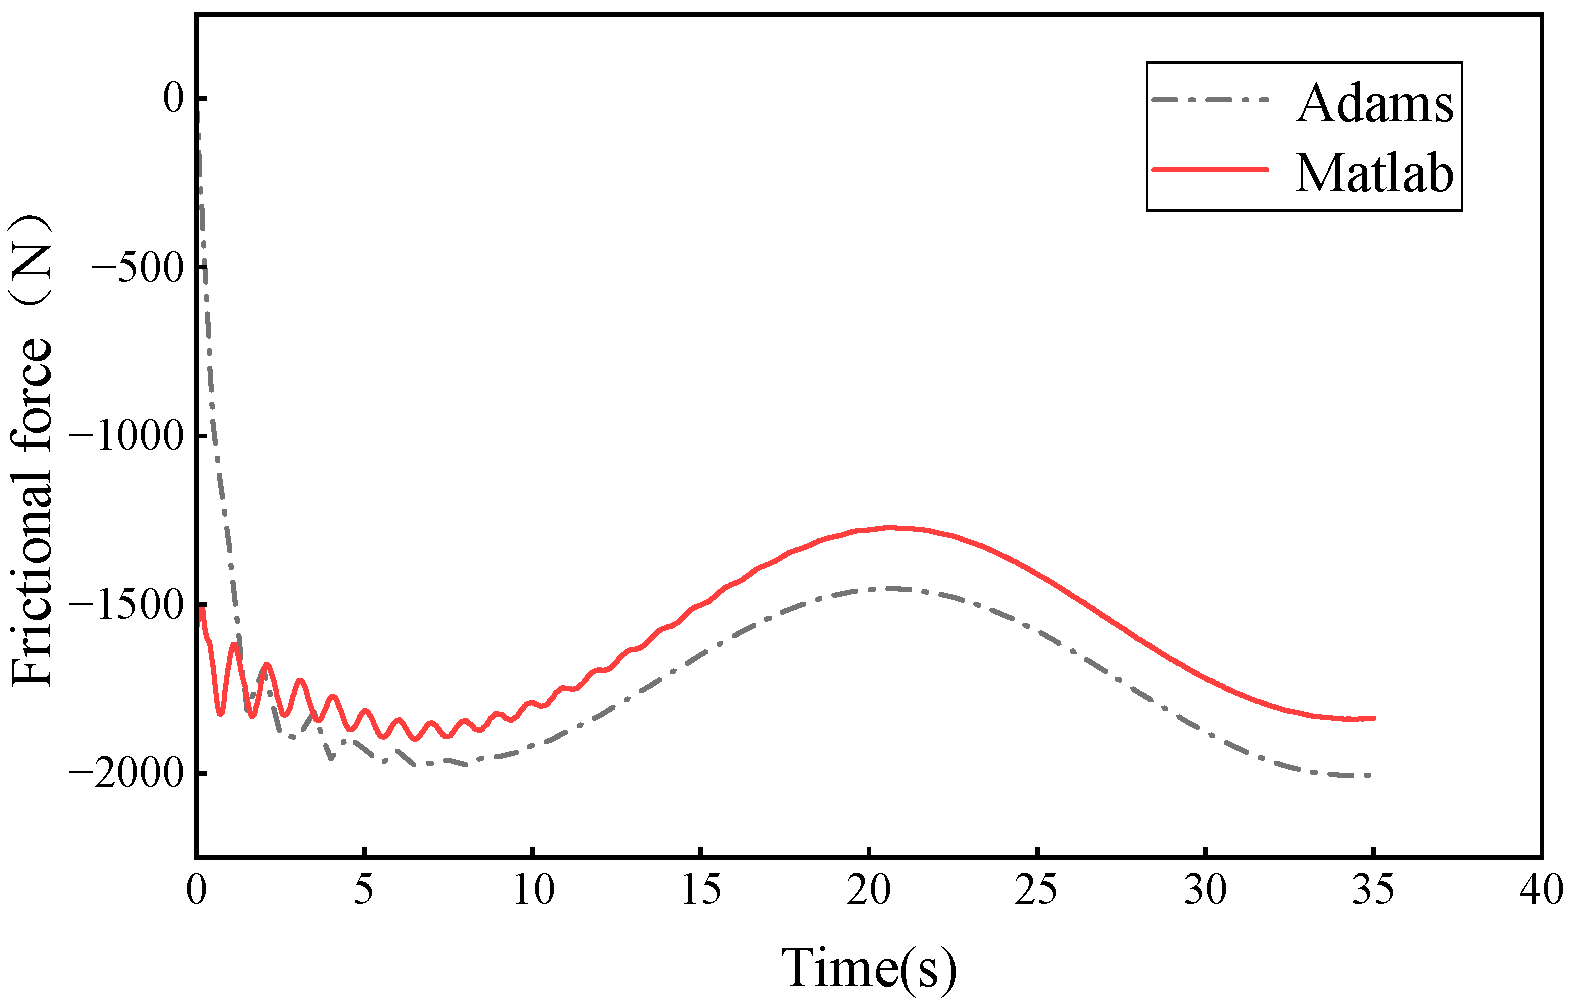
Based on the previous equations, the winch rope and tire friction forces can be calculated, and the comparisons of the results and the corresponding results obtained by ADAMS are conducted, as shown in Figure 45 and Figure 46, where the red solid line represents the results of the MATLAB calculation and the black dashed line represents the results of the ADAMS calculation. Figure 42 is the comparison of the front rope forces obtained by ADAMS and MATLAB; the correlation coefficient between them is 0.91. Figure 43 is the comparison of the right rear wheel friction forces obtained by ADAMS and MATLAB; the correlation coefficient between them is 0.97. It can be seen from the figures that the maximum difference between the simulation software and theoretical modeling is only 12%, which meets the engineering requirements, being within the allowable range. ADAMS and MATLAB-based theoretical modeling approaches exhibit complementary strengths and limitations in the context of carrier-based aircraft towing dynamics. ADAMS enables high-fidelity multi-body dynamic simulations with realistic representations of complex contacts, constraints, and flexible body effects, making it suitable for capturing detailed mechanical interactions during towing operations. However, the underlying force mechanisms are often embedded within the numerical formulation, limiting direct analytical interpretability.
In contrast, MATLAB-based theoretical models provide clearer physical insight into governing mechanisms and parameter influences, but necessarily rely on simplifying assumptions and reduced-order representations. By combining these two approaches and conducting a quantitative comparison, the present study leverages their complementary advantages. The strong agreement observed in key dynamic responses demonstrates the physical consistency and engineering reliability of the proposed co-simulation framework.
It should be noted that the present comparison constitutes a cross-validation between simulation models. Although the consistency of the results enhances the credibility of the models, the final confirmation of model validity still requires comparison with real deck towing experimental data or publicly available authoritative engineering benchmarks. This remains an important direction for the future improvement of the present study.

5. Discussion

5.1. Effect of Trajectory Control on Winch Rope Forces

The simulation results indicate that trajectory control significantly reduces the peak winch rope force, especially during the start-up phase.
This phenomenon can be explained by the fact that the Bezier-curve-based trajectory introduces a smoother lateral displacement evolution, which avoids sudden changes in steering angle and longitudinal acceleration.
As a result, the inertial force and rope tension induced by abrupt motion initiation are effectively suppressed.
From an engineering perspective, reducing the start-up peak force is critical, since rope failure and winch overload are most likely to occur during this transient phase rather than in steady motion.

5.2. Comparison Between Three-Winch Traction and Five-Winch Traction Modes

The five-winch mode exhibits a lower peak front-rope force than the three-winch mode under the same trajectory control.
This is mainly attributed to the load-sharing effect introduced by the auxiliary winches, which redistribute the traction force and reduce the burden on the front winch during the initial towing stage.
However, the results also show that the front rope force of the five-winch system may exceed that of the three-winch system in the later stage, indicating that the coordination strategy among multiple winches is a key factor for further optimization.

5.3. Interpretation of Tire Force Characteristics

The results indicate that the rear wheels experience larger vertical and longitudinal forces than the front wheel in both three-winch and five-winch traction modes. This is mainly due to the aircraft mass distribution and traction point configuration, as the center of mass is closer to the rear landing gears and multiple winch ropes are directly connected to them. Moreover, the lateral force of the rear wheels shows significantly larger fluctuations, with the peak values reaching up to 215% of those of the front wheel. This behavior results from the combined effects of curved trajectory tracking, asymmetric rope tension, and ship motion disturbances, under which the rear landing gears play a dominant role in maintaining lateral and yaw stability.
Trajectory control effectively smooths tire force evolution, especially during the start-up phase. Without trajectory control, abrupt acceleration and steering responses cause sharp force fluctuations, whereas the Bezier-curve-based trajectory introduces gradual changes in lateral displacement and steering angle, reducing inertial excitation and load variation. Although ship motion and wind load increase the overall magnitude and oscillation of tire forces, the relative load distribution between front and rear wheels remains unchanged. From an engineering perspective, these findings indicate that the rear landing gears are critical load-bearing components, and appropriate trajectory control is essential for reducing tire force fluctuations and enhancing towing safety on small decks.

5.4. Influence of Ship Motion and Wind Load

Ship motion and wind load introduce additional inertial and aerodynamic forces, leading to pronounced force fluctuations.
Compared with calm conditions, the rope and tire forces increase by up to 26%, indicating that environmental excitation is a non-negligible factor in winch traction safety.

6. Conclusions

This study investigated the dynamic characteristics and safety performance of a ship-borne aircraft winch traction system on a small deck under complex sea conditions. A fully coupled aircraft-landing gear–tire–rope–winch model was developed, and a Bezier-curve-based PID trajectory control strategy was proposed and validated through Adams-MATLAB/Simulink co-simulation. The main conclusions can be summarized as follows.
(1)
The proposed Bezier-curve-based PID trajectory control strategy significantly reduces winch rope force fluctuations, especially during the start-up phase. Compared with the uncontrolled straight-line trajectory, the peak force of the front winch rope was reduced by 54.9% for the three-winch system and 57.6% for the five-winch system, while the steady-state rope force was also slightly decreased.
(2)
A comparative analysis between three-winch and five-winch traction configurations was conducted under the same trajectory control conditions. The results show that the five-winch system provides a lower peak front rope force, with the maximum reduction of 12.7% compared to the three-winch system, indicating a larger safety margin during aircraft transfer operations.
(3)
The variation characteristics of tire forces were systematically analyzed. The rear wheels experience larger vertical, longitudinal, and lateral loads than the front wheel, with the maximum lateral force of the rear wheel reaching up to 215% of that of the front wheel. Trajectory control effectively smooths the tire force evolution and reduces abrupt load changes during start-up.
(4)
The accuracy and reliability of the proposed modeling approach were verified by theoretical analysis. The correlation coefficients between the theoretical results and numerical simulations range from 0.91 to 0.97, and the maximum error is less than 12%, satisfying engineering accuracy requirements.
This study has significant academic and engineering value in evaluating the force limits and safety margins of winch traction ropes and aircraft tires under various operating conditions, as well as in traction route planning and trajectory optimization for ship-borne aircraft. Moreover, the findings of this work provide a solid foundation for subsequent studies on the safety and stability of aircraft towing operations under complex sea conditions.
Unlike previous studies that primarily focus on simplified analytical models or validated experimental data, this research provides a comparative analysis between the MATLAB/Simulink and ADAMS simulation models, offering a preliminary assessment of the consistency between these two simulation approaches. This comparison lays the foundation for confirming the model’s credibility, and in the future, the model’s validity will be further improved through validation with real experimental data and authoritative engineering benchmarks.
Despite the promising performance of the proposed modeling and control framework for the ship-borne aircraft winch traction system, several limitations should be acknowledged. The accuracy of the simulation results depends on the fidelity of key modeling parameters, including landing gear stiffness and damping, tire–deck friction coefficients, and aircraft mass and inertia properties, which, although provided by the project, may still carry uncertainties due to variability in operational conditions and measurement tolerances. In addition, ship motion is represented by regular waves to facilitate mechanism analysis and method validation; however, this simplification cannot fully capture the randomness and extreme responses associated with realistic irregular sea states, potentially leading to an underestimation of peak loads. Moreover, model validation in the present study is mainly based on cross-comparisons between theoretical modeling and ADAMS simulations, while direct experimental or high-fidelity benchmark validation remains limited.
Future work will therefore focus on improving model robustness and engineering applicability by incorporating uncertainty quantification and sensitivity analysis to assess the influence of key parameters on traction dynamics. More realistic ship motion models based on irregular wave spectra, such as the JONSWAP model, will be introduced to evaluate statistical responses and extreme load scenarios. In addition, experimental validation through scaled tests, hardware-in-the-loop simulations, or comparisons with high-fidelity benchmark data will be pursued to further enhance the credibility of the proposed modeling and control framework.

Author Contributions

Software: B.Z., Y.L. and S.Y.; validation: G.N.; investigation: G.N.; resources: G.N.; data curation: S.Y.; writing—original draft preparation: B.Z.; writing—review and editing: Y.L. and S.Y.; supervision: G.N.; project administration: G.N.; funding acquisition: G.N. All authors have read and agreed to the published version of the manuscript.

Funding

This research was funded by National Natural Science Foundation of China, grant number 52275118. The APC was funded by Guofang Nan.

Data Availability Statement

The datasets analyzed during the current study are not publicly available due data being derived from a project, but are available from the corresponding author on reasonable request.

Conflicts of Interest

The authors declare no conflicts of interest.

Nomenclature

DRLDeep Reinforcement Learning
FEAFinite Element Analysis
BPBack-propagation
UAVUnmanned Aerial Vehicle
MECMobile Edge Computing
DDPGDeep Deterministic Policy Gradient
UAHUnmanned Aerial Helicopter
PPMPrescribed Performance Method
ABSAnti-lock Braking System
CTDConductivity–Temperature–Depth
PIDProportional–Integral–Derivative

References

  1. Nan, G.; Yang, S.; Li, Y.; Zhou, Y. Winch Traction Dynamics for a Carrier-Based Aircraft Under Trajectory Control on a Small Deck in Complex Sea Conditions. Aerospace 2024, 11, 885. [Google Scholar] [CrossRef] [Scilit]
  2. Wang, N.J.; Zhou, L.J.; Song, Q.; Zhang, D.F. Simulation Research on Braking Safety Properties of Aircraft Traction Systeme. Key Eng. Mater. 2009, 419–420, 705–708. [Google Scholar] [CrossRef] [Scilit]
  3. Zhang, H.; Jiao, Z.X.; Shang, Y.X.; Liu, X.C.; Qi, P.Y.; Wu, S. Ground maneuver for front-wheel drive aircraft via deep reinforcement learning. Chin. J. Aeronaut. 2021, 34, 166–176. [Google Scholar] [CrossRef] [Scilit]
  4. Wei, X.Z.; Lv, Y.; Li, J.H. Finite element analysis and structure design for chassis of aircraft towbarless tractor. Adv. Mater. Res. 2011, 328, 690–694. [Google Scholar] [CrossRef] [Scilit]
  5. Linn, D.R.; Langlois, R.G. Development and experimental validation of a shipboard helicopter on-deck maneuvering simulation. J. Aircr. 2006, 43, 895–906. [Google Scholar] [CrossRef] [Scilit]
  6. Afonin, D.V.; Pechurin, A.S.; Yatsun, S.F. Simulation of the Autonomous Curvilinear Motion of a Robotic Aircraft Towing System. J. Mach. Manuf. Reliab. 2022, 51, 173–183. [Google Scholar] [CrossRef] [Scilit]
  7. Wang, Y.G.; Wang, W.J.; Qu, X.J. Multi-body dynamic system simulation of carrier-based aircraft ski-jump takeoff. Chin. J. Aeronaut. 2013, 26, 104–111. [Google Scholar]
  8. Sharma, A. Development and Application of a Comprehensive Simulation for Modeling Helicopter Ship Landing. Doctoral Dissertation, University of Michigan, Ann Arbor, MI, USA, 2019. [Google Scholar]
  9. Li, H.X.; Qu, X.J.; Wang, W.J. Multi-body motion modeling and simulation for tilt rotor aircraft. Chin. J. Aeronaut. 2010, 23, 415–422. [Google Scholar] [CrossRef] [Scilit]
  10. Thota, P.; Krauskopf, B.; Lowenberg, M. Multi-parameter bifurcation study of shimmy oscillations in a dual-wheel aircraft nose landing gear. Nonlinear Dyn. 2012, 70, 1675–1688. [Google Scholar] [CrossRef] [Scilit]
  11. Yan, H.F.; Wang, Z.; Chen, W.K.; Wang, Z.; Wen, Q. Vision localization algorithm of intelligent towbarless aircraft tractor. Comput. Eng. 2008, 34, 214–216. [Google Scholar]
  12. He, Z.J.; Shi, Q.; Liang, J.; Gui, J.K.; Cheng, T.; He, L. Tridimensional vector path abstracting and trajectory tracking control on ramps of full self-driving vehicle. Control. Eng. Pract. 2023, 139, 105626. [Google Scholar] [CrossRef] [Scilit]
  13. Dong, C.Y.; Li, Y.; Wang, H.; Tu, R.; Chen, Y.J.; Ni, D.H.; Liu, Y.J. Lane-changing trajectory control strategy on fuel consumption in an iterative learning framework. Expert Syst. Appl. 2023, 228, 120251. [Google Scholar] [CrossRef] [Scilit]
  14. Xu, F.; Wang, S.; Su, W.Y.; Zhang, L. Joint optimization task offloading and trajectory control for unmanned-aerial-vehicle-assisted mobile edge computing. Comput. Electr. Eng. 2023, 111, 108916. [Google Scholar] [CrossRef] [Scilit]
  15. Wang, N.J.; Liu, H.B. Research on trajectory tracking behavior in traction task for tractor-aircraft system. In Proceedings of the 2013 IEEE International Conference on Mechatronics and Automation, Takamatsu, Japan, 4–7 August 2013; pp. 1251–1255. [Google Scholar]
  16. Wang, X.W.; Peng, H.J.; Liu, J.; Dong, X.Z.; Zhao, X.D.; Lu, C. Optimal control based coordinated taxiing path planning and tracking for multiple carrier aircraft on flight deck. Def. Technol. 2022, 18, 238–248. [Google Scholar] [CrossRef] [Scilit]
  17. Shao, S.Y.; Wang, L.W.; Yan, X.H.; Wu, Q.X. Trajectory planning and prescribed performance tracking control based on fractional-order observers for unmanned helicopters with unmeasurable states. Aerosp. Sci. Technol. 2023, 139, 108360. [Google Scholar] [CrossRef] [Scilit]
  18. Tsybanev, G.V.; Ageev, M.A.; Titarenko, R.V. Analysis of the specific features of loading of the elements of landing gears of aircrafts aimed at the evaluation of the load-bearing capacity of the structure. Strength Mater. 2008, 40, 458–462. [Google Scholar] [CrossRef] [Scilit]
  19. Jiang, Y.Y.; Feng, G.; Tang, H.H.; Zhang, J.; Jiang, B.Y. Effect of Coulomb friction on shimmy of nose landing gear under time-varying load. Tribol. Int. 2023, 188, 108828. [Google Scholar] [CrossRef] [Scilit]
  20. Wang, Z.Z.; Qi, P.Y.; Bai, N.; Liu, X.C.; Jiao, Z.X. A novel aircraft anti-skid brake control method based on multi-objective model predictive control for suppressing landing gear walk vibration. Aerosp. Sci. Technol. 2023, 132, 108062. [Google Scholar] [CrossRef] [Scilit]
  21. Ye, H.R.; Li, W.H.; Zhang, H.X.; Lin, S.Y.; Zhang, D.H.; Ge, Y.Y.; Lie, Z.H. Experimental evaluation of dimension-stable synthetic fibre rope under investigation of spooling test on the multilayer winch drum. Ocean Eng. 2023, 279, 114585. [Google Scholar] [CrossRef] [Scilit]
  22. Lee, K.; Ahn, S.; Hyun, D.; Seo, T. Position prediction of viscoelastic rope on traction sheave with rope-slip model. Mech. Mach. Theory 2023, 180, 105131. [Google Scholar] [CrossRef] [Scilit]
  23. Carral, L.; De Lara Rey, J.; Alvarez-Feal, J.C.; Couce, J.C. Winch control gear for CTD sampling with a system to compensate vertical motion heave when manoeuvring in rough seas. Ocean. Eng. 2017, 135, 246–257. [Google Scholar] [CrossRef] [Scilit]
  24. Zhao, C.; Thies, P.R.; Johanning, L. Investigating the winch performance in an ASV/ROV autonomous inspection system. Appl. Ocean Res. 2021, 115, 102827. [Google Scholar] [CrossRef] [Scilit]
  25. Chen, M.; Eatock Taylor, R.; Choo, Y.S. Investigation of the complex dynamics of float-over deck installation based on a coupled heave-roll-pitch impact mode. Ocean Eng. 2017, 137, 262–275. [Google Scholar] [CrossRef] [Scilit]
  26. Yang, H.J.; Ni, T.; Wang, Z.H.; Wang, Z.L.; Zhao, D.X. Dynamic modeling and analysis of traction operation process for the shipboard helicopter. Aerosp. Sci. Technol. 2023, 142, 108661. [Google Scholar] [CrossRef] [Scilit]
  27. Xiao, H. Research of Simulation Technology for Towing Operation in Tow Tractor-Aircraft System. Ph.D. Thesis, Huazhong University of Science and Technology, Wuhan, China, 2008. [Google Scholar]
  28. Wang, N.J.; Liu, H.B.; Zhou, L.J. Moving characteristics analysis of carrier -based aircraft traction system on deck. J. Cent. South Univ. 2013, 44, 2304–2310. [Google Scholar]
  29. Qi, J.Y.; Jin, J.Q.; Fu, J.S. Yaw Stability Control of Carrier-Based Aircraft Towbarless Tractor. J. Shanghai Jiaotong Univ. 2020, 54, 943–952. [Google Scholar]
  30. Wang, D. Study on Tether Load Analysis and Optimization Design of Shipborne Helicopters. Ph.D. Thesis, Harbin Engineering University, Harbin, China, 2008. [Google Scholar]
  31. Aeronautical Science and Technology Research Institute of the Ministry of Aerospace Industry (Ed.) Helicopter Load Manual; Aviation Industry Press: Beijing, China, 1991; pp. 212–223. [Google Scholar]
Figure 3. Winch model.
Jmse 14 00170 g003
Figure 4. Force analysis of cable on traction drum.
Jmse 14 00170 g004
Figure 1. Rear landing gear model.
Jmse 14 00170 g001
Figure 2. Front landing gear model.
Jmse 14 00170 g002
Figure 5. The schematic diagram of the coordinate system and motions of ship.
Jmse 14 00170 g005
Figure 6. Schematic diagram of wind load synthesis. The arrows indicate the individual wind velocity components and the resultant wind velocity acting at the aircraft center of mass.
Jmse 14 00170 g006
Figure 7. Illustration of a third-order Bézier curve. The initial black line segments connect the four control points P0, P1, P2, and P3, defining the overall shape and trend of the curve. The green and intermediate black segments represent the auxiliary connections of the first- and second-order Bézier points during the recursive interpolation process. The red curve denotes the final third-order Bézier curve, which is the smooth target parametric trajectory.
Jmse 14 00170 g007
Figure 8. PID control.
Jmse 14 00170 g008
Figure 9. Schematic diagram of three-winch traction.
Jmse 14 00170 g009
Figure 10. Curve of vertical force for front/rear wheel with change in time (no wind, no ship motion, and three winches).
Jmse 14 00170 g010
Figure 11. Curve of longitudinal force for front/rear wheel with change in time (no wind, no ship motion, and three winches).
Jmse 14 00170 g011
Figure 12. Curve of lateral force for front/rear wheel with change in time (no wind, no ship motion, and three winches).
Jmse 14 00170 g012
Figure 13. Curve of rope force for front/rear winch with change in time (no wind, no ship motion, and three winches).
Jmse 14 00170 g013
Figure 14. Curve of vertical force for front/rear wheel with change in time (wind, ship motion, and three winches).
Jmse 14 00170 g014
Figure 15. Curve of longitudinal force for front/rear wheel with change in time (wind, ship motion, and three winches).
Jmse 14 00170 g015
Figure 16. Curve of lateral force for front/rear wheel with change in time (wind, ship motion, and three winches).
Jmse 14 00170 g016
Figure 17. Curve of rope force for front/rear winch with change in time (wind, ship motion, and three winches).
Jmse 14 00170 g017
Figure 18. Schematic diagram of five-winch traction.
Jmse 14 00170 g018
Figure 19. Curve of vertical force of front/rear wheel with change in time (five winches).
Jmse 14 00170 g019
Figure 20. Curve of longitudinal force of front/rear wheel with change in time (five winches).
Jmse 14 00170 g020
Figure 21. Curve of lateral force of front/rear wheel with change in time (five winches).
Jmse 14 00170 g021
Figure 22. Curve of rope force of front/rear winch with change in time (five winches).
Jmse 14 00170 g022
Figure 23. Curve of the auxiliary rope force with change in time of the five-winch traction with deck motion and wind load (going for hangar).
Jmse 14 00170 g023
Figure 24. Flow chart of SIMULINK control module.
Jmse 14 00170 g024
Figure 25. Curve of vertical force of front/rear wheel with change in time (without ship movement and wind).
Jmse 14 00170 g025
Figure 26. Curve of longitudinal force of front/rear wheel with change in time (without ship movement and wind).
Jmse 14 00170 g026
Figure 27. Curve of lateral force of front/rear wheel with change in time (without ship movement and wind).
Jmse 14 00170 g027
Figure 28. Curve of rope force of front/rear winch with change in time (without ship movement and wind).
Jmse 14 00170 g028
Figure 29. Comparison of setting trajectory and actual trajectory (without ship movement and wind).
Jmse 14 00170 g029
Figure 30. Bezier comparison of without ship movement and wind (actual curve1) and with ship movement and wind (actual curve).
Jmse 14 00170 g030
Figure 31. Comparison of setting trajectory and actual trajectory (with ship movement and wind).
Jmse 14 00170 g031
Figure 32. Curve of vertical force of front/rear wheel with change in time (with ship movement and wind).
Jmse 14 00170 g032
Figure 33. Curve of longitudinal force of front/rear wheel with change in time (with ship movement and wind).
Jmse 14 00170 g033
Figure 34. Curve of lateral force of front/rear wheel with change in time (with ship movement and wind).
Jmse 14 00170 g034
Figure 35. Comparison of rope force of front winch with or without trajectory control with change in time (three-winch).
Jmse 14 00170 g035
Figure 36. Comparison between the actual trajectory and the setting trajectory.
Jmse 14 00170 g036
Figure 37. Curve of vertical force of front/rear wheel with change in time.
Jmse 14 00170 g037
Figure 38. Curve of longitudinal force of front/rear wheel with change in time.
Jmse 14 00170 g038
Figure 39. Curve of lateral force of front/rear wheel with change in time.
Jmse 14 00170 g039
Figure 40. Curves of rope forces of auxiliary winches with change in time.
Jmse 14 00170 g040
Figure 41. Comparison of rope force of front winch with or without trajectory control (five-winch).
Jmse 14 00170 g041
Figure 42. Comparison of rope force of front wheel between three-winch and five-winch.
Jmse 14 00170 g042
Figure 45. Comparison of the front rope forces obtained by ADAMS and MATLAB.
Jmse 14 00170 g045
Figure 46. Comparison of right rear wheel friction forces obtained by ADAMS and MATLAB.
Jmse 14 00170 g046
Figure 43. Rope mechanics model.
Jmse 14 00170 g043
Figure 44. Theoretical analytical model of fuselage-landing gear–tire system.
Jmse 14 00170 g044
Table 4. Parameters of contact and rope.
Rope ParametersContact Parameters of Rope and Pulley
Density (g·m−3)1.0 × 10⁶Contact stiffness (N·mm−1)1.0 × 10⁴
Young’s modulus (MPa)1.0 × 10⁵Coefficient of friction0.6
Damping (N·S/mm)1.0 × 10−2Critical contact velocity (mm·s−1)0.6
Table 1. Landing gear parameters.
The Name of the ParameterMeaning of the ParameterNumerical
Main landing gearStiffness (N/mm)370.7
Damping(N·s/mm)49.9
Front landing gearStiffness(N/mm)884.4
Damping(N·s/mm)15.3
Table 2. Parameters of landing gear.
Rear Landing Gear (mm)
Vertical pillarUpper pillar diameter150Upper pillar length470
Lower pillar diameter120Lower pillar length230
Inclined pillarUpper pillar diameter116Upper pillar length364
Lower pillar diameter96Lower pillar length262
Front landing gear (mm)
Vertical pillarUpper pillar diameter89Upper pillar length280
Lower pillar diameter61Lower pillar length194
Property of Landing gear
MaterialsSteelDensity (g/cm3)7.801
Table 3. Fiala tire parameters.
The Name of the ParameterValue
Tire mass (kg)150
Tire radius (mm)280
Tread width of the tire (mm)230
Tire normal stiffness coefficient2800
Normal damping coefficient of the tire28
Tire rolling resistance arm (mm)9.32
Longitudinal stiffness of tires (N/mm)6000
Tire side stiffness (N/d)1000
Table 5. Parameters of PID.
Three-WinchFive-Winch
Proportional (P)0.15Proportional (P)0.1
Integral (I)0.102Integral (I)0.2
Derivative (D)0Derivative (D)0
Table 6. Parameters of ship motion and wind load.
Parameters of Ship Motion Parameters of Wind Load
Period (s) T φ T θ T z Wind load area (m2)32.04
14.827.326.2
Initial phase angle (°) η φ η θ η z Resultant wind velocity (m/s)15
000
Table 7. Coordinates of traction point in three-winch traction.
NameCoordinate (m)
Traction point of front winch (88.96, 0.057, −1.28)
Traction point of rear winch 1 (−21.01, 14.94, −1.28)
Traction point of rear winch 2 (−21.01, −14.94, 1.28)
Traction point of front landing gear(4.65, 0, −0.395)
Traction point of rear landing gear 1(−1.95, 1.95, −0.32)
Traction point of rear landing gear 2(−1.95, −1.95, −0.32)
Origin of the coordinateProjection of the aircraft centroid on the deck at initiation
Table 8. Coordinates of five-winch traction point.
NameCoordinate (m)
Traction point of front winch(88.96, 0.057, −1.28)
Traction point of rear winch 1(−21.01, 14.94, −1.28)
Traction points of rear winch 2(−21.01, −14.94, 1.28)
Traction point of auxiliary winch 1(13.99, 14.94, −1.28)
Traction points of auxiliary winch 2(13.99, −14.94, −1.28)
Traction point of front landing gear(4.65, 0, −0.395)
Traction point of rear landing gear 1(−1.95, 1.95, −0.32)
Traction point of rear landing gear 2(−1.95, −1.95, −0.32)
Origin of the coordinateProjection of the aircraft centroid on the deck at initiation
Disclaimer/Publisher’s Note: The statements, opinions and data contained in all publications are solely those of the individual author(s) and contributor(s) and not of MDPI and/or the editor(s). MDPI and/or the editor(s) disclaim responsibility for any injury to people or property resulting from any ideas, methods, instructions or products referred to in the content.