Article

Experimental Investigation of Hydrodynamic Coefficients of a Pitch-Inclined Column–Heave-Plate Component for Floating Offshore Wind Turbines


1
School of Infrastructure Engineering, Dalian University of Technology, Dalian 116024, China
2
State Key Laboratory of Coastal and Offshore Engineering, Dalian University of Technology, Dalian 116024, China
3
Science and Technology Research Institute (STRI), China Three Gorges Corporation, Beijing 101149, China
4
School of Naval Architecture, Ocean and Energy Power Engineering, Wuhan University of Technology, Wuhan 430062, China
5
Department of Civil Engineering, Faculty of Engineering, Chiang Mai University, Chiang Mai 50200, Thailand
*
Author to whom correspondence should be addressed.
J. Mar. Sci. Eng. 2026, 14(17), 1563; https://doi.org/10.3390/jmse14171563
Submission received: 4 June 2026 / Revised: 14 July 2026 / Accepted: 20 August 2026 / Published: 24 August 2026
(This article belongs to the Special Issue Numerical Analysis and Modeling of Floating Structures (2nd Edition))

Abstract

As offshore wind development moves toward deeper waters, floating offshore wind turbines have become essential for carbon-neutral energy systems. This study experimentally investigates the hydrodynamic coefficients of typical column–heave-plate components under forced oscillations, focusing on the influence of pitch-induced inclination. A circular column without a heave plate and a circular column equipped with a hexagonal heave plate were tested under heave and surge motions with varying periods, amplitudes, and static inclination angles. The static inclinations were used to represent the attitude variation of platform components during large-amplitude pitch responses. Added mass and damping coefficients were identified using the least squares method. The results show that for the heave-plate-equipped column, increasing the inclination from 0° to 5° and 10° reduced the nondimensional heave added mass by approximately 4.3% and 5.9%, respectively, and reduced the nondimensional heave damping by approximately 7.1% and 6.8%. The corresponding reductions in surge added mass were approximately 5.3% and 10.5%, whereas the reductions in surge damping reached approximately 8.2% and 16.4%, indicating that the surge damping is most sensitive to static inclination. These variations may be associated with the altered geometric projection and disturbed flow symmetry of the inclined component, which may affect the attached-fluid volume and energy-dissipation process during forced oscillation. Future studies should further verify the corresponding local separation and vortex-formation mechanisms through detailed flow-field measurements, PIV, or CFD.

1. Introduction

As offshore wind development moves into deeper waters, floating offshore wind turbines (FOWTs) have become an important option for large-scale wind-energy exploitation. Among the major floating concepts, semi-submersible platforms are widely studied because of their broad water-depth applicability, convenient construction, and moderate mooring requirements [1,2,3,4]. Recent studies have further extended FOWT research to coupled wind–wave and wind–aquaculture integrated systems [5,6], while wet-towing operation analysis and tugboat time-domain simulation have provided useful support for the marine transportation and operational-safety assessment of semi-submersible floating wind turbines [7,8]. Short-term mooring-tension prediction under typhoon conditions has also strengthened operational-safety assessment for floating systems [9]. Related advances in marine-environment perception and adaptive sea-state estimation also support safer offshore and polar marine operations [10,11]. Their hydrodynamic behavior is strongly affected by columns, pontoons, and heave plates, which determine the added mass, damping, and natural periods of the system.
Beyond external-load prediction and marine-operation support, structural vibration-control devices such as multi-stage inertial dampers also indicate the increasing emphasis on response suppression and energy dissipation in wind turbines [12]. Heave plates are essential appendages for improving the motion performance of semi-submersible platforms. They are commonly installed at column bottoms or pontoon ends to increase added mass and viscous damping, shift the natural period away from the dominant wave-energy range, and dissipate wave-induced energy through flow separation, vortex shedding, and wake development around sharp plate edges. Their coefficients depend on the Keulegan–Carpenter number (KC), frequency parameter, geometry, porosity, submergence, and edge shape. Forced oscillation tests, free-decay tests, and computational fluid dynamics (CFD) have therefore been widely used to identify heave plate added mass and damping [13].
Fundamental studies have established the dominant role of vortex generation and viscous dissipation in heave plate hydrodynamics. Takaki and Lee [14], Tao and Thiagarajan [15,16], Tao and Dray [17], Li et al. [18], Tian et al. [19], and Ezoji et al. [20] showed that KC number, frequency, submergence, porosity, edge geometry, and plate spacing can significantly affect hydrodynamic coefficients.
For column–heave-plate configurations in floating wind platforms, Lopez-Pavon and Souto-Iglesias [21] performed large-scale forced oscillation experiments and highlighted the importance of accurately estimating viscous damping under survival conditions. Medina-Manuel et al. [22] compared forced oscillation and free-decay methods for identifying heave plate hydrodynamic coefficients. Zhang et al. [23] further examined heave plate effects, including boundary influences, and emphasized the need for accurate coefficient identification in FOWT hydrodynamic modelling.
Furthermore, Zhang et al. [24] examined free-surface and seabed effects, demonstrating that boundary conditions and local vortex structures can significantly modify added mass and damping.
In addition to heave motion, floating wind platforms experience coupled motions in surge, sway, pitch, roll, and yaw under realistic sea conditions. Therefore, investigations limited to heave-direction hydrodynamic coefficients are insufficient for engineering modeling. Han et al. [25,26] showed that a cylinder with a heave plate can exhibit distinct horizontal and vertical load characteristics and that higher-order harmonics may become important at larger amplitudes or smaller submergence depths. Therefore, heave surge and pitch coefficients are relevant for component-level parameterization.
CFD can complement experiments by resolving viscous-flow features that are not captured by potential-flow theory. Recent numerical and experimental studies on perforated heave plates, CFD-assisted frequency-domain modeling, and overset-mesh simulations have improved coefficient prediction for heave plate components [27,28,29].
In recent years, some studies have further improved the motion performance of floating wind platforms from the perspective of heave plate structural optimization. Huang et al. [30] proposed a biomimetic fractal heave plate for a spar-type floating wind platform and showed its potential for reducing heave response. However, most existing studies still focus on vertical or symmetric configurations. In practical operation, floating wind platforms may undergo large pitch responses induced by mean wind loads, wave excitation, or extreme sea states, causing the column–heave-plate component to become inclined relative to the free surface. Liu et al. [31] showed that small inclination angles can alter the pressure distribution, vortex structure, and fluid-force characteristics of a circular cylinder with an end appendage, suggesting that inclination may also influence the hydrodynamic behavior of column–heave-plate components.
Additional heave plate studies further broaden the parameter space relevant to hydrodynamic-coefficient identification. Molin [32] analyzed the added mass and damping of periodic arrays of fully or partially porous disks, while Tao et al. [33] showed that the spacing between multiple heave plates can affect vortex interaction and the resulting hydrodynamic coefficients. An and Faltinsen [34] combined experiments and numerical modeling for submerged perforated rectangular plates and demonstrated the KC-dependent nature of heave added mass and damping. Brown et al. [35] investigated heave plate coefficients for wave-energy applications and highlighted the combined influence of KC, Reynolds number, and β, while Turner et al. [36] compiled heave plate coefficient data for floating offshore wind turbine modeling. Thiagarajan and Moreno [37] further showed that incident waves and the relative phase between wave and motion can modify the hydrodynamic coefficients of heave plates near the free surface.
At the component scale, Rao et al. [38] used forced oscillation tests to obtain the heave added mass and damping of a spar with heave plates, while their companion CFD study further validated numerical prediction of heave plate damping [39]. Pinguet et al. [40] adopted an overset-mesh CFD method to analyze the added mass, damping, and induced flow of isolated and cylinder-mounted heave plates at different submergence depths.
At the platform scale, Mello et al. [41] and Yang et al. [42] investigated the influence of heave plates on the dynamic responses of floating offshore wind turbines in waves and model tests. Recent design-oriented studies further examined heave plate optimization [43], dual circular heave plate concepts under extreme turbulent winds [44], heave plate shape effects for 15 MW floating wind turbines [45], and the combined effects of moonpools and heave plates on barge-type platforms [46]. In addition, real-time hybrid model tests [47] and focused-wave excitation studies [48] have emphasized the need for reliable hydrodynamic modeling at the global-platform level. Nevertheless, most of them focus on vertical, symmetric, or global-platform responses. The present contribution is the experimental quantification of static-inclination effects on both heave and surge hydrodynamic coefficients of a column–hexagonal-heave-plate component under common amplitude–period conditions.
Based on these gaps, this study conducts forced oscillation experiments on a representative column–heave-plate component extracted from a 15 MW semi-submersible floating wind platform. The objectives are to (i) quantify the heave and surge added mass and damping coefficients of circular-column and column–hexagonal-heave-plate configurations; (ii) evaluate the influence of prescribed static pitch inclinations of 5° and 10° on the non-dimensional coefficients of the heave-plate-equipped component; and (iii) provide component-level experimental data for hydrodynamic-parameter selection and future calibration of global floating-wind-platform models. Unlike previous studies that mainly focused on vertical or symmetric configurations, the present work emphasizes pitch-inclined component-level hydrodynamic coefficients under both heave and surge forced oscillations. The remainder of this paper is organized as follows. Section 2 describes the model, experimental setup, and test cases. Section 3 introduces the coefficient-identification and nondimensionalization methods. Section 4 presents and discusses the effects of the heave plate and static inclination. Section 5 summarizes the main conclusions and limitations.

2. Experimental Setup and Model Description

2.1. Model Description

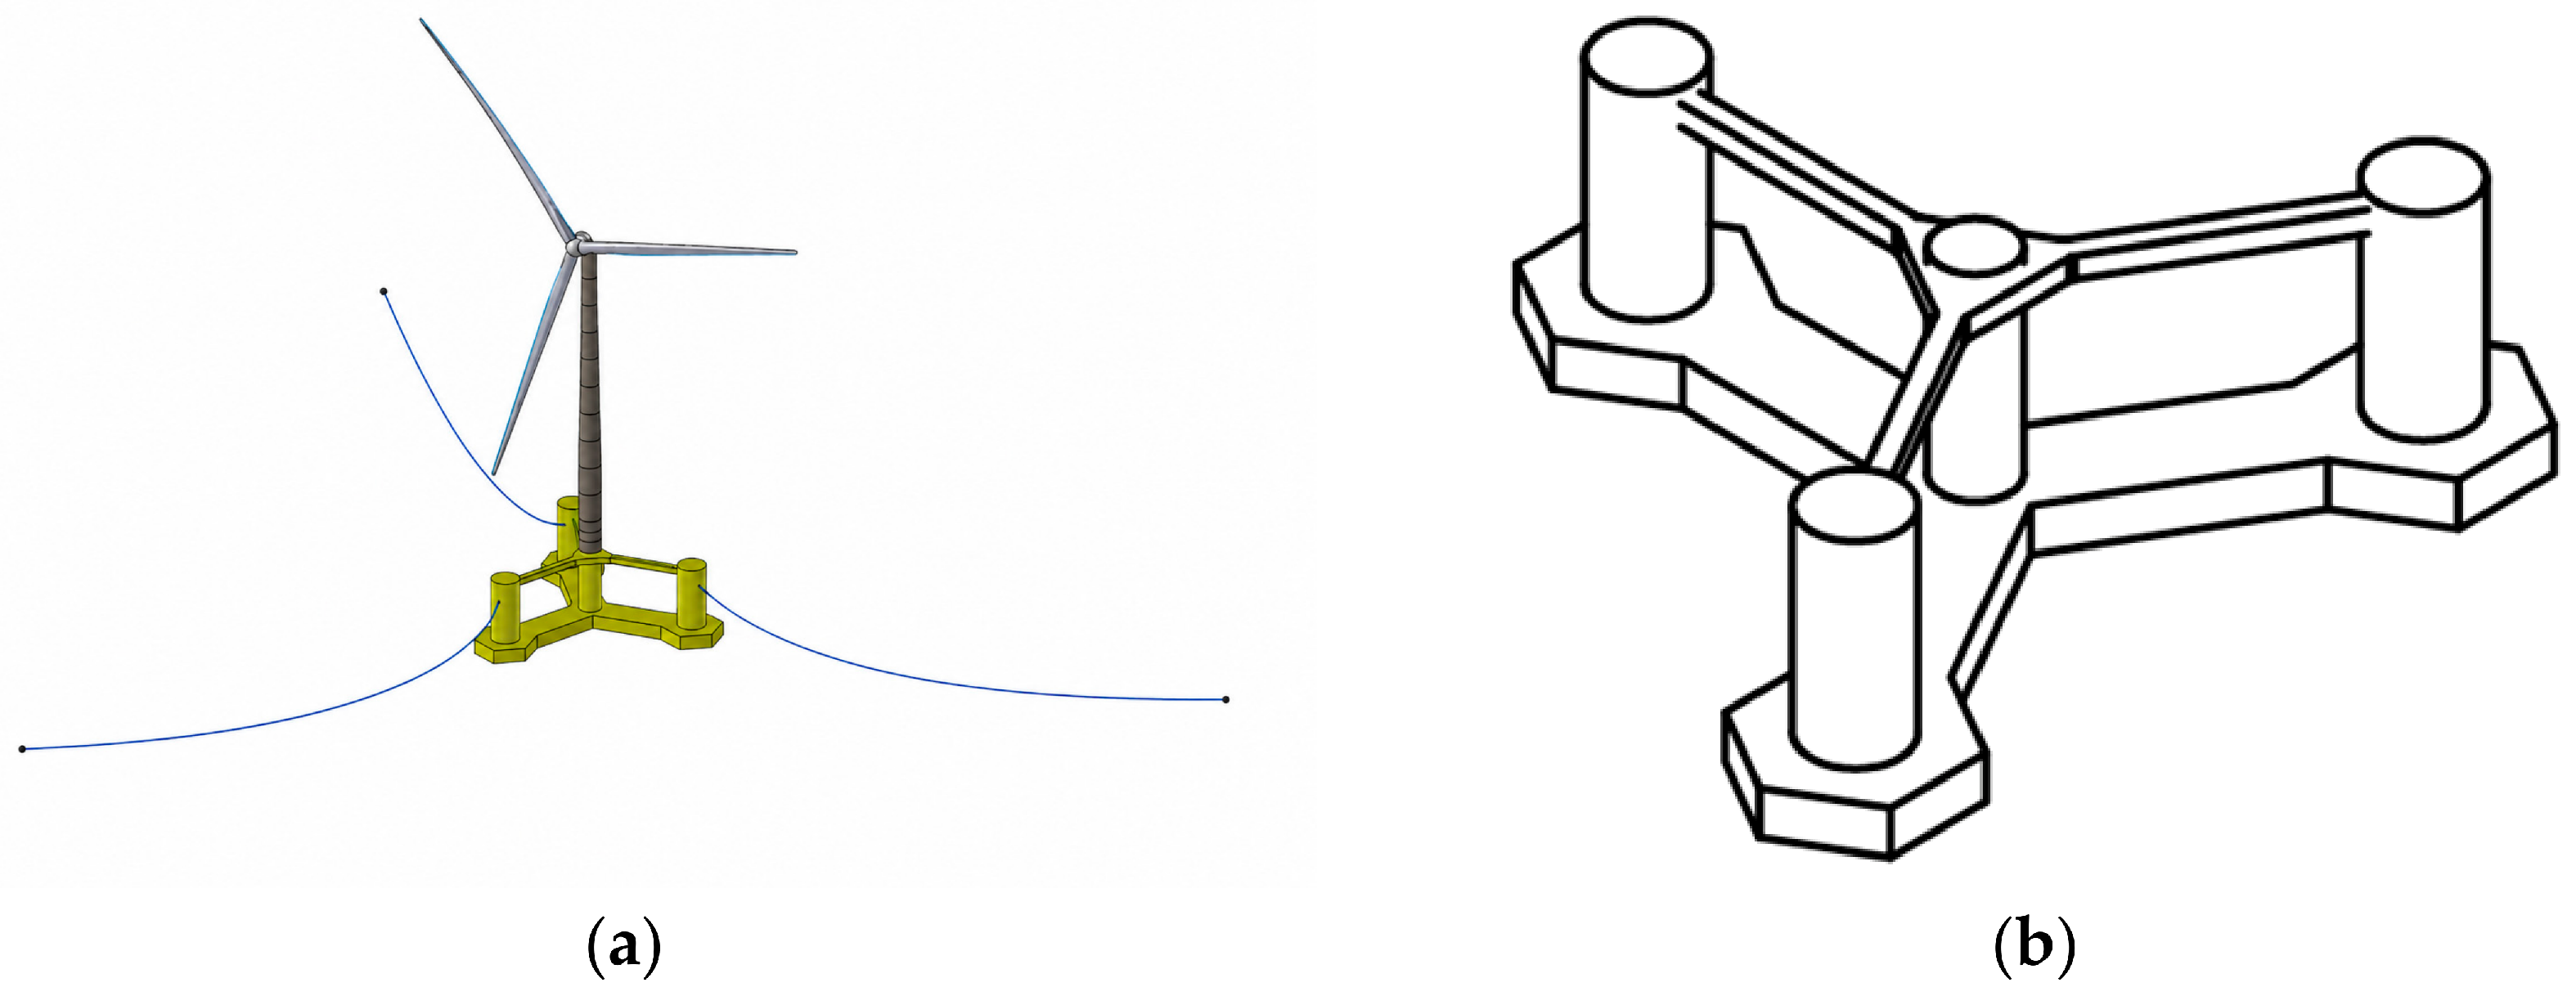
The reference geometry was derived from Science and Technology Research Institute, China Three Gorges Corporation [49]. The prototype platform includes hexagonal heave plates at the column bottoms. Model A3 represents the column–heave-plate component of the prototype, whereas Model A1 was introduced as a control case to isolate the hydrodynamic contribution of the heave plate. The test object is a 1:100 scaled component model of a 15 MW semi-submersible FOWT. The prototype platform mainly consists of three side columns, one central column, lower pontoons, and hexagonal heave plates, as illustrated in Figure 1. This study focuses on representative column and column–heave-plate components that strongly affect local hydrodynamic coefficients.
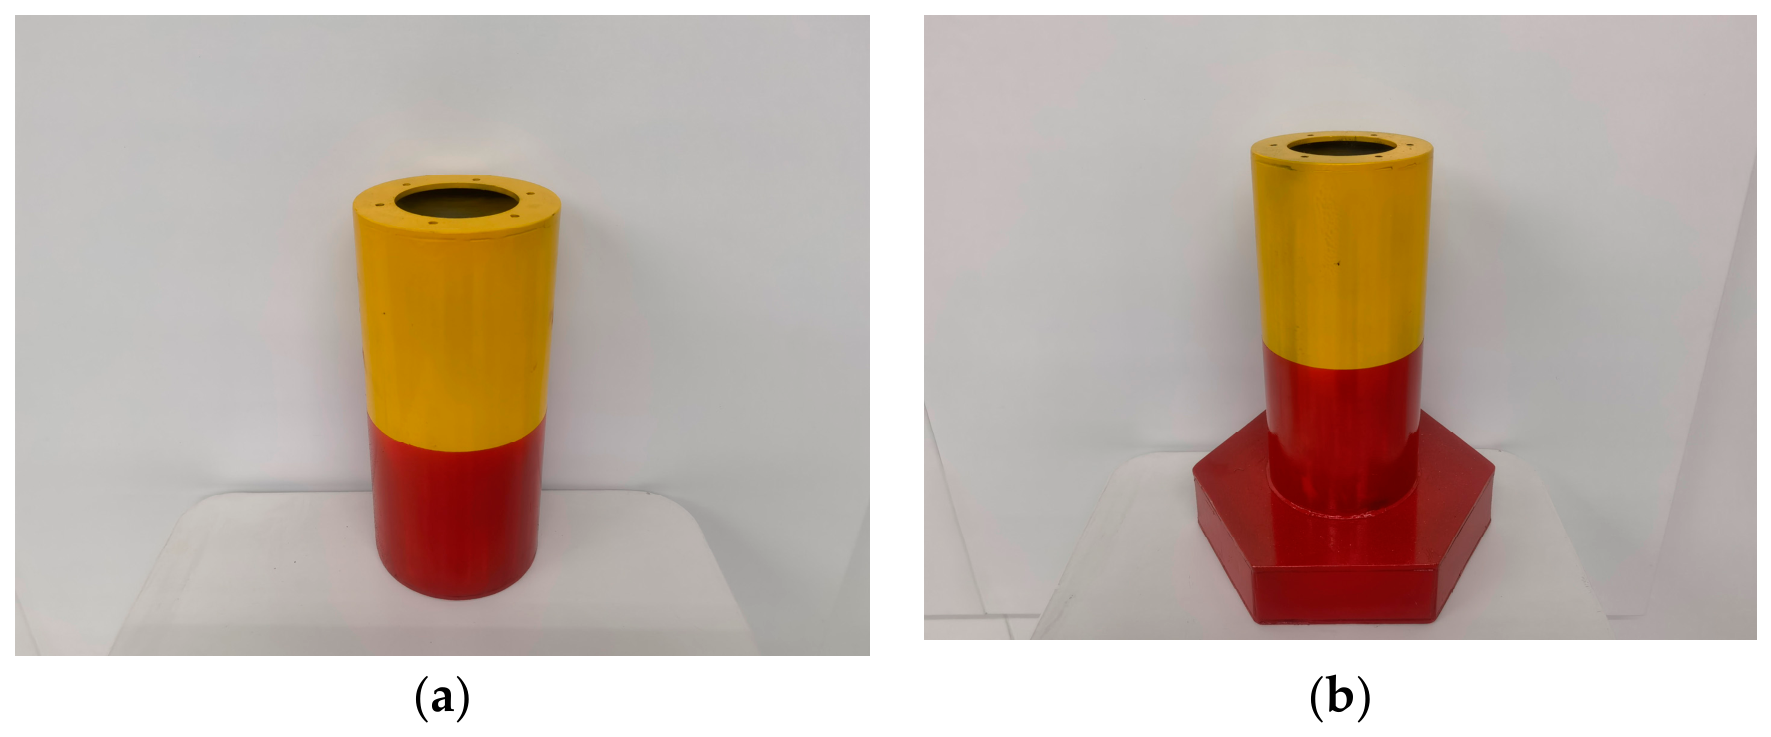
To ensure experimental feasibility, non-essential transition details were simplified while the main submerged hydrodynamic features were retained. The test models consisted of a circular column and a circular column with a hexagonal heave plate, fabricated from aluminum alloy.
The principal prototype and model dimensions are listed in Table 1, and photographs of the model are shown in Figure 2. The scaled models preserve the main geometric proportions of the prototype components and are suitable for forced oscillation coefficient identification.
The center of gravity and mass moments of inertia were not used in the present single-degree-of-freedom forced oscillation tests because the models were rigidly connected to the hexapod motion system and only prescribed heave or surge motions were imposed. Therefore, these quantities were not involved in the extraction of the heave and surge hydrodynamic coefficients.

2.2. Experimental Setup

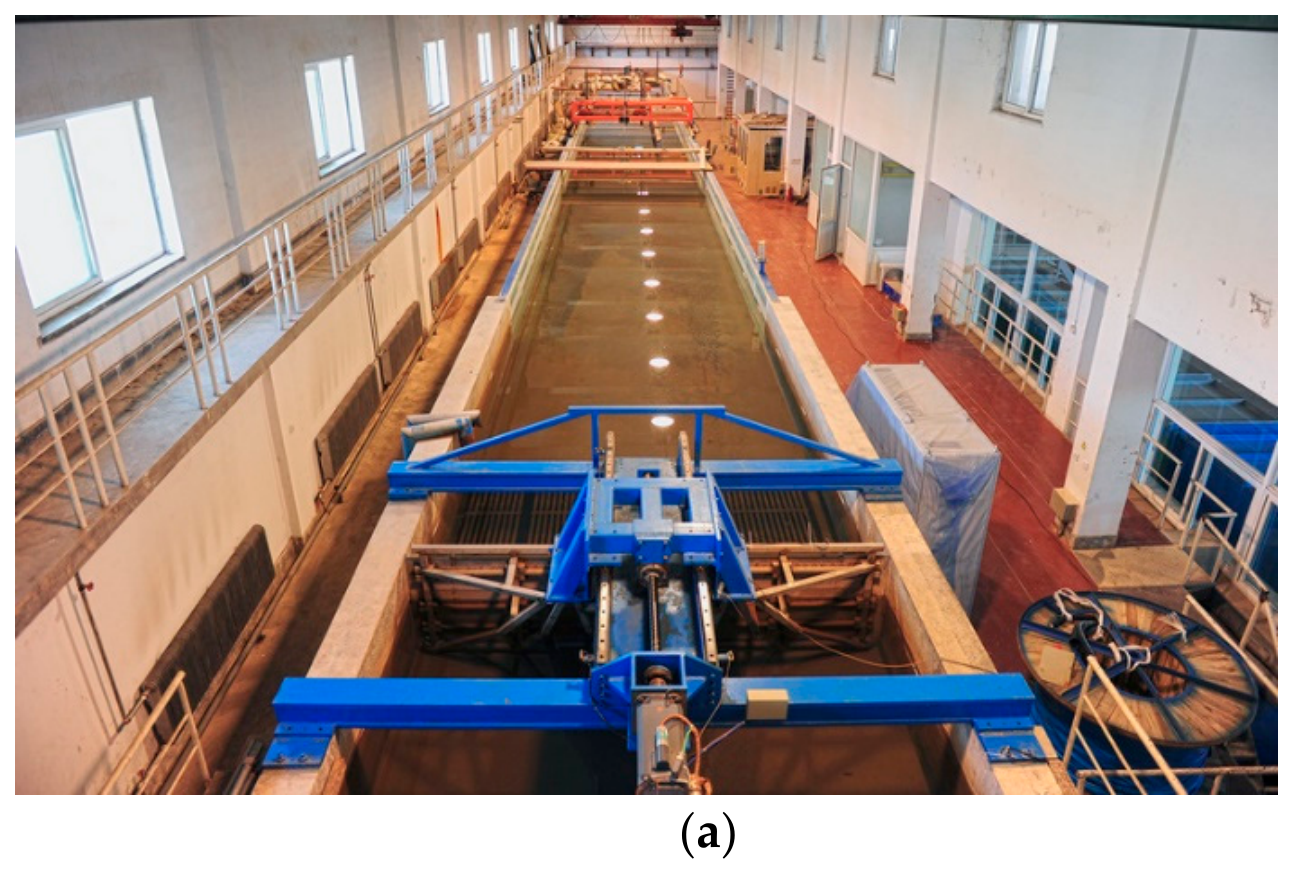
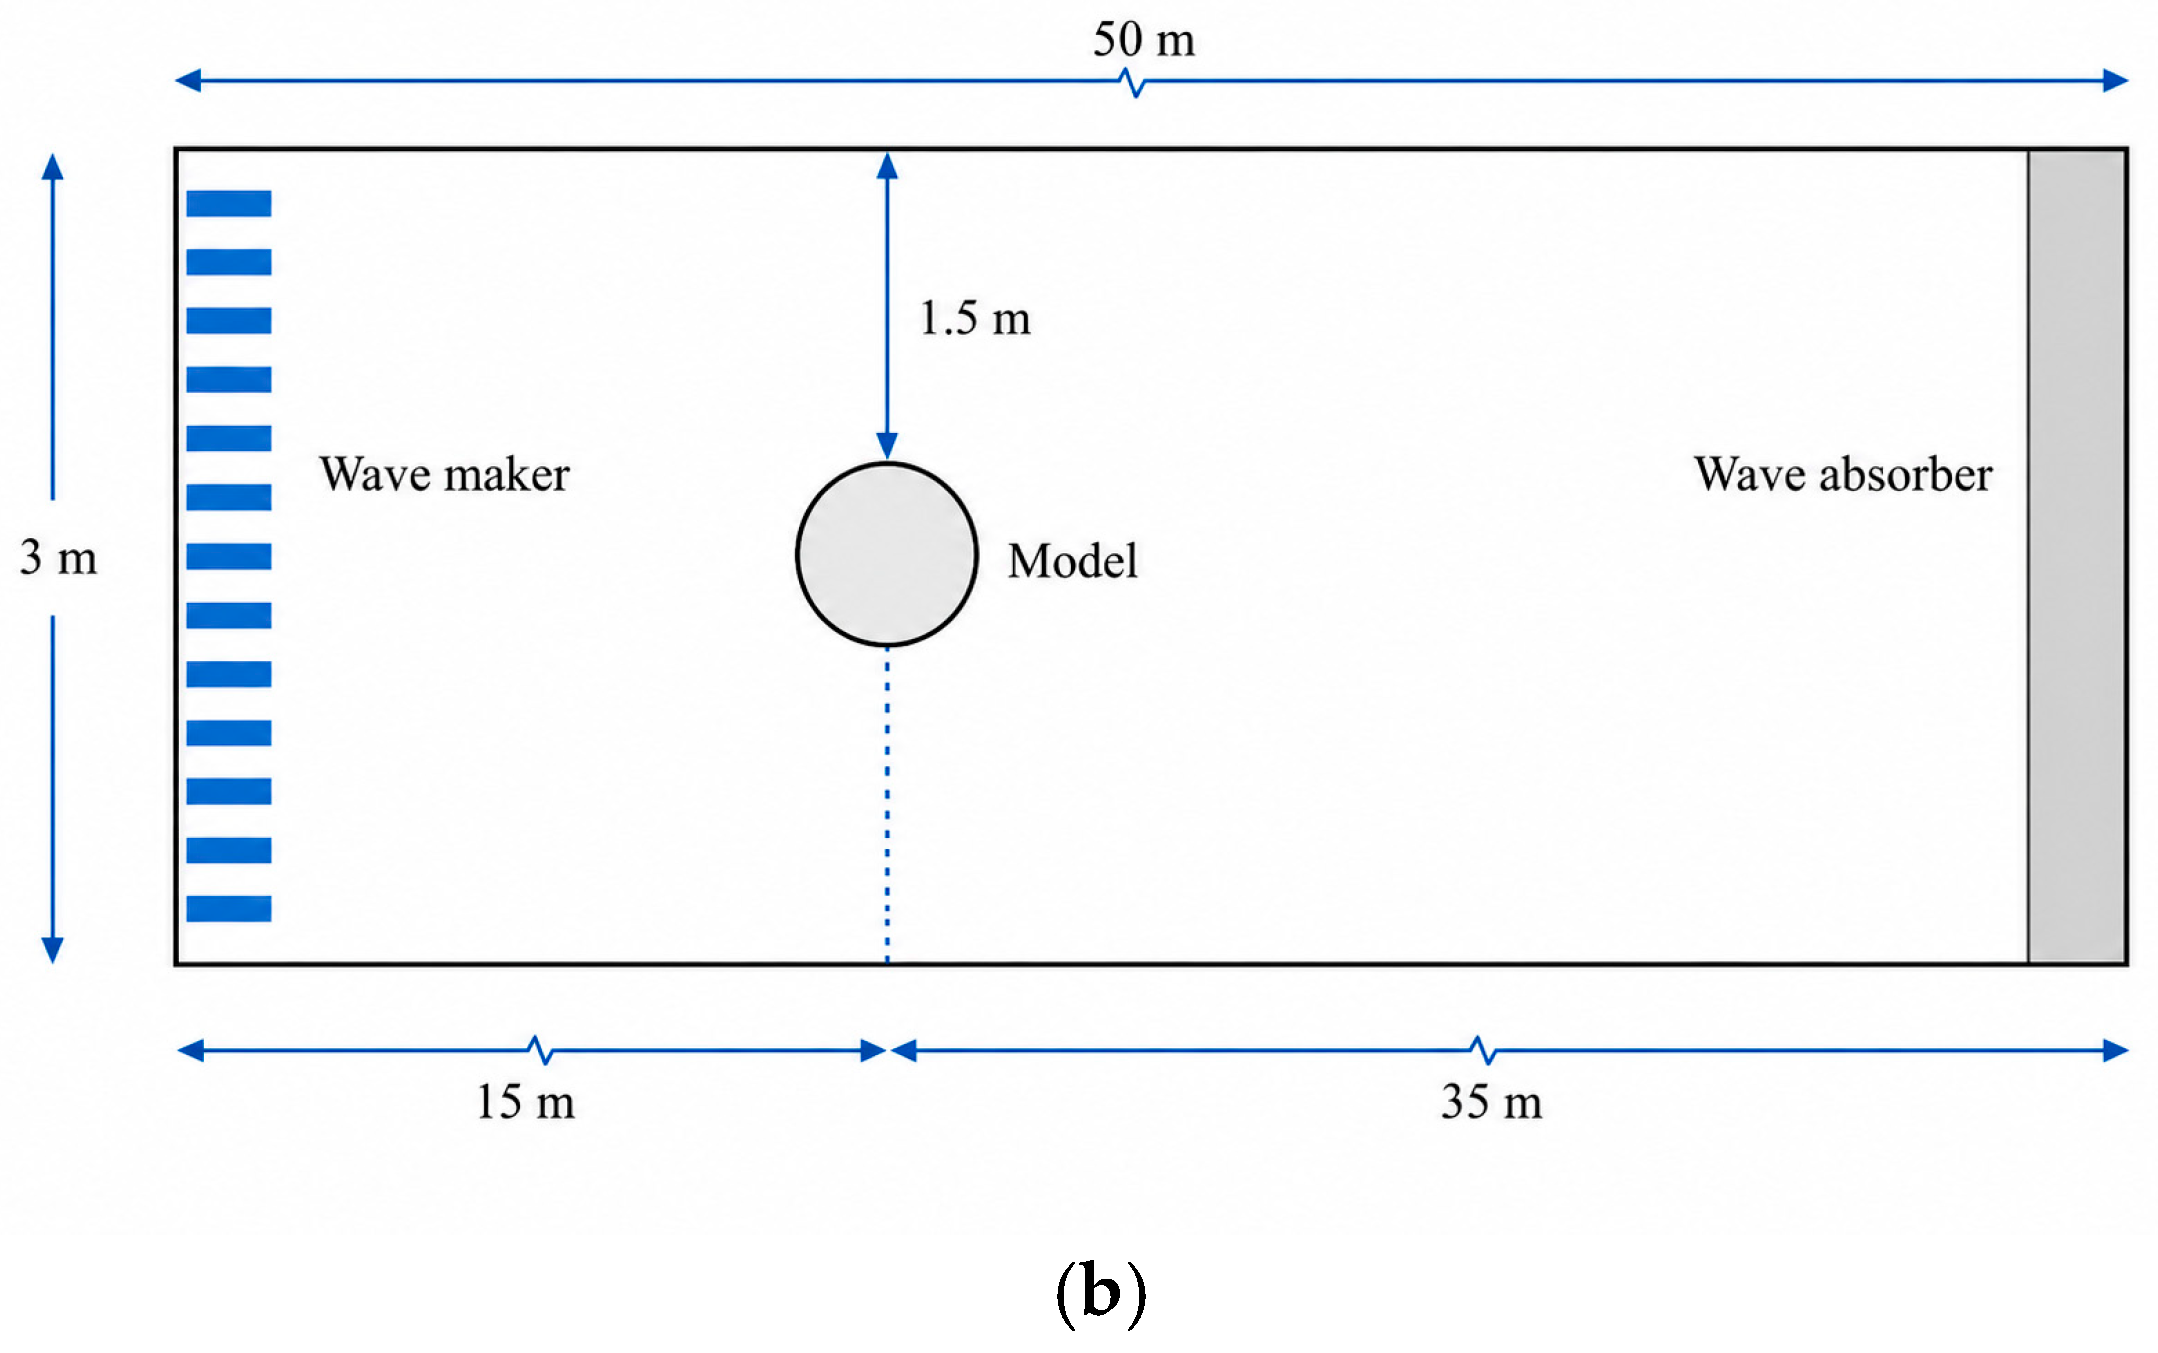
The physical model experiments were conducted in the ocean environmental wave tank at the State Key Laboratory of Coastal and Offshore Engineering, Dalian University of Technology (Figure 3). The wave tank is 50.0 m long, 3.0 m wide, and 1.0 m deep. The maximum operating water depth of the wave maker is 0.7 m, with a maximum wave height of 0.30 m and a wave period range of 0.5–5.0 s.
Figure 3 shows the position of the experimental model in the wave tank. The model was arranged along the centerline of the flume and positioned relatively close to the wave maker. During the experiments, the model was mounted beneath an inverted hexapod motion system and connected to the component model through a connector and bolted joints.
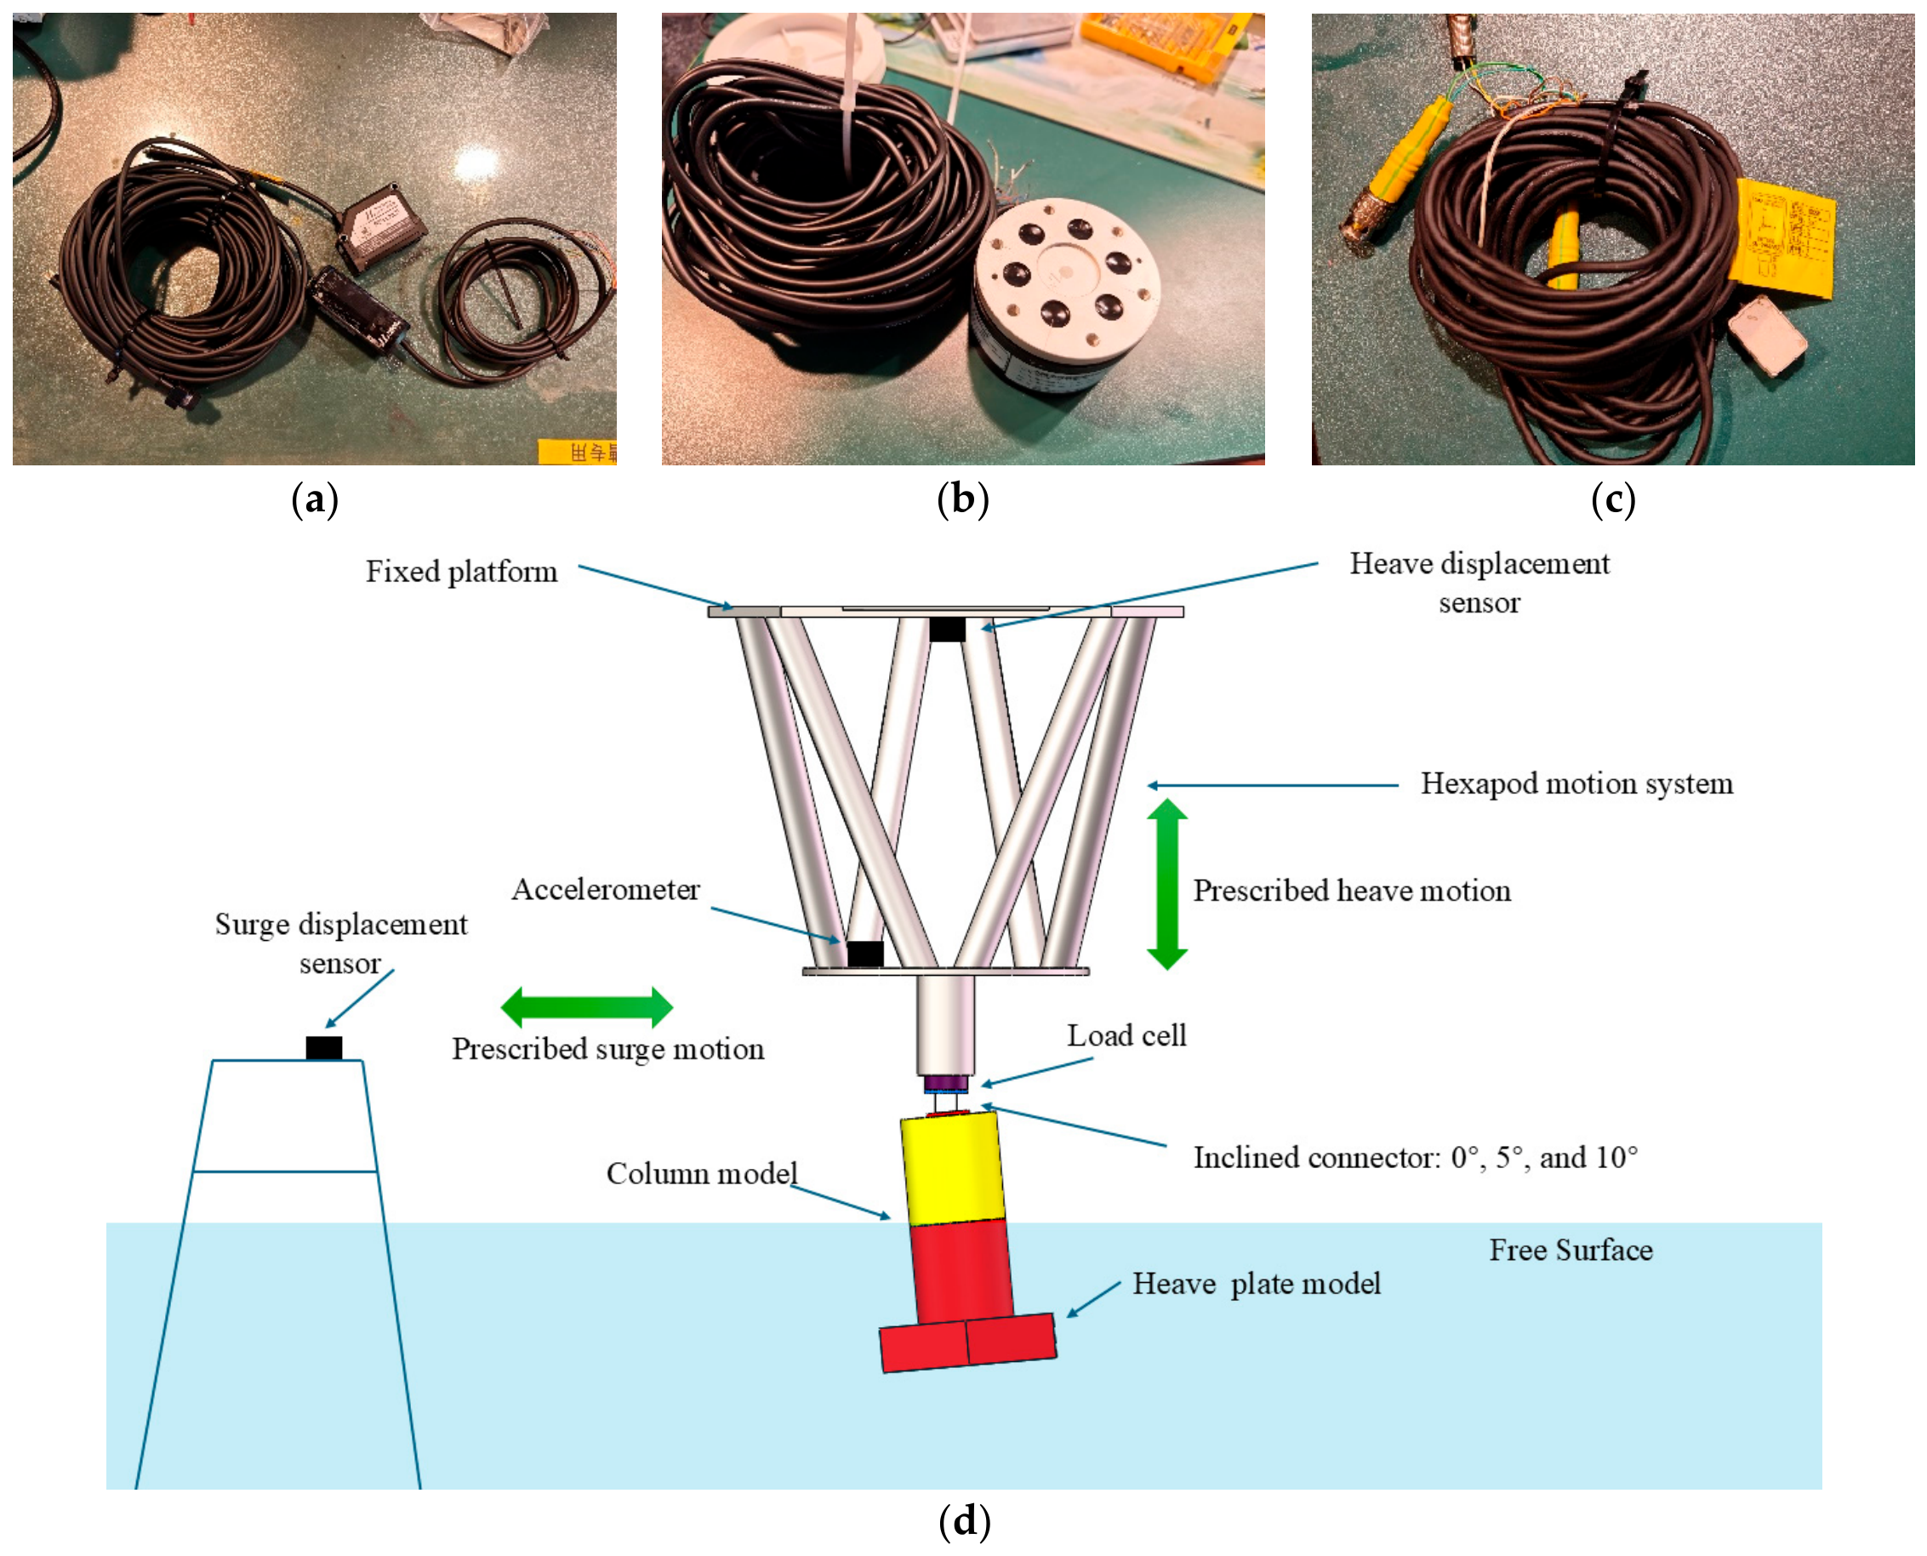
The main instruments used in the forced oscillation experiments included a six-component load cell, an accelerometer, two laser displacement sensors, and an integrated synchronized data acquisition system (Figure 4 and Table 2), which recorded forces, accelerations, and heave/surge displacements during forced oscillation.
The load cell measured vertical and longitudinal forces at the model–hexapod connection. The accelerometer recorded three-directional acceleration, and laser sensors measured heave and surge displacement. All signals were acquired synchronously at 100 Hz. The prescribed motion was verified by the laser measurements; the amplitude deviation was within 1%; and the measured displacement was used for coefficient identification.
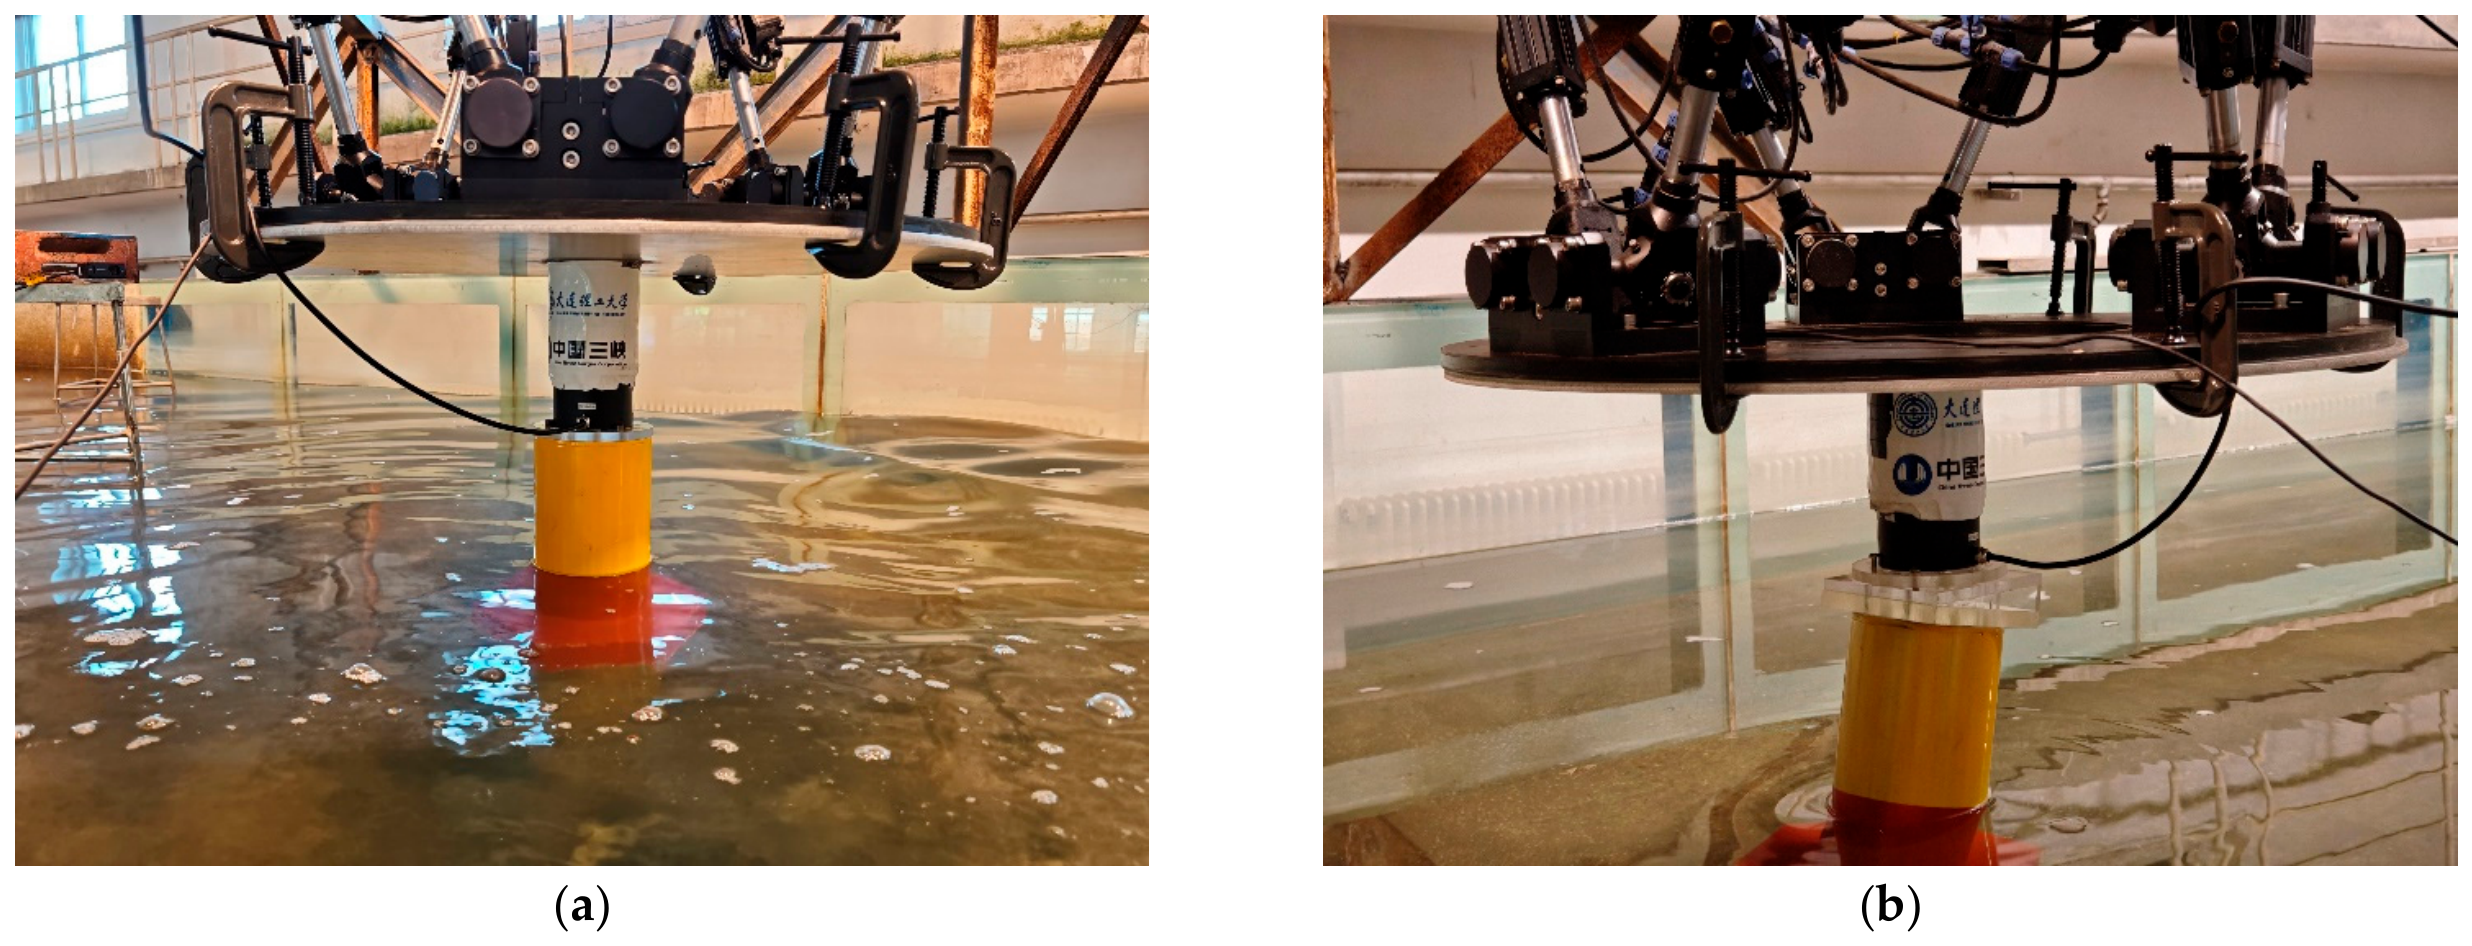
The model was mounted beneath the hexapod motion system. Prescribed forced motions with specified frequencies and amplitudes were imposed by the platform to generate periodic oscillations under the target test conditions. During each test, the vertical force, longitudinal force, three-directional acceleration, heave displacement time history, and surge displacement time history of the model were synchronously recorded for subsequent time-domain response analysis and hydrodynamic characterization. The arrangements of the model and sensors are shown in Figure 5.
These specifications were used to evaluate the measurement uncertainty associated with force, displacement, and acceleration acquisition.
To investigate the influence of large-amplitude pitch responses on the hydrodynamic characteristics of the component, two additional pitch-inclination conditions, 5° and 10°, were considered in addition to the conventional vertical installation condition of 0°. The inclined conditions were achieved using specially designed connectors with prescribed inclination angles between the model and the hexapod motion system. In this way, the model axis formed a specified pitch angle relative to the vertical direction, and the inclined attitude was maintained throughout the tests.
Under the inclined conditions, the excitation mode, measurement-system arrangement, and data-processing procedure were kept consistent with those used for the 0° condition. The same motion-control strategy and measurement method were adopted for all test cases to ensure the comparability of the hydrodynamic coefficients obtained under different inclination angles. After installation, the initial attitude and connection condition of the model were carefully checked to minimize the influence of installation errors, additional clearance, and changes in boundary conditions on the experimental results.
It should be noted that the inclined conditions were not intended to directly reproduce the six-degree-of-freedom coupled motion of an actual floating wind platform. Instead, the prescribed static pitch inclinations were introduced to examine the variation trends in hydrodynamic coefficients when the component operates under a large pitch-displacement background. This approach allows the influence of pitch attitude on the added mass and damping characteristics in the heave and surge directions to be highlighted under single-degree-of-freedom forced oscillation tests, thereby providing a basis for analyzing the variation in component-level hydrodynamic parameters under large-amplitude pitch responses. However, this method mainly reflects the effect of pitch attitude on local hydrodynamic characteristics and cannot fully replace the analysis of global hydrodynamic responses under realistic six-degree-of-freedom coupled motions of floating wind platforms. Under inclined conditions, forces were resolved in the laboratory-fixed vertical and longitudinal directions. The heave and surge excitation directions were kept identical to those under the 0° condition.

2.3. Case Definition

A series of heave and surge forced oscillation cases was designed with different amplitudes and periods. KC number and frequency parameter β were used to describe the test range and to facilitate comparison with previous forced oscillation studies.
The cases were selected with reference to response analysis of the prototype 15 MW semi-submersible platform in the target sea area. The prototype heave amplitude was below 3 m, the surge amplitude was below 8 m, and the representative motion period range was 6–25 s.
Using the geometric scale ratio λ = 100, the prototype amplitudes and periods were converted to model scale by Froude similarity, with A m = A p / λ and T m = T p / λ . The detailed model-scale amplitudes, periods, and inclination cases are listed in Table 3.
Reynolds similarity was not enforced because simultaneous Froude and Reynolds similarity cannot be satisfied for a 1:100 water-tank model. Therefore, the results should be interpreted as model-scale component-coefficient trends, especially for viscous damping. To clarify the viscous-related test range, KC and β are reported in Table 3. Because the inclination comparisons use the same model, fluid, measurement system, and common amplitude–frequency cases, the relative trends among 0°, 5°, and 10° remain meaningful, but direct full-scale extrapolation should be made with caution. The damping results should be interpreted with particular caution because viscous separation and vortex shedding are Reynolds-number dependent, whereas added mass is generally less sensitive to Reynolds-number effects.
For comparison with previous heave plate studies, the KC number and frequency parameter β are summarized in Table 4. KC describes the ratio of oscillation amplitude to characteristic length, while β represents the relationship between oscillation frequency and viscosity effects:
K C = 2 π A D
β = D 2 f ν
where A is the oscillation amplitude, D is the characteristic length ( D d for heave and D c for surge), f is the oscillation frequency, and ν is the kinematic viscosity of water. In the following analysis, the results are organized mainly by amplitude, frequency, and inclination angle.
The tested KC range is relatively low, especially in heave. In this regime, local separation near the sharp plate edges dominates the viscous response. Although the sharp-edged hexagonal geometry may constrain the separation locations, the damping coefficients may still be affected by Reynolds-number scale effects.

3. Methodology

3.1. Hydrodynamic Coefficient Identification

The data processing and coefficient identification were performed in MATLAB R2024a. For each case, the first and last 5 s were discarded, and ten stable cycles from the middle of the record were used. Force and motion signals were processed with the same sixth-order zero-phase Butterworth low-pass filter, with a cut-off frequency of twice the prescribed excitation frequency. Three repeated tests were compared in terms of phase, amplitude, and overall time-history trend; abnormal records were excluded. The mean force was removed before fitting, and the added mass and damping coefficients were identified from the filtered steady segment by least-squares fitting.
During forced oscillation, the total load acting on the component can be decomposed into three parts: the hydrostatic restoring force, the inertial force, and the hydrodynamic force. The governing Equations (3) and (4) can be expressed as follows:
F H _ h e a v e ( t ) = F 33 ( t ) F K ( t ) F I ( t )
F H _ s u r g e ( t ) = F 11 ( t ) F I ( t )
where F H ( t ) denotes the hydrodynamic force, F 33 ( t ) is the total vertical force (heave) measured by the load sensor, F 11 ( t ) is the total longitudinal force (surge) measured by the load sensor, F K ( t ) represents the hydrostatic restoring force, and F I ( t ) denotes the inertial term. The hydrostatic restoring force and inertial load can be written as follows:
F K ( t ) = ρ g A ω x ( t )
F I ( t ) = M x ¨ ( t )
where ρ is the water density, g is the gravitational acceleration, A ω is the waterplane area, and x ( t ) , x ˙ ( t ) , and x ¨ ( t ) are the displacement, velocity, and acceleration, respectively. M denotes the mass of the model. For the surge oscillation cases, the hydrostatic restoring-force term is taken as zero.
After subtracting the hydrostatic restoring force and inertial load, the pure hydrodynamic load can be obtained. It is further expressed as the sum of the added-mass force and the damping force:
F H ( t ) = A i j x ¨ ( t ) + B i j x ˙ ( t )
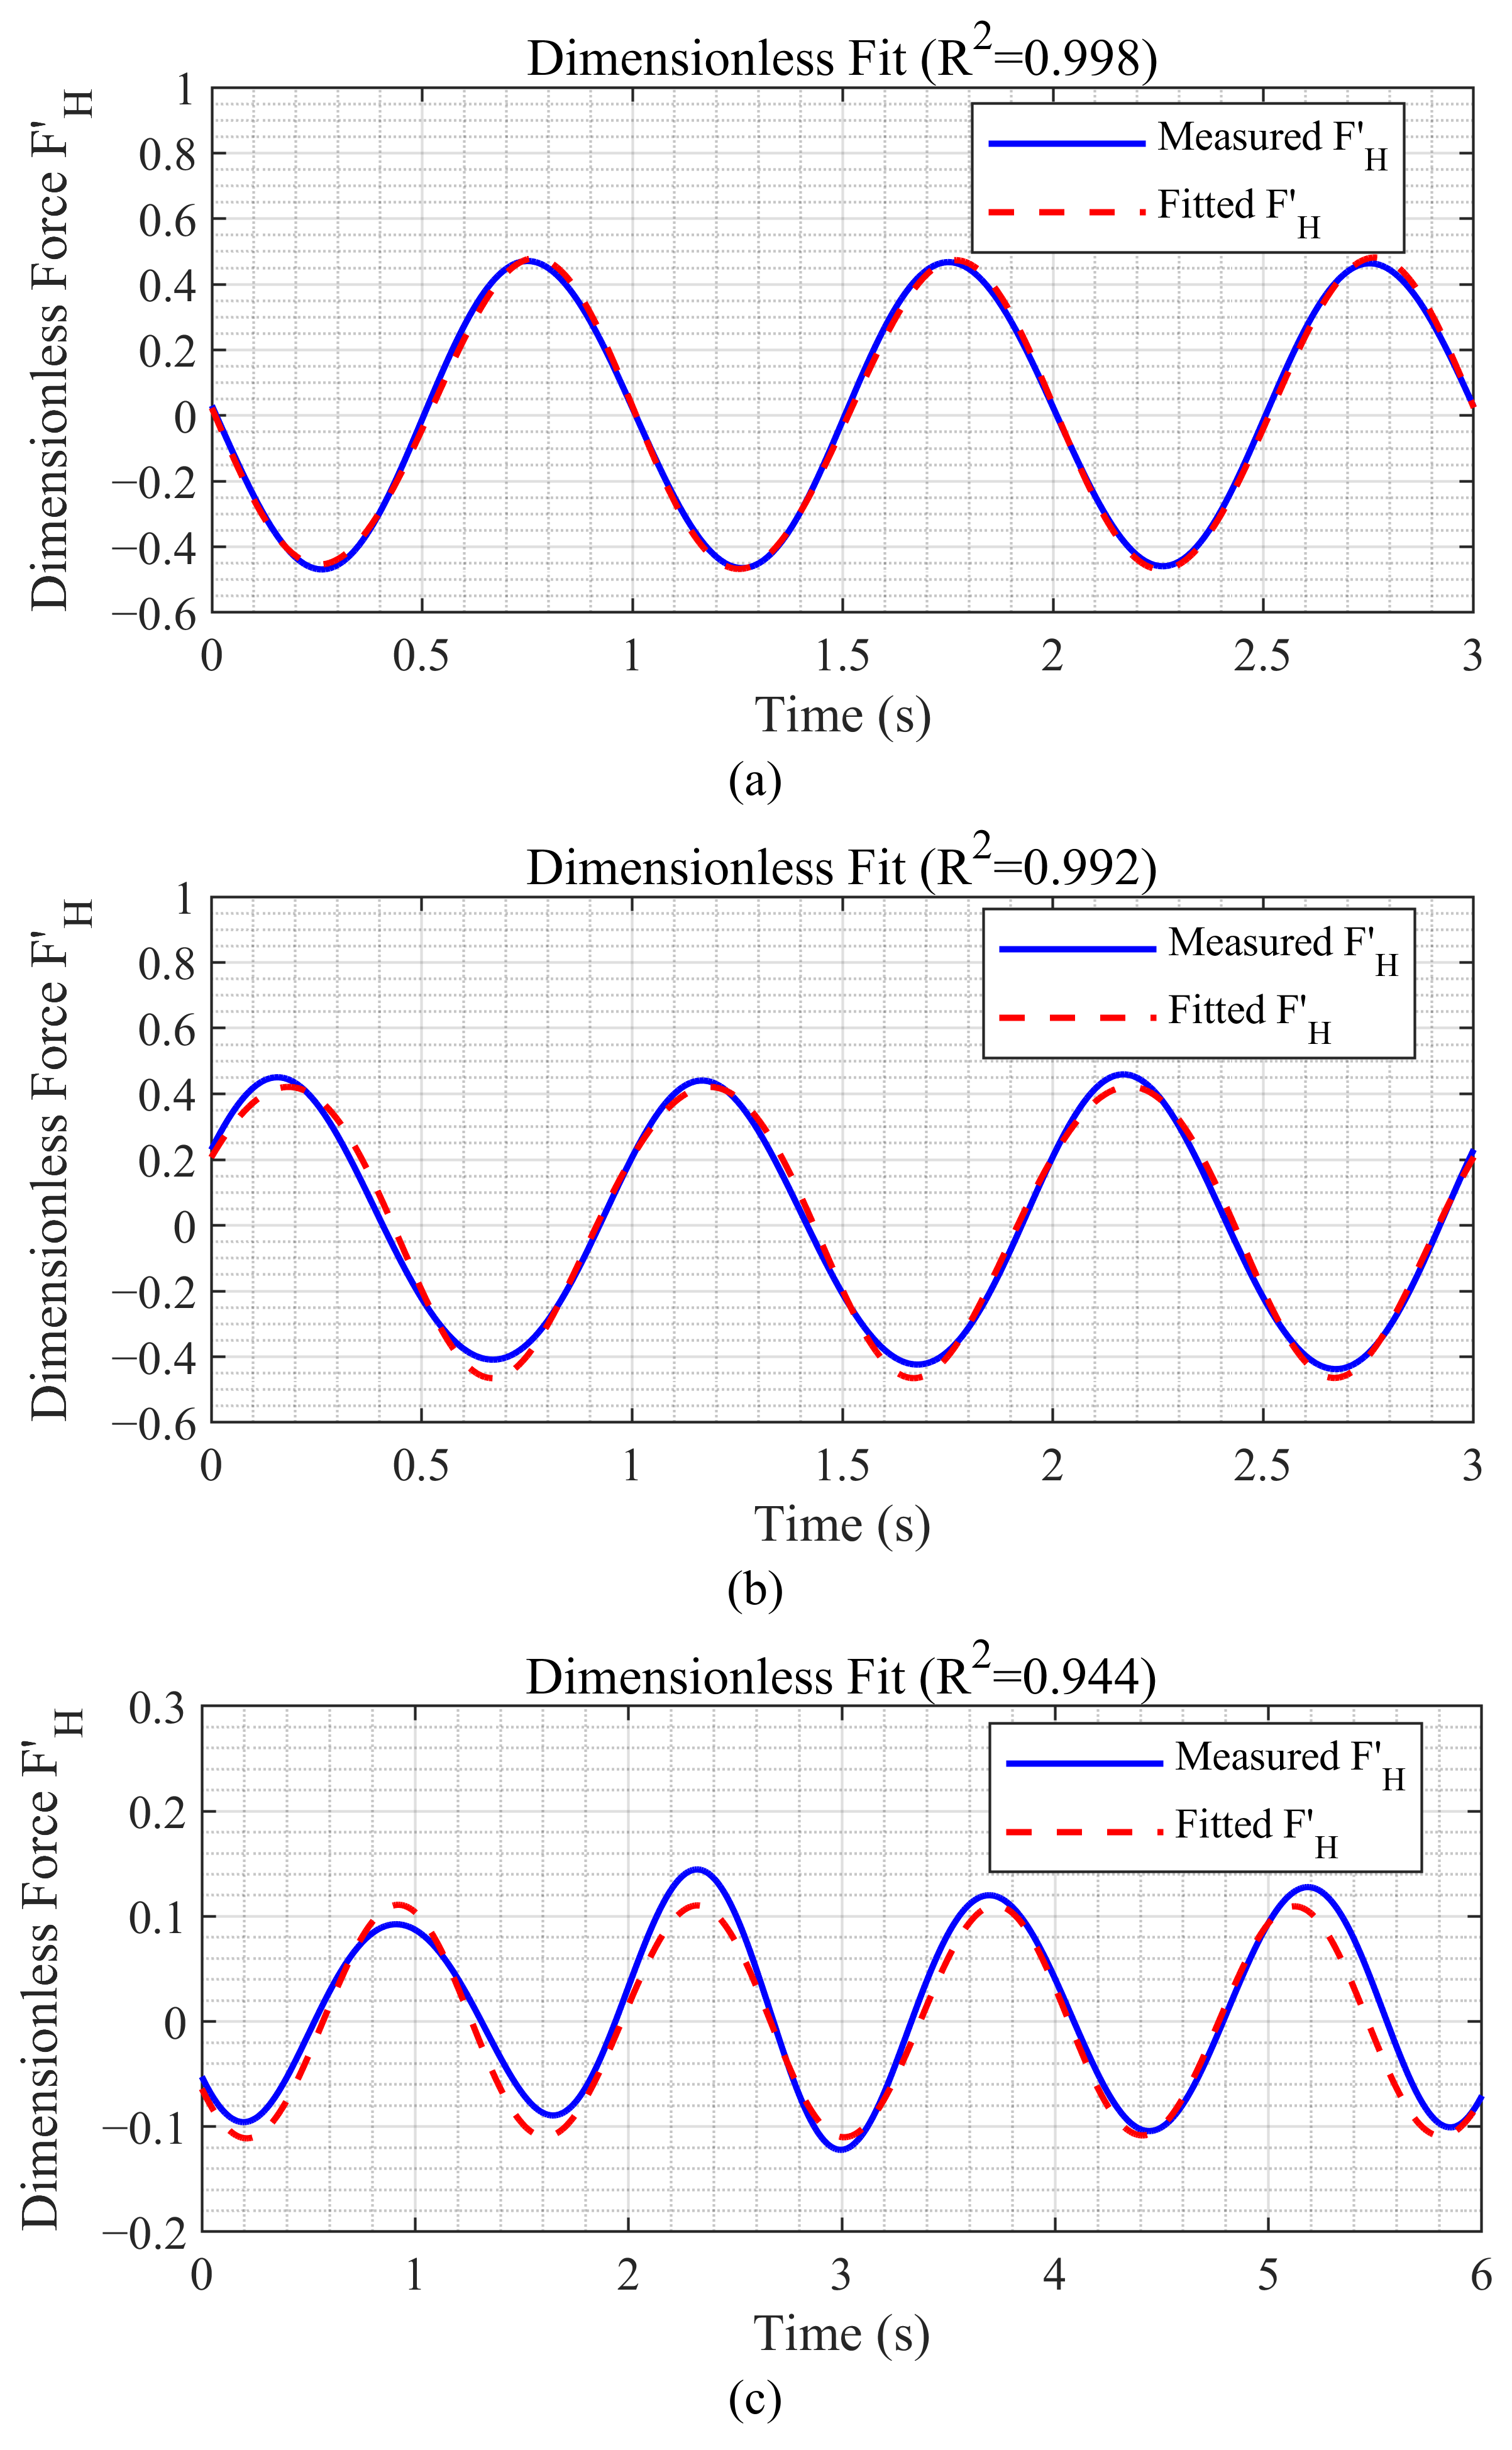
where A i j is the added mass, and B i j is the damping coefficient. As indicated by Equation (7), when the hydrodynamic load, velocity, and acceleration are known, the only parameters to be identified are A i j and B i j . In this study, the least squares method was applied to fit the discrete time-history data in the steady oscillation stage. Accordingly, A 33 and B 33 were obtained for the heave direction, while A 11 and B 11 were identified for the surge direction using the same procedure. The coefficients of determination for the least squares fitting were larger than 0.95 for 98% of all cases, with an average of 0.992 and a minimum of 0.942. It should be noted that the few lower-R2 cases were mainly observed for Model A1 without the heave plate under low-amplitude and short-period conditions. Because the hydrodynamic force of the no-plate model was relatively small in these cases, the fitting results were more sensitive to measurement noise and phase deviation. The lower-R2 cases were not concentrated in the inclined Model A3 tests, suggesting that static inclination did not systematically reduce the fitting quality. A representative fitting result is shown in Figure 6 and Table 5, indicating that the identified added mass and damping coefficients can well characterize the hydrodynamic load features during the steady oscillation stage.

3.2. Non-Dimensionalization of Hydrodynamic Coefficients

To facilitate comparison of hydrodynamic differences among different configurations, oscillation amplitudes, and oscillation frequencies, the added mass and damping coefficients were nondimensionalized as follows. For the heave direction, the theoretical added mass A 33 t h [23] is defined as follows:
A 33 t h = 1 3 ρ D d 3
where D d is the equivalent diameter used for heave-direction normalization, as listed in Table 1. For model with heave plate, it corresponds to the equivalent diameter of the column–heave-plate component. The corresponding non-dimensional added mass coefficient A 33 and non-dimensional damping coefficient B 33 [23] are expressed as follows:
A 33 = A 33 A 33 t h
B 33 = B 33 2 π f A 33 t h
where f is the oscillation frequency. For the surge direction, the theoretical added mass A 11 t h [25] is written as follows:
A 11 t h = ρ D c 3
where D c is the equivalent diameter of the column. Accordingly, the non-dimensional added mass coefficient A 11 and non-dimensional damping coefficient B 11 [25] are expressed as follows:
A 11 = A 11 A 11 t h
B 11 = B 11 2 π f A 11 t h
Through the above treatment, the direct influences of scale effects and geometric differences can be reduced, allowing the effects of different model configurations and oscillation parameters on the hydrodynamic characteristics to be more clearly revealed.

4. Results and Discussion

4.1. Heave Hydrodynamic Coefficients

To clarify the influence of the heave plate on the heave hydrodynamic characteristics of a typical column component, this section first compares the heave added mass and damping characteristics of the circular column without a heave plate, Model A1, and the circular column with a heave plate, Model A3, under the 0° vertical condition. The non-dimensional results are further discussed to examine the effects of configuration differences on the variation of hydrodynamic coefficients. It should be noted that the present test cases were mainly designed according to the oscillation amplitudes and periods that the prototype platform component may experience under realistic motion conditions. Maintaining strictly identical KC numbers between different models was not adopted as the primary control criterion; instead, the oscillation amplitude was used as the main control parameter. Therefore, the comparison between Models A1 and A3 in this section is mainly intended to reveal the overall variation trends caused by the presence or absence of the heave plate, rather than to emphasize a strictly equivalent point-by-point comparison at each frequency.
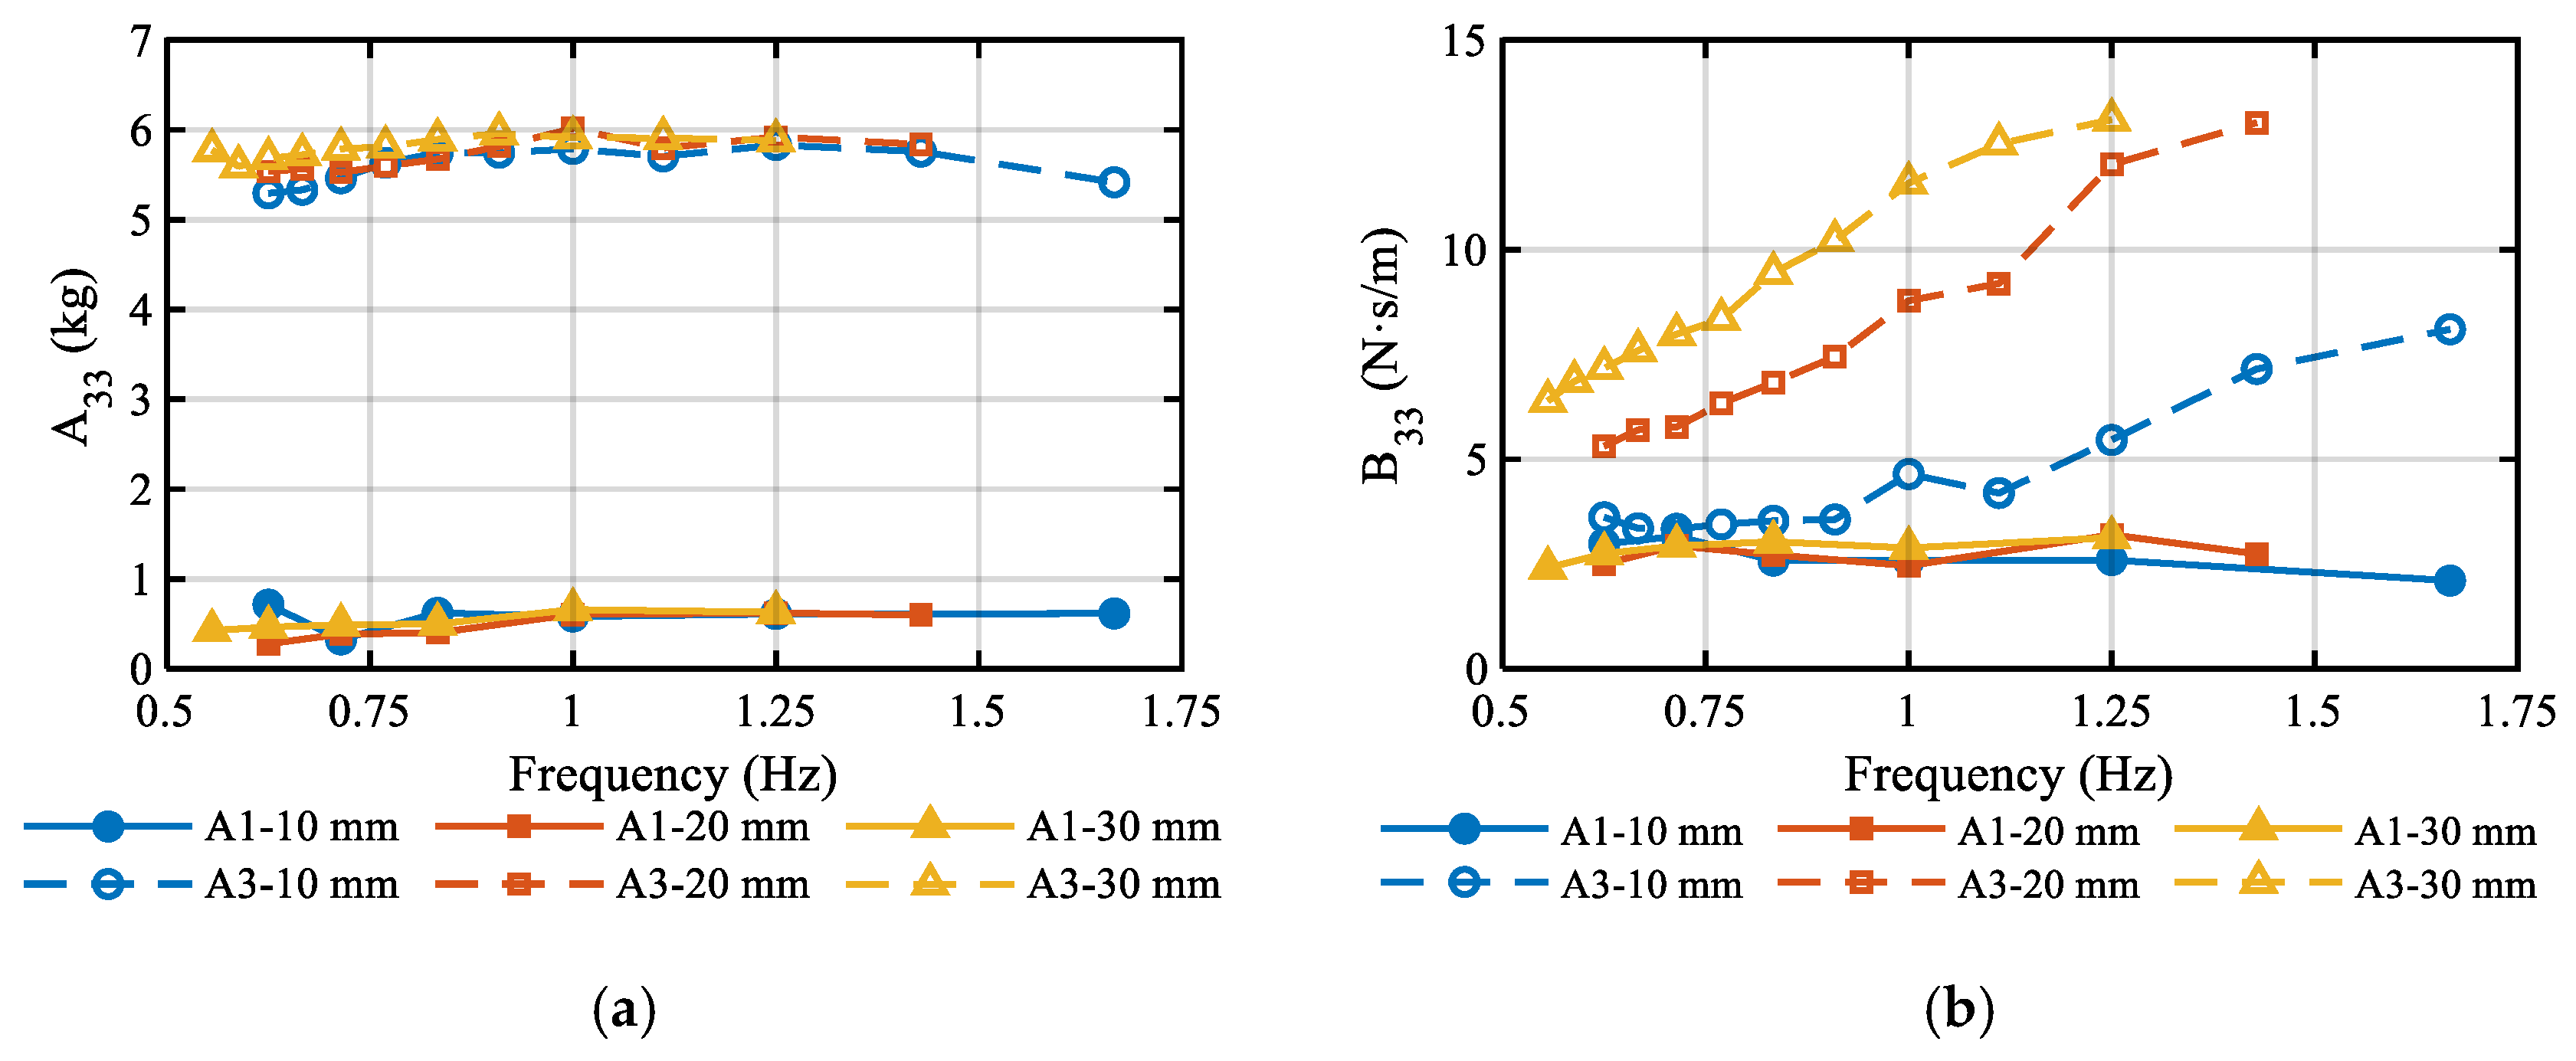
Figure 7 presents the comparison of added mass and damping between Models A1 and A3 in the heave direction. Overall, the heave added mass of Model A3 is significantly higher than that of Model A1 within the tested range, indicating that the introduction of the heave plate markedly enhances the attached inertial effect during vertical reciprocating motion. In addition, the added mass of Model A3 is not sensitive to the variation in oscillation frequency, but it increases slightly with increasing oscillation amplitude.
The damping results also show distinct differences between Models A1 and A3. Within the experimental range, the heave damping of the model equipped with a heave plate is higher than that of the model without a heave plate, indicating that the heave plate enhances energy dissipation during vertical oscillation. Compared with added mass, the damping curves are generally more sensitive to variations in oscillation frequency and amplitude, and the data scatter among different test cases is more pronounced. As shown in the figure, the damping of Model A3 increases significantly with increasing oscillation frequency and amplitude, whereas the damping of Model A1 shows no obvious dependence on either frequency or amplitude.
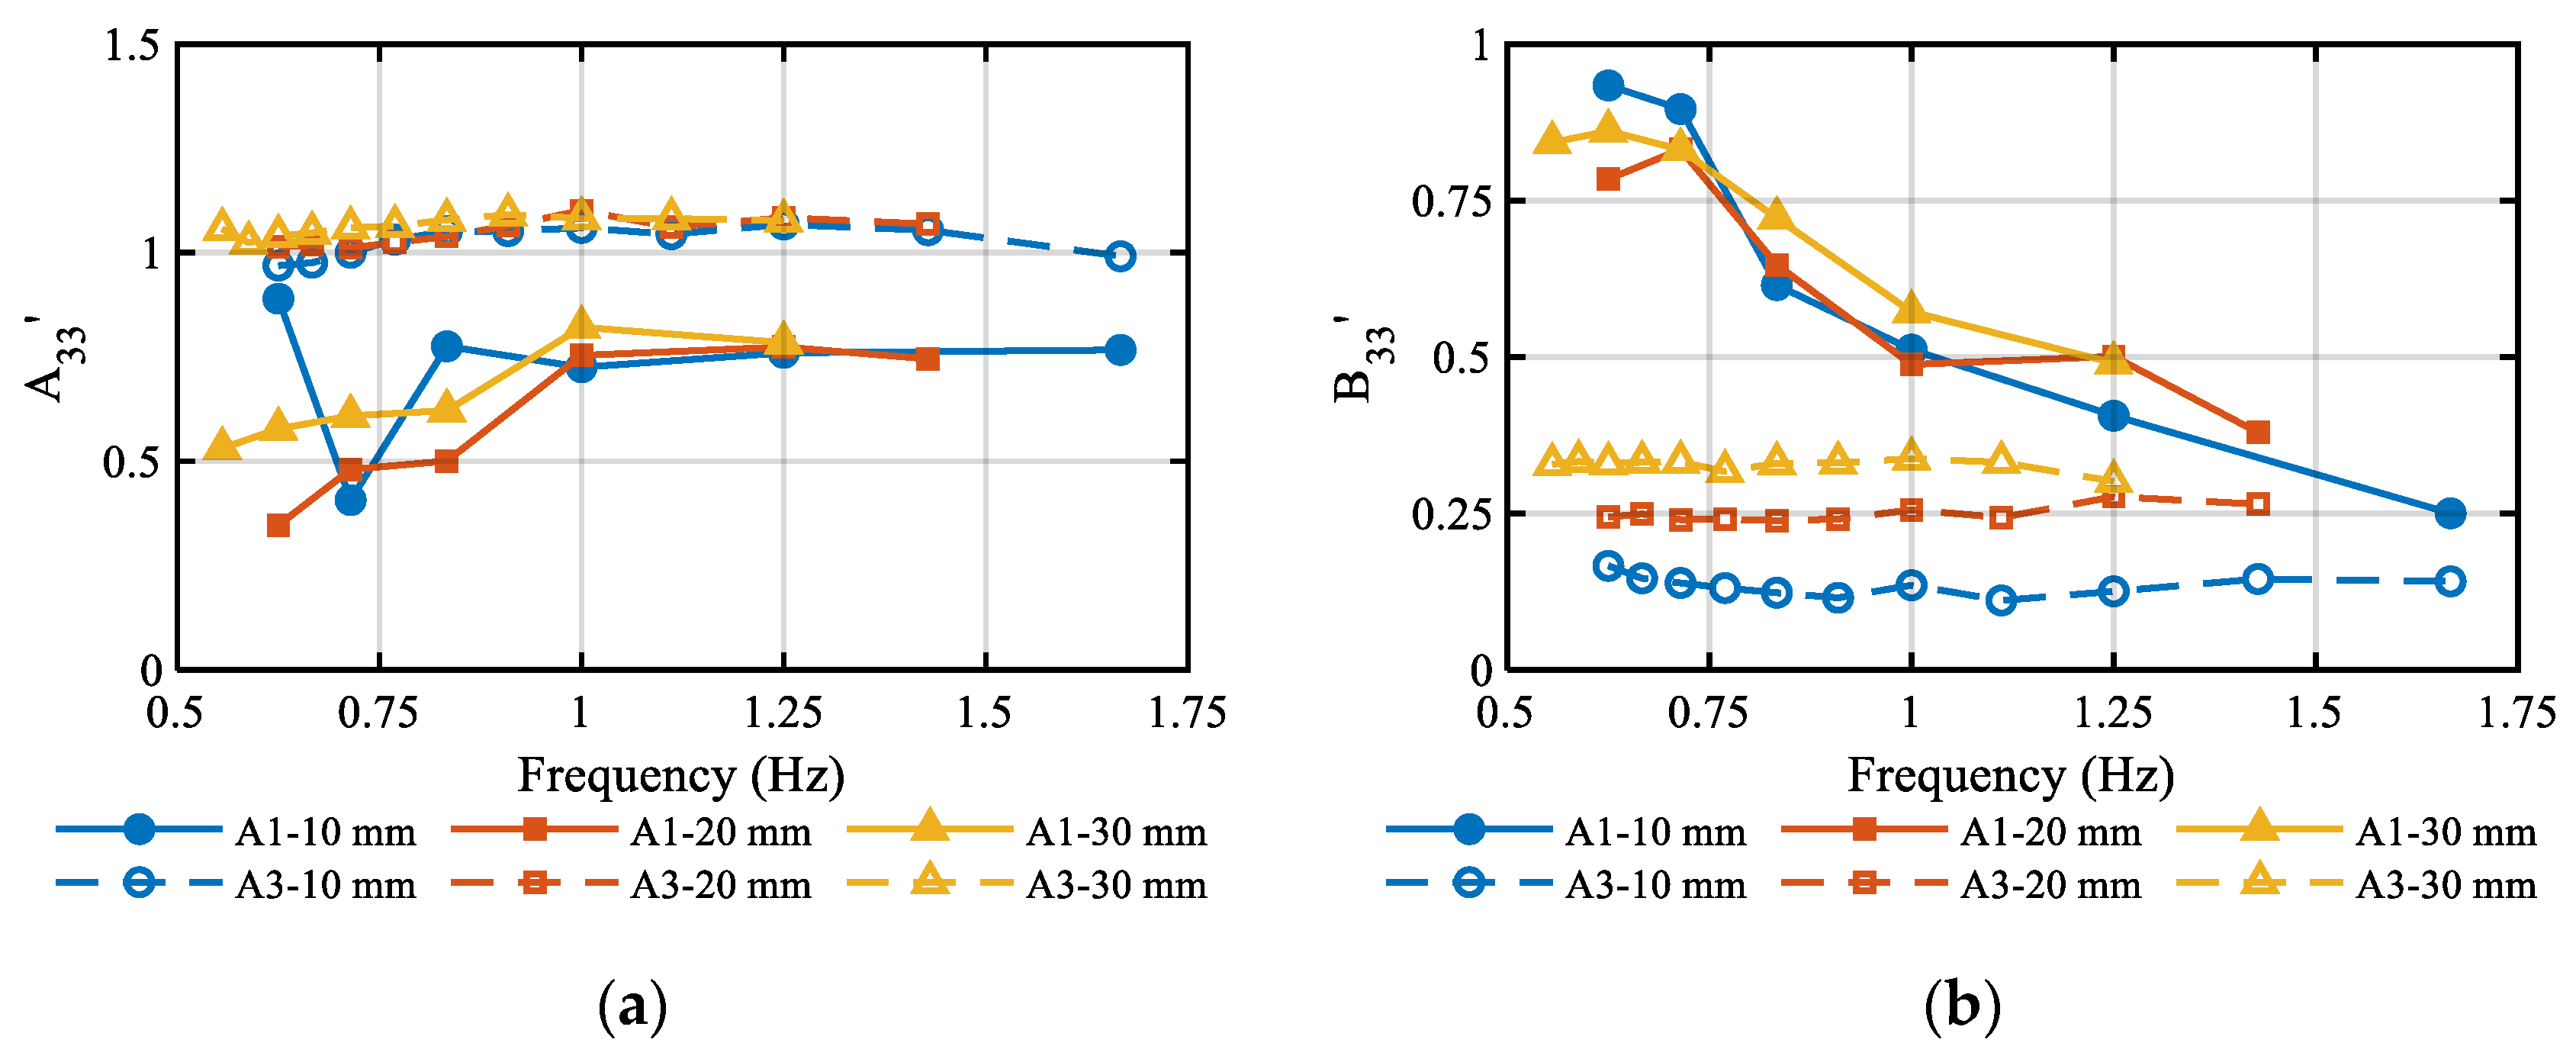
To further reduce the direct influence of differences in characteristic length scales on the comparison, Figure 8 shows the non-dimensional heave added mass and damping coefficients of Models A1 and A3. Although dimensional damping is larger for A3, the selected normalization by the much larger theoretical added mass reduces the non-dimensional damping level. Under the same oscillation amplitude, Model A1 corresponds to a larger KC number than Model A3 because of its smaller characteristic length. Therefore, dimensional and non-dimensional damping should be interpreted together. In terms of the dimensional hydrodynamic response, Model A3 still exhibits a stronger attached inertial effect and a higher energy-dissipation capacity in the heave direction.
These results indicate that the differences between Models A3 and A1 are not merely caused by geometric scale effects or the selection of characteristic parameters. Instead, they reflect the intrinsic influence of the heave plate configuration on the vertical hydrodynamic characteristics of the component. In other words, the non-dimensional results further confirm that the heave plate has a clear and stable physical effect on modifying the heave hydrodynamic parameters of the column component.
From an engineering perspective, the comparison between Models A1 and A3 indicates that the installation of a heave plate significantly changes the added mass and damping levels of a typical column component in the heave direction. For floating offshore wind platforms, this implies that the heave plate may not only improve the vertical motion response of the platform but also directly affect the appropriate selection of heave-related hydrodynamic parameters in numerical models. Therefore, in platform hydrodynamic modeling and parameter determination, the heave plate should not be treated merely as a local appendage. Instead, its systematic influence on the vertical attached inertia and energy-dissipation characteristics of typical components should be fully considered.
In summary, within the tested range, Model A3 with a heave plate exhibits stronger heave hydrodynamic effects than Model A1 without a heave plate. The increase in added mass mainly reflects the enhancement of the attached fluid inertia, while the increase in damping indicates a marked change in the energy-dissipation mechanism during heave motion. Since the test cases for different models were not designed strictly according to the identical-KC-number principle, the above comparison is more suitable as a baseline analysis of the influence of model configuration. On this basis, the following section further discusses the effect of static pitch inclination on the heave hydrodynamic coefficients of Model A3.

4.2. Surge Hydrodynamic Coefficients

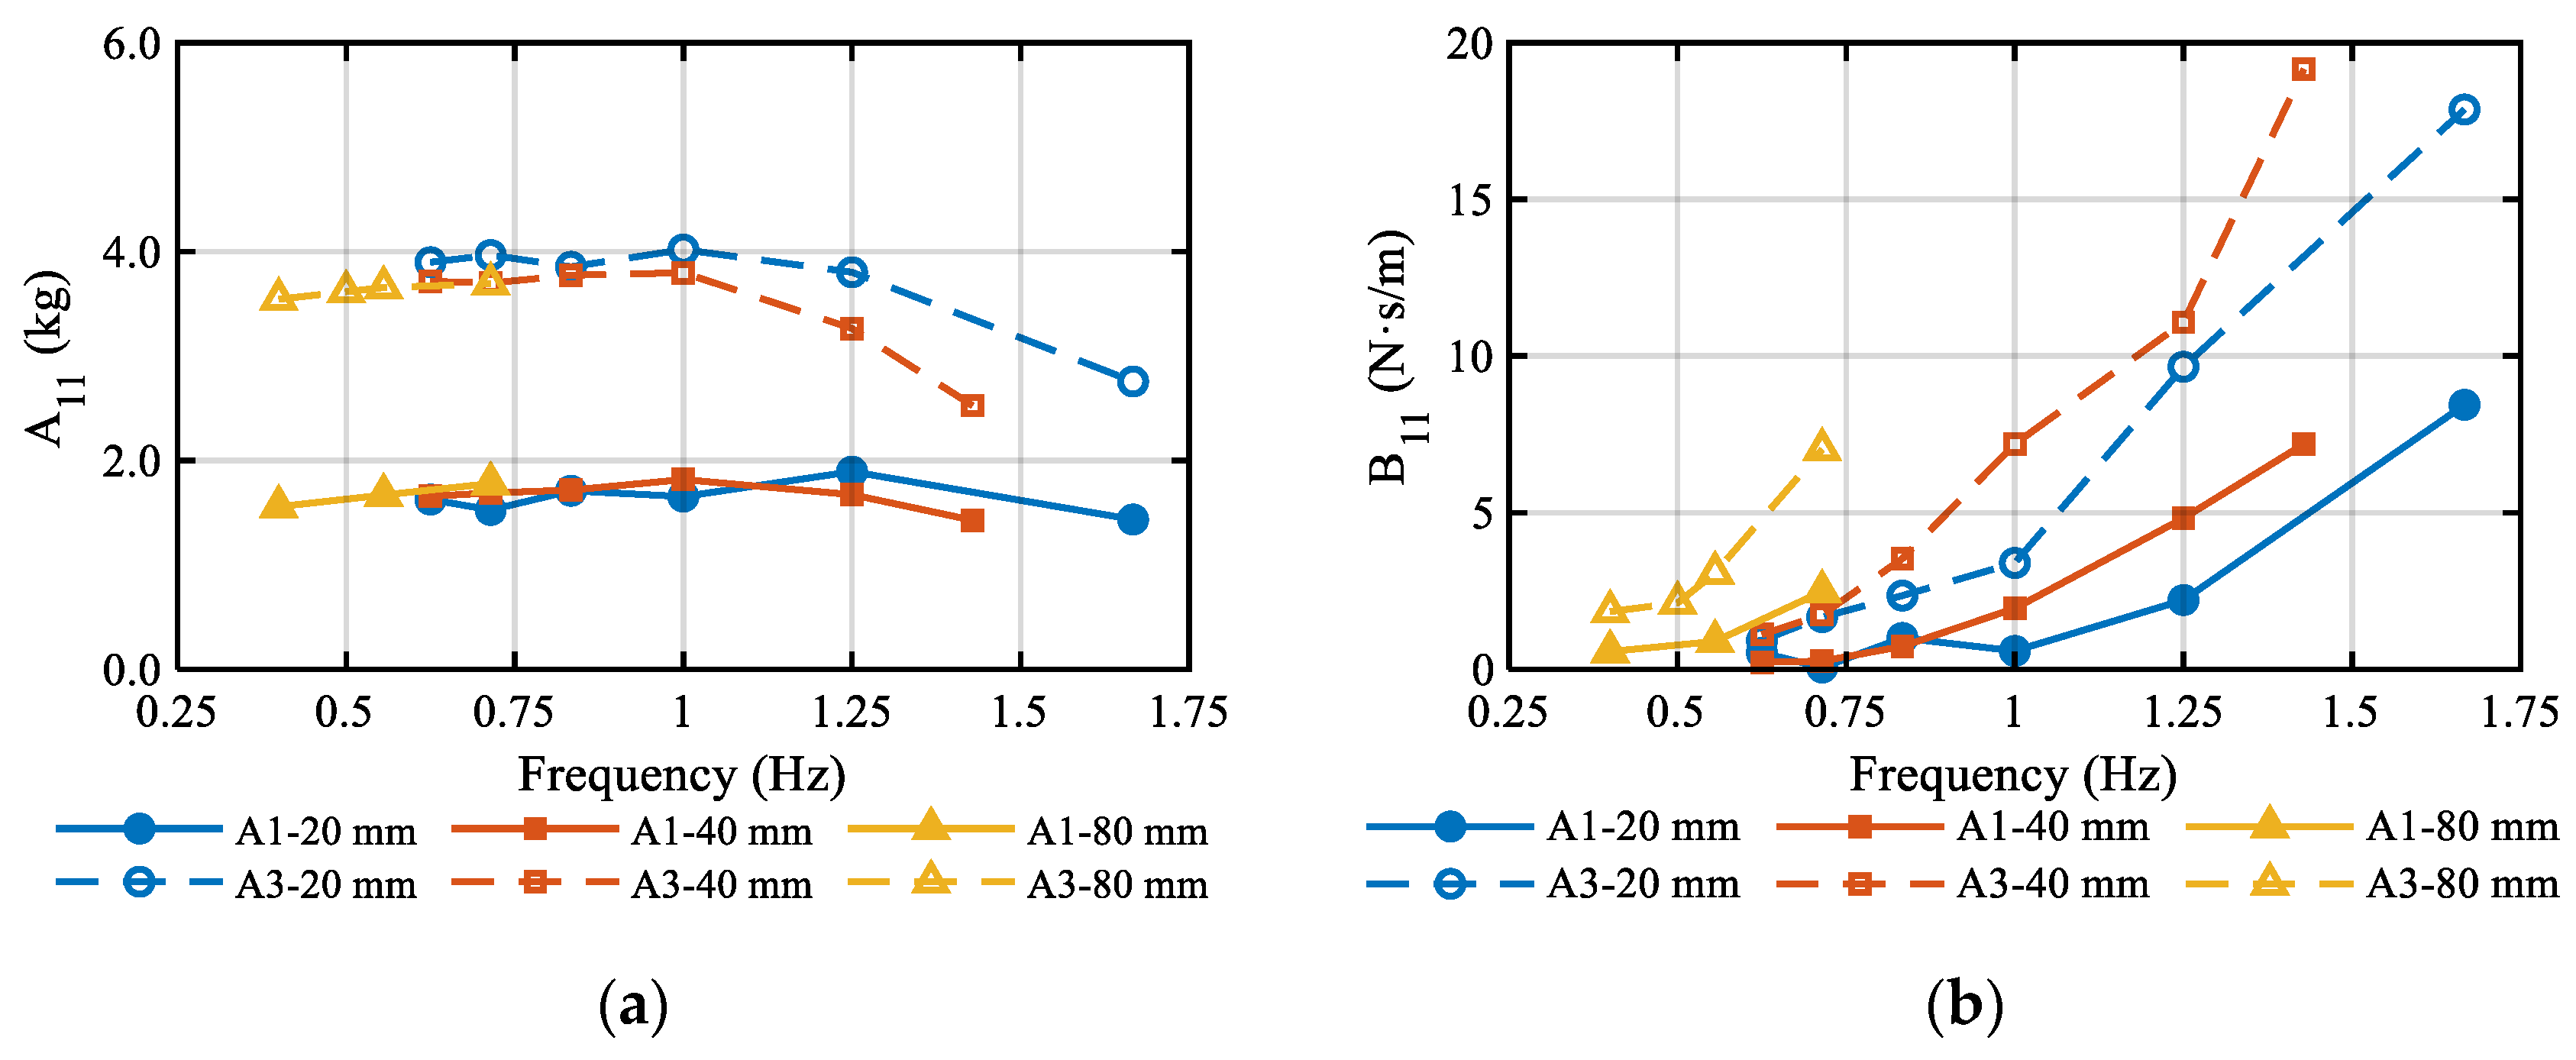
In addition to the heave direction, the presence of the heave plate may also affect the hydrodynamic characteristics of the component in the surge direction. Therefore, this section further compares the surge added mass and damping characteristics of Models A1 and A3 under the 0° condition and discusses the influence of the heave plate on the horizontal hydrodynamic response of the component based on the non-dimensional results.
Figure 9 presents the comparison of surge added mass and damping between Models A1 and A3. Within the tested range, the surge added mass of Model A3 is also significantly higher than that of Model A1, indicating that the installation of the heave plate not only modifies the heave hydrodynamic characteristics of the component but also has a pronounced influence on the attached inertia in the surge direction. Compared with the heave direction, the surge added mass shows stronger sensitivity to oscillation frequency, with more evident fluctuations among different frequency cases. Meanwhile, the difference between Models A3 and A1 is clear under most test conditions, suggesting that the heave-plate-equipped configuration also exhibits stronger hydrodynamic response characteristics in the surge direction.
From the damping results, clear differences can also be observed between Models A3 and A1. In general, the surge damping level of Model A3 is higher than that of Model A1, and its damping varies more significantly with oscillation frequency and amplitude. In contrast, Model A1 exhibits a relatively low surge damping level, with smoother variations in the corresponding curves. The results indicate that the damping in the surge direction is notably sensitive to oscillation frequency, particularly in the higher-frequency range. This suggests that under horizontal oscillation conditions, the influence of configuration differences on damping characteristics should also not be neglected.
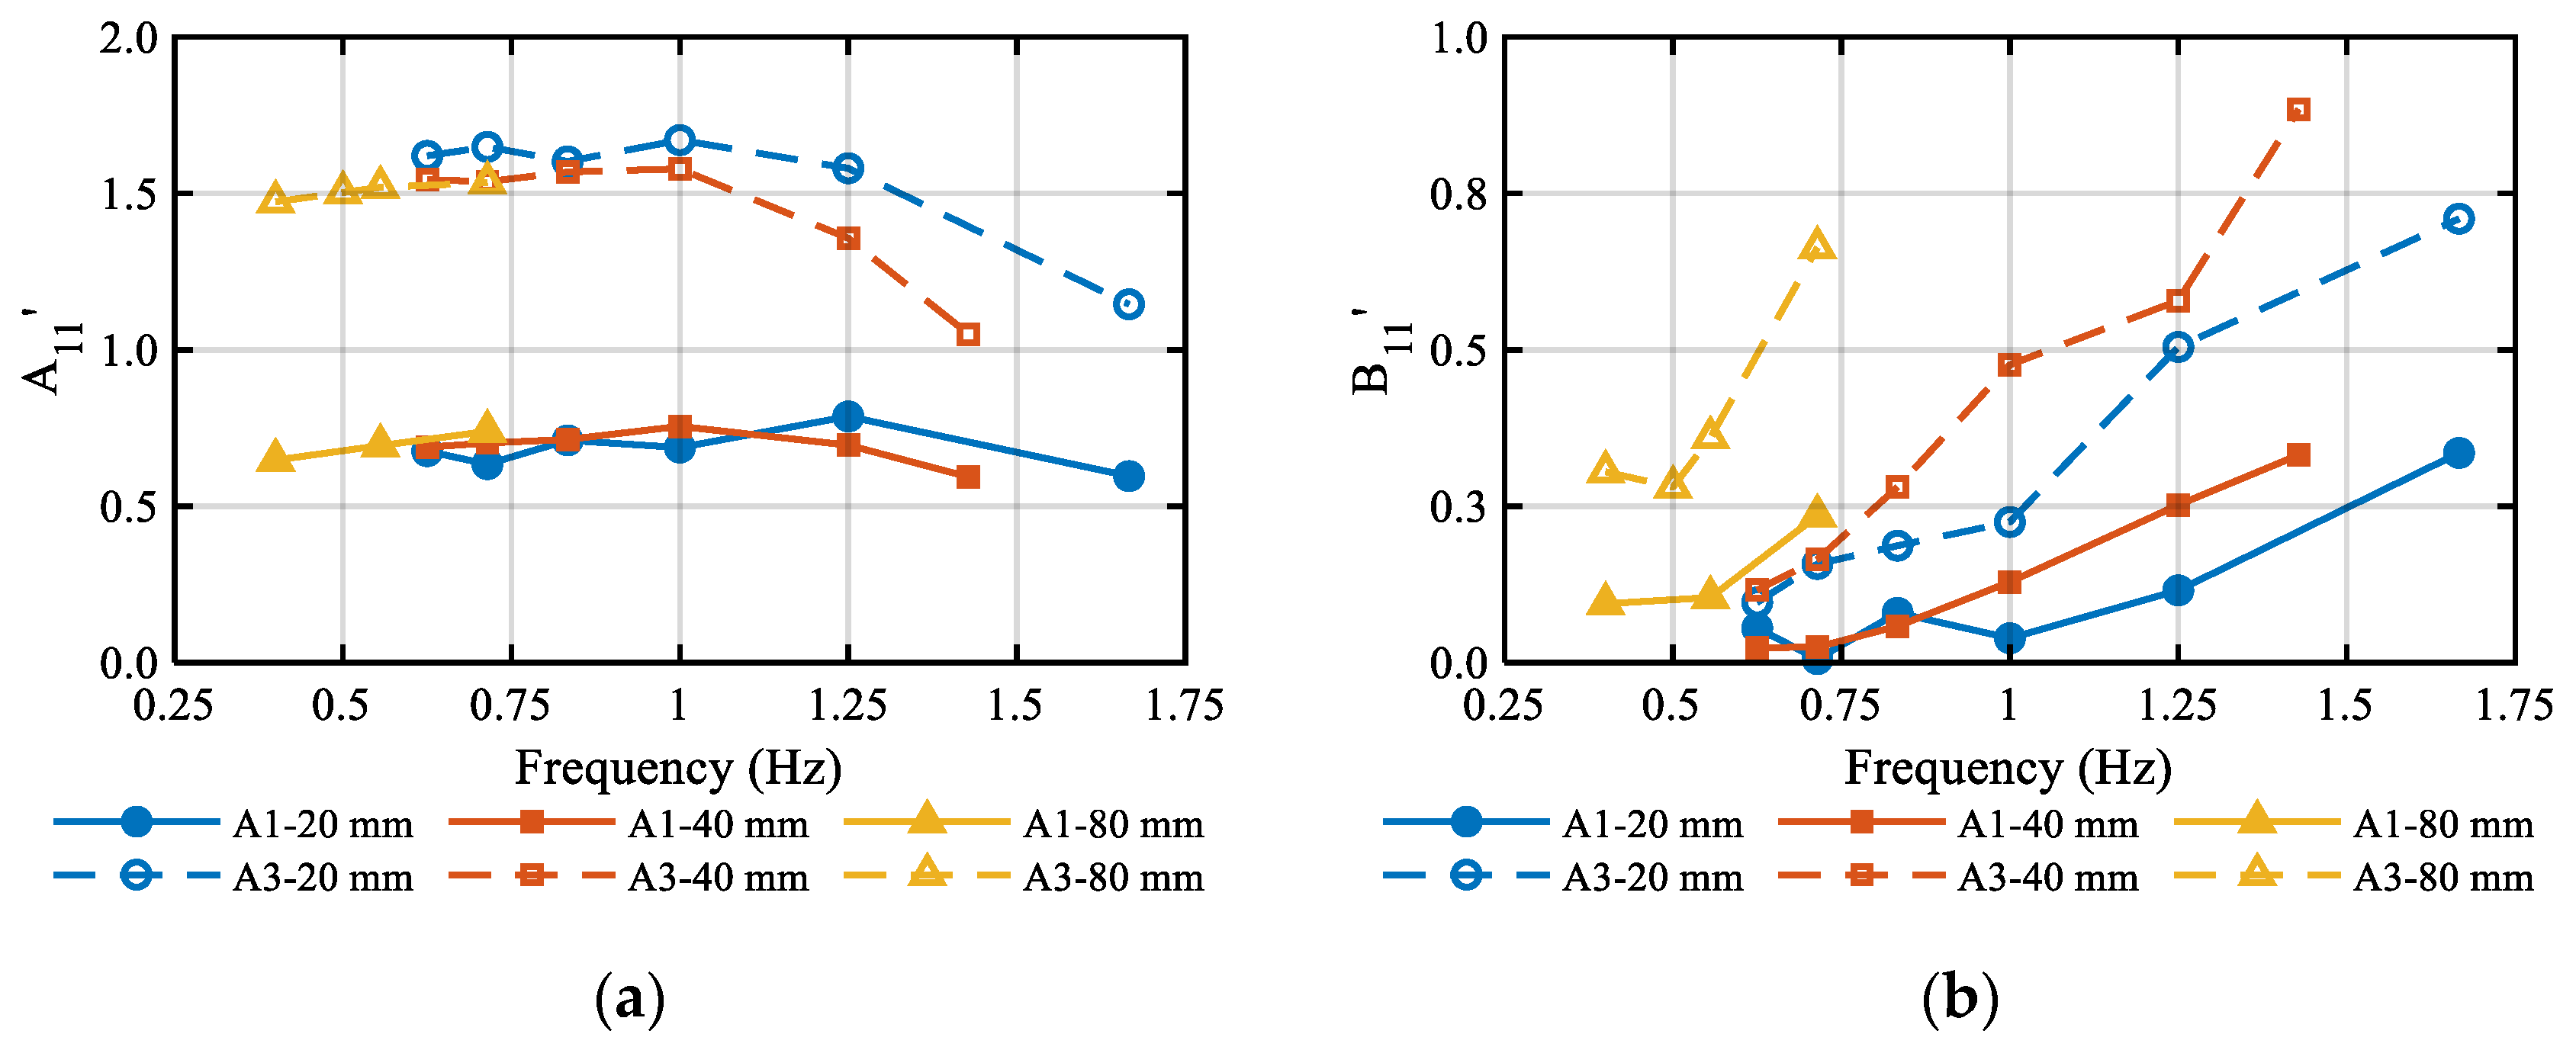
The non-dimensional surge added mass and damping coefficients of Models A1 and A3 are compared in Figure 10. Overall, the main differences between the two models remain evident after nondimensionalization, and the general variation trends are consistent with those observed in the dimensional results. This indicates that the differences between Models A3 and A1 in the surge direction are not merely caused by dimensional scaling but reflect the actual influence of the heave plate configuration on the horizontal hydrodynamic characteristics of the component. Combined with the results in Section 4.1, it can be concluded that the heave plate not only modifies the added mass and damping in the heave direction but also has a pronounced effect on the hydrodynamic parameters in the surge direction.
In summary, within the tested range, Model A3 with a heave plate exhibits stronger hydrodynamic effects in terms of both surge added mass and damping than Model A1 without a heave plate, and the surge-direction results show greater sensitivity to frequency variation. These findings indicate that in the analysis of hydrodynamic parameters for typical column components of floating offshore wind platforms, the influence of the heave plate should not be understood only from the heave direction but should also be considered in terms of its modification of surge hydrodynamic characteristics. Based on the above analysis of configuration effects, the next section further discusses the variations in heave and surge hydrodynamic coefficients of Model A3 under static inclination conditions.

4.3. Effect of Inclination Angle

To further reveal the influence of large-amplitude pitch attitude on the hydrodynamic characteristics of typical column–heave-plate components, the circular column model equipped with a hexagonal heave plate, denoted as Model A3, was selected for detailed analysis. The variations in the non-dimensional added mass and damping coefficients in the heave and surge directions were compared under static pitch-inclination conditions of 0°, 5°, and 10°. Compared with the configuration-based comparison between Model A1 without a heave plate and Model A3 with a heave plate, the different inclination cases of Model A3 provide better comparability. Therefore, this section focuses on the effect of static pitch inclination on the hydrodynamic coefficients.
It should be noted that the data points for the 0° condition are denser than those for the 5° and 10° conditions. To ensure the rationality of the quantitative comparison, the relative differences were calculated only for the oscillation amplitudes and periods that were common to all three inclination conditions, with the 0° condition used as the reference. The relative difference is defined as follows:
Δ C = C θ C 0 ° C 0 ° × 100 %
where C θ denotes the hydrodynamic coefficient at an inclination angle of 5° or 10°, and C 0 ° denotes the hydrodynamic coefficient under the 0° condition with the same oscillation amplitude and frequency. The average differences discussed below were calculated based only on the common test cases.
After the introduction of static pitch inclination, the geometric projection of the component relative to the inflow or motion direction changes, and the local flow field shifts from an approximately symmetric state to an asymmetric one. These effects jointly influence the volume of attached fluid and the periodic energy-dissipation process. Since the present experiments mainly measured global response quantities, including force, displacement, velocity, and acceleration, but did not directly measure the local flow field, the following discussion on local flow separation, vortex shedding, and changes in energy-dissipation pathways should be regarded as a physical interpretation based on the observed variations in the hydrodynamic coefficients. Therefore, this limitation is not repeated in each subsection, and the following analysis focuses on the coefficient trends, representative quantitative differences, and scatter ranges.

4.3.1. Heave Added Mass

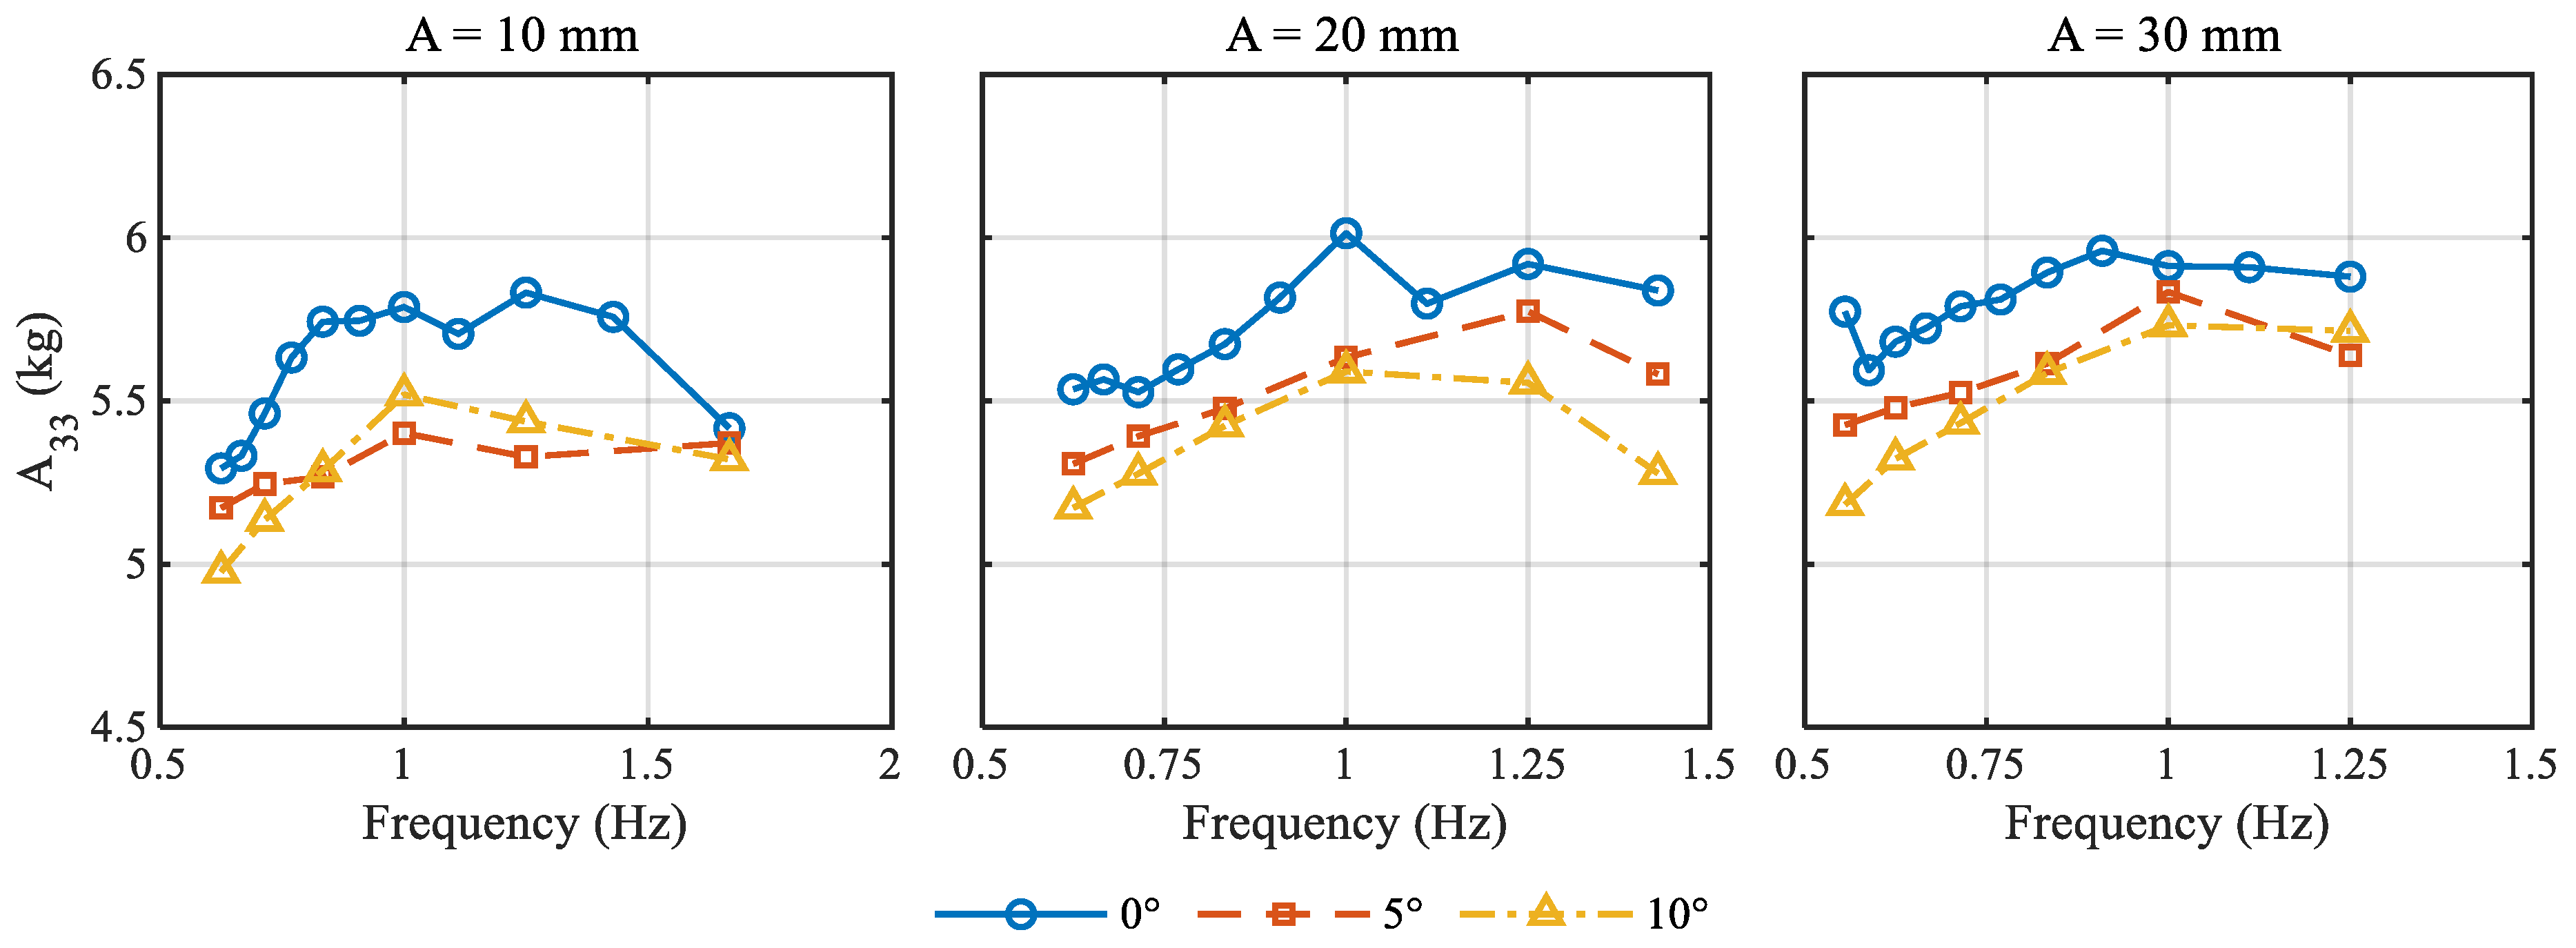
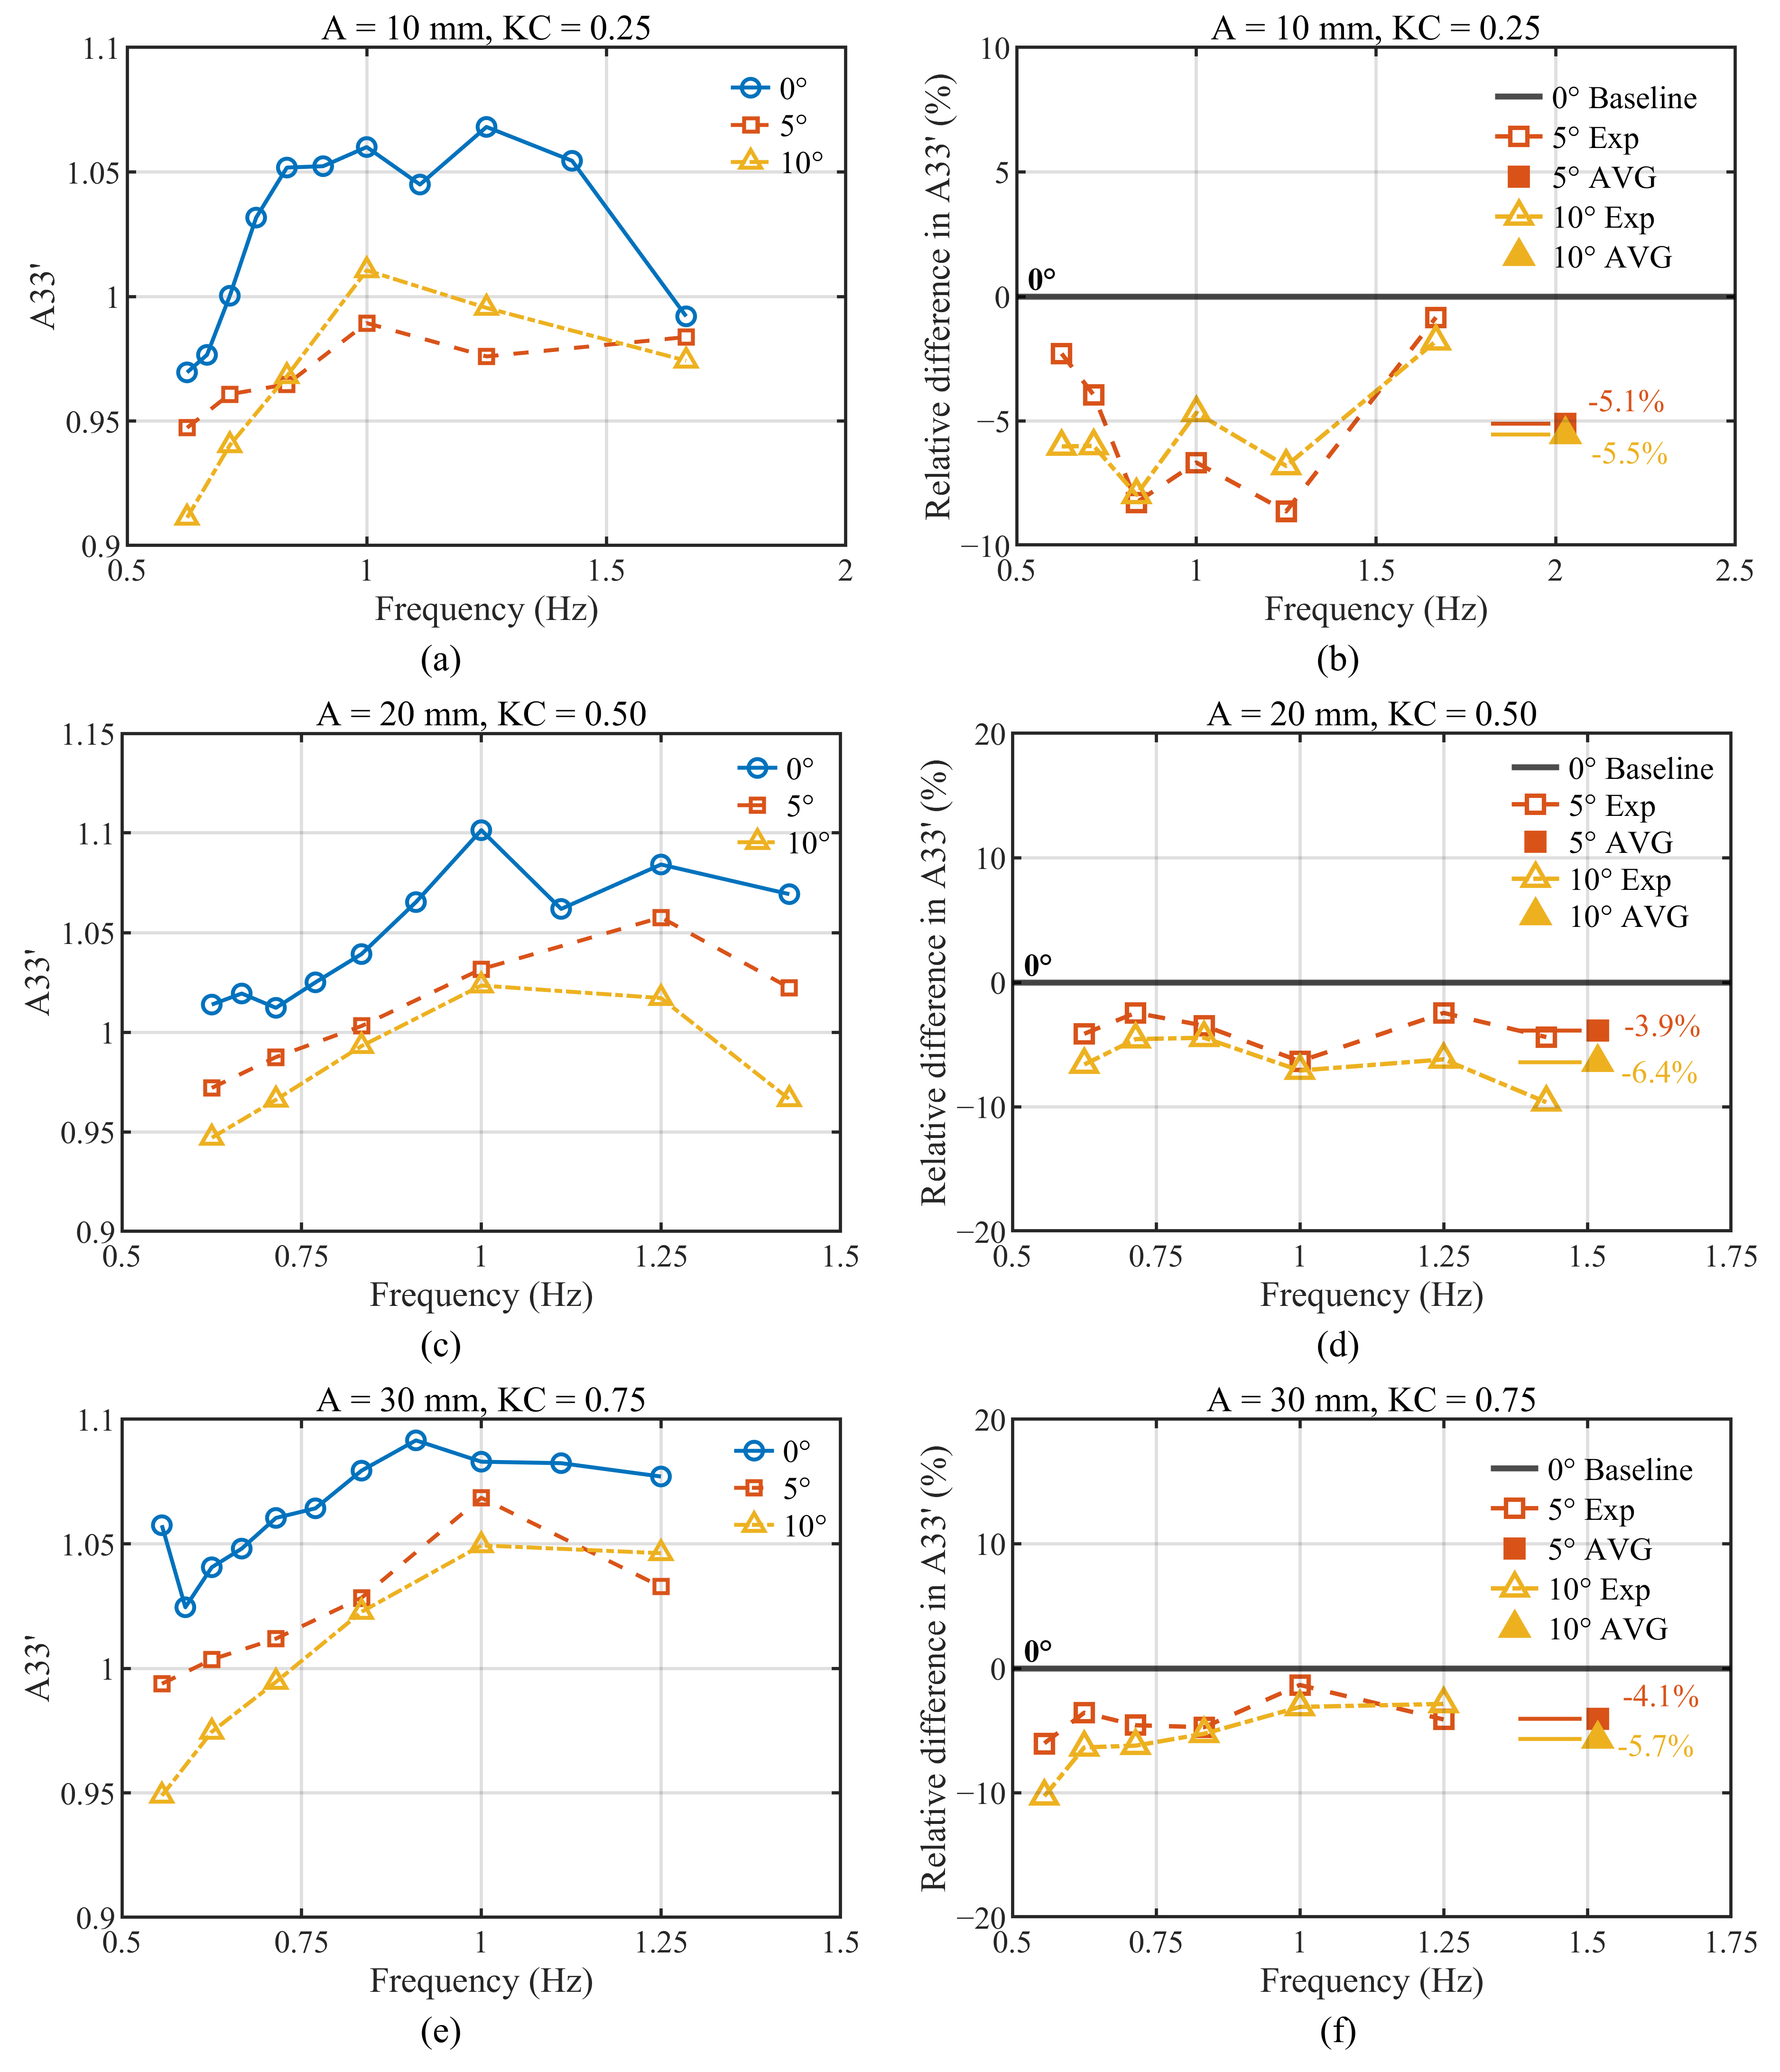
Figure 11 and Figure 12 show the variation in the heave added mass coefficient of Model A3 under different static pitch-inclination angles. Overall, under the three oscillation-amplitude conditions, the added mass curves corresponding to different inclination angles exhibit generally consistent trends and similar distributions with respect to frequency. This indicates that the static inclination does not alter the basic frequency-dependent behavior of the heave added mass. However, compared with the 0° condition, the added mass curves under the 5° and 10° conditions shift slightly downward as a whole, suggesting that the heave added mass of Model A3 decreases slightly with increasing static inclination.
Based on the average results from the common test cases, the non-dimensional heave added mass coefficients under the 5° and 10° conditions decrease by approximately 4.3% and 5.9%, respectively, compared with the 0° condition. This indicates that within the small-inclination range considered in this study, increasing the inclination angle slightly weakens the heave added mass. Specifically, for the case with an amplitude of 20 mm and f = 1.43 Hz, the heave added mass coefficients under the 5° and 10° conditions decrease by approximately 4.4% and 9.6%, respectively, relative to the 0° condition. For the case with an amplitude of 30 mm and f = 0.56 Hz, the reduction under the 10° condition is approximately 10.3%. These results suggest that the influence of static pitch inclination on heave added mass becomes more pronounced under certain medium-to-low-frequency and larger-amplitude conditions.
However, the influence of inclination on added mass does not exhibit a strictly monotonic trend at all frequency points. As shown in Figure 12, the added mass curves under the 5° and 10° conditions are close to each other within certain frequency ranges and even intersect locally. In other words, the added mass under the 10° condition is not always lower than that under the 5° condition. For example, under the 10 mm amplitude condition, the added mass coefficient at f = 1.67 Hz under the 10° condition is approximately 3.8% higher than that under the 0° condition. This indicates that within the small-inclination range investigated in this study, increasing the inclination angle mainly leads to a slight overall reduction in the added mass level, rather than a continuously enhanced monotonic decrease with increasing inclination. In other words, static inclination does affect the added mass, but its influence is limited in magnitude and exhibits a certain degree of frequency dependence.
Furthermore, this trend is generally consistent under different oscillation-amplitude conditions, indicating that the influence of static inclination on added mass is relatively stable. Specifically, a slight decrease in added mass with increasing inclination can be observed across different test cases. However, compared with the damping coefficients discussed later, the added mass curves exhibit smaller dispersion among different inclination angles, and the differences between test cases are relatively limited. This suggests that for the heave-plate-equipped component, static inclination slightly weakens the attached fluid inertia effect but is not sufficient to cause a substantial reconstruction of the added-mass characteristics.
A possible reason is the change in projected geometry between the inclined component and the laboratory-fixed heave direction. However, this interpretation is based on coefficient trends only and should be verified by future flow-field measurements or CFD.
Therefore, for the heave added mass, a more accurate conclusion is that within the range investigated in this study, increasing static inclination causes a slight overall reduction in the heave added mass of Model A3. Nevertheless, the reduction is limited, and a strictly monotonic relationship among different inclination angles is not always observed.

4.3.2. Heave Damping

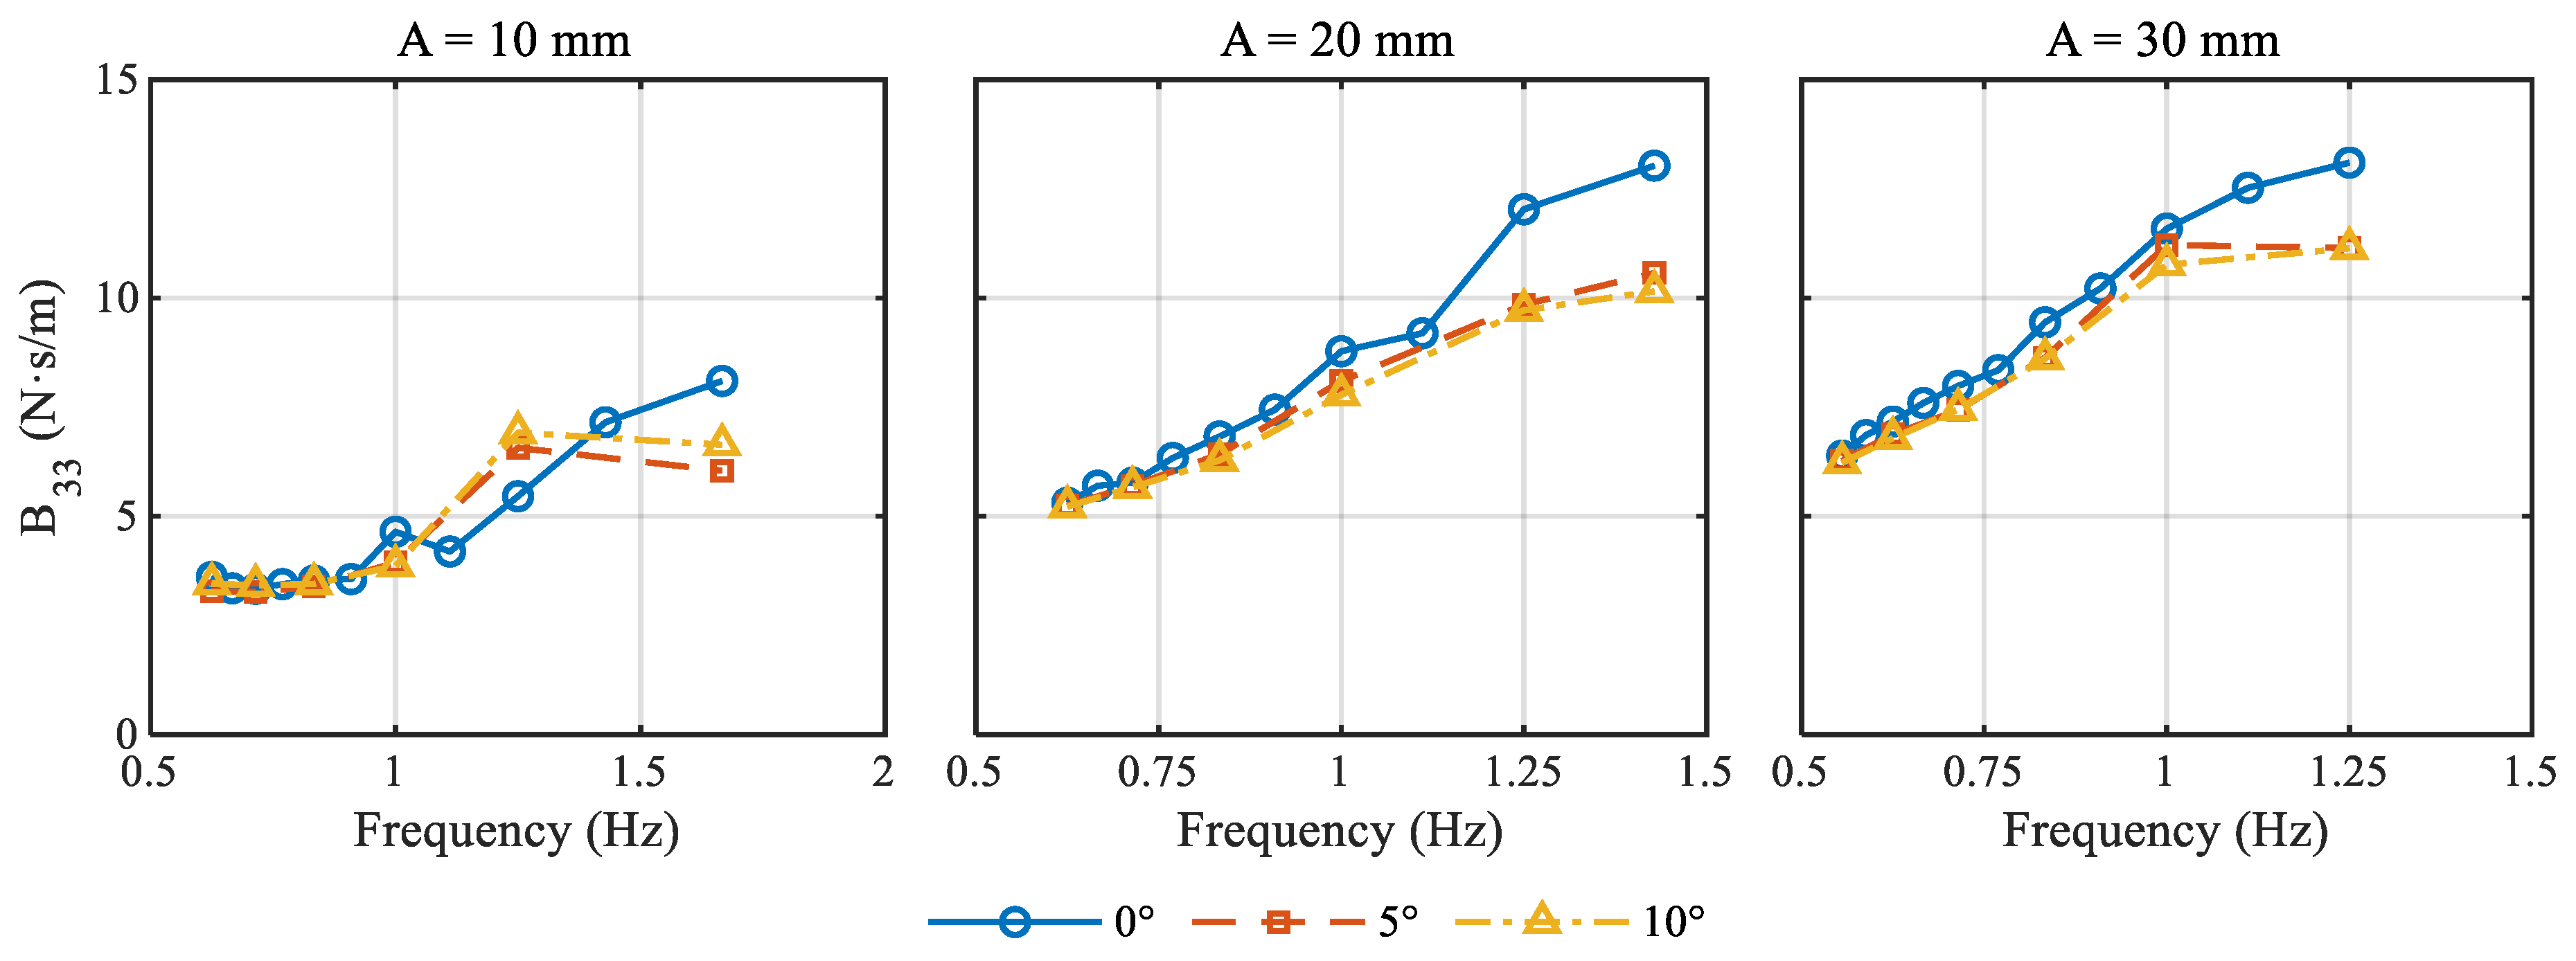
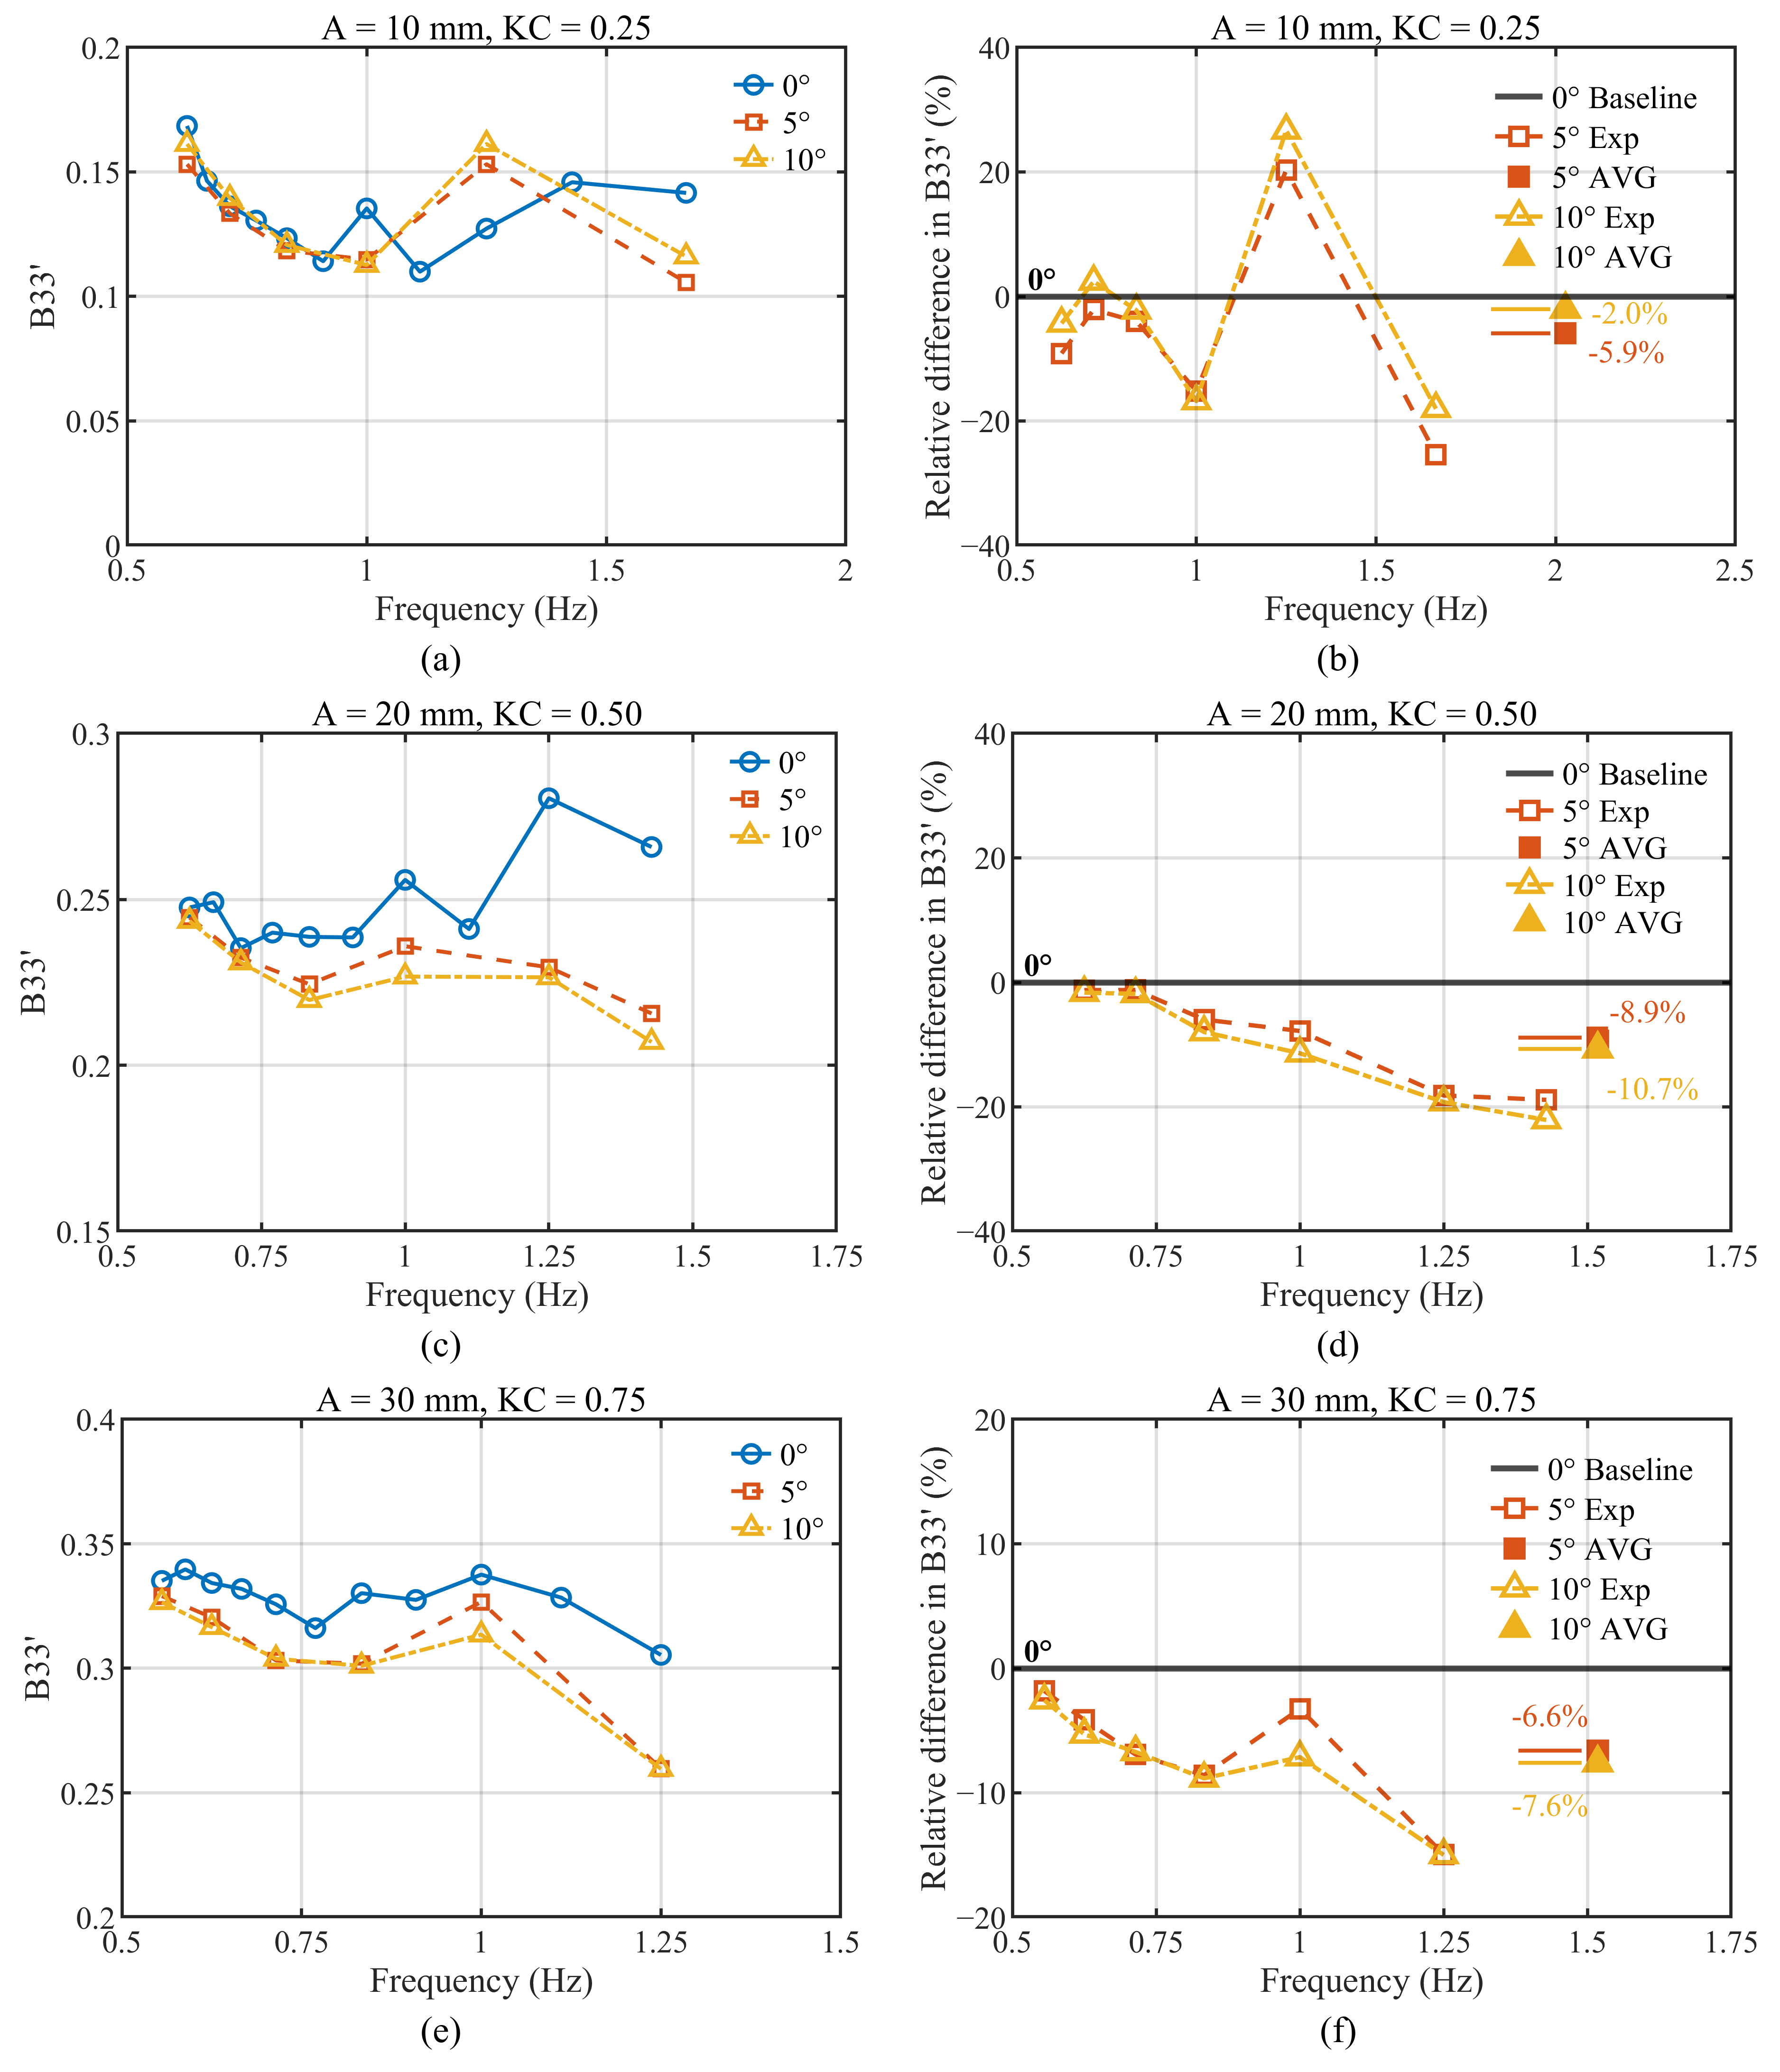
The effects of static pitch inclination on the heave damping and non-dimensional heave damping coefficients of Model A3 are illustrated in Figure 13 and Figure 14, respectively. Overall, within the tested range, the damping curves under different inclination angles exhibit similar frequency-dependent trends. However, compared with the 0° condition, the damping coefficients under the 5° and 10° conditions are generally lower, indicating that static inclination weakens the energy-dissipation capacity of the component during heave motion to some extent. In other words, compared with the 0° condition, the inclined cases generally show lower heave damping, although the difference between the 5° and 10° conditions is not strictly monotonic. This trend is also observed in the non-dimensional damping coefficients, suggesting that the reduction is not merely caused by the normalization method based on characteristic scales but reflects a physically consistent influence of static inclination.
From the results under different oscillation amplitudes, this feature remains evident. Although the overall tendency of reduced damping after introducing static pitch inclination is generally consistent for the three amplitude conditions, the degree of curve dispersion differs among the amplitudes. This indicates that the damping is affected not only by the inclination angle but also closely related to the oscillation amplitude. Therefore, the variation in heave damping is not solely caused by geometric inclination; rather, it results from the combined effects of static inclination, oscillation frequency, and oscillation amplitude.
Compared with added mass, damping exhibits a more complex response to variations in static inclination. As shown in the figures, the 0° condition generally corresponds to higher damping levels over most of the frequency range, whereas the 5° and 10° conditions exhibit reductions to varying degrees. This indicates that the static inclined attitude indeed modifies the energy-dissipation mechanism near the heave plate. However, this variation does not follow a strictly monotonic relationship at each frequency point. Within certain frequency ranges, the damping curves for the 5° and 10° conditions are relatively close to each other. At some local frequency points, the two curves even intersect, indicating that the damping under the 10° condition is not always lower than that under the 5° condition.
According to the averaged results of the common test cases, the non-dimensional heave damping coefficients under the 5° and 10° conditions decrease by approximately 7.1% and 6.8%, respectively, compared with the 0° condition. This indicates that the overall influence of static inclination on heave damping is stronger than that on heave added mass. For example, under the case with an amplitude of 20 mm and f = 1.43 Hz, the non-dimensional heave damping coefficients under the 5° and 10° conditions decrease by approximately 18.9% and 22.1%, respectively, relative to the 0° condition. Under the case with an amplitude of 30 mm and f = 1.00 Hz, the reduction under the 10° condition is approximately 7.1% compared with the 0° condition. These results suggest that the weakening effect of inclination on heave damping is more pronounced under medium-to-high-frequency conditions or cases with relatively high damping levels.
However, the local variations in heave damping do not always exhibit a monotonic decrease. For example, under the case with an amplitude of 10 mm and f = 1.25 Hz, the non-dimensional damping coefficients under the 5° and 10° conditions are higher than that under the 0° condition. Such local intersections indicate that under low-velocity motion conditions, the damping is more susceptible to vortex shedding, local flow separation, measurement uncertainty and fitting sensitivity, and the stability of signal fitting. Therefore, the relative difference at a single frequency point should not be overinterpreted. In this study, greater emphasis is placed on the overall trend reflected by the average values of the common test cases and the general shapes of the curves. Considering the physical meaning of damping, this variation can be interpreted as a change in the periodic energy-dissipation process. After the introduction of static inclination, the local flow structures near the plate edges may no longer be identical to those under the 0° condition. As a result, the original rhythm of flow separation and energy dissipation may be disturbed, leading to a decrease in the average damping level.

4.3.3. Surge Added Mass

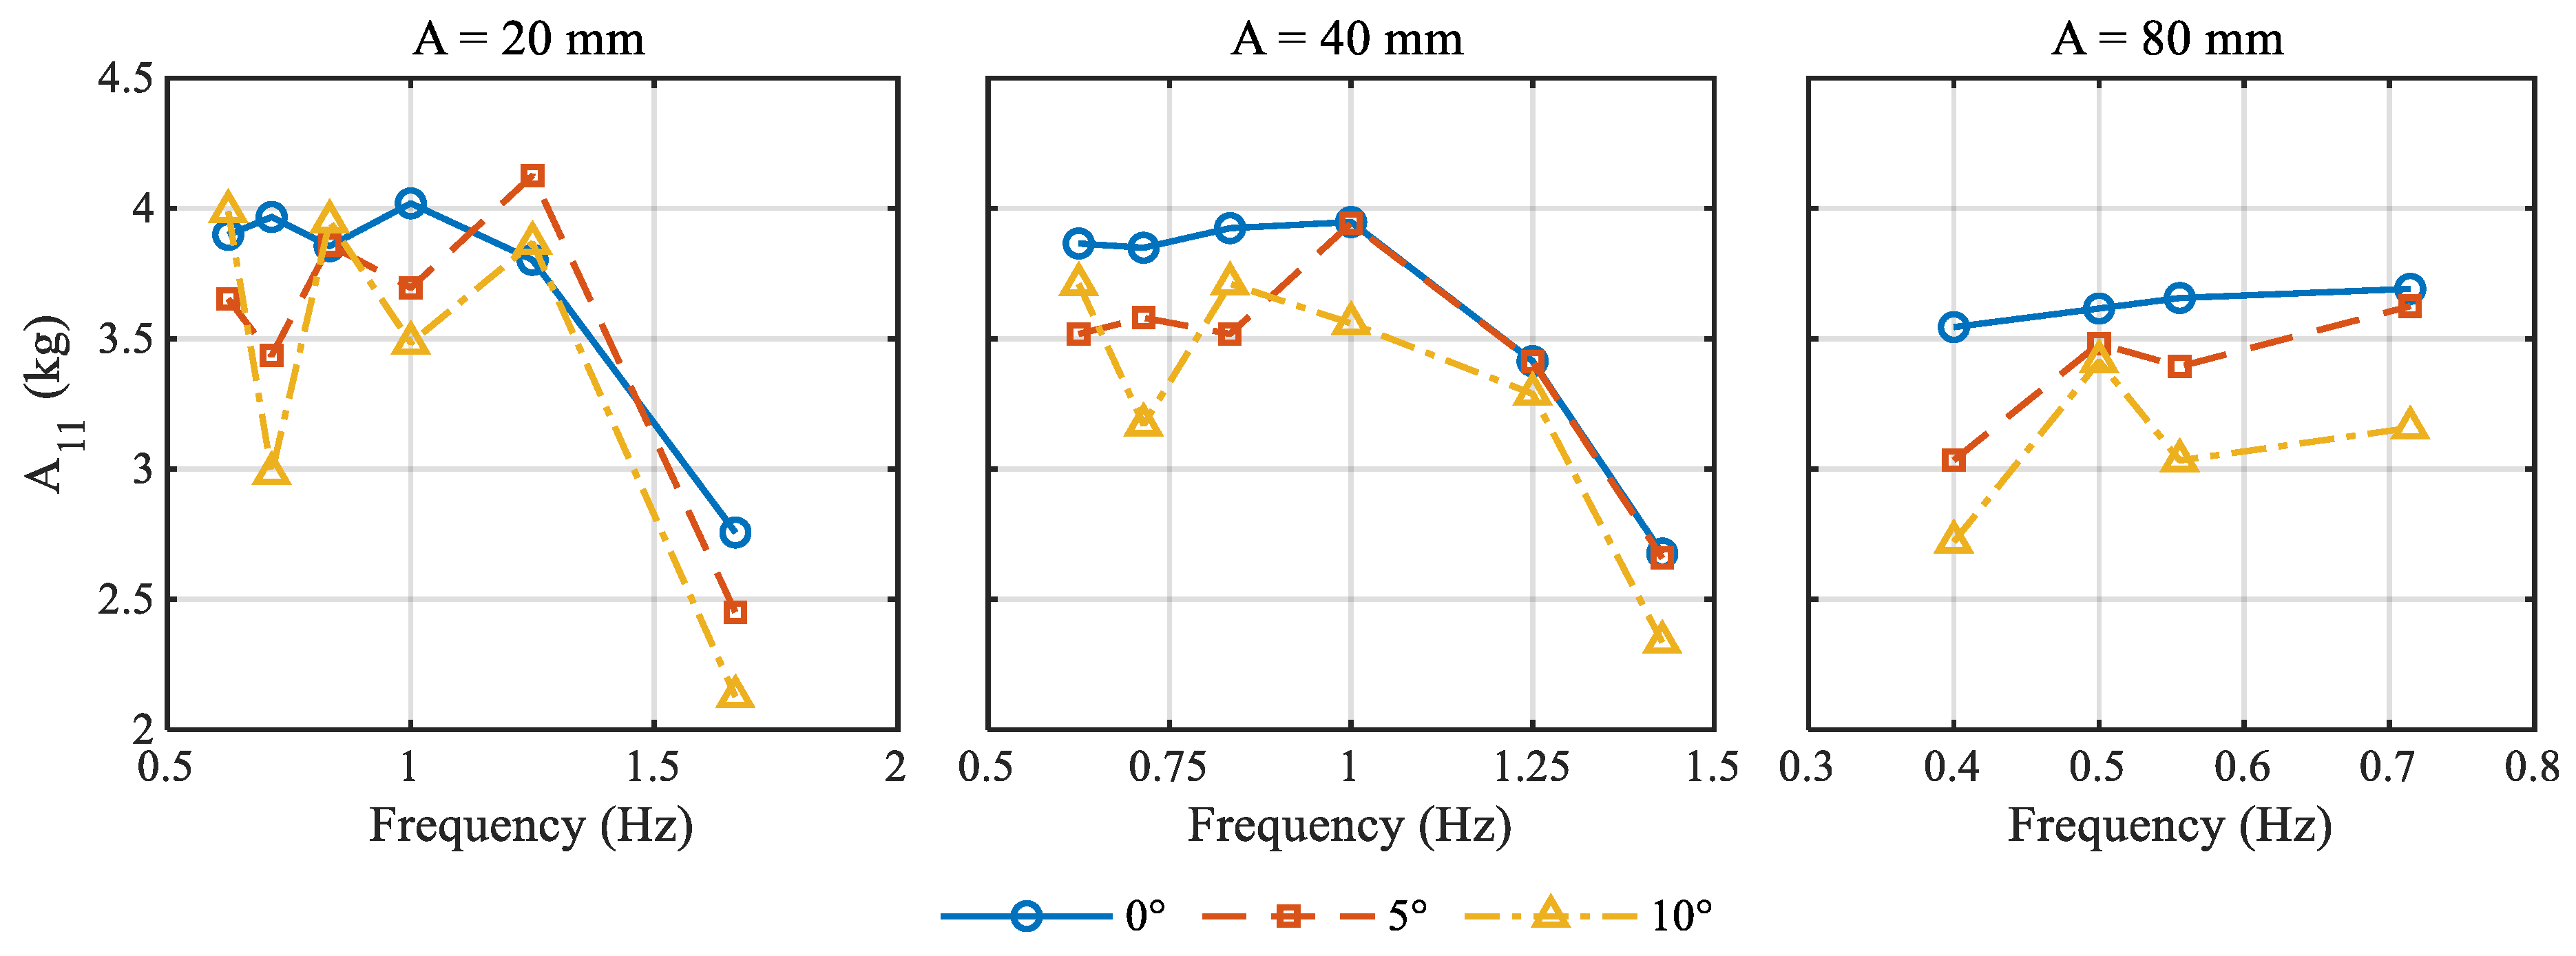
Figure 15 and Figure 16 illustrate the effects of static pitch inclination on the surge added mass of Model A3 and its corresponding non-dimensional coefficient, respectively. Overall, under different oscillation-amplitude conditions, the surge added mass exhibits similar frequency-dependent trends. Specifically, it remains at a relatively high level from the low- to medium-frequency range but decreases markedly in the higher-frequency range. Compared with the heave direction, the surge added mass is more sensitive to variations in oscillation frequency, and the differences among the different inclination conditions are also more pronounced.
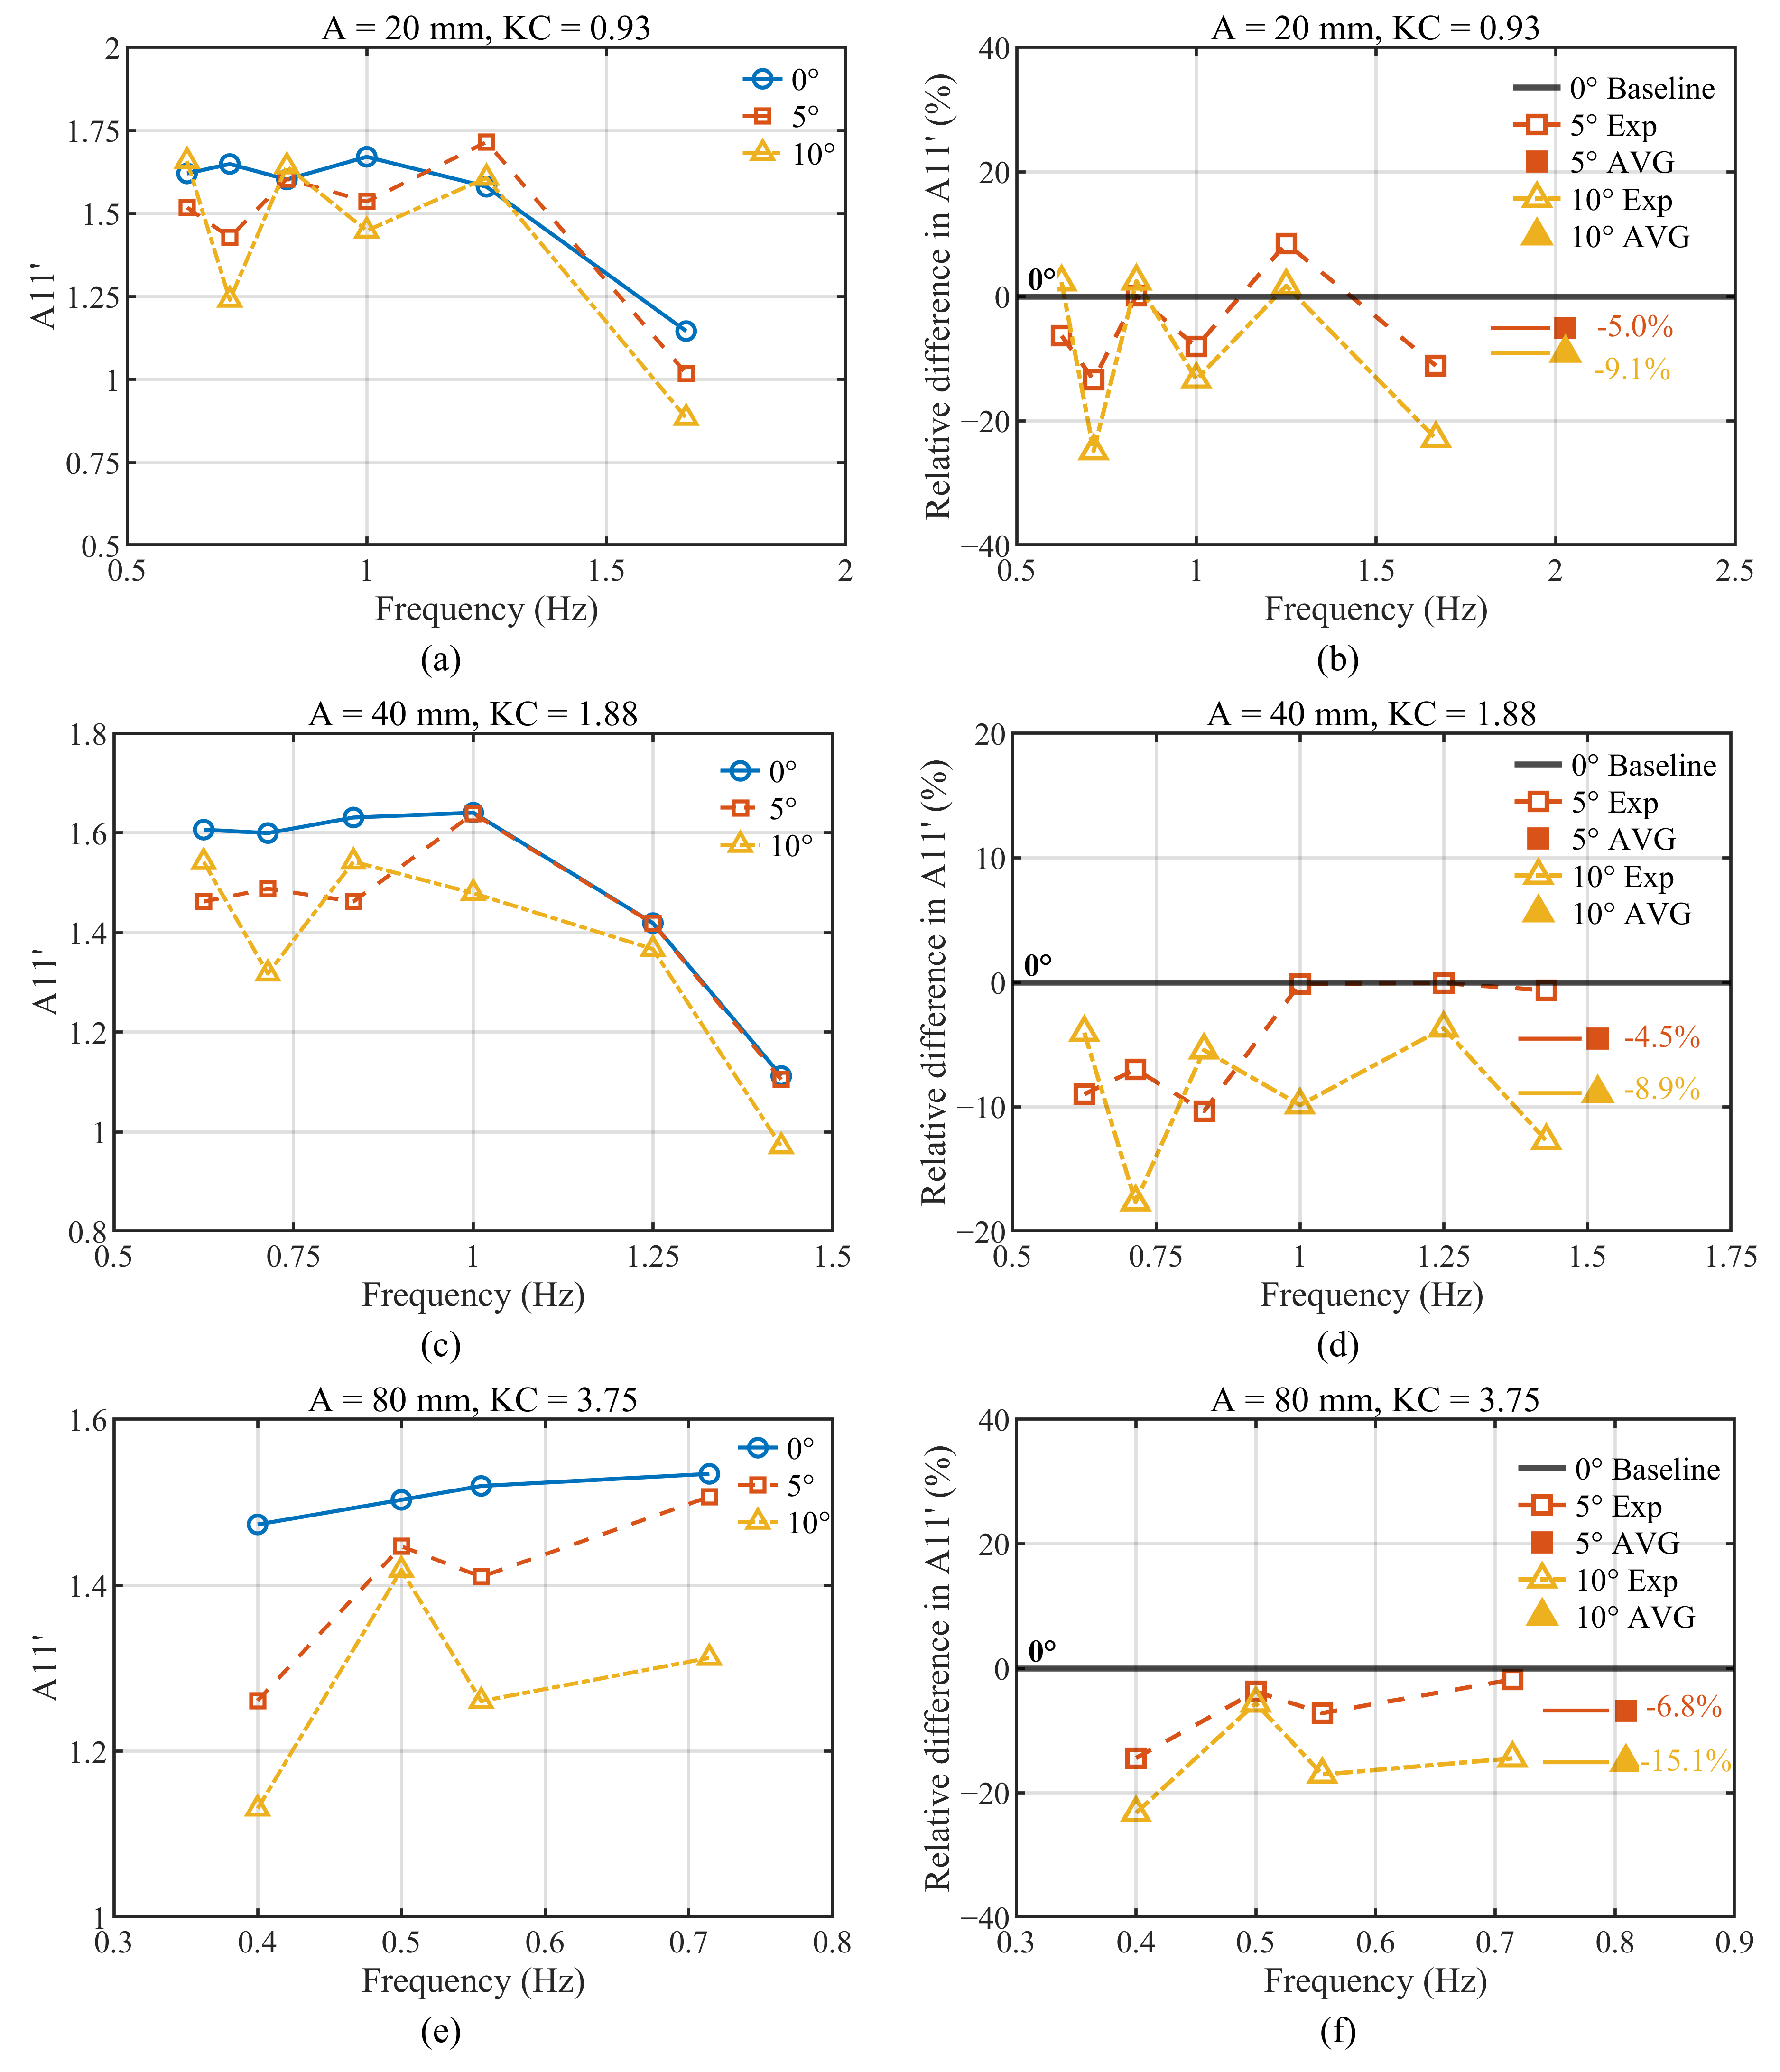
For the common test cases, the averaged results indicate that the non-dimensional surge added mass coefficients under the 5° and 10° conditions decrease by approximately 5.3% and 10.5%, respectively, compared with the 0° condition. This indicates that as the static inclination angle increases, the attached inertia effect of Model A3 in the surge direction is weakened more noticeably. Specifically, for the case with an amplitude of 20 mm and f = 1.67 Hz, the surge added mass coefficients under the 5° and 10° conditions decrease by approximately 11.1% and 22.8%, respectively, relative to the 0° condition. For the case with an amplitude of 40 mm and f = 1.43 Hz, the reduction under the 10° condition is approximately 12.7%. For the case with an amplitude of 80 mm and f = 0.40 Hz, the reduction under the 10° condition reaches approximately 23.2%. These results indicate that the surge added mass is more sensitive to static inclination than the heave added mass.
At the same time, the surge added mass does not decrease strictly monotonically at all frequency points. For example, under the case with an amplitude of 20 mm and f = 1.25 Hz, the non-dimensional surge added mass coefficients under the 5° and 10° conditions are not both lower than that under the 0° condition. This indicates that the influence of inclination on surge added mass is still jointly modulated by oscillation frequency and amplitude. Nevertheless, from the overall average values and most test cases, the added mass level under the 10° condition is clearly lower than that under the 0° condition, suggesting that increasing inclination has a more stable weakening effect on the attached inertia in the surge direction.
This behavior may be related to the changed projection of the column–heave-plate component relative to the laboratory-fixed surge direction. Because the local flow was not measured, this explanation remains a qualitative interpretation rather than a confirmed mechanism.
Therefore, for surge added mass, it can be concluded that increasing static inclination generally reduces the surge added mass of Model A3, with the reduction under the 10° condition usually being greater than that under the 5° condition. Compared with the heave direction, this influence is more significant, although it still exhibits a certain degree of frequency dependence.

4.3.4. Surge Damping

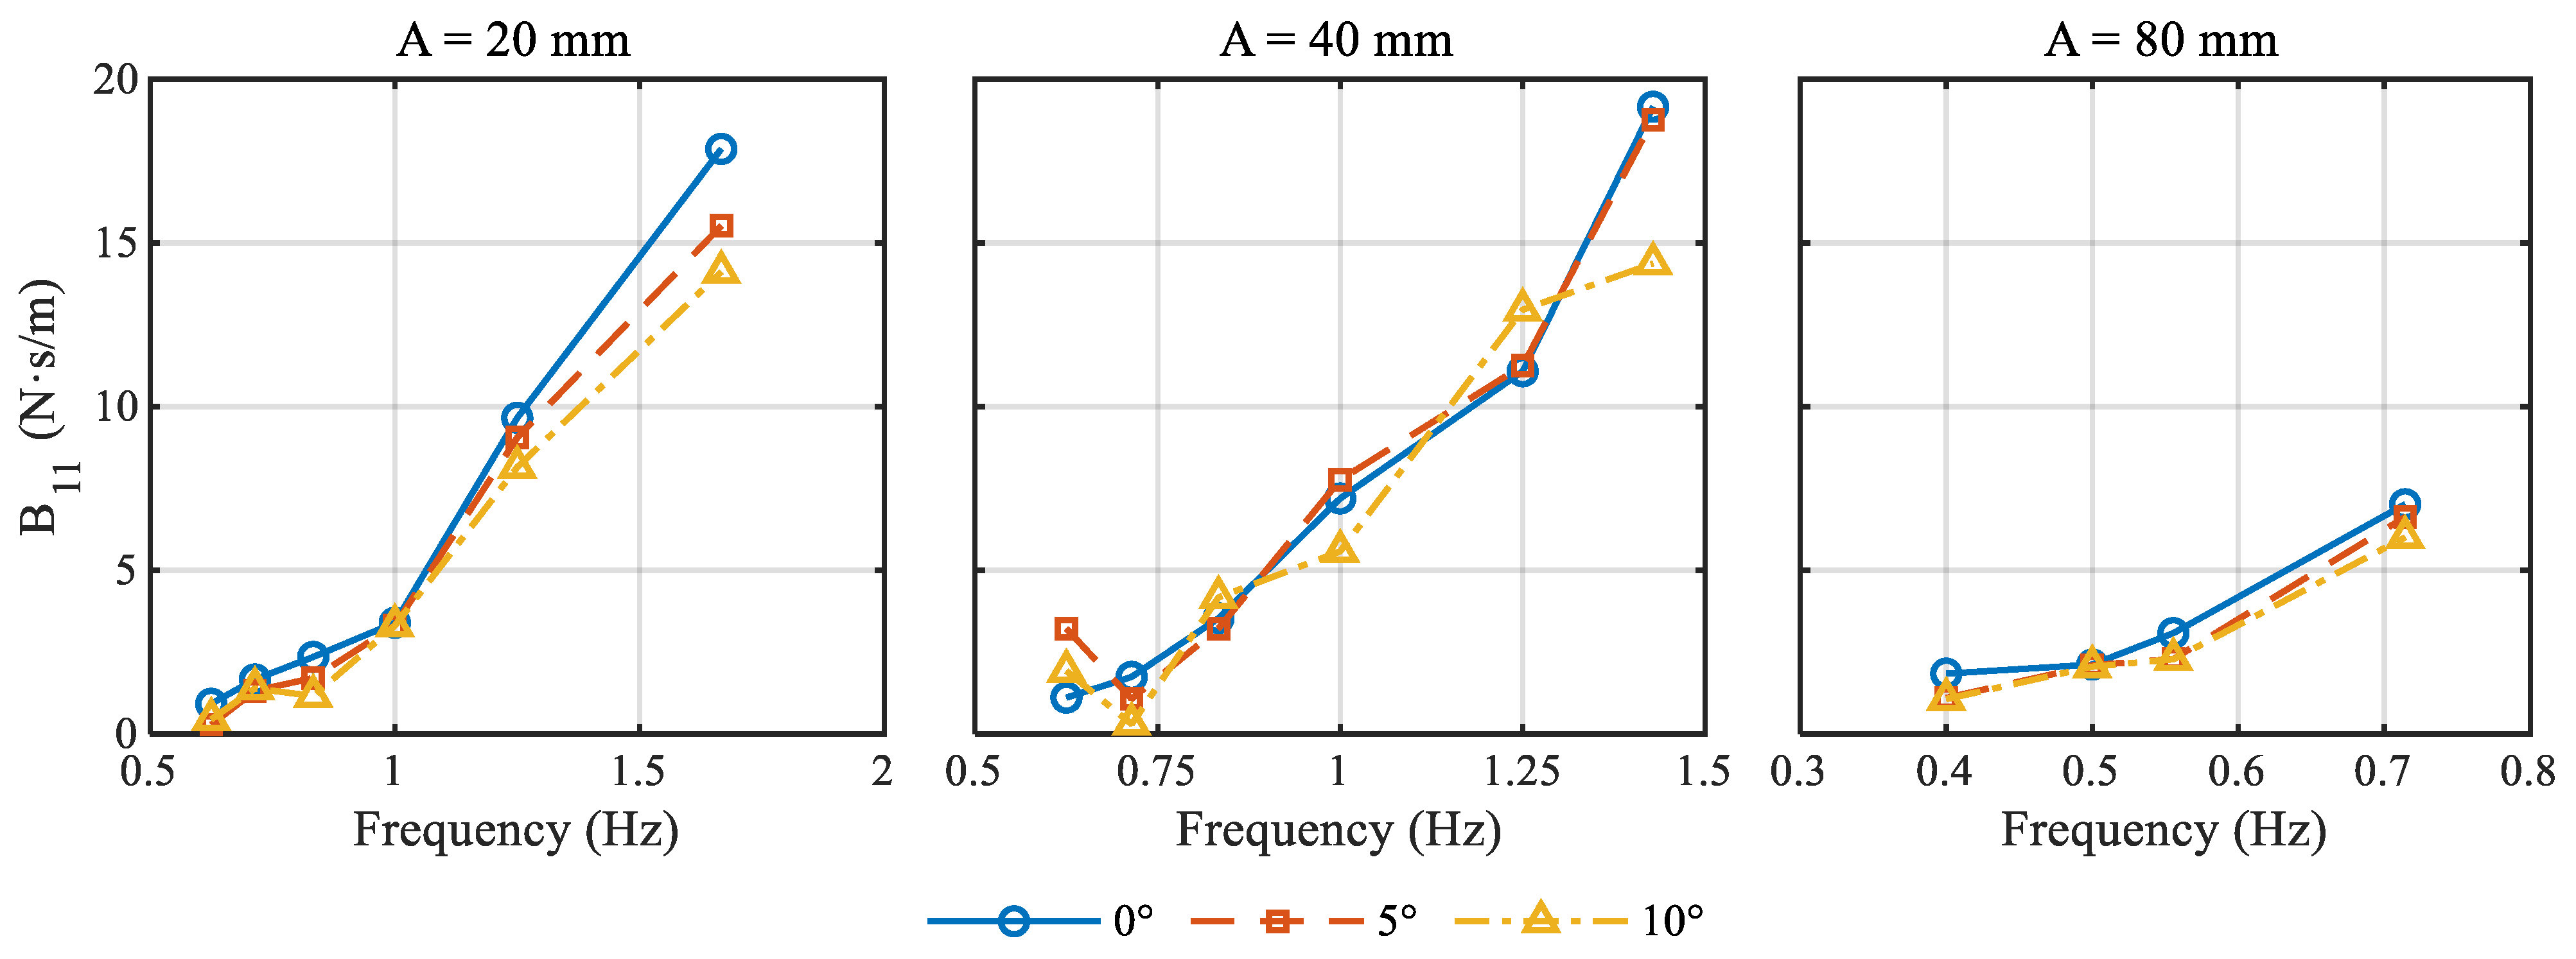
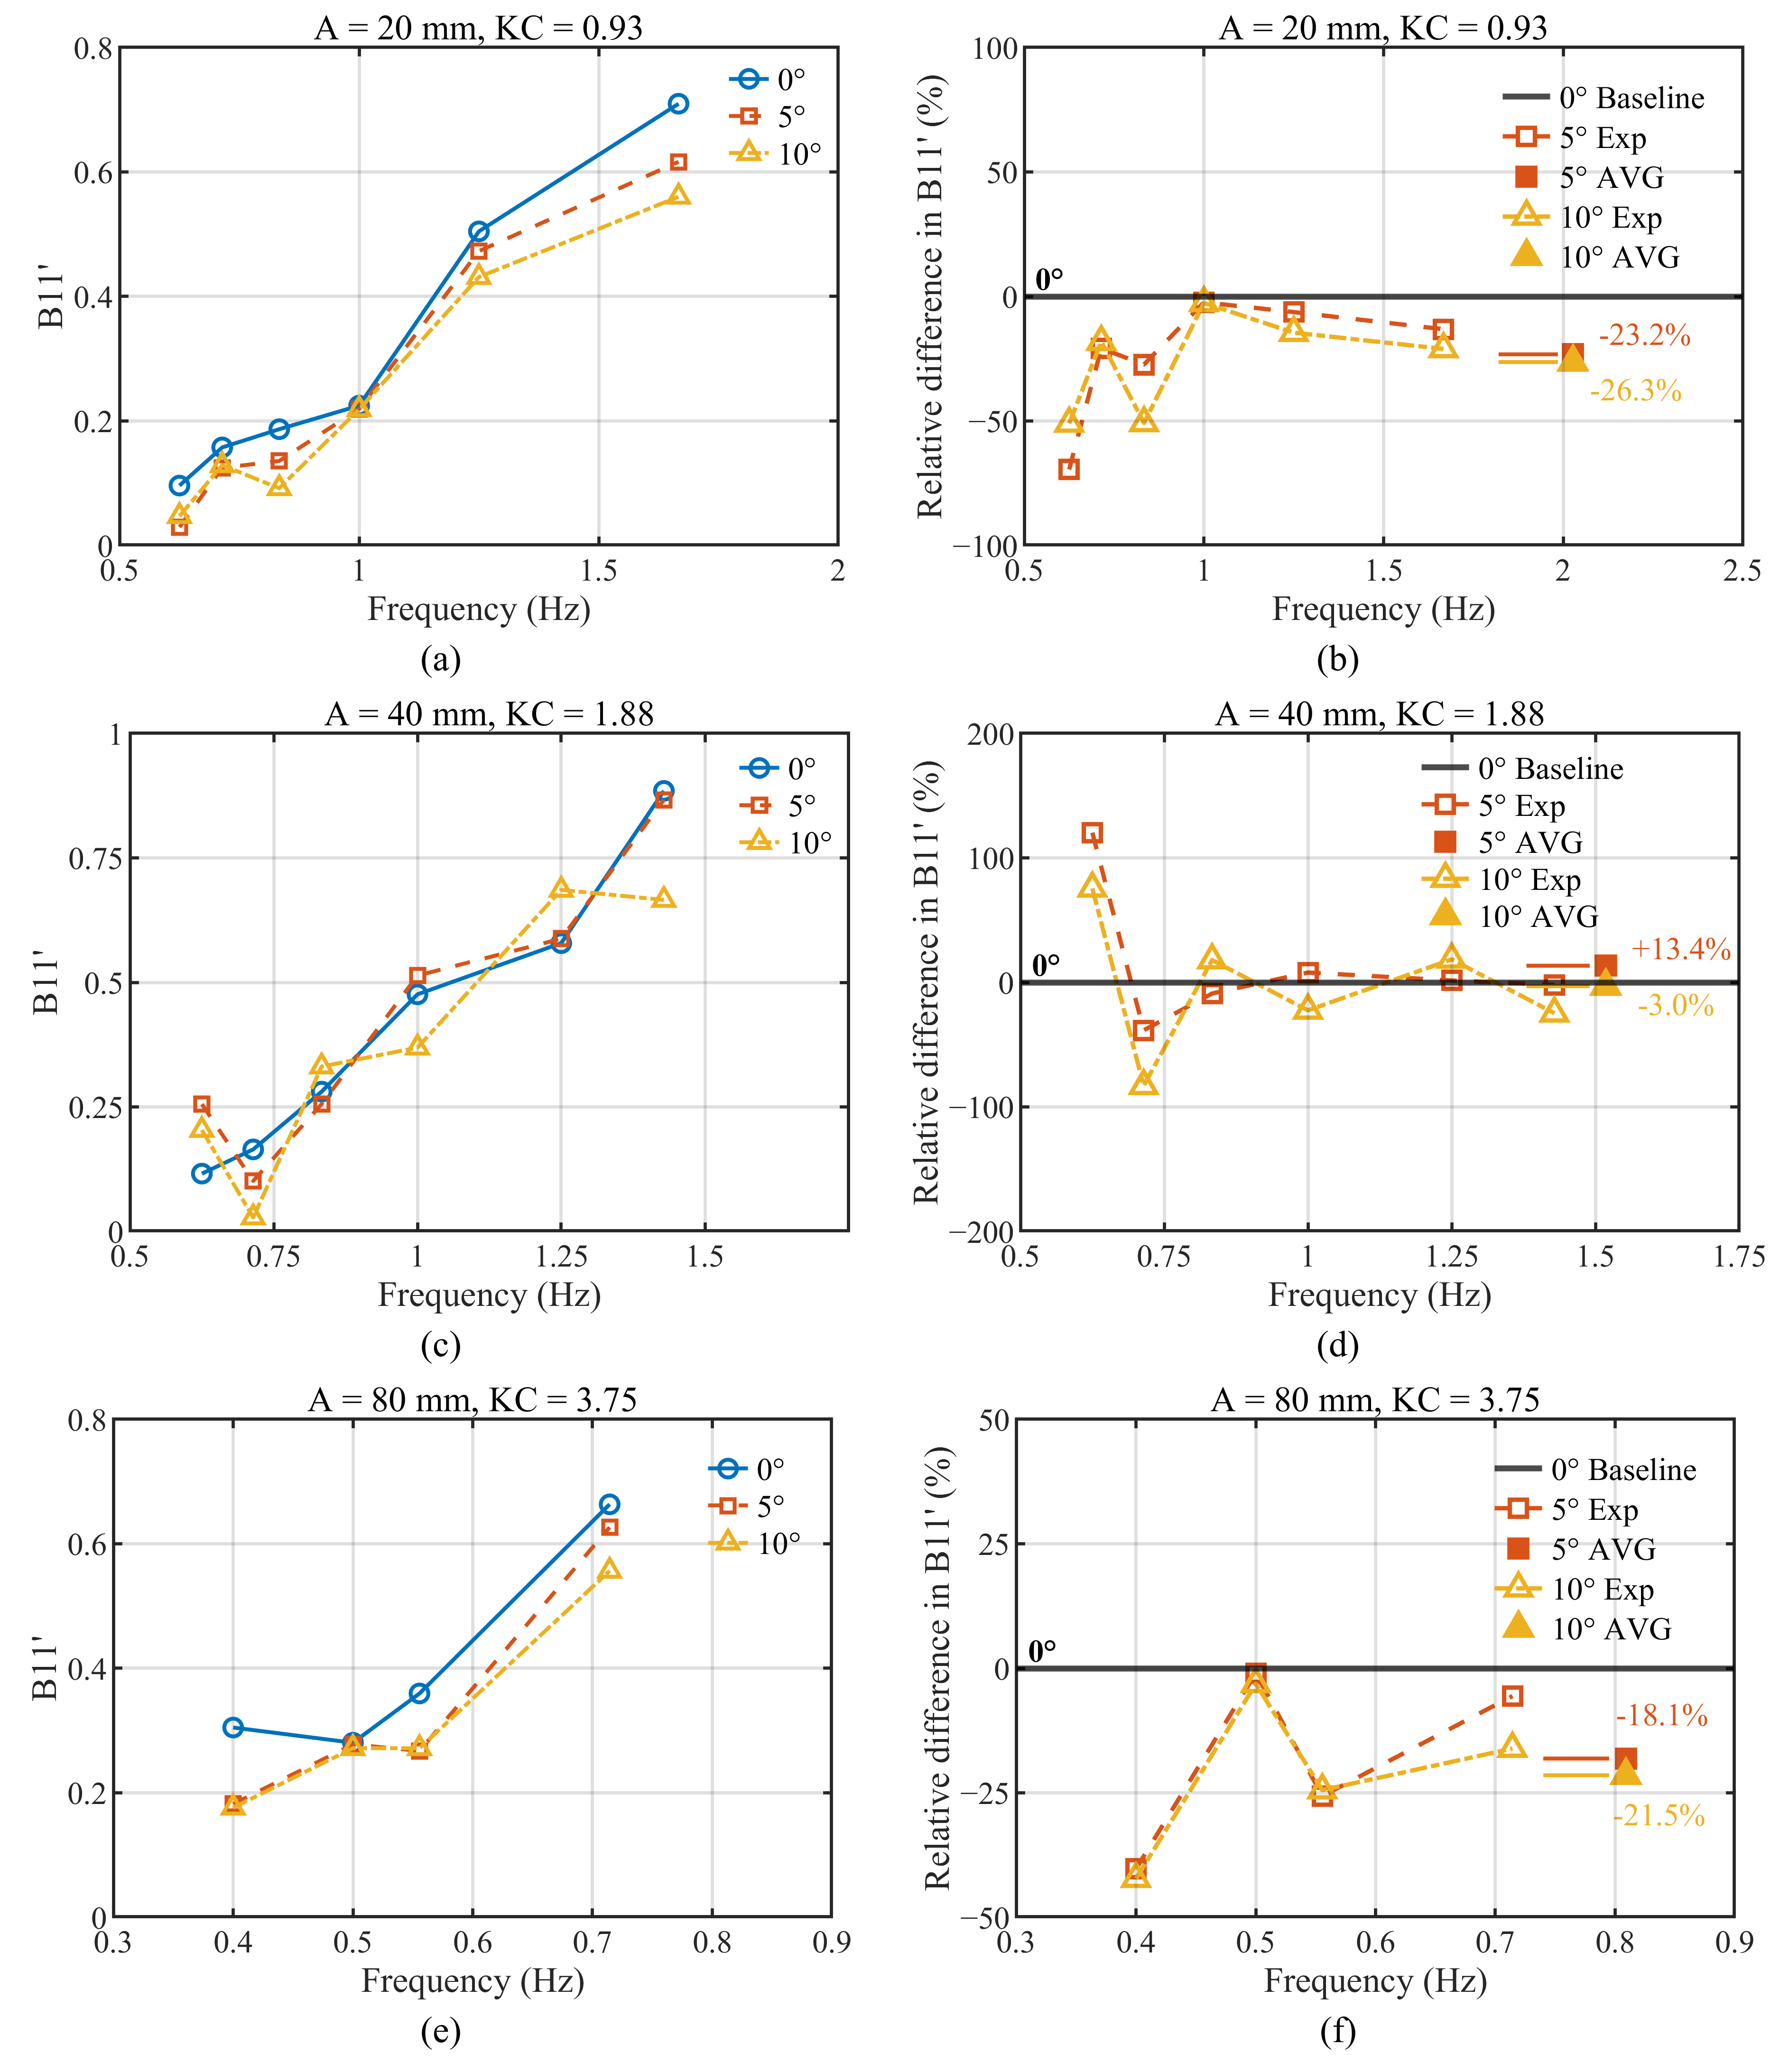
Figure 17 and Figure 18 present the variations in the surge damping and non-dimensional surge damping coefficient of Model A3 under different static inclination conditions, respectively. Overall, the surge damping increases markedly with increasing frequency under all three oscillation amplitudes, and this feature is also observed in the non-dimensional damping results. This indicates that the damping characteristics in the surge direction are highly sensitive to frequency variation, both in terms of the absolute damping level and the relative energy-dissipation capacity. Meanwhile, the curves under the inclined conditions are generally lower than those under the vertical condition, suggesting that static inclination weakens the energy-dissipation capacity of the component during surge motion to some extent.
An average comparison of the common test cases indicates that the non-dimensional surge damping coefficients under the 5° and 10° conditions decrease by approximately 8.2% and 16.4%, respectively, compared with the 0° condition. This indicates that surge damping is more sensitive to inclination than surge added mass and also exhibits a stronger average variation than the heave-direction damping. In particular, the reduction in surge damping is more pronounced under the 10° condition. For example, for the case with an amplitude of 20 mm and f = 1.67 Hz, the surge damping under the 10° condition decreases by approximately 21.1% relative to the 0° condition. For the case with an amplitude of 40 mm and f = 1.43 Hz, the corresponding reduction is approximately 24.7%. For the case with an amplitude of 80 mm and f = 0.40 Hz, the reduction reaches approximately 42.2%. These results suggest that static inclination may significantly weaken the energy-dissipation capacity of the component in the surge direction.
The relative differences in surge damping can be large at some individual frequency points, especially when the damping under the 0° condition is already small, where the percentage difference can be easily amplified. Therefore, a single low-damping frequency point is not used as the sole criterion for evaluating the influence of inclination. Instead, the analysis is based on both the average differences and the overall trends of the curves. Overall, the surge damping coefficient under the 10° condition is clearly lower than that under the 0° condition, indicating that a larger static inclination weakens the energy dissipation during horizontal reciprocating motion.
From the measured coefficients, the reduced surge damping suggests a lower component-level energy-dissipation capacity under static inclination. However, the present data cannot identify the detailed flow path responsible for this reduction.
Therefore, for surge damping, a more reasonable conclusion is that, within the range investigated in this study, increasing static inclination generally reduces the surge damping of Model A3. This trend is also observed in the non-dimensional damping results. The 0° condition generally maintains a higher damping level, whereas the 10° condition exhibits an overall lower damping level. However, the damping does not always follow a strictly monotonic relationship among different inclination angles, and its variation shows strong dependence on oscillation frequency and amplitude.

4.3.5. Summary of Inclination Effects

Table 6 summarizes the average relative variations of the nondimensional coefficients. The heave added mass decreases by about 4.3% and 5.9% at 5° and 10°, whereas the surge added mass decreases by about 5.3% and 10.5%, respectively.
Damping shows larger sensitivity: heave damping decreases by about 7.1% and 6.8%, while surge damping decreases by about 8.2% and 16.4% at 5° and 10°, respectively. Thus, damping is more affected by static inclination than added mass, and surge damping shows the strongest response.
Overall, static inclination does not change the basic frequency-dependent trends, but it reduces the average levels of added mass and damping, especially damping. These findings should be used as component-level evidence for inclination-dependent coefficient variation, rather than as direct conclusions for full-platform pitch-response prediction.
The scatter ranges in Table 6 indicate that the inclination effect is not strictly monotonic at every individual frequency point. The dispersion is relatively small for the added-mass coefficients, whereas it becomes much wider for the damping coefficients, especially in the surge direction. This is partly because at lower oscillation frequencies, the measured damping force is relatively small, and the damping coefficient is more sensitive to force measurement noise, phase deviation, signal filtering, and least squares fitting uncertainty. As a result, even a small absolute difference among repeated or inclined cases may be amplified into a large percentage variation when normalized by the 0° reference value. Therefore, the large scatter range of the damping coefficients should not be interpreted as a reversal of the overall trend. Instead, the average values and the general curve tendencies are used to evaluate the inclination effect, while individual low-frequency points are treated with caution.

4.4. Engineering Implications and Limitations

The possible influence of the inclination-induced added-mass variation on the heave natural period can be evaluated only in an approximate sense, because the present experiments measured component-level hydrodynamic coefficients rather than the total heave added mass of the complete floating platform. Therefore, the following discussion is intended to provide an order-of-magnitude interpretation rather than a direct platform-level prediction.
Mello et al. [41] reported a semi-submersible FOWT with heave plates whose platform mass was about 7.35 × 10⁶ kg. For different heave plate configurations, the corresponding heave added mass A33 ranged from approximately 11.90 × 10⁶ kg to 26.90 × 10⁶ kg. This indicates that for a floating platform equipped with heave plates, the heave added mass can be larger than the structural mass and may account for roughly 60–80% of the effective heave inertia. In the same study, the calculated heave natural period increased from 10.10 s for the no-plate case to 14.50–19.35 s for the heave plate cases, and the decay-test results showed a similar increase from 9.8 s to 14.4–19.7 s. These data confirm that heave plates can strongly affect the heave natural period by increasing the effective inertia of the system.
Based on this empirical range, if the averaged heave added mass reductions observed in the present inclined component tests were transferred proportionally to the global heave added mass, the resulting change in the effective heave inertia would be limited. The 4.3% reduction in non-dimensional heave added mass at 5° would correspond to an estimated heave natural-period reduction of about 1.3–1.7%, while the 5.9% reduction at 10° would correspond to about 1.8–2.3%. These values suggest that the inclination-induced change in heave added mass may cause only a small shift in the heave natural period of a complete platform, compared with the much larger period increase caused by installing heave plates in the first place.
However, this estimate should be interpreted with caution. The present tests do not include the full platform geometry, hydrostatic restoring, mooring stiffness, or six-degree-of-freedom coupling. Moreover, the static inclination tested here is a frozen-attitude approximation and does not include dynamic pitch velocity, pitch–heave–surge phase coupling, or time-varying relative velocity. Therefore, the present results should be regarded as component-level evidence that inclination may slightly reduce the effective heave inertia and damping contribution under large pitch attitudes. A quantitative assessment of the resulting natural-period shift and design-load variation should be performed in future work using coupled full-platform simulations or dedicated platform-scale experiments.

5. Conclusions

This study investigated the possible variation in the hydrodynamic characteristics of typical column–heave-plate components of floating offshore wind platforms under large-amplitude pitch-response conditions. Forced oscillation experiments were conducted on a single circular column model and a circular column model equipped with a hexagonal heave plate. Both heave and surge motions were considered, with different oscillation amplitudes, oscillation frequencies, and static pitch inclination angles of 0°, 5°, and 10°. The added mass and damping coefficients were identified using the least squares method and further nondimensionalized. The effects of the heave plate and static pitch inclination were analyzed. The main conclusions are as follows.
(1)
Effect of the heave plate configuration:
Compared with the circular column without a heave plate, the circular column with a hexagonal heave plate exhibits larger dimensional added mass and damping in both the heave and surge directions. This indicates that the heave plate significantly enhances the interaction between the component and the surrounding fluid. Since the test cases of A1 and A3 were not designed under strictly identical KC-number conditions, this comparison is mainly used to demonstrate the overall enhancement of hydrodynamic effects caused by the introduction of the heave plate.
(2)
Effect of inclination in the heave direction:
For the heave-plate-equipped model, the non-dimensional heave added mass under the 5° and 10° inclination conditions decreases by approximately 4.3% and 5.9%, respectively, compared with the 0° condition. The corresponding non-dimensional heave damping decreases by approximately 7.1% and 6.8%, respectively. These results indicate that static inclination has a relatively limited effect on heave added mass but produces a more pronounced weakening effect on heave damping.
(3)
Effect of inclination in the surge direction:
The surge-direction hydrodynamic coefficients are more sensitive to static inclination. Under the 5° and 10° inclination conditions, the non-dimensional surge added mass decreases by approximately 5.3% and 10.5%, respectively, while the non-dimensional surge damping decreases by approximately 8.2% and 16.4%, respectively. This suggests that directly using damping parameters obtained from vertically installed components may overestimate the energy-dissipation capacity of the component under large-amplitude pitch attitudes.
(4)
Engineering implications and limitations:
The results show that static pitch inclination does not completely change the basic frequency-dependent trends of the hydrodynamic coefficients, but it reduces the added mass and damping, with the damping reduction being more significant. Because the present tests used prescribed static inclination and did not resolve local flow fields, the findings should be interpreted as component-level coefficient trends. Future work should combine particle image velocimetry (PIV), CFD, and coupled-platform tests. The prescribed static inclination represents a frozen-attitude approximation and should not be interpreted as dynamic pitch motion. It captures the influence of mean pitch attitude on projected geometry, local flow asymmetry, and component-level heave/surge coefficients, but it does not include dynamic pitch velocity, pitch–heave–surge phase coupling, time-varying relative velocity, or global six-degree-of-freedom platform response. Therefore, the findings should be regarded as component-level evidence for inclination-dependent hydrodynamic coefficients, rather than direct full-platform response predictions.
These data provide an experimental basis for introducing inclination-dependent corrections to component-level hydrodynamic parameters in floating offshore wind platform models.

Author Contributions

Conceptualization, Z.Z. and Y.Z.; methodology, Z.Z.; software, Z.Z.; validation, J.W., Y.Z. and Z.Z.; formal analysis, W.S., W.C. and C.S.; investigation, Z.Z. and J.W.; resources, Z.Z.; data curation, Z.Z. and J.W.; writing—original draft preparation, Z.Z.; writing—review and editing, W.S. and M.Q.; visualization, Z.Z.; supervision, W.S. and M.Q.; project administration, W.S., L.Z., S.W. and M.Q.; funding acquisition, M.Q. All authors have read and agreed to the published version of the manuscript.

Funding

This research is funded by the National Key R&D Program of China (2022YFB4201200); China Three Gorges Corporation Research Funding (NBZZ202300694).

Data Availability Statement

The original contributions presented in this study are included in the article. Further inquiries can be directed to the corresponding author.

Acknowledgments

DeepSeek was used in the making of this paper, as an assisting tool, only for the creation of the English text and for spelling assistance. All the information was checked according to the references included in the paper.

Conflicts of Interest

Authors Long Zheng, Songxiong Wu, and Ming Qin were employed by the China Three Gorges Co., Ltd. The remaining authors declare that the research was conducted in the absence of any commercial or financial relationships that could be construed as a potential conflict of interest.

Abbreviations

The following abbreviations are used in this manuscript:
CFDComputational Fluid Dynamics
FOWTFloating Offshore Wind Turbine
PIVParticle image velocimetry
KCKeulegan–Carpenter number

Nomenclatures

SymbolDefinitionUnit
A1Circular column model without a heave plate
A3Circular column model with a hexagonal heave plate
A Prescribed oscillation amplitude at model scalemm
A p Prototype-scale oscillation amplitudem
A m Model-scale oscillation amplitudemm
A 11 Surge added mass coefficientkg
A 33 Heave added mass coefficientkg
A 11 t h Theoretical surge added masskg
A 33 t h Theoretical heave added masskg
A 11 Non-dimensional surge added mass coefficient
A 33 Non-dimensional heave added mass coefficient
A ω Waterplane area of the modelm2
B 11 Surge damping coefficientN·s/m
B 33 Heave damping coefficientN·s/m
B 11 Non-dimensional surge damping coefficient
B 33 Non-dimensional heave damping coefficient
D c Equivalent diameter of the columnm
D d Equivalent diameter of the heave platem
f Oscillation frequencyHz
F 11 ( t ) Measured total longitudinal force in surge motionN
F 33 ( t ) Measured total vertical force in heave motionN
F H ( t ) Hydrodynamic forceN
F H _ h e a v e ( t ) Hydrodynamic force in the heave directionN
F H _ s u r g e ( t ) Hydrodynamic force in the surge directionN
F K ( t ) Hydrostatic restoring forceN
F g r a v ( t ) Inertial load caused by the model massN
g Gravitational accelerationm/s2
L m Model-scale characteristic lengthm
L p Prototype-scale characteristic lengthm
M Mass of the modelkg
R 2 Coefficient of determination for least squares fitting
T Prescribed oscillation periods
T m Model-scale oscillation periods
T p Prototype-scale oscillation periods
t Times
x ( t ) Displacement time historym
x ˙ ( t ) Velocity time historym/s
x ¨ ( t ) Acceleration time historym/s2
β Frequency parameter
λ Geometric scale ratio, λ = L p / L m
ν Kinematic viscosity of waterm2/s
ρ Water densitykg/m3
θ Static pitch-inclination angle of the model°

References

  1. Roddier, D.; Cermelli, C.; Aubault, A.; Weinstein, A. WindFloat: A floating foundation for offshore wind turbines. J. Renew. Sustain. Energy 2010, 2, 033104. [Google Scholar] [CrossRef] [Scilit]
  2. Huijs, F.; de Bruijn, R.; Savenije, F. Concept design verification of a semi-submersible floating wind turbine using coupled simulations. Energy Procedia 2014, 53, 2–12. [Google Scholar] [CrossRef] [Scilit]
  3. Karimirad, M.; Michailides, C. V-shaped semisubmersible offshore wind turbine: An alternative concept for offshore wind technology. Renew. Energy 2015, 83, 126–143. [Google Scholar] [CrossRef] [Scilit]
  4. Robertson, A.; Jonkman, J.; Masciola, M.; Song, H.; Goupee, A.; Coulling, A.; Luan, C. Definition of the Semisubmersible Floating System for Phase II of OC4; NREL/TP-5000-60601; National Renewable Energy Laboratory: Golden, CO, USA, 2014. [CrossRef] [Scilit] [PubMed]
  5. Teng, H.; Leng, S.; Shi, W.; Li, X.; Hou, X.; Ren, Y.; Michailides, C.; Karimirad, M. Hydrodynamic and power performance of a V-shaped floating wind-wave integrated system based on multi-field coupling. Ocean Eng. 2026, 351, 124331. [Google Scholar] [CrossRef] [Scilit]
  6. Cai, Y.; Zhao, H.; Li, X.; Shi, W.; Xiao, Q. Developing an OpenFOAM solver for coupled aero-hydrodynamic analysis of integrated structure with floating offshore wind turbine and aquaculture net cage. Coast. Eng. 2025, 198, 104720. [Google Scholar] [CrossRef] [Scilit]
  7. Chen, M.; Chen, Y.; Li, T.; Tang, Y.; Ye, J.; Zhou, H.; Ouyang, M.; Zhang, X.; Shi, W.; Sun, X. Analysis of the wet-towing operation of a semi-submersible floating wind turbine using a single tugboat. Ocean Eng. 2024, 299, 117354. [Google Scholar] [CrossRef] [Scilit]
  8. Chen, M.; Tang, Y.; Ye, J.; Jiang, X.; Chen, Y.; Ren, Z.; Choo, Y.S. A constant parameter time-domain simulator for a tugboat with forward-speed dependent hydrodynamics and speed control. J. Mar. Eng. Technol. 2026, 25, 220–234. [Google Scholar] [CrossRef] [Scilit]
  9. Hu, L.; Shi, W.; Hu, W.; Chai, W.; Hu, Z.; Wu, J.; Li, X. Short-term prediction of mooring tension for floating offshore wind turbines under typhoon conditions based on the VMD-MI-LSTM method. Renew. Sustain. Energy Rev. 2025, 216, 115606. [Google Scholar] [CrossRef] [Scilit]
  10. Dong, W.; Zhou, L.; Ding, S.; Wang, A.; Cai, J. Two-staged method for ice channel identification based on image segmentation and corner point regression. China Ocean Eng. 2024, 38, 313–325. [Google Scholar] [CrossRef] [Scilit]
  11. Zhang, T.; Ma, C.; An, Y.; Ren, Z. Estimating semi-stationary sea states through wavelet-based adaptive segmentation of ship motions. Ocean Eng. 2026, 350, 124030. [Google Scholar] [CrossRef] [Scilit]
  12. Wei, M.; Zhang, J.; Sun, K.; Chea, C.P.; Zhang, X.; Liu, Z.; Jiang, F. Design, characterization, and simulation of a novel multi-stage inertial damper for wind turbine structural vibration control. Energy 2026, 347, 140407. [Google Scholar] [CrossRef] [Scilit]
  13. Jang, H.K.; Park, S.; Kim, M.H.; Kim, K.H.; Hong, K. Effects of heave plates on the global performance of a multi-unit floating offshore wind turbine. Renew. Energy 2019, 134, 526–537. [Google Scholar] [CrossRef] [Scilit]
  14. Takaki, M.; Lee, S. Hydrodynamic forces on submerged-plate heaving near a free surface. In Proceedings of the International Society of Offshore and Polar Engineers Conference, Honolulu, HI, USA, 25–30 May 2003. [Google Scholar]
  15. Tao, L.; Thiagarajan, K. Low KC flow regimes of oscillating sharp edges I: Vortex shedding observation. Appl. Ocean Res. 2003, 25, 21–35. [Google Scholar] [CrossRef] [Scilit]
  16. Tao, L.; Thiagarajan, K. Low KC flow regimes of oscillating sharp edges II: Hydrodynamic forces. Appl. Ocean Res. 2003, 25, 53–62. [Google Scholar] [CrossRef] [Scilit]
  17. Tao, L.; Dray, D. Hydrodynamic performance of solid and porous heave plates. Ocean Eng. 2008, 35, 1006–1014. [Google Scholar] [CrossRef] [Scilit]
  18. Li, J.; Liu, S.; Zhao, M.; Teng, B. Experimental investigation of the hydrodynamic characteristics of heave plates using forced oscillation. Ocean Eng. 2013, 66, 82–91. [Google Scholar] [CrossRef] [Scilit]
  19. Tian, X.; Tao, L.; Li, X.; Yang, J. Hydrodynamic coefficients of oscillating flat plates at 0.15 ≤ KC ≤ 3.15. J. Mar. Sci. Technol. 2017, 22, 101–113. [Google Scholar] [CrossRef] [Scilit]
  20. Ezoji, M.; Shabakhty, N.; Tao, L. Hydrodynamic damping of solid and perforated heave plates oscillating at low KC number based on experimental data: A review. Ocean Eng. 2022, 253, 111247. [Google Scholar] [CrossRef] [Scilit]
  21. Lopez-Pavon, C.; Souto-Iglesias, A. Hydrodynamic coefficients and pressure loads on heave plates for semi-submersible floating offshore wind turbines: A comparative analysis using large scale models. Renew. Energy 2015, 81, 864–881. [Google Scholar] [CrossRef] [Scilit]
  22. Medina-Manuel, A.; Botia-Vera, E.; Saettone, S.; Calderon-Sanchez, J.; Bulian, G.; Souto-Iglesias, A. Hydrodynamic coefficients from forced and decay heave motion tests of a scaled model of a column of a floating wind turbine equipped with a heave plate. Ocean Eng. 2022, 252, 110985. [Google Scholar] [CrossRef] [Scilit]
  23. Zhang, L.; Shi, W.; Zeng, Y.; Michailides, C.; Zheng, S.; Li, Y. Experimental investigation on the hydrodynamic effects of heave plates used in floating offshore wind turbines. Ocean Eng. 2023, 267, 113103. [Google Scholar] [CrossRef] [Scilit]
  24. Zhang, L.; Wang, Y.; Ren, Y.; Huang, X.; Lin, Z.; Shi, W. Vortex-induced damping of heave plates used for floating offshore wind turbines: Effects of free surface and seabed boundaries. Energy Convers. Manag. 2026, 356, 121372. [Google Scholar] [CrossRef] [Scilit]
  25. Han, S.Y.; Bouscasse, B.; Leroy, V.; Delacroix, S.; Gilloteaux, J.C.; Bonnefoy, F.; Le Touzé, D. Experimental study of hydrodynamic loads induced by the motion of a vertical circular cylinder with heave plates in proximity of the free surface. Ocean Eng. 2024, 310, 118712. [Google Scholar] [CrossRef] [Scilit]
  26. Han, S.Y.; Bouscasse, B.; Leroy, V.; Delacroix, S.; Bonnefoy, F.; Bachynski-Polić, E.E.; Le Touzé, D. Experimental study of wave diffraction loads on a vertical circular cylinder with heave plates at deep and shallow drafts. Ocean Eng. 2024, 312, 118970. [Google Scholar] [CrossRef] [Scilit]
  27. Wang, W.; Zhao, C.; Jia, P.; Lu, Z.; Xie, Y. Numerical simulation and experimental study on perforated heave plate of a DeepCwind floating wind turbine platform. Ships Offshore Struct. 2023, 18, 438–449. [Google Scholar] [CrossRef] [Scilit]
  28. Lei, W.; Chen, J.; Shao, Y.; Yu, X. CFD-assisted linearized frequency-domain analysis of motion and structural loads for floating structures with damping plates. Ocean Eng. 2023, 281, 114924. [Google Scholar] [CrossRef] [Scilit]
  29. Zhang, W.; Calderon-Sanchez, J.; Almeida-Medina, T.; Medina-Manuel, A.; Souto-Iglesias, A. Numerical analysis of forced heave oscillations for an FOWT column with a heave plate using overset mesh. Ocean Eng. 2025, 341, 122736. [Google Scholar] [CrossRef] [Scilit]
  30. Huang, H.; Liu, Q.; Iglesias, G.; Yue, M.; Miao, W.; Ye, Q.; Li, C.; Yang, T. A fully-coupled analysis of the spar-type floating offshore wind turbine with bionic fractal heave plate under wind-wave excitation conditions. Renew. Energy 2024, 232, 121088. [Google Scholar] [CrossRef] [Scilit]
  31. Liu, Y.; Liu, F.; Xiao, Q.; Zhou, L. The effect of inclination on vortex-induced vibration of a circular cylinder with a base column. Ocean Eng. 2020, 206, 107332. [Google Scholar] [CrossRef] [Scilit]
  32. Molin, B. On the added mass and damping of periodic arrays of fully or partially porous disks. J. Fluids Struct. 2001, 15, 275–290. [Google Scholar] [CrossRef] [Scilit]
  33. Tao, L.; Molin, B.; Scolan, Y.M.; Thiagarajan, K. Spacing effects on hydrodynamics of heave plates on offshore structures. J. Fluids Struct. 2007, 23, 1119–1136. [Google Scholar] [CrossRef] [Scilit]
  34. An, S.; Faltinsen, O.M. An experimental and numerical study of heave added mass and damping of horizontally submerged and perforated rectangular plates. J. Fluids Struct. 2013, 39, 87–101. [Google Scholar] [CrossRef] [Scilit]
  35. Brown, A.; Thomson, J.; Rusch, C. Hydrodynamic coefficients of heave plates, with application to wave energy conversion. IEEE J. Ocean. Eng. 2018, 43, 983–996. [Google Scholar] [CrossRef] [Scilit]
  36. Turner, M.; Wang, L.; Thiagarajan, K.; Robertson, A. Heave-plate hydrodynamic coefficients for floating offshore wind turbines: A compilation of data. In Proceedings of the ASME 2023 5th International Offshore Wind Technical Conference, Exeter, UK, 18–19 December 2023; American Society of Mechanical Engineers: New York, NY, USA, 2024; Volume 87578, p. V001T02A001. [Google Scholar] [CrossRef] [Scilit]
  37. Thiagarajan, K.; Moreno, J. Wave induced effects on the hydrodynamic coefficients of an oscillating heave plate in offshore wind turbines. J. Mar. Sci. Eng. 2020, 8, 622. [Google Scholar] [CrossRef] [Scilit]
  38. Rao, M.J.; Nallayarasu, S.; Bhattacharyya, S.K. Numerical and experimental studies of heave damping and added mass of spar with heave plates using forced oscillation. Appl. Ocean Res. 2021, 111, 102667. [Google Scholar] [CrossRef] [Scilit]
  39. Rao, M.J.; Nallayarasu, S.; Bhattacharyya, S.K. CFD approach to heave damping of spar with heave plates with experimental validation. Appl. Ocean Res. 2021, 108, 102517. [Google Scholar] [CrossRef] [Scilit]
  40. Pinguet, R.; Benoit, M.; Molin, B.; Rezende, F. CFD analysis of added mass, damping and induced flow of isolated and cylinder-mounted heave plates at various submergence depths using an overset mesh method. J. Fluids Struct. 2022, 109, 103442. [Google Scholar] [CrossRef] [Scilit]
  41. Mello, P.C.; Malta, E.B.; da Silva, R.O.P.; Candido, M.H.O.; do Carmo, L.H.S.; Alberto, I.F.; Franzini, G.R.; Simos, A.N.; Suzuki, H.; Gonçalves, R.T. Influence of heave plates on the dynamics of a floating offshore wind turbine in waves. J. Mar. Sci. Technol. 2021, 26, 190–200. [Google Scholar] [CrossRef] [Scilit]
  42. Yang, L.; Jiang, Y.; Guo, S.; Lin, Z.; Deng, W.; Liu, L. Research on the effect of a heave plate on the dynamics of the floating wind turbine using model tests. J. Mar. Sci. Eng. 2024, 12, 1808. [Google Scholar] [CrossRef] [Scilit]
  43. Zhao, H.; Wei, K.; Yang, W. Further study of heave plate designs for enhancing motion control of floating offshore wind turbines. Ocean Eng. 2025, 327, 121016. [Google Scholar] [CrossRef] [Scilit]
  44. Yang, Q.; Tang, X.; Wu, S.; Yu, M.; Xue, X.; Xie, J. Performance optimization of floating offshore wind turbine under extreme turbulent winds using dual circular heave-plate design. J. Mar. Sci. Appl. 2026, 1–15. [Google Scholar] [CrossRef] [Scilit]
  45. Bazher, S.A.; Chon, H.; Noh, J.; Oh, J.; Seo, D. Heave plate shape effects on the motion performance of 15 MW floating offshore wind turbine. Energies 2026, 19, 94. [Google Scholar] [CrossRef] [Scilit]
  46. Xu, H.; Jia, K.; Wang, E.; Xiao, Q.; Incecik, A. Effects of moonpools and heave plates on hydrodynamic performance of a barge-type floating offshore wind turbine platform in regular waves. Phys. Fluids 2025, 37, 087166. [Google Scholar] [CrossRef] [Scilit]
  47. Shi, W.; Fu, J.; Ren, Z.; Jiang, Z.; Wang, T.; Cui, L.; Li, X. Real-time hybrid model tests of floating offshore wind turbines: Status, challenges, and future trends. Appl. Ocean Res. 2023, 141, 103796. [Google Scholar] [CrossRef] [Scilit]
  48. Haider, R.; Shi, W.; Lin, Z.; Xiao, Q.; Zhang, W.; Li, X. Dynamic response of floating offshore wind turbine to focused wave excitation. Phys. Fluids 2025, 37, 082120. [Google Scholar] [CrossRef] [Scilit]
  49. Qin, M.; Wu, S.; Zhong, Y.; Shi, W.; Zheng, L.; Liu, X. Design and coupled dynamics analysis of a novel 15-MW semi-submersible floating wind platform for moderate depths. Acta Energiae Solaris Sin. 2026; accepted.
Figure 1. Schematic diagram of the floating offshore wind turbine: (a) Illustration model; (b) Floating platform.
Jmse 14 01563 g001
Figure 2. Experimental models: (a) Circular column (A1 model); (b) Circular column with hexagonal heave plate (A3 model).
Jmse 14 01563 g002
Figure 3. Wave tank: (a) Whole view of wave tank; (b) Position of the heave plate model in the wave tank.
Jmse 14 01563 g003aJmse 14 01563 g003b
Figure 4. Sensors and experimental arrangement: (a) Displacement sensor; (b) Six-component load cell; (c) Accelerometer; (d) Schematic diagram of the forced oscillation experimental setup for the inclined column–heave-plate model.
Jmse 14 01563 g004
Figure 5. Installation of the experimental model: (a) Vertical condition; (b) Pitch-inclined condition.
Jmse 14 01563 g005
Figure 6. Representative comparison between the measured and fitted hydrodynamic force: (a) Model A3 under heave, A = 20 mm, f = 1.0 Hz, and θ = 0°; (b) Model A3 under heave, A = 20 mm, f = 1.0 Hz, and θ = 10°; (c) Model A1 under heave, A = 10 mm, f = 0.71 Hz, and θ = 0°.
Jmse 14 01563 g006
Figure 7. Comparison of heave added mass and damping between the circular column models with and without the heave plate: (a) Heave added mass; (b) Heave damping.
Jmse 14 01563 g007
Figure 8. Comparison of nondimensionalized heave added mass and damping between the circular column models with and without the heave plate: (a) Heave added mass; (b) Heave damping.
Jmse 14 01563 g008
Figure 9. Comparison of surge added mass and damping between the circular column models with and without the heave plate: (a) Surge added mass; (b) Surge damping.
Jmse 14 01563 g009
Figure 10. Comparison of nondimensionalized surge added mass and damping between the circular column models with and without the heave plate: (a) Surge added mass; (b) Surge damping.
Jmse 14 01563 g010
Figure 11. Heave added mass of Model A3 under different inclination angles.
Jmse 14 01563 g011
Figure 12. Non-dimensional heave added mass coefficients and their relative differences under different inclination angles: (a) Coefficient at A = 10 mm; (b) Relative difference at A = 10 mm; (c) Coefficient at A = 20 mm; (d) Relative difference at A = 20 mm; (e) Coefficient at A = 30 mm; (f) Relative difference at A = 30 mm.
Jmse 14 01563 g012
Figure 13. Heave damping of Model A3 under different inclination angles.
Jmse 14 01563 g013
Figure 14. Variation in the non-dimensional heave damping coefficient and its relative difference under different inclination angles: (a) Coefficient at A = 10 mm; (b) Relative difference at A = 10 mm; (c) Coefficient at A = 20 mm; (d) Relative difference at A = 20 mm; (e) Coefficient at A = 30 mm; (f) Relative difference at A = 30 mm.
Jmse 14 01563 g014
Figure 15. Surge added mass of Model A3 under different inclination angles.
Jmse 14 01563 g015
Figure 16. Variation in the non-dimensional surge added mass coefficient and its relative difference under different inclination angles: (a) Coefficient at A = 20 mm; (b) Relative difference at A = 20 mm; (c) Coefficient at A = 40 mm; (d) Relative difference at A = 40 mm; (e) Coefficient at A = 80 mm; (f) Relative difference at A = 80 mm.
Jmse 14 01563 g016
Figure 17. Surge damping of Model A3 under different inclination angles.
Jmse 14 01563 g017
Figure 18. Variation in the non-dimensional surge damping coefficient and its relative difference under different inclination angles: (a) Coefficient at A = 20 mm; (b) Relative difference at A = 20 mm; (c) Coefficient at A = 40 mm; (d) Relative difference at A = 40 mm; (e) Coefficient at A = 80 mm; (f) Relative difference at A = 80 mm.
Jmse 14 01563 g018
Table 1. Principal dimensions of the prototype and scaled model.
ParameterUnitPrototypeModel
Central column diameterm10.000.1
Column diameter used for surge normalization D c m13.400.134
Column heightm28.750.2875
Heave plate diameterm28.000.28
Heave plate heightm6.250.0625
Pontoon diameterm14.000.14
Design water depthm600.6
Draftm200.2
Waterplane aream2141.020.0141
Equivalent heave plate diameter used for heave normalization D d m25.4 (Heave plate)/
13.4 (Column)
0.254 (Heave plate)/
0.134 (Column)
Model masskg/2.76 (A3 model)/
1.457 (A1 model)
Table 2. Main specifications of the measurement system.
InstrumentMeasured QuantityRangeAccuracySampling Frequency
Six-component load cellSix-directional force0–400 N 100 Hz
AccelerometerThree-directional acceleration10 g 100 Hz
Displacement sensorHeave/surge displacement0.2–1.0 m 100 Hz
Data-acquisition systemSynchronized data recording50–1 kHz0.3%100 Hz
Hexapod motion systemPrescribed forced motion Amplitude deviation within 1%
Table 3. Load case definition.
ModelMotionInclination (°)Amplitude (mm)Period (s)
Circular column (A1)Heave0100.6, 0.8, 1.0, 1.2, 1.4, 1.6
200.7, 0.8, 1.0, 1.2, 1.4, 1.6
300.8, 1.0, 1.2, 1.4, 1.6, 1.8
Surge0200.6, 0.8, 1.0, 1.2, 1.4, 1.6
400.7, 0.8, 1.0, 1.2, 1.4, 1.6
801.4, 1.8, 2.5
Circular column with hexagonal heave plate (A3)Heave0100.6, 0.7, 0.8, 0.9, 1.0, 1.1, 1.2, 1.3, 1.4, 1.5, 1.6
200.7, 0.8, 0.9, 1.0, 1.1, 1.2, 1.3, 1.4, 1.5, 1.6
300.8, 0.9, 1.0, 1.1, 1.2, 1.3, 1.4, 1.5, 1.6, 1.7, 1.8
5, 10100.6, 0.8, 1.0, 1.2, 1.4, 1.6
200.7, 0.8, 1.0, 1.2, 1.4, 1.6
300.8, 1.0, 1.2, 1.4, 1.6, 1.8
Surge0, 5, 10200.6, 0.8, 1.0, 1.2, 1.4, 1.6
400.7, 0.8, 1.0, 1.2, 1.4, 1.6
801.4, 1.8, 2.0, 2.5
Table 4. KC numbers β and Re for different models.
ModelMotionKCβRe
Circular column(A1)Heave0.453–1.40210,131–29,8065824–25,730
Surge0.93–3.757151–28,82711,655–47,721
Circular column with Hexagonal heave plate (A3)Heave0.25–0.7528,114–107,06211,757–49,441
Surge0.93–3.757151–28,82711,655–47,721
Table 5. Repeatability of representative forced oscillation cases.
ModelMotionInclination
(°)
Amplitude
(mm)
Period
(s)
Added Mass COV (%)Damping COV (%)R2 Range
Circular column with hexagonal heave plate(A3)Heave0201.00.6840.8910.991–0.998
10201.00.6780.7530.992–0.993
Surge0401.01.2460.8070.994–0.996
10401.01.4021.1840.996–0.999
Circular column (A1)Heave0101.48.2381.8950.942–0.944
Table 6. Statistics of relative variations in non-dimensional hydrodynamic coefficients.
IndicatorAverage Variation at 5° Relative to 0°Range at 5°Average Variation at 10° Relative to 0°Range at 10°
Non-dimensional heave added mass A 33 −4.3% −8.6% to −0.8% −5.9%−10.3% to −1.8%
Non-dimensional heave damping B 33 −7.1%−25.4% to 20.3%−6.8%−22.1% to 26.7%
Non-dimensional surge added mass A 11 −5.3%−14.4% to 8.5%−10.5%−24.8% to 2.5%
Non-dimensional surge damping B 11 −8.2%−69.5% to 120.3%−16.4%−83.0% to 75.5%
Disclaimer/Publisher’s Note: The statements, opinions and data contained in all publications are solely those of the individual author(s) and contributor(s) and not of MDPI and/or the editor(s). MDPI and/or the editor(s) disclaim responsibility for any injury to people or property resulting from any ideas, methods, instructions or products referred to in the content.