Article

Effects of Non-Uniform Hanging-Depth Layouts on Hydrodynamics and Mass Transport in Suspended Mussel Farms


1
College of Oceanography and Ecological Science, Shanghai Ocean University, Shanghai 201306, China
2
Engineering Technology Research Center of Marine Ranching, Shanghai Ocean University, Shanghai 201306, China
3
Key Laboratory of Marine Ecological Monitoring and Restoration Technologies, Ministry of Nature Resources, Shanghai 200137, China
*
Authors to whom correspondence should be addressed.
J. Mar. Sci. Eng. 2026, 14(15), 1418; https://doi.org/10.3390/jmse14151418
Submission received: 6 July 2026 / Revised: 24 July 2026 / Accepted: 29 July 2026 / Published: 1 August 2026
(This article belongs to the Section Ocean Engineering)

Abstract

In suspended mussel farms, culture-layer food supply can be limited, whereas the 4–8 m subsurface layer is rich in particulate organic matter and seston. Using a representative aquaculture block off Gouqi Island, China, this study examined the hydrodynamic and transport effects of non-uniform hanging-depth layouts. The 0° uniform-depth layout was the reference. Five configurations were modeled: V-shaped, inverted V-shaped, uniform-depth (90° inflow), V-shaped (extended), and inverted V-shaped (extended). Flume PIV validated the model. Simulations used uniform and measured velocity-profile inflows, with and without density stratification; a passive tracer tracked seston-rich water from the 4–8 m layer. Uniform-depth hanging formed a low-velocity zone in the sleeve layer, limiting water exchange. Non-uniform layouts altered drag distribution and promoted tracer redistribution into overlying 3–5 m waters. In the V-shaped configuration, water was guided upward along sleeve bottoms in the downstream half of the aquaculture block (S2), where pronounced redistribution within the aquaculture block resulted in a tracer concentration of approximately 0.1362 in the 2–3 m layer. Stratification constrained upward spreading, whereas extended configurations may limit food replenishment through enhanced upper-layer blockage and filtering effects. Low-Richardson-number regions corresponded with tracer uplift and enhanced spreading, indicating local shear. Overall, the V-shaped configuration balanced in-farm replenishment, downstream transport, and flow maintenance without additional sleeve length.

1. Introduction

Marine aquaculture has considerable potential to contribute to future global food security by meeting the growing demand for sustainable protein. Shellfish and other low-trophic-level organisms are particularly important components of marine food production [1,2,3]. In recent years, as nearshore marine aquaculture has expanded, increasing attention has been paid to the interactions between aquaculture facilities and the surrounding hydrodynamic environment [4,5]. Large-scale suspended aquaculture facilities can modify local flow structures and water-exchange processes and may further affect nutrient cycling, the source–sink dynamics of particulate organic food, and the ecological carrying capacity of aquaculture waters [6,7,8,9]. China is one of the world’s major shellfish-producing countries, where suspended shellfish aquaculture is widely practiced in coastal waters [10,11,12,13].
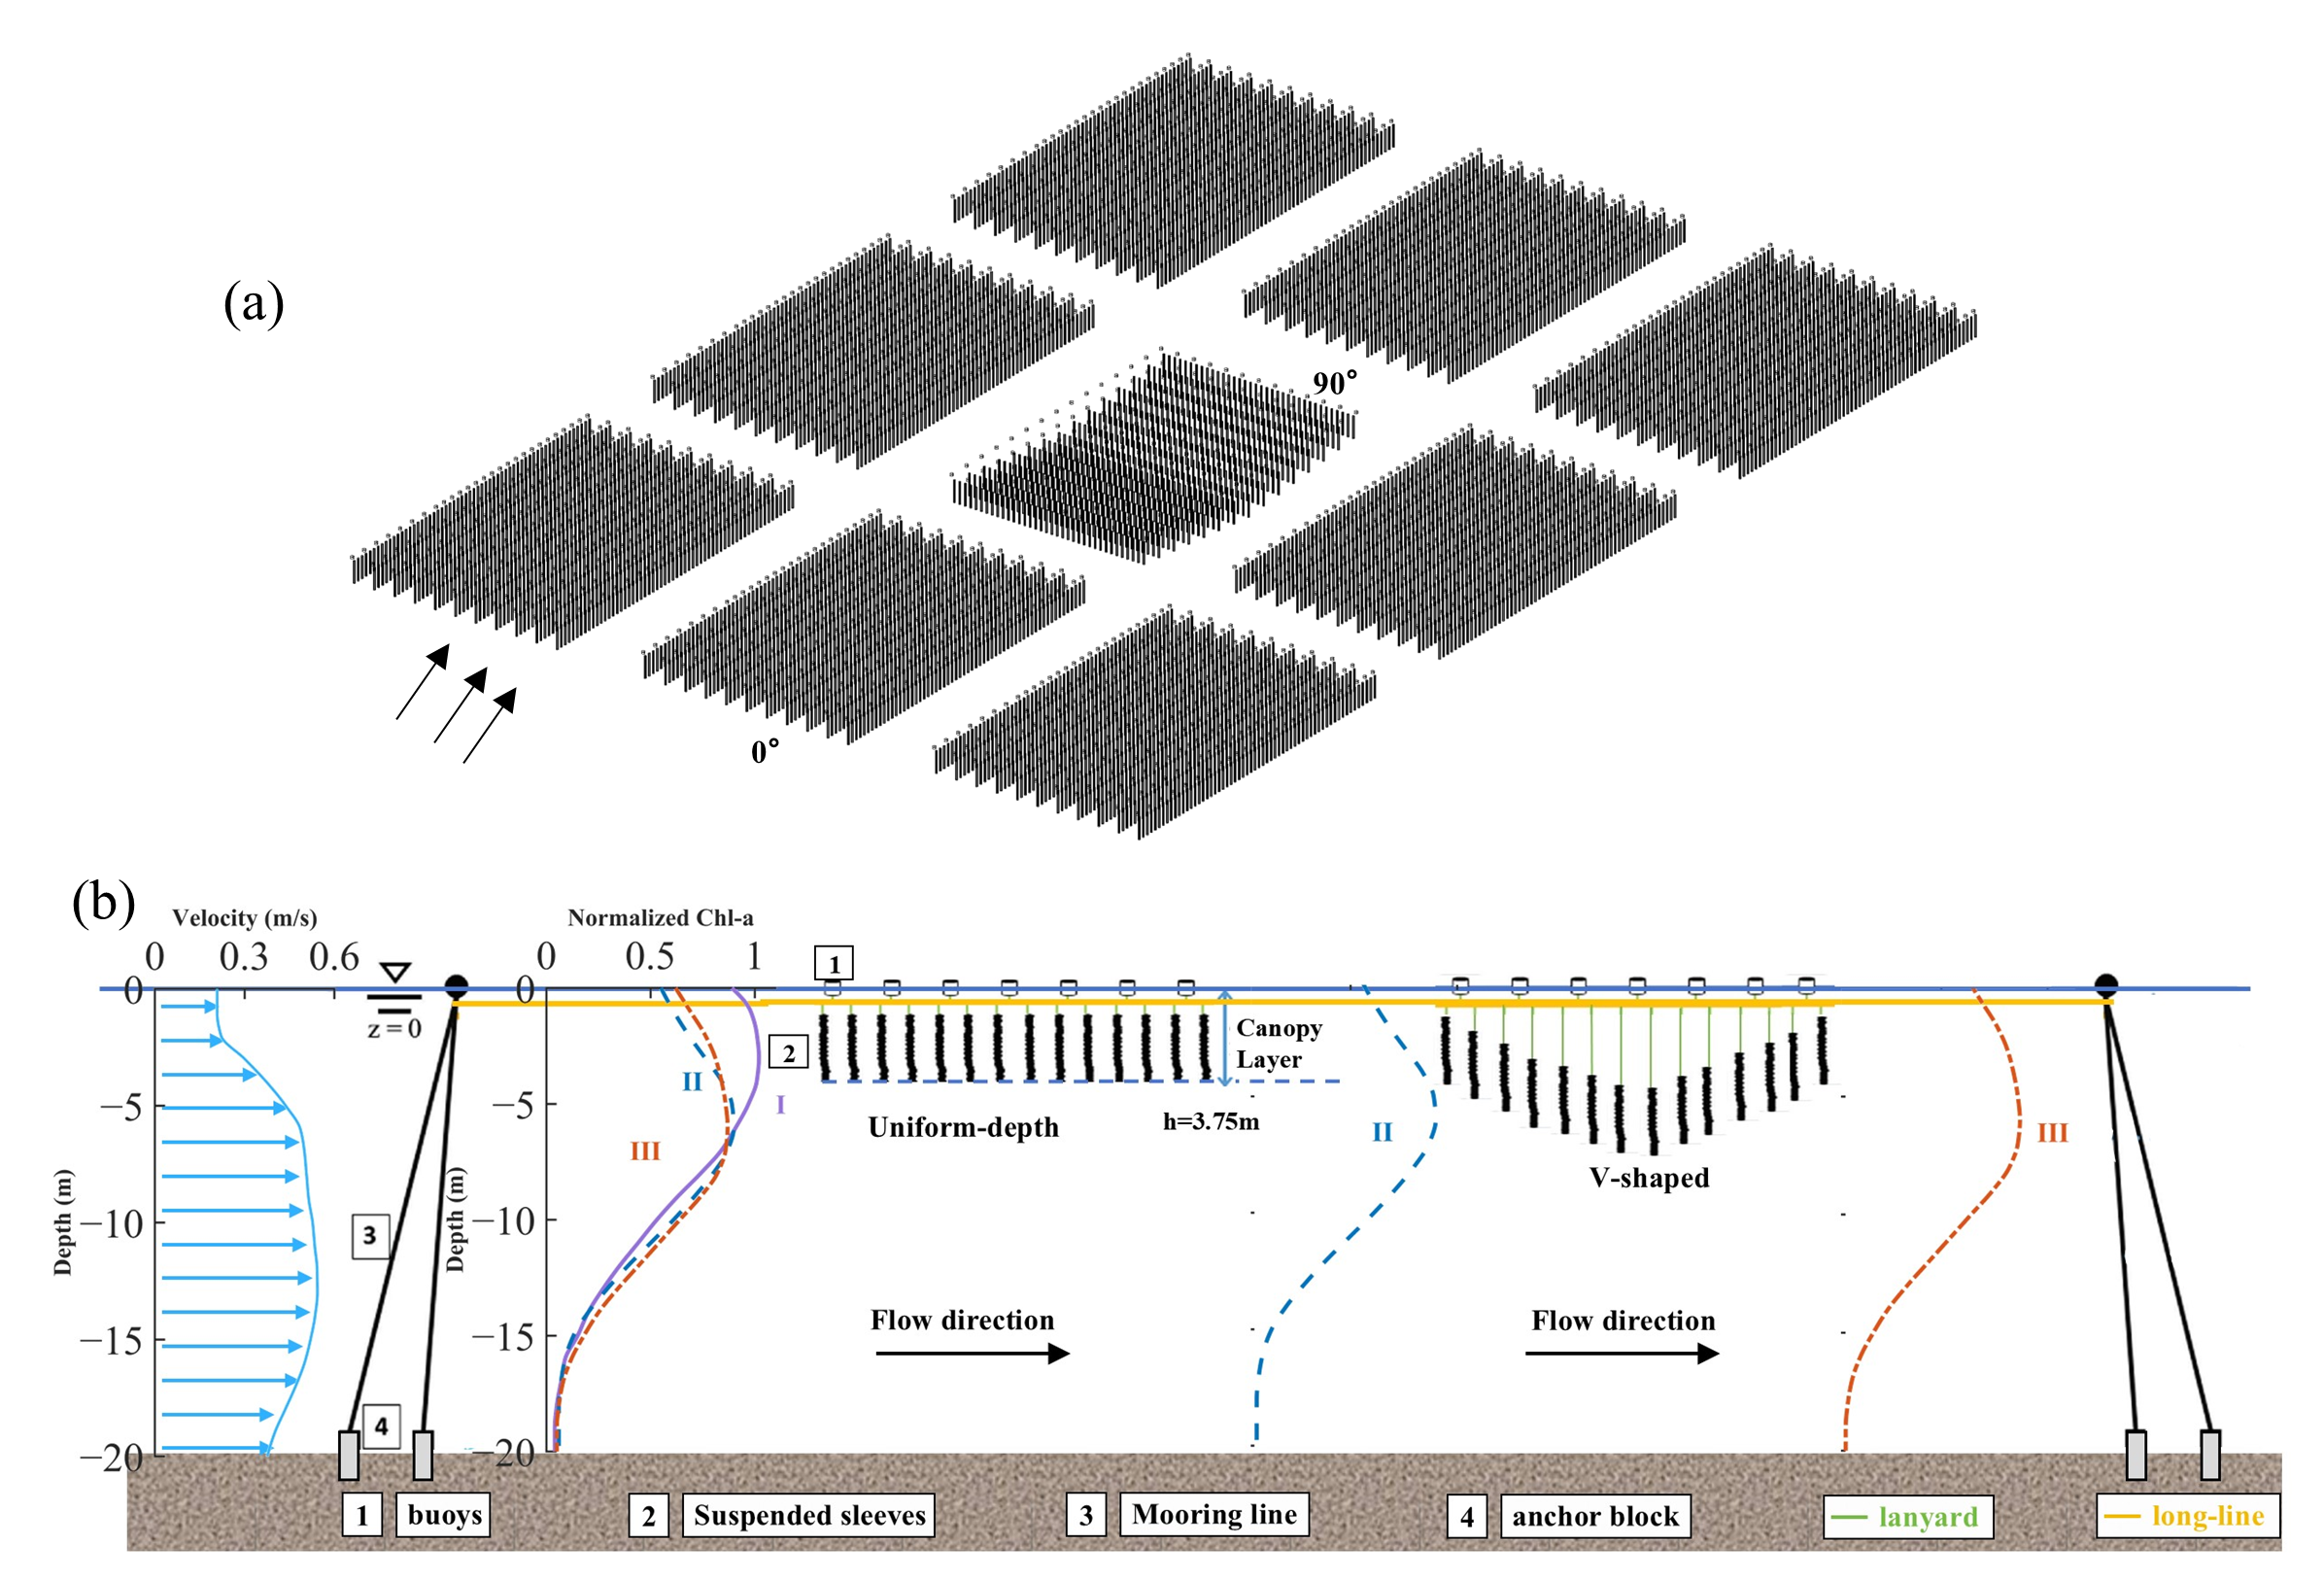
The waters off Gouqi Island, Zhejiang Province, China, are among the country’s important suspended mussel farming areas, characterized by large farming scales and hydrodynamic conditions typical of suspended mussel farms [10,14]. Mussel sleeves are typically suspended in the near-surface water column by buoys and longlines. Together with associated facilities, they form a distinct suspended canopy drag structure in the upper part of the farm [15] (Figure 1). As farm area and mussel-sleeve density increase, the flow-blocking effects of buoys, longlines, and mussel sleeves become more pronounced, potentially reducing current velocities and water exchange within the farm and modifying local flow structures [7,10,16,17,18,19,20]. The hydrodynamic and mass-transport effects of suspended mussel aquaculture facilities are closely related to the spatial distribution of drag they exert [9]. Drag exerted by the suspended canopy reduces current velocities and forms shear layers near canopy boundaries, thereby promoting the exchange of momentum and scalars between the interior and exterior of the canopy [21]. Under seasonally density-stratified conditions, interactions between canopy shear flow and vertical density gradients become more complex. Stratification suppresses vertical mixing, whereas canopy-induced shear and turbulence can promote vertical mixing and transport [22]. High-density shellfish aquaculture facilities can exhibit porous-medium-like flow-blocking characteristics, causing flow diversion, deceleration, wake dispersion, and shear mixing within the farm [23,24,25]. These processes can affect phytoplankton growth, the deposition and resuspension of organic detritus, and the transport, mixing, and associated biogeochemical processes of mussel metabolic products [16,26,27]. At a more general level, theoretical studies of idealized immersed-body systems have shown that hydrodynamic forces and resistance can be affected by relative spacing, body-size ratio, oscillatory motion, frequency, and prescribed surface boundary conditions [28,29]. Although these simplified systems differ from suspended mussel farms, they further highlight the importance of geometric arrangement and structural-motion assumptions when evaluating flow through densely distributed suspended structures. Mussel sleeves in suspended farms are primarily distributed within the upper culture layer. The combined effects of mussel filtration and flow blockage by aquaculture facilities can further restrict the replenishment of particulate organic food within this layer [18,30]. Observations have shown that, during spring and summer stratified conditions, peak chlorophyll-a concentrations within the farm commonly occur in mid-depth waters below 5 m, whereas concentrations in the overlying culture layer are relatively low [16,31]. This suggests that, under natural hydrodynamic conditions, seston-rich subsurface waters cannot effectively replenish the near-surface culture layer occupied by mussels.
Existing studies on hydrodynamic regulation in suspended mussel farms have primarily focused on the flow-blocking effects and configuration of aquaculture facilities, with particular attention to how facility density, culture-line spacing, incident-flow angle, longline arrangement, and farm planform layout affect current reduction, water exchange, and mass transport [32,33,34,35]. Adjusting row and line spacing or optimizing the planform layout of a farm can, to some extent, improve flow pathways and internal water exchange conditions [36,37]. However, under conventional uniform-depth hanging configurations, mussel sleeves generally extend to the same depth, readily forming a relatively continuous flow-blocking layer within a specific water-depth range. As water passes through the culture array, the flow tends to bypass it along paths of lower resistance, while flow exchange among different layers within the array and wake-induced disturbances remain relatively limited. Meanwhile, during the spring–summer stratified season, the euphotic depth in the farm area is approximately twice the hanging depth, allowing relatively high phytoplankton biomass to persist at depths of 4–8 m. Therefore, in addition to optimizing culture-line spacing and arrangement at the horizontal scale, adjusting hanging depths to regulate the vertical drag distribution within the mussel sleeve array and promote material exchange between the culture layer and the underlying high-biomass water layer represents another effective approach to improving aquaculture efficiency.
Non-uniform hanging-depth layouts provide a new approach for optimizing the hydrodynamic environment of suspended mussel farms. The main novelty of this study lies in treating the vertical distribution of sleeve hanging depths as an explicit design variable, rather than focusing only on horizontal spacing, cultivation density, or farm planform arrangement. Unlike conventional uniform-depth hanging, they vary the hanging depths of mussel sleeves at different positions, dispersing the vertical drag distribution of the farm structures and creating velocity differences and local pressure gradients among sleeves at different depths. These changes can affect wake disturbances behind the sleeve array and interlayer mass exchange. This approach does not require additional energy input; instead, it regulates the local flow field through geometric reconfiguration of the farm structures, showing potential as a passive hydrodynamic control strategy. In a broader context, model-based prediction and optimization are increasingly used to support the design and management of marine systems under complex operational constraints. For example, Meng et al. developed a constraint-embedded model predictive control framework for the real-time trajectory planning of unmanned surface vehicles, illustrating the broader value of numerical modelling and optimization in modern marine-system design and management [38].
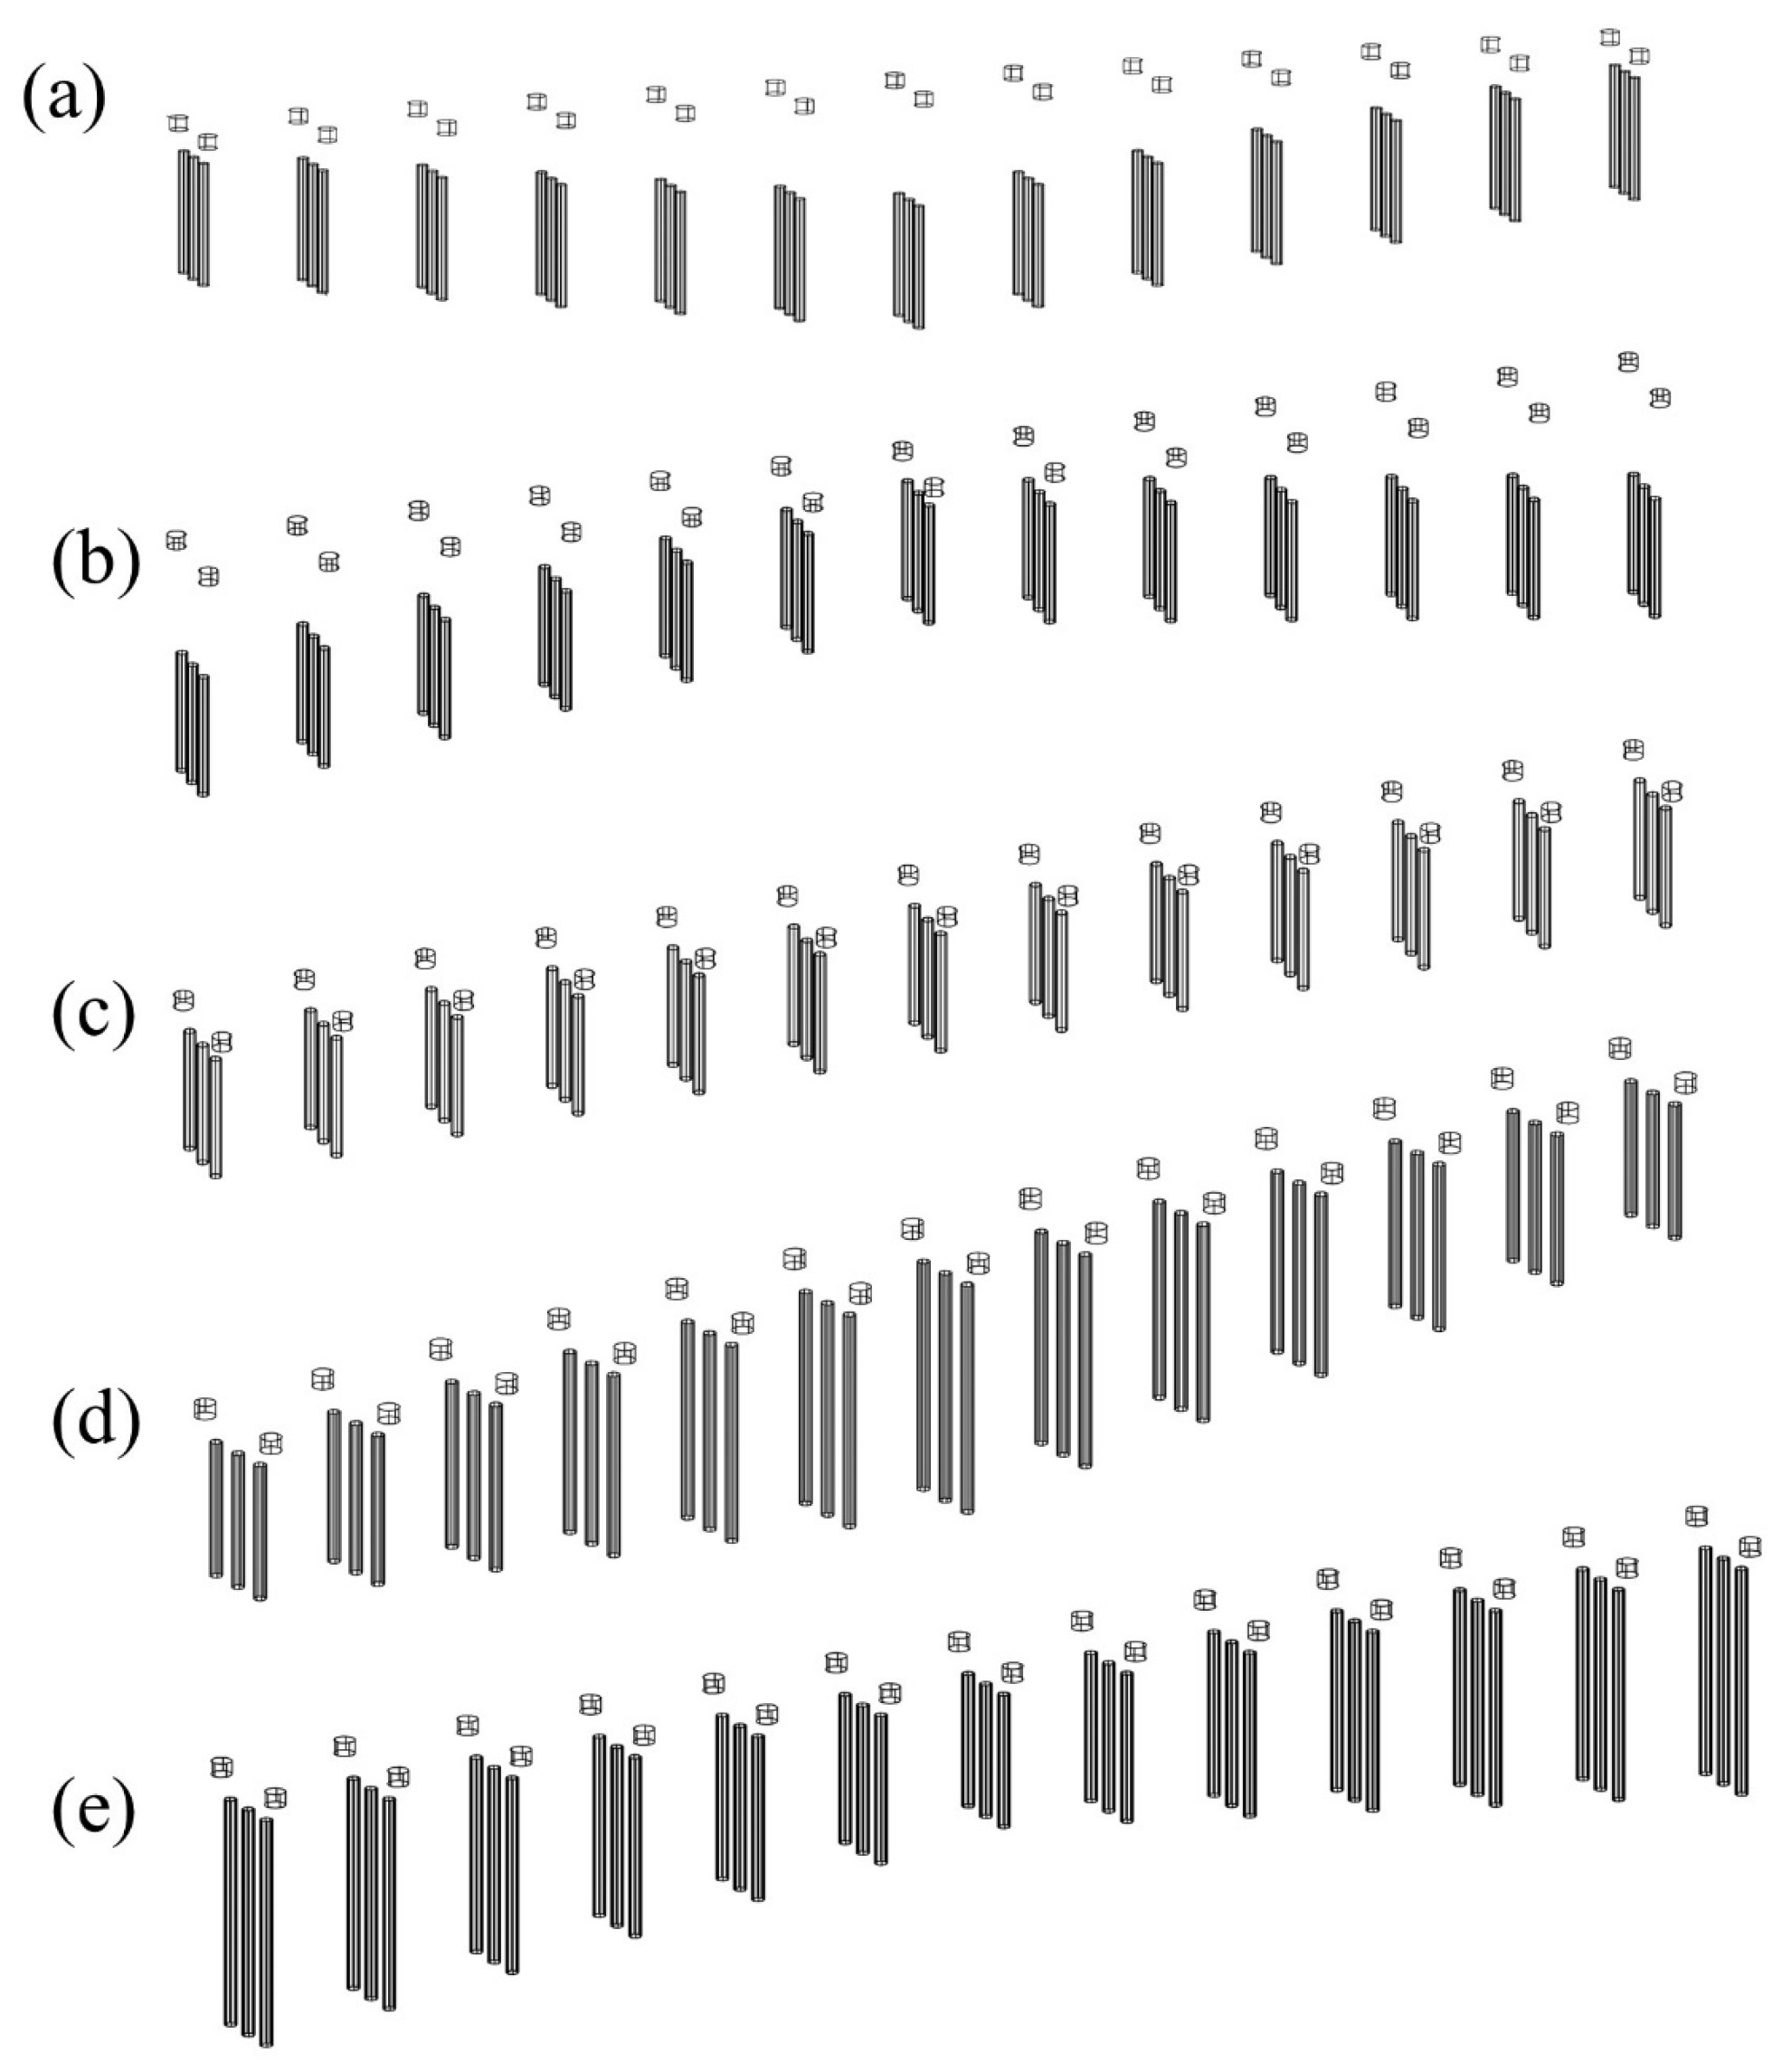
To address the hydrodynamic and transport limitations associated with conventional uniform-depth hanging layouts, this study used a representative aquaculture block within a suspended mussel farm off Gouqi Island as the study system. We hypothesized that non-uniform hanging-depth layouts would redistribute canopy drag, alter wake structures and local shear, and promote the upward redistribution of subsurface water into the upper culture layers. The existing uniform-depth hanging layout at a 0° inflow angle was included as a reference scheme, and three-dimensional numerical models were developed for five sleeve-hanging configurations: V-shaped, inverted V-shaped, uniform-depth (90° inflow angle), V-shaped (extended), and inverted V-shaped (extended) (Figure 2). Uniform and measured velocity-profile inflow conditions were considered, each with and without density stratification. Tracer transport was compared among the different hanging schemes within the farm, in the downstream region without aquaculture facilities, and across different water layers to investigate the effects of non-uniform hanging-depth layouts on local in-farm transport and the maintenance of downstream transport. The results provide a basis for optimizing hanging layouts and improving water exchange in suspended mussel farms.

2. Materials and Methods

2.1. Physical Model

The waters off Gouqi Island, Shengsi County, Zhejiang Province, China, are among the representative areas for suspended mussel farming in China, where farm structures are deployed at a large scale and in a regular arrangement. To illustrate the design concept of the non-uniform hanging-depth layouts and the vertical configuration of the farm structures, a schematic diagram is presented in Figure 1. Based on field surveys, a typical aquaculture block within a suspended mussel farm in this area covers approximately 4800 m2 (80 m × 60 m) and is located in water approximately 20 m deep. The geometric parameters used in the physical model, including the sleeve length, sleeve density, row spacing, and overall arrangement, were derived from field investigation of the suspended mussel farm off Gouqi Island and from the local farming configuration reported in previous work [32]. Therefore, the model geometry represents the typical high-density mussel sleeve arrangement considered in the study area, rather than an arbitrarily prescribed farm configuration. The components of the farm structures were appropriately simplified in the geometric model. Buoys were represented as cylinders with a diameter of 0.45 m and a height of 0.30 m, with a submergence depth of 0.30 m. Mussel sleeves were represented as cylindrical structures with a diameter of 0.25 m and a length of 3.00 m. To facilitate mesh generation, the cross sections of the sleeves were approximated as regular octagons. The streamwise, transverse, and vertical directions were defined as the x-, y-, and z-axes, respectively.
To examine the effects of non-uniform hanging-depth layouts on hydrodynamics and mass transport within the farm, five sleeve-hanging configurations were established based on the baseline idealized aquaculture-block model: V-shaped (Figure 2a), inverted V-shaped (Figure 2b), uniform-depth (Figure 2c), V-shaped (extended) (Figure 2d), and inverted V-shaped (extended) (Figure 2e). All five configurations contained 13 rows of suspended sleeves, with a streamwise spacing of 3.0 m between adjacent rows and a transverse spacing of 0.80 m between adjacent columns. The configurations differed primarily in the streamwise variation in sleeve lower-end depth and sleeve length.
The five configurations were selected to provide a controlled and practically feasible comparison of representative vertical drag distributions under the 90° inflow-oriented arrangement, rather than to exhaustively search all possible geometric layouts. Relative to the existing uniform-depth layout with a 0° inflow angle, the proposed 90° arrangement allows the incoming flow to encounter a smaller streamwise spacing between mussel sleeve rows. Within this framework, the V-shaped and inverted V-shaped configurations represent two opposite streamwise variations in hanging depth, whereas the uniform-depth configuration serves as an equal-depth control under the same 90° inflow-oriented arrangement. The two extended configurations were included to examine whether increased vertical sleeve coverage could further enhance tracer redistribution. Therefore, these configurations cover the main contrasting modes of vertical drag arrangement considered in this study.
In the uniform-depth configuration, all rows of mussel sleeves had the same length and lower-end depth, forming a uniform hanging structure. In the V-shaped and inverted V-shaped configurations, all sleeves were 3.0 m long, and non-uniform hanging depths were achieved by varying their suspension depths. In the V-shaped configuration, the lower-end depths of the sleeves gradually increased from both ends toward the center of the array. The lower-end depths of the first seven rows ranged from 3.75 to 5.85 m below the water surface, while the remaining six rows were arranged symmetrically with respect to the first six rows. In contrast, in the inverted V-shaped configuration, the lower-end depths gradually decreased from both ends toward the center. In the V-shaped (extended) configuration, sleeves were shorter at both ends and longer near the center, whereas the opposite pattern was used in the inverted V-shaped (extended) configuration, with longer sleeves at both ends and shorter sleeves near the center. Flow structures and tracer transport characteristics were compared across the five hanging configurations to evaluate the effects of different non-uniform hanging-depth layouts on the hydrodynamic environment and mass transport processes within the farm.

2.2. Numerical Modeling Method

2.2.1. Governing Equations and Turbulence Model

A three-dimensional numerical model was developed using the computational fluid dynamics software ANSYS Fluent 2023 R1 to simulate flow structures and mass transport processes in suspended mussel farms under different sleeve-hanging configurations. The model was based on the continuity and momentum equations for incompressible flow, together with the energy equation to describe flow processes under temperature-induced density stratification. Given the pronounced unsteady disturbances and wake structures around the aquaculture facilities, large eddy simulation (LES) was adopted to resolve turbulent flow characteristics in the vicinity of the sleeve array [15,32,39,40]. Compared with RANS, which primarily represents the time-averaged effects of turbulence, LES can resolve the dominant unsteady large-scale eddies associated with wake interactions, flow separation, and shear-layer development. Although DES can also resolve separated turbulent structures, its transition between the RANS and LES regions requires careful grid-dependent treatment. Therefore, LES was selected to provide a consistent representation of the dominant unsteady turbulent structures throughout the densely arranged sleeve array. The kinetic-energy transport subgrid-scale model implemented in ANSYS Fluent was used to represent unresolved turbulent motions associated with flow separation, wake interactions, and shear-layer development around the mussel sleeve array. This model solves an additional transport equation for the subgrid-scale kinetic energy. A passive tracer was introduced to represent mass transport in the water column [41], and its concentration distribution was calculated using the species transport model [40] to evaluate the effects of different hanging configurations on mass transport and redistribution.

2.2.2. Computational Domain, Mesh, and Boundary Conditions

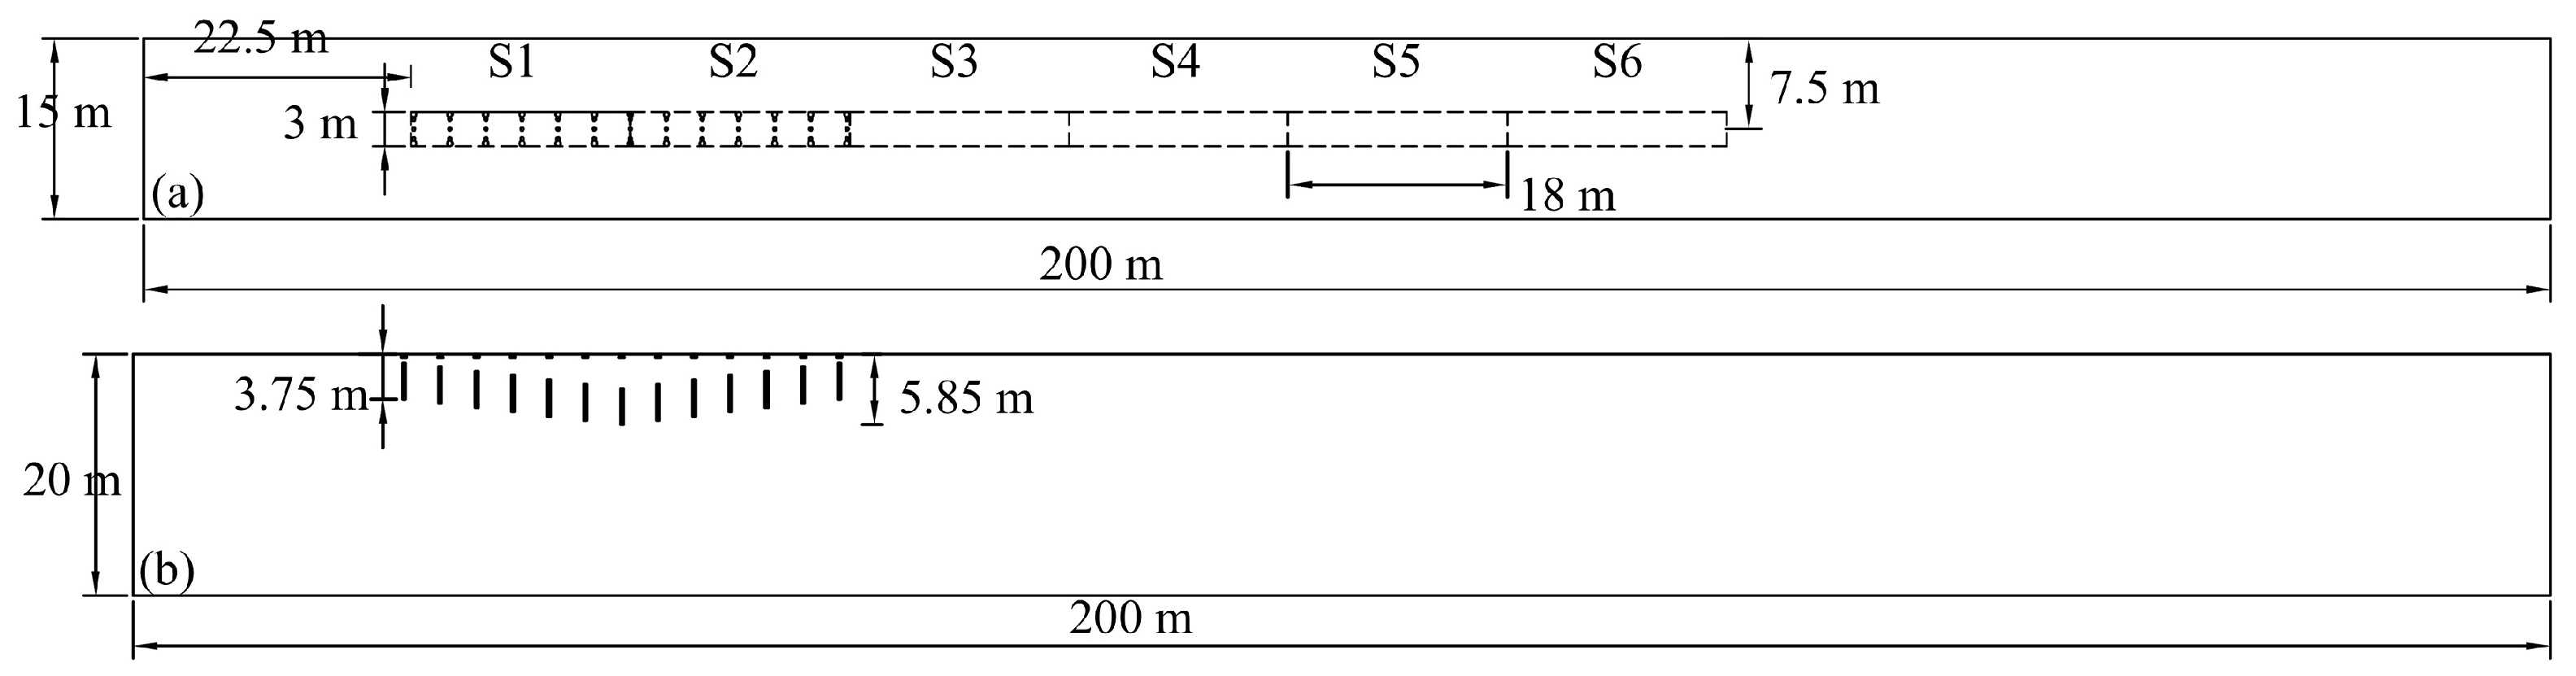
To simulate aquaculture facilities in an open-water environment, the computational domain was set to 200 m × 15 m × 20 m (length × width × height). The computational domain size was determined according to the spatial extent of the simplified mussel-sleeve array and the downstream wake region to be resolved. A transverse width of 15 m was adopted so that the lateral symmetry boundaries were separated from the main sleeve array and statistical regions, thereby reducing their influence on the in-farm flow structure and tracer redistribution. The outlet boundary was placed sufficiently far downstream of the mussel-sleeve array to avoid direct effects of the outflow condition on the hydrodynamic structure within the aquaculture block and the near-field wake region.
Strong velocity gradients and complex vortical structures were expected around the farm structures. Therefore, the mesh was locally refined around the aquaculture model and its surrounding region to ensure computational accuracy. Mesh generation was performed using the Meshing module in ANSYS Workbench 2023 R1. Given the geometric complexity of the model, the computational domain was discretized using an unstructured tetrahedral mesh. A representative V-shaped case with a prescribed uniform inflow velocity of 0.5 m s−1 and without density stratification was selected for the mesh-sensitivity analysis. Three mesh resolutions containing approximately 1.0, 2.0, and 4.0 million cells were examined. The volume-averaged tracer concentrations in the 3–4 m depth layer of the S1 and S2 statistical regions, as defined in Section 2.2.3, were selected as evaluation metrics. For the 1.0, 2.0, and 4.0 million-cell meshes, the tracer concentrations were 0.1952, 0.1139, and 0.1171 in S1, and 0.3571, 0.1822, and 0.1808 in S2, respectively. Taking the 4.0 million-cell mesh as the reference, the relative differences obtained with the 2.0 million-cell mesh were 2.73% for S1 and 0.77% for S2. These results indicate that further mesh refinement beyond approximately 2.0 million cells had only a limited influence on the evaluated tracer-transport results. Accordingly, meshes containing approximately 2.0 million cells were adopted for the subsequent simulations. For the adopted mesh resolution, the minimum and maximum element sizes were 0.08 and 0.8 m, respectively. Minor variations in the total cell number occurred among the different hanging-depth configurations owing to geometric differences. The same meshing strategy was applied to all 13 cases to maintain consistent spatial resolution for inter-case comparisons.
The bottom boundary and all solid surfaces, including the farm structures, were assigned no-slip wall boundary conditions, whereas the lateral boundaries and the top boundary were specified as symmetry boundaries.
Two types of inlet boundary conditions were adopted to represent flow characteristics within the farm under different hydrodynamic environments. The uniform velocity-inlet condition was used to simulate typical tidal-current conditions for aquaculture blocks located at the periphery of the farming area. The upstream velocity was uniform over the water depth and set to 0.5 m s−1, whereas the downstream boundary was also specified as a velocity inlet with a streamwise velocity of −0.5 m s−1 to maintain a prescribed uniform through-flow.
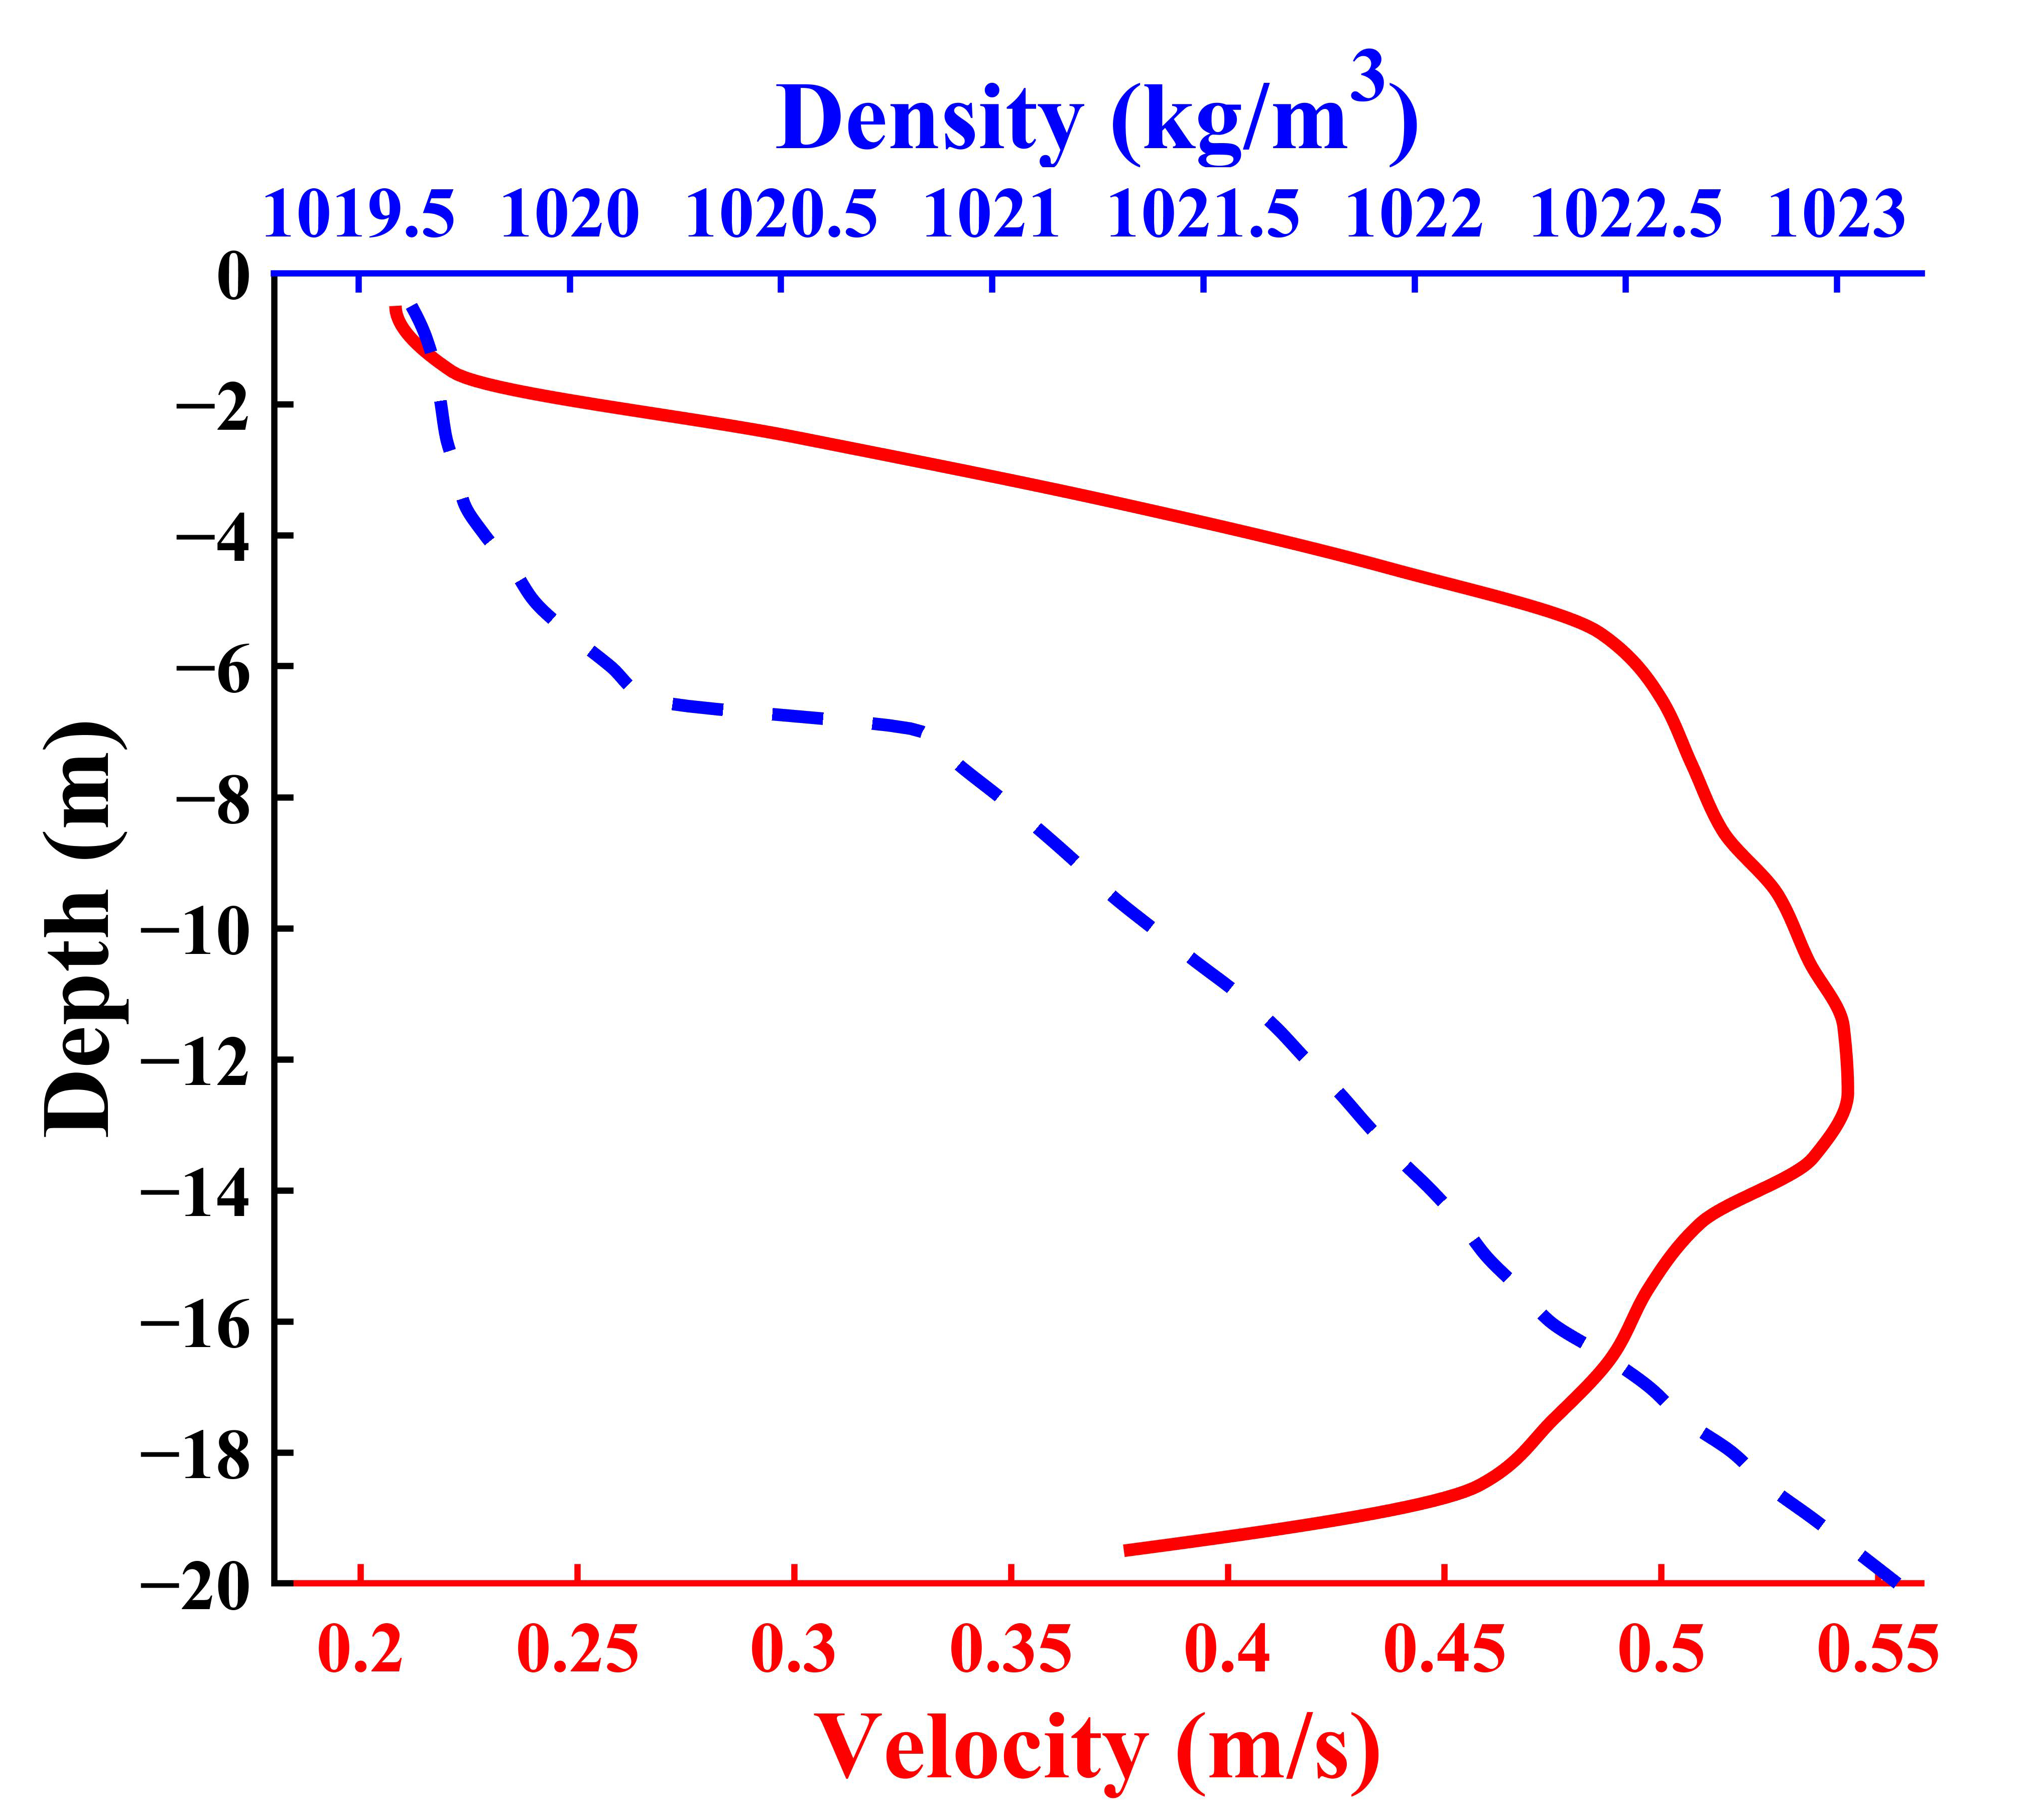
The measured velocity-profile inlet condition was used to simulate vertically non-uniform flow fields within the farm, in which surface velocities were substantially reduced by the cumulative flow-blocking effects of upstream buoys, longlines, and mussel sleeves. The measured velocity profile and density-stratification characteristics are shown in Figure 3. The observed ADCP (Signature500, Nortek AS, Rud, Norway) velocity profile and CTD-derived temperature and density profiles (SBE 19plus, Sea-Bird Electronics, Bellevue, WA, USA) were imposed at the inlet using a user-defined function (UDF), and the corresponding stratified background field was initialized. In the stratified cases, density stratification was therefore prescribed according to the measured vertical temperature and density profiles rather than generated dynamically through surface heating, cooling, or tidal mixing processes. This approach allowed the influence of the observed background stratification to be incorporated into the comparative simulations, while maintaining consistent geometry and boundary conditions among the different hanging-depth configurations. For these cases, a pressure-outlet boundary condition was applied at the downstream boundary. Under both inlet conditions, comparison cases with and without density stratification were established. Based on the inlet condition, the numerical simulations were organized into two groups comprising 13 cases in total, as summarized in Table 1. Case 0 represents the existing uniform-depth hanging layout under the uniform velocity-inlet condition without density stratification and at a 0° inflow angle; it was included as a reference case for comparison with the five proposed sleeve-hanging configurations.
A time-step size of 0.1 s was used for all transient simulations. Each simulation was continued for at least one characteristic flow-through time of the computational domain to allow the imposed inflow conditions and associated wake structures to develop throughout the domain. The uniform-inflow cases were simulated for 650 s, and the instantaneous results from 600 to 650 s were time-averaged for all quantitative analyses. The measured velocity-profile cases were simulated for 1000 s, and the corresponding results from 950 to 1000 s were time-averaged.

2.2.3. Definition of Tracer Release Zone, Statistical Regions, and Vertical Layers

To simulate tracer transport within and downstream of the aquaculture block, a tracer release zone was specified near the inlet of the computational domain. The release zone extended from 4 to 8 m below the water surface and had a transverse width equal to that of the aquaculture block. At the beginning of each simulation, the tracer concentration throughout the computational domain was initialized to 0. At the inlet, the tracer concentration in the release zone was set to 1, while that in the remaining inlet water layers was set to 0. This tracer boundary condition was imposed continuously throughout the simulation. Therefore, the simulated tracer concentration represents the relative transport intensity of water originating from the 4–8 m layer rather than measured seston concentration or actual food availability. Particle settling and biological processes, including mussel filtration, biological uptake, and phytoplankton growth, were not considered in the present model.
S1 and S2 were defined as the upstream and downstream statistical regions within the aquaculture block, respectively. S3 and S4 were located in the near-field wake region extending one block length downstream of the mussel sleeves. S5 and S6 were located in the downstream wake region, with a total length equal to that of S1–S2 and S3–S4. Each statistical region had a transverse width of 3 m.
To analyze the distribution of tracer concentrations across different water layers, each statistical region was divided into ten 1 m-thick layers over the 0–10 m depth range below the water surface. The tracer concentration in each layer was represented by its volume-averaged value and used to compare the vertical distribution and downstream evolution of tracer transport under different hydrodynamic conditions and hanging configurations (Figure 4).

3. PIV Flume Experiments and Numerical Model Validation

3.1. Experimental Setup

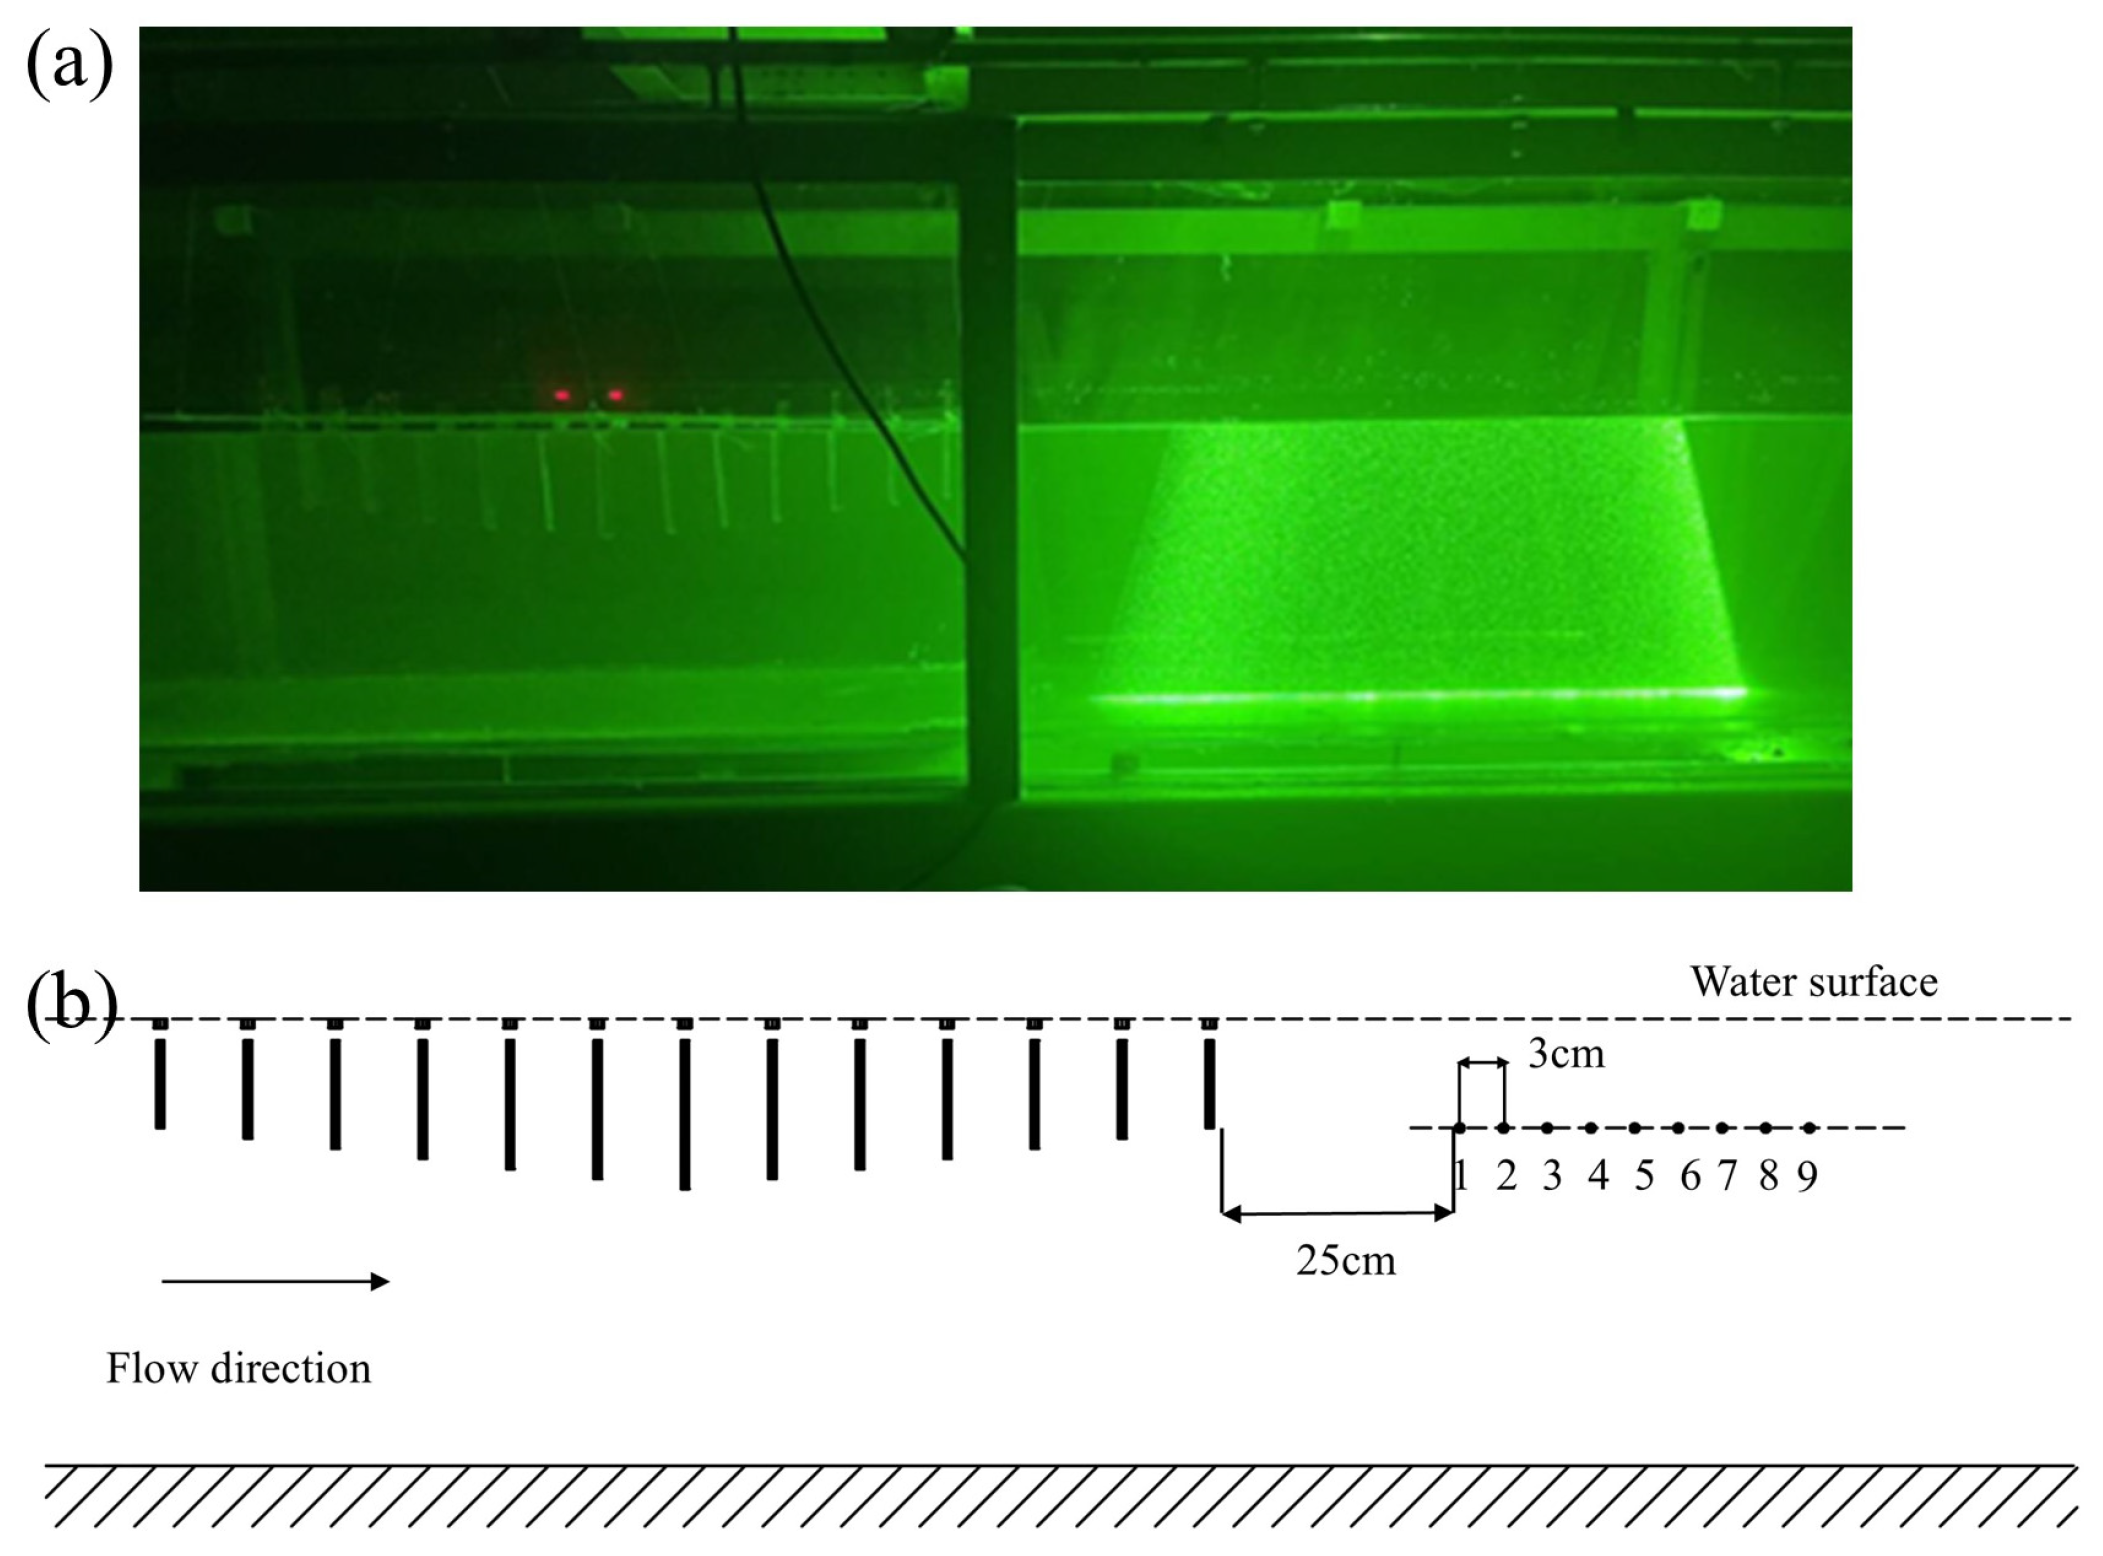
Flow-field validation experiments were conducted in a U-shaped recirculating flume at the Hydrodynamics Laboratory of Shanghai Ocean University. The facility consists of two parallel straight channels connected by a semicircular bend. The straight test section is 6.0 m long and 0.45 m wide, with a maximum water depth of 0.55 m. The bend consists of concentric semicircular channels with inner and outer radii of 0.53 m and 0.98 m, respectively. To validate the effects of sleeve arrays with different hanging depths on the local flow field, the experimental model appropriately simplified the actual sleeve structure and did not include auxiliary components such as raft frames and buoys.
The experimental model was designed based on the Froude similarity criterion. Considering both the prototype sleeve dimensions and the dimensions of the experimental flume, the geometric scale factor was set to λ L = 50 . The sleeve models were fabricated from transparent acrylic to minimize optical obstruction during particle image velocimetry (PIV) data acquisition. Based on this geometric scale, the sleeves were represented in the physical model as equivalent cylinders with a characteristic diameter of 5 mm. A V-shaped non-uniform hanging-depth arrangement was adopted for the experiment. The sleeve array consisted of 13 rows. The lower-end depths of the first seven rows below the water surface were set to 7.50, 8.20, 8.90, 9.60, 10.30, 11.00, and 11.70 cm, respectively, while the remaining six rows were arranged symmetrically about the central row. This layout formed a V-shaped hanging structure, with shallower sleeves at both ends and deeper sleeves near the center, to examine the effects of varying sleeve depths on the local flow field.
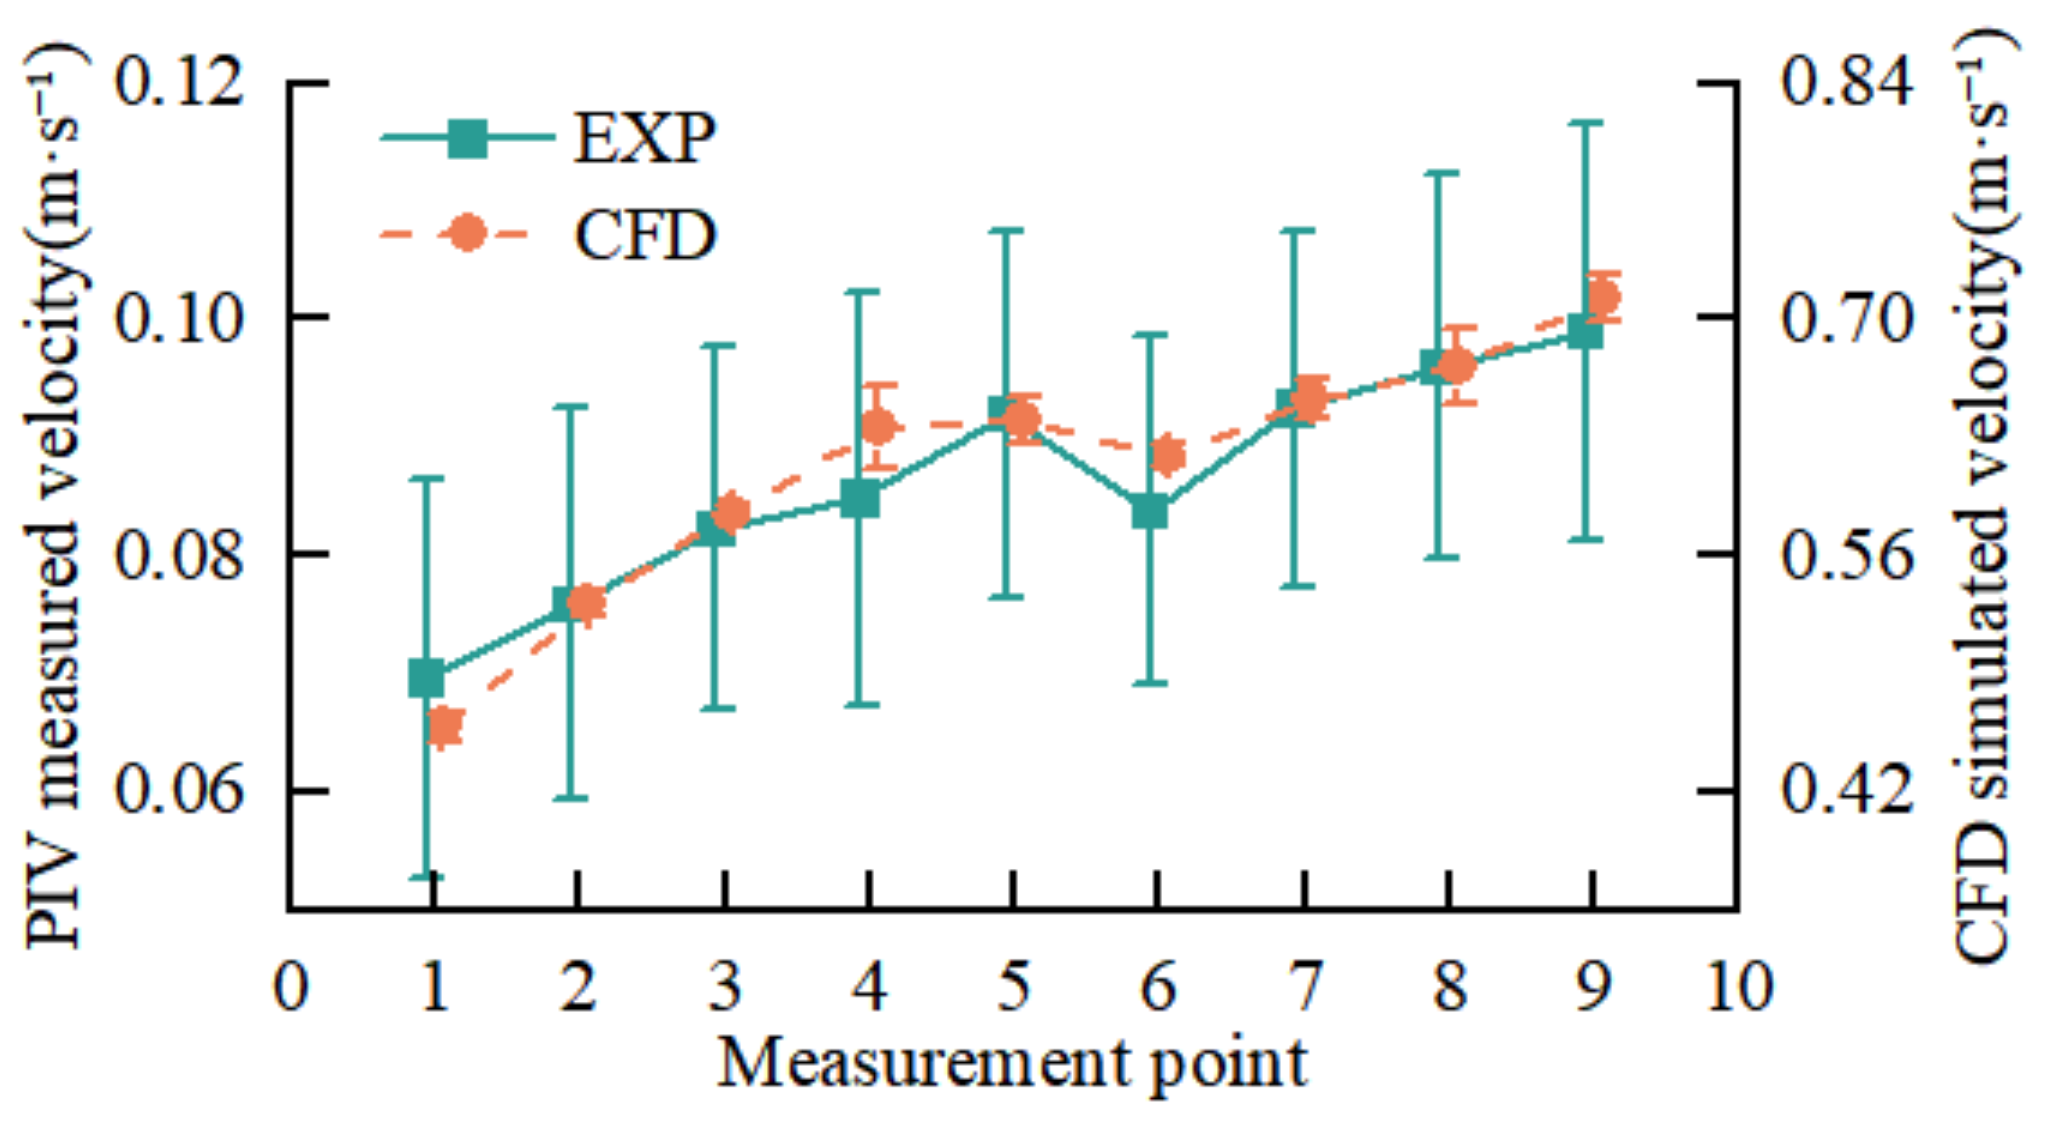
The experimental model was positioned 1.20 m downstream of the flume inlet and centered laterally within the channel. According to Froude similarity, the inflow velocity in the flume experiment was set to 0.14 m s−1, whereas the inlet velocity in the CFD simulation was set to 1.0 m s−1. Flow-field measurements were conducted using particle image velocimetry (PIV), with polyvinyl chloride (PVC) particles with a diameter of 50 μm used as tracers. The PIV flume experiment was conducted as a single independent physical validation run (n = 1), rather than a repeated statistical experiment. During this run, velocity fields were obtained from a time sequence of PIV images, and the reported velocities represent time-averaged values over the sampling period. For both the PIV measurements and CFD simulations, the mean velocity and temporal standard deviation at each sampling point were calculated from the corresponding velocity time series over their respective monitoring periods. These standard deviations represent temporal velocity fluctuations rather than variability among independent physical replicates. The PIV measurement plane was located at the central vertical plane of the sleeve array to obtain the two-dimensional velocity field around the non-uniform hanging-depth sleeve array (Figure 5). To validate the numerical model, velocity measurements obtained from the flume experiments were compared with the corresponding numerical results. The validation was conducted along a velocity sampling line located in the central vertical plane of the sleeve array. Nine sampling points were arranged along this line at intervals of 3 cm. Differences between the experimental and simulated velocities at these points were used to evaluate the accuracy of the numerical model in reproducing the local flow structure under the V-shaped non-uniform hanging-depth configuration.

3.2. Numerical Model Validation

A representative sampling line downstream of the sleeve array was selected in the central vertical plane of the model, corresponding to the PIV measurement plane shown in Figure 5, to validate the numerical model. Figure 6 compares the velocities obtained from the nine sampling points along this line. Overall, the numerical simulations and flume experiments showed consistent trends. Both indicated that flow velocity, after being attenuated by the mussel sleeves in the wake region, increased along the streamwise direction and was accompanied by localized fluctuations. The PIV results showed a local decrease in velocity between sampling points 5 and 6, while the CFD simulations exhibited a corresponding reduction at the same location, indicating that the model could capture localized flow disturbances induced by the sleeve structures. The PIV-measured velocities were converted to the prototype scale according to Froude similarity. The root mean square error (RMSE) between the converted PIV velocities and the CFD-simulated velocities at the nine sampling points was 0.02 m s−1, and the mean relative error was 2.57%, indicating good agreement between the experimental measurements and numerical results. Taken together, these results indicate that the numerical model reasonably reproduced the mean velocity distribution and localized flow variations near the sleeve array under the experimental conditions. Because independent physical replicate experiments were not conducted, variability among physical replicates and replicate-based confidence intervals could not be calculated. Therefore, the PIV flume experiment should be regarded as a representative validation case for evaluating the performance of the LES model under the experimental conditions. Despite this limitation, the agreement between the PIV measurements and CFD simulations was considered sufficient for the subsequent comparative analyses of flow structures and tracer transport under different hanging configurations. Future studies should include independent replicate PIV experiments to further quantify experimental variability and uncertainty.

4. Results

4.1. Flow Structures Under Different Hanging Configurations

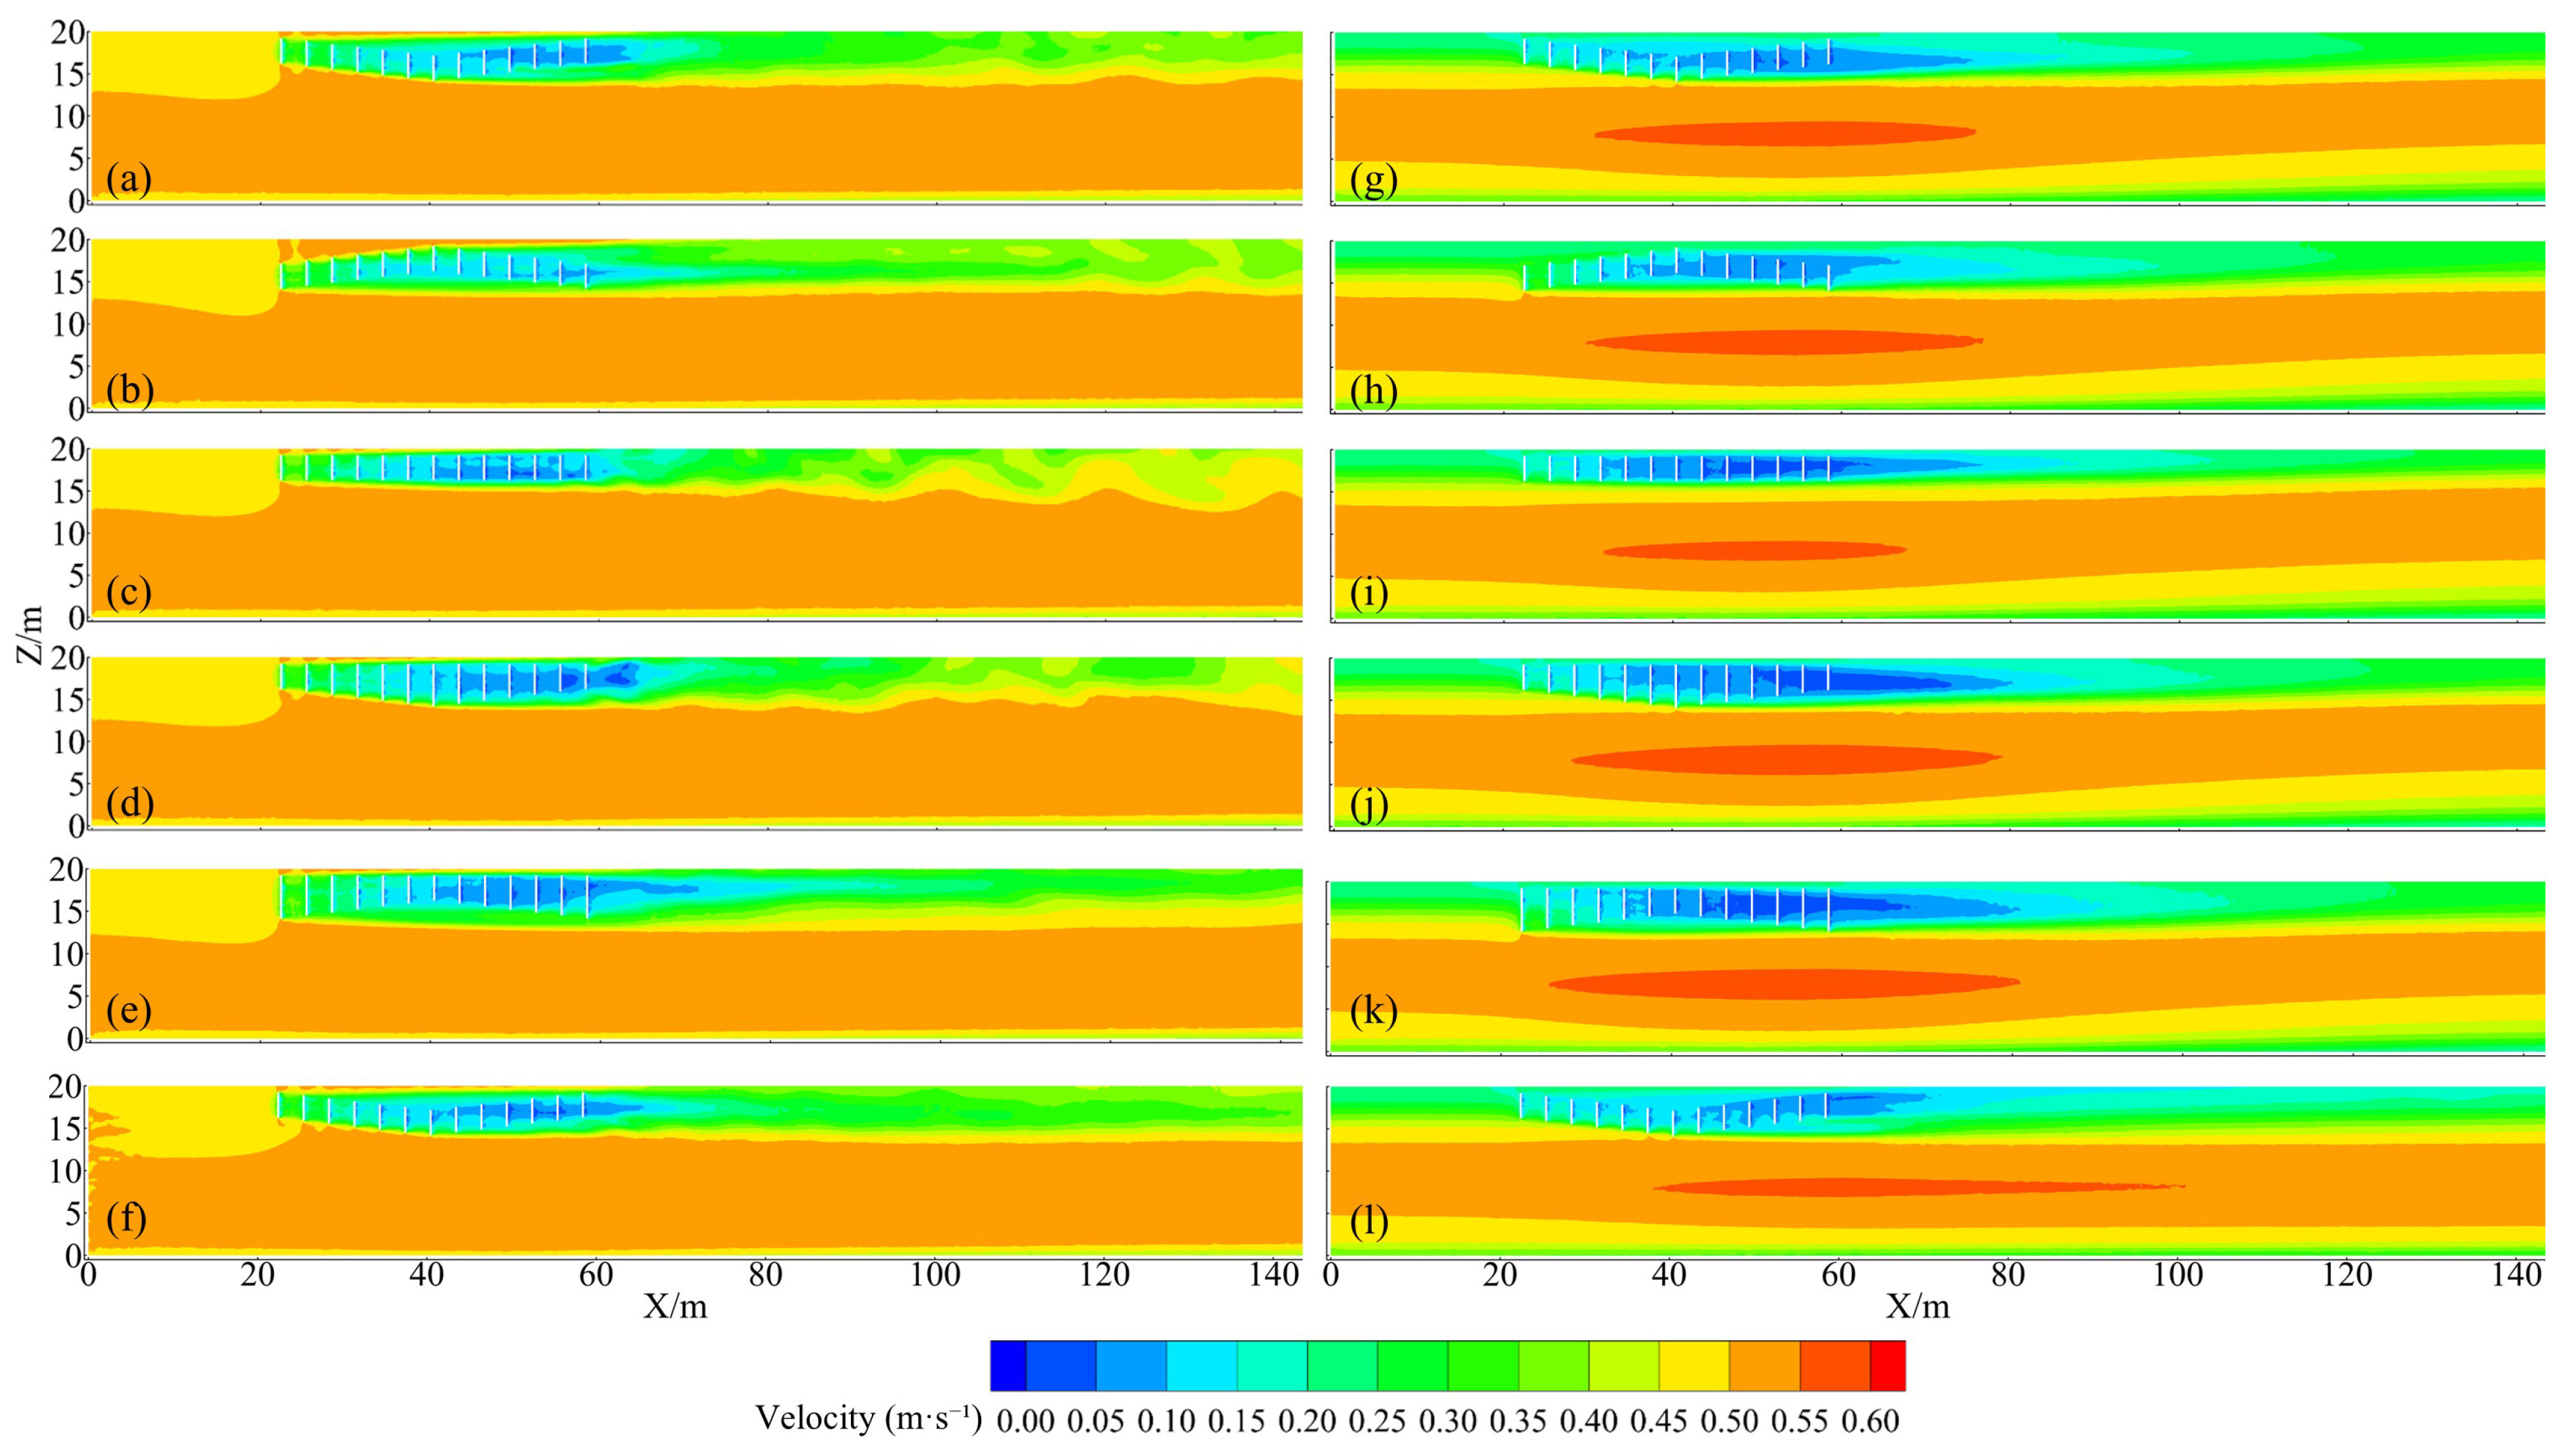
Under different hydrodynamic conditions and hanging configurations, the mussel sleeve array altered the velocity distribution both within and downstream of the farm, generating low-velocity wake regions of varying extent behind the sleeves (Figure 7). Overall, the flow-blocking effect of the mussel sleeves was mainly confined to the cultured layer and the adjacent water layers, whereas the deeper water beneath the sleeves retained relatively high velocities and was less affected by the hanging configuration.
Under uniform inflow without density stratification (Figure 7a–e), the five hanging configurations exhibited clear differences in velocity distribution. Under the V-shaped configuration, the low-velocity region extended continuously downstream behind the mussel sleeve array, with a noticeably undulating wake boundary, indicating stronger flow deflection and localized disturbances. Under the inverted V-shaped configuration, the low-velocity region was mainly concentrated near the sleeve array and within the middle and upper water layers, with a relatively shorter downstream extent and more pronounced localized flow-blocking effects. The uniform-depth configuration formed a relatively continuous low-velocity band within the water layer occupied by the mussel sleeves. The low-velocity region extended steadily through S3 and S4 in the horizontal direction, with a relatively smooth wake boundary. However, a more pronounced velocity recovery was observed in S5 and S6 owing to the relatively shallow hanging depth (Figure 7c; Case 3). By simultaneously varying sleeve lengths and lower-end depths, the extended configurations further enhanced local drag differences among rows. In particular, the V-shaped (extended) configuration produced a more distinct low-velocity core downstream of the array, whereas the low-velocity region under the inverted V-shaped (extended) configuration was more concentrated within the array and the near-field wake region.
With density stratification (Figure 7f; Case 6), wake fluctuations under the V-shaped configuration were markedly weakened, and the boundary between the high- and low-velocity regions became straighter. Compared with uniform inflow without stratification (Figure 7a; Case 1), the vertical expansion of the low-velocity wake was constrained under stratified conditions. This indicates that stable stratification suppresses the vertical disturbances and wake spreading induced by flow blockage from the mussel sleeves, causing velocity variations to be more confined to the water layer occupied by the sleeves and the adjacent regions.
Under the measured velocity-profile inlet condition with density stratification (Figure 7g–k), the flow field exhibited a more stable vertically stratified structure. Under the combined effects of the inlet velocity profile and density stratification, the high-velocity region in the middle and lower water layers remained relatively stable, whereas the low-velocity wake behind the mussel sleeve array was mainly confined to the upper and middle water layers. Its vertical extent was markedly smaller than that under uniform inflow without stratification. Differences among the hanging configurations were still evident. Both the V-shaped and inverted V-shaped configurations modified the local velocity structure downstream of the mussel sleeves, although wake disturbances were substantially weaker than those under uniform inflow. In the uniform-depth configuration, the low-velocity region was continuously distributed along the water layer occupied by the mussel sleeves. The extended configurations produced more pronounced localized low-velocity regions in the middle and upper water layers, indicating that increasing sleeve length further enhanced the in-farm flow-blocking effect. Compared with the measured velocity-profile inlet condition without stratification (Figure 7l; Case 12), the wake boundary was smoother under stratified conditions (Figure 7g; Case 7), further indicating that density stratification weakened the vertical disturbances and wake spreading induced by the mussel sleeve array.
Overall, the five hanging configurations primarily regulated flow attenuation and wake recovery in the upper and middle water layers by altering the vertical distribution of drag exerted by the mussel sleeves. The V-shaped configuration produced low-velocity wakes with stronger streamwise continuity, whereas the inverted V-shaped configuration generated more concentrated localized deceleration zones in the middle and upper water layers. The uniform-depth configuration exhibited comparatively gradual wake recovery. By varying sleeve lengths and associated lower-end depths among rows, the V-shaped (extended) and inverted V-shaped (extended) configurations further increased local differences in drag and produced more pronounced low-velocity regions in the middle and upper water layers under both hydrodynamic conditions. These differences in velocity distribution provide the hydrodynamic basis for subsequent differences in tracer distribution and vertical mass transport among the hanging configurations.

4.2. Effects of Different Hanging Configurations on Material Transport

4.2.1. Overall Transport Patterns

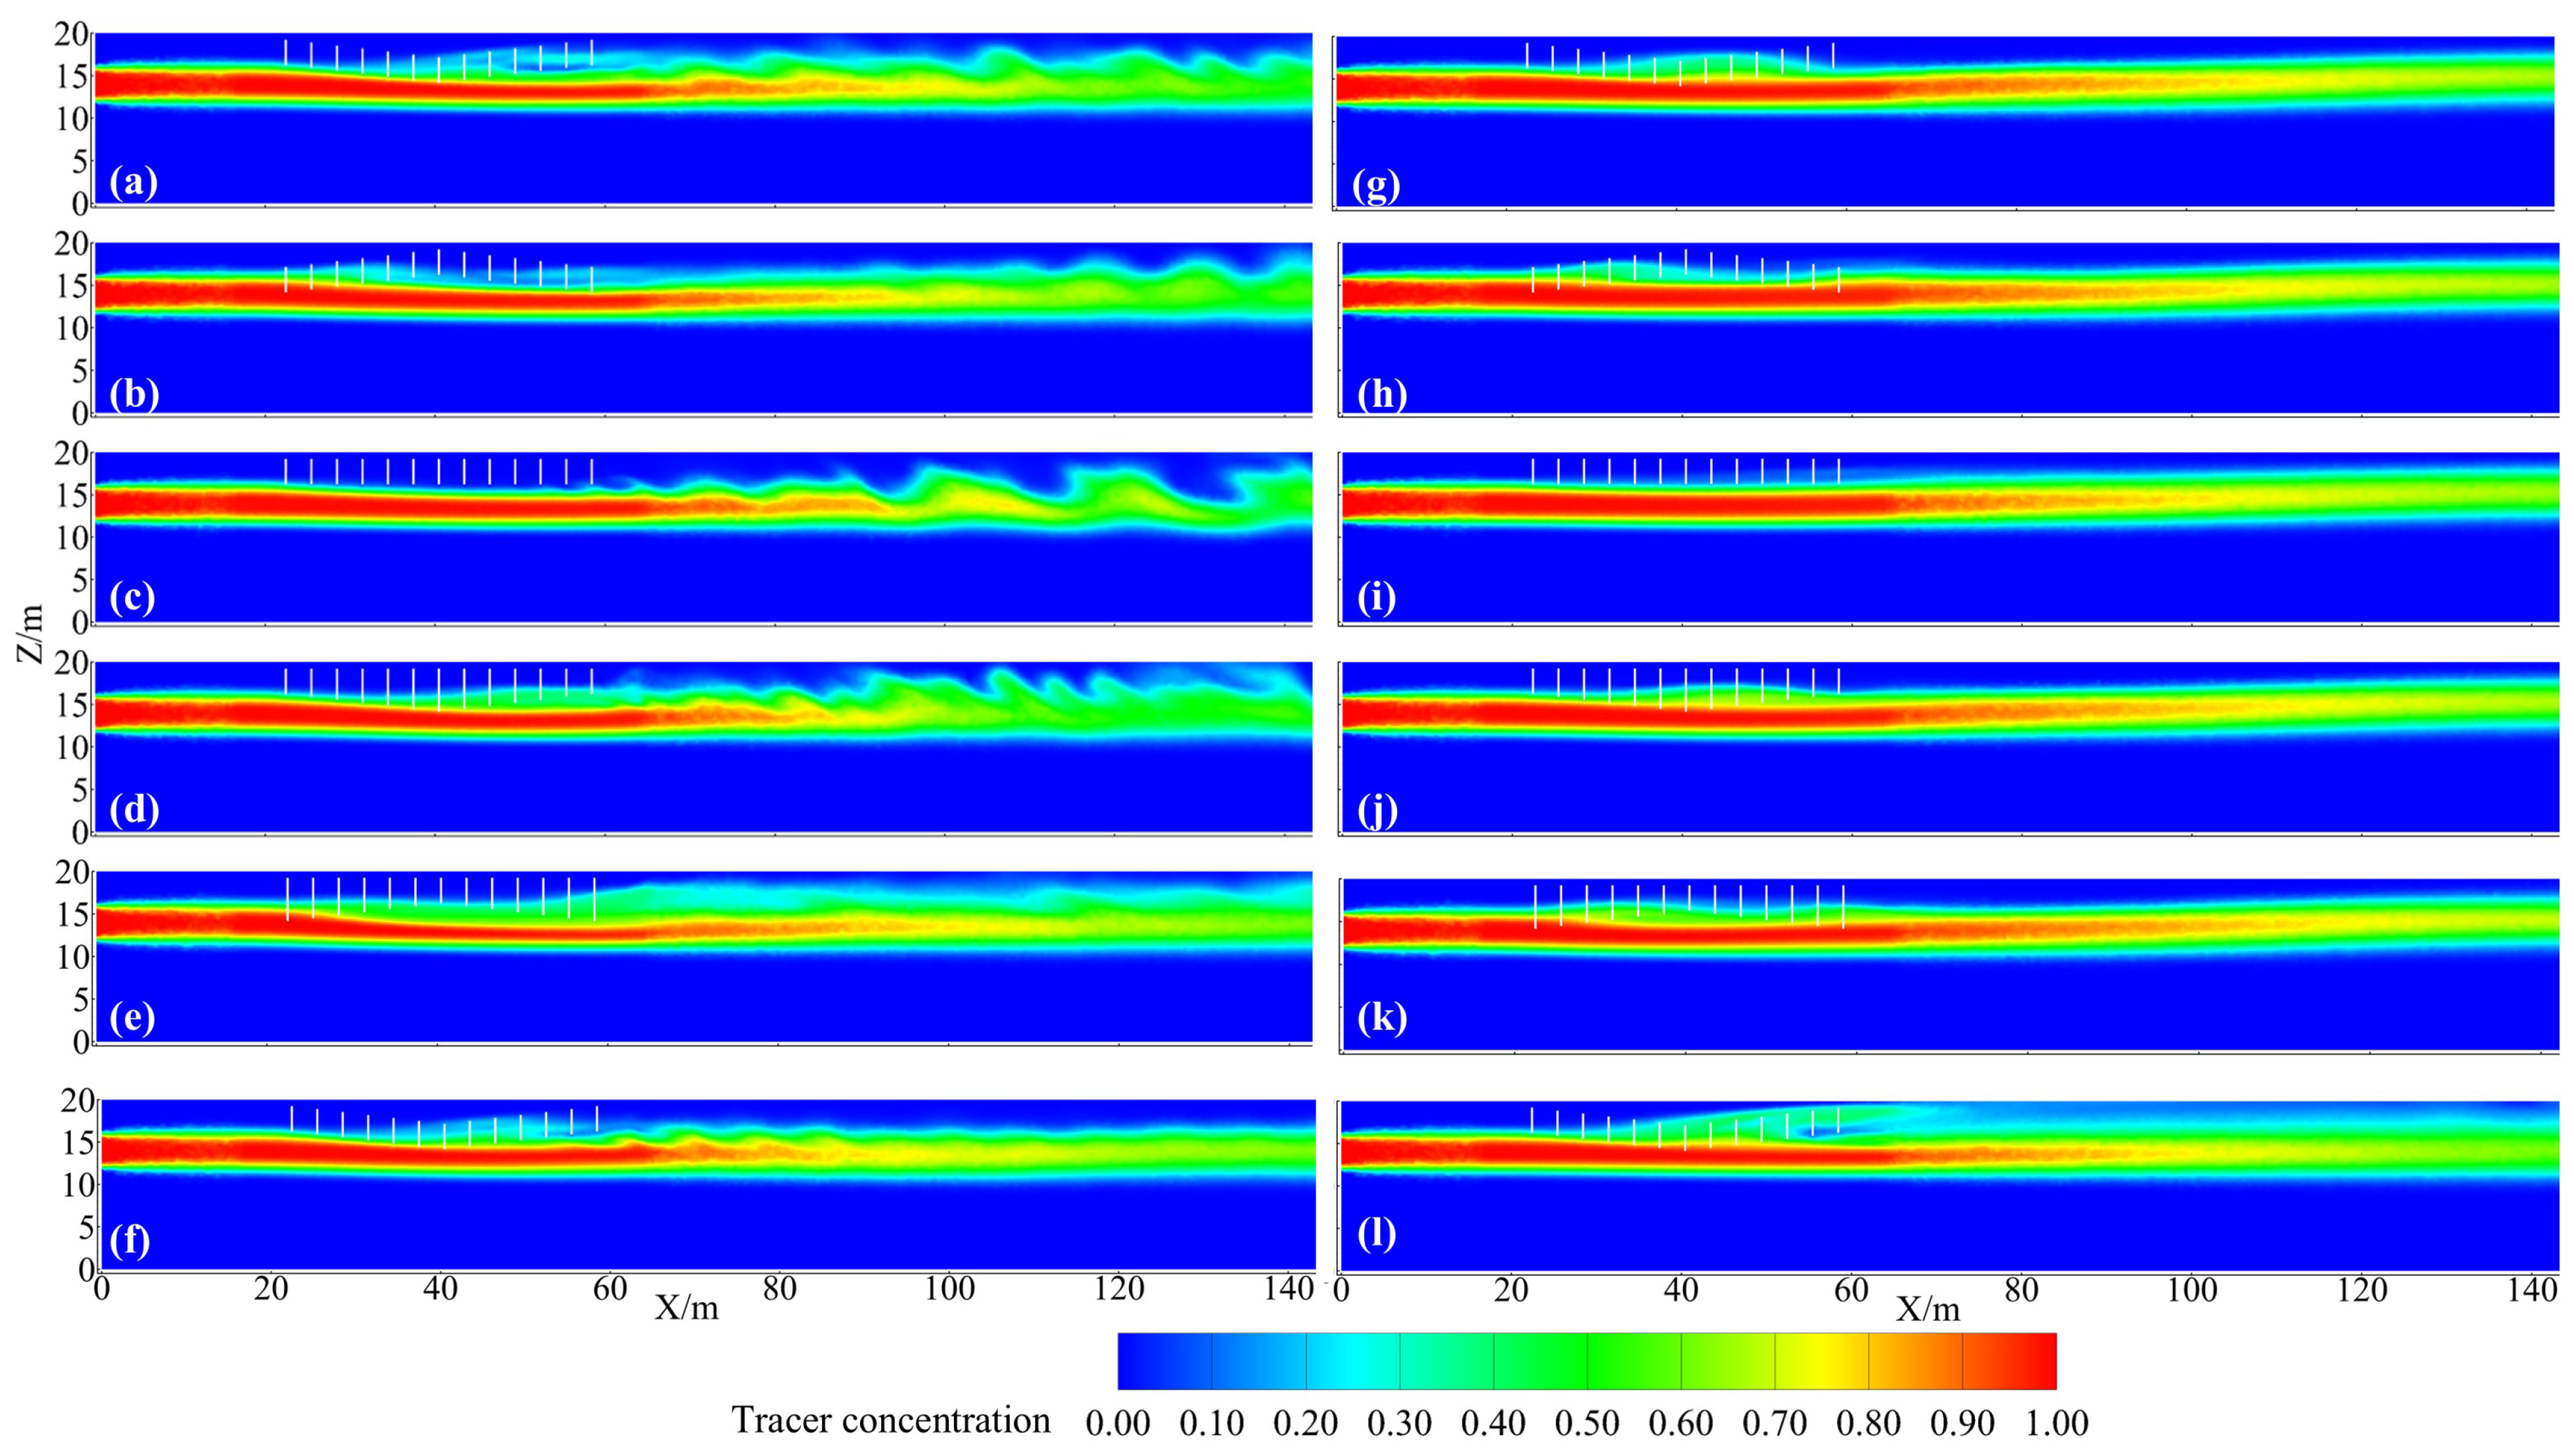
The five hanging configurations affected the transport and spatial redistribution of water within the 4–8 m subsurface layer under different hydrodynamic conditions (Figure 8). Overall, the tracer was transported primarily downstream within the release layer in the streamwise direction and underwent varying degrees of vertical transport, wake-induced turbulent spreading, and redistribution under disturbances generated by the mussel sleeve array. The differences in tracer distribution corresponded well with the low-velocity regions and wake disturbance characteristics shown in the velocity fields, indicating that the sleeve array further regulates water transport pathways by modifying the local flow structure.
Under uniform inflow without density stratification (Figure 8a–e), the tracer plume exhibited pronounced disturbances and spreading downstream of the mussel sleeve array, and the high-concentration regions showed noticeable spatial undulations farther downstream. Under the V-shaped equal-length configuration (Figure 8a; Case 1), the tracer extended relatively continuously in the streamwise direction, and the transport pathways within and downstream of the farm remained comparatively stable. This indicates that the configuration facilitates the transport of tracer-laden water from the 4–8 m subsurface layer into the farm and the downstream wake region. Under the inverted V-shaped configuration (Figure 8b; Case 2), in-farm upward transport occurred in S1, unlike the V-shaped configuration, in which in-farm upward transport occurred in S2. In both configurations, the upward-flow regions were aligned with the streamwise upward-sloping sections of the sleeve bottoms, indicating a pronounced flow-guiding effect induced by the flow-blocking structures. Under the uniform-depth configuration (Figure 8c; Case 3), the tracer was advected primarily downstream within relatively fixed water layers, with weaker vertical disturbances, consistent with the continuous and stable low-velocity band observed in the corresponding velocity field. The extended configurations altered mussel sleeve lengths among rows (Figure 8d,e; Cases 4 and 5), enhancing local flow blockage and wake disturbances and thereby promoting more pronounced tracer transport and redistribution behind the sleeve array. However, these effects were accompanied by stronger localized velocity attenuation. With density stratification, the tracer plume under the same V-shaped equal-length configuration exhibited weaker spatial undulations, a narrower vertical spreading range, and high-concentration regions more confined to the release layer and its adjacent water layers (Figure 8f; Case 6). This indicates that stable stratification suppresses the vertical disturbances induced by the mussel sleeves, causing water from the 4–8 m subsurface layer to be preferentially advected downstream within its original water layer and reducing exchange between adjacent water layers.
Under the measured velocity-profile inlet condition with density stratification (Figure 8g–k), tracer transport exhibited a more stable layered structure. Compared with the uniform inflow condition without density stratification (Figure 8a–e), the high-concentration regions extended more smoothly downstream along the release layer, while vertical spreading and plume undulations were markedly weakened. This indicates that the combined effects of the background velocity profile and density stratification constrained vertical mixing. Differences among the hanging configurations were still evident. Under the V-shaped configuration (Figure 8g; Case 7), tracer transport within the aquaculture block remained relatively continuous, whereas the inverted V-shaped configuration (Figure 8h; Case 8) showed more pronounced localized accumulation. The uniform-depth configuration produced relatively stable transport pathways but weaker vertical spreading (Figure 8i; Case 9). The extended configurations enhanced downstream tracer redistribution while potentially intensifying localized flow blockage (Figure 8j,k; Cases 10 and 11). Under the measured velocity-profile inlet condition without density stratification (Figure 8l; Case 12), in-farm upward transport in S2 was more pronounced. In contrast, under stratified conditions (Figure 8g; Case 7), the high-concentration region did not extend downstream into S3 (Table 2), and the vertical thickness of the high-concentration band was reduced. These results further indicate that density stratification suppresses vertical tracer spreading induced by the mussel sleeve array.

4.2.2. Tracer Mixing Under Uniform Inflow Conditions

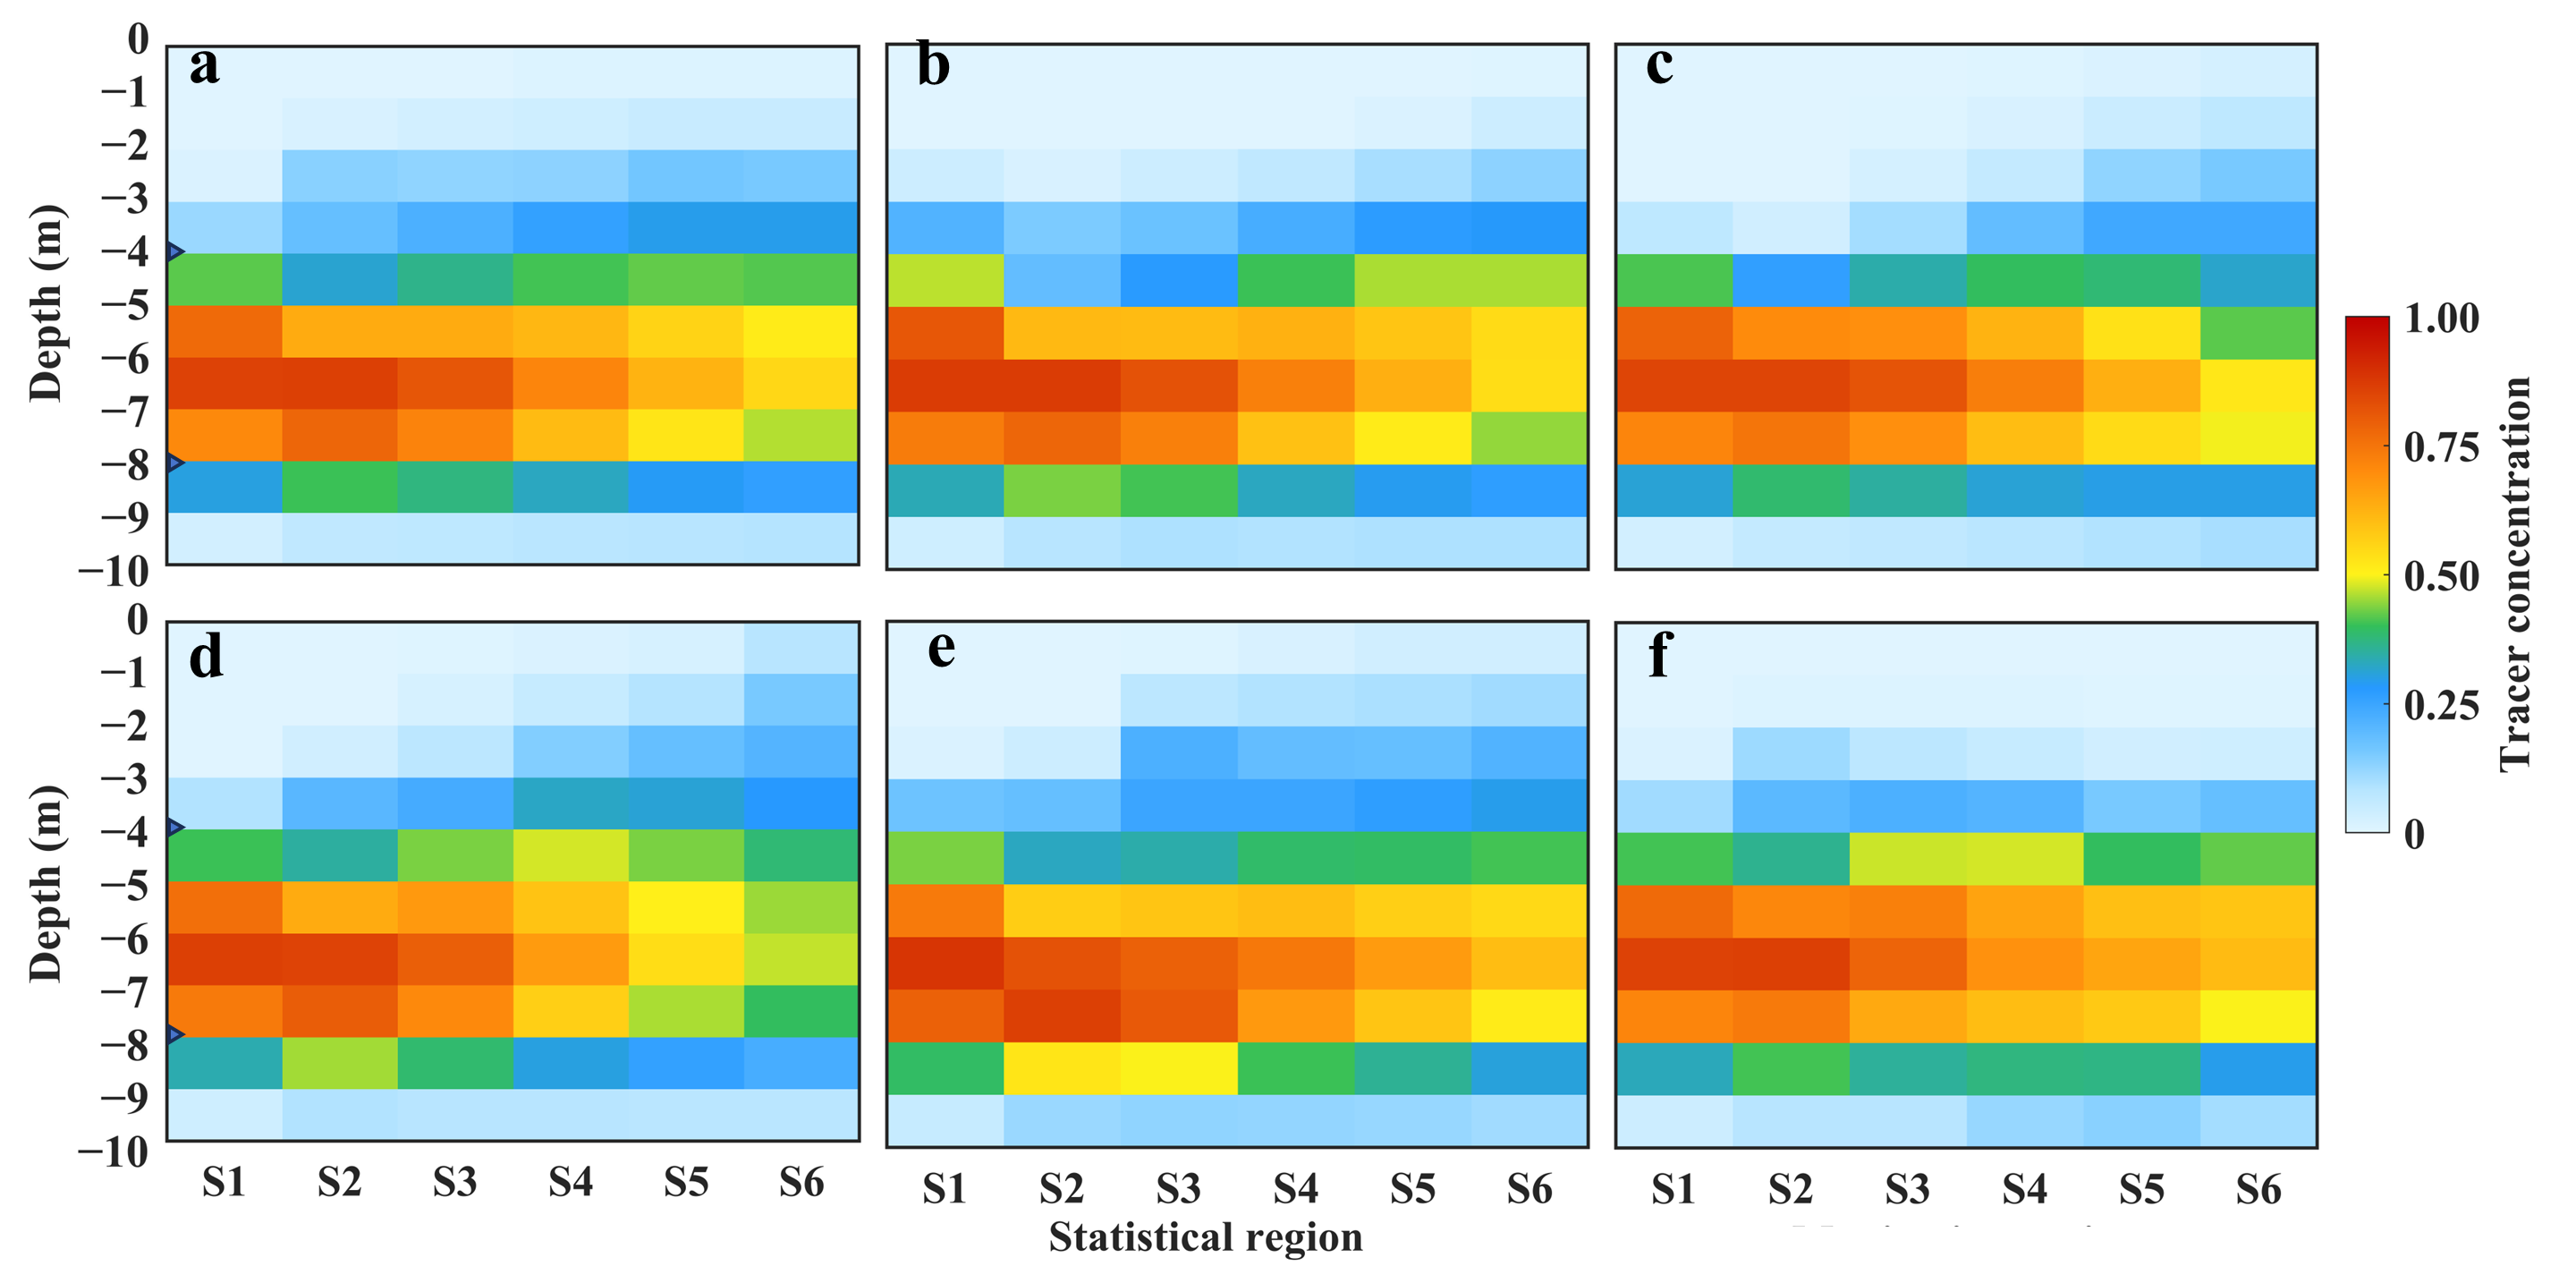
Under uniform inflow conditions, tracer concentrations exhibited clear vertical differentiation among the hanging configurations (Figure 9; Table 2 and Table 3). Under unstratified conditions, the tracer was mainly distributed within and adjacent to the 5–8 m release layer and transported downstream (Figure 9a–e). As the reference case representing the existing uniform-depth hanging layout at a 0° inflow angle, Case 0 showed low tracer concentrations in the upper water layers of S1 and S2. Specifically, concentrations in the 2–3 m layer were 0.0021 and 0.0093, respectively, whereas those in the 1–2 m layer were close to zero (Table 2 and Table 3). These results indicate that, under the existing hanging layout, transport of water from the release layer into the upper in-farm culture layers was weak.
Compared with Case 0, the non-uniform hanging-depth configurations altered the vertical tracer distribution within the farm, although the locations and intensities of upward transport differed among configurations. Under the V-shaped configuration (Figure 9a; Case 1), tracer concentrations in the 1–2 m, 2–3 m, and 3–4 m layers of S2 were 0.0180, 0.1362, and 0.1822, respectively, indicating relatively continuous upward redistribution of release-layer water into the upper in-farm water layers. Under the inverted V-shaped configuration (Figure 9b; Case 2), higher concentrations occurred mainly in S1, while tracer concentrations in the 2–3 m and 3–4 m layers of S2 decreased to 0.0186 and 0.1490, respectively, indicating that upward transport was concentrated primarily in the upstream portion of the farm. Under the uniform-depth configuration with a 90° inflow angle (Figure 9c; Case 3), tracer concentrations in the 2–3 m layer of S1 and S2 were only 0.0017 and 0.0026, respectively, indicating relatively limited tracer replenishment to the upper in-farm water layers.
The two extended configurations mainly enhanced localized tracer redistribution near the upper boundary of the release layer. Under the V-shaped (extended) configuration (Figure 9d; Case 4), the tracer concentration in the 3–4 m layer of S2 reached 0.2203, whereas concentrations in the 1–2 m and 2–3 m layers were only 0.0017 and 0.0339, respectively. A similar pattern was observed under the inverted V-shaped (extended) configuration (Figure 9e; Case 5; Table 3). These results indicate that the extended configurations promoted tracer redistribution in the 3–4 m layer but provided limited replenishment to the shallower 1–3 m layers. Concentration variations across S3–S6 reflected differences in downstream transport and wake-induced redistribution among the configurations (Figure 9a–e; Table 2).
Under uniform inflow with density stratification, the V-shaped configuration still promoted upward tracer transport into the upper water layers in S2, although its spreading toward shallower layers was constrained (Figure 9f; Case 6). Tracer concentrations in the 1–2 m, 2–3 m, and 3–4 m layers of S2 were 0.0080, 0.1131, and 0.1992, respectively, which were lower than those under the unstratified V-shaped condition (Case 1; Table 3). These results indicate that density stratification did not completely prevent in-farm tracer redistribution but suppressed its further spreading into the shallower culture layers. Overall, under uniform inflow, the V-shaped configuration showed the most pronounced in-farm upward transport in S2, whereas density stratification weakened transport toward the shallower water layers.

4.2.3. Measured Velocity-Profile Conditions

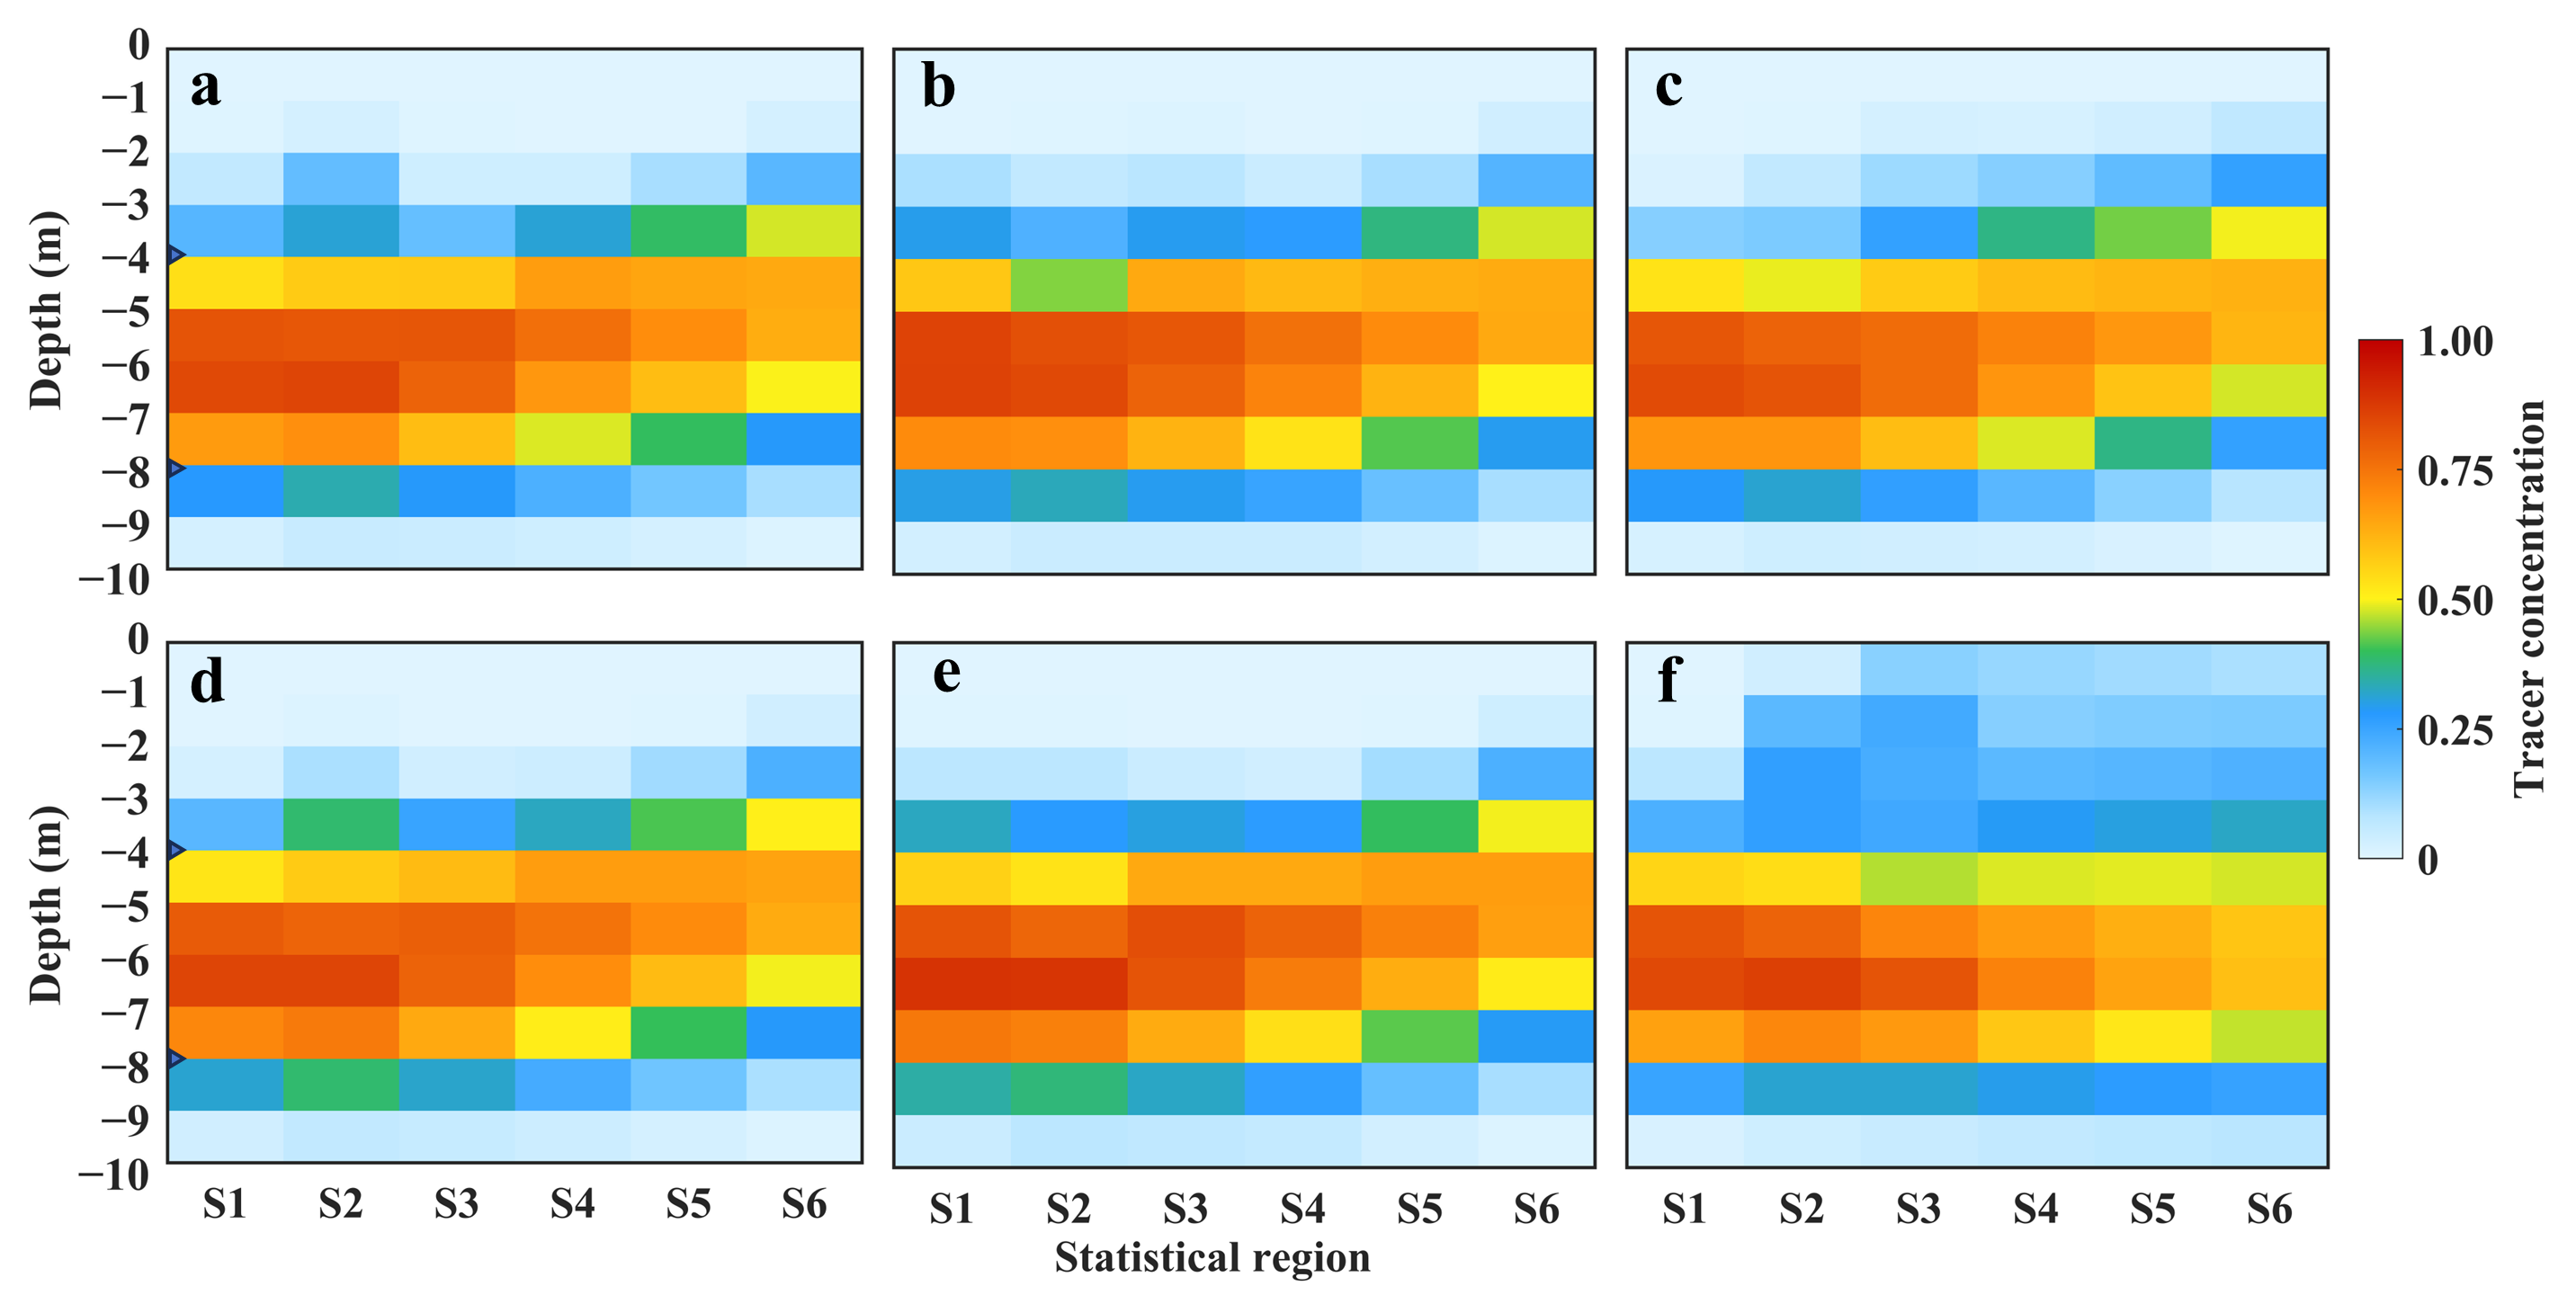
Under measured velocity-profile inflow conditions, tracer concentrations exhibited clear vertical differentiation among the hanging configurations (Figure 10; Table 2 and Table 4). Under density-stratified conditions, the tracer was mainly distributed within and adjacent to the 5–8 m release layer and transported downstream along the streamwise direction (Figure 10a–e).
In-farm upward transport under the different configurations was mainly evident in S1 and S2. Under the V-shaped configuration (Figure 10a; Case 7), tracer concentrations in the 1–2 m, 2–3 m, and 3–4 m layers of S2 were 0.0272, 0.1860, and 0.3110, respectively, all higher than those in the corresponding layers of S1 (Table 4). This indicates that release-layer water could undergo continuous upward redistribution into the upper water layers within the farm. Under the inverted V-shaped configuration (Figure 10b; Case 8), higher concentrations occurred mainly in S1, while tracer concentrations in the 2–3 m and 3–4 m layers of S2 decreased to 0.0588 and 0.2150, respectively, indicating that upward transport was concentrated primarily in the upstream portion of the farm. Under the uniform-depth configuration (Figure 10c; Case 9), tracer concentrations in the upper water layers of S1 and S2 were generally low, indicating relatively limited in-farm upward transport.
The two extended configurations mainly enhanced localized tracer redistribution near the upper boundary of the release layer. Under the V-shaped (extended) configuration (Figure 10d; Case 10), the tracer concentration in the 3–4 m layer of S2 reached 0.3858, whereas concentrations in the 1–2 m and 2–3 m layers were only 0.0081 and 0.0959, respectively (Table 4). A similar pattern was observed under the inverted V-shaped (extended) configuration (Figure 10e; Case 11). These results indicate that the extended configurations promoted tracer redistribution in the 3–4 m layer but provided limited replenishment to the shallower 1–3 m layers. Concentration variations across S3–S6 reflected differences in downstream transport and wake-induced redistribution among the configurations (Figure 10a–e; Table 2).
Compared with the V-shaped configuration under stratified conditions, in-farm upward transport was stronger under unstratified conditions (Figure 10f; Case 12). In Case 12, tracer concentrations in the 1–2 m and 2–3 m layers of S2 were 0.1971 and 0.2619, respectively, higher than the corresponding values of 0.0272 and 0.1860 in Case 7 (Table 4). These results indicate that density stratification limits further tracer spreading into the upper 1–3 m culture layers, causing more tracer to remain near the upper boundary of the release layer and in adjacent water layers. Overall, the V-shaped configuration showed clear in-farm upward transport in S2, whereas density stratification weakened transport toward the shallower culture layers.

5. Discussion

5.1. Hydrodynamic Dependence of the Effects of Non-Uniform Hanging-Depth Layouts

The velocity-field results are consistent with previous studies showing that suspended shellfish farming structures can impede incoming flow, reduce flow velocities within farms, and form low-velocity wake regions downstream of the structures [17,42,43,44]. Suspended mussel farming structures can also be regarded as submerged canopy-like structures characterized by distributed drag, where the drag distribution influences flow penetration, flow deflection, and wake recovery [25,45,46,47]. In the present study, all five hanging configurations generated low-velocity regions within and downstream of the mussel sleeve array, confirming that the sleeve array substantially modified the local flow field. More importantly, the non-uniform hanging-depth layouts altered the vertical distribution of canopy drag, which explains the observed differences in wake continuity, localized deceleration, and downstream recovery among the configurations.
The velocity-distribution and tracer transport results indicate that the effects of non-uniform hanging-depth layouts depend strongly on hydrodynamic conditions. Under uniform inflow without density stratification (Case 1–5), the background velocity was relatively uniform in the vertical direction, and stabilizing constraints on the water column were weak. Consequently, flow blockage by the mussel sleeve array more readily induced wake fluctuations and localized disturbances. Under these conditions, the different non-uniform hanging configurations modified the shape of the low-velocity region behind the sleeves, generated undulations along the wake boundary, and promoted the vertical spreading and redistribution of tracer released within the 4–8 m layer downstream of the sleeve array. Taking the V-shaped configuration as an example (Case 1), its low-velocity wake extended relatively continuously downstream, and the tracer plume maintained a relatively stable transport pathway between the farm interior and the downstream region without aquaculture facilities. These results indicate that, in the absence of stratification, non-uniform hanging-depth layouts can more readily enhance exchange between adjacent water layers by inducing wake disturbances.
Compared with the unstratified V-shaped case, density stratification markedly weakened wake fluctuations, straightened the velocity-field and tracer-plume boundaries, and confined the high-concentration regions (Figure 7a,f and Figure 8a,f; Cases 1 and 6). These results indicate that stable stratification suppressed sleeve-induced vertical disturbances, shear mixing, and wake spreading, thereby restricting velocity variations and tracer redistribution to the sleeve layer and adjacent waters. Previous studies have shown that canopy drag generates shear layers near canopy boundaries and thereby regulates turbulent mixing and scalar transport. Under stable stratification, interactions between these shear layers and vertical density gradients may further limit vertical exchange [24,40,48,49]. Consistent with these mechanisms, the present results indicate that background stratification constrains wake disturbances, vertical tracer transport, and interlayer exchange induced by the sleeve array as a suspended drag structure.
Under the combined effects of the measured velocity-profile inflow and density stratification (Cases 7–11), the background flow exhibited pronounced vertical variations. The regulation induced by non-uniform hanging-depth layouts was therefore influenced not only by the sleeve configuration but also by differences in incoming velocity among water layers. The velocity field showed a relatively stable layered structure, with a continuous high-velocity region in the middle and lower layers, whereas the low-velocity wake behind the sleeve array was mainly confined to the upper and middle layers. Correspondingly, high-concentration tracer regions extended more smoothly downstream along the release layer, with markedly reduced vertical spreading and plume undulation (Figure 7g–k and Figure 8g–k). Compared with the V-shaped configuration under uniform inflow without density stratification (Case 1), the V-shaped configuration under the measured velocity-profile inflow without density stratification (Case 12) showed higher tracer concentrations across the statistical regions, particularly in the shallow water layers of S2. This indicates that vertically non-uniform inflow was more favorable for streamwise transport of water from the 4–8 m layer and its redistribution into the upper in-farm water layers. Further comparison between Cases 7 and 12 showed that, under the same measured velocity-profile inflow condition, density stratification reduced tracer concentrations in the 1–3 m layers of S2. This indicates that stable stratification mainly limited the further spreading of release-layer water into the shallower culture layers.

5.2. Mass-Transport Regulation by Non-Uniform Hanging-Depth Layouts and Practical Implications

Under conventional uniform-depth hanging layouts, mussel sleeves tend to form extensive low-velocity regions within and downstream of the farm, thereby limiting the transport of water from the 4–8 m layer into the upper culture layer [32]. In this study, Case 0, which served as the reference for the existing uniform-depth hanging layout, showed tracer concentrations of only 0.0021 and 0.0093 in the 2–3 m layer of S1 and S2, respectively, indicating weak replenishment of the upper in-farm water layers (Case 0; Table 2 and Table 3). By redistributing the vertical drag exerted by the mussel sleeve array, non-uniform hanging-depth layouts can alleviate the restriction imposed by the continuous flow-blocking band on water exchange and improve the in-farm velocity structure and transport of water from the 4–8 m layer (Figure 7a–e and Figure 9a–e; Cases 1–5). Therefore, the focus of configuration optimization should not be simply to increase sleeve length or farming density, but rather to enhance replenishment from the middle and lower water layers while maintaining appropriate flow velocities.
In terms of flow regulation, non-uniform hanging-depth layouts were more favorable than the uniform-depth configuration for maintaining in-farm water movement. Under uniform inflow conditions, in-farm velocities ranged from 0.08 to 0.34 m s−1 for the V-shaped configuration and from 0.06 to 0.34 m s−1 for the inverted V-shaped configuration, whereas the uniform-depth configuration showed a narrower range of only 0.05–0.13 m s−1. These results indicate that the V-shaped and inverted V-shaped configurations disrupted the continuous flow-blocking layer formed under uniform-depth hanging by varying sleeve-bottom depths (Figure 7a–c; Cases 1–3). Although the extended configurations enhanced localized disturbances, they also increased the vertical coverage of the mussel sleeves and local drag. Their effects on maintaining in-farm flow should therefore be considered carefully in practical applications (Figure 7d,e; Cases 4 and 5).
Previous studies have shown that the drag of suspended aquaculture structures and its interaction with background stratification can regulate local shear, mixing, and material transport processes [8,10,40,48,49,50]. Consistent with these mechanisms, the present results further demonstrate that differences in the vertical drag distribution of the mussel sleeve array can alter tracer transport pathways and redistribution patterns. The V-shaped configuration favored relatively continuous streamwise transport, whereas the inverted V-shaped configuration was more prone to localized high-concentration accumulation. The V-shaped (extended) and inverted V-shaped (extended) configurations enhanced local wake disturbances and tracer redistribution. Under density-stratified conditions, however, the tracer was transported mainly downstream along the release layer and adjacent water layers, with relatively limited vertical spreading. These findings indicate that optimization of non-uniform hanging-depth layouts should balance enhanced local material redistribution with the maintenance of in-farm water exchange.
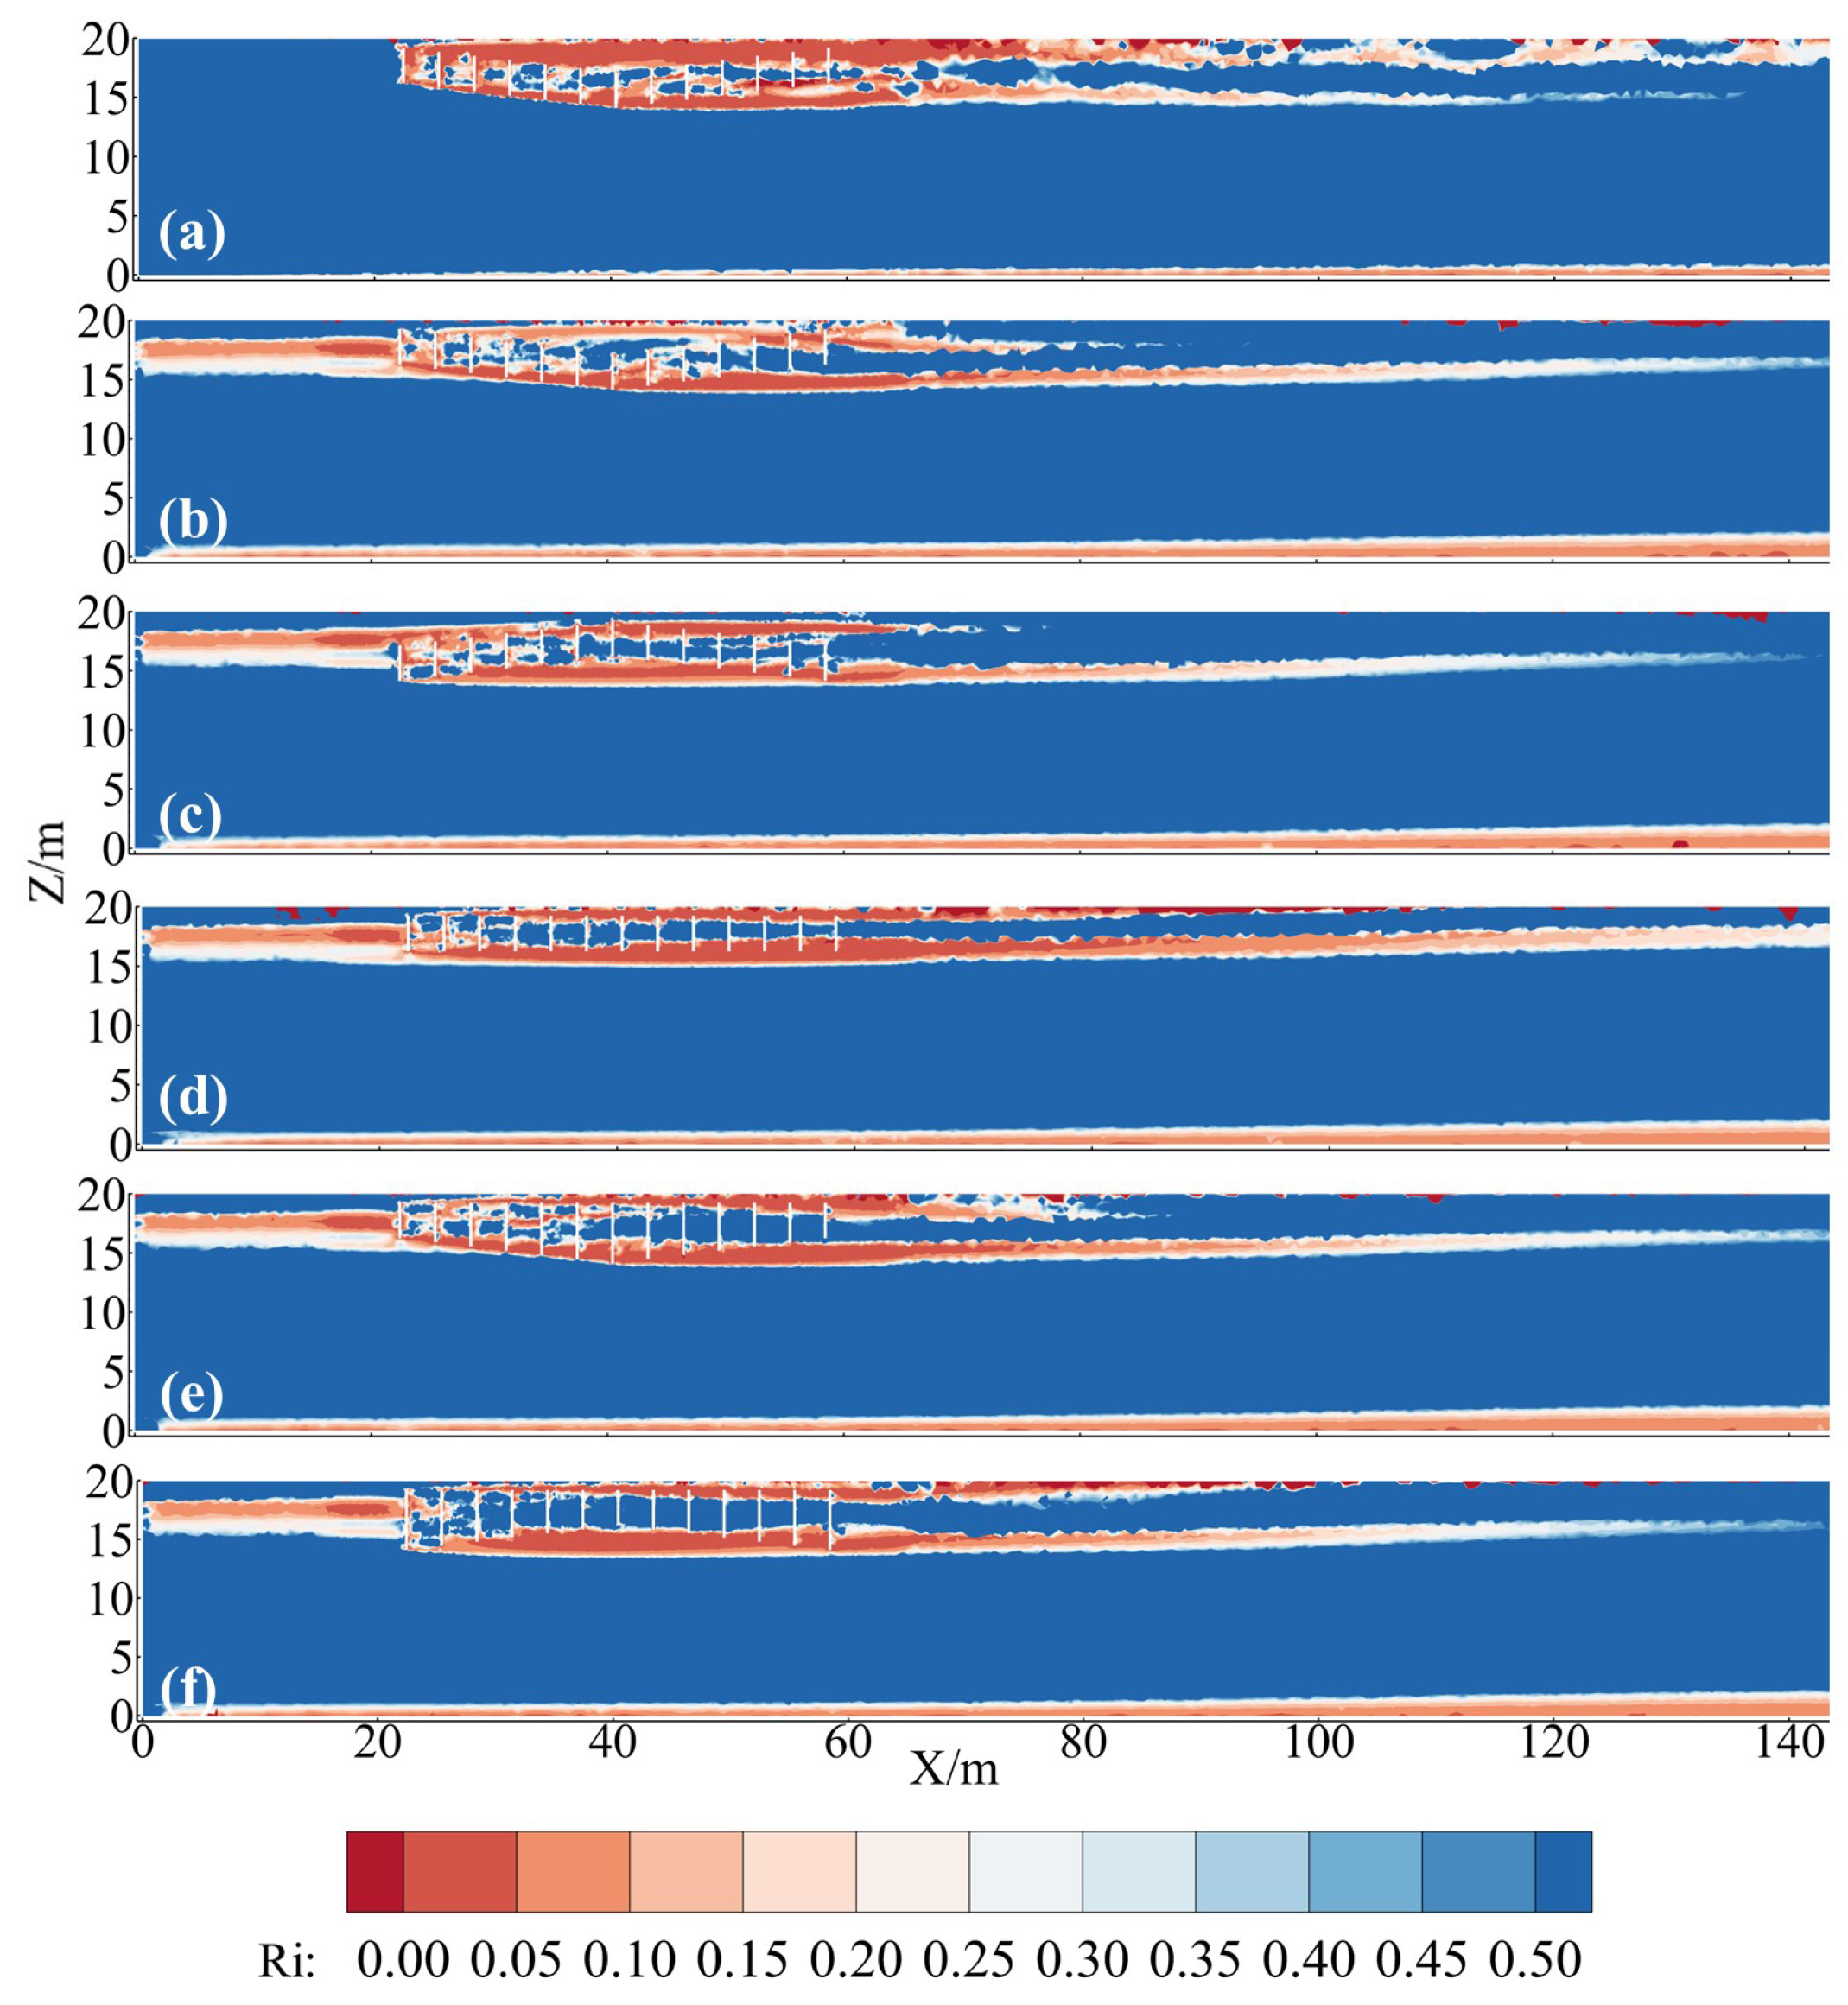
The gradient Richardson number (Ri) was used to characterize the relative effects of density stratification and local velocity shear on mixing [40]. Lower Ri values indicate that local shear is relatively stronger than density stratification and is therefore more favorable for shear-induced vertical mixing. Regions with low Ri values showed good spatial correspondence with areas of tracer-plume uplift and enhanced spreading, indicating that local shear induced by the mussel sleeve array is an important mechanism promoting the redistribution of water from the 4–8 m layer into adjacent upper water layers (Figure 8f–k and Figure 11a–f; Cases 6–11).
Under measured velocity-profile inflow with density stratification, low-Ri regions under the V-shaped configuration were distributed relatively continuously across the downstream half of the aquaculture block and corresponded to tracer redistribution near S2, indicating a greater capacity to promote in-farm water exchange (Figure 8g and Figure 11b; Case 7). In contrast, low-Ri regions under the inverted V-shaped configuration were more locally concentrated, whereas those under the uniform-depth configuration were less extensive. Correspondingly, tracer transport was characterized by localized accumulation and transport confined near the release layer, respectively (Figure 8h,i and Figure 11c,d; Cases 8 and 9). The two extended configurations formed pronounced low-Ri regions near the sleeve array, indicating enhanced local shear disturbances. However, tracer redistribution was mainly concentrated near the upper boundary of the release layer and in adjacent downstream water layers, providing limited enhancement of replenishment to shallow in-farm layers (Figure 8j,k and Figure 11e,f; Cases 10 and 11).
It should be noted that the density stratification in this study was prescribed using one measured temperature–density profile, and the stratification strength and profile shape were not varied independently. The comparisons between stratified and unstratified cases indicate that density stratification constrained tracer uplift and reduced vertical plume spreading. Therefore, changes in stratification strength or in the vertical density-gradient structure may influence the vertical extent of tracer uplift and the spatial distribution of low-Ri regions. In general, stronger stratification may further suppress vertical spreading, whereas weaker stratification may allow more pronounced tracer uplift and broader low-Ri regions. However, these responses were inferred from the stratified–unstratified comparisons and were not quantified through additional perturbation simulations of the density profile. Future studies should include sensitivity tests with different stratification strengths and profile shapes to further evaluate the robustness of the tracer-uplift and low-Ri features.
Non-uniform hanging-depth layouts influence water transport not only by modifying the flow structure but also by altering the spatial relationship between mussel sleeves and seston-rich water layers. Under the existing uniform-depth hanging layout, the sleeve bottoms of all rows were located at approximately 3.75 m below the water surface. In contrast, under the non-uniform configurations examined in this study, the sleeve bottoms of some rows extended to 5.85 m below the water surface, reaching the upper portion of the relatively seston-rich 4–8 m layer and thereby increasing their potential for direct contact with water from this layer (Figure 2).
Under uniform inflow without density stratification, the V-shaped configuration produced clear in-farm tracer redistribution in S2. This feature remained evident under the measured velocity-profile inflow with density stratification, indicating that the V-shaped configuration maintained a relatively stable capacity to transport release-layer water into adjacent upper in-farm water layers (Figure 9a and Figure 10a; Cases 1 and 7). In contrast, tracer redistribution under the inverted V-shaped configuration was more concentrated in the upstream portion of the farm or localized downstream regions, whereas enhanced tracer concentrations in the upper layers under the uniform-depth configuration occurred mainly downstream, indicating relatively limited in-farm vertical exchange (Figure 9b,c; Cases 2 and 3). The two extended configurations enhanced localized redistribution near the upper boundary of the release layer and in adjacent downstream water layers; however, their effects were mainly concentrated around the 3–4 m layer and provided limited replenishment to shallower culture layers (Figure 9d,e and Figure 10d,e; Cases 4, 5, 10, and 11). For example, under uniform inflow without density stratification, the tracer concentration in the 2–3 m layer of S2 was 0.0339 and 0.0428 for the V-shaped (extended) and inverted V-shaped (extended) configurations, respectively, which were 75.1% and 68.6% lower than that of the non-extended V-shaped configuration (0.1362; Case 1). However, these values were still higher than that of the existing uniform-depth reference layout (0.0093; Case 0), indicating that the extended configurations still improved shallow-layer tracer transport relative to the existing layout, but were less effective than the non-extended V-shaped configuration (Table 2). From a biological perspective, the lower tracer concentrations in the shallow culture layer suggest a weaker renewal potential of seston-rich water, which may reduce the potential delivery of seston particles to mussels in this layer compared with the non-extended V-shaped configuration. However, because mussel filtration, particle settling, biological uptake, and growth processes were not explicitly simulated, the possible effects on actual food supply, local carrying capacity, and mussel growth should be further evaluated using coupled hydrodynamic–biological models and field observations.
From a practical farming perspective, the V-shaped configuration may be relatively feasible for large-scale commercial mussel farms because it does not require new infrastructure, additional energy input, or an increase in mussel sleeve length. Instead, it can be implemented by assigning different target suspension depths to different sleeve rows within the existing raft or longline framework. The implementation would mainly involve setting different suspension depths during deployment, which could be achieved using preset hanging-line lengths or simple row-specific depth markings, without substantial changes to the existing installation, maintenance, or harvesting procedures. Therefore, the basic farming materials, such as mussel sleeves, floats, ropes, and anchors, would remain similar to those used in conventional uniform-depth layouts, which may help limit additional construction and material costs. Nevertheless, field trials and cost–benefit analyses are still needed to verify the accuracy of the prescribed hanging depths and evaluate the associated labor requirements and economic feasibility under commercial farming conditions.
To provide a clearer quantitative basis for identifying the preferred hanging configuration, the configurations were evaluated using three criteria: (i) in-farm replenishment of upper culture waters, represented by tracer concentrations in the shallow in-farm layers, especially the 2–3 m layer of S2; (ii) maintenance of in-farm flow, represented by the velocity range within the aquaculture block and the avoidance of a continuous low-velocity band; and (iii) practical feasibility, including whether the configuration required increased mussel sleeve length, additional infrastructure, or additional energy input.
Based on these criteria, the V-shaped configuration showed the most balanced performance among the configurations examined. Under uniform inflow without density stratification, the tracer concentration in the 2–3 m layer of S2 reached 0.1362 for the V-shaped configuration, which was higher than those of the existing uniform-depth reference case, inverted V-shaped configuration, uniform-depth configuration under 90° inflow, and the two extended configurations. Under measured velocity-profile inflow with density stratification, the corresponding value for the V-shaped configuration reached 0.1860, also exceeding those of the inverted V-shaped, uniform-depth, V-shaped (extended), and inverted V-shaped (extended) configurations (Table 2; Cases 1 and 7). In terms of flow maintenance, the in-farm velocity range of the V-shaped configuration under uniform inflow was 0.08–0.34 m s−1, which was broader than that of the uniform-depth configuration under the 90° inflow arrangement (0.05–0.13 m s−1). Although the extended configurations produced higher tracer concentrations in the 3–4 m layer in some cases, their replenishment to the shallower 1–3 m layers was more limited. In addition, the V-shaped configuration did not require increased mussel sleeve length, additional infrastructure, or additional energy input. Therefore, the V-shaped configuration was identified as the preferred configuration under the present model assumptions and evaluation metrics.
Overall, the advantages of non-uniform hanging-depth layouts are reflected in two main aspects. First, the non-uniform vertical drag distribution alleviates the effects of continuous flow blockage and improves the in-farm velocity structure. Second, it promotes the redistribution of water from the 4–8 m layer into adjacent upper culture layers within the farm while maintaining a certain degree of downstream transport. For high-density suspended mussel farms off Gouqi Island, optimization of hanging layouts should balance in-farm flow maintenance, replenishment of target water layers, and drag-related flow blockage. Among the configurations examined in this study, the V-shaped configuration provided the most balanced performance in terms of in-farm water transport, flow maintenance, and practical feasibility. It can therefore be considered a preferred option under the present model assumptions and evaluation metrics.

5.3. Limitations and Future Work

This study used a passive scalar to track the redistribution of water originating from the relatively seston-rich 4–8 m layer toward the upper culture layers and downstream regions. The tracer concentration characterizes the extent of this redistribution rather than the measured seston concentration or actual food availability. Particle settling and biological processes, including mussel filtration, uptake, phytoplankton growth, and feeding–seston feedbacks, were not represented. Therefore, “food replenishment” refers only to the hydrodynamic potential for transporting seston-rich water. The preferred configuration was evaluated mainly using tracer transport, in-farm flow maintenance, and practical feasibility, whereas residence time, flushing rate, and carrying capacity were not directly assessed. Future studies should incorporate these farm-scale indicators and couple hydrodynamic transport with particle and biological processes.
The mussel sleeves were modeled as rigid structures, without wave–current-induced oscillation or deformation. Studies of idealized oscillating bodies indicate that relative motion between neighboring immersed structures can modify hydrodynamic force responses [28]. Although these systems differ from flexible mussel sleeves, they suggest that sleeve motion may affect effective frontal area, drag, wake interactions, and tracer redistribution. In addition, the simulations were limited to a single aquaculture block and a restricted range of prescribed constant-direction inflow and stratification conditions. Sensitivity to tidal velocity, oblique and time-varying inflows, waves, seasonal variability, stratification characteristics, and turbulence-model selection was not systematically evaluated. In particular, no direct comparison among LES, RANS, and DES was conducted. Future field observations and sensitivity analyses should examine these factors to assess the robustness and applicability of the findings under realistic sea conditions.

6. Conclusions

To address limited potential food-layer replenishment in the surface culture layers of suspended mussel farms and investigate transport from the relatively seston-rich 4–8 m water layer, this study used a representative aquaculture block within a suspended mussel farm as the model system. The existing uniform-depth hanging layout at a 0° inflow angle served as the reference scheme. Five mussel sleeve-hanging configurations were evaluated: V-shaped, inverted V-shaped, uniform-depth (90° inflow angle), V-shaped (extended), and inverted V-shaped (extended). Flow structures and transport characteristics of water originating from the 4–8 m layer were analyzed under different inflow and density-stratification conditions. The passive tracer was used to evaluate the hydrodynamic transport potential of seston-rich water rather than actual food availability. The main conclusions are as follows:
(1)
Uniform-depth hanging readily forms a continuous low-velocity band within the water layer occupied by the mussel sleeves, limiting in-farm water exchange and the transport of water from the 4–8 m layer into the upper culture layers. By altering the vertical distribution of drag induced by the mussel sleeves, non-uniform hanging-depth layouts can alleviate the effects of continuous flow blockage and improve the in-farm velocity structure and local water-exchange conditions under the conditions considered in this study.
(2)
The V-shaped configuration exhibited more pronounced in-farm upward transport. Under uniform inflow without density stratification, water was guided upward along the bottoms of the V-shaped mussel sleeves and underwent clear in-farm redistribution in the downstream half of the aquaculture block (S2), where the tracer concentration in the 2–3 m layer reached 0.1362. Under measured velocity-profile inflow with density stratification, the V-shaped configuration still promoted transport of release-layer water into adjacent upper water layers in S2, indicating good potential for enhancing in-farm transport of seston-rich water.
(3)
Density stratification suppresses tracer spreading into the shallower culture layers, causing the tracer to remain more concentrated near the upper boundary of the release layer and in adjacent water layers. Low-Richardson-number regions showed good spatial correspondence with areas of tracer uplift and enhanced spreading, indicating that local shear induced by the mussel sleeves is an important mechanism promoting tracer redistribution into adjacent water layers.
(4)
Although the two extended configurations enhanced local shear disturbances and tracer redistribution near the upper boundary of the release layer, their greater vertical coverage strengthened flow blockage in the upper layers, providing limited improvement in the hydrodynamic transport potential of seston-rich water toward shallow in-farm culture waters. Under practical farming conditions, longer mussel sleeves may also be associated with greater filter-feeding consumption, further increasing pressure on food replenishment in the upper layers.
Overall, under the hydrodynamic and stratification conditions considered in this study, the V-shaped configuration provides a better balance among in-farm replenishment, flow maintenance, and downstream transport. It can therefore be regarded as a preferred configuration under the present model assumptions and evaluation metrics. Future studies should incorporate field observations and further consider processes such as flexible sleeve motion and filter feeding to verify the hydrodynamic and ecological regulation effects of this layout under realistic sea conditions.

Author Contributions

Conceptualization, Y.Z. and J.L.; methodology, Y.Z. and J.L.; software, Y.Z.; validation, Y.Z. and K.Z.; formal analysis, Y.Z.; investigation, Y.Z., W.Z., Y.L. and K.Z.; resources, J.L.; data curation, Y.Z.; writing—original draft preparation, Y.Z.; writing—review and editing, J.Z. and J.L.; visualization, Y.Z.; supervision, J.Z. and J.L.; project administration, J.L.; funding acquisition, J.L. All authors have read and agreed to the published version of the manuscript.

Funding

This research was funded by the National Key R&D Program of China, grant number 2023YFD2401902, and the National Natural Science Foundation of China, grant number 42376207.

Data Availability Statement

The original contributions presented in this study are included in the article. Further inquiries can be directed to the corresponding authors.

Conflicts of Interest

The authors declare no conflicts of interest. The funders had no role in the design of the study; in the collection, analyses, or interpretation of data; in the writing of the manuscript; or in the decision to publish the results.

References

  1. Costello, C.; Cao, L.; Gelcich, S.; Cisneros-Mata, M.Á.; Free, C.M.; Froehlich, H.E.; Golden, C.D.; Ishimura, G.; Maier, J.; Macadam-Somer, I.; et al. The Future of Food from the Sea. Nature 2020, 588, 95–100. [Google Scholar] [CrossRef] [PubMed]
  2. Naylor, R.L.; Hardy, R.W.; Buschmann, A.H.; Bush, S.R.; Cao, L.; Klinger, D.H.; Little, D.C.; Lubchenco, J.; Shumway, S.E.; Troell, M. A 20-Year Retrospective Review of Global Aquaculture. Nature 2021, 591, 551–563. [Google Scholar] [CrossRef] [PubMed]
  3. Shen, L.; Wu, L.; Wei, W.; Yang, Y.; MacLeod, M.J.; Lin, J.; Song, G.; Yuan, J.; Yang, P.; Wu, L.; et al. Marine Aquaculture Can Deliver 40% Lower Carbon Footprints than Freshwater Aquaculture Based on Feed, Energy and Biogeochemical Cycles. Nat. Food 2024, 5, 615–624. [Google Scholar] [CrossRef] [PubMed]
  4. Garlock, T.M.; Asche, F.; Anderson, J.L.; Eggert, H.; Anderson, T.M.; Che, B.; Chávez, C.A.; Chu, J.; Chukwuone, N.; Dey, M.M.; et al. Environmental, Economic, and Social Sustainability in Aquaculture: The Aquaculture Performance Indicators. Nat. Commun. 2024, 15, 5274. [Google Scholar] [CrossRef] [PubMed]
  5. Plew, D.R.; Stevens, C.L.; Spigel, R.H.; Hartstein, N.D. Hydrodynamic Implications of Large Offshore Mussel Farms. IEEE J. Ocean Eng. 2005, 30, 95–108. [Google Scholar] [CrossRef]
  6. Plew, D. Shellfish Farm-Induced Changes to Tidal Circulation in an Embayment, and Implications for Seston Depletion. Aquac. Environ. Interact. 2011, 1, 201–214. [Google Scholar] [CrossRef]
  7. Grant, J.; Bacher, C. A Numerical Model of Flow Modification Induced by Suspended Aquaculture in a Chinese Bay. Can. J. Fish. Aquat.Sci. 2001, 58, 1003–1011. [Google Scholar] [CrossRef]
  8. Cranford, P.J.; Duarte, P.; Robinson, S.M.C.; Fernández-Reiriz, M.J.; Labarta, U. Suspended Particulate Matter Depletion and Flow Modification inside Mussel (Mytilus Galloprovincialis) Culture Rafts in the Ría de Betanzos, Spain. J. Exp. Mar. Biol. Ecol. 2014, 452, 71–81. [Google Scholar] [CrossRef]
  9. Delaux, S.; Stevens, C.L.; Popinet, S. High-Resolution Computational Fluid Dynamics Modelling of Suspended Shellfish Structures. Environ. Fluid Mech. 2011, 11, 405–425. [Google Scholar] [CrossRef]
  10. Zhong, W.; Lin, J.; Zou, Q.; Wen, Y.; Yang, W.; Yang, G. Hydrodynamic Effects of Large-Scale Suspended Mussel Farms: Field Observations and Numerical Simulations. Front. Mar. Sci. 2022, 9, 973155. [Google Scholar] [CrossRef]
  11. FAO. The State of World Fisheries and Aquaculture 2020: Sustainability in Action; FAO: Rome, Italy, 2020. [Google Scholar]
  12. Lai, Q.; Ma, J.; He, F.; Zhang, A.; Pei, D.; Yu, M. Current and Future Potential of Shellfish and Algae Mariculture Carbon Sinks in China. Int. J. Environ. Res. Public Health 2022, 19, 8873. [Google Scholar] [CrossRef] [PubMed]
  13. Gu, Y.; Lyu, S.; Wang, L.; Chen, Z.; Wang, X. Assessing the Carbon Sink Capacity of Coastal Mariculture Shellfish Resources in China from 1981–2020. Front. Mar. Sci. 2022, 9, 981569. [Google Scholar] [CrossRef]
  14. Ma, Q.; Liang, S.; Zhang, R.; Sun, Z. Siting and Evaluation of Offshore Suspended Mussel Farms through Nutritional Restriction Approach. Aquaculture 2024, 578, 739989. [Google Scholar] [CrossRef]
  15. Xu, Z.; Qin, H.; Li, P.; Liu, R. Computational Fluid Dynamics Approaches to Drag and Wake of a Long-Line Mussel Dropper under Tidal Current. Sci. Prog. 2020, 103, 36850419901235. [Google Scholar] [CrossRef] [PubMed]
  16. Lin, J.; Li, C.; Zhang, S. Hydrodynamic Effect of a Large Offshore Mussel Suspended Aquaculture Farm. Aquaculture 2016, 451, 147–155. [Google Scholar] [CrossRef]
  17. O’Donncha, F.; Hartnett, M.; Nash, S. Physical and Numerical Investigation of the Hydrodynamic Implications of Aquaculture Farms. Aquacult. Eng. 2013, 52, 14–26. [Google Scholar] [CrossRef]
  18. Newell, C.R.; Richardson, J. The Effects of Ambient and Aquaculture Structure Hydrodynamics on the Food Supply and Demand of Mussel Rafts. J. Shellfish Res. 2014, 33, 257–272. [Google Scholar] [CrossRef]
  19. Pilditch, C.A.; Grant, J. Effect of Variations in Flow Velocity and Phytoplankton Concentration on Sea Scallop (Placopecten Magellanicus) Grazing Rates. J. Exp. Mar. Biol. Ecol. 1999, 240, 111–136. [Google Scholar] [CrossRef]
  20. Shi, J.; Wei, H.; Zhao, L.; Yuan, Y.; Fang, J.; Zhang, J. A Physical–Biological Coupled Aquaculture Model for a Suspended Aquaculture Area of China. Aquaculture 2011, 318, 412–424. [Google Scholar] [CrossRef]
  21. Stevens, C.; Petersen, J. Turbulent, Stratified Flow through a Suspended Shellfish Canopy: Implications for Mussel Farm Design. Aquac. Environ. Interact. 2011, 2, 87–104. [Google Scholar] [CrossRef]
  22. Wiles, P.J.; Van Duren, L.A.; Häse, C.; Larsen, J.; Simpson, J.H. Stratification and Mixing in the Limfjorden in Relation to Mussel Culture. J. Mar. Syst. 2006, 60, 129–143. [Google Scholar] [CrossRef]
  23. Konstantinou, Z.I.; Kombiadou, K. Rethinking Suspended Mussel-Farming Modelling: Combining Hydrodynamic and Bio-Economic Models to Support Integrated Aquaculture Management. Aquaculture 2020, 523, 735179. [Google Scholar] [CrossRef]
  24. Plew, D.R. Depth-Averaged Drag Coefficient for Modeling Flow through Suspended Canopies. J. Hydraul. Eng. 2011, 137, 234–247. [Google Scholar] [CrossRef]
  25. Tseung, H.L.; Kikkert, G.A.; Plew, D. Hydrodynamics of Suspended Canopies with Limited Length and Width. Environ. Fluid Mech. 2016, 16, 145–166. [Google Scholar] [CrossRef]
  26. Zhong, W.; Lin, J.; Zou, Q.; Yamazaki, H.; Yang, W.; Yang, G. Impacts of Large-Scale Suspended Mussel Farm on Seston Depletion. Estuar. Coast. Shelf Sci. 2024, 300, 108710. [Google Scholar] [CrossRef]
  27. Duarte, P.; Fernández-Reiriz, M.J.; Labarta, U. Modelling Mussel Growth in Ecosystems with Low Suspended Matter Loads Using a Dynamic Energy Budget Approach. J. Sea Res. 2012, 67, 44–57. [Google Scholar] [CrossRef]
  28. Faltas, M.S.; El-Sapa, S. Rectilinear Oscillations of Two Spherical Particles Embedded in an Unbounded Viscous Fluid. Microsyst. Technol. 2019, 25, 39–49. [Google Scholar] [CrossRef]
  29. Al-Hanaya, A.; El-Sapa, S. Impact of Slippage on the Wall Correction Rotation Factor of MHD Couple Stress Fluid between Two Concentric Spheres. Results Eng. 2023, 20, 101463. [Google Scholar] [CrossRef]
  30. Wu, Y.; Yang, G.; Zhong, W.; Zhang, X.; Zhao, J.; Lin, J. Interaction between Stocking Density and Hydrodynamic on the Growth of Mytilus Coruscus in Suspended Cultures. Aquaculture 2026, 614, 743481. [Google Scholar] [CrossRef]
  31. Guan, Y.; Lin, J.; Jiao, J.; Liu, H. The characteristics of phytoplankton community of mussel raft farms and surrounding waters under high filtration pressure. Mar. Environ. Sci. 2022, 41, 543–553. (In Chinese) [Google Scholar] [CrossRef]
  32. Tan, Y.; Zhong, W.; Lin, J.; Zhao, J. Numerical Simulation of Flow Resistance Effect around the Suspended Mussel Aquaculture. J. Fish. China 2025, 50, 1–13. [Google Scholar] [CrossRef]
  33. Lei, X.; Wang, L.; Zhou, Y.; Mao, X. Parameterized Model for Drag Coefficient of Raft Culture in Coastal Waters and Its Application for Hydrodynamic Environment Effect Evaluation. J. Hydrol. 2022, 612, 128027. [Google Scholar] [CrossRef]
  34. Fan, X.; Wei, H.; Yuan, Y.; Zhao, L. Vertical Structure of Tidal Current in a Typically Coastal Raft-Culture Area. Cont. Shelf Res. 2009, 29, 2345–2357. [Google Scholar] [CrossRef]
  35. Rosland, R.; Bacher, C.; Strand, Ø.; Aure, J.; Strohmeier, T. Modelling Growth Variability in Longline Mussel Farms as a Function of Stocking Density and Farm Design. J. Sea Res. 2011, 66, 318–330. [Google Scholar] [CrossRef]
  36. Comeau, L.A.; Drapeau, A.; Landry, T.; Davidson, J. Development of Longline Mussel Farming and the Influence of Sleeve Spacing in Prince Edward Island, Canada. Aquaculture 2008, 281, 56–62. [Google Scholar] [CrossRef]
  37. Drapeau, A.; Comeau, L.A.; Landry, T.; Stryhn, H.; Davidson, J. Association between Longline Design and Mussel Productivity in Prince Edward Island, Canada. Aquaculture 2006, 261, 879–889. [Google Scholar] [CrossRef]
  38. Meng, F.; Xu, H.; Gao, Z.; Li, Q. Real-Time Trajectory Planning of Unmanned Surface Vehicles: A Constraint-Embedded Model Predictive Control Approach. Ocean Eng. 2026, 363, 126812. [Google Scholar] [CrossRef]
  39. Yan, C.; McWilliams, J.C.; Chamecki, M. Generation of Attached Langmuir Circulations by a Suspended Macroalgal Farm. J. Fluid Mech. 2021, 915, A76. [Google Scholar] [CrossRef]
  40. Bo, T.; McWilliams, J.C.; Chamecki, M. Oceanic Mixing and Waves in the Presence of a Suspended Canopy. J. Fluid Mech. 2025, 1007, A35. [Google Scholar] [CrossRef]
  41. Venayagamoorthy, S.K.; Ku, H.; Fringer, O.B.; Chiu, A.; Naylor, R.L.; Koseff, J.R. Numerical Modeling of Aquaculture Dissolved Waste Transport in a Coastal Embayment. Environ. Fluid Mech. 2011, 11, 329–352. [Google Scholar] [CrossRef]
  42. Jiang, Z.; Fang, J.; Men, Q.; Wang, W. Studies on the Interaction between Shellfish Long-Line Culture and Environment in Sungo Bay. South China Fish. Sci. 2006, 2, 23–29. [Google Scholar]
  43. Shao, D.; Huang, L.; Wang, R.-Q.; Gualtieri, C.; Cuthbertson, A. Flow Turbulence Characteristics and Mass Transport in the Near-Wake Region of an Aquaculture Cage Net Panel. Water 2021, 13, 294. [Google Scholar] [CrossRef]
  44. Ji, M.; Zou, W.; Long, Y.; Ye, J. Research on Cage Layout Mode Based on Numerical Simulation of Flow Field Disturbance Response and Suspended Particulate Matter Diffusion: A Case Study of the Nanpeng Island Wind Power Sea Area in Yangjiang City, China. Sustainability 2025, 17, 7679. [Google Scholar] [CrossRef]
  45. Hu, B.; Li, J.; Ruan, J.; Hao, J.; Huang, J. Characterization of the Internal and External Flow Field of a Semi-Submersible Aquaculture Platform with Multiple Net Cage Configuration. J. Mar. Sci. Eng. 2025, 13, 1373. [Google Scholar] [CrossRef]
  46. Jiang, X.; Tu, J.; Fan, D. The Influence of a Suspended Cage Aquaculture Farm on the Hydrodynamic Environment in a Semienclosed Bay, SE China. Front. Mar. Sci. 2022, 8, 779866. [Google Scholar] [CrossRef]
  47. Plew, D.R.; Enright, M.P.; Nokes, R.I.; Dumas, J.K. Effect of Mussel Bio-Pumping on the Drag on and Flow around a Mussel Crop Rope. Aquacult. Eng. 2009, 40, 55–61. [Google Scholar] [CrossRef]
  48. Plew, D.R.; Spigel, R.H.; Stevens, C.L.; Nokes, R.I.; Davidson, M.J. Stratified Flow Interactions with a Suspended Canopy. Environ. Fluid Mech. 2006, 6, 519–539. [Google Scholar] [CrossRef]
  49. Bo, T.; McWilliams, J.C.; Frieder, C.A.; Davis, K.A.; Chamecki, M. Nutrient Replenishment by Turbulent Mixing in Suspended Macroalgal Farms. Geophys. Res. Lett. 2024, 51, e2024GL109128. [Google Scholar] [CrossRef]
  50. Jackson, G.A. Currents in the High Drag Environment of a Coastal Kelp Stand off California. Cont. Shelf Res. 1997, 17, 1913–1928. [Google Scholar] [CrossRef]
Figure 1. Schematic diagram of the non-uniform hanging-depth layout and vertical structure of a suspended mussel farm. (a) Planform arrangement of aquaculture blocks. The central aquaculture block shows the V-shaped configuration; 0° and 90° denote inflow angles. (b) Vertical structure of the aquaculture block, prescribed inlet velocity profile, and conceptual normalized chlorophyll-a profiles. Profiles I–III represent conditions outside the farm, within the farm, and after the upward redistribution of chlorophyll-a-rich subsurface water, respectively.
Jmse 14 01418 g001
Figure 2. Schematic illustration of mussel sleeve-hanging configurations. (a) V-shaped; (b) inverted V-shaped; (c) uniform-depth (90° inflow angle); (d) V-shaped (extended); and (e) inverted V-shaped (extended).
Jmse 14 01418 g002
Figure 3. Measured vertical profiles of density and velocity. The red solid line denotes velocity, and the blue dashed line denotes density.
Jmse 14 01418 g003
Figure 4. Schematic layout of the statistical regions and mussel sleeve array. (a) Plan view showing the streamwise statistical regions S1–S6 and the transverse width used for statistical analysis; (b) side view showing the vertical distribution of the mussel sleeves.
Jmse 14 01418 g004
Figure 5. PIV flume experiment and velocity sampling arrangement for the V-shaped configuration. (a) Photograph of the central vertical measurement plane. (b) Velocity sampling line and nine sampling points downstream of the sleeve array.
Jmse 14 01418 g005
Figure 6. Comparison of velocities at nine sampling points between PIV measurements and CFD simulations. The left and right axes correspond to PIV-measured and CFD-simulated velocities, respectively. Error bars denote the temporal standard deviations calculated from the velocity time series at each monitoring point over the respective sampling periods.
Jmse 14 01418 g006
Figure 7. Velocity distributions in the central vertical plane for Cases 1–12. (ae) Uniform inflow without density stratification; (f) uniform inflow with density stratification; (gk) measured velocity-profile inflow with density stratification; and (l) measured velocity-profile inflow without density stratification. Configurations are V-shaped (a,f,g,l), inverted V-shaped (b,h), uniform-depth (c,i), V-shaped (extended) (d,j), and inverted V-shaped (extended) (e,k).
Jmse 14 01418 g007
Figure 8. Tracer concentration distributions in the central vertical plane for Cases 1–12. (ae) Uniform inflow without density stratification; (f) uniform inflow with density stratification; (gk) measured velocity-profile inflow with density stratification; and (l) measured velocity-profile inflow without density stratification. Configurations are V-shaped (a,f,g,l), inverted V-shaped (b,h), uniform-depth (c,i), V-shaped (extended) (d,j), and inverted V-shaped (extended) (e,k).
Jmse 14 01418 g008
Figure 9. Vertical tracer concentration distributions across S1–S6 under uniform inflow. (ae) V-shaped, inverted V-shaped, uniform-depth, V-shaped (extended), and inverted V-shaped (extended) configurations without density stratification; (f) V-shaped configuration with density stratification. Panels (af) correspond to Cases 1–6 in Table 1. Blue triangles mark the tracer release-layer boundaries.
Jmse 14 01418 g009
Figure 10. Vertical tracer concentration distributions across S1–S6 under measured velocity-profile inflow. (ae) V-shaped, inverted V-shaped, uniform-depth, V-shaped (extended), and inverted V-shaped (extended) configurations with density stratification; (f) V-shaped configuration without density stratification. Panels (af) correspond to Cases 7–12 in Table 1. Blue triangles mark the tracer release-layer boundaries.
Jmse 14 01418 g010
Figure 11. Richardson number distributions in the central vertical plane under density-stratified conditions. (a) V-shaped configuration under uniform inflow, corresponding to Case 6; (bf) V-shaped, inverted V-shaped, uniform-depth, V-shaped (extended), and inverted V-shaped (extended) configurations under measured velocity-profile inflow, corresponding to Cases 7–11, respectively.
Jmse 14 01418 g011
Table 1. Settings of numerical simulation cases.
Case GroupInflow
Condition
Density StratificationHanging Configuration
IUniform
velocity inlet
AbsentCase 0: Uniform-depth (0° inflow angle)
Case 1: V-shaped
Case 2: Inverted V-shaped
Case 3: Uniform-depth (90° inflow angle)
Case 4: V-shaped (extended)
Case 5: Inverted V-shaped (extended)
Uniform
velocity inlet
PresentCase 6: V-shaped
IIMeasured
velocity-profile inlet
PresentCase 7: V-shaped
Case 8: Inverted V-shaped
Case 9: Uniform-depth (90° inflow angle)
Case 10: V-shaped (extended)
Case 11: Inverted V-shaped (extended)
Measured
velocity-profile inlet
AbsentCase 12: V-shaped
Note: Case 0 represents the existing uniform-depth layout (0° inflow) used as a reference. Case 6 is the stratified comparison case under the uniform velocity-inlet condition, whereas Case 12 is the unstratified comparison case under the measured velocity-profile inlet condition.
Table 2. Tracer concentrations in the 2–3 m layer below the water surface across S1–S6 for Cases 0–12.
CaseS1S2S3S4S5S6
Case 00.00210.00930.03530.05590.11690.1918
Case 10.01450.13620.12770.13090.16170.1533
Case 20.03930.01860.04220.06580.10120.1313
Case 30.00170.00260.02480.05750.12690.1551
Case 40.00310.03390.07190.14100.18040.2071
Case 50.01310.04280.22090.18360.18210.2135
Case 60.01300.11310.07160.05240.03390.0389
Case 70.05980.18600.03580.03750.09900.1999
Case 80.09580.05880.07470.04660.10020.2093
Case 90.01380.06140.11230.13790.18840.2614
Case 100.02630.09590.03420.04200.10940.2202
Case 110.07170.07250.04560.03210.10540.2202
Case 120.07230.26190.22820.19710.20490.2176
Table 3. Tracer concentrations in the 1–4 m layers below the water surface within the aquaculture block (S1 and S2) under uniform inflow conditions.
CaseS1S2
1–2 m2–3 m3–4 m1–2 m2–3 m3–4 m
Case 00.00000.00210.08040.00050.00930.0509
Case 10.00010.01450.11390.01800.13620.1822
Case 20.00020.03930.21190.00010.01860.1490
Case 30.00000.00170.06800.00010.00260.0337
Case 40.00010.00310.08950.00170.03390.2023
Case 50.00000.01310.16900.00080.04280.1803
Case 60.00010.01300.10610.00800.11310.1992
Table 4. Tracer concentrations in the 1–4 m layers below the water surface within the aquaculture block (S1 and S2) under measured velocity-profile inflow conditions.
CaseS1S2
1–2 m2–3 m3–4 m1–2 m2–3 m3–4 m
Case 70.00400.05980.20320.02720.18600.3110
Case 80.00220.09580.29410.00490.05880.2150
Case 90.00030.01380.13860.00630.06140.1487
Case 100.00190.02630.20280.00810.09590.3858
Case 110.00400.07170.32480.00700.07250.2768
Case 120.00710.07230.22030.19710.26190.2654
Disclaimer/Publisher’s Note: The statements, opinions and data contained in all publications are solely those of the individual author(s) and contributor(s) and not of MDPI and/or the editor(s). MDPI and/or the editor(s) disclaim responsibility for any injury to people or property resulting from any ideas, methods, instructions or products referred to in the content.