Article

Carbonate Microfacies of the Coniacian–Santonian (Cretaceous) Deposits near the Kazerun Fault (Southwestern Iran): Evidence from Wells in a Divided Domain of the Zagros Basin

by
Fatemeh Moradi-Doreh
1,
Tahereh Habibi
1,*,
Dmitry A. Ruban
2 and
Rohollah Hosseinzadeh
3
1
Department of Earth Sciences, College of Sciences, Shiraz University, Shiraz 71454, Iran
2
Institute of Tourism, Service and Creative Industries, Southern Federal University, 23-ja Linija Street 43, Rostov-on-Don 344019, Russia
3
Exploration Management of National Iranian Oil Company, Tehran 1994814695, Iran
*
Author to whom correspondence should be addressed.
J. Mar. Sci. Eng. 2026, 14(13), 1227; https://doi.org/10.3390/jmse14131227
Submission received: 3 June 2026 / Revised: 29 June 2026 / Accepted: 30 June 2026 / Published: 1 July 2026
(This article belongs to the Section Geological Oceanography)

Abstract

Heterogeneities of Late Cretaceous tropical carbonate platforms of the Middle East are yet to be fully understood. The analysis of carbonate microfacies with materials obtained from exploration wells can contribute to filling the noted gap. The present study focuses on the Coniacian–Santonian deposits near the Kazerun fault in the central part of the southern Zagros. The material from two exploration wells drilled east of this fault was used to establish carbonate microfacies and shale lithofacies and propose a depositional model. Six carbonate microfacies signify the existence of a homoclinal ramp, and inner-ramp environments were especially common. The stratigraphical distribution of the established microfacies made it possible to document a long-term transgression–regression cycle, which looks dissimilar to the global sea-level changes. Another control of this cycle might have been tectonic activity, particularly the activity of the Kazerun fault. The comparison of the lines of evidence from two wells east of this fault and two other wells west of this fault indicates striking differences.

1. Introduction

The Zagros is a giant geological domain of the Middle East, and its studies have played a significant role in the general understanding of fold–thrust belts [1,2,3]. This domain has also become a focus of research dealing with the long-term development of large hydrocarbon systems [4,5]. The evolution of the Zagros was related closely to the large-scale geological processes in the Mediterranean (sensu lato) and Central Asian regions [6,7,8].
Cretaceous carbonate successions of the Zagros sedimentary basin, which is located in the southwestern part of Iran, are among the most famous hydrocarbon reservoirs in the world, and they have attracted the attention of many researchers over several decades [9,10,11,12,13,14]. These studies have shed light on the late Mesozoic sedimentation in tropical seas on the Arabian plate margin. Practically, they have stimulated exploration and subsequent exploitation of the richest hydrocarbon reserves. Despite the long research history, some particular questions about the Cretaceous sedimentary successions of this region remain unanswered. The ongoing geological investigations related to hydrocarbon prospecting bring new information that is useful for answering these questions.
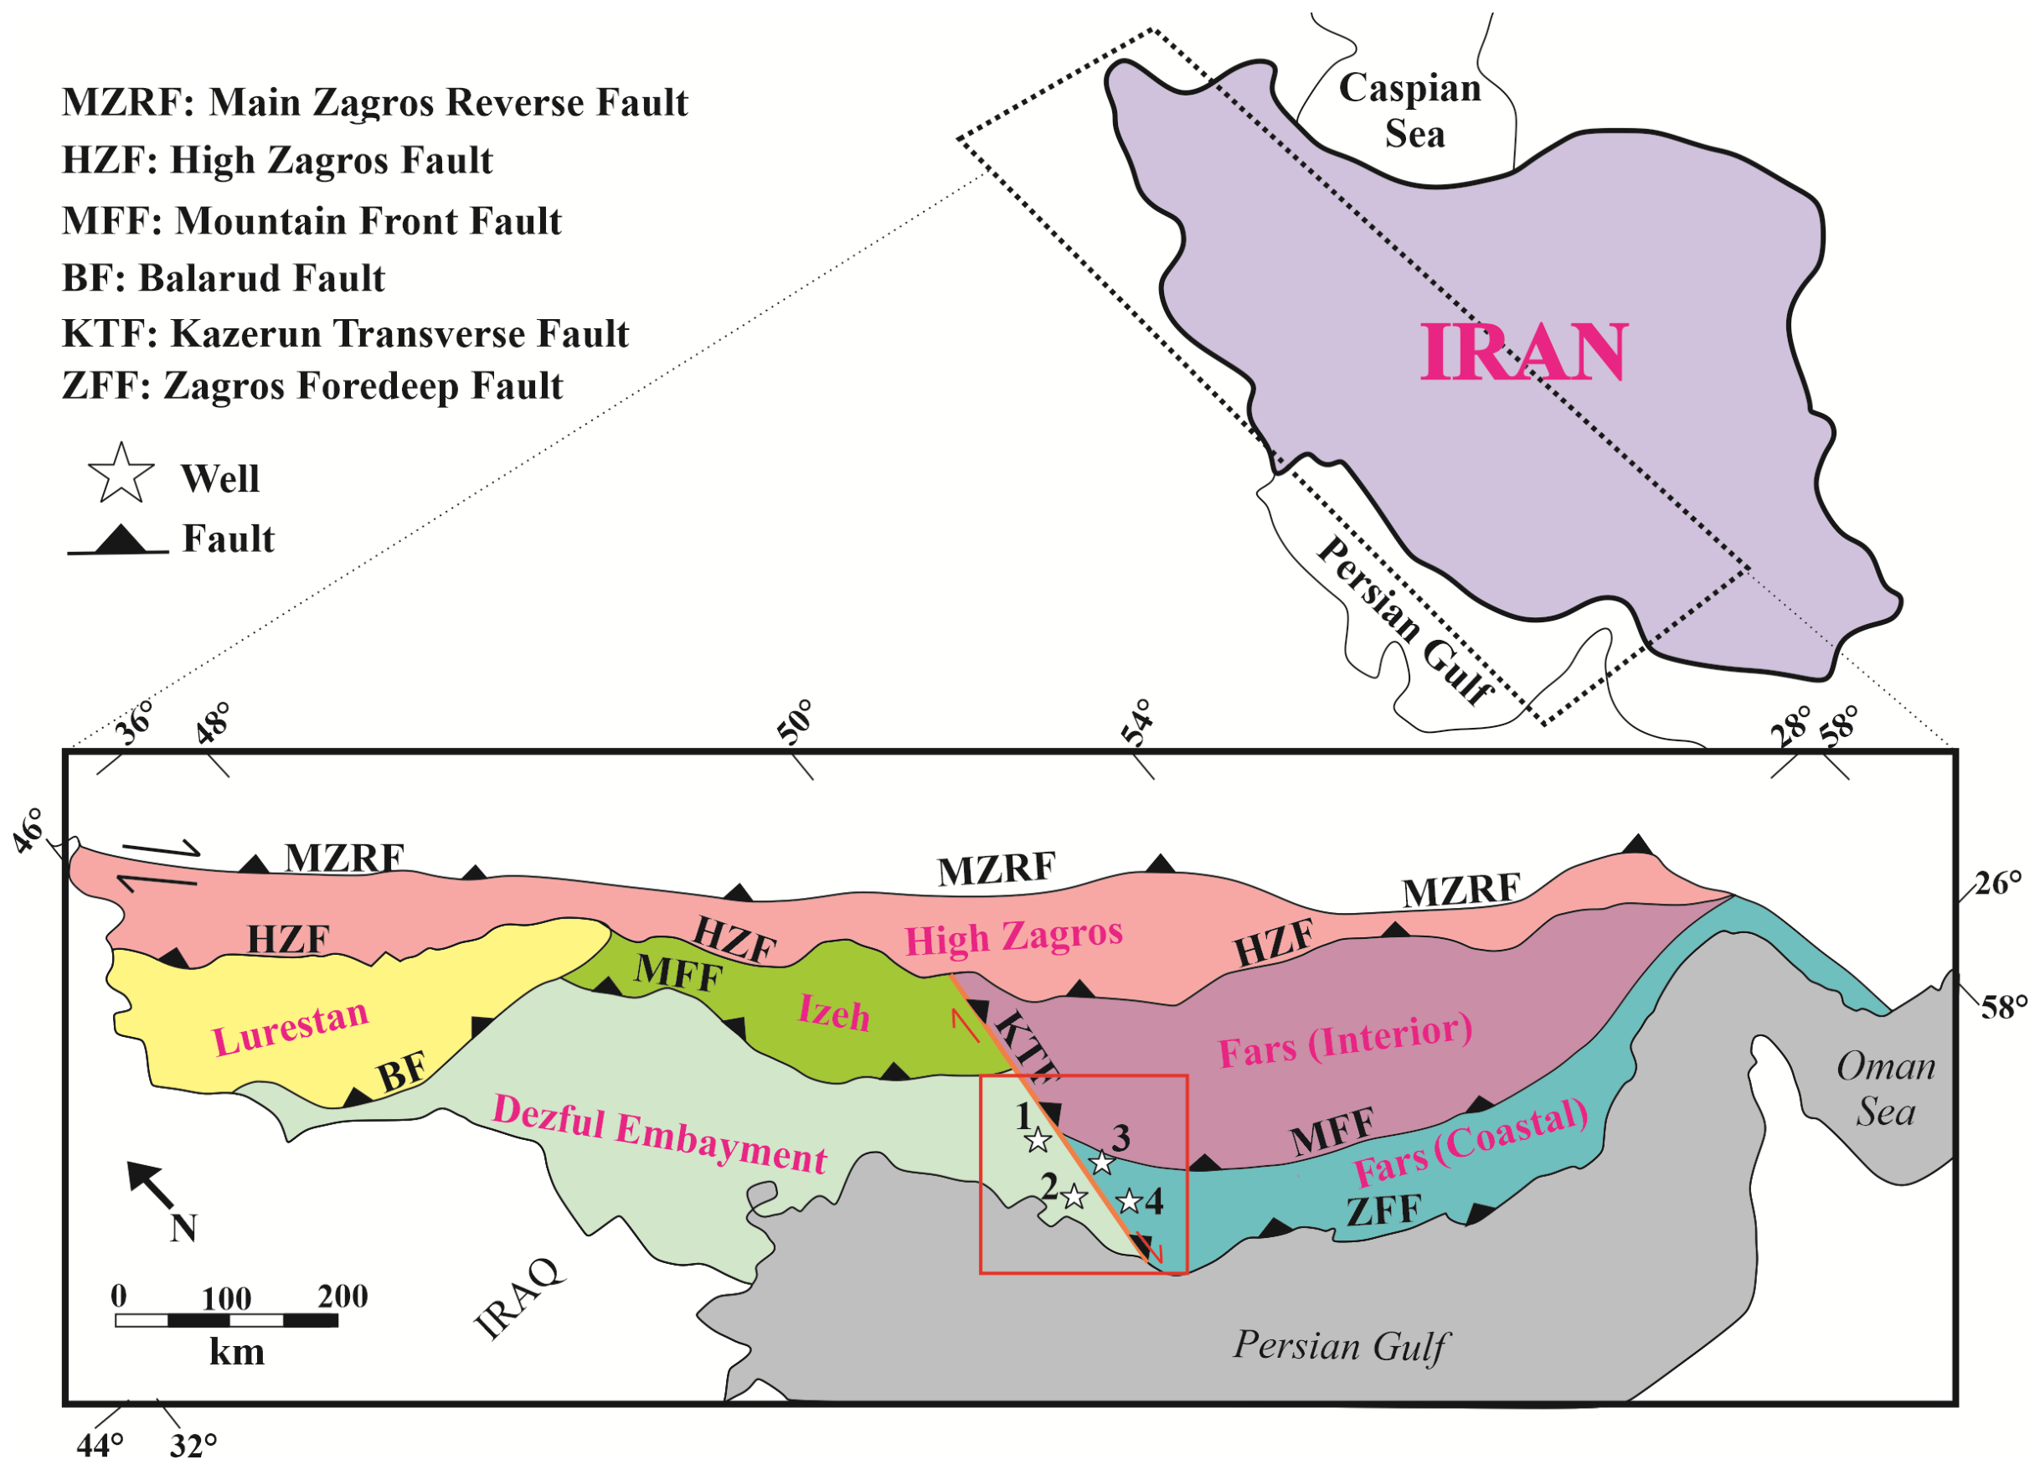
In their seminal work, Sepehr and Cosgrove [15] focused on the Kazerun fault (also known as the fault zone, transverse fault, or transfer fault) that cuts the Zagros Basin almost perpendicularly and separates two large structural units, namely the Dezful Embayment in the west and Fars in the east (Figure 1). The Mountain Front Fault subdivides the Fars unit into the Interior Fars and Coastal Fars sub-basins. The activity of the Kazerun fault accelerated in the Cretaceous [15]. Zadeh et al. [16] proved that this fault was active in the Aptian and influenced the local depositional environment. According to Bagherpour et al. [17], block tilting east of this long-lived deformation zone created lateral changes in the Coniacian–Santonian sequences. The material from the exploration wells drilled near the Kazerun fault can enhance the understanding of the Coniacian–Santonian deposits.
The objective of the present study is the establishment of carbonate microfacies in the Coniacian–Santonian deposits near the Kazerun fault in the central part of the southern Zagros Basin. New material from the exploration wells is employed for this purpose. Carbonate microfacies are important indicators of the depositional environment [18]. Previous studies in different regions of the world such as the Middle East [19], the Moesian Platform [20], and the Volga–Ural Region [21] demonstrated the efficacy of their analyses as the principal approach in studies of carbonate rocks based on materials from exploration wells.

2. Geological Setting

The Zagros Mountains, with a length of ~2000 km and a width of 100–300 km, stretch through a significant part of the Middle East, constitute a dominant feature of southwestern Iran, and reach the Hormoz strait. Tectonically, this is a relatively young, Cenozoic orogen (fold–thrust belt) created by the active contacts of the Arabian plate in the southwest and the Iranian tectonic blocks in the northeast [2,22,23,24,25,26,27,28].
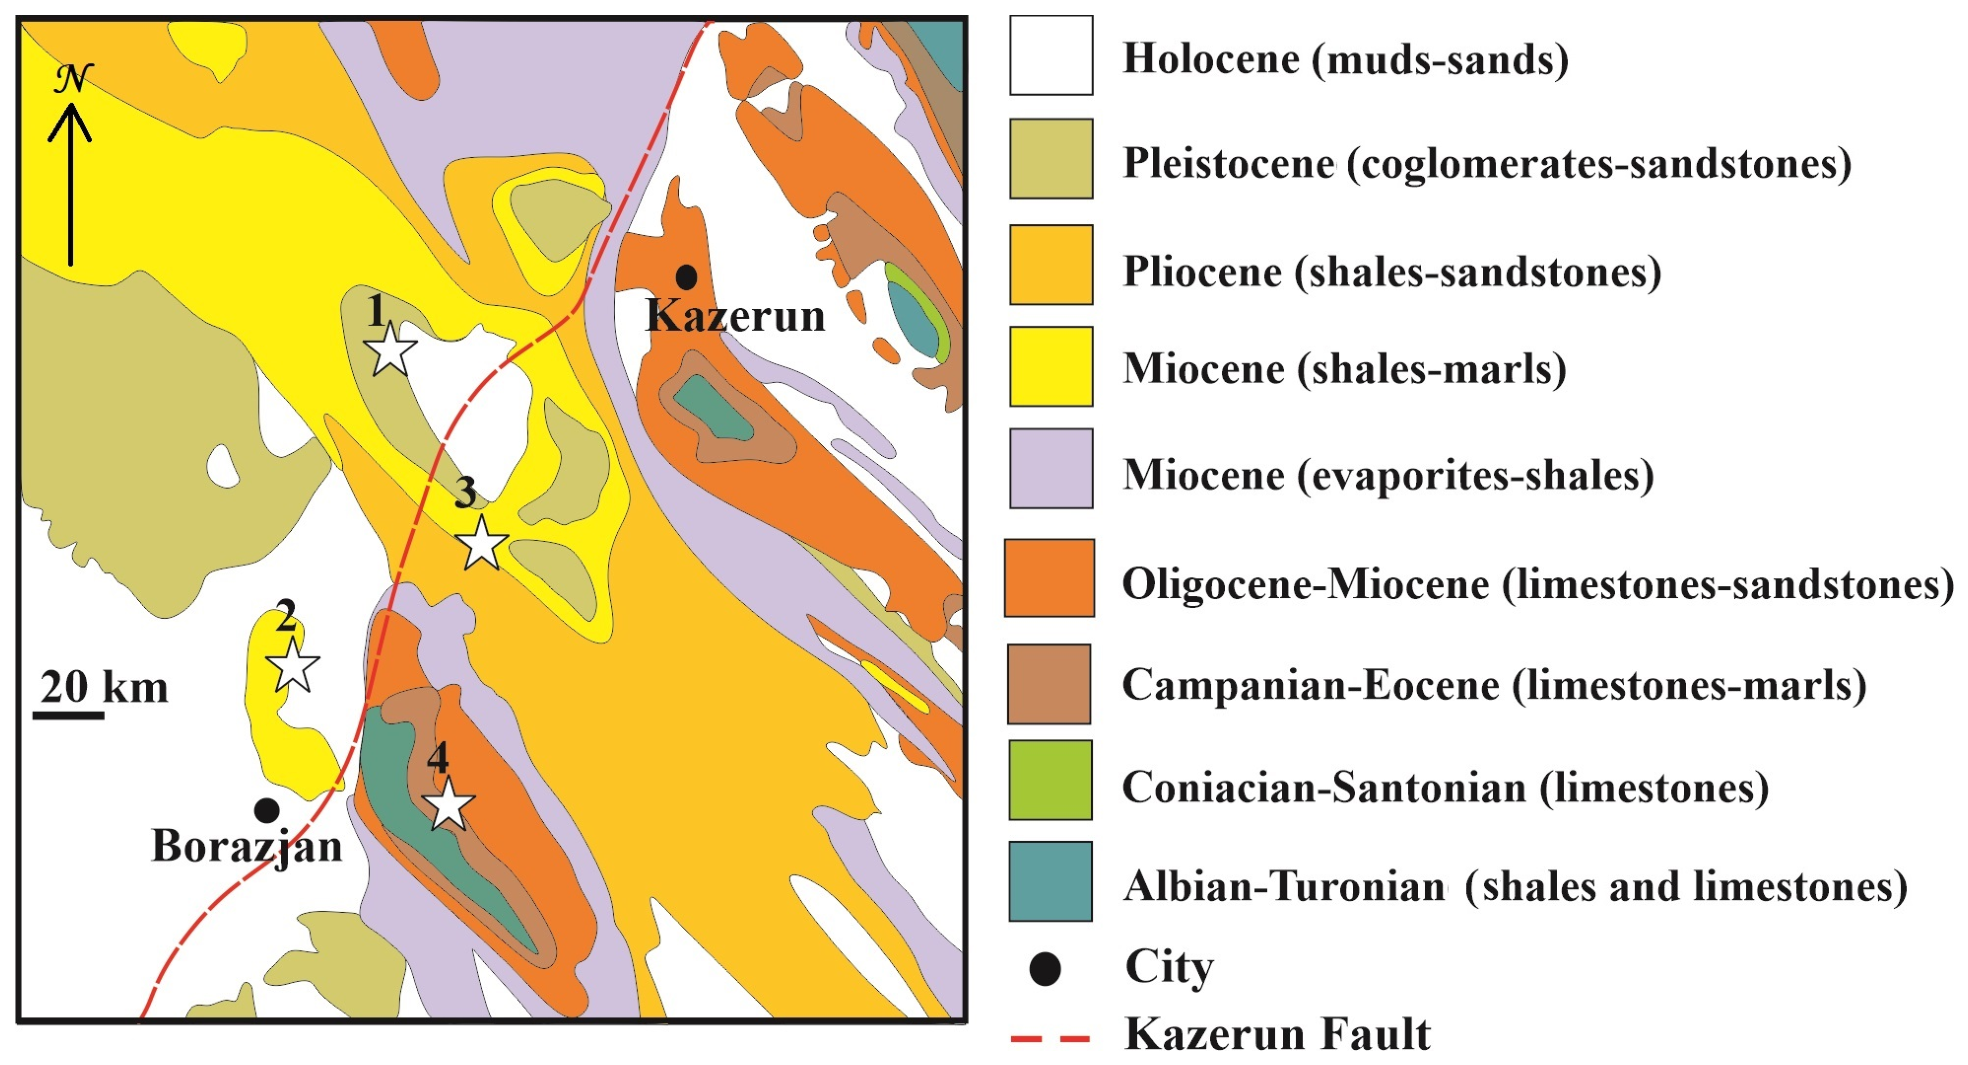
Several major faults divide the Zagros Basin into segments (Figure 1). One of them is the Kazerun fault, which formed in the beginning of the Paleozoic and reactivated in the late Mesozoic–Cenozoic with remaining seismicity [15,16,29,30,31]. The study area is situated in the central part of the southern Zagros, where this fault separates the Dezful Embayment from Coastal Fars (Figure 2). There, chiefly Cenozoic strata crop out. The Bangestan Group of the late Mesozoic age is distributed widely, although usually below the surface.
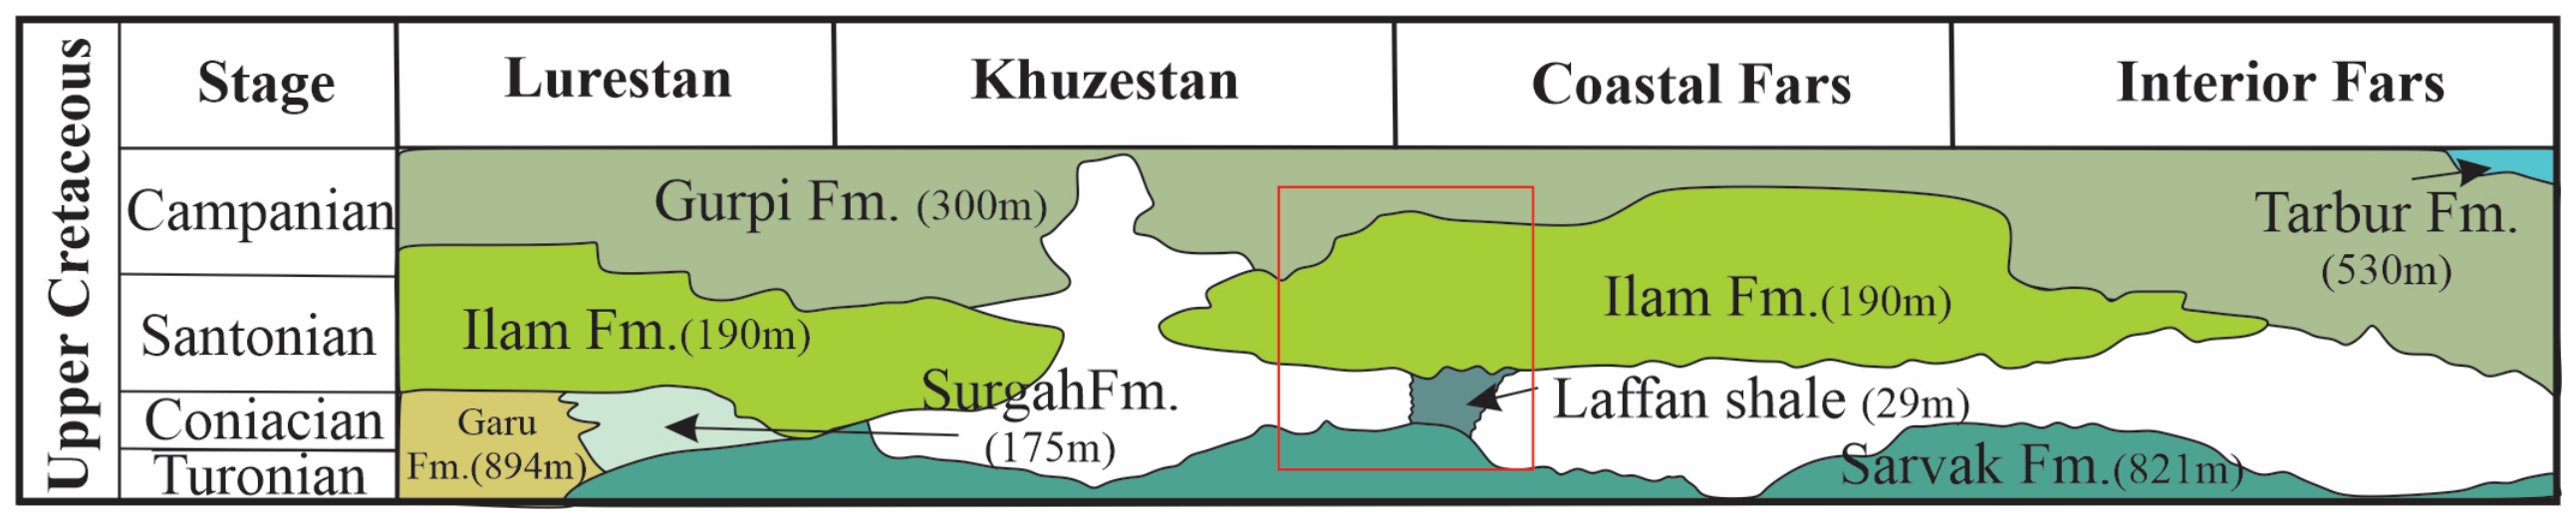
The Bangestan Group consists of several lithostratigraphic units, including the Laffan Shale Member and the Ilam Formation [33,34]. These two units form a sedimentary package bounded by unconformities. At the bottom, the unconformity separates these deposits from the Sarvak Formation (Albian–Turonian). At the top, the other unconformity separates the package from the Gurpi Formation (upper Santonian–Maastrichtian). It should be noted that the mentioned package experiences lateral changes in the Zagros Basin, and the study area represents a domain where this package consists of the two above-mentioned units (Figure 3).
The Laffan Shale Member consists chiefly of grey to green shales with intercalation of limestones. Their total thickness reaches 30 m, but these deposits are locally absent. Previously, this small unit was reported from some oilfields of the Persian Gulf [36,37]. The Ilam Formation, which has been studied particularly by Abedi et al. [38], Adabi and Mehmandosti [39], Bagherpour et al. [17], Fouladvand et al. [40], Khodaei et al. [41], Mehrabi et al. [42], Moghadam et al. [43], and Reza [44], is primarily composed of fossiliferous limestones, dolomites, and marlstones. Their total thickness locally exceeds 120 m, but these deposits are absent in some parts of the study area. Due to its high-quality reservoir characteristics, this formation hosts a large oilfield in the southwest of Iran [40]. Taking into account the previous developments [17,33,34,45,46,47], the age of the considered sedimentary package is Coniacian–Santonian. It should be added that a recent micropaleontological investigation by Hosseini et al. [48] questioned the ages commonly assigned to the Laffan Shale Member and the Ilam Formation: it cannot be excluded that the former is Turonian, and the latter is Turonian–Santonian. Indeed, further investigations are necessary to comprehend these interpretations and to determine whether they are suitable for all areas of the Zagros where the noted units exist. The foraminifer-based biostratigraphical evidence based on the biozones of Wynd [34] and Khalili [49] implies that the Laffan Shale Member is Coniacian and the Ilam Formation is Coniacian–Santonian in the study area.
Following modern plate tectonic reconstructions, the study area was located in the northeastern margin of the African–Arabian lithospheric plate in the Late Cretaceous [50,51]. The Coniacian–Santonian deposits of the study area formed not so far from an outer edge of a large sea (partly epeiric and partly shelfal), which was a marginal sea of the Neo-Tethys ocean [52]. The sea was tropical, with rich ecosystems, and dominated by carbonate deposition. The environment was very favorable for hydrocarbons [53]. The Sanandaj-Sirjan tectonic block was separated from the plate margin by a narrow, deep basin, which was a branch of the Neo-Tethys ocean [52]. If this reconstruction is correct, the study area was situated near the entrance to this branch. However, one should take into account differences in regional geodynamic interpretations [54,55,56,57]. Generally, the study area can be imagined as a tropical marine domain divided into two parts by a major, long-lived fault zone.

3. Materials and Methods

The present study employed the information obtained from four exploration wells drilled in the study area (Figure 1). Two of them are located west of the Kazerun fault, and two others are located east of this lineament. This information made it possible to register the presence/absence of the Laffan Shale Member and the Ilam Formation in the study area. In Well 1, these lithostratigraphic units are absent, and the Sarvak Formation is overlain directly by the Gurpi Formation. In Well 2, only the Ilam Formation with a thickness of only ~1.5 m is registered. In contrast, Well 3 and Well 4 sufficiently represent both units. This is why the present study utilized material from two wells (3 and 4), and it took into account evidence from two other wells (1 and 2) in the subsequent interpretations.
This study refers to the modern version of the geological time scale [58,59]. Microfossil-based biostratigraphical developments by Khalili [49] and Wynd [34] were followed. Particularly, the Laffan Shale Member corresponds generally to biozone 30a (Chara–ostracods facies zone), and the Ilam Formation corresponds to biozone 30 (Rotalia sp.22-algae assemblage zone) and biozone 31 (Archaecyclus-mid-orientalis-Pseudedomia (Fabularia) assemblage zone).
The exploration wells were drilled by the Exploration Management of the National Iranian Oil Company (Iran). The materials provided to the authors included logs of these wells, which were used to construct composite stratigraphic sections (some modifications were made after microscopic examinations), and thin sections suitable for examination of microfacies.
A total of 129 thin sections derived from the cutting chips of Wells 3 and 4 were examined in the paleontological laboratory of the Exploration Management of the National Iranian Oil Company (Tehran, Iran). These investigations made it possible to distinguish several microfacies and lithofacies, with a subsequent proposal of a general depositional model. The rock texture classification based on Dunham [60] and Embry and Klovan [61] for non-reefal and reefal carbonates and the Udden–Wentworth grain-size scale [62,63,64,65,66] were followed. The common principles of carbonate (micro)facies studies [18,67,68] (see also a brief summary in ref. [69]) were applied. The depositional model reflects spatial regularities in the distribution of the registered carbonate facies. In other words, this is an idealized scheme used to summarize the available evidence, and it should be distinguished from real paleogeographical reconstructions, which differ essentially. The utility of such depositional models in carbonate studies has been demonstrated in numerous research projects and, particularly, in the recent works by Aliane and Benmansour [70], Amente et al. [71], and Shah and Shah [72]. Due to some peculiarities of the well drilling, shales were not studied petrographically.
Additionally, the stratigraphical distribution of the established microfacies along the wells made it possible to identify the long-term trajectories of relative sea-level changes. Microfacies related to a shallower environment indicated a relatively low position of the sea level, and microfacies related to a deeper environment indicated a relatively high position of the sea level.
Diagenetic patterns in carbonates of the Ilam Formation were recorded, described with a common terminology [73], and interpreted on the basis of the available knowledge [18,74,75,76,77,78,79,80,81,82,83,84,85]. This information is marginal regarding the objectives of this study, but it is worth reporting (Supplementary Materials).

4. Results

4.1. Microfacies and Lithofacies

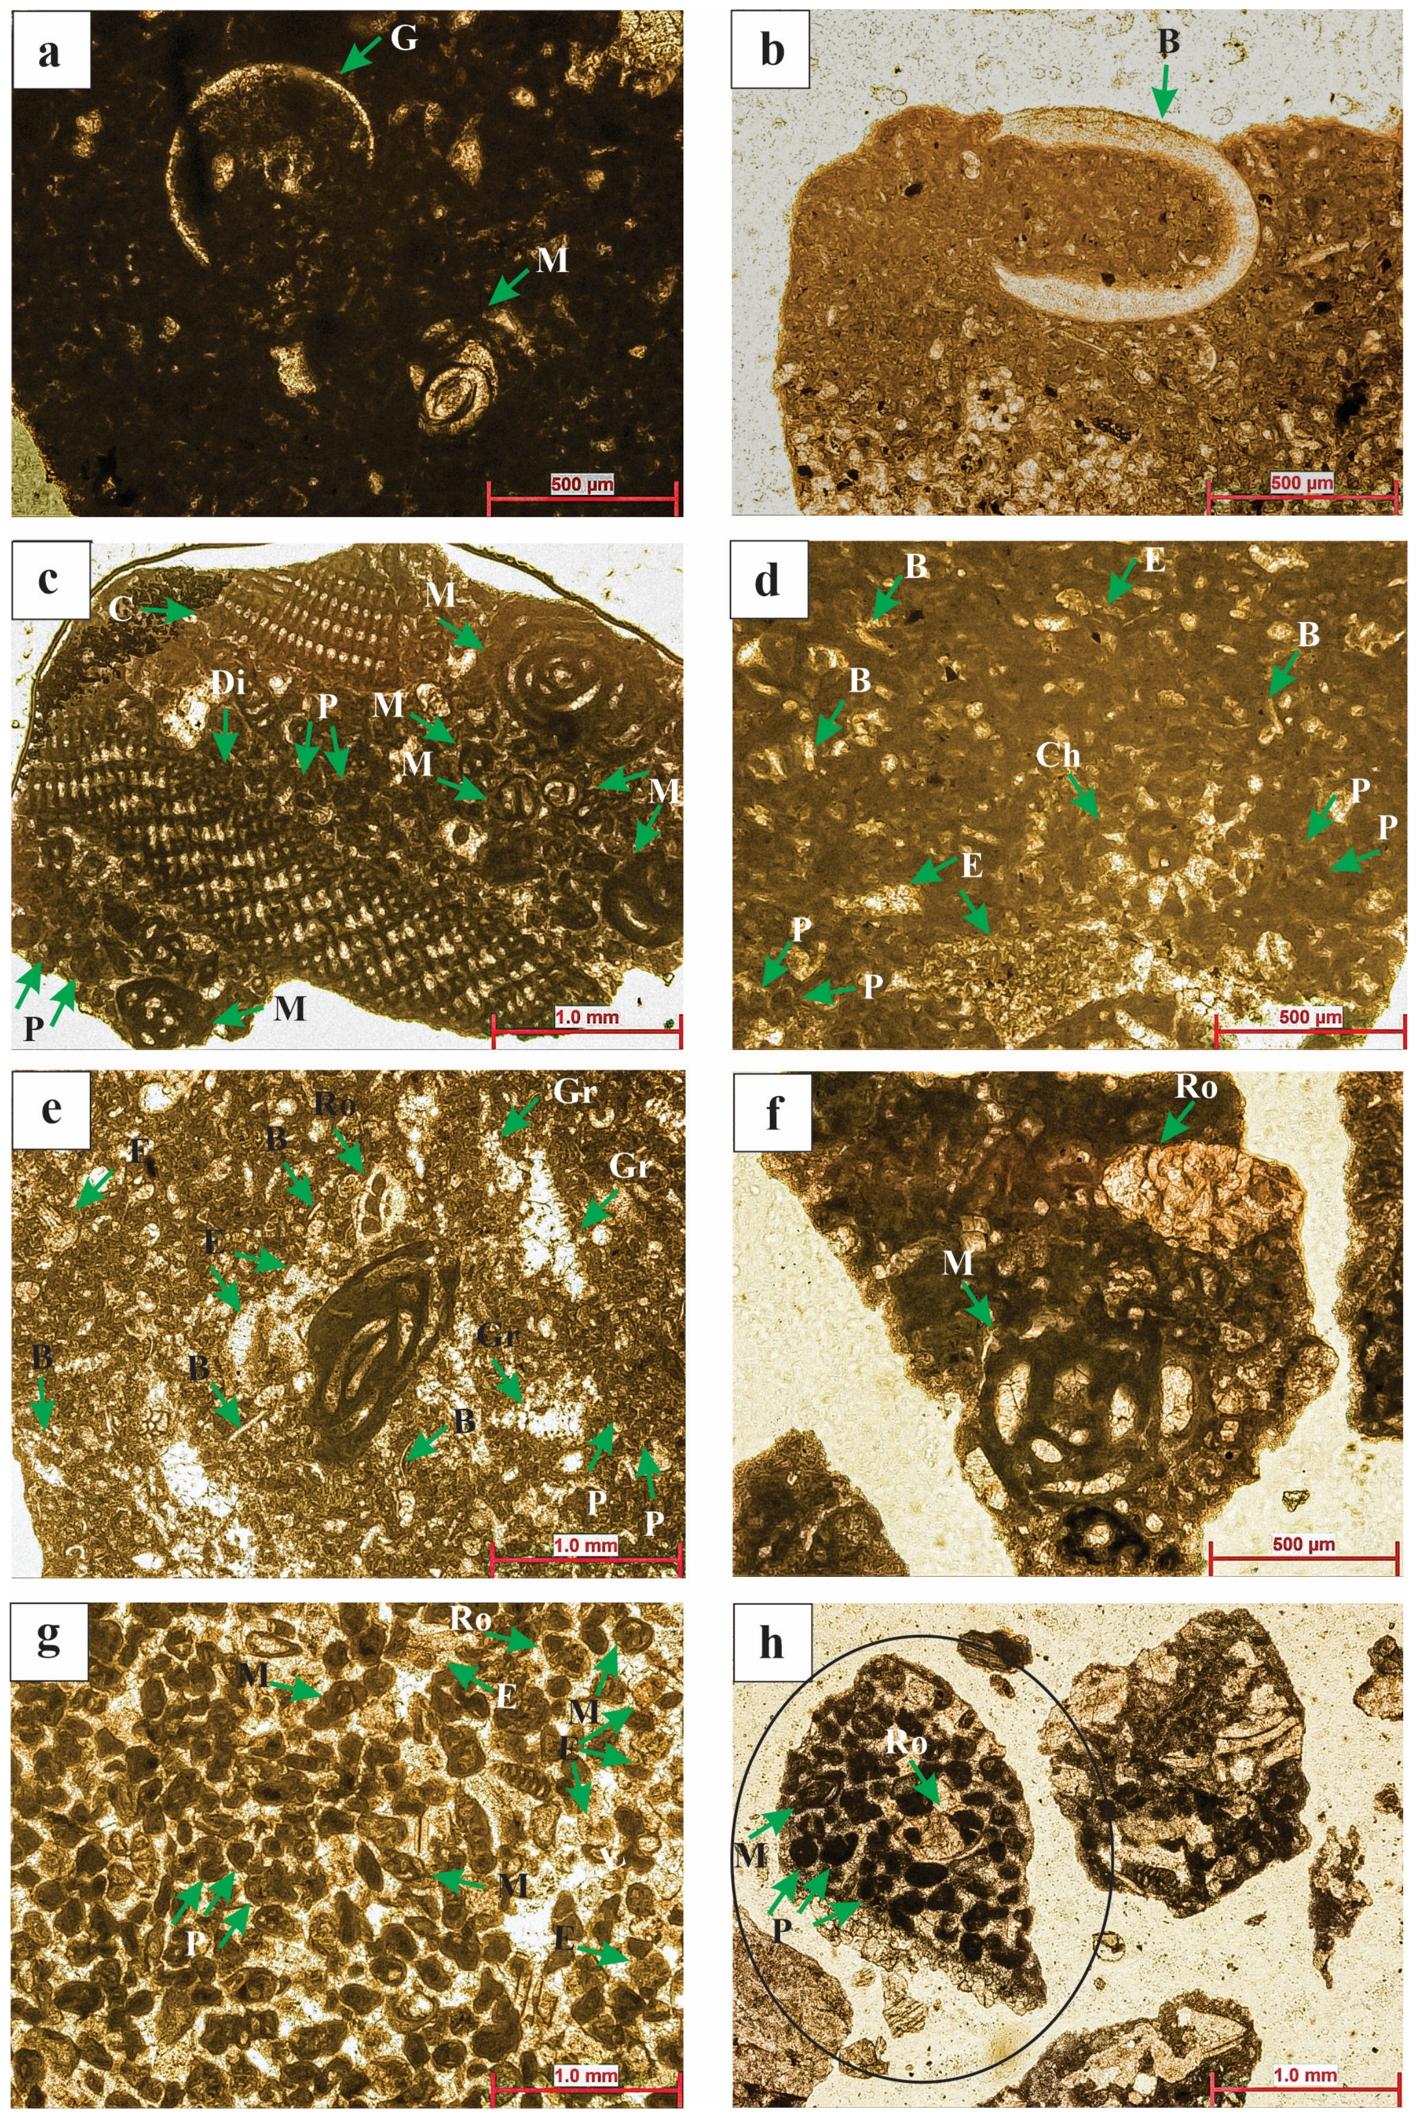
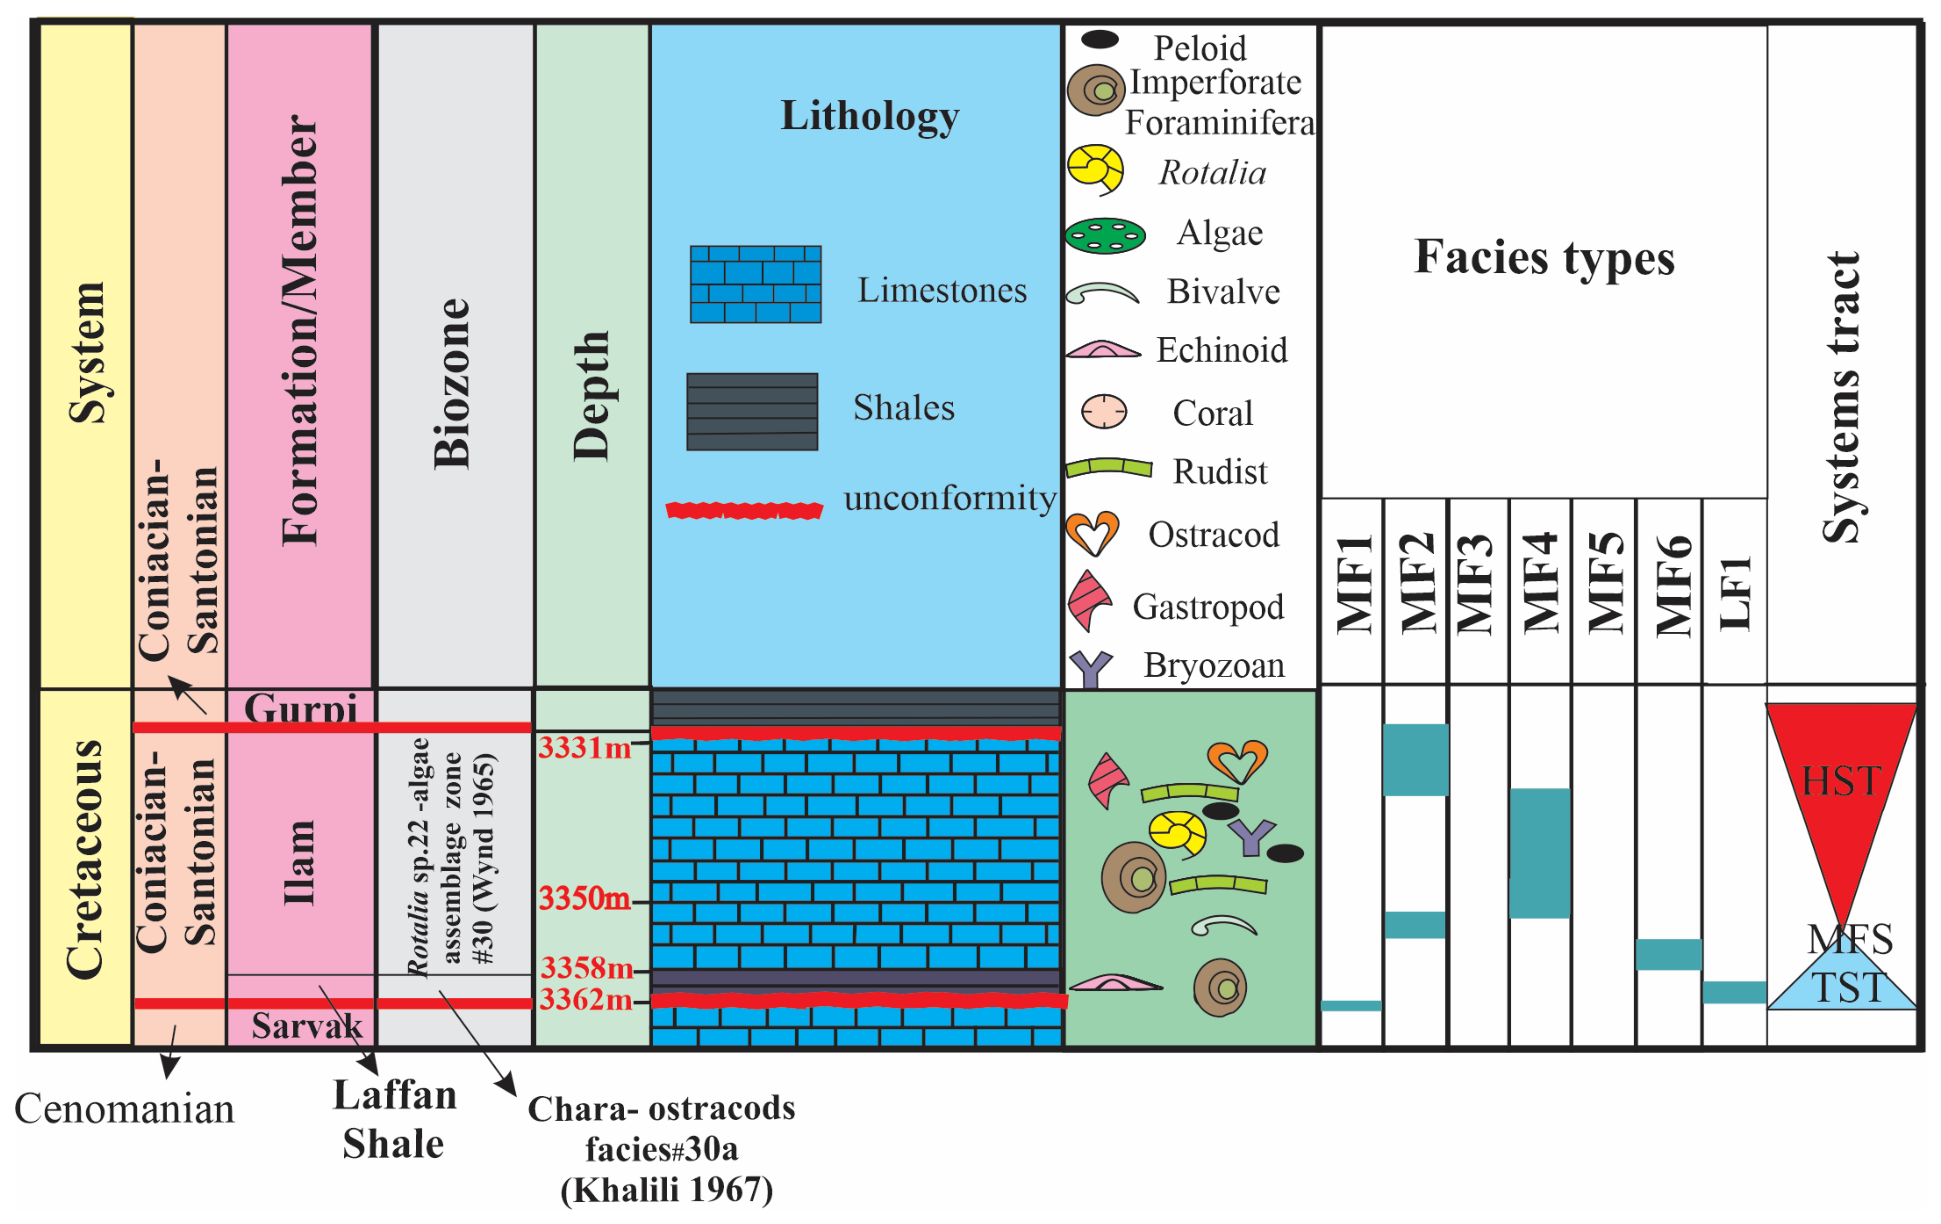
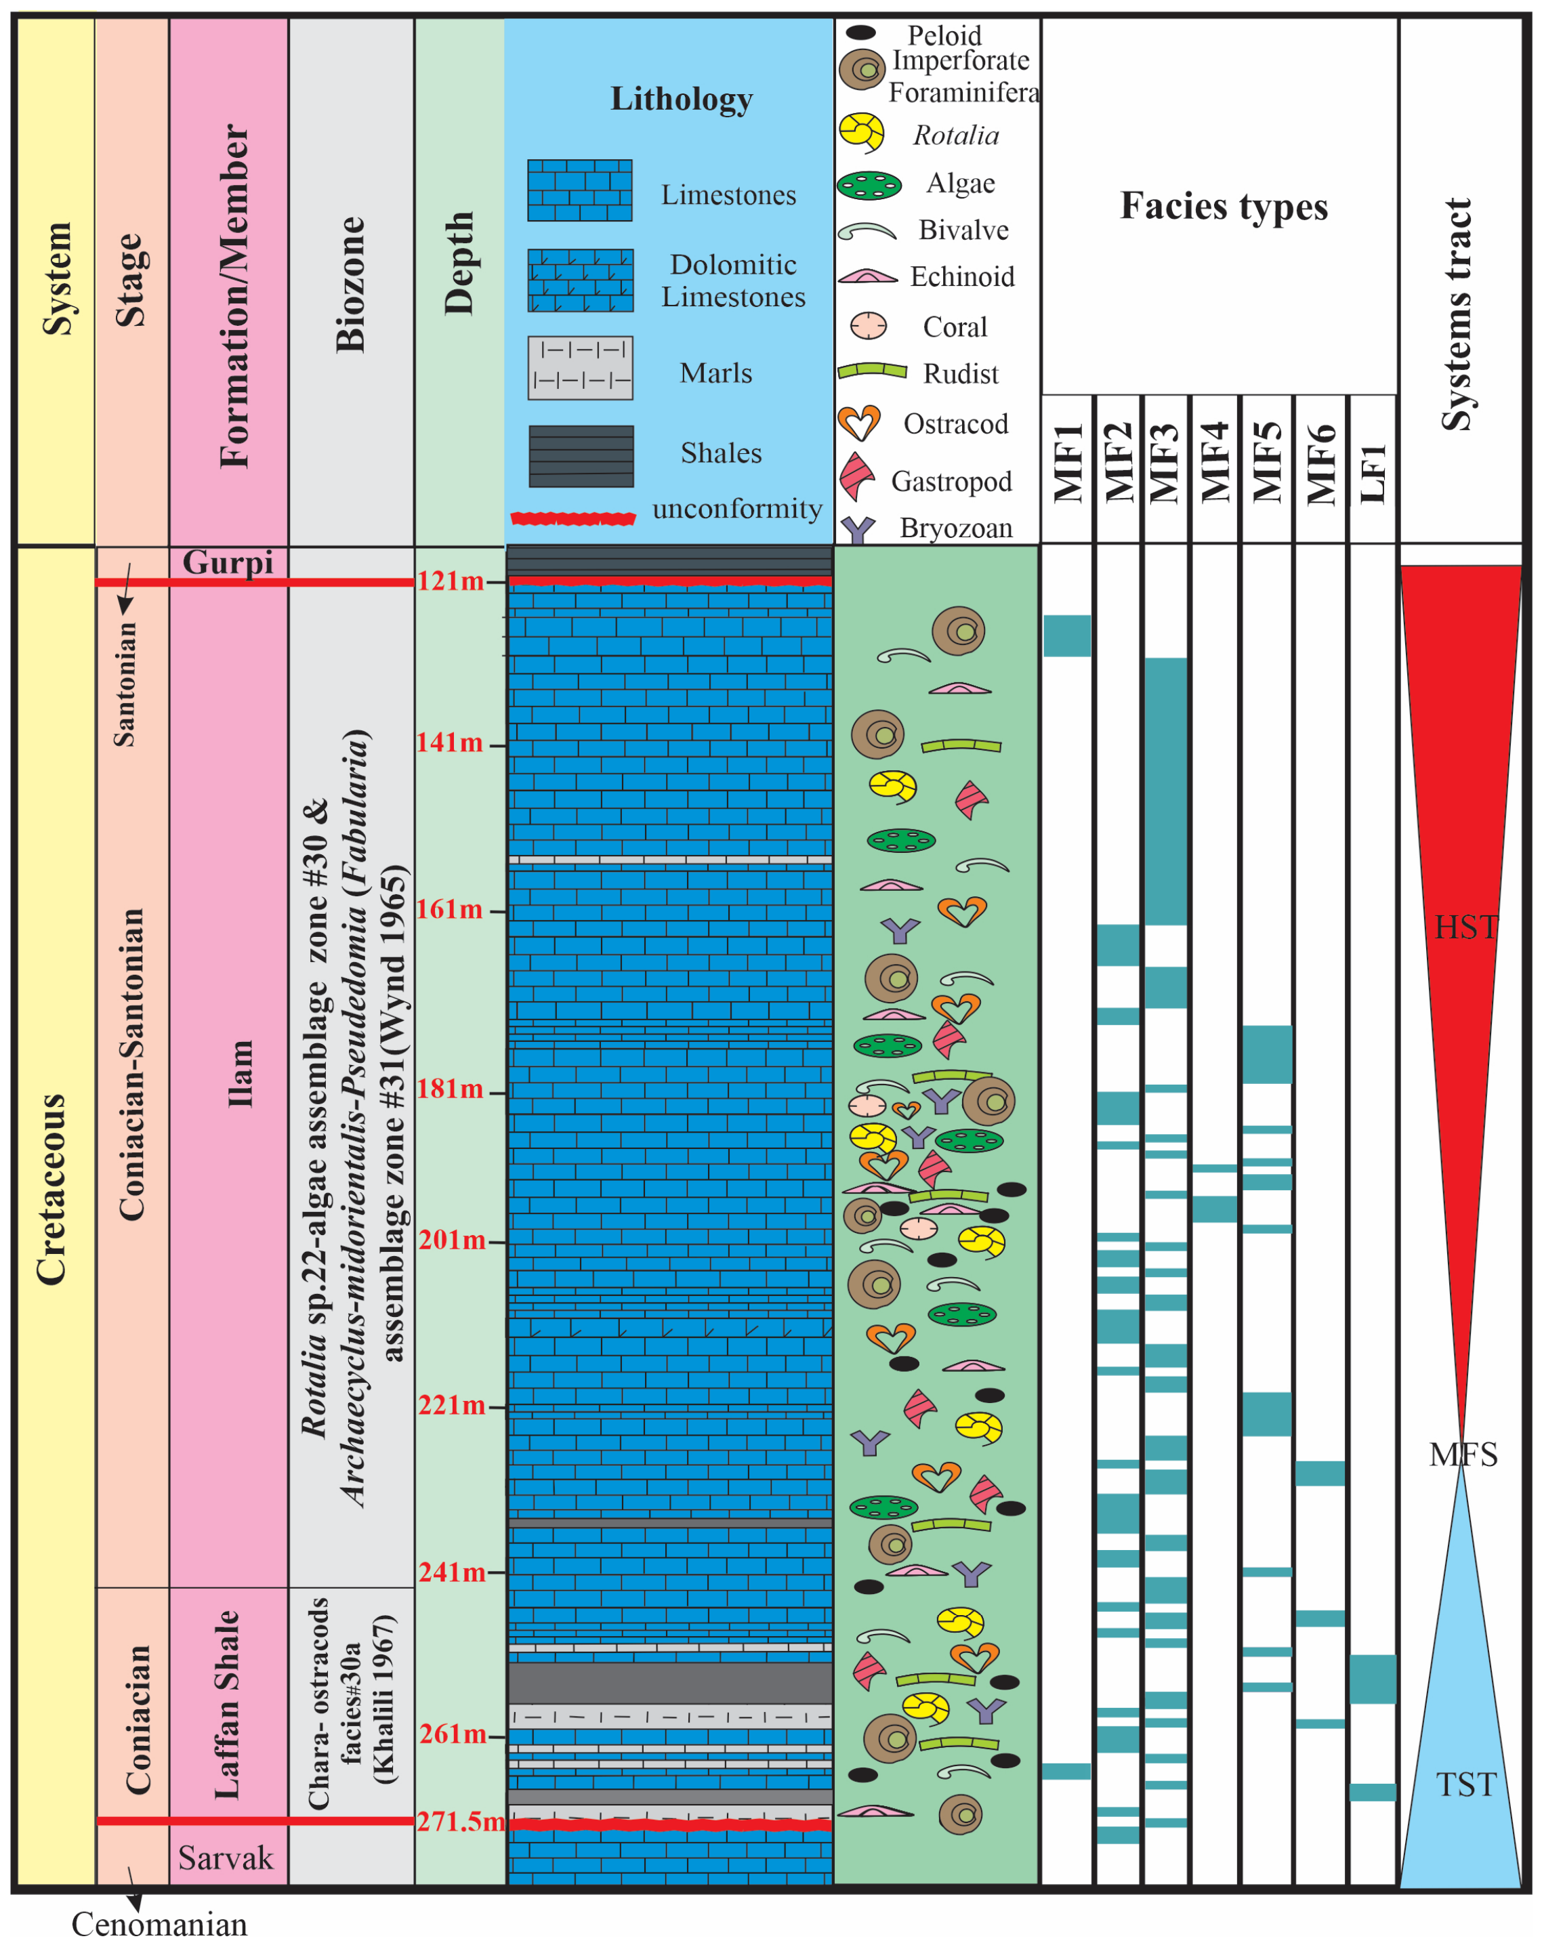
The analyzed materials made it possible to establish six microfacies (MF) and one lithofacies (LF) in the Coniacian–Santonian deposits of the study area (Figure 4). They correspond to carbonate and fine siliciclastic rock types, respectively. The stratigraphical distribution of these microfacies and lithofacies was documented in Well 3 (Figure 5) and Well 4 (Figure 6). Their characteristics are presented below.
Bioclastic wackestone microfacies (MF1). Biogenic components such as bivalve and gastropod shells make up as much as ~5–10% of all constituents (Figure 4a,b). These bioclasts range from 0.01 mm to 1 mm in size, and they are embraced by a fine micritic matrix. Mollusk debris particles are often large (up to 1 mm) and well preserved; they signify low-energy sedimentation. From benthic foraminifera, miliolid tests are present in a small amount. The low diversity of benthic foraminifera and the entire marine biota, as well as the poorly sorted texture, indicate a shallow, restricted lagoonal environment.
Imperforate foraminifera bioclastic packstone–grainstone microfacies (MF2). The grains consist of medium-sized particles (0.1–1 mm), and they are scattered in a micritic matrix with poor sorting. In some samples, the texture changes to grainstone where a micritic mud is replaced by a sparitic matrix. The main distinctive feature is the presence of relatively diverse, non-porous (agglutinated and porcelaneous) tests of benthic foraminifera, which constitute ~50% of the rock. Among them, miliolids with porcelaneous walls are abundant, while taxa with agglutinated walls such as Nezzazatinella, Cuneolina, Montcharmonita, Nezzazata, and Dicyclina occur in smaller amounts. Shell debris of mollusks (rudists), echinoids, ostracods, and green algae was also found (Figure 4c). Charophyte remains are subordinate components (Figure 4d). The primarily non-skeletal constituents are peloids. Micritization of bioclasts (mainly bivalve) is common in this microfacies type. The mentioned components are poorly sorted and dispersed within a micritic matrix. This is evidence of deposition in a low-energy environment. The diversity of non-porous tests of benthic foraminifera implies a restricted lagoonal setting. Charophyte algae signify a possible influx of freshwater from nearby land [18,86,87]. The presence of the grain-supported texture in this setting can be explained by episodic high-energy events or proximity to shoals, and, thus, the presence of grainstone in MF2 does not contradict a restricted lagoon interpretation, and it reflects internal facies heterogeneity within a lagoonal setting.
Green algae–Rotalia–imperforate foraminifera bioclastic packstone–grainstone microfacies (MF3). This microfacies contains skeletal grains, which are fine to moderately coarse (0.1–1.4 mm) and surrounded by a micritic mud or sparitic cement. The texture is dominated by grain-supported packstone to grainstone with poor sorting. Diverse skeletal components such as thick-walled Rotalia tests and imperforate tests of Textularia and miliolids form 30–40% of the rock (Figure 4e,f). Other imperforate tests of foraminifera such as Dicyclina are also present (10–15%). The diversity of marine invertebrates is higher relative to the microfacies types described above, and the components belong to rudists, echinoids, gastropods, and red and green algae. Non-skeletal peloid grains (15–20%) are dispersed within a micritic to sparitic matrix. These grains fill interparticle spaces. Particles contact directly, or calcitic cement occludes empty pores. The texture variation implies an environment with energy fluctuations. Generally, the reported features represent a shallow lagoonal setting connected to an open marine environment.
Bioclastic, Rotalia, miliolid peloid grainstone microfacies (MF4). The rocks exhibit mud-free, grain-supported textures, generally dominated by grain sizes of ~0.3 mm, which are subrounded to rounded and sorted. The components are less diverse than in MF3. The main skeletal components belong to Rotalia with thick and lenticular tests and miliolids, which constitute up to 35% of the rock (Figure 4g,h). Foraminiferal tests are quite well preserved due to their hardness. Invertebrate debris (bivalves and echinoids) is also present. The texture is determined by sparry calcite, which replaced micritic mud. This is proven by the presence of well-sorted and rounded biogenic and non-biogenic particles. These features are typical of a shallow, high-energy environment. This microfacies can be related to shoals along the platform margin.
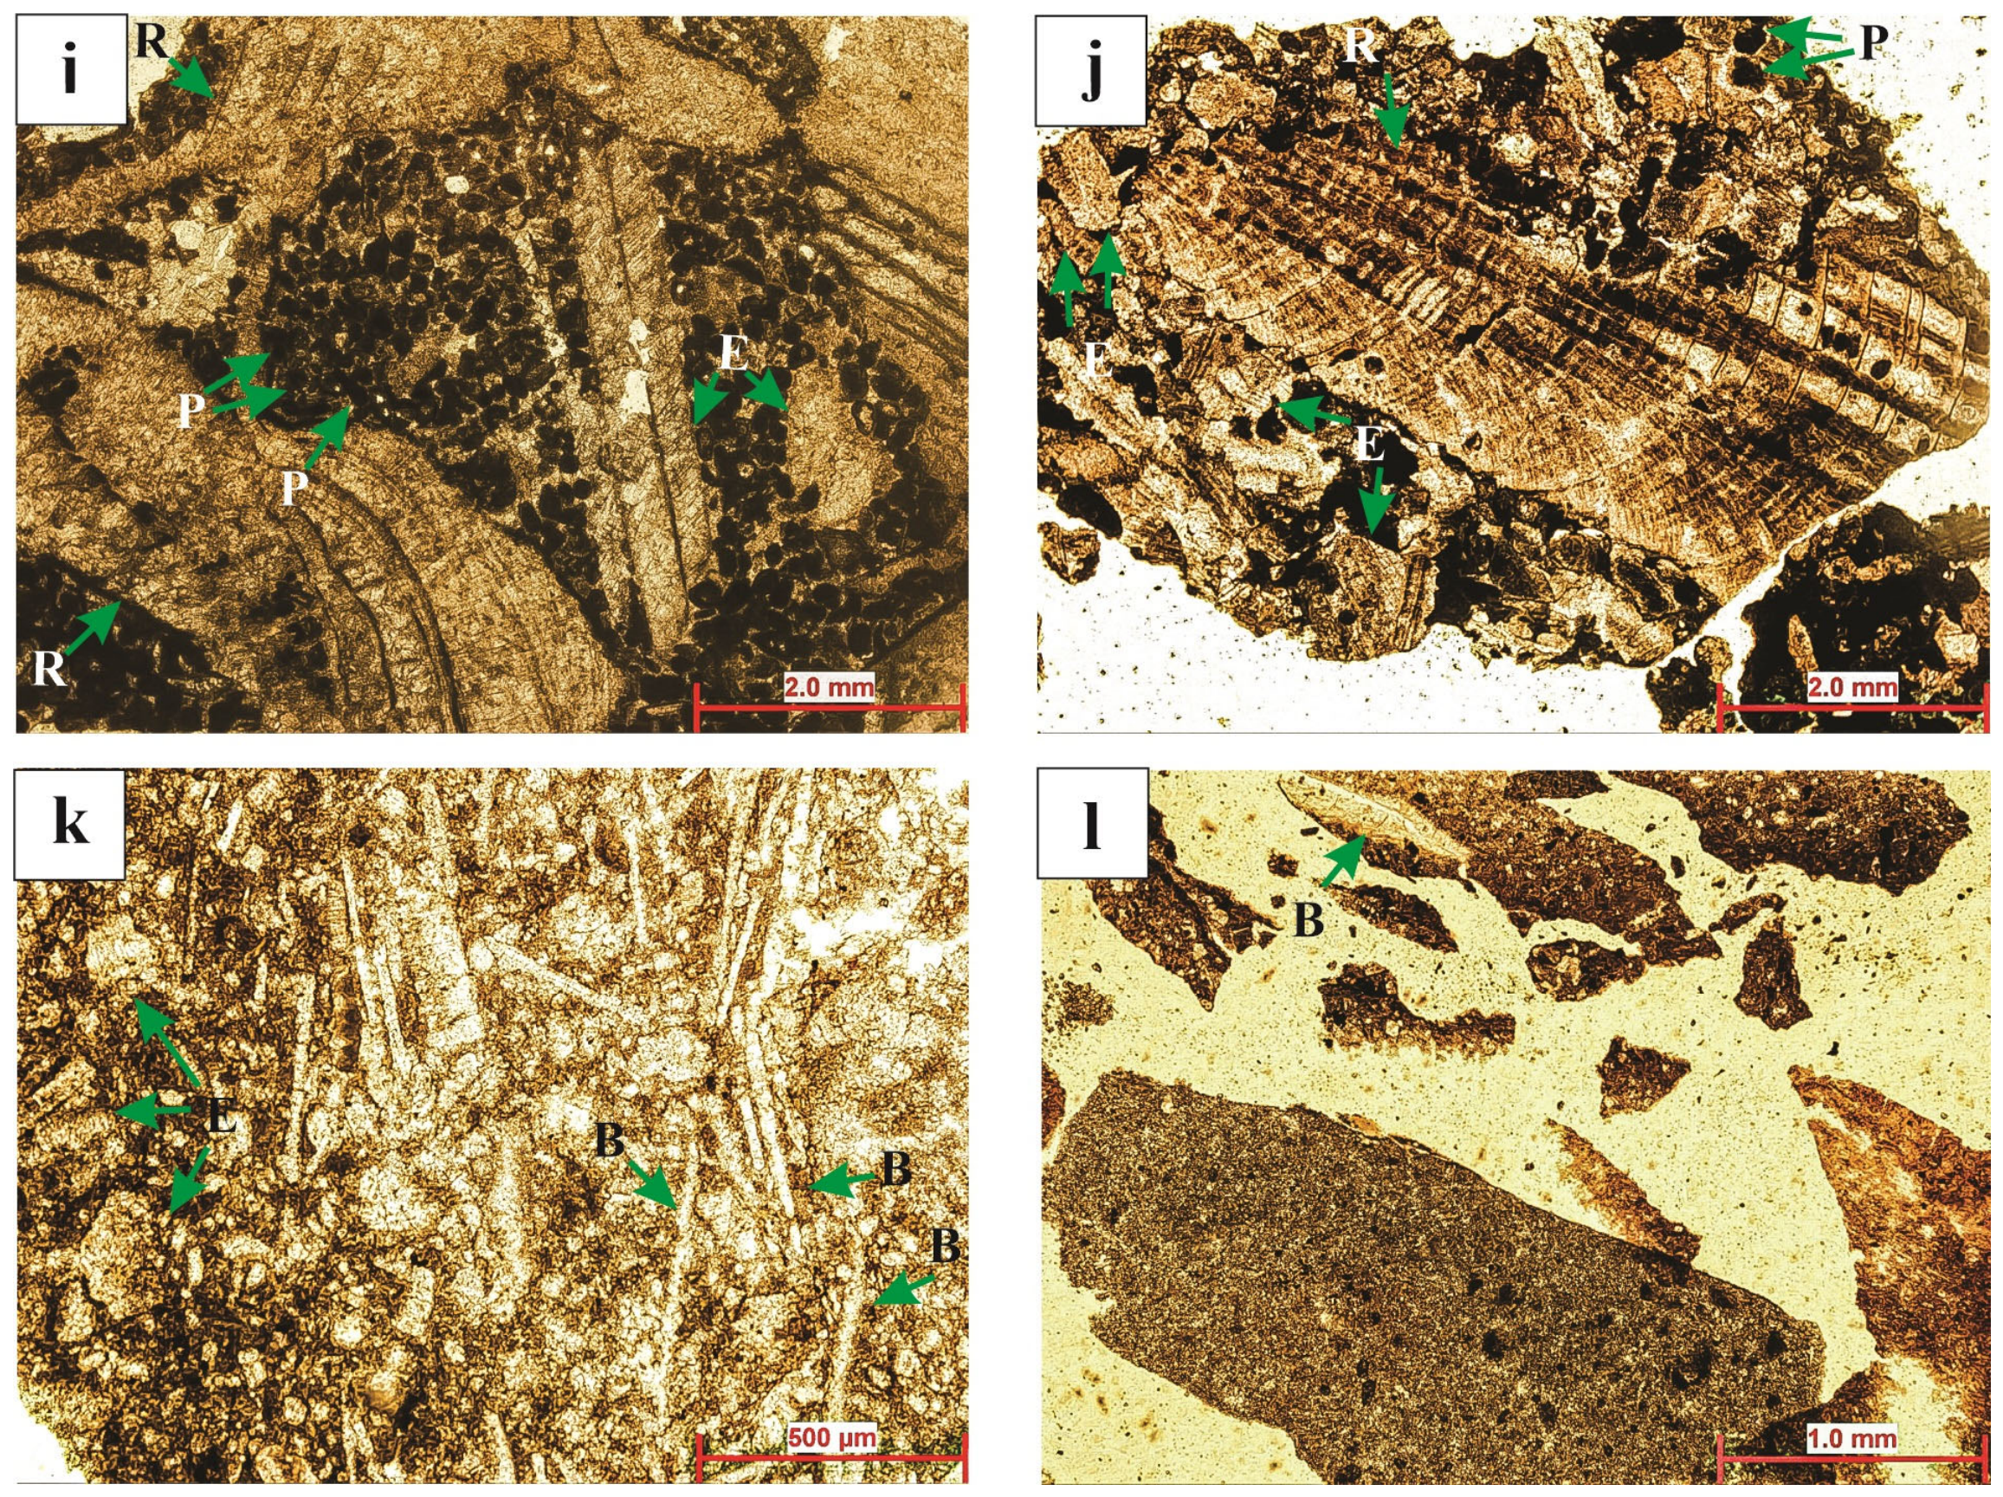
Peloid rudist bioclastic rudstone microfacies (MF5). The component-dominated texture contains a mixture of very coarse (6 mm) to fine (0.2 mm) particles, often angular to sub-angular, embraced by a poorly sorted, micritic mud. The key component is coarse bioclasts (>2 mm in size) of invertebrates, which constitute 30–50% of the rock. They belong mainly to rudists, corals, echinoids, and bryozoans (Figure 4i,j). Ostracod shells are also present in a small amount. Miliolids, Rotalia and Textularia are found among foraminifera. Non-skeletal components belong to peloid grains. Millimeter-sized bioclasts are characteristic of this microfacies type and indicate a medium- to high-energy environment. The presence of the noted foraminifera and the absence of green algae imply the carbonate platform’s deeper part.
Echinoid bivalve packstone microfacies (MF6). The packstone texture is made of particles with sizes varying from 0.1 mm to 1.2 mm; they are poorly sorted and surrounded by a micritic mud. Fragmented shells of echinoids and bivalves are the main components. Bivalve bioclasts are thin and differ in size (Figure 4k). Rotalia with thin and delicate tests are present, and miliolids and Textularia are common. They are dispersed in a muddy matrix. Fragmented bioclast debris implies that high-energy water motions broke shells, but they were not so strong as to create a sorted texture. Delicate tests of hyaline foraminifera signify a deeper, but middle part of the platform, where symbiont-bearing tests received enough light.
Shale lithofacies (LF1). The entire rock consists of very fine (<0.062 mm) particles, and the matrix is dominantly homogenous. These are grey to green shales found in the Laffan Shale Member. They coexist with limestones, for which MF2 and MF3 are interpreted. Echinoid and bivalve debris with particles <0.1 mm in size are found in a clay matrix (Figure 4l). These strata formed in a lagoonal setting.

4.2. Depositional Environments

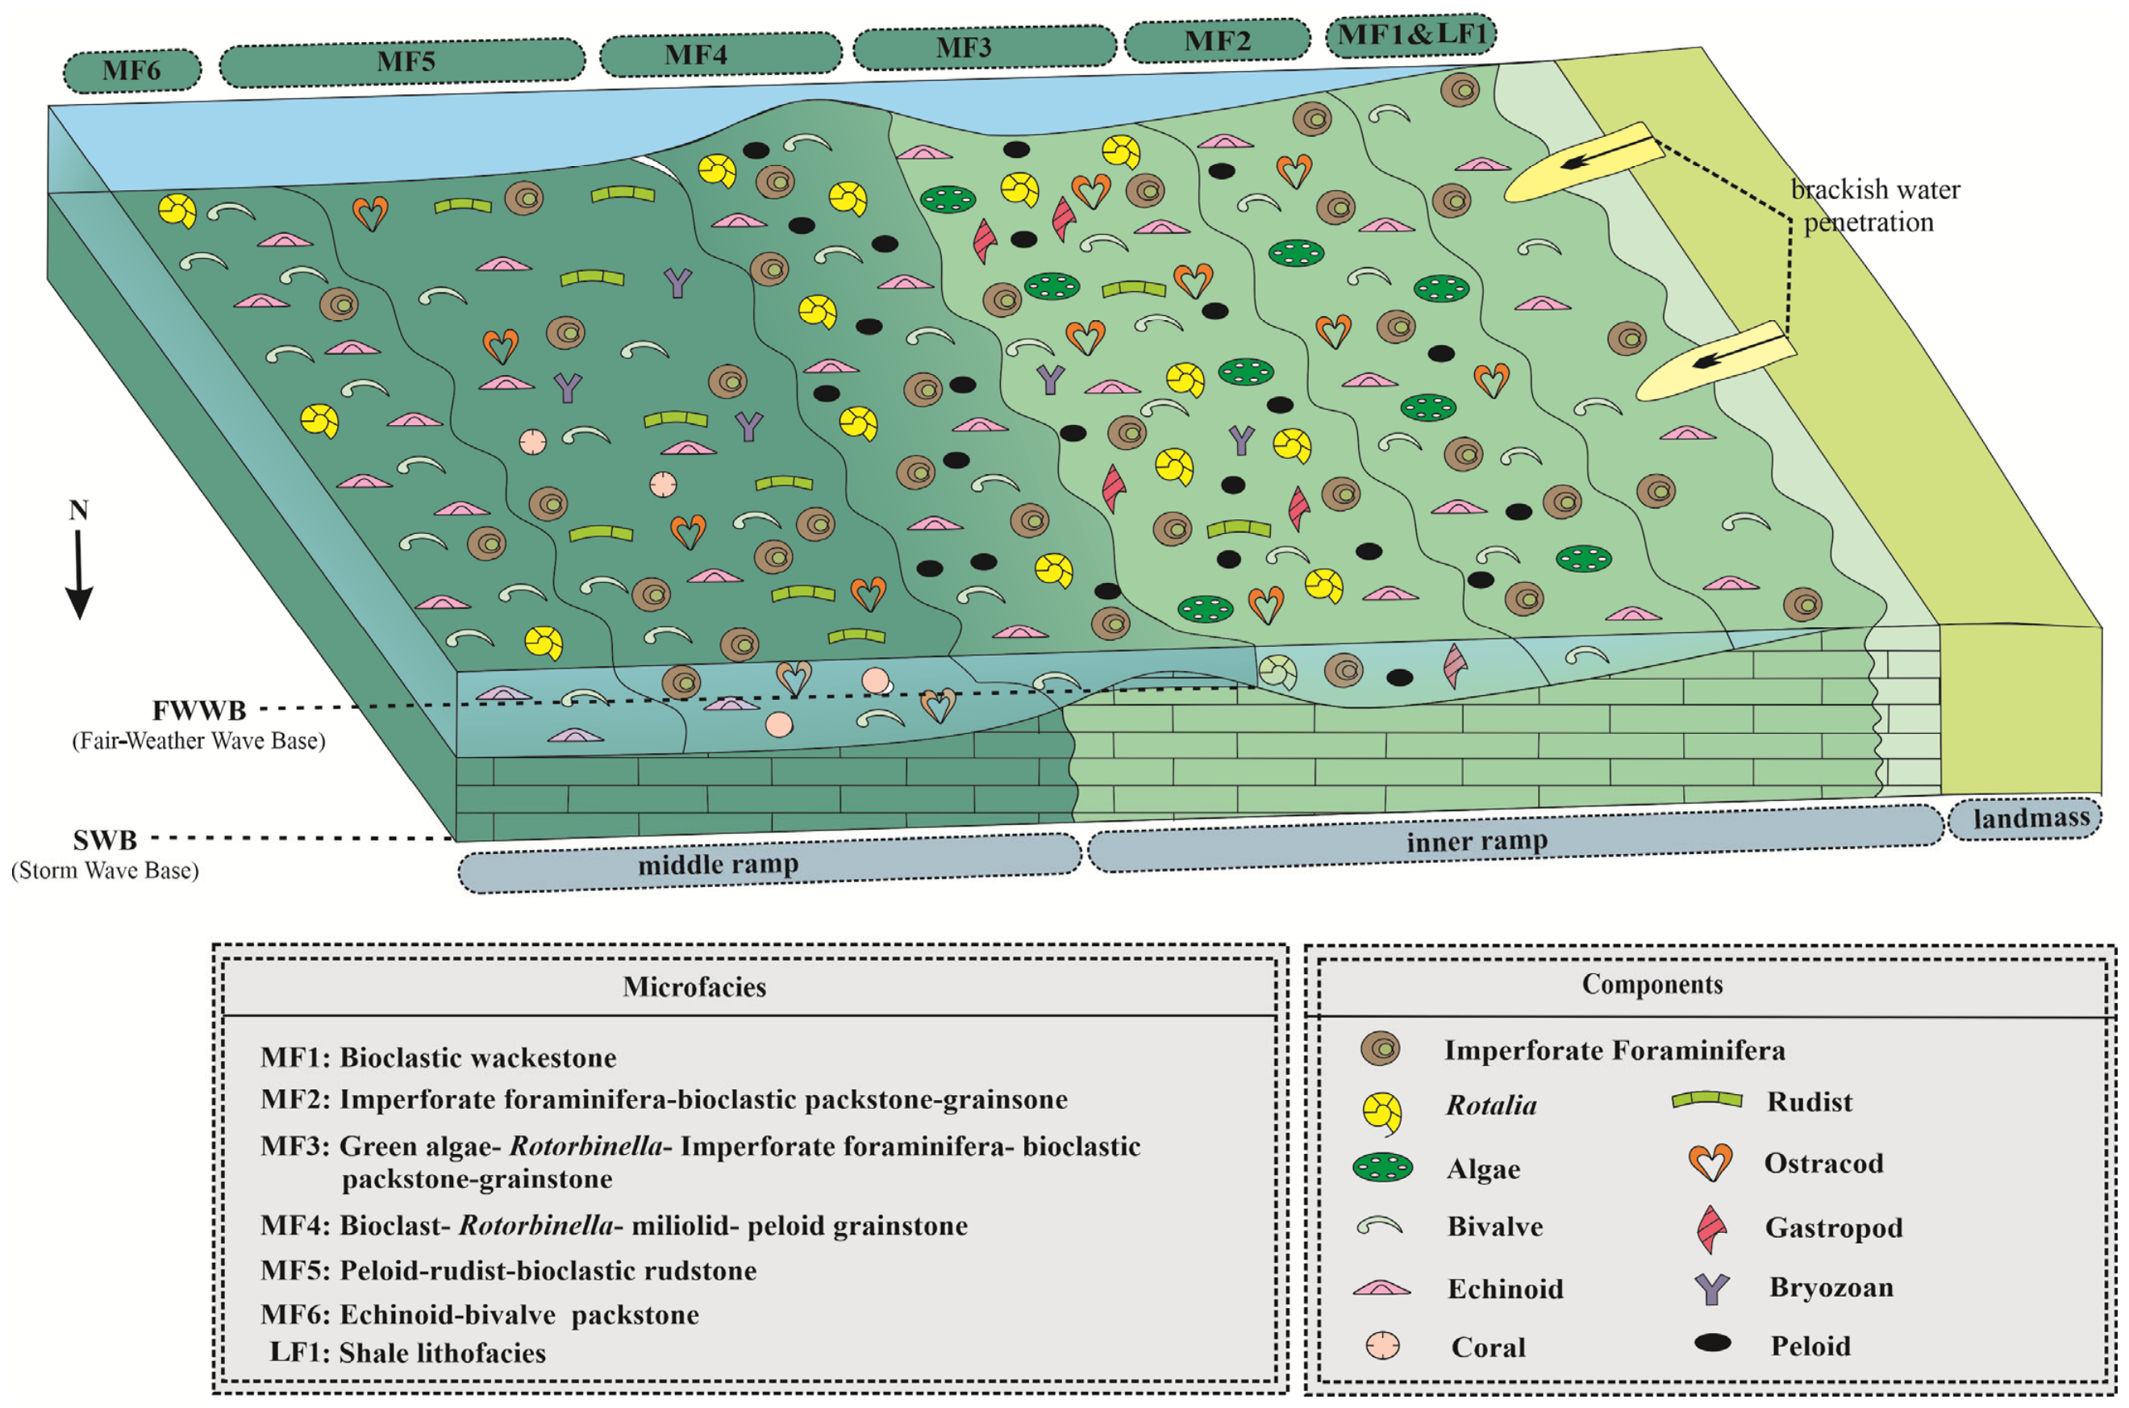
Summarizing the microfacies types established in the Coniacian–Santonian package of two considered wells makes it possible to propose a depositional model of the Ilam Formation (Figure 7). A carbonate platform in the study area was a homoclinal ramp (sensu [18,68]) due to the dominance of micritic textures, the gradual facies variations, and the absence of reefs. MF1 and MF2 mark its inner part, with a restricted, low-energy setting. Apparently, this part was not connected broadly to open marine environments and received an influx of freshwater. MF3 marks a deeper part of the ramp, and the texture shifts from packstone to grainstone may be interpreted as a signature of short-term sea-level changes. A shoal with a high-energy environment (MF 4) existed between the inner and middle parts of the ramp. Bioclastic–peloidal components of the shoal facies are in accordance with the tropical warm climate in the Zagros Basin [38]. This grain-supported microfacies type implies a fair-weather wave base [18,68]. A deeper middle-ramp environment with high energy (waves and/or storm currents) (MF 5) changed gradually to an even deeper setting with low energy (MF 6). The grain-supported texture of MF5 and varying grain sizes encountered in a micritic matrix indicate a storm wave base. The presence of marine invertebrate bioclasts in association with thin-walled benthic hyaline foraminifera in MF6 and its stratigraphical position close to MF5 prove the existence of the deep part of the middle ramp. It can be added that the deposition of the Laffan Shale Member preceded massive carbonate accumulation, but took place on the same ramp. Apparently, LF1 was linked to more active erosion on nearby land and subsequent delivery of fine siliciclastic material to newly formed lagoons.
The distribution of microfacies and lithofacies types in Wells 3 and 4 shows that MF2 and MF3 are the most frequent (Figure 5 and Figure 6). This means that shallow-water, inner-ramp depositional settings were common in the Coniacian–Santonian. Nonetheless, the stratigraphical distribution of the established microfacies (Figure 5 and Figure 6) implies the existence of two long-term trajectories. First, the relative sea level tended to rise during the deposition of the Laffan Shale Member and in the beginning of the deposition of the Ilam Formation. MF6 marks the culmination of this trajectory in both considered wells (Figure 5 and Figure 6). The relative sea level tended to fall during an interval, when the middle and upper portions of the Ilam Formation were deposited. In other words, there was a major Santonian–Coniacian transgression–regression cycle, which started and ended with hiatuses and probable erosion.

5. Discussion

5.1. Transgression–Regression Cycle and Its Possible Controls

The analysis of microfacies and depositional environments made it possible to realize the correspondence of the Coniacian–Santonian deposits of the study area to a single long-term transgression–regression cycle that started near the beginning of the Coniacian and ended before the end of the Santonian (the lower part of the Gurpi Formation is Santonian in age). In the common terminology of sequence stratigraphy [88,89], the unconformities bounding the considered package are sequence boundaries (Figure 5 and Figure 6). According to Simmons et al. [90], who revised the initially proposed sequence model of the Arabian plate [12], there were two maximum flooding surfaces in the Coniacian–Santonian interval, namely K150 in the mid-Coniacian and K160 in the lower Santonian. The MF6-dominated horizon approximately at the Coniacian–Santonian transition (Figure 5 and Figure 6), which reflects the relatively highest position of the sea level in the study area, would be difficult to correlate with either K150 or K160.
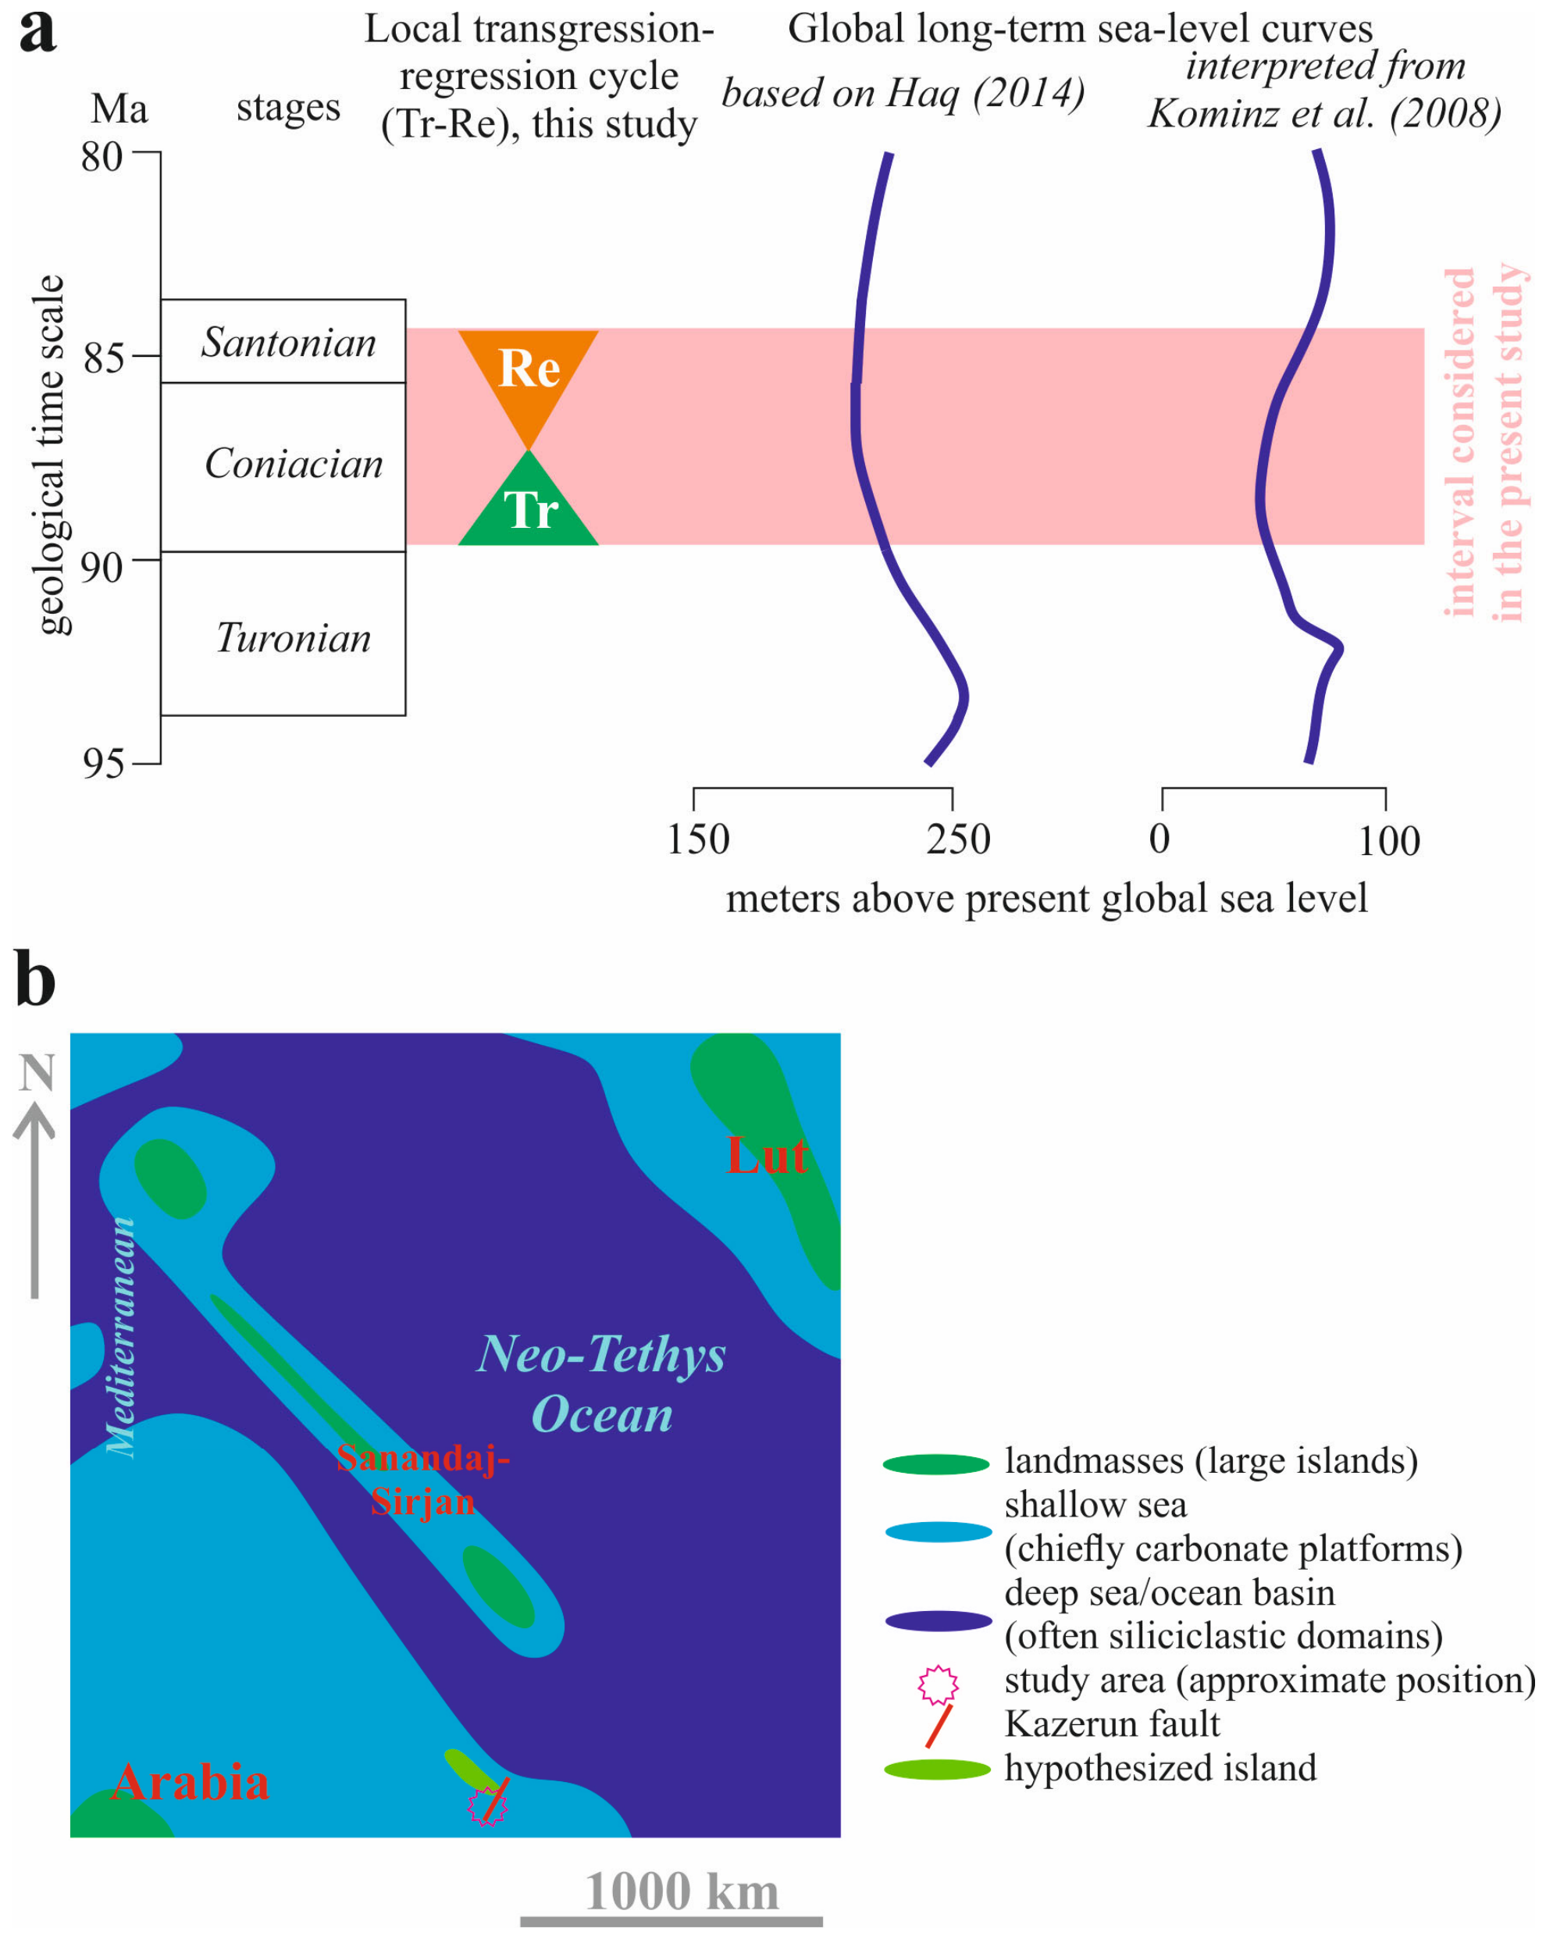
The transgression–regression cycle interpreted in the study area can be compared to the global sea-level changes. Taking into account the time span of accumulation of the Ilam Formation and the limited biostratigraphical resolution of the available records, it is reasonable to compare this cycle to only long-term sea-level changes (Figure 8a). According to Haq [91], a global long-term sea-level fall started in the Turonian and culminated in the Coniacian, after which a gradual rise started. These changes contrast strikingly with the local interpretations (Figure 8a). According to Kominz et al. [92], there was a long-term tendency of a global sea-level rise through the entire Coniacian–Santonian interval. This tendency also does not match the evidence from the study area (Figure 8a). Apparently, these interpretations matter irrespective of the possible reconsiderations of the position of the Coniacian/Santonian boundary in the studied sedimentary succession because the established cycle would not match the global curves in any case (Figure 8a).
An alternative explanation is that the established transgression–regression cycle might have been determined tectonically (at least, in the long-term perspective). Particularly, the activity of the Kazerun fault and vertical motions of the related tectonic blocks [15,17] as well as deformations related to salt diapir movements and far-distance tectonic influences [93] should be taken into account. More generally, the northeastern margin of the Arabian plate was active due to subduction processes; there is fresh evidence of their initiation already in the Late Cretaceous [94,95]. Epeirogenic motions can also be hypothesized; at least, the mechanisms of epeirogeny were already considered for Arabia [96,97] and the Zagros [98]. Nonetheless, these interpretations should be taken with certain caution because of two reasons. First, significant uncertainties in the reconstructions of Late Cretaceous global sea-level changes remain [99,100]. Second, the actual ages of the Laffan Shale Member and the Ilam Formation may differ from those commonly accepted [48]. Therefore, it is too early to rule out the eustatic factor of local sedimentation and postulate the dominance of the tectonic factor. Moreover, the possible contribution of local changes in the accommodation space needs further examination.

5.2. Hypothesizing the Local Depositional Environments and the Role of the Kazerun Fault

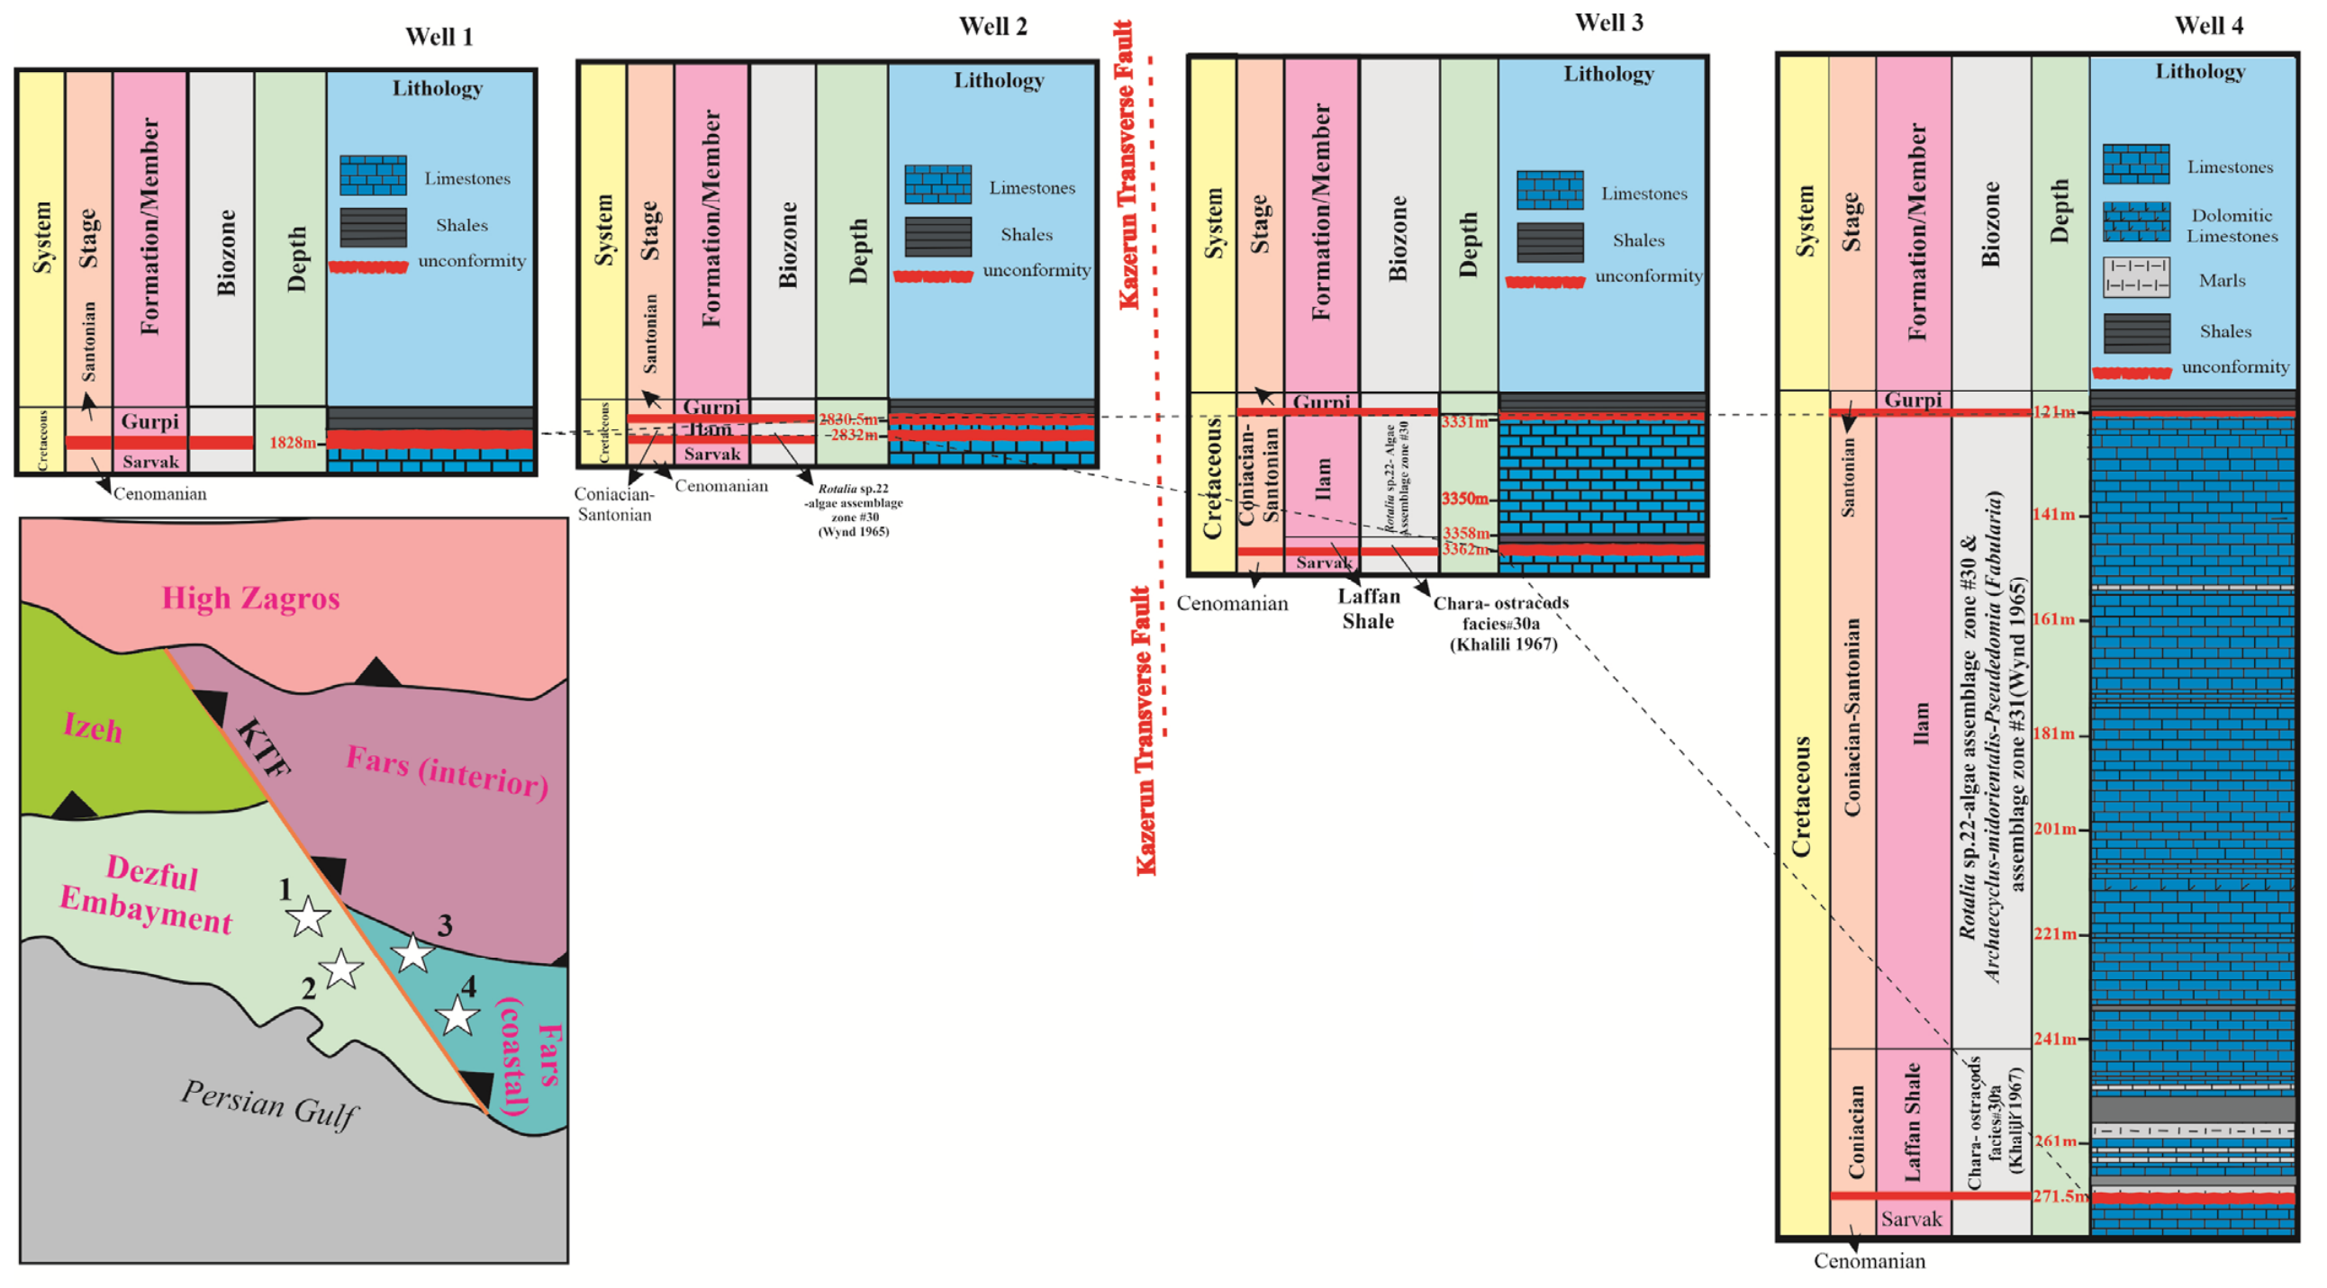
The study area is a peculiar domain divided by the Kazerun fault (Figure 8b). Thus, it is of great interest to correlate the wells located on the opposite sides of the latter. Wells 3 and 4, which are emphasized in this study due to their representative Coniacian–Santonian successions, are located east of the Kazerun fault (Figure 1). But there are two other wells located west of this fault. Well 1 does not contain the Laffan Shale Member or the Ilam Formation, whereas Well 2 contains only a thin horizon of the latter (Figure 9). The absence of the strata in Well 1 evidences a hiatus. The Ilam Formation in Well 2 is similar to this unit in Wells 3 and 4, and, thus, one can hypothesize a short-term, episodic deposition of these strata west of the fault (not necessarily due to the peculiarities of block motions; paleotopography might have also mattered).
Apparently, carbonates accumulated west of the fault only near the maximum of the Coniacian–Santonian transgression. At least, this interpretation matches the information from the four considered wells (Figure 9). One can assume the relatively elevated position of the western part of the study area relative to its eastern part. The most logical (although not the only possible) explanation implies vertical motions along the Kazerun fault combined with regional sea-level changes, subaerial erosion, and changes in the local accommodation space. However, these motions were different in direction from those supposed by Sepehr and Cosgrove [15]. According to these specialists, the western part of the fault subsided in the mid-Cretaceous. If so, the vertical motions along this fault changed with time, which is expectable regarding the tectonic complexity of the northeastern margin of Arabia [55]. Moreover, a reactivation of the Kazerun fault after the deposition of the Sarvak Formation was hypothesized in the study area [101]. Nonetheless, these interpretations require further verification. The reconstruction offered by Bagherpour et al. [17] indicates that the eastern side of the Kazerun fault remained uplifted when the Ilam Formation was deposited. The difference in the interpretations could be rooted in the spatial heterogeneity of motions along the fault and attention to different areas. Moreover, other explanations are also possible (for instance, the effects of epeirogenic motions and paleotopography).
The study area was situated in the northeastern margin of Arabia, embraced by a large sea [52]. Shallow-marine and lagoonal environments interpreted together with the analysis of carbonate microfacies and shale lithofacies (Figure 7) signify the proximity of the study area to a landmass, most probably an island (Figure 8b). The latter can only be hypothesized, as well as the relation of its origin to the vertical motions along the Kazerun fault. Further investigations, not only restricted to the four considered wells, are required to check the validity of this hypothesis.

5.3. General Inferences

The interpretations presented above match the ideas of Bagherpour et al. [17] on differentiated vertical motions (also tilting) of the blocks in this part of the Zagros Basin in the Late Cretaceous. Evidently, the growth of carbonate platforms in the Arabian margin was significantly complicated by the local tectonic activity. More generally, when any carbonate platform was too large and not limited to a particular tectonic block, its evolution can be described as a complex and changeable interplay between massive carbonate deposition and tectonic processes related to long-lived structures inherited from the previous, pre-platform phases of geological evolution. This interplay can be understood as a combination of two totally different trends leading to a homogenization of paleogeographical spaces and increases in their heterogeneity.
Several examples of when the fault activity affected the development of carbonate platforms were reported previously from different geological time slices and domains. These examples include the Cambrian Yangtze Platform of South China [102], the Triassic carbonate system in the Southern Alps of North Italy [103], and the Cenozoic platform in Northwest Sabah in Malaysia [104]. These examples and the outcomes of the present study imply a diversity of fault-related effects in the history of carbonate platforms, and synthesizing the related knowledge is a challenging but important task for future research. The interpretation of the local geological development of the study area resembles a reconstruction of the Triassic carbonate platform in the Megyehegy Dolomite of Hungary [105]. There, differential motions of fault-controlled blocks led to the fragmentation of the carbonate platform: the character of sedimentation changed in the locally drowned blocks, whereas smaller carbonate platforms continued to evolve in the other blocks. In the case of the study area, the situation might have been the opposite, but the mechanism can be regarded as essentially similar.

6. Conclusions

The present analysis of Coniacian–Santonian deposits near the Kazerun fault makes it possible to draw three general conclusions.
(1)
Six carbonate microfacies and one shale lithofacies are established in these deposits, which accumulated on a homoclinal carbonate ramp.
(2)
The Laffan Shale Member and the Ilam Formation were deposited during a single transgression–regression cycle, which cannot be related to the long-term global sea-level changes.
(3)
The activity of the Kazerun fault might have influenced the Coniancian–Santonian sedimentation in the study area.
The next step to enhance the understanding of the influences of the Kazerun fault on the Late Cretaceous sedimentation should be the construction of structural models and seismic profiles on the basis of information from exploration wells and outcrops. Another urgent task is the accumulation of biostratigraphical data required to increase the resolution of the local records and to refine their correlation with regional/global events. Presently, it is possible to discuss the relative roles of eustatic and tectonic factors in the long-term perspective, and, therefore, it is urgent to find stratigraphical markers that would make it possible to shift to the short-term perspective. More generally, fault activity enhanced the spatiotemporal heterogeneity of large carbonate platforms, and additional, comparative investigations are necessary to conceptualize the related mechanisms.

Supplementary Materials

The following supporting information can be downloaded at https://www.mdpi.com/article/10.3390/jmse14131227/s1, Figure S1: Diagenetic patterns in the studied carbonates of the Ilam Formation.

Author Contributions

Conceptualization, T.H.; methodology, F.M.-D. and T.H.; investigation, F.M.-D., T.H., D.A.R. and R.H.; writing—original draft preparation, F.M.-D., T.H., D.A.R. and R.H.; supervision, T.H. All authors have read and agreed to the published version of the manuscript.

Funding

Shiraz University research council.

Data Availability Statement

Data are contained within the article.

Acknowledgments

The authors thank the Shiraz University research council for financial support. They also acknowledge the Exploration Management of the National Iranian Oil Company for the information provision. The authors thank Mohammad Hasani-Giv for constructive comments and suggestions.

Conflicts of Interest

Author Rohollah Hosseinzadeh was employed by the Management of National Iranian Oil Company (Iran). The remaining authors declare that the research was conducted in the absence of any commercial or financial relationships that could be construed as a potential conflict of interest.

References

  1. Jackson, J.A. Reactivation of basement faults and crustal shortening in orogenic belts. Nature 1980, 283, 343–346. [Google Scholar] [CrossRef]
  2. Mohajjel, M.; Fergusson, C.L. Jurassic to Cenozoic tectonics of the Zagros orogen in northwestern Iran. Int. Geol. Rev. 2014, 56, 263–287. [Google Scholar]
  3. Sepehr, M.; Cosgrove, J.W.; Moieni, M. The impact of cover rock rheology on the style of folding in the Zagros fold-thrust belt. Tectonophysics 2006, 427, 265–281. [Google Scholar] [CrossRef]
  4. Bordenave, M.L.; Huc, A.Y. The Cretaceous source rocks in the Zagros foothills of Iran. Rev. L’institut Français Pétrole 1995, 50, 727–752. [Google Scholar] [CrossRef]
  5. Cooper, M. Structural style and hydrocarbon prospectivity in fold and thrust belts: A global review. Geol. Soc. Spec. Publ. 2007, 272, 447–472. [Google Scholar] [CrossRef]
  6. Fu, H.; Han, J.; Sun, Y.; Wang, R.; Xiong, R.; Zhou, Y.; Xie, C.; Su, F. Tethys orogenic belt. Sediment. Geol. Tethyan Geol. 2024, 44, 100–133. [Google Scholar]
  7. Hasterok, D.; Halpin, J.A.; Collins, A.S.; Hand, M.; Kreemer, C.; Gard, M.G.; Glorie, S. New Maps of Global Geological Provinces and Tectonic Plates. Earth-Sci. Rev. 2022, 231, 104069. [Google Scholar] [CrossRef]
  8. Van Hinsbergen, D.J.J.; Torsvik, T.H.; Schmid, S.M.; Matenco, L.C.; Maffione, M.; Vissers, R.L.M.; Gürer, D.; Spakman, W. Orogenic architecture of the Mediterranean region and kinematic reconstruction of its tectonic evolution since the Triassic. Gondwana Res. 2020, 81, 79–229. [Google Scholar] [CrossRef]
  9. Bagherpour, B.; Faghih, A.; Vaziri-Moghaddam, H.; Mehrabi, H.; Zare, M.; Immenhauser, A. Tectono-eustasy and basin morphology controls on Cretaceous facies architecture in the northeastern margin of Arabian Plate. Sediment. Geol. 2025, 486, 106943. [Google Scholar] [CrossRef]
  10. Kordi, M. Sedimentary basin analysis of the Neo-Tethys and its hydrocarbon systems in the Southern Zagros fold-thrust belt and foreland basin. Earth-Sci. Rev. 2019, 191, 1–11. [Google Scholar] [CrossRef]
  11. Mehrabi, H.; Fakhar-Shahreza, N.; Karami, F.; Honarmand, J. Controls of tectonics and paleoclimate on depositional–diagenetic evolution and pore types of Upper Cretaceous successions (Sarvak Formation) in the Abadan plain, Iran. Mar. Pet. Geol. 2024, 170, 107118. [Google Scholar] [CrossRef]
  12. Sharland, P.R.; Archer, M.; Casey, D.M.; Davies, R.B.; Hall, S.H.; Heward, A.P.; Horbury, A.D.; Simmins, M.D. Arabian Plate Sequence Stratigraphy; GeoArabia Special Publication; Gulf PetroLink: Manama, Bahrain, 2001; Volume 2, pp. 1–371. [Google Scholar]
  13. Stoneley, R. The Middle East Basin: A summary overview. Geol. Soc. Lond. Spec. Publ. 1990, 50, 293–298. [Google Scholar] [CrossRef]
  14. Zhang, T. Characteristics and controls of super-thick carbonate reservoirs: A case study of piedmont fold zone in T oilfield of Zagros Basin. Geol. Surv. China 2025, 12, 30–40. [Google Scholar]
  15. Sepehr, M.; Cosgrove, J.W. Role of the Kazerun Fault Zone in the formation and deformation of the Zagros Fold-Thrust Belt, Iran. Tectonics 2005, 24, TC5005. [Google Scholar] [CrossRef]
  16. Zadeh, A.M.; Sabzevari, K.M.; Abyat, A.; Baharvand, S.; Shahrokhi, S.V. Paleoenvironmental reconstruction of the upper aptian to upper Albian deposits in the Eastern Izeh Zone, Zagros basin (Southwestern Iran). Carbonates Evaporites 2025, 40, 143. [Google Scholar] [CrossRef]
  17. Bagherpour, B.; Mehrabi, H.; Faghih, A.; Vaziri-Moghaddam, H.; Omidvar, M. Tectono-eustatic controls on depositional setting and spatial facies distribution of Coniacian–Santonian sequences of the Zagros Basin in Fars area, S. Iran. Mar. Pet. Geol. 2021, 129, 105072. [Google Scholar] [CrossRef]
  18. Flügel, E. Microfacies of Carbonate Rocks: Analysis, Interpretation and Application; Springer: Berlin, Germany, 2010. [Google Scholar]
  19. Zangana, H.A.; Rashid, F. Microfacies and diagenesis impact the distribution of pore types in heterogenous carbonate reservoir rock: An example from the Bai-Hassan Oilfield, Northern Iraq. J. Afr. Earth Sci. 2026, 235, 105976. [Google Scholar]
  20. Andreeva, P. Famennian carbonate microfacies from the Preslavtsi-2 well (Moesian Platform, north-eastern Bulgaria). Geol. Balc. 2019, 48, 13–24. [Google Scholar] [CrossRef]
  21. Bashlykova, E.Y.; Gorozhanina, E.N.; Kulagina, E.I. Microfacies and foraminifers of the Tulian horizon (the Visean substage, Lower Carboniferous) of the southeast of the East European platform and the Southern Urals. Georesursy 2025, 27, 179–194. [Google Scholar] [CrossRef]
  22. Alavi, M. Structures of the Zagros fold-thrust belt in Iran. Am. J. Sci. 2007, 307, 1064–1095. [Google Scholar] [CrossRef]
  23. Chisenga, C.; Yan, J.; Manda, B.; Saibi, H.; Amrouche, M. New insights into the crustal structures of the Arabian Plate and surrounding plates unveiled from the crustal thickness model and its implications for geodynamics. J. Asian Earth Sci. 2025, 279, 106431. [Google Scholar] [CrossRef]
  24. Farkiani, H.; Mahmoodabadi, M.; Yaminifard, F.; Tatar, M. Crustal anisotropy and deformation in the Zagros collision belt. Tectonophysics 2026, 922, 231056. [Google Scholar] [CrossRef]
  25. Mouthereau, F.; Lacombe, O.; Vergés, J. Building the Zagros collisional orogen: Timing, strain distribution and the dynamics of Arabia/Eurasia plate convergence. Tectonophysics 2012, 532–535, 27–60. [Google Scholar] [CrossRef]
  26. Sembroni, A.; Reitano, R.; Faccenna, C.; Callieri, P. The geologic configuration of the Zagros Fold and Thrust Belt: An overview. Mediterr. Geosci. Rev. 2024, 6, 61–86. [Google Scholar] [CrossRef]
  27. Sepehr, M.; Cosgrove, J.W. Structural framework of the Zagros Fold-Thrust Belt, Iran. Mar. Pet. Geol. 2004, 21, 829–843. [Google Scholar] [CrossRef]
  28. Talebi, A.; Rahimi, H.; Moradi, A. Coda wave attenuation in the Zagros collision zone in southwest of Iran and its tectonic implications. Acta Geophys. 2025, 73, 119–130. [Google Scholar] [CrossRef]
  29. Eftekhari, S.N.; Sayyadpour, H.; Kowsari, M. A near-fault probabilistic seismic hazard assessment for Yasouj, located in the Kazerun fault system, southwest Iran. Nat. Hazards 2021, 105, 1945–1961. [Google Scholar]
  30. Mehdizadeh, R. Kinematic Evaluation of the Kazerum Fault System within the Zagros Fold-and-Thrust Belt, Iran. Geotectonics 2019, 53, 774–785. [Google Scholar] [CrossRef]
  31. Safari, H.O.; Pirasteh, S.; Mansor, S.B. Role of the Kazerun fault for localizing oil seepage in the Zagros Mountain, Iran: An application of GiT. Int. J. Remote Sens. 2011, 32, 1–16. [Google Scholar] [CrossRef]
  32. Afaghi, A.; Moazami, J.; Salek, M. Geological Map of Iran Sheet No. 5 South-Central Iran, Scale 1:1000000; National Iranian Oil Company: Tehran, Iran, 1969. [Google Scholar]
  33. Motiei, H. Stratigraphy of Zagros. Treatise on the Geology of Iran No. 1; Ministry of Mines and Metals, Geological Survey of Iran: Tehran, Iran, 1993.
  34. Wynd, J.G. Biofacies of the Iranian Oil Consortium Agreement area. In Iranian Oil Operating Companies, Geological and Exploration Division Report; Report No. 1082; Iranian Oil Operating Companies (IOOC), Geological and Exploration Division: Tehran, Iran, 1965. [Google Scholar]
  35. James, G.A.; Wynd, J.G. Stratigraphic Nomenclature of Iranian Oil Consortium Agreement Area. Am. Assoc. Pet. Geol. Bull. 1965, 49, 2182–2245. [Google Scholar] [CrossRef]
  36. Alsuwaidi, E.S.; Xi, G.; Zimmerman, R.W. Mechanical characterization of Laffan and Nahr Umr anisotropic shales. J. Pet. Sci. Eng. 2021, 200, 108195. [Google Scholar] [CrossRef]
  37. Ghajari, A.; Kamali, M.; Mortazavi, S.A. A comprehensive study of Laffan Shale Formation in Sirri oil fields, offshore Iran: Implications for borehole stability. J. Pet. Sci. Eng. 2013, 107, 50–56. [Google Scholar] [CrossRef]
  38. Abedi, Y.; Mosaddegh, H.; Kavoosi, M.A. Linking diagenesis to sequence stratigraphy: An integrated approach for understanding and predicting the reservoir quality distribution of the Ilam Formation (Santonian) in Abadan Plain, southwest of Iran. Mar. Pet. Geol. 2025, 177, 107399. [Google Scholar] [CrossRef]
  39. Adabi, M.H.; Asadi Mehmandosti, E. Microfacies and geochemistry of the Ilam Formation in the Tang-E Rashid area, Izeh, SW Iran. J. Asian Earth Sci. 2008, 33, 267–277. [Google Scholar] [CrossRef]
  40. Fouladvand, R.; Adabi, M.H.; Sadeghi, A.; Jalali, M. Investigating the relationship between reservoir properties and sedimentary processes in the Ilam Formation of Susangerd oilfield, SW Iran. J. Stratigr. Sedimentol. Res. 2022, 38, 1–20. [Google Scholar]
  41. Khodaei, N.; Rezaee, P.; Honarmand, J.; Abdollahi-Fard, I. Controls of depositional facies and diagenetic processes on reservoir quality of the Santonian carbonate sequences (Ilam Formation) in the Abadan Plain, Iran. Carbonates Evaporites 2021, 36, 19. [Google Scholar] [CrossRef]
  42. Mehrabi, H.; Navidtalab, A.; Enayati, A.; Bagherpour, B. Age, duration, and geochemical signatures of paleo-exposure events in Cenomanian–Santonian sequences (Sarvak and Ilam formations) in SW Iran: Insights from carbon and strontium isotopes chemostratigraphy. Sediment. Geol. 2022, 434, 106136. [Google Scholar] [CrossRef]
  43. Moghadam, A.Y.; Mahboubi, A.; Gharaei, M.H.M.; Harami, R.M. Geochemical characteristics and paleogeographic analysis of the Late Cretaceous (Ilam Formation) in the Lorestan subzone, Zagros area, Iran. Geopersia 2025, 15, 253–271. [Google Scholar] [CrossRef]
  44. Reza, M.M. Sequence stratigraphy of Albian–Campanian carbonate deposits (Sarvak and Ilam formations) in Shiraz area, Fars, SW Iran. Carbonates Evaporites 2020, 35, 92. [Google Scholar] [CrossRef]
  45. Amirkhani, A.; Mirzakhanian, M.; Sepahvand, S.; Sadoni, J. Upper Cretaceous petroleum system of northwestern Persian Gulf. Iran. J. Earth Sci. 2015, 7, 153–163. [Google Scholar]
  46. Schlagintweit, F.; Omidvar, M.; Safari, A.; Yazdi-Moghadam, M.; Rashidi, K. Dasycladales (green algae) and some benthic foraminifera from the Upper Cretaceous Ilam Formation (Late Coniacian–Santonian), SW Iran (onshore and offshore). Riv. Ital. Paleontol. Stratigr. 2024, 130, 487–506. [Google Scholar] [CrossRef]
  47. Schlagintweit, F.; Behbahani, R.; Ezampanah, Y.; Mohseni, H. Tekkeina anatoliensis Farinacci & Yeniay, 1995 hemipelagic larger benthic foraminifer from the Santonian Ilam Formation of west-southwestern Iran: Emendation of the genus and suprageneric status. Rev. Micropaleontol. 2025, 89, 100863. [Google Scholar] [CrossRef]
  48. Hosseini, S.; Parente, M.; Morsalnejad, D.; Asnafi, M.R.; Shafiezad, M.; Akhari, M.; Hemmatinasab, M.; Parandavar, M. First record of Reticulinella? kaeveri in the Laffan and Ilam formations (Zagros fold and thrust belt, SW Iran): New constraints on the chronostratigraphic calibration of the Arabian Plate sequence stratigraphy. Cretac. Res. 2024, 157, 105821. [Google Scholar] [CrossRef]
  49. Khalili, M. The biostratigraphic synthesis of Bangestan Group in southwest Iran. IOC Rep. 1967, 1219, 9. [Google Scholar]
  50. Müller, R.D.; Zahirovic, S.; Williams, S.E.; Cannon, J.; Seton, M.; Bower, D.J.; Tetley, M.G.; Heine, C.; Le Breton, E.; Liu, S.; et al. A Global Plate Model Including Lithospheric Deformation Along Major Rifts and Orogens Since the Triassic. Tectonics 2019, 38, 1884–1907. [Google Scholar] [CrossRef]
  51. Scotese, C.R. An Atlas of Phanerozoic Paleogeographic Maps: The Seas Come In and the Seas Go Out. Annu. Rev. Earth Planet. Sci. 2021, 49, 679–728. [Google Scholar] [CrossRef]
  52. Golonka, J. Plate tectonic evolution of the southern margin of Eurasia in the Mesozoic and Cenozoic. Tectonophysics 2004, 381, 235–273. [Google Scholar] [CrossRef]
  53. Huang, T.; Zhang, G.; Luo, B.; Yi, Z.; Zhang, L.; He, Z.; Bai, G.; Yin, J.; Zhu, H.; Yin, J.; et al. Cretaceous prototype basins and lithofacies paleogeography in the Tethyan domain and their role in hydrocarbon accumulation. Oil Gas Geol. 2024, 45, 658–672. [Google Scholar]
  54. Arfania, R.; Shahriari, S. Role of southeastern Sanandaj-Sirjan Zone in the tectonic evolution of Zagros Orogenic Belt, Iran. Isl. Arc 2009, 18, 555–576. [Google Scholar] [CrossRef]
  55. Barrier, E.; Vrielynck, B.; Brouillet, J.F.; Brunet, M.F. Paleotectonic Reconstruction of the Central Tethyan Realm. Tectono-Sedimentary-Palinspastic Maps from Late Permian to Pliocene. Atlas of 20 Maps; CGMW/CCGM: Paris, France, 2018. [Google Scholar]
  56. Hassanzadeh, J.; Wernicke, B.P. The Neotethyan Sanandaj-Sirjan zone of Iran as an archetype for passive margin-arc transitions. Tectonics 2016, 35, 586–621. [Google Scholar] [CrossRef]
  57. Mehdipour Ghazi, J.; Moazzen, M. Geodynamic evolution of the Sanandaj-Sirjan Zone, Zagros Orogen, Iran. Turk. J. Earth Sci. 2015, 24, 513–528. [Google Scholar] [CrossRef]
  58. Gradstein, F.M.; Ogg, J.G.; Schmitz, M.D.; Ogg, G.M. (Eds.) Geologic Time Scale 2020; Elsevier: Amsterdam, The Netherlands, 2020. [Google Scholar]
  59. International Commission on Stratigraphy. International Chronostratigraphic Chart, v2024/12. Available online: https://Stratigraphy.org (accessed on 1 June 2026).
  60. Dunham, R.J. Classification of carbonate rocks according to depositional textures. Am. Assoc. Pet. Geol. Mem. 1962, 1, 108–121. [Google Scholar]
  61. Embry, A.F.; Klovan, J.E. Absolute water depth limits of late Devonian paleoecological zones. Geol. Rundsch. 1972, 60, 672–686. [Google Scholar] [CrossRef]
  62. Folk, R.L.; Andrews, P.B.; Lewis, D.W. Detrital sedimentary rock classification and nomenclature for use in New Zealand. N. Z. J. Geol. Geophys. 1970, 13, 937–968. [Google Scholar] [CrossRef]
  63. Tanner, W.F. The particle size scale. J. Sediment. Petrol. 1969, 39, 809–812. [Google Scholar] [CrossRef]
  64. Udden, J.A. Mechanical composition of clastic sediments. Geol. Soc. Am. Bull. 1914, 25, 655–744. [Google Scholar] [CrossRef]
  65. Wentworth, C.K. A scale of grade and class terms for clastic sediments. J. Geol. 1922, 30, 377–392. [Google Scholar] [CrossRef]
  66. Wentworth, C.K. The terminology of coarse sediments. Natl. Res. Counc. Bull. 1935, 98, 225–246. [Google Scholar]
  67. Burchette, T.P.; Wright, V.P. Carbonate ramp depositional systems. Sediment. Geol. 1992, 79, 3–57. [Google Scholar] [CrossRef]
  68. Wilson, J.L. Carbonate Facies in Geologic History; Springer: New York, NY, USA, 1975. [Google Scholar]
  69. Wang, H.; Zhong, H.; Chen, A.; Li, K.; He, H.; Qi, Z.; Zheng, D.; Zhao, H.; Hou, M. A knowledge graph for standard carbonate microfacies and its application in the automatical reconstruction of the relative sea-level curve. Geosci. Front. 2023, 14, 101535. [Google Scholar] [CrossRef]
  70. Aliane, K.; Benmansour, S. Microfacies analysis and depositional model of a complex hybrid carbonate–siliciclastic ramp from the Aptian–Albian of the Central Aurès Basin (NE Algeria). Carbonates Evaporites 2026, 41, 84. [Google Scholar]
  71. Amente, B.; Atnafu, B.; Kassa, S.; Domenico, G.K. Microfacies analysis and depositional environment of the Jurassic Antalo Limestone Formation, Blue Nile Basin, Ethiopia. Carbonates Evaporites 2025, 40, 93. [Google Scholar] [CrossRef]
  72. Shah, S.B.A.; Shah, S.H.A. Depositional model, cyclicity, and hydrocarbon potential of the Eocene Sakesar carbonate ramp, Salt Range, Pakistan. Carbonates Evaporites 2026, 41, 20. [Google Scholar] [CrossRef]
  73. Deng, L.; Hu, C.; Li, X.; Su, H.; Atuquaye Quaye, J.; Yuan, Q. Diagenetic evolution in marine carbonate rocks based on the typical case studies: Review and perspectives. Mar. Pet. Geol. 2025, 176, 107352. [Google Scholar] [CrossRef]
  74. Adams, A.; Diamond, L.W. Early diagenesis driven by widespread meteoric infiltration of a Central European carbonate ramp: A reinterpretation of the Upper Muschelkalk. Sediment. Geol. 2017, 362, 37–52. [Google Scholar] [CrossRef]
  75. Ahr, W.M. Geology of Carbonate Reservoir; Wiley: Hoboken, NJ, USA, 2008. [Google Scholar]
  76. Choquette, P.W.; James, N.P. Limestones: The burial diagenetic environment. Geosci. Can. 1990, 4, 75–111. [Google Scholar]
  77. Fontana, S.; Nader, F.H.; Morad, S.; Ceriani, A.; Al-Aasm, I.S.; Daniel, J.M.; Mengus, J.M. Fluid-rock interactions associated with regional tectonics and basin evolution. Sedimentology 2014, 61, 660–690. [Google Scholar]
  78. Goldhaber, M.B. Sulfur-rich sediments. In Sediments, Diagenesis and Sedimentary Rocks. Treatise on Geochemistry; Mackenzie, F.T., Ed.; Elsevier: Amsterdam, The Netherlands, 2004; pp. 257–288. [Google Scholar]
  79. Gomez-Rivas, E.; Martín-Martín, J.D.; Bons, P.D.; Koehn, D.; Griera, A.; Travé, A.; Llorens, M.-G.; Humphrey, E.; Neilson, J. Stylolites and stylolite networks as primary controls on the geometry and distribution of carbonate diagenetic alterations. Mar. Pet. Geol. 2022, 136, 105444. [Google Scholar] [CrossRef]
  80. Hou, M.C.; Jiang, W.J.; Xing, F.C.; Xu, S.L.; Liu, X.C.; Xiao, C. Origin of dolomites in the Cambrian (upper 3rd-Furongian) formation, south-eastern Sichuan Basin, China. Geofluids 2016, 16, 799–1058. [Google Scholar] [CrossRef]
  81. Humphrey, E.; Gomez-Rivas, E.; Neilson, J.; Martín-Martín, J.D.; Healy, D.; Yao, S.; Bons, P.D. Quantitative analysis of stylolite networks in different platform carbonate facies. Mar. Pet. Geol. 2020, 114, 104203. [Google Scholar] [CrossRef]
  82. Koehn, D.; Renard, F.; Toussaint, R.; Passchier, C.W. Growth of stylolite teeth pattern depending on normal stress and finite compaction. Earth Planet. Sci. Lett. 2007, 257, 582–595. [Google Scholar] [CrossRef]
  83. Martín-Martín, J.D.; Gomez-Rivas, E.; Gómez-Gras, D.; Travé, A.; Ameneiro, R.; Koehn, D.; Bons, P.D. Activation of stylolites as conduits for overpressured fluid flow in dolomitized platform carbonates. Geol. Soc. Lond. Spec. Publ. 2018, 459, 157–176. [Google Scholar]
  84. Morad, D.; Nader, F.H.; Morad, S.; Al Darmaki, F.; Hellevang, H. Impact of stylolitization on fluid flow and diagenesis in foreland basins: Evidence from an Upper Jurassic Carbonate gas reservoir, Abu Dhabi, United Arab Emirates. J. Sediment. Res. 2018, 88, 1345–1361. [Google Scholar] [CrossRef]
  85. Sibley, D.F.; Gregg, J.M. Classification of Dolomite Rock Textures. J. Sediment. Res. 1987, 57, 967–975. [Google Scholar] [CrossRef]
  86. Domozych, D.; Sørensen, I.; Popper, Z.A. Editorial: Charophytes: Evolutionary Ancestors of Plants and Emerging Models for Plant Research. Front. Plant Sci. 2017, 8, 338. [Google Scholar] [CrossRef] [PubMed]
  87. Habibi, T. Microfacies analysis and paleoecology of the Oligocene succession in a central Tethyan carbonate platform, Zagros Basin, SW Iran. Acta Geol. Sin. 2021, 95, 1634–1646. [Google Scholar] [CrossRef]
  88. Catuneanu, O.; Galloway, W.E.; Kendall, C.G.S.C.; Miall, A.D.; Posamentier, H.W.; Strasser, A.; Tucker, M.E. Sequence Stratigraphy: Methodology and Nomenclature. Newsl. Stratigr. 2011, 44, 173–245. [Google Scholar] [CrossRef]
  89. Wilgus, C.K.; Hastings, B.S.; Kendall, C.G.S.C.; Posamentier, H.W.; Ross, C.A.; Van Wagoner, J.C. (Eds.) Sea-Level Changes—An Integrated Approach; SEPM Special Publication; GeoScieceWorld: McLean, VA, USA, 1988; Volume 42, pp. 1–407. [Google Scholar]
  90. Simmons, M.D.; Sharland, P.R.; Casey, D.M.; Davies, R.B.; Sutcliffe, O.E. Arabian Plate sequence stratigraphy: Potential implications for global chronostratigraphy. GeoArabia 2007, 12, 101–130. [Google Scholar] [CrossRef]
  91. Haq, B.U. Cretaceous eustasy revisited. Glob. Planet. Change 2014, 113, 44–58. [Google Scholar] [CrossRef]
  92. Kominz, M.A.; Browning, J.V.; Miller, K.G.; Sugarman, P.J.; Mizintseva, S.; Scotese, C.R. Late Cretaceous to Miocene sea-level estimates from the New Jersey and Delaware coastal plain coreholes: An error analysis. Basin Res. 2008, 20, 211–226. [Google Scholar] [CrossRef]
  93. Piryaei, A.; Reijmer, J.J.G.; Borgomano, J.; van Buchem, F.S.P. Late Cretaceous tectonic and sedimentary evolution of the Bandar Abbas area, Fars region, southern Iran. J. Pet. Geol. 2011, 34, 157–180. [Google Scholar] [CrossRef]
  94. Navidtalab, A.; Mehrabi, H.; Shafaii Moghadam, H.; Rahimpour-Bonab, H. Strontium isotope proxy of sedimentological records reveals uplift and erosion in the Southeastern Neo-Tethys ocean during the late Cretaceous. Sci. Rep. 2024, 14, 3499. [Google Scholar] [CrossRef] [PubMed]
  95. Talebi, E.; Mehrabi, H.; Daraei, M.; Navidtalab, A.; Bayet-Goll, A. Palaeoenvironmental interpretation and isotope stratigraphy of the Campanian–Danian successions in the Zagros Foreland Basin (Kabir Kuh, Lurestan, Iran). Cretac. Res. 2025, 168, 106058. [Google Scholar]
  96. Alsharhan, A.S.; Strohmenger, C.J.; Al-Mansoori, A. Mesozoic petroleum systems of Abu Dhabi, United Arab Emirates. Am. Assoc. Pet. Geol. Mem. 2014, 106, 679–711. [Google Scholar]
  97. Stewart, S.A.; Reid, C.T.; Hooker, N.P.; Kharouf, O.W. Mesozoic siliciclastic reservoirs and petroleum system in the Rub’ Al-Khali basin, Saudi Arabia. Am. Assoc. Pet. Geol. Bull. 2016, 100, 819–841. [Google Scholar] [CrossRef]
  98. Heydari, E. Tectonics versus eustatic control on supersequences of the Zagros Mountains of Iran. Tectonophysics 2008, 451, 56–70. [Google Scholar] [CrossRef]
  99. Wright, N.M.; Seton, M.; Williams, S.E.; Whittaker, J.M.; Muller, R.D. Sea-level fluctuations driven by changes in global ocean basin volume following supercontinent break-up. Earth-Sci. Rev. 2020, 208, 103293. [Google Scholar] [CrossRef]
  100. Young, A.; Flament, N.; Williams, S.E.; Merdith, A.; Cao, X.; Muller, R.D. Long-term Phanerozoic sea level change form solid Earth processes. Earth Planet. Sci. Lett. 2022, 584, 117451. [Google Scholar] [CrossRef]
  101. Moradi-Doreh, F.; Habibi, T.; Ruban, D.A.; Hosseinzadeh, R. A Large Cenomanian Carbonate Ramp at the Transition Between Two Domains of the Zagros Sedimentary Basin, SW Iran: Cyclic Evolution and Its Eustatic and Tectonic Controls. J. Mar. Sci. Eng. 2025, 13, 1084. [Google Scholar] [CrossRef]
  102. Wang, G.; Gao, H.; Zou, H. Sequence stratigraphy and geometry of the carbonate platform in the Longwangmiao Formation (Toyonian), Cambrian, SW China. Front. Mar. Sci. 2025, 12, 1607571. [Google Scholar] [CrossRef]
  103. Berra, F. Soft-sediment deformation structures and Neptunian dykes across a carbonate system: Evidence for an earthquake-related origin (Norian, Dolomia Principale, Southern Alps, Italy). Sedimentology 2024, 71, 827–849. [Google Scholar]
  104. Banerjee, A.; Salim, A.M.A.; Husen, M.H.; Latiff, A.H.A. Evaluation of Carbonate Platform in the Deep-water Dangerous Grounds, NW Sabah Platform Region, Malaysia. Pet. Coal 2022, 64, 515–532. [Google Scholar]
  105. Budai, T.; Vörös, A. Middle Triassic platform and basin evolution of the Southern Bakony mountains (Transdanubian Range, Hungary). Riv. Ital. Paleontol. Stratigr. 2006, 112, 359–371. [Google Scholar] [CrossRef]
Figure 1. Structural subdivisions of the Zagros sedimentary basin (modified from ref. [3]) and the geographic locations of Wells 1–4. The red line in the bottom image indicates lateral displacements along the fault. The red rectangle in the bottom image marks the study area where the wells are located. The units are colored differently for easier visual distinction, and their names are given in violet for the same purpose.
Jmse 14 01227 g001
Figure 2. Schematic geological map of the study area (corresponds to the red rectangle in Figure 1) (modified from ref. [32] with permission from the National Iranian Oil Company). Stars indicate Wells 1–4 considered in this study. The stratigraphical packages and the corresponding rocks are colored differently for easier visual distinction.
Jmse 14 01227 g002
Figure 3. Generalized stratigraphical scheme of the Upper Cretaceous deposits in the Zagros Basin (based on the information from James and Wynd [35]). White color indicates hiatuses. The units are colored differently for easier visual distinction. The red rectangle corresponds to the sedimentary succession in the study area. Approximate thicknesses of the units are given for reference in parentheses.
Jmse 14 01227 g003
Figure 4. Carbonate microfacies types and fine siliciclastic lithofacies of the Laffan Shale Member and the Ilam Formation: (a,b)—MF1, (c,d)—MF2, (e,f)—MF3, (g,h) (particle in ellipse)—MF4, (i,j)—MF5, (k)—MF6, (l)—LF1. Labels: B—bivalve, C—Cuneolina, Ch—charophyte, Di—Dicyclina, G—gastropod, Ro—Rotalia, Gr—green algae, M—miliolid, E—echinoid, P—peloid, R—rudist. Green arrows indicate the components labeled by the letters.
Jmse 14 01227 g004aJmse 14 01227 g004b
Figure 5. Coniacian–Santonian deposits in Well 3. Different colors are used for easier visual distinction. Systems tracts: TST—transgressive systems tract; HST—highstand systems tract; MFS—maximum flooding surface (shown approximately). Sources indicated in the image: (Wynd 1965)—[34], (Khalili 1967)—[49].
Jmse 14 01227 g005
Figure 6. Coniacian–Santonian deposits in Well 4. Different colors are used for easier visual distinction. Systems tracts: TST—transgressive systems tract; HST—highstand systems tract; MFS—maximum flooding surface (shown approximately). Sources indicated in the image: (Wynd 1965)—[34], (Khalili 1967)—[49].
Jmse 14 01227 g006
Figure 7. Depositional model of the Ilam Formation in the study area (different colors are used for better visualization of the details). This model is a schematic summary of the outcomes of the carbonate microfacies analysis and not a paleogeographical reconstruction of the study area.
Jmse 14 01227 g007
Figure 8. Paleogeographical interpretations for the study area: (a)—comparison of the transgression–regression cycle established in the study area with the global long-term sea-level changes (based on the information from [91,92]), (b)—location of the study area in the central sector of the Neo-Tethys (based on the information from Golonka [52]; only blocks indicated in that work are labeled). Due to biostratigraphical uncertainties, the change from the long-term transgression (green) to the long-term regression (orange) is shown very approximately. Sources indicated in the image: Haq (2014)—[91], Kominz et al. (2008)—[92].
Jmse 14 01227 g008
Figure 9. Correlation of the considered wells in the study area. The insert scheme shows the relative positions of the wells marked by stars (see Figure 1 for scale and other details). Different colors are used for easier visual distinction. Sources indicated in the image: (Wynd 1965)—[34], (Khalili 1967)—[49].
Jmse 14 01227 g009
Disclaimer/Publisher’s Note: The statements, opinions and data contained in all publications are solely those of the individual author(s) and contributor(s) and not of MDPI and/or the editor(s). MDPI and/or the editor(s) disclaim responsibility for any injury to people or property resulting from any ideas, methods, instructions or products referred to in the content.