Article

Investigation into the Distribution Characteristics and Sources of Dissolved Gases in the Offshore Waters of Dingzi Bay, South Yellow Sea

1
Qingdao Institute of Marine Geology, China Geological Survey, Qingdao 266237, China
2
Laboratory for Marine Mineral Resources, Qingdao Marine Science and Technology Center, Qingdao 266237, China
3
Key Laboratory of Ocean Observation and Forecasting, Key Laboratory of Marine Geology and Environment, Institute of Oceanology, Chinese Academy of Sciences, Qingdao 266071, China
4
Qingdao Sparta Analysis & Test Co., Ltd., Qingdao 266555, China
*
Author to whom correspondence should be addressed.
J. Mar. Sci. Eng. 2026, 14(13), 1167; https://doi.org/10.3390/jmse14131167
Submission received: 8 May 2026 / Revised: 12 June 2026 / Accepted: 16 June 2026 / Published: 25 June 2026
(This article belongs to the Section Chemical Oceanography)

Abstract

Utilizing seawater samples collected during the summer of 2025 in the Dingzi Bay region, South Yellow Sea, this study conducted a comprehensive analysis of the contents and concentrations of dissolved gases (N2, O2, Ar, CO2) and hydrocarbon gases (such as methane, ethane, and propane). The findings reveal that the dissolved gases in the study area are predominantly composed of N2 and O2, with average proportions of 77.8% and 21.6%, respectively. Notably, significant CO2 anomalies were detected at certain stations, which may indicate intense organic matter degradation or the introduction of external fluids. Furthermore, wet gas constituents, including propane, butane, and isobutane, were identified in several samples, suggesting potential submarine oil and gas seepage or subsurface thermogenic gas input. Spatial analysis revealed that anomalous points were primarily concentrated at stations CJ01, CJ08, CJ10, and CQ01, with no significant correlation to water depth, suggesting that their distribution may be influenced by local geological structures or bottom currents. This study elucidates the complexity and heterogeneity of dissolved gas composition in the waters of Dingzi Bay, thereby providing a novel scientific foundation for regional carbon cycle research, seabed resource exploration, and marine environmental monitoring.

1. Introduction

Coastal regions, as critical zones of land–sea interaction, play an essential role in global material and energy cycles [1], exerting a significant influence on both regional and global climate change. Dingzi Bay region, South Yellow Sea, situated in the southeastern part of the Shandong Peninsula, represents a quintessential coastal bay ecosystem in Qingdao. The composition of dissolved gases in its seawater has a direct impact on the quality of the regional marine ecological environment and the sustainable development of aquaculture. Previous studies in the Dingzi Bay area have primarily focused on the seasonal variations of conventional hydrochemical parameters (e.g., dissolved oxygen and pH) and their response to terrestrial inputs and aquaculture activities [2]. However, systematic investigations into the composition, spatial distribution, and sources of a broad spectrum of dissolved gases—including hydrocarbon and noble gases—are notably lacking. This gap is largely attributable to the technical challenges associated with maintaining sample integrity during collection from shallow, dynamic coastal environments. With the rapid socio-economic development along coastal regions, a comprehensive understanding of the spatial distribution characteristics and influencing factors of dissolved gas components in this marine area is of significant scientific importance. This understanding is crucial for elucidating the marine carbon cycle, biogeochemical processes, air–sea exchange mechanisms, and gas accumulation [3,4].
Dissolved gases in seawater, such as N2, O2, CO2, and methane, serve as key indicators for tracing marine biogeochemical cycles and are essential for comprehending the functioning of marine ecosystems and their responses to global climate change [5]. Among these gases, O2 is fundamental for sustaining aerobic life processes in the ocean, and its distribution effectively reflects the level of marine primary productivity and water exchange conditions. CO2, as a critical greenhouse gas, plays a pivotal regulatory role in the energy balance of the global climate system through its air–sea exchange processes. Despite its low atmospheric concentration, methane possesses a global warming potential approximately 28–34 times greater than that of CO2. Methane emissions resulting from the degradation of organic matter in shallow sea sediments can significantly influence regional climate dynamics [6]. The concentration, spatial distribution, and air–sea fluxes of these gases are not merely outcomes of the interplay among marine physical, chemical, and biological processes, but also serve as critical indicators for evaluating the health and environmental stress of nearshore ecosystems [5].
Currently, the assessment of dissolved gases in seawater is primarily conducted through two technical methodologies: one involves on-site sampling using water samplers such as Niskin bottles, followed by laboratory analysis via gas chromatography or mass spectrometry; the other utilizes in situ sensors or spectroscopic techniques for real-time online monitoring. Traditional sampling methods are subject to inherent limitations. During the ascent of the water sampler, fluctuations in pressure and temperature can lead to significant degassing or fractionation of dissolved gases within the water sample, resulting in analytical outcomes that deviate from the true in situ values [7]. The ocean sniffer provides another means of continuously measuring dissolved gases in the water column. Used as early as the 1970s and 1980s, column sniffer technology served to collect and analyze dissolved petroleum volatiles for offshore oil and gas exploration [8]. As one of the earliest in situ approaches to enable continuous underway measurements, the ocean sniffer offers a unique advantage in circumventing the limitations of conventional sampling. Nevertheless, its use remains constrained by challenges such as detection sensitivity and environmental interference. In recent years, in situ measurement techniques such as laser Raman spectroscopy have demonstrated considerable advantages in the study of near-seafloor environments, they remain insufficiently developed for application in shallow sea areas [9,10].
To address these challenges, this study employed a self-developed shallow-sea in situ fidelity sampling device to conduct field tests in the Dingzi Bay area, South Yellow Sea, achieving a comprehensive assessment of the biogeochemical behavior of dissolved gases in this region for the first time. Using in situ concentration data of dissolved gases in nearshore seawater, including major gases (N2, O2, Ar, CO2), hydrocarbon gases (methane, ethane, propane, butane, isobutane), noble gases (He, Ne, Kr, Xe), and trace gases (H2, CO, H2S), this study systematically examined the spatial distribution characteristics, controlling factors, and genetic mechanism. Our analysis aims to elucidate the pivotal roles and contributions of dissolved gases in the marine carbon cycle, biogeochemical processes, air–sea exchange, and gas accumulation.

2. Regional Geological Background

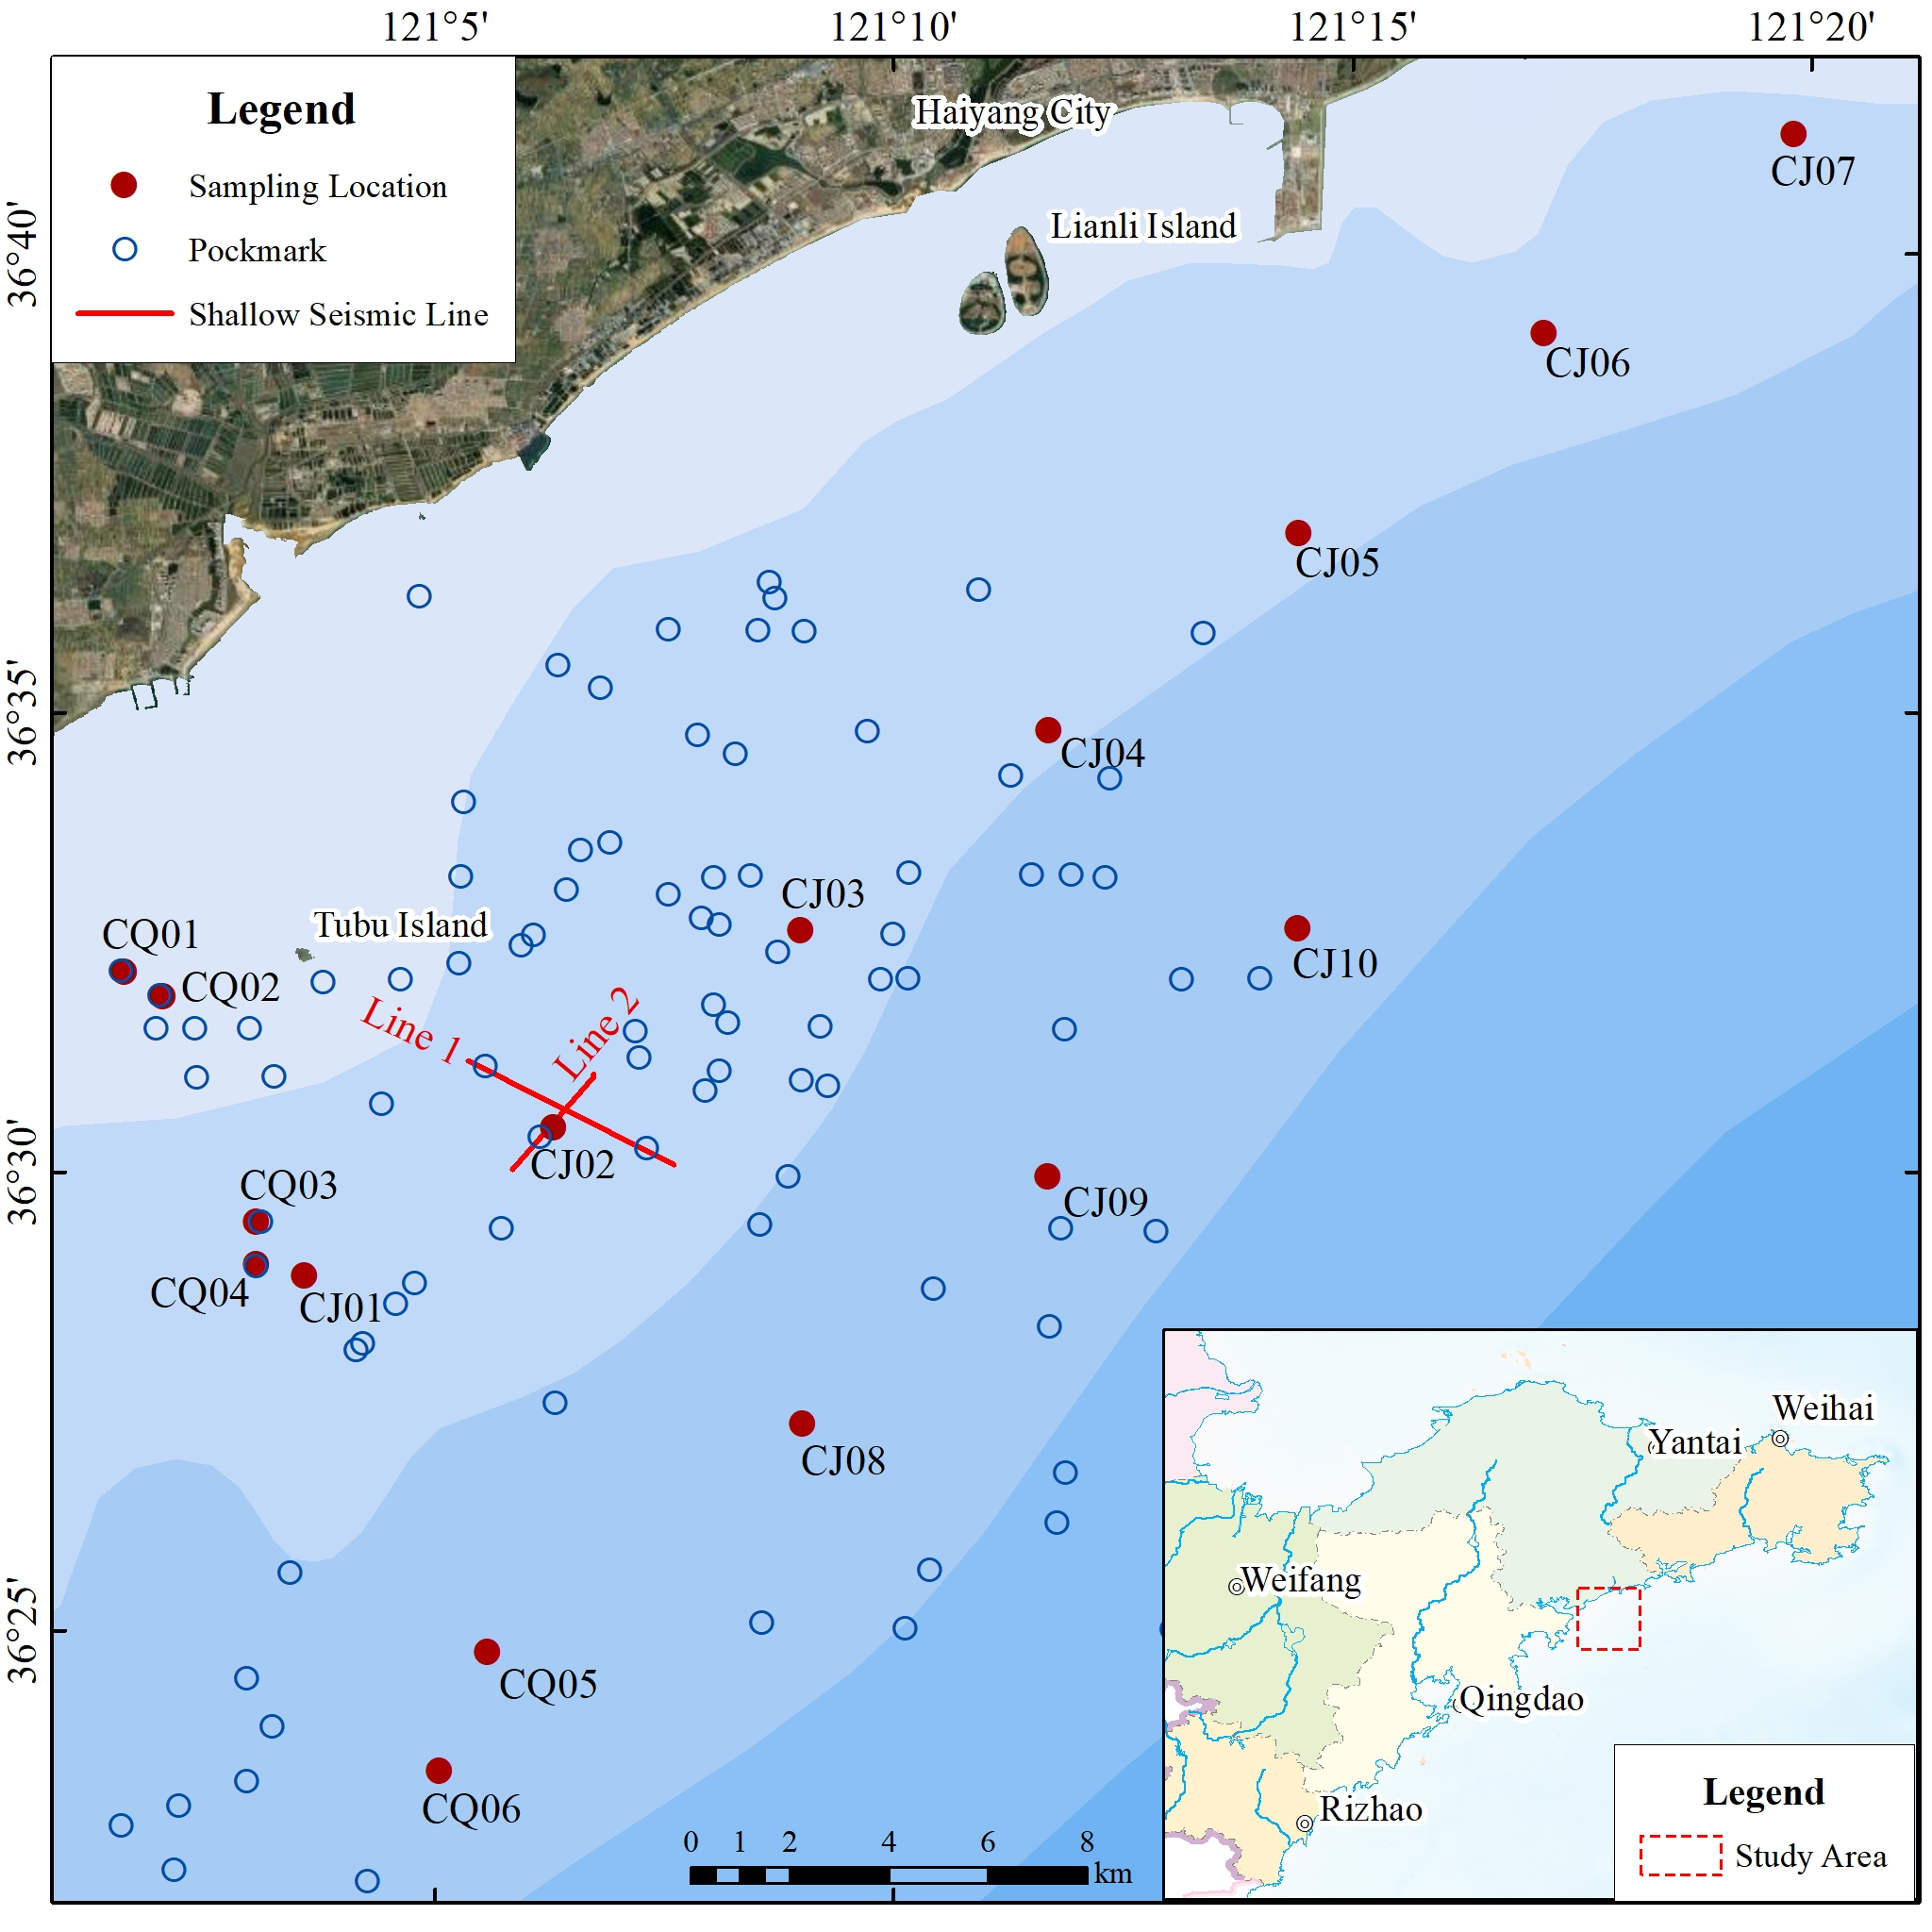
The study area, Dingzi Bay, South Yellow Sea, is situated in the southeastern region of the Shandong Peninsula, at the confluence of Qingdao’s offshore Laoshan Bay and the Dingzi River estuary, characterized by a complex geological setting (Figure 1). The coastline extends from the east of Xiaodongkou, Jinkou Village in the north, to Maqiancun Village, Aoshanwei Town in the south. The region’s stratigraphy is diverse: the areas north of Wali Township and north of Daren River in Aoshanwei Town are part of the Mesozoic Cretaceous or Jurassic strata, while the southern region is predominantly covered by Mesozoic intrusive granite. The coastal landscape primarily features alluvial-marine landforms [11].
Since the Quaternary period, this region has undergone intricate sedimentary processes, characterized by the extensive distribution of marine facies deposits in coastal plain areas below the 5 m elevation contour. In Dingzi Bay, coastal sediments predominantly consist of gray-yellow and gray-black clayey silt and silty clay, which are abundant in foraminifera and marine shells, with thicknesses exceeding 6.5 m [12]. Notably, shallow seismic profiling offshore has identified the presence of buried paleo-channels near the Dingzi Bay estuary. These channels contain sediments rich in organic matter-bearing terrigenous clasts, providing a favorable substrate for the formation of shallow biogenic gas; at present, shallow gas reservoirs have been widely identified within this stratum [13].
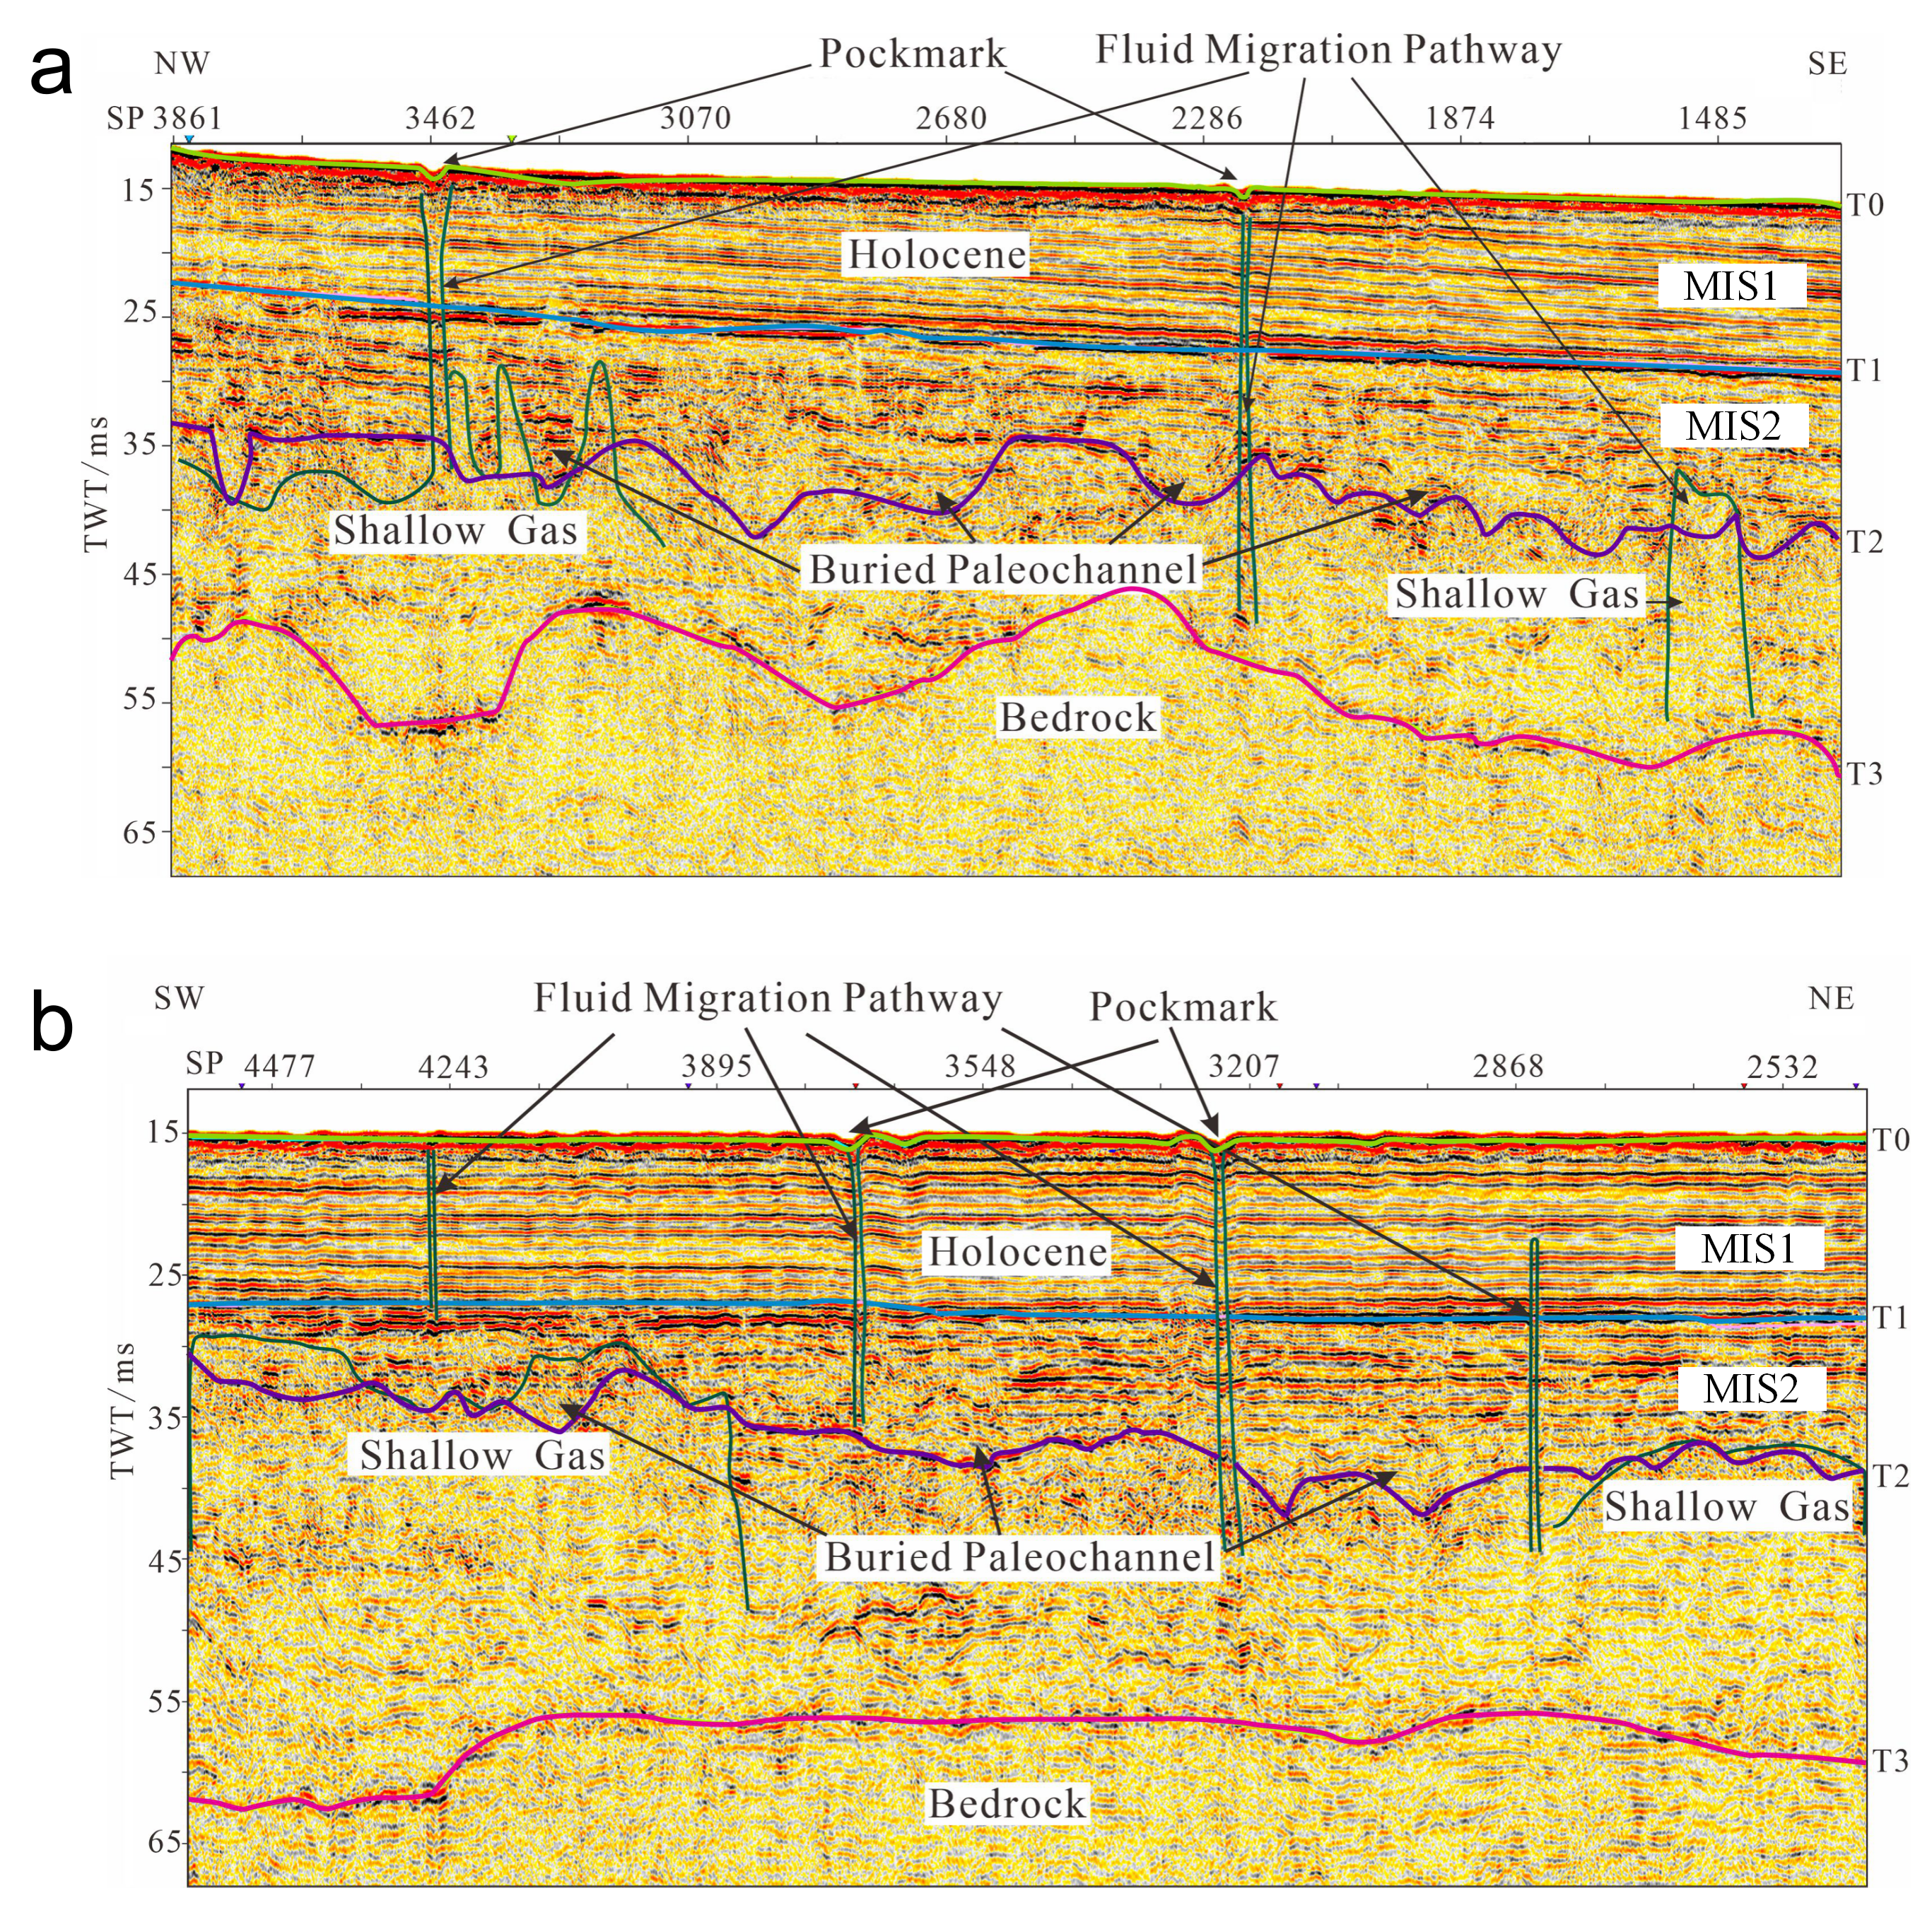
This fine-grained sediment-dominated sedimentary environment is precisely a favorable setting for biogenic methane generation and preservation. The total organic carbon (TOC) content of fine-grained sediments typically ranges from 0.5% to 1.5%, which is conducive to methanogenesis and gas preservation [14]. Radiocarbon dating of coeval sediment cores from adjacent areas suggests that the uppermost 5–10 m of the Holocene sequence accumulated over the past 6–8 kyr, during which repeated cycles of organic matter burial and early diagenesis could have generated biogenic methane and, to a lesser extent, heavier alkanes via slow thermal alteration at shallow burial depths [15]. As shown in Figure A1, the shallow seismic profile clearly reveals the co-occurrence of buried paleo-channels, vertical fluid migration pathways, shallow gas reservoirs, and pockmarks. The presence of buried paleo-channels indicates that sand-rich channel-fill deposits serve not only as conduits for lateral gas migration but also as high-quality reservoirs for shallow gas accumulation [16]. Vertical fluid pathways connect deep gas sources to the paleo-channel sand bodies, allowing gas to accumulate as shallow gas reservoirs within these sand bodies, while residual gas seeps upward to the seafloor, ultimately leading to the formation of pockmarks.
Figure 1. Map of sampling stations and seabed pockmark distribution in the study area [17], with Line 1 and Line 2 as two intersecting sub-bottom profile lines.
Jmse 14 01167 g001

3. Materials and Methods

3.1. Study Area Overview

Sampling stations were established in the nearshore waters of Dingzi Bay, South Yellow Sea (Figure 1). The coastline exhibits a sinuous morphology, with landforms such as Kaolaotou, Dazui, Chanshan Tou, and Aoshan Tou projecting into the sea, creating a distinctive bay landscape encircled by hills. The water depth in the bay generally ranges from 2 to 10 m, with an average depth of approximately 3.2 m, and the depth at the bay center can reach 5.9 m during low tide [18].
In this study, two continuous transects were established along isobaths in the offshore waters of Dingzi Bay, and one transect was deployed perpendicular to the shoreline. The nearshore transect, comprising stations CJ01 to CJ07, is located approximately 5 nautical miles from the coastline, while the offshore transect, comprising stations CJ08 to CJ10, is situated approximately 10 nautical miles from the coastline. Stations along both transects are evenly spaced along a straight line to systematically monitor gas variation trends with increasing distance from the shore. Additionally, stations CQ01 to CQ06 are irregularly arranged perpendicular to the coastline to trace shallow gas seepage. Surface and bottom water samples were collected at each station based on water depth (with mid-depth water samples collected where water depth exceeded 10 m) to elucidate vertical distribution patterns along the depth gradient. This equally spaced, linear transect design facilitates a systematic analysis of dissolved gas variation patterns along specific directions, such as distance from shore or water depth gradient.

3.2. Sample Collection

From June to July 2025, an in situ fidelity seawater sampling survey was conducted in the Dingzi Bay area aboard the research vessel “Ke Hang”, resulting in the establishment of a total of 16 sampling stations (Table 1).
This study utilized an automatic in situ seawater fidelity sampler (Figure 2) (Model: JQY2H-6P, Qingdao Tuna Marine Equipment Co., Ltd., Qingdao, China) in conjunction with quick-connect fidelity sampling tubes (Model: KJ2H-100, Qingdao Tuna Marine Equipment Co., Ltd., Qingdao, China) for the collection of seawater gas samples. The system connects the deck unit with the underwater operating unit via a shipboard communication cable, integrating a Conductivity-Temperature-Depth (CTD) profiler and six pressure-adaptive sampling tubes. The main technical specifications of this device include a maximum operating depth of 200 m, an adjustable single-tube sampling volume ranging from 0~100 mL, and a fidelity rate approaching 100%. The primary innovation of this device is its capability for real-time communication and fully autonomous underwater operation, facilitating rapid sample collection while preserving the in situ state at depths of up to 200 m. This ensures that no gas escapes during sampling and prevents any exchange of substances between the sample and the external environment.
Sampling layers were determined based on real-time monitoring data obtained from the CTD profiler, with specific settings detailed in Table 1. Approximately 80 mL of water was collected from each layer, and the valves were immediately closed post-sampling to maintain in situ fidelity. Upon retrieval on deck, the sealing status was promptly verified, and on-site temperature and pressure were recorded. Samples were then stored in a refrigerator at 4 °C within two hours and subsequently transported to the onshore laboratory for further analysis.

3.3. Test Analysis

All sample testing and analysis were completed at Qingdao Sparta Analysis & Test Co., Ltd., Qingdao, China.
Gas component determination was performed using the headspace method. Upon arrival at the laboratory, samples were first subjected to pressure equilibrium, and then gas components were manually transferred to the gas chromatography injection system. Gas volume was obtained by cumulative measurement through multiple extractions, with measurement error controlled within 0.1 mL. Analysis was conducted using an Agilent 6890N gas chromatograph (Santa Clara, CA, USA) equipped with a flame ionization detector (FID) and a thermal conductivity detector (TCD). Separation of alkane gases (methane, ethane, propane, i-C4H10, n-C4H10) was achieved using an HP-PONA capillary column (50 m × 0.20 mm × 0.50 µm, Agilent, Santa Clara, CA, USA) with FID detection, high-purity nitrogen (99.999%) as carrier gas, and an oven temperature program: 35 °C held for 5 min, then increased to 150 °C at 5 °C/min held for 2 min. Analysis of air components (N2, O2, Ar) used an RT-Msieve 5A capillary column (30 m × 0.53 mm, Grace, Cambridge, MA, USA) with TCD detection, high-purity helium (99.999%) as carrier gas, and a constant oven temperature of 40 °C. CO2 determination employed a GC-Q capillary column (30 m × 0.53 mm, Restek, Mount Airy, PA, USA) with TCD detection, also using high-purity helium as carrier gas, and a constant oven temperature of 40 °C.
Qualitative analysis was based on retention time comparison, and quantitative analysis utilized the external standard method. Standard gases included N2, O2, CO2, Ar, methane, ethane, propane, and C4H10, with concentration ranges matching the samples to be tested. Correlation coefficients (R2) for standard curves were all greater than 0.999. Method detection limits: alkane gases below 1.0 × 10⁻⁶ (volume fraction), permanent gases and CO2 below 5.0 × 10⁻⁶. Repeat test precision, expressed as relative standard deviation (RSD), was <10% for alkane gases and <5% for permanent gases and CO2.
The gas components analyzed included N2, O2, CO2, Ar, alkanes (methane, ethane, propane, butane, isobutane, and pentane), alkenes (ethylene and propylene), noble gases (He, Ne, Kr, Xe), and trace gases (H2, CO, H2S). However, the noble gases, trace gases, pentane, ethylene, and propylene were not detected.
Determination of major elements (K, Ca, Na, Mg) was performed using an Inductively Coupled Plasma Optical Emission Spectrometer (ICP-OES, Varian 720-ES, Palo Alto, CA, USA). Samples were filtered through a 0.45 µm membrane, diluted 100 times with 2% HNO3, and analyzed. Relative error was <5%, RSD < 3%.
Analysis of Cl and SO42− used an ion chromatograph (RPIC-2017, Qingdao, China) equipped with an anion exchange column (REEPO-HA1, Qingdao, China), with Na2CO3/NaHCO3 mixed solution as the eluent at a flow rate of 1.0 mL/min, and a suppressed conductivity detector. Samples were filtered through a 0.22 µm membrane and directly injected, RSD < 2%.
Salinity was measured using a Mettler Toledo multi-parameter analyzer (Seven Excellence, Shanghai, China) with an instrument precision of 0.01‰, calibrated with standard seawater before measurement.
Quality Control:
(i)
Overall, 10% of the samples were analyzed in duplicate to evaluate analytical precision (RSD ≤ 15%).
(ii)
A single-point calibration was employed, and the response value at the calibration point must lie within the linear range of the instrument. For each batch (≤20 samples), the calibration point was measured once before and once after the sample analysis; the relative error between the measured value and the initial calibration point concentration should be within ±20%.

3.4. Data Analysis

The volume percentage (%) of dissolved gases refers to the proportion of each gas component in the total extracted gas after degassing, representing a relative composition. Based on the Ideal Gas Law, this percentage is converted into an absolute concentration expressed in μmol/L:
C = P × V g a s × 10 6 R × T × V w a t e r
where C is the concentration (μmol/L); P is the ambient pressure (assumed to be 1 atm during laboratory measurement); V g a s is the volume of a given gas component (L), obtained by multiplying the total volume of the extracted gas by the volume fraction of that component; R is the ideal gas constant (0.082057 L·atm·K−1·mol−1); T is the laboratory temperature (K); V w a t e r is the volume of the water sample (L).

4. Results

4.1. Characteristics of the Hydrological Environment

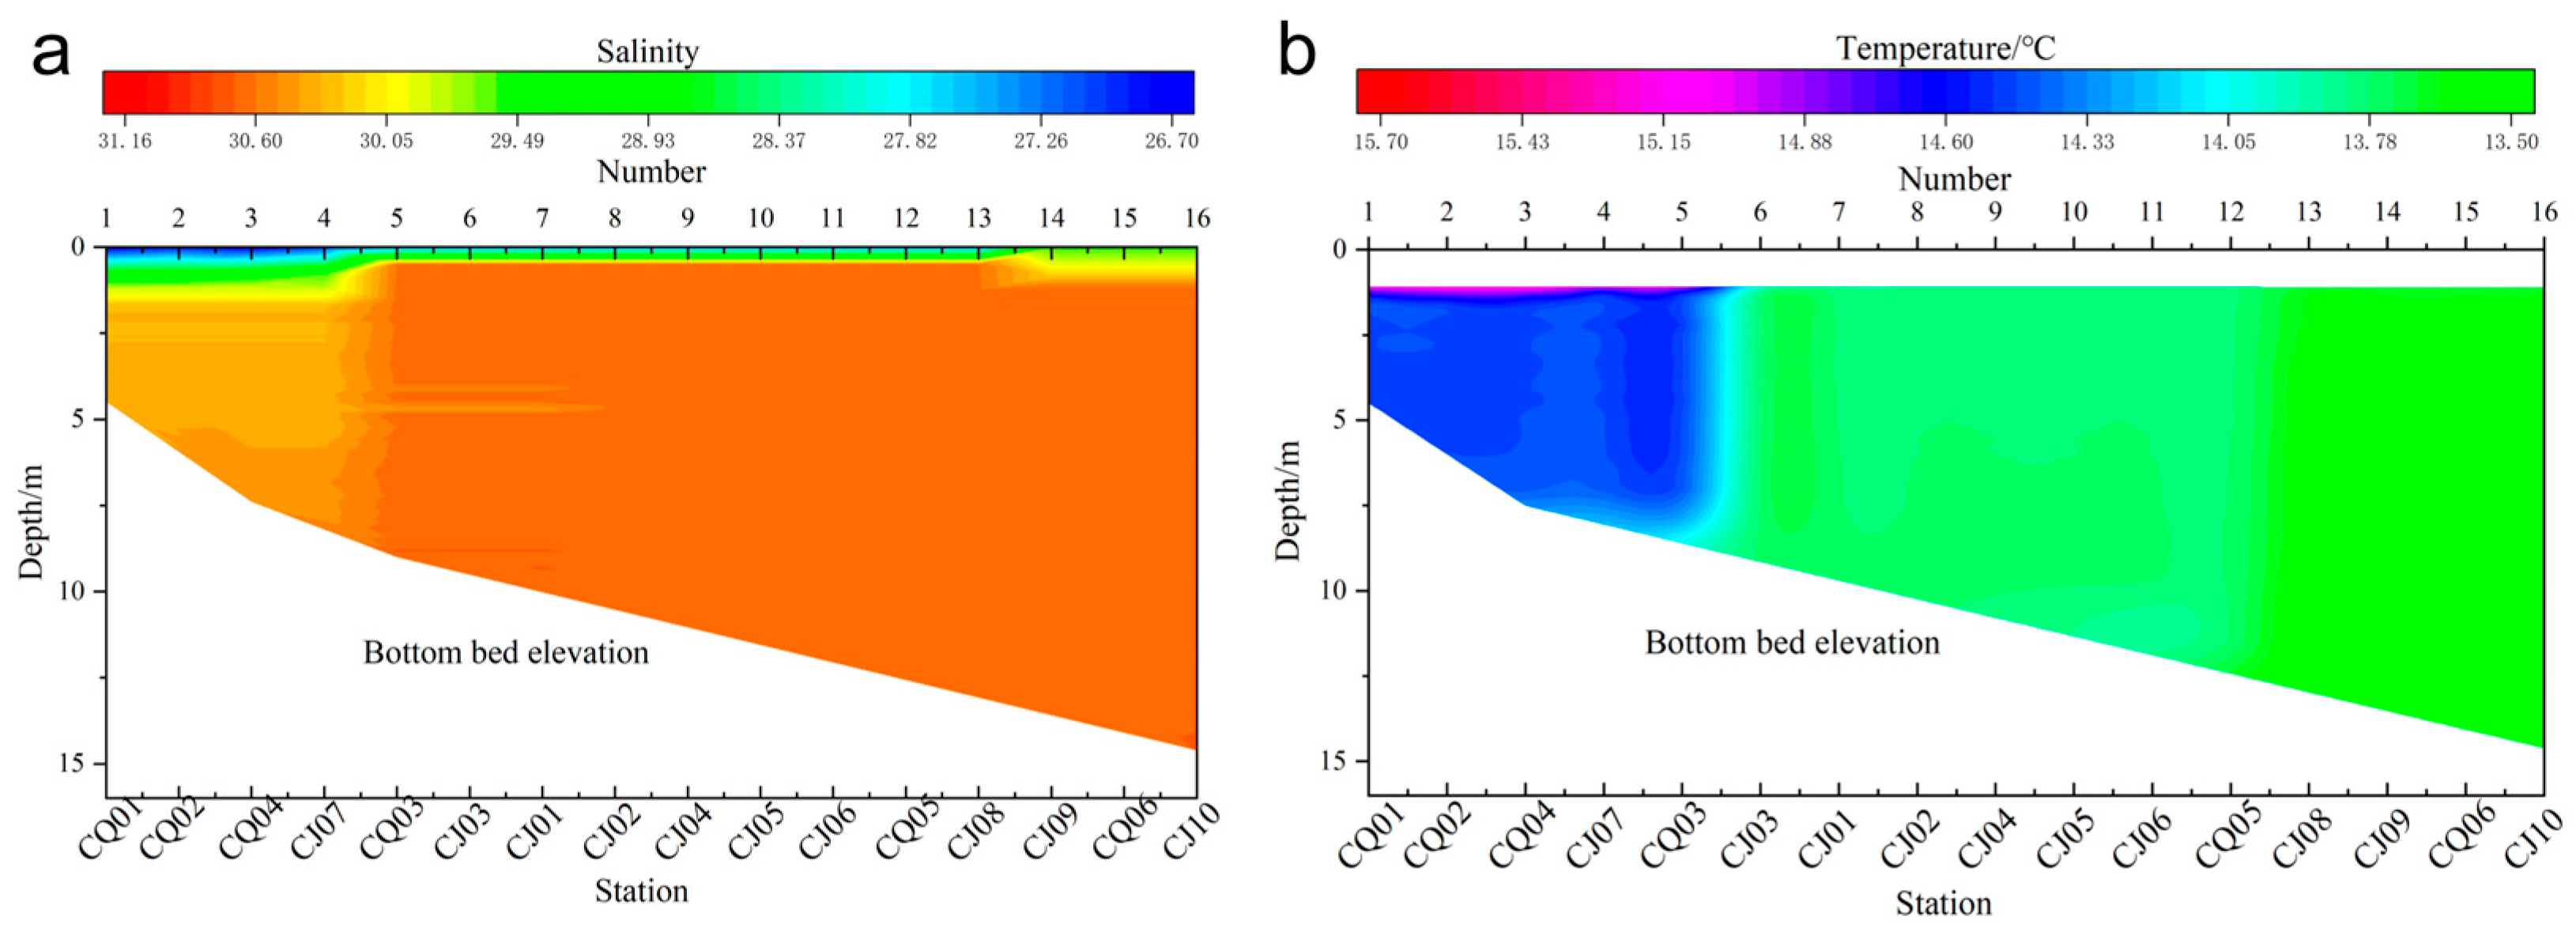
As illustrated in Figure 3, the hydrographic structure of the study area is primarily controlled by salinity, while thermal stratification is extremely weak. Surface waters are significantly influenced by terrestrial runoff, showing pronounced horizontal salinity variations: in nearshore stations (e.g., CQ01, CQ02, CQ04, CJ07), surface salinity is as low as 26.7–27.0, whereas in offshore deeper stations (e.g., CJ10, CJ09), it reaches 29.5. Correspondingly, surface temperature is higher (~15.2 °C) and decreases slowly with depth, reaching ~13.5 °C at the bottom; the overall temperature difference across the study area is less than 1.5 °C, with no typical thermocline present. The vertical salinity structure exhibits strong stratification, allowing the water column to be divided vertically into three water masses: a shallow low-salinity freshwater plume (salinity < 28), an intermediate mixed water mass (salinity 29–30.5), and a bottom Yellow Sea high-salinity water mass (salinity 30.6–30.7). The bottom high-salinity water is uniformly distributed, whereas the surface freshwater plume is confined to nearshore shallow areas. These characteristics indicate that the hydrographic environment of this area is mainly governed by the density gradient between the intrusion of offshore high-salinity water and river-induced freshwater, with vertical mixing being strongly suppressed.

4.2. Major Element Composition of Seawater

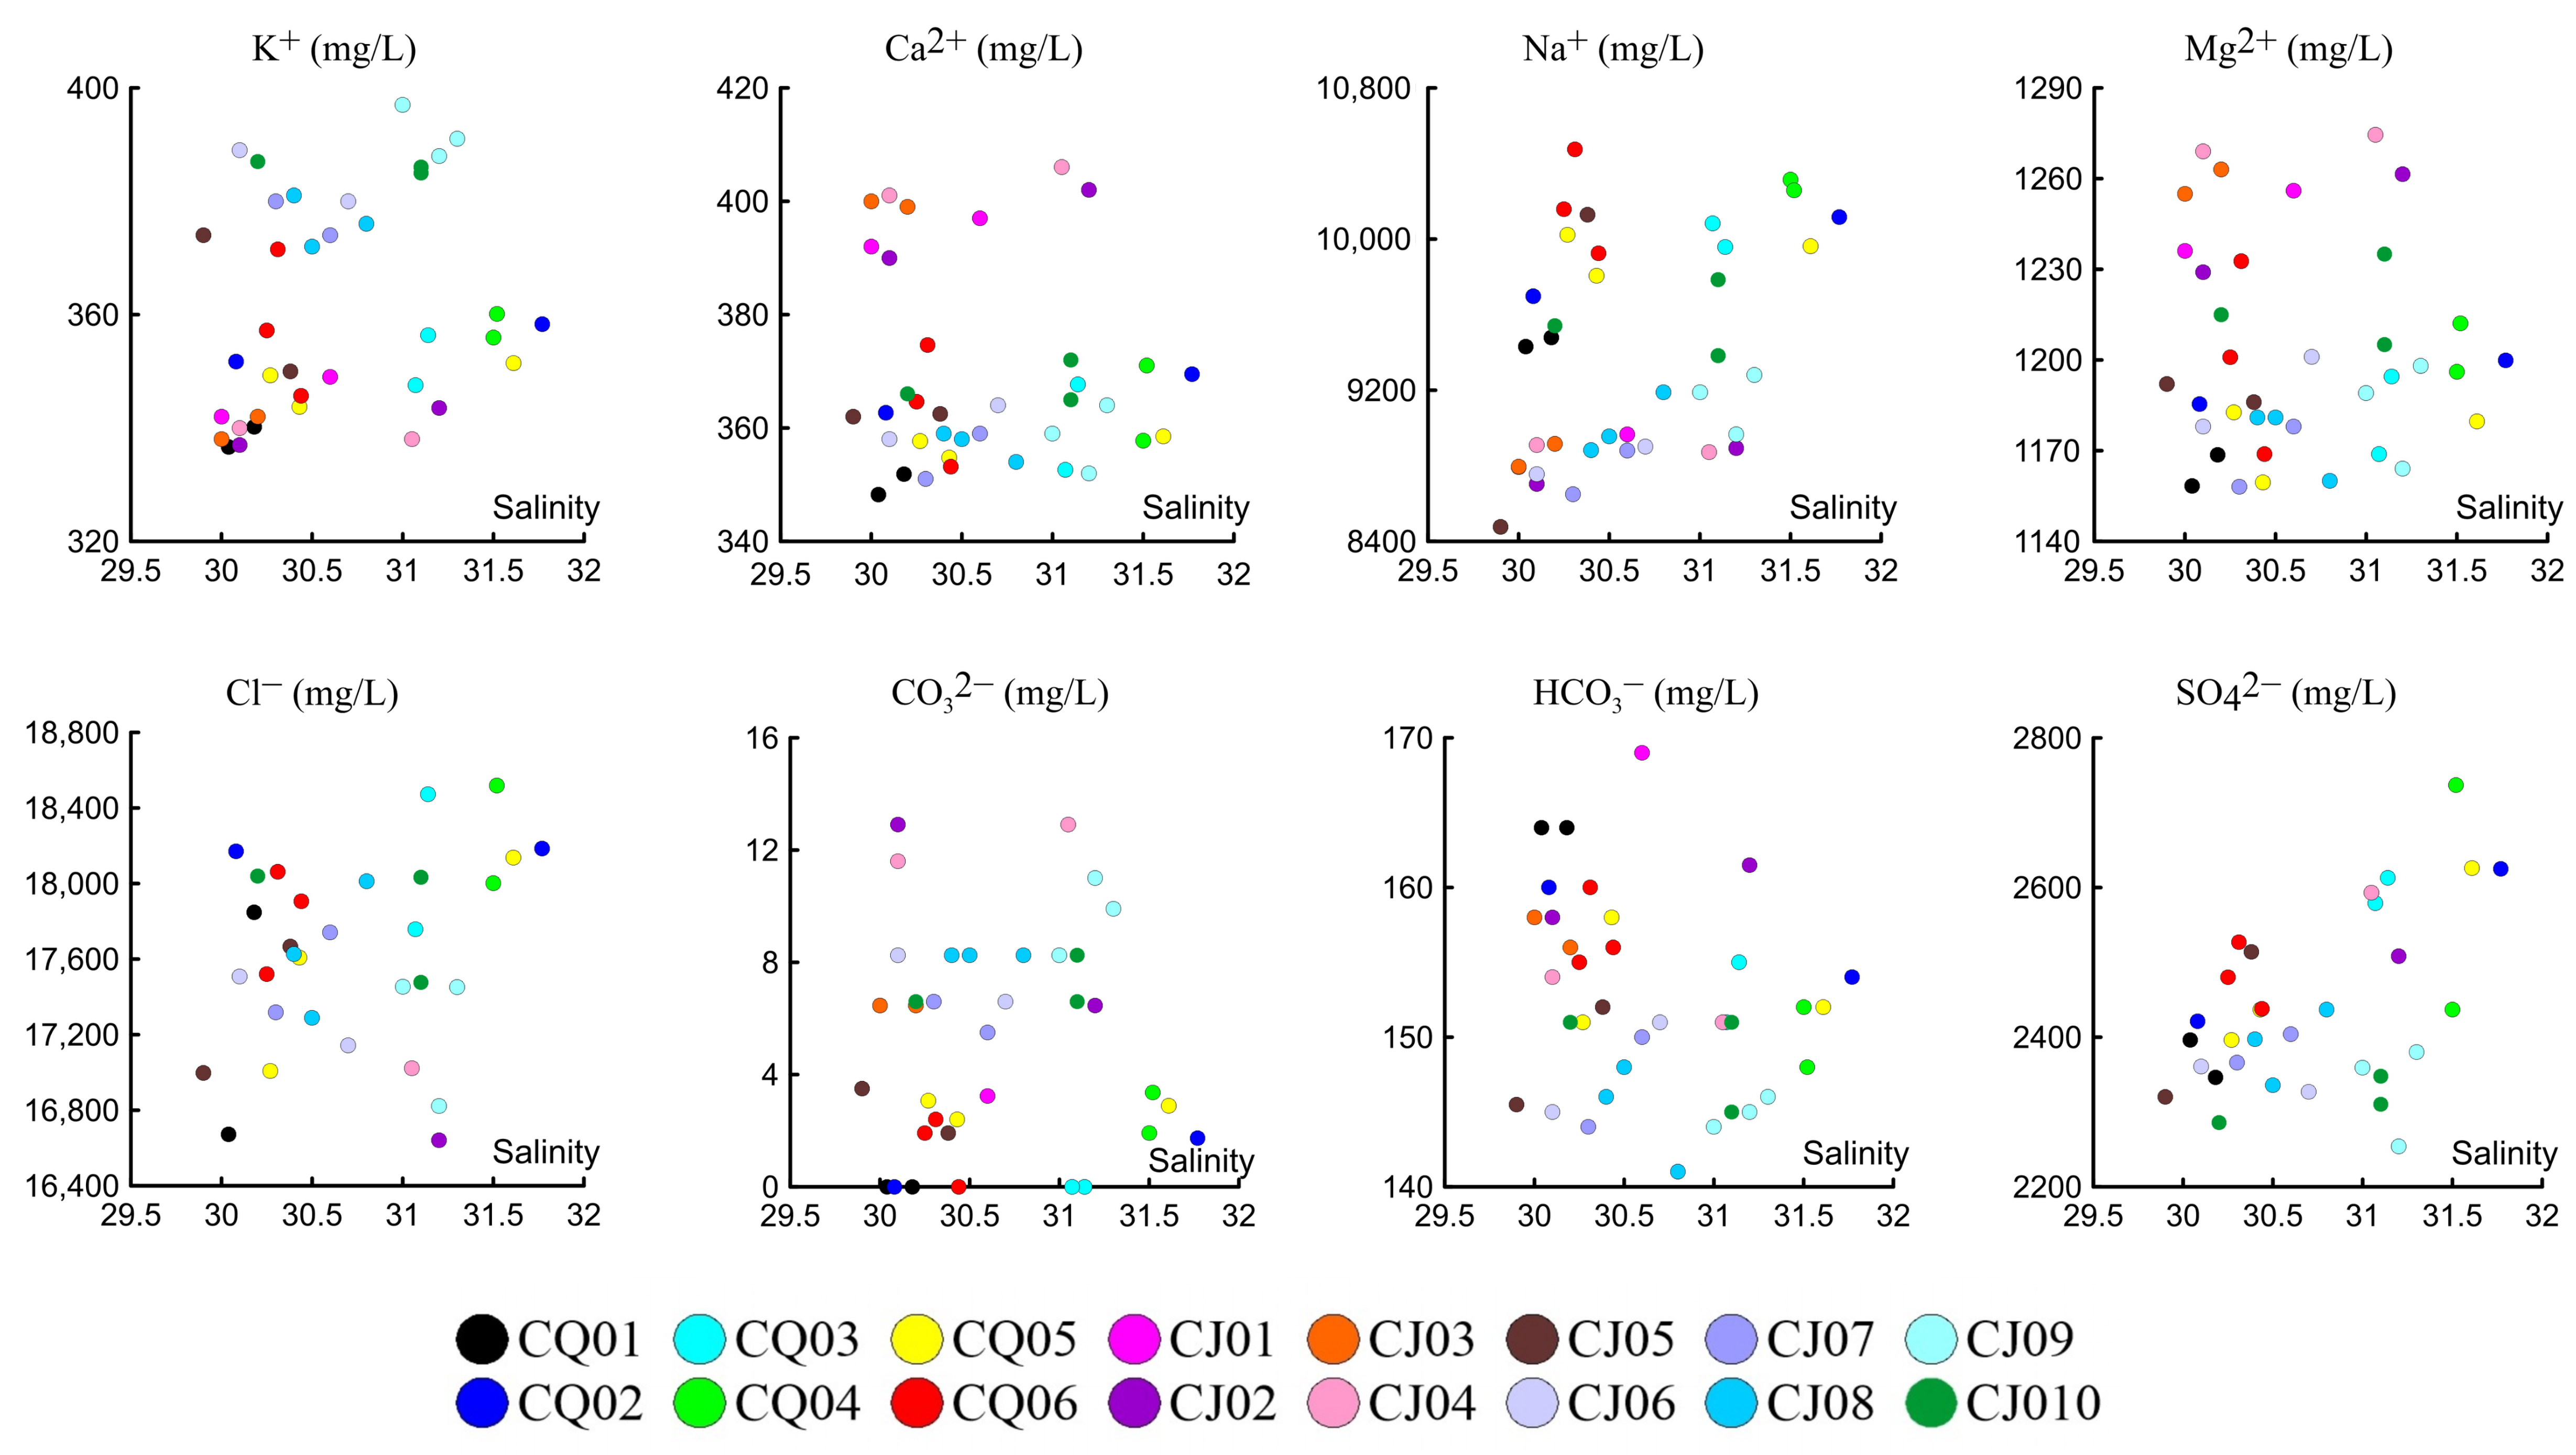
The concentration ranges of major elements in surface, middle, and bottom water samples collected from 16 stations in the study area are as follows: Cl ranges from 16,442 to 18,518 mg/L, Na+ from 8475 to 10,474 mg/L, SO42− from 2254 to 2737 mg/L, Mg2+ from 994 to 1275 mg/L, Ca2+ from 298 to 406 mg/L, and K+ from 284 to 452 mg/L. These concentrations are generally slightly lower than those found in standard seawater, which aligns with the relatively low salinity levels (29.9–31.8‰) observed in the area. This suggests a dilution effect due to freshwater inputs from rivers or groundwater.
The hydrochemical characteristics of the Dingzi Bay area are predominantly influenced by the mixing processes between seawater and freshwater. As illustrated in Figure 4, the major conservative ions (Cl, Na+, Mg2+, SO42−, K+) demonstrate significant positive correlations with salinity, indicative of conservative mixing behavior [19]. Conversely, the concentrations of Ca2+ and carbonate components (CO32−, HCO3) are relatively elevated at the CJ series stations, which may reflect the impact of increased biological productivity and/or carbonate weathering inputs [20]. Vertically, water mixing is generally uniform; however, there is evidence of freshwater input in the bottom waters at certain individual stations.

4.3. Dissolved Gas Composition and Vertical Variation

The complete dataset of dissolved gas concentrations for all sampling stations and layers is provided in Table A1 (Appendix A).

4.3.1. Overall Characteristics of Gas Composition

The primary constituents of dissolved gases in the Dingzi Bay region include nitrogen (N2), oxygen (O2), argon (Ar), and carbon dioxide (CO2). The concentration of N2 varies between 44.28% and 79.42%, O2 between 12.16% and 29.33%, Ar between 0% and 1.18%, and CO2 between 0.22% and 43.22%. These relative proportions are generally consistent with atmospheric composition [21]. The combined percentage of N2 and O2 constitutes between 56.78% and 99.78% of the total dissolved gases. The N2/O2 ratio ranges from 2.41 to 3.98, exhibiting some variation from the atmospheric ratio of approximately 3.7, suggesting that biogeochemical processes may induce deviations in gas ratios. Nevertheless, the dissolved gases in seawater predominantly originate from atmospheric equilibrium processes, such as adequate air–sea exchange, and the composition of dissolved gases in the water body is primarily governed by atmospheric partial pressure [22,23,24].
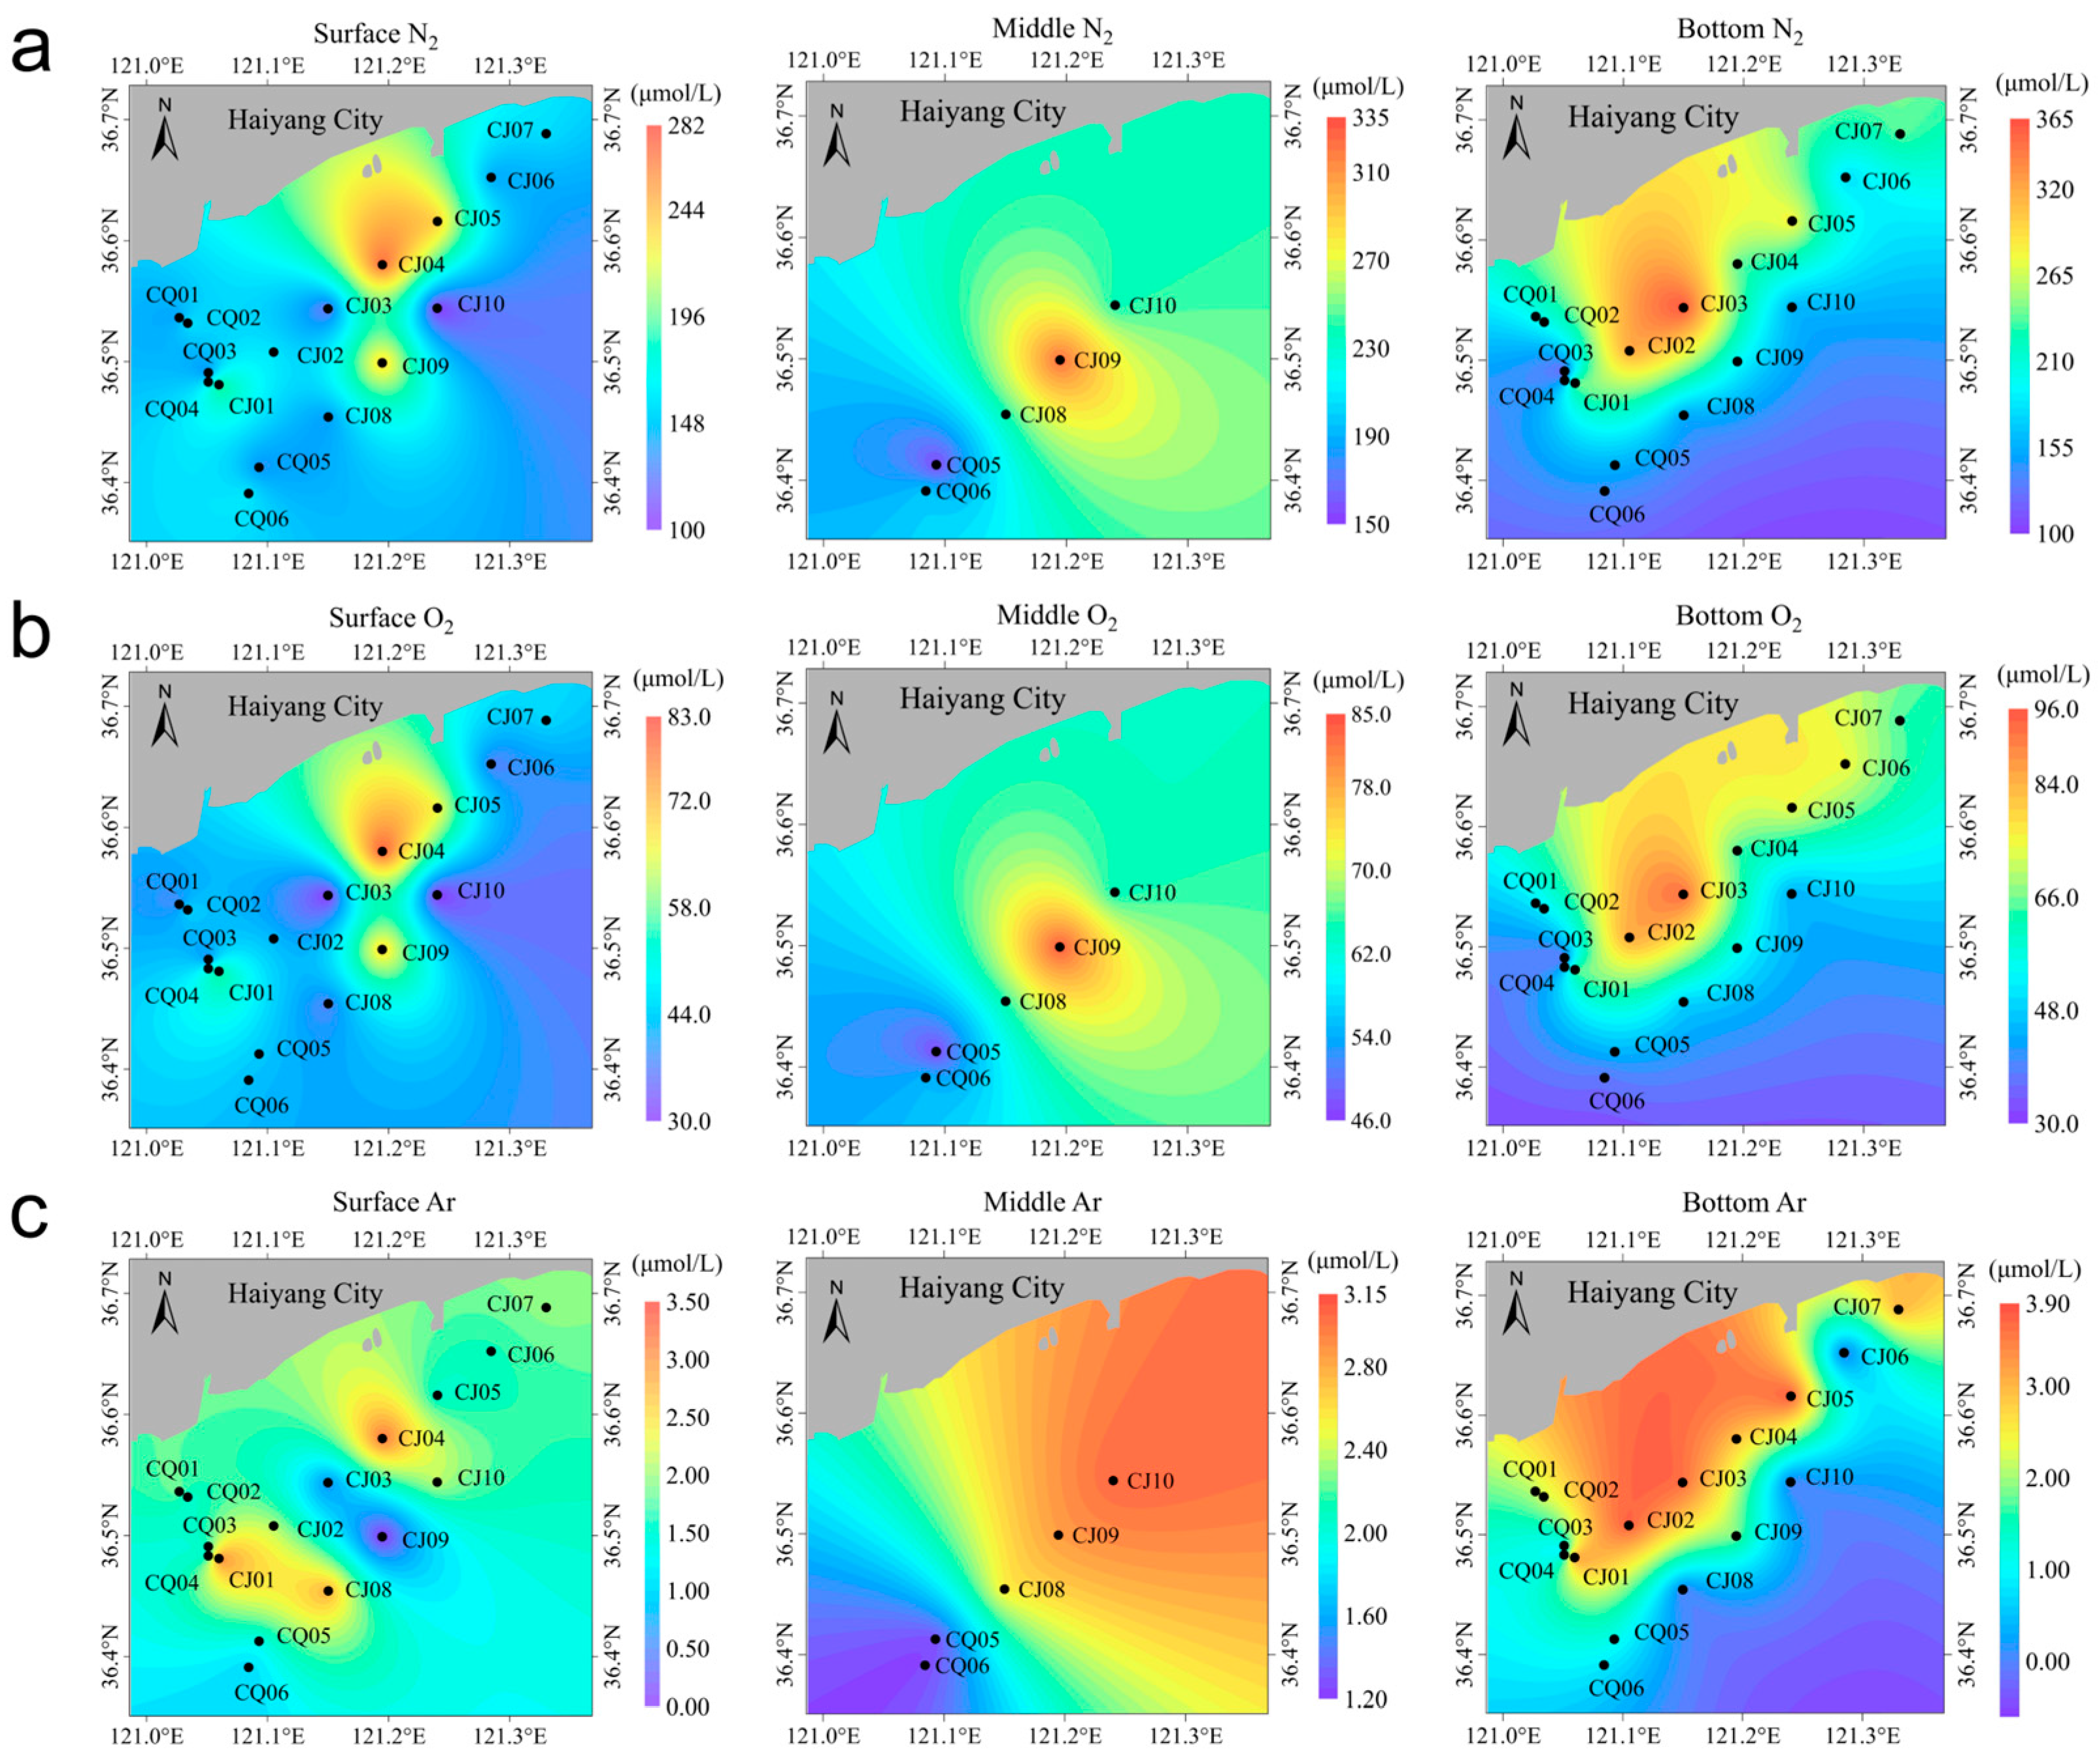
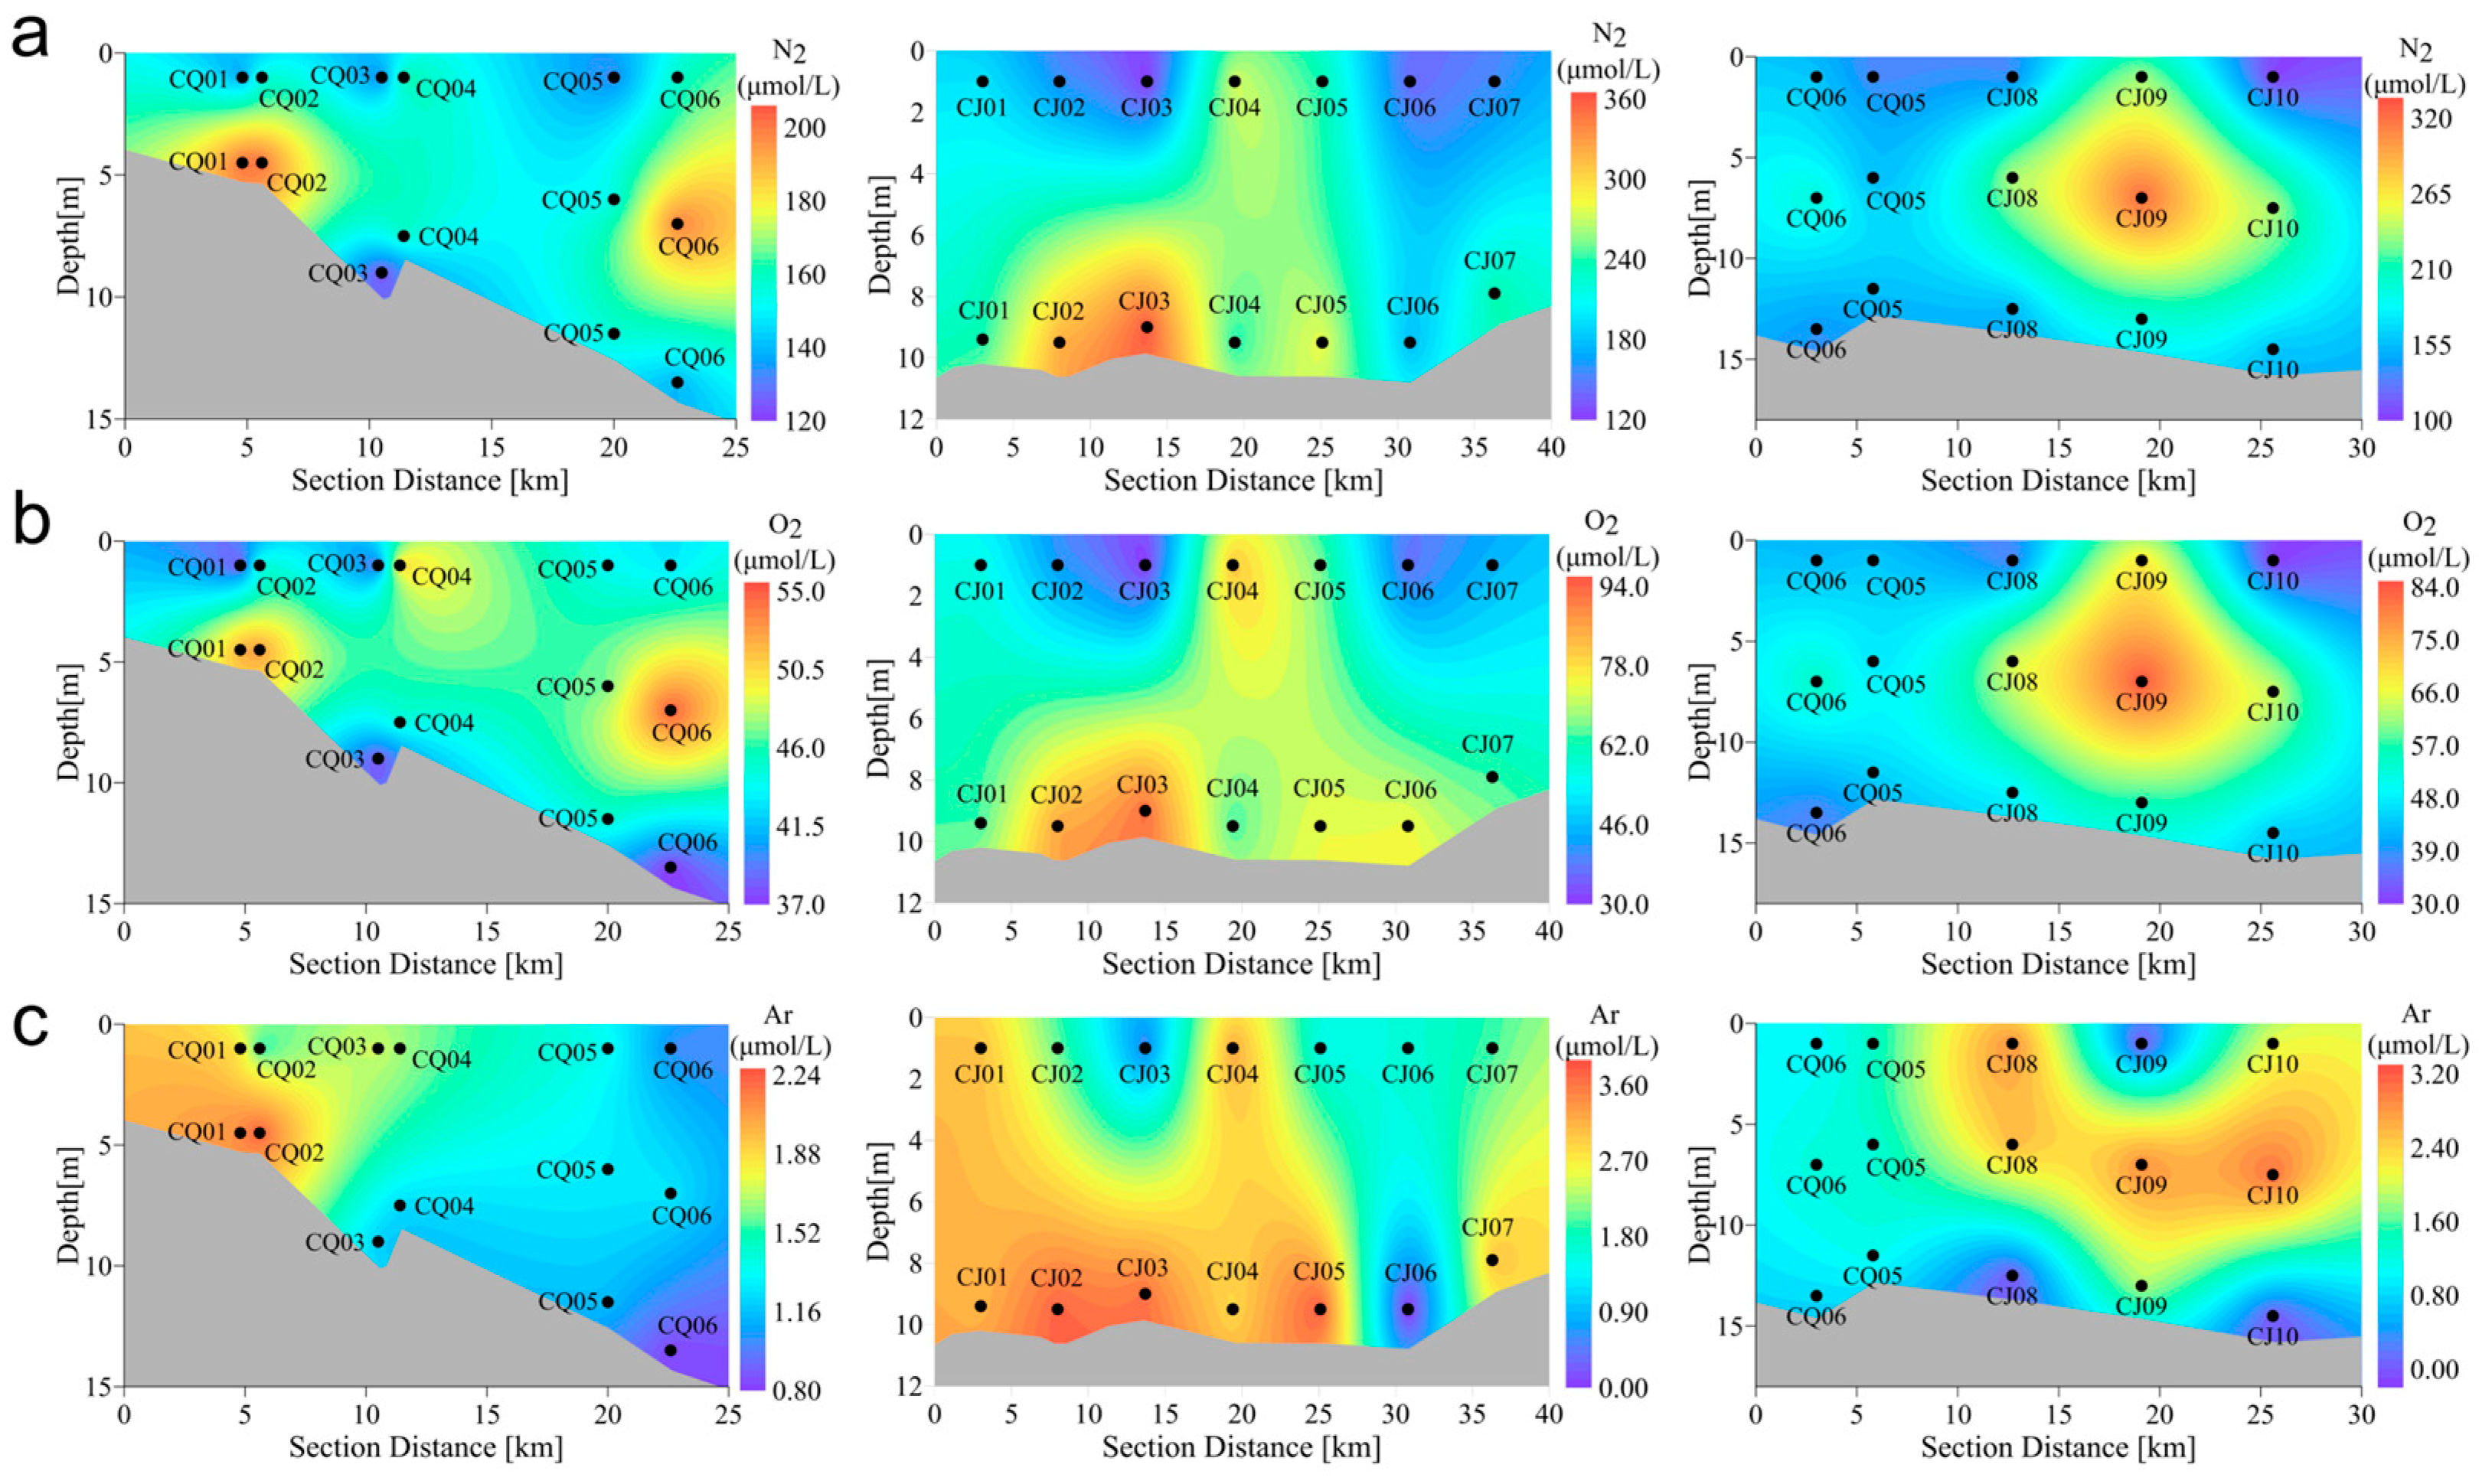
The concentrations of N2 in surface, middle, and bottom seawater across various stations in the Dingzi Bay area range from 104 to 359 µmol/L (Figure 5a), O2 from 30.3 to 92.5 µmol/L (Figure 5b), and Ar from 0 to 3.77 µmol/L (Figure 5c), with a general trend of higher concentrations nearshore and lower concentrations offshore. As illustrated in Figure 6, at shallow water stations with depths less than 10 m, the concentrations of the three gases are generally lower in the surface layer compared to the bottom layer. This observation may be attributed to nitrogen desaturation resulting from intense air–sea exchange in the surface layer, as well as processes such as organic matter degradation or sediment release in the bottom layer [25,26,27]. Conversely, at stations with water depths exceeding 10 m, the concentration profile exhibits enrichment in the middle layer, with relatively lower concentrations in both the surface and bottom layers. This pattern likely reflects the influence of physical stratification and water mass structure [28,29].
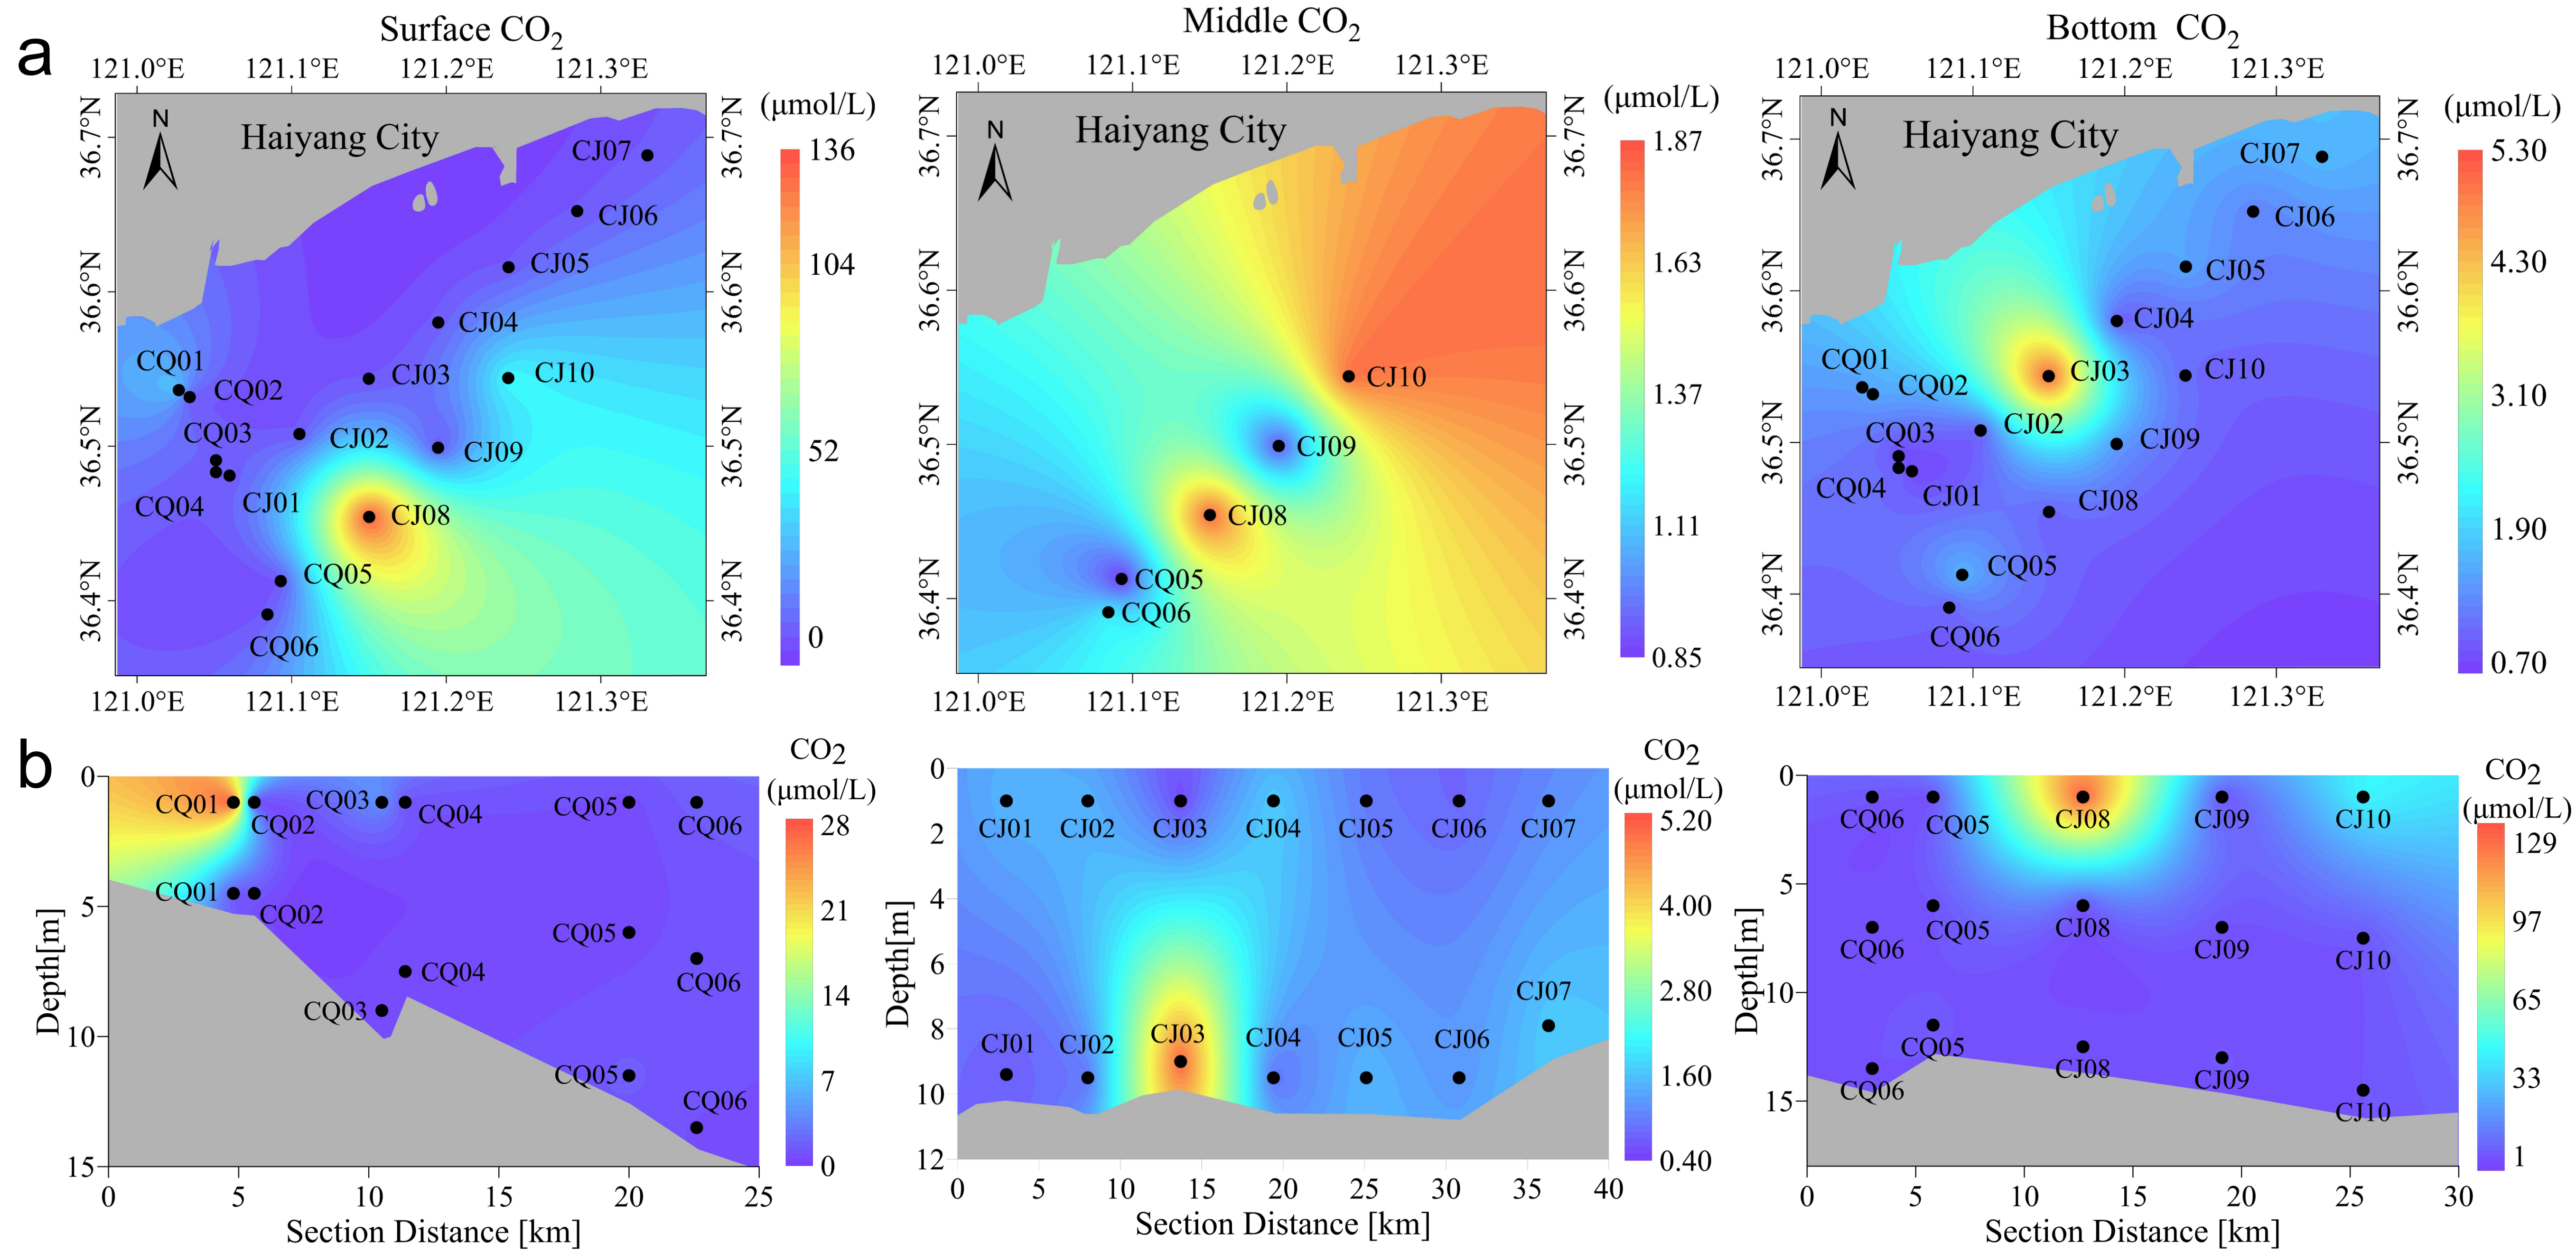
As depicted in Figure 7, CO2 concentrations range from 0.55 to 132 μmol/L, displaying an inverse correlation with nitrogen concentrations [30]. The locally observed anomalously high values, such as CO2 accounting for up to 43.22% in surface seawater at station CJ08, may indicate intense local biogeochemical processes. This particular station is situated in an oyster farming area, where biological respiration is significant [31]; additionally, early diagenetic processes may contribute to substantial CO2 accumulation [26].

4.3.2. Horizontal Distribution of Major Gases

As illustrated in Figure 5, the concentrations of N2, O2, and Ar generally demonstrate a pattern of being elevated nearshore and diminished offshore. For instance, surface data indicate that at the nearshore station CQ04, the concentrations of N2, O2, and Ar are 162 μmol/L, 50.4 μmol/L, and 1.65 μmol/L, respectively. In contrast, at the offshore station CJ10, these concentrations decrease to 104 μmol/L, 30.3 μmol/L, and 2.09 μmol/L, respectively, with Ar showing a slight increase, potentially due to local factors. This distribution pattern is predominantly governed by physical processes: nearshore regions are affected by terrestrial freshwater input, leading to reduced salinity and relatively higher gas solubility. Additionally, slower water renewal and ample air–sea exchange in these areas promote gas accumulation. Conversely, in offshore regions, enhanced mixing and dilution with outer sea water result in decreased concentrations. While the distribution of O2 is partially influenced by biological activity, its spatial variation trend remains highly consistent with that of N2 and Ar under conditions of strong physical mixing. This suggests that physical mixing is the primary factor governing the distribution of dissolved gases in this marine area.

4.3.3. Distribution Characteristics of Alkane Gases

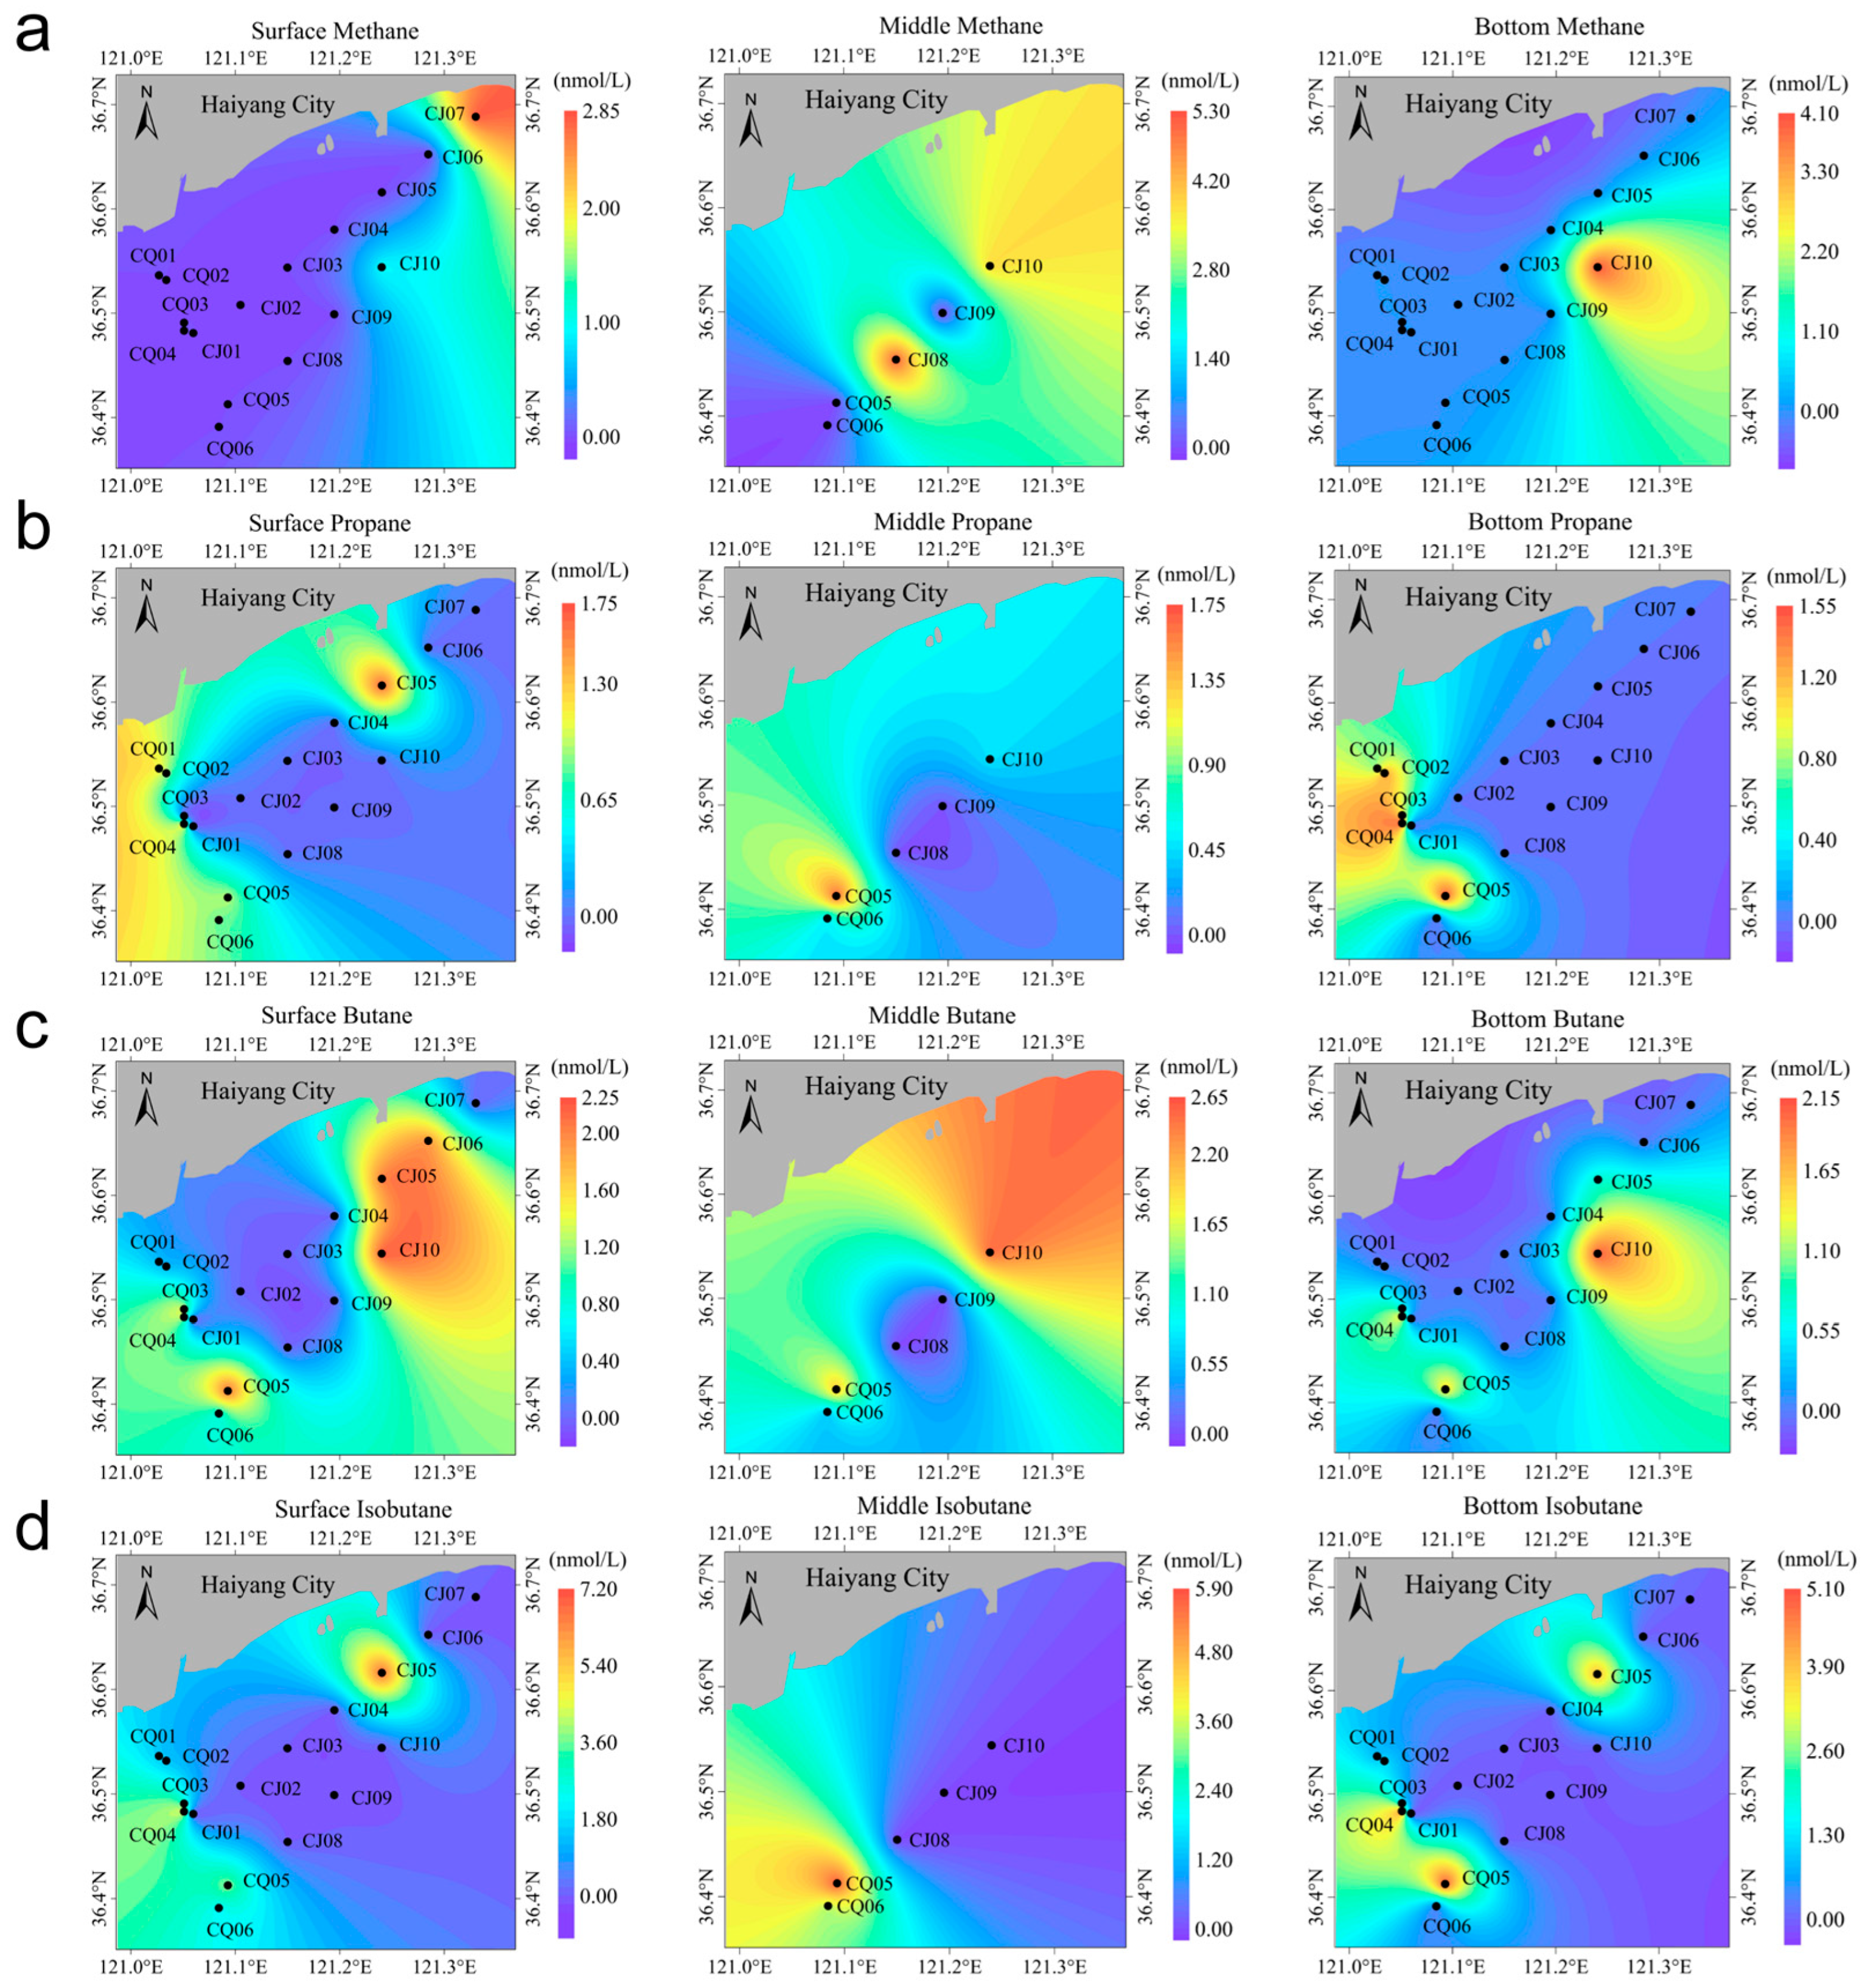
Alkane gases, including methane, ethane, propane, and butane, were identified in only a subset of samples, predominantly at trace concentrations (nmol/L). Their distribution is not uniform across all stations but is instead concentrated at specific locations, such as CQ04, CQ05, and CJ10, as illustrated in Figure 8. This pattern suggests that the sources of these gases are localized point sources or diffuse sources, rather than a consistent background input.
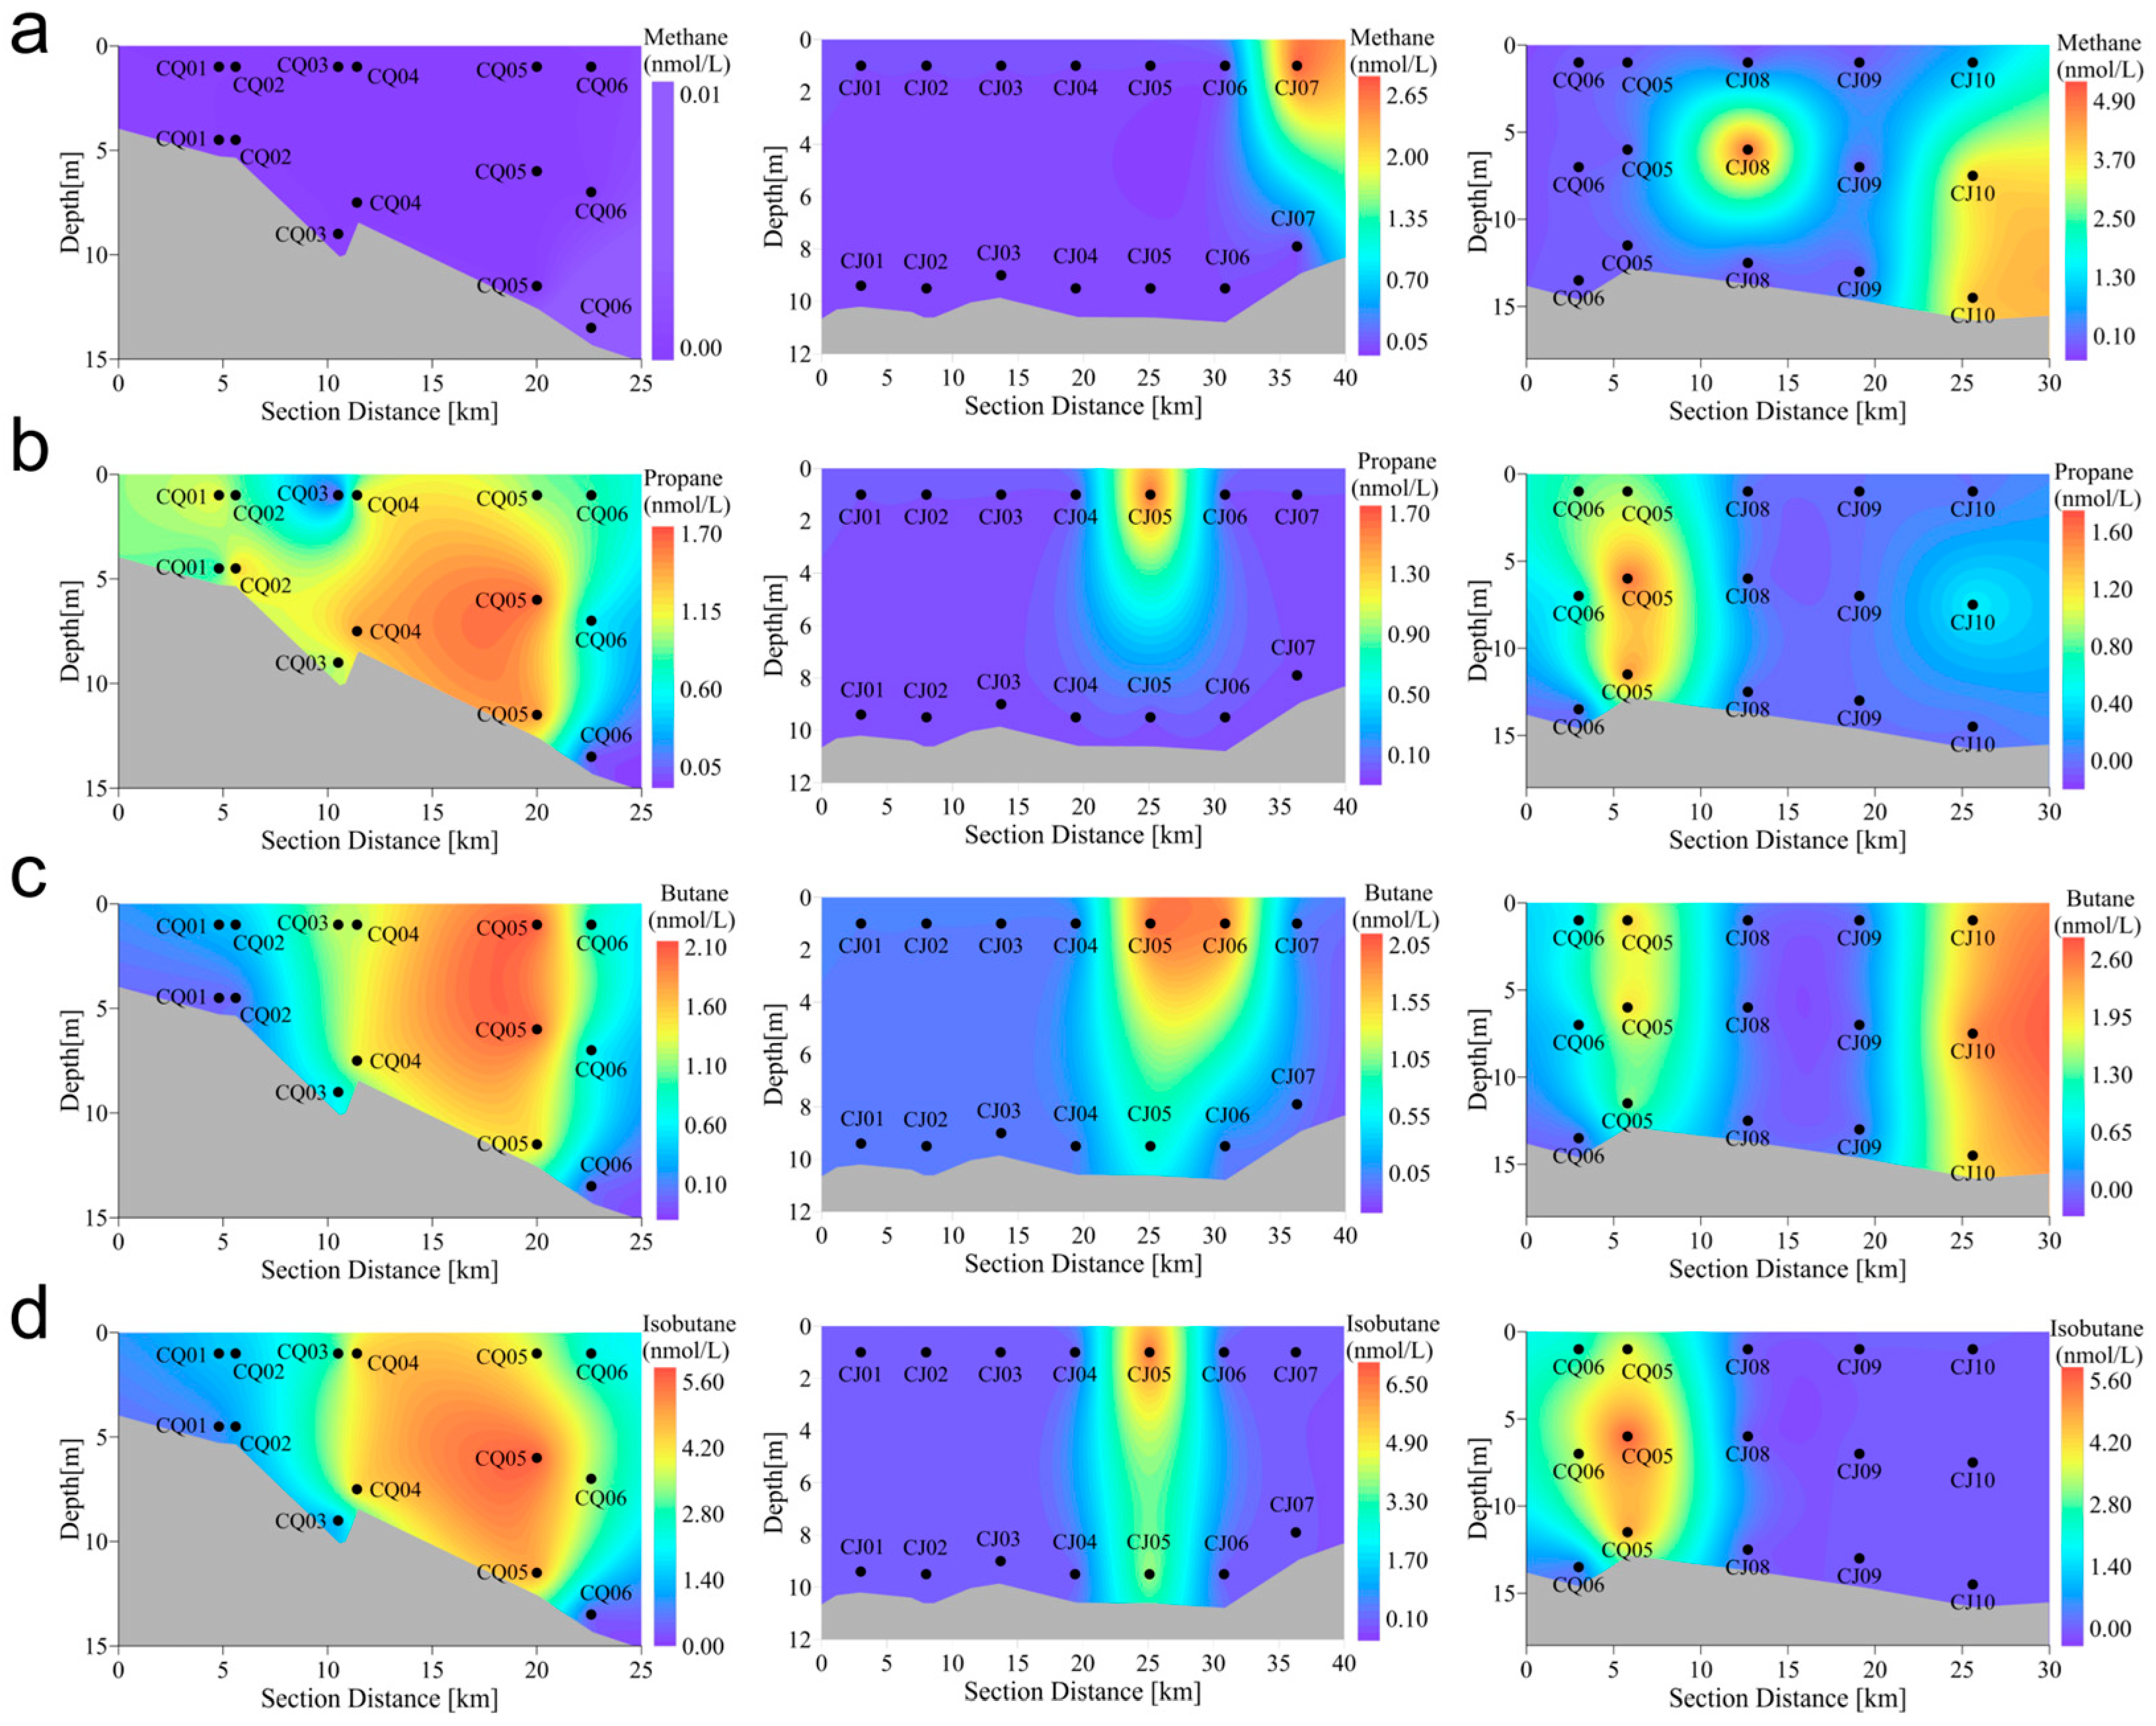
As depicted in Figure 9, stations CQ01~CQ06, situated in the southwestern region of the survey area, exhibit a general abundance of wet gases, such as propane, butane, and isobutane, with relatively elevated concentrations across all water layers, while methane levels are nearly negligible. This observation may imply a continuous influx of oil and gas-like substances in this region or the influence of thermogenic gas generated during the early diagenesis of organic matter. Conversely, wet gases at the northeastern stations, CJ01~CJ10, are detected only at select locations, such as CJ05 and CJ10, whereas methane is present at CJ07, CJ08, and CJ10. Stations CJ08 and CJ10 concurrently display notable CO2 anomalies, suggesting potential influence from submarine cold seeps, shallow gas leakage, or release from sediments rich in organic matter, thereby indicating active biogeochemical processes.

5. Discussion

5.1. Gas Sources: Influence of Atmospheric Input and Biological Activity

Due to the presence of undetected trace gases or analytical uncertainty, the sum of gas percentages may not always equal 100%. The compositional ratios of N2, O2, and Ar in the seawater of the study area are close to those in the atmosphere, confirming that the dissolved gases in the samples primarily originate from atmospheric dissolution rather than sample contamination. If atmospheric contamination had occurred during sampling, the N2/O2 ratio should be strictly equal to 3.7, and the concentrations would be abnormally high. In this study, the N2/O2 ratio ranges from 2.41 to 3.98, which is consistent with typical values in surface seawater (usually saturated or slightly undersaturated) [32,33,34,35]. Among these gases, N2 and Ar, being inert, have distributions primarily influenced by physical processes such as changes in temperature and salinity, as well as water mixing [22]. In contrast, fluctuations in O2 concentrations (30.3~92.5 μmol/L) reflect the net effects of biological production and respiration [35].
Dingzi Bay, characterized as a shallow water area with an average depth of 3.2 m, exhibits complex spatial heterogeneity in the distribution of N2, O2, and Ar. At shallow water stations (e.g., CQ01~CQ04), the concentrations of gases in the bottom layer are generally higher than those in the surface layer. This phenomenon is likely attributable to the retention of bottom water and the decomposition of organic matter within the sediments [36,37]. In contrast, at stations with water depths exceeding 10 m (e.g., CJ08~CJ10), enrichment occurs predominantly in the middle layer. This is primarily influenced by physical stratification induced by the summer thermocline and halocline, as well as the structure of water masses [38,39].
The spatial distribution of CO2 more distinctly highlights regions of active biogeochemical processes. The concentration of CO2 varies significantly, ranging from 0.55 to 132 μmol/L, and exhibits a negative correlation with N2 [40]. Notably, significant peaks in CO2 concentration were observed at the surface of CJ08 (132 μmol/L) and CJ10 (43.1 μmol/L). CJ08 is situated in an oyster farming area, where elevated CO2 levels primarily result from biological respiration and the degradation of organic matter [41]. At CJ10, the presence of methane suggests that the high CO2 levels may be associated with CO2-rich fluids released during early diagenesis in shallow sediments [36]. These “biogeochemical hotspots” are critical factors influencing the distribution of CO2 in nearshore shallow waters.

5.2. Origin of Alkane Gases: Dual Role of Microbial Activity and Potential Thermogenic Fluids

The detection of alkane gases exhibits significant station-specificity, predominantly concentrated in the CQ series (CQ01~CQ06) and certain CJ series stations (CJ05, CJ07, CJ08, CJ10), suggesting the presence of local point sources rather than a regional background input.
(1)
The “Methane-poor, Wet Gases-rich” Anomaly at CQ Series Stations: Potential Evidence of Fractionation or Non-Thermogenic Sources
Stations CQ01~CQ06 in the southwestern part of the survey area are characterized by the presence of propane and butane with minimal or undetectable methane. While this phenomenon may indicate a thermogenic fluid signature, and the specific causes can be attributed to the following two aspects:
(i)
Adsorption-chromatographic fractionation in low-rate seepage: During migration through fine-grained sediments, natural gas undergoes chromatographic fractionation due to differential adsorption. Methane, being small, weakly polar, and poorly adsorptive, preferentially escapes into the water column and atmosphere. In contrast, wet gases such as ethane and propane are strongly adsorbed by clay minerals and organic matter, and thus are selectively retained in sediment pores, leading to relative enrichment of wet gases in the residual fluid. This fractionation is highly sensitive to seepage rate and pathway type: under high-rate, open-channel conditions, methane may become relatively enriched in seawater; under low-rate, fine-grained conditions, chromatographic separation is pronounced, resulting in methane loss and wet-gas retention [42,43].
In our study area, shallow seismic profiles (Figure A1) reveal vertical fluid migra-tion pathways, buried paleochannels, and shallow gas reservoirs. Wet-gas anomalies are spatially confined to stations CQ01–CQ06, showing a point-source distribution consistent with a low-rate, chromatographic-type seepage regime.
(ii)
Anthropogenic input: Given the proximity of the study area to the coast and potential shipping activities, the introduction of liquefied petroleum gas (LPG, primarily composed of propane and butane) or other industrial hydrocarbons cannot be ruled out. The compositional pattern of CQ series stations bears a resemblance to LPG, and this potential source should be investigated in future studies with additional geochemical tracers such as stable isotopes [44].
(2)
Methane Distribution Characteristics and Microbial/Mixed Origin at CJ Series Stations
Methane was primarily detected at stations CJ07, CJ08, and CJ10, with a peak concentration of 5.05 nmol/L. Its spatial distribution frequently aligned with CO2 anomalies or the presence of wet gases. At station CJ07, methane was exclusively found in the surface layer without accompanying wet gases, suggesting typical shallow microbial gas production resulting from the metabolism of sedimentary organic matter by methanogenic bacteria [45]. At station CJ08, a methane concentration of 5.05 nmol/L was identified in the intermediate layer, which is consistent with aquaculture activities and elevated CO2 levels, further corroborating its biogenic origin [46]. Stations CJ05 and CJ10 demonstrated characteristics indicative of mixed sources. At CJ05, high concentrations of wet gases, such as isobutane at 6.67 nmol/L, were simultaneously detected in the surface layer, resembling features observed at stations in the CQ series and potentially influenced by thermogenic fluids. At CJ10, the vertical variations in alkane composition across distinct stratigraphic layers indicate a mixing process involving deep thermogenic gas and shallow microbial gas. This process is likely influenced by a stratified supply mechanism related to fluid migration pathways [47].

5.3. Implications for Potential Oil/Gas or Hydrate Resource Exploration

5.3.1. Indication of the Presence of Deep Effective Source Rocks

The alkane anomalies characterized by wet gases (C2+) commonly detected at the CQ series and some CJ stations are likely attributable to microbial activity [48], but the most plausible explanation is the vertical introduction of deep thermogenic fluids [49]. This finding not only corroborates the presence of mature source rocks in the deeper strata of the study area but also offers direct geochemical evidence of oil and gas occurrences in this region.

5.3.2. Indication of the Development of Vertical Fluid Migration Pathways

The concentration of alkane anomalies at specific stations, such as CQ01~CQ06, CJ05, and CJ10, rather than a uniform distribution across the entire marine area, suggests that deep fluids predominantly migrate vertically along preferential pathways, including faults, fractures, or unconformities [50,51]. The presence of buried paleo-channels and regional fault systems in the study area likely provides the physical framework for a “chimney effect” facilitating fluid release [52]. High-resolution seismic profiles of shallow gas and fluid seepage activities in the study area clearly illustrate a fluid activity system characterized by “deep gas source-vertical migration pathways-shallow accumulation-seabed pockmark leakage”. Consequently, alkane anomalies in seawater can serve as effective indicators for identifying submarine fluid seepage windows, offering critical evidence for pinpointing the exit points of oil and gas migration pathways.

6. Conclusions

Utilizing a self-developed shallow-sea in situ fidelity sampling device, this study successfully collected high-fidelity seawater samples from the Dingzi Bay area, South Yellow Sea. The research systematically analyzed the distribution characteristics of dissolved gases and major elements, leading to the following primary conclusions:
(1)
Achieved high-fidelity sampling of shallow-sea dissolved gases: By employing in situ fidelity sampling technology—achieving a fidelity rate close to 100%—for the first time in the Dingzi Bay area, the research effectively mitigated the gas loss issues associated with pressure changes in traditional sampling methods. This advancement provides crucial technical support for acquiring reliable data on seawater dissolved gases in complex nearshore environments.
(2)
Revealed the distribution characteristics and controlling factors of permanent gases: The distribution of N2, O2, and Ar is predominantly governed by physical processes such as atmospheric dissolution and water mixing. However, their spatial heterogeneity further underscores the impact of summer stratification and water mass structure. In contrast, CO2 concentrations display significant spatial variability, ranging from 0.55 to 132 μmol/L. The unusually high values observed in aquaculture areas, such as at station CJ08, suggest that the distribution of these values is largely influenced by local “biogeochemical hotspot” processes, including intense biological respiration and the degradation of organic matter.
(3)
Discovered two types of alkane anomalies for the first time in the Dingzi Bay area:
The CQ Series “Methane-poor, Wet Gases-rich” Anomaly: At these stations, the gas composition is predominantly composed of wet gases with methane content being extremely low or even undetectable. This compositional characteristic implies that the gas source is likely deep thermogenic fluids, rather than in situ microbial activity.
The CJ Series Methane and Mixed Anomalies: These stations are primarily characterized by the presence of methane, sometimes accompanied by wet gases. Genetically, these anomalies are mainly derived from microbial activity or represent a mixture of deep thermogenic fluids and shallow biogenic gas.
(4)
Proposed the indicative significance of alkane anomalies for regional resource exploration: The thermogenic alkane anomalies identified at the CQ series stations offer robust geochemical evidence for the presence of deep, effective source rocks and active vertical fluid migration pathways within the study area. Detailed component analysis of dissolved alkanes in seawater not only uncovers evidence of deep fluid activity but also establishes a novel, efficient, and cost-effective geochemical indicator for identifying migration pathway exits and evaluating the potential of regional oil and gas resources. The implementation of this method enhances the technical capabilities and scientific significance of dissolved gas surveys in the context of marine oil and gas exploration.

Author Contributions

J.Z.: Investigation, Conceptualization, Funding acquisition, Writing—review and editing; X.Y.: Resources, Formal analysis, Project administration; K.Y.: Writing—original draft, Writing—review and editing; Z.H.: Visualization, Data curation; K.Z.: Data curation; F.W.: Investigation; J.K.: Investigation; L.W.: Investigation; H.T.: Investigation; Y.Z.: Investigation. All authors have read and agreed to the published version of the manuscript.

Funding

This research was funded by the National Natural Science Foundation of China (42176078); the China Geological Survey (DD202603102402); and the Laoshan Laboratory (LSKJ202502705).

Data Availability Statement

The raw data supporting the conclusions of this article will be made available by the authors on request.

Acknowledgments

The authors thank the crew and all research members who participated in the cruises of the research vessel “Ke Hang” for their contributions to the data collection. During the preparation of this manuscript, the authors used DeepSeek-V4-Pro for the purposes of language polishing. The authors have reviewed and edited the output and take full responsibility for the content of this publication.

Conflicts of Interest

Kaixin Yu, Zhenfei He and Kuiying Zhang were employed by the company Qingdao Sparta Analysis & Test Co., Ltd. The remaining authors declare that the research was conducted in the absence of any commercial or financial relationships that could be construed as a potential conflict of interest.

Abbreviations

The following abbreviations are used in this manuscript:
CTDConductivity-Temperature-Depth
FIDFlame Ionization Detector
TCDThermal Conductivity Detector
RSDRelative Standard Deviation
ICP-OESInductively Coupled Plasma Optical Emission Spectrometer
GHSZGas Hydrate Stability Zone

Appendix A

Table A1. The dissolved gas concentrations for all stations and layers (ND: not detected).
StationDepth
(m)
Volume
(mL)
N2
(μmol/L)
O2
(μmol/L)
Ar
(μmol/L)
CO2
(μmol/L)
CH4
(nmol/L)
C2H6
(nmol/L)
C3H8
(nmol/L)
C4H10
(nmol/L)
Iso-C4H10
(nmol/L)
C5H12
(nmol/L)
C2H4
(nmol/L)
C3H6
(nmol/L)
H2
(nmol/L)
CO
(nmol/L)
H2S
(nmol/L)
He
(nmol/L)
Ne
(nmol/L)
Kr
(nmol/L)
Xe
(nmol/L)
CQ011.00.4013838.11.8627.1NDND1.130.371.52NDNDNDNDNDNDNDNDNDND
CQ014.50.5020051.82.101.43NDND0.78ND0.85NDNDNDNDNDNDNDNDNDND
CQ021.00.4015744.71.531.10NDND0.890.361.45NDNDNDNDNDNDNDNDNDND
CQ024.50.5020052.52.221.53NDND1.26ND1.21NDNDNDNDNDNDNDNDNDND
CQ031.00.3513439.31.714.42NDNDND1.272.89NDNDNDNDNDNDNDNDNDND
CQ039.00.3212438.01.200.758NDND1.000.641.38NDNDNDNDNDNDNDNDNDND
CQ041.00.4015744.81.791.08NDND1.391.023.82NDNDNDNDNDNDNDNDNDND
CQ041.00.4216250.41.651.28NDND1.111.204.37NDNDNDNDNDNDNDNDNDND
CQ047.50.4015844.51.231.02NDND1.441.384.33NDNDNDNDNDNDNDNDNDND
CQ051.00.3513343.91.360.843NDND0.952.073.79NDNDNDNDNDNDNDNDNDND
CQ056.00.4015547.01.280.851NDND1.622.005.71NDNDNDNDNDNDNDNDNDND
CQ0511.50.4015744.91.141.64NDND1.481.464.90NDNDNDNDNDNDNDNDNDND
CQ061.00.4015942.91.031.73NDND0.830.802.31NDNDNDNDNDNDNDNDNDND
CQ067.00.5019854.81.261.18NDND0.520.633.44NDNDNDNDNDNDNDNDNDND
CQ0613.50.3514037.20.830.943NDNDNDND0.34NDNDNDNDNDNDNDNDNDND
CJ011.00.5019556.53.031.48NDNDNDNDNDNDNDNDNDNDNDNDNDNDND
CJ019.40.6023964.23.140.704NDNDNDNDNDNDNDNDNDNDNDNDNDNDND
CJ021.00.4015942.12.071.46NDNDNDNDNDNDNDNDNDNDNDNDNDNDND
CJ029.50.8031985.43.740.963NDNDNDNDNDNDNDNDNDNDNDNDNDNDND
CJ031.00.3012230.50.590.553NDNDNDNDNDNDNDNDNDNDNDNDNDNDND
CJ039.00.9035992.53.625.07NDNDNDNDNDNDNDNDNDNDNDNDNDNDND
CJ041.00.6023864.62.731.98NDNDNDNDNDNDNDNDNDNDNDNDNDNDND
CJ041.00.7027281.23.211.68NDNDNDNDNDNDNDNDNDNDNDNDNDNDND
CJ049.50.6023964.02.880.906NDNDNDNDNDNDNDNDNDNDNDNDNDNDND
CJ049.50.6023964.02.870.937NDNDNDNDNDNDNDNDNDNDNDNDNDNDND
CJ051.00.6023866.11.530.973NDND1.632.016.67NDNDNDNDNDNDNDNDNDND
CJ059.50.7027974.23.511.58NDNDND1.063.30NDNDNDNDNDNDNDNDNDND
CJ059.50.7027973.73.771.51NDNDND0.753.96NDNDNDNDNDNDNDNDNDND
CJ061.00.3514036.91.670.779NDNDND1.91NDNDNDNDNDNDNDNDNDNDND
CJ069.50.5017974.5ND1.22NDNDNDNDNDNDNDNDNDNDNDNDNDNDND
CJ071.00.4015645.21.971.132.76NDNDNDNDNDNDNDNDNDNDNDNDNDND
CJ077.90.6023864.12.991.68NDNDNDNDNDNDNDNDNDNDNDNDNDNDND
CJ081.00.6013637.22.84132NDNDNDNDNDNDNDNDNDNDNDNDNDNDND
CJ086.00.6023865.02.551.825.05NDNDNDNDNDNDNDNDNDNDNDNDNDND
CJ0812.50.4015448.6ND0.965NDNDNDNDNDNDNDNDNDNDNDNDNDNDND
CJ091.00.6023569.0ND1.72NDNDNDNDNDNDNDNDNDNDNDNDNDNDND
CJ097.00.8032283.82.850.906NDNDNDNDNDNDNDNDNDNDNDNDNDNDND
CJ0913.00.5019656.11.851.43NDNDNDNDNDNDNDNDNDNDNDNDNDNDND
CJ101.00.3510430.32.0943.10.925NDND2.16NDNDNDNDNDNDNDNDNDNDND
CJ107.50.6023864.23.051.803.80ND0.462.48NDNDNDNDNDNDNDNDNDNDND
CJ1014.50.4015944.5ND1.033.98NDND2.06NDNDNDNDNDNDNDNDNDNDND
Figure A1. High-resolution seismic profiles of shallow gas and fluid seepage activities in the study area. (a) Profile location is shown as Line 1 in Figure 1, with the survey line oriented northwest (NW)–southeast (SE); (b) Profile location is shown as Line 2 in Figure 1, with the survey line oriented southwest (SW)–northeast (NE). In this figure, T0 (green lines) denotes the seafloor; T1 (blue lines) denotes the base of the Holocene (MIS1); T2 (purple lines) denotes the base of the Last Glacial Maximum (MIS2); and T3 (red lines) denotes the top of the basement.
Jmse 14 01167 g0a1

References

  1. Wang, X.J.; Zhang, X.L.; Wang, Z.Y.; Luo, M.H.; Li, H.L.; Zheng, C.M.; Geng, X.L.; Liu, C.Q. Review of seawater-groundwater interactions in the coastal earth critical zone of the Bohai Sea. Earth Crit. Zone 2025, 2, 100041. [Google Scholar] [CrossRef] [Scilit]
  2. Fu, P.; Yang, P.; He, J.; Jiang, H.; Wang, L.; Liu, L.; Liu, A.; Ma, Y.; Song, X. Effects of the occurrence of Green tide (Ulva prolifera) on marco and mesozooplankton community structure in the sea area near Dingzi Bay. Mar. Environ. Sci. 2023, 42, 604–611. [Google Scholar] [CrossRef] [Scilit]
  3. Bisander, T.; Prytherch, J.; Brüchert, V. Methane ebullition as the dominant pathway for carbon sea-air exchange in coastal, shallow water habitats of the Baltic Sea. Biogeosciences 2025, 22, 4779–4796. [Google Scholar] [CrossRef] [Scilit]
  4. Wei, S.; Hou, D.J.; Xiong, C. Geochemistry and genesis of marine shallow gas in the Pearl River Mouth Basin (PRMB), South China Sea. Pet. Sci. 2025, 22, 4329–4340. [Google Scholar] [CrossRef] [Scilit]
  5. Sun, B.Y.; Li, Y. Dissolved gases in seawater. In Encyclopedia of China. Marine Science Volume; Encyclopedia of China Publishing House: Beijing, China, 1998. [Google Scholar]
  6. You, K.H. Biodegradation of Ancient Organic Carbon Fuels Seabed Methane Emission at the Arctic Continental Shelves. Glob. Biogeochem. Cycles 2024, 38, e2023GB007999. [Google Scholar] [CrossRef] [Scilit]
  7. Garcia-Robledo, E.; Paulmier, A.; Borisov, S.M.; Revsbech, N.P. Sampling in low oxygen aquatic environments: The deviation from anoxic conditions. Limnol. Oceanogr. Methods 2021, 19, 733–740. [Google Scholar] [CrossRef] [Scilit]
  8. Sackett, W.M. Use of hydrocarbon sniffing in offshore exploration. J. Geochem. Explor. 1977, 7, 243–254. [Google Scholar] [CrossRef] [Scilit]
  9. Li, L. In Situ Quantitative Analysis of Dissolved Gas in Deep-Sea Hydrothermal Vent Fluid Based on Laser Raman Spectroscopy. Ph.D. Thesis, University of Chinese Academy of Sciences, Qingdao, China, 2020. [Google Scholar]
  10. Liu, Z. Development and Application of Mid-Infrared In-Situ System for Carbon Dioxide Detection near Seabed. Ph.D. Thesis, Jilin University, Changchun, China, 2021. [Google Scholar]
  11. Shandong Province Local History and Annals Compilation Committee. Chapter 1 Marine Topography. In Annals of Shandong Province·Annals of Marine; Shandong People’s Publishing House: Jinan, China, 1993. [Google Scholar]
  12. Shandong Province Local History and Annals Compilation Committee. Chapter 2 Marine Sediments. In Annals of Shandong Province·Annals of Marine; Shandong People’s Publishing House: Jinan, China, 1993. [Google Scholar]
  13. Lin, M. The Study on the Characteristics of Geo-Hazard Factors in Qingdao Offshore. Master’s Thesis, Shijiazhuang University of Economics, Shijiazhuang, China, 2014. [Google Scholar]
  14. Burdige, D.J. Preservation of organic matter in marine sediments: Controls, mechanisms, and an imbalance in sediment organic carbon budgets? Chem. Rev. 2007, 107, 467–485. [Google Scholar] [CrossRef] [Scilit]
  15. Martens, C.S.; Klump, J.V. Biogeochemical cycling in an organic-rich coastal marine basin-I. Methane sediment-water exchange processes. Geochim. Cosmochim. Acta 1980, 44, 471–490. [Google Scholar] [CrossRef] [Scilit]
  16. Hovland, M.; Judd, A. Seabed Pockmarks and Seepages: Impact on Geology, Biology and the Marine Environment; Graham & Trotman: London, UK, 1988. [Google Scholar] [CrossRef] [Scilit]
  17. Micallef, A.; Averes, T.; Hoffmann, J.; Crutchley, G.; Mountjoy, J.J.; Person, M.; Cohen, D.; Woelz, S.; Bury, S.J.; Ahaneku, C.V.; et al. Multiple drivers and controls of pockmark formation across the Canterbury Margin, New Zealand. Basin Res. 2022, 34, 1374–1399. [Google Scholar] [CrossRef] [Scilit]
  18. Shandong Province Local History and Annals Compilation Committee. Chapter 5 Tides. In Annals of Shandong Province·Annals of Marine; Shandong People’s Publishing House: Jinan, China, 1993. [Google Scholar]
  19. Riley, J.P.; Chester, R. Chemical Oceanography; Academic Press: Pittsburgh, PA, USA, 1976. [Google Scholar] [CrossRef] [Scilit]
  20. Libes, S. Introduction to Marine Biogeochemistry; Academic Press: Pittsburgh, PA, USA, 2011. [Google Scholar]
  21. Pilson, M.E. An Introduction to the Chemistry of the Sea; Cambridge University Press: Cambridge, UK, 2013. [Google Scholar]
  22. Weiss, R.F. The solubility of nitrogen, oxygen and argon in water and seawater. Deep Sea Res. Oceanogr. Abstr. 1970, 17, 721–735. [Google Scholar] [CrossRef] [Scilit]
  23. Keeling, R.F.; Stephens, B.B.; Najjar, R.G.; Doney, S.C.; Archer, D.; Heimann, M. Seasonal variations in the atmospheric O2/N2 ratio in relation to the kinetics of air-sea gas exchange. Glob. Biogeochem. Cycles 1998, 12, 141–163. [Google Scholar] [CrossRef] [Scilit]
  24. Broecker, W.S.; Peng, T.H. Tracers in the Sea. BioScience 1984, 34, 452. [Google Scholar] [CrossRef] [Scilit]
  25. Wanninkhof, R. Relationship between wind speed and gas exchange over the ocean. J. Geophys. Res. Ocean. 1992, 97, 7373–7382. [Google Scholar] [CrossRef] [Scilit]
  26. Burdige, D.J. Geochemistry of Marine Sediments. Eos Trans. AGU 2007, 88, 507. [Google Scholar] [CrossRef] [Scilit]
  27. Burnett, W.C.; Bokuniewicz, H.; Huettel, M.; Moore, W.S.; Taniguchi, M.M. Groundwater and pore water inputs to the coastal zone. Biogeochemistry 2003, 66, 3–33. [Google Scholar] [CrossRef] [Scilit]
  28. Zhang, W.S.; Zhang, H.Y.; Song, G.S.; Zhao, L.; Wei, H. Physical and biogeochemical processes in controlling the seasonal variation of dissolved oxygen in the Bohai and Yellow Seas. Front. Mar. Sci. 2025, 12, 1600636. [Google Scholar] [CrossRef] [Scilit]
  29. Liu, Y.; Bao, X.W.; Wu, D.X. Analysis of Vertical Structure and Seasonal Variation of the Dissolved Oxygen in the South China Sea. Period. Ocean. Univ. China 2011, 41, 25–32. [Google Scholar] [CrossRef]
  30. Rödenbeck, C.; Le Quéré, C.; Heimann, M.; Keeling, R.F. Interannual variability in oceanic biogeochemical processes inferred by inversion of atmospheric O2/N2 and CO2 data. Tellus B Chem. Phys. Meteorol. 2008, 60, 685–705. [Google Scholar] [CrossRef] [Scilit]
  31. Liang, S.; Li, H.C.; Liang, J.; Liu, H.R.; Wang, X.Y.; Chen, L.M.; Gao, L.; Qi, J.F.; Guo, Y.J. Synergistic effects of bivalve and microalgae co-cultivation on carbon dynamics and water quality. Mar. Environ. Res. 2024, 201, 106672. [Google Scholar] [CrossRef] [Scilit] [PubMed]
  32. Craig, H.; Weiss, R.F. Dissolved gas saturation anomalies and excess helium in the ocean. Earth Planet. Sci. Lett. 1971, 10, 289–296. [Google Scholar] [CrossRef] [Scilit]
  33. Hamme, R.; Emerson, S. The solubility of neon, nitrogen and argon in distilled water and seawater. Deep Sea Res. Part I Oceanogr. Res. Pap. 2004, 51, 1517–1528. [Google Scholar] [CrossRef]
  34. Weiss, R.F. Carbon dioxide in water and seawater: The solubility of a non-ideal gas. Mar. Chem. 1974, 2, 203–215. [Google Scholar] [CrossRef] [Scilit]
  35. Emerson, S.; Hedges, J. Chemical Oceanography and the Marine Carbon Cycle; Cambridge University Press: Cambridge, UK, 2012. [Google Scholar]
  36. Wu, D.D. Early Diagenesis Records and Geochemical Characteristics of Gas Hydrate in the South China Sea. Ph.D. Thesis, Zhejiang University, Hangzhou, China, 2008. [Google Scholar]
  37. Zhou, H.Y.; Yin, X.J.; Yang, Q.H.; Wang, H.; Wu, Z.J.; Bao, S.X. Distribution, source and flux of methane in the western Pearl River Estuary and northern South China Sea. Mar. Chem. 2009, 117, 21–31. [Google Scholar] [CrossRef] [Scilit]
  38. Yang, J.B.; Yao, P.; Zhang, X.H. The distribution and controlling factors of the concentration and structure of dissolved inorganic nutri-ents in the Shenhu Area, northern South China Sea. Haiyang Xuebao 2020, 42, 132–143. [Google Scholar] [CrossRef]
  39. Tian, J.; Ma, X.L.; Zhou, J.H.; Wang, W.J. Subsidence of the northern South China Sea and formation of the Bashi Strait in the latest Miocene: Paleoceanographic evidences from 9-Myr high resolution benthic foraminiferal δ18O and δ13C records. Palaeogeogr. Palaeoclimatol. Palaeoecol. 2017, 466, 382–391. [Google Scholar] [CrossRef] [Scilit]
  40. Zhai, W.; Dai, M.H.; Chen, B.S.; Guo, X.H.; Li, Q.; Shang, S.L.; Zhang, C.Y.; Cai, W.J.; Wang, D.X. Seasonal variations of sea--air CO2 fluxes in the largest tropical marginal sea (South China Sea) based on multiple-year underway measurements. Biogeosciences 2013, 10, 7775–7791. [Google Scholar] [CrossRef] [Scilit]
  41. Cai, W.J.; Hu, X.; Huang, W.J.; Murrell, M.M.; Lehrter, J.C.; Lohrenz, S.E.; Chou, W.C.; Zhai, W.; Hollibaugh, J.T.; Wang, Y.; et al. Acidification of subsurface coastal waters enhanced by eutrophication. Nat. Geosci. 2011, 4, 766–770. [Google Scholar] [CrossRef] [Scilit]
  42. Abram, M.A. Distribution of Subsurface Hydrocarbon Seepage in Near-Surface Marine Sediments. In Hydrocarbon Migration and Its Near-Surface Expression; American Association of Petroleum Geologists: Tulsa, OK, USA, 1996. [Google Scholar] [CrossRef] [Scilit]
  43. Abrams, M.A. Evaluation of Near-Surface Gases in Marine Sediments to Assess Subsurface Petroleum Gas Generation and Entrapment. Geosciences 2017, 7, 35. [Google Scholar] [CrossRef] [Scilit]
  44. Etiope, G.; Ciccioli, P. Earth’s degassing: A missing ethane and propane source. Science 2009, 323, 478. [Google Scholar] [CrossRef] [Scilit] [PubMed]
  45. Whiticar, M. Carbon and hydrogen isotope systematics of bacterial formation and oxidation of methane. Chem. Geol. 1999, 161, 291–314. [Google Scholar] [CrossRef] [Scilit]
  46. Zhang, G.; Huang, Y.; Chen, B. Marine Natural Gas Hydrate Seismology; Ocean Press: Beijing, China, 2003. [Google Scholar]
  47. Molofsky, L.J.; Etiope, G.; Segal, D.C.; Engle, M.A. Methane-rich gas emissions from natural geologic seeps can be chemically distinguished from anthropogenic leaks. Commun. Earth Environ. 2025, 6, 11. [Google Scholar] [CrossRef] [Scilit]
  48. Oremland, R.S.; Whiticar, M.J.; Strohmaier, F.F.; Kline, R.P. Bacterial ethane formation from reduced, ethylated sulfur compounds in anoxic sediments. Geochim. Cosmochim. Acta 1988, 52, 1895–1904. [Google Scholar] [CrossRef] [Scilit]
  49. Yao, Y.J.; He, J.X.; Xu, X.; Su, P.B.; Ju, D.; Guan, J.A. Comprehensive identification of natural gas/hydrate genesis types and gas sources in the northern continental margin basins of the South China Sea. Miner. Explor. 2024, 15, 2075–2088. [Google Scholar] [CrossRef]
  50. Suess, E. Marine cold seeps and their manifestations: Geological control, biogeochemical criteria and environmental conditions. Int. J. Earth Sci. 2014, 103, 1889–1916. [Google Scholar] [CrossRef] [Scilit]
  51. Wu, N.Y.; Yang, S.X.; Wang, H.B.; Liang, J.Q.; Gong, Y.H.; Lu, Z.Q.; Wu, D.D.; Guan, H.X. Gas-bearing fluid influx sub-system for gas hydrate geological system in Shenhu Area, Northern South China Sea. Chin. J. Geophys. 2009, 52, 1641–1650. [Google Scholar] [CrossRef]
  52. Xie, D.N.; Zhang, C.; Ren, J.Y.; Yao, B.C.; Wang, L.; Chen, H.; Kang, B. Effects of distinct tectonic evolutions on hydrocarbon accumulation in northern and southern continental marginal basins of South China Sea. Chin. J. Geophys. 2011, 54, 3280–3291. [Google Scholar] [CrossRef] [Scilit]
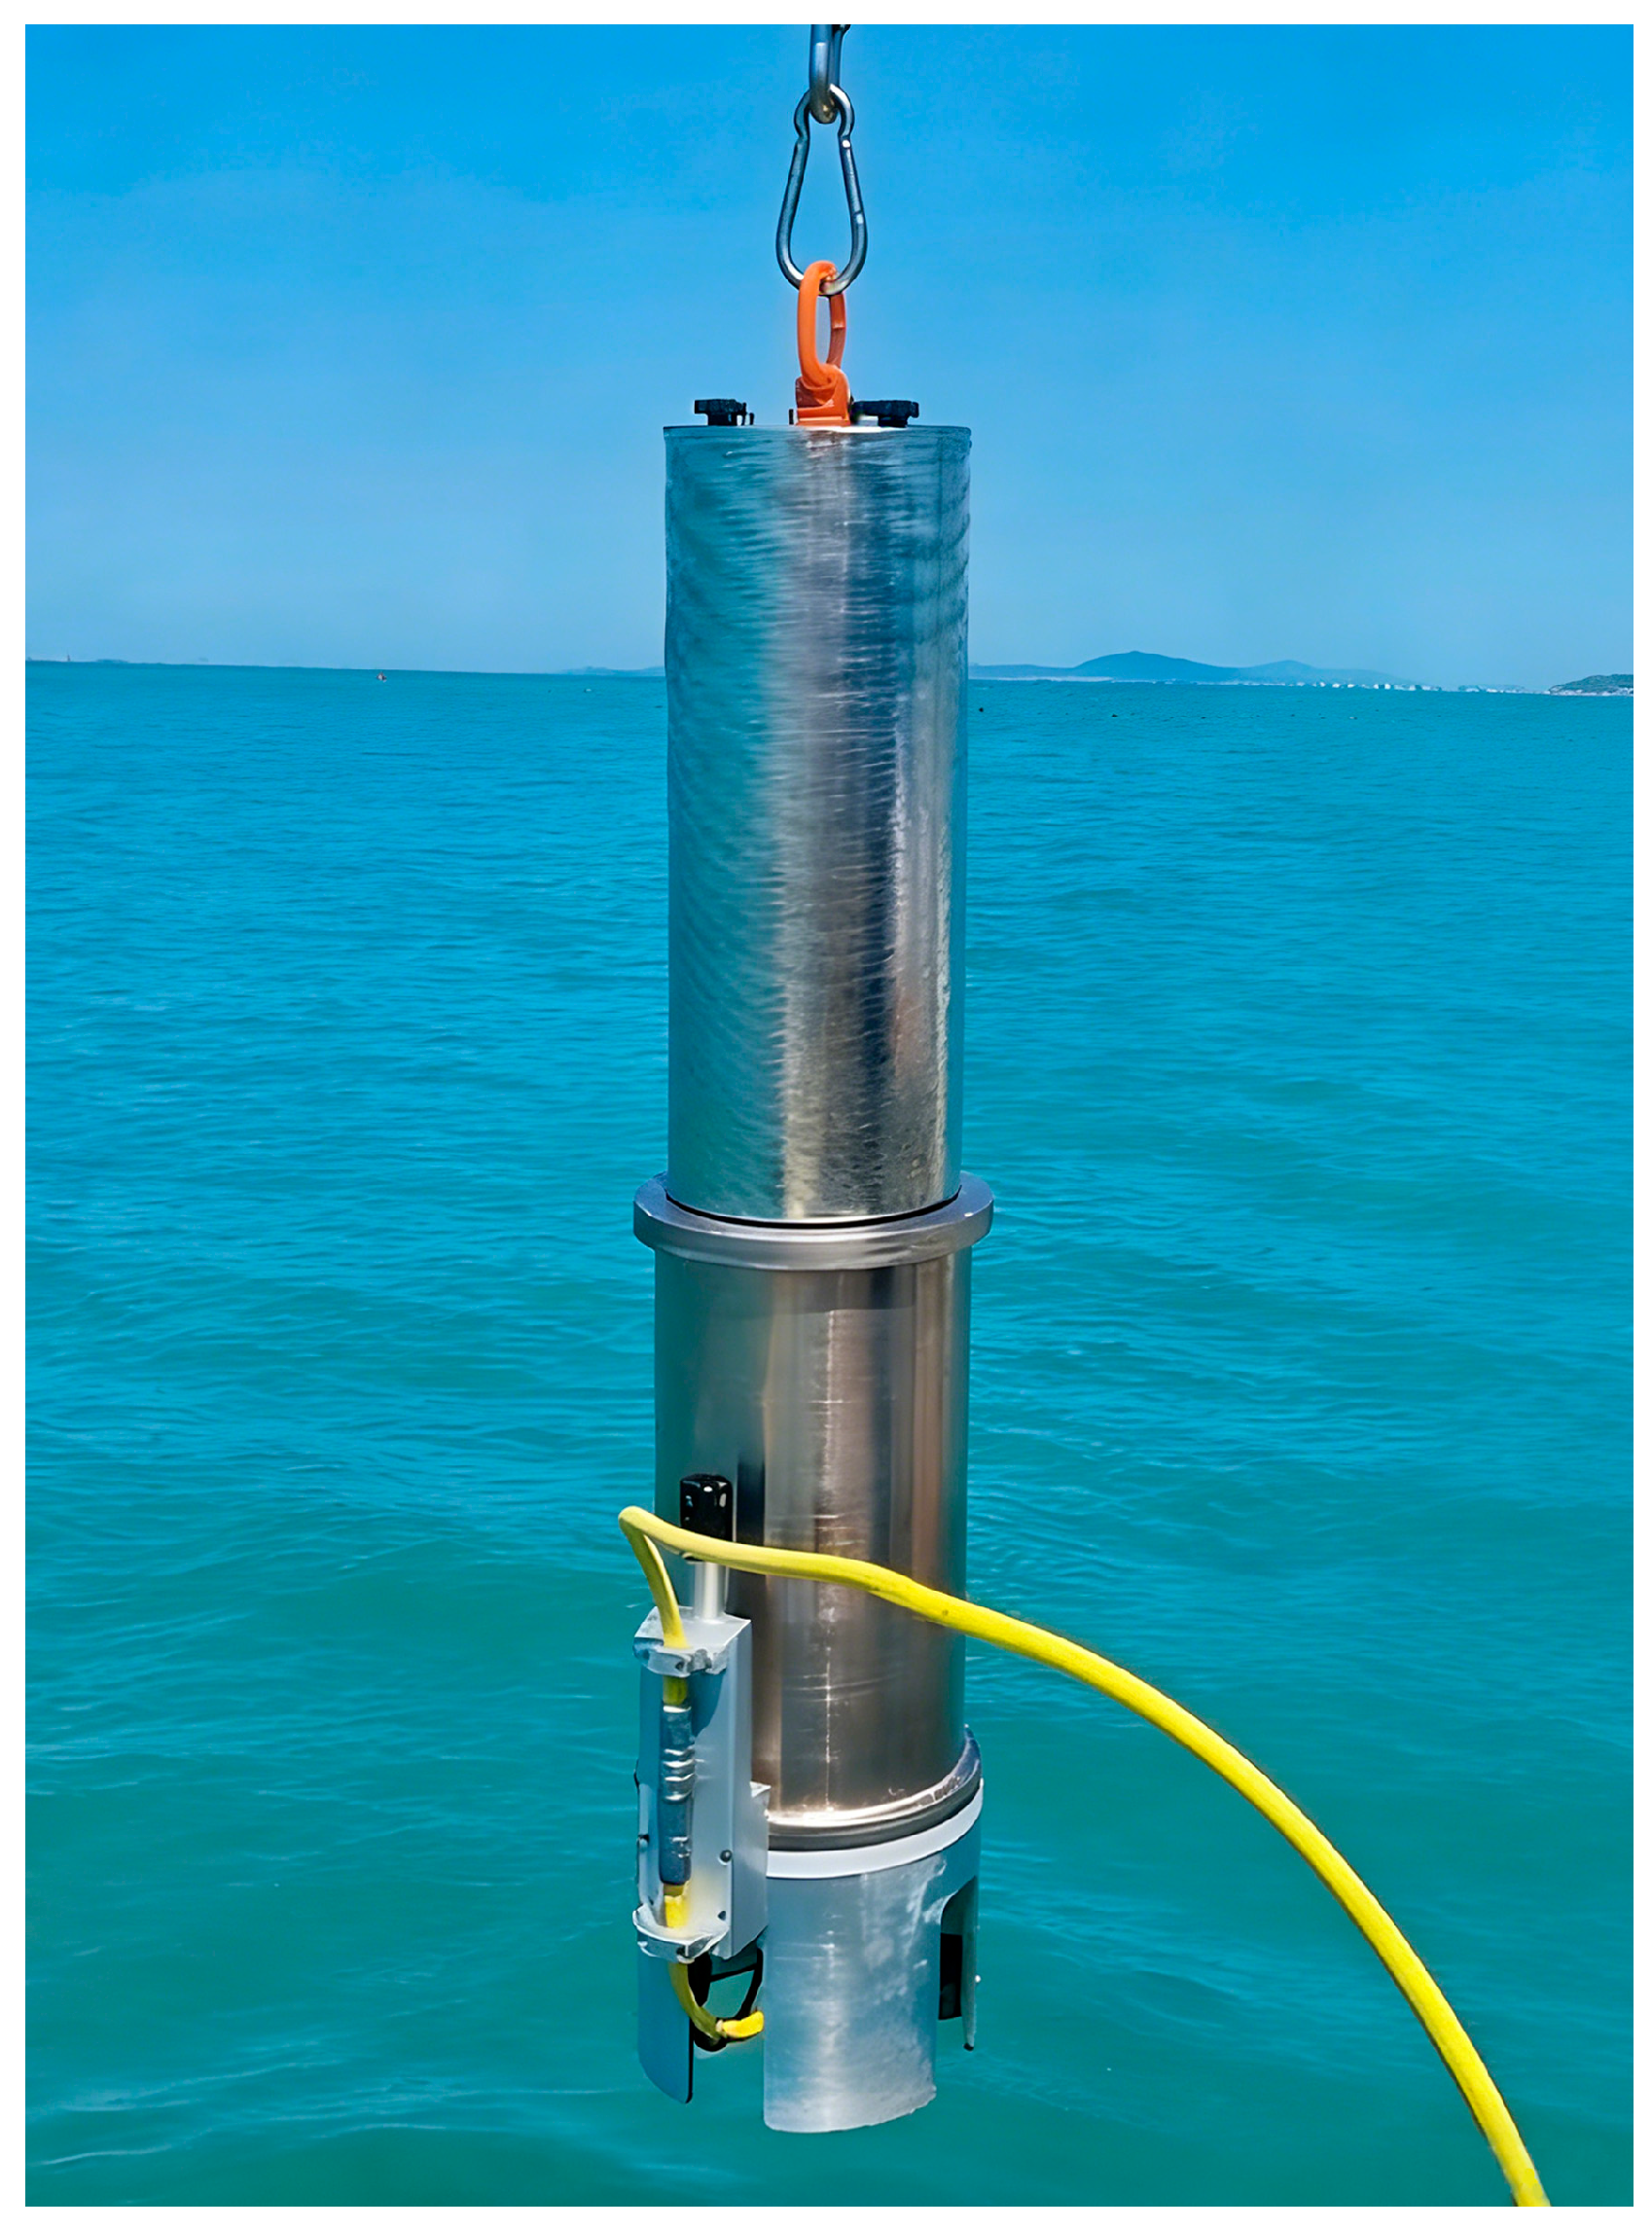
Figure 2. Automatic seawater in situ fidelity sampler.
Jmse 14 01167 g002
Figure 3. Vertical profiles of salinity (a) and temperature (b) with depth at different stations in the study area.
Jmse 14 01167 g003
Figure 4. Correlation between major elements and salinity at each station.
Jmse 14 01167 g004
Figure 5. Planar distribution map of major dissolved gas concentrations in the study area. (a) Distribution characteristics of N2 in surface, middle, and bottom seawater at each station; (b) Distribution characteristics of O2 in surface, middle, and bottom seawater at each station; (c) Distribution characteristics of Ar in surface, middle, and bottom seawater at each station.
Jmse 14 01167 g005
Figure 6. Profiles of major dissolved gas concentrations in the study area. (a) Profiles of N2 in surface, middle, and bottom seawater at each station. (b) Profiles of O2 in surface, middle, and bottom seawater at each station. (c) Profiles of Ar in surface, middle, and bottom seawater at each station.
Jmse 14 01167 g006
Figure 7. Distribution characteristics of CO2 in the study area. (a) Planar distribution map of CO2 in surface, middle, and bottom seawater at each station. (b) Profiles of CO2 in surface, middle, and bottom seawater at each station.
Jmse 14 01167 g007
Figure 8. Planar distribution map of alkane concentrations in the study area. (a) Distribution characteristics of methane in surface, middle, and bottom seawater at each station. (b) Distribution characteristics of propane in surface, middle, and bottom seawater at each station. (c) Distribution characteristics of butane in surface, middle, and bottom seawater at each station. (d) Distribution characteristics of isobutane in surface, middle, and bottom seawater at each station.
Jmse 14 01167 g008
Figure 9. Profiles of alkane concentrations in the study area. (a) Profiles of methane in surface, middle, and bottom seawater at each station. (b) Profiles of propane in surface, middle, and bottom seawater at each station. (c) Profiles of butane in surface, middle, and bottom seawater at each station. (d) Profiles of isobutane in surface, middle, and bottom seawater at each station.
Jmse 14 01167 g009
Table 1. Sampling Stations in the Dingzi Bay Area, South Yellow Sea.
Sampling PointWater Depth (m)Sampling LayerLongitudeLatitude
CQ015.0Surface, Bottom121.027036.5363
CQ025.0Surface, Bottom121.034036.5318
CQ039.5Surface, Bottom121.051036.4909
CQ048.0Surface, Bottom121.051036.4832
CQ0512.0Surface, Middle, Bottom121.092936.4127
CQ0614.0Surface, Middle, Bottom121.084336.3911
CJ019.9Surface, Bottom121.059836.4810
CJ0210.1Surface, Bottom121.105036.5079
CJ039.6Surface, Bottom121.149936.5437
CJ0410.1Surface, Bottom121.194836.5801
CJ0510.0Surface, Bottom121.240336.6159
CJ0610.1Surface, Bottom121.284736.6522
CJ078.4Surface, Bottom121.330136.6883
CJ0813.0Surface, Middle, Bottom121.150136.4542
CJ0913.8Surface, Middle, Bottom121.194736.4990
CJ1015.0Surface, Middle, Bottom121.240136.5441
Disclaimer/Publisher’s Note: The statements, opinions and data contained in all publications are solely those of the individual author(s) and contributor(s) and not of MDPI and/or the editor(s). MDPI and/or the editor(s) disclaim responsibility for any injury to people or property resulting from any ideas, methods, instructions or products referred to in the content.