Article

Design and Genetic Fuzzy Control of Fiber-Reinforced Magnetorheological Elastomer Vibration Isolators for Low-Frequency Vibration of Marine Hydraulic Pipelines

1
School of Mechanical and Electrical Engineering, Wuhan University of Technology, Wuhan 430070, China
2
Institute of Advanced Material Manufacturing Equipment and Technology, Wuhan University of Technology, Wuhan 430070, China
*
Author to whom correspondence should be addressed.
J. Mar. Sci. Eng. 2026, 14(13), 1147; https://doi.org/10.3390/jmse14131147
Submission received: 5 May 2026 / Revised: 16 June 2026 / Accepted: 19 June 2026 / Published: 23 June 2026
(This article belongs to the Section Ocean Engineering)

Featured Application

The purpose of this study is to provide theoretical guidance for the isolation of hydraulic pipeline systems in large Marine, and the conclusions of the research itself have certain vibration reduction effects.

Abstract

To address the critical challenge of 0–100 Hz low-frequency vibration control for marine hydraulic pipelines, this paper proposes a dedicated fiber-reinforced magnetorheological elastomer (MRE) isolator and a genetic algorithm-optimized fuzzy control strategy utilizing the magnetically tunable properties of MREs. An upper-lower split-type isolator is designed to suppress axial and radial vibrations through the shear and Compression Modes of MRE, respectively, and a two-degree-of-freedom (2-DOF) dynamic model is established to analyze the effects of mass ratio and natural frequency ratio on the system’s amplitude magnification factor. A Mamdani-type fuzzy controller, with acceleration error and its rate of change as inputs and control voltage as output, is optimized via a genetic algorithm. Simulation and experimental results show that 31–56.5% amplitude attenuation is achieved under 25–35 Hz single-frequency excitation; 12 dB isolation in the 5–23 Hz band at the input end and a maximum 15 dB isolation in multiple bands for the suspended pipeline section are obtained without external forced excitation; and efficient 0–100 Hz full-band isolation is realized at an applied current of 1.5 A. This work verifies the effectiveness of the proposed scheme for low-frequency vibration control of marine hydraulic pipelines.

1. Introduction

The marine hydraulic pipeline system serves as the core supply network for critical functions such as power transmission, cabin opening and closing, and steering gear control, whose stability directly affects the navigation safety of marines [1,2]. However, the flow of hydraulic oil, the operation of marine power equipment, and the marine environment all generate vibrations that are transmitted to the pipeline system, resulting in broadband vibrations ranging from 5 to 500 Hz [3,4]. Intense vibrations can cause structural damage such as pipeline fracture and flange leakage, thereby rendering the marine pipeline inoperable. Meanwhile, they also endanger the health of crew members and interfere with the signals of precision equipment on board [5,6,7]. Therefore, high-efficiency pipeline vibration isolation technology has become a key demand in marine vibration control.
To address the issue of pipeline vibration, an increasing number of scholars have focused on this field since the 1990s, yielding a series of research outcomes. Shoaib et al. investigated the applicability of frequency band gap to reduce vibration in fluid conveying pipelines by employing a periodic inertial amplification mechanism [8]. In their research, Cheer J and Daley S uniformly arranged eight piezoelectric stack actuators along the circumferential direction of the pipeline; by adjusting the controller parameters, they implemented targeted suppression of fluid pulsations inside the pipeline and noise radiation induced by vibration, ultimately accomplishing system-level vibration and noise control objectives [9]. Jiao Zongxia et al. proposed a piezoelectric ceramic-based active throttle valve device for pipelines, which regulates and distributes the fluid flow inside the pipeline through controlling the opening and closing actions of the throttle valve, thereby indirectly achieving vibration control goals [10]. Alternatively, Shuai Zhijun et al. adopted a different technical route, designing a piezoelectric ceramic tube as a secondary source pipe section to specifically suppress fluid pressure pulsations in the pipeline [11]. Li Wanyou et al. developed active and semi-active vibration absorbers for pipelines based on electromagnetic actuators, with slight differences in their configurations; the active absorber employs a frequency-domain adaptive control algorithm to realize active tracking control of pipeline vibration [12,13]. Wang and his team effectively suppressed low-frequency noise in the fluid-filled pipeline by adopting active control methods, further enhancing the reliability of the pipeline system and mechanical equipment [14]. Tian Ruixue designed a MRE absorber and conducted research on the control method of the pipeline MRE absorber under time-varying excitation [15].
The control method and isolator are the core components that depend on and cooperate with each other in the isolation system, and their comprehensive performance directly determines the effectiveness of vibration suppression [16,17]. As a physical execution element, the isolator directly executes the control strategy, and the control method provides a scientific basis for the selection, parameter design, and combination of isolators based on the vibration characteristics of the isolated object. At present, various active and semi-active algorithms are emerging in the field of vibration control. Many scholars have introduced LQR and PID hybrid control algorithms [18], fuzzy control [19,20,21,22], Fx-LMS control algorithm [23], particle swarm optimization algorithm [24], adaptive filtering algorithm [25], genetic algorithm [26], feedback Fx-LMS robust hybrid algorithm [27], adaptive proportional integral algorithm [28], fertilization particle swarm optimization algorithm [29], and nonlinear PPF methods [30] into vibration control in fields such as building structures, ship engineering, and vehicle engineering. Although there are significant differences in the physical form, operating conditions, and actuation implementation forms of vibration reduction objects in different fields, their dynamic essence and control objectives have a high degree of inherent consistency, which provides the underlying theoretical support for the cross-domain migration of intelligent vibration reduction control algorithms. From a dynamic perspective, various vibration reduction systems can be abstracted as second-order dynamic systems composed of mass stiffness damping, with disturbance suppression, amplitude attenuation, and improved operational stability as the core objectives. Their closed-loop feedback control architecture and performance evaluation system are universal, so these algorithms are also applicable to vibration control of ship hydraulic pipeline systems.
Currently, the research on vibration isolation and control methods for hydraulic pipeline systems has been relatively mature; however, the existing studies still lack effective vibration suppression performance for low-frequency vibrations. Based on the vibration characteristics of large marine hydraulic pipeline systems investigated in Reference [31] and the fiber-reinforced MRE proposed in Reference [32], this paper designs a dedicated vibration isolator for hydraulic pipelines, and achieves effective isolation of low-frequency vibrations ranging from 0 to 100 Hz through a genetic fuzzy control strategy.

2. Design of Fiber-Reinforced MRE Vibration Isolators for Marine Hydraulic Pipelines

Vibration has now become a primary cause of failure in marine hydraulic pipelines, and there is an urgent need to design vibration isolators for hydraulic pipeline systems. While traditional passive vibration isolators with fixed stiffness struggle to adapt to broadband scenarios, fiber-reinforced MRE have emerged as ideal vibration isolation components due to their magnetically tunable reversible properties. However, their vibration isolation effectiveness is highly dependent on structural design; therefore, based on the vibration characteristics of pipelines, this paper designs an isolator structure that meets engineering requirements.

2.1. Structural Design of Fiber-Reinforced MRE Pipeline Vibration Isolators

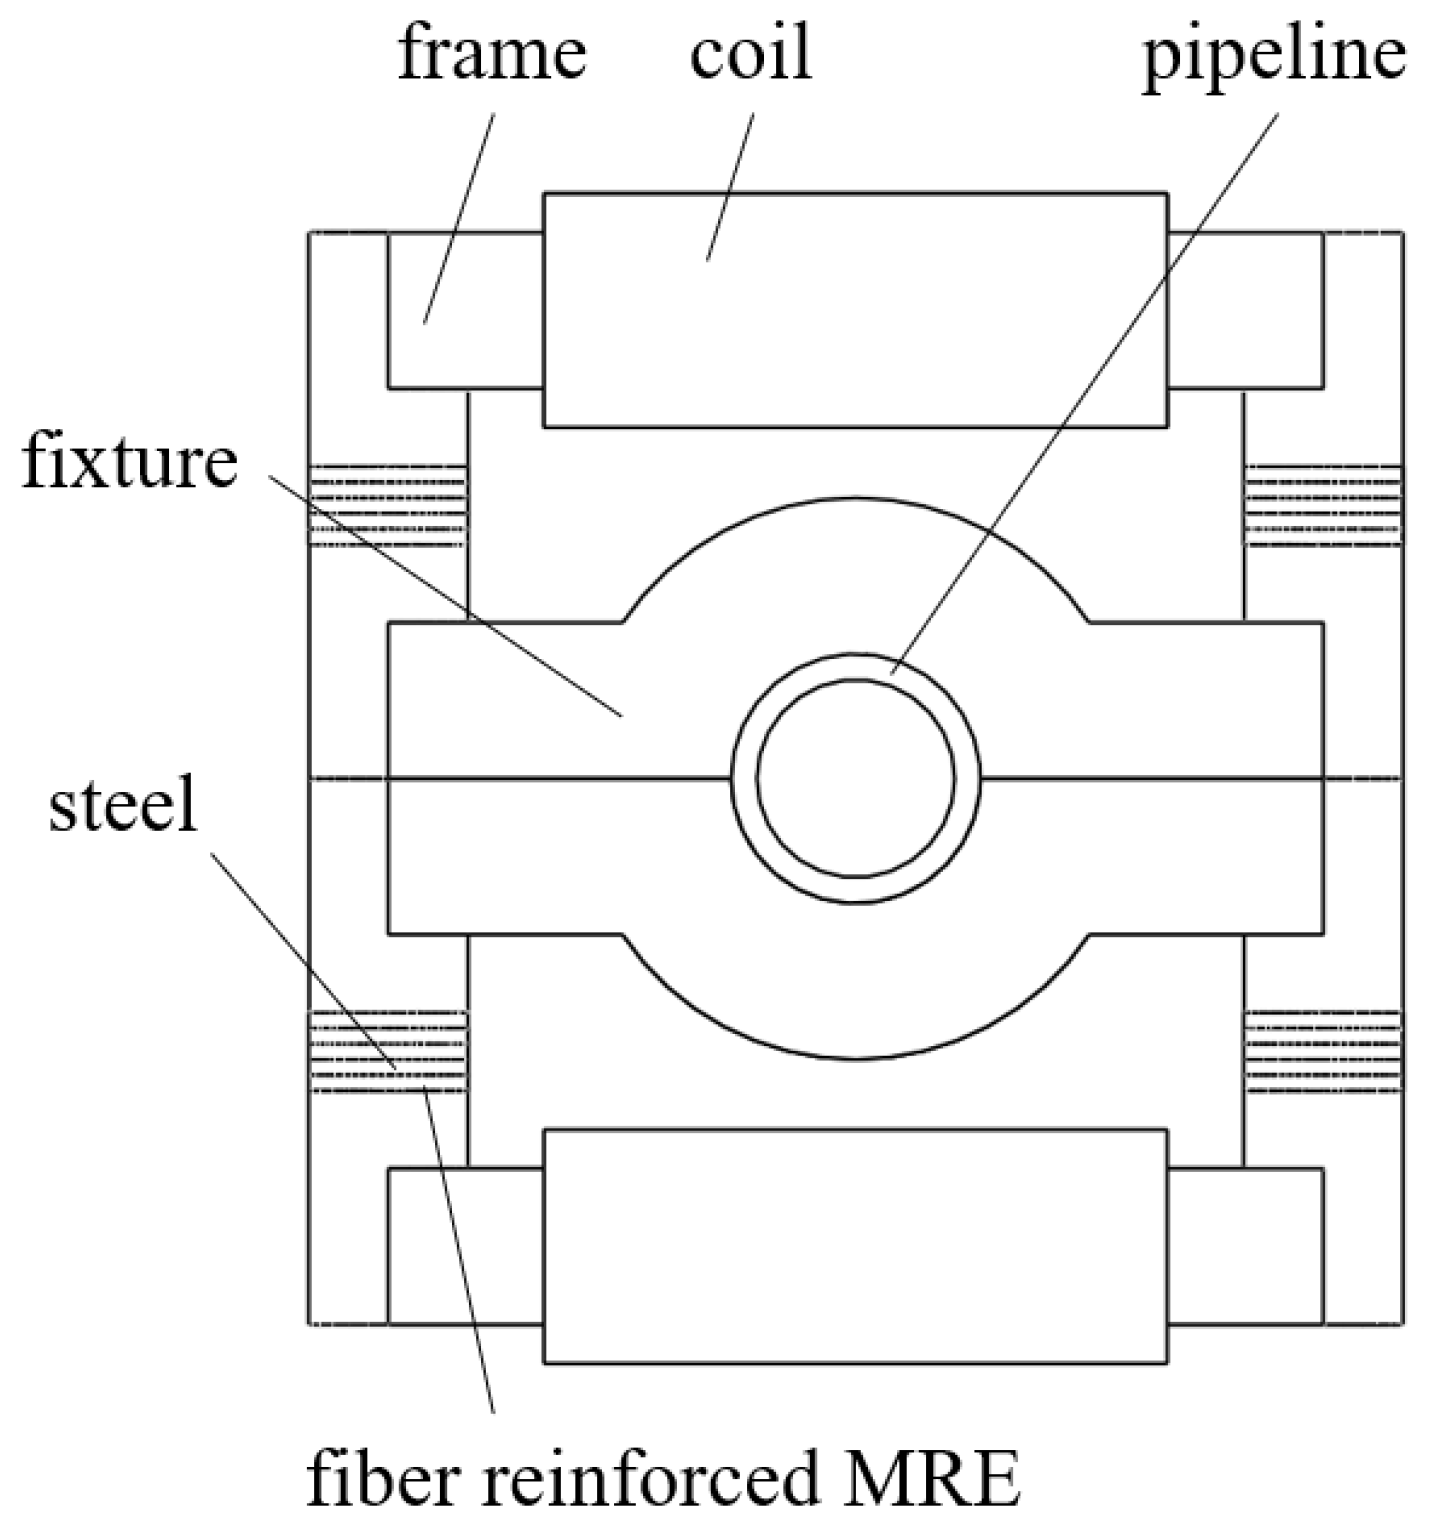
In the design of pipeline vibration isolators, fiber-reinforced MRE serves as the core component. The “variable stiffness characteristics” of the isolator mainly rely on the inherent properties of fiber-reinforced MRE materials: applying an external magnetic field alters the internal chain-like structure of the material, thereby modifying its mechanical properties. During the structural design process, considerations must be given to the magnetic circuit layout and relevant details. Since the vibration of large marine hydraulic pipeline systems is three-dimensional, including two radial directions (X and Y) and one axial direction, the working modes of the fiber-reinforced MRE need to be arranged accordingly to target vibrations in different directions of the pipeline. The structural diagram of the designed fiber-reinforced MRE vibration isolator is shown in Figure 1. The isolator is primarily composed of five parts—frame, coils, circular steel sheets, clamps, and MRE—and is divided into upper and lower sections, which respectively eliminate radial and axial vibrations of the pipeline. These two sections firmly clamp the pipeline in between and are fixed and connected by bolts. The upper and lower sections can achieve independent control: the upper section mainly utilizes the Shear Mode of the fiber-reinforced MRE to isolate vibrations in the axial direction and radial X direction of the pipeline, while the lower section primarily adopts the Compression Mode of the fiber-reinforced MRE to control vibrations in the radial Y direction. Additionally, the bolted connection between the upper and lower sections can also be used for positioning, which avoids the coaxial alignment issue and makes the installation process more convenient and efficient.

2.2. Establishment of a Dynamic Model for the Fiber-Reinforced MRE Vibration Isolator

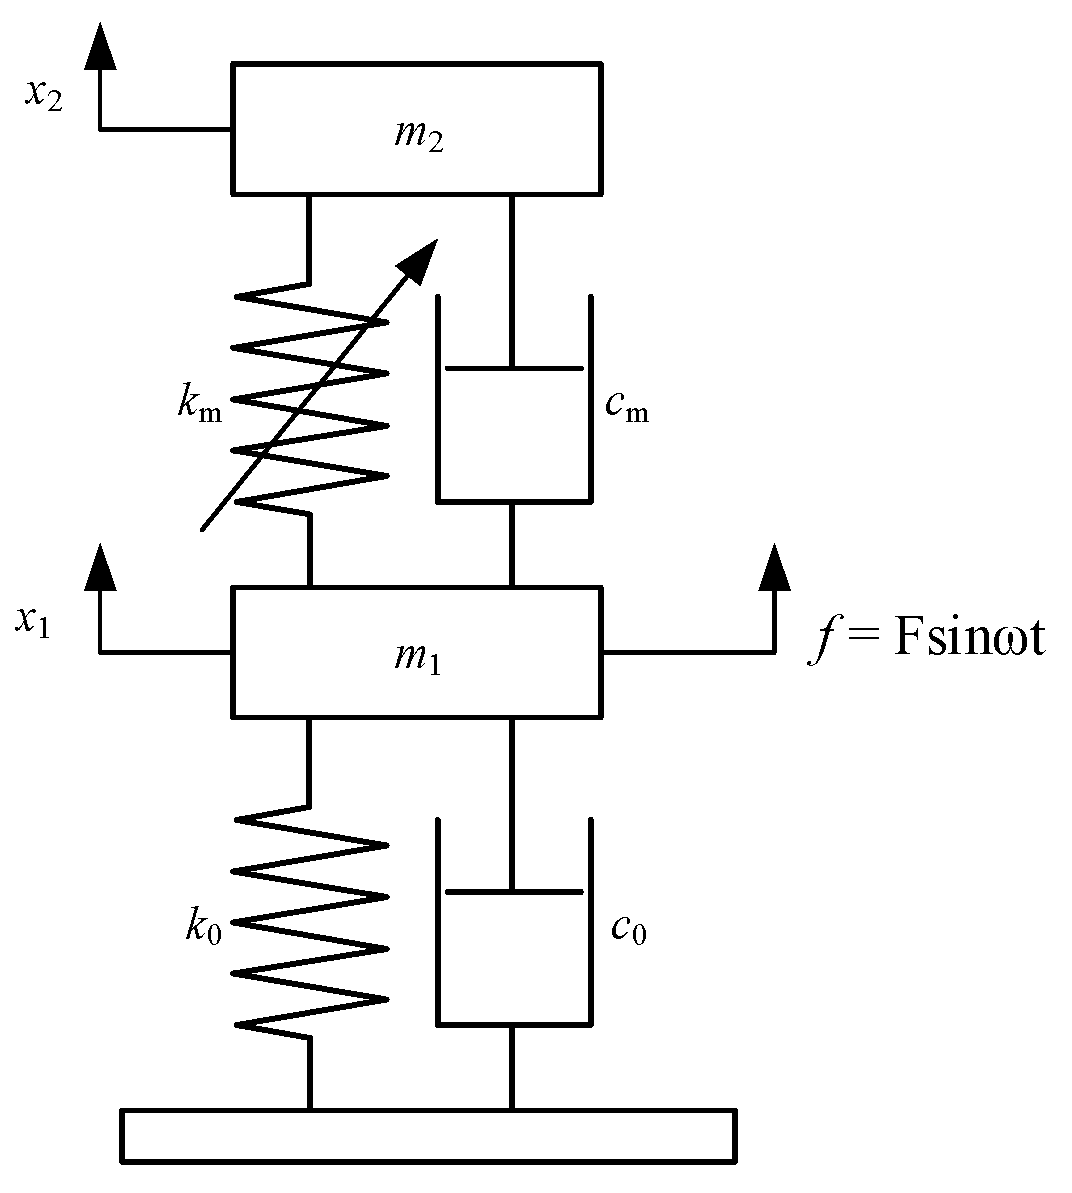
Considering the support conditions of large marine hydraulic pipelines in practical application environments, this paper establishes a mechanical model of the vibration isolation system for the fiber-reinforced MRE isolator designed in the previous section [33]. Considering the complex characteristics of ship pipeline vibration, a simplified mechanical model of the two-degree-of-freedom vibration system isolator for unidirectional vibration analysis is established here. The specific model is shown in Figure 2.
Given that m 1 denotes the mass of the pipeline vibration system (corresponding to the pipeline in Figure 1), c 0 and k 0 represent the damping and stiffness of the pipeline vibration system, m 2 is the mass of the fiber-reinforced MRE vibration isolator (corresponding to other components in Figure 1 except for pipelines), c m and k m stand for the damping and stiffness of the fiber-reinforced MRE vibration isolator, x 1 and x 2 denote the vibrational displacements of the pipeline vibration system and the fiber-reinforced MRE vibration isolator respectively, and f is the excitation force acting on the pipeline vibration system, the motion equation of the system can be derived in accordance with Newton’s second law as follows:
m 2 x ¨ 2 c m x ˙ 1 + c m x ˙ 2 k m x 1 + k m x 2 = 0 m 1 x ¨ 1 + ( c 0 + c m ) x ˙ 1 + ( k 0 + k m ) x 1 c m x ˙ 2 k m x 2 = f
At this point, assuming that the excitation force acting on the pipeline vibration system is a sinusoidal excitation, the excitation force f can be expressed as:
f = F sin ω t
where F and ω represent the amplitude and angular frequency of the external excitation force. Performing a Fourier transform on Equation (1) yields:
m 2 ω 2 X 2 + j c m ω ( X 2 X 1 ) + k m ( X 2 X 1 ) = 0 m 1 ω 2 X 1 + j c m ( X 1 X 2 ) + k m ( X 1 X 2 ) + k 0 X 1 + j c 0 ω X 1 = F
where X1, X2 and F are the Fourier transforms of x1, x2 and f, respectively; solving Equation (3) yields the amplitudes of the pipeline vibration system and the vibration isolator as follows:
X 1 = F ( m 2 ω 2 + j c m ω + k m ) ( m 1 ω 2 + j c m ω + k m + k 0 + j c 0 ω ) ( m 2 ω 2 + j c m ω + k m ) ( j c m ω + k m ) 2 X 2 = F ( j c m ω + k m ) ( m 1 ω 2 + j c m ω + k m + k 0 + j c 0 ω ) ( m 2 ω 2 + j c m ω + k m ) ( j c m ω + k m ) 2
Thus, the amplitude magnification factor of the pipeline vibration system can be calculated as follows:
T = X 1 X s t = ( γ 2 λ 2 ) 2 + ( 2 γ λ ξ 2 ) 2 γ 2 1 + 4 γ ξ 1 ξ 2 + ( 1 + μ ) γ 2 λ 2 + λ 4 + ( 2 λ ( γ 2 λ 2 ) ξ 1 + γ 1 ( 1 + μ ) γ 2 ξ 2 ) 2 X s t = F k 0
where μ = m 2 / m 1 denotes the mass ratio of the fiber-reinforced MRE vibration isolator to the pipeline vibration system, λ = ω / ω n 1 represents the forced vibration frequency ratio of the pipeline vibration system, γ = ω n 2 / ω n 1 is the natural frequency ratio between the fiber-reinforced MRE vibration isolator and the pipeline vibration system, ξ 1 = c 0 / 2 m 1 ω n 1 stands for the damping ratio of the pipeline vibration system, ξ 2 = c m / 2 m 2 ω n 2 denotes the damping ratio of the fiber-reinforced MRE vibration isolator, ω n 1 = k 0 / m 1 is the natural frequency of the pipeline vibration system, and ω n 2 = k m / m 2 represents the natural frequency of the fiber-reinforced MRE vibration isolator.
It can be seen from the above equations that to reduce the amplitude magnification factor of the pipeline vibration system, the three parameters ( μ , γ , ξ 2 ) of the fiber-reinforced MRE vibration isolator can be adjusted. Thus, the influences of each parameter of the fiber-reinforced MRE vibration isolator on the amplitude magnification factor will be analyzed below.

2.3. Influences of Each Parameter of the Fiber-Reinforced MRE Vibration Isolator on the Amplitude Magnification Factor

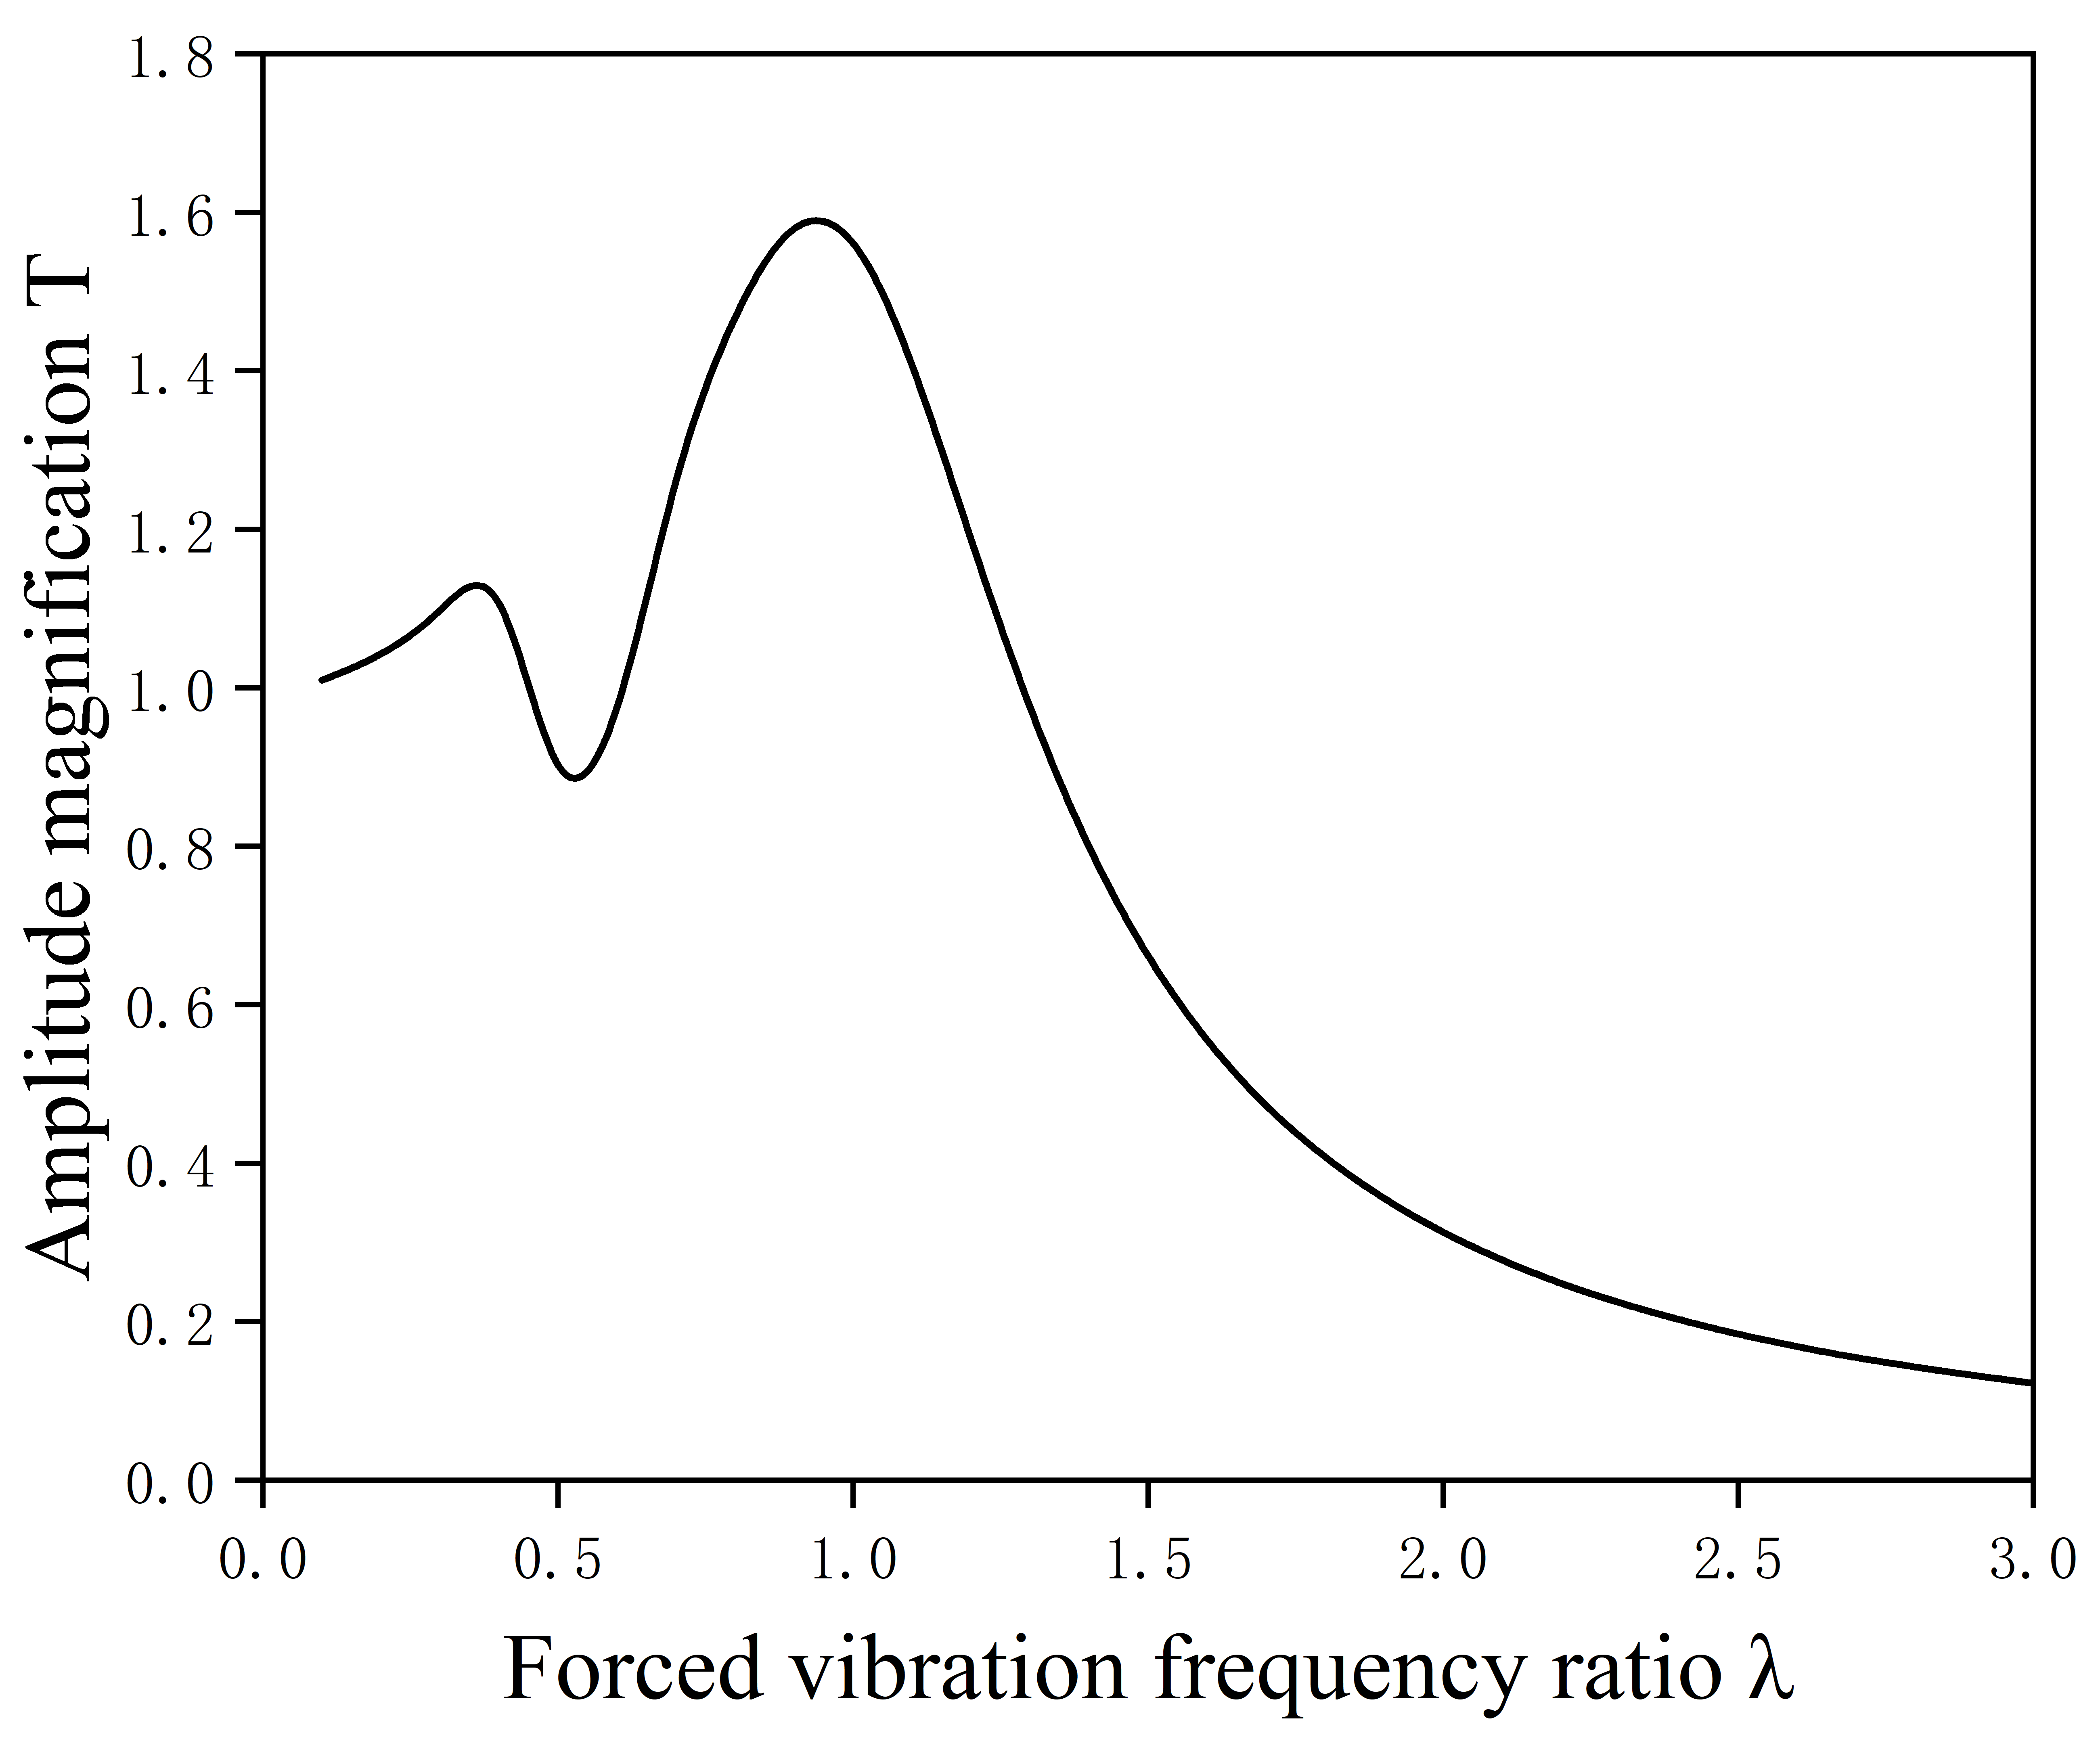
Based on the amplitude magnification factor formula derived in the previous section, when μ = 0.3 , γ = 0.6 , ξ 1 = 0.3 , and ξ 2 = 0.1 [34], the relationship between the amplitude magnification factor T and the forced vibration frequency ratio λ can be obtained as shown in Figure 3.
It can be observed from the figure that the amplitude magnification factor curve exhibits two characteristic peaks, which correspond to the first-order and second-order natural frequencies of the pipeline vibration system respectively. Notably, there exists a certain vibration reduction bandwidth between the two resonance peaks, and its core function lies in the fact that when the operating frequency range of the isolator falls within this vibration reduction bandwidth, the pipeline vibration system can maintain a low vibration amplitude, thereby achieving the expected vibration reduction effect. However, the vibration reduction bandwidth in the figure is relatively narrow; instead, the frequency range above the second-order natural frequency demonstrates superior vibration reduction performance. To systematically explore the regulatory laws of the fiber-reinforced MRE vibration isolator parameters on the amplitude magnification factor curve, subsequent studies will first determine the basic parameters of the pipeline vibration system and the isolator. On this basis, the mass ratio μ , natural frequency ratio γ , and damping ratio ξ 2 of the dynamic vibration isolator will be taken as individual variables, respectively. The control variable method will be adopted to sequentially analyze the influence laws of changes in each parameter on the peak height, peak position, and vibration reduction bandwidth of the amplitude magnification factor curve, thereby providing a theoretical basis for the parameter optimization design of the vibration isolator.
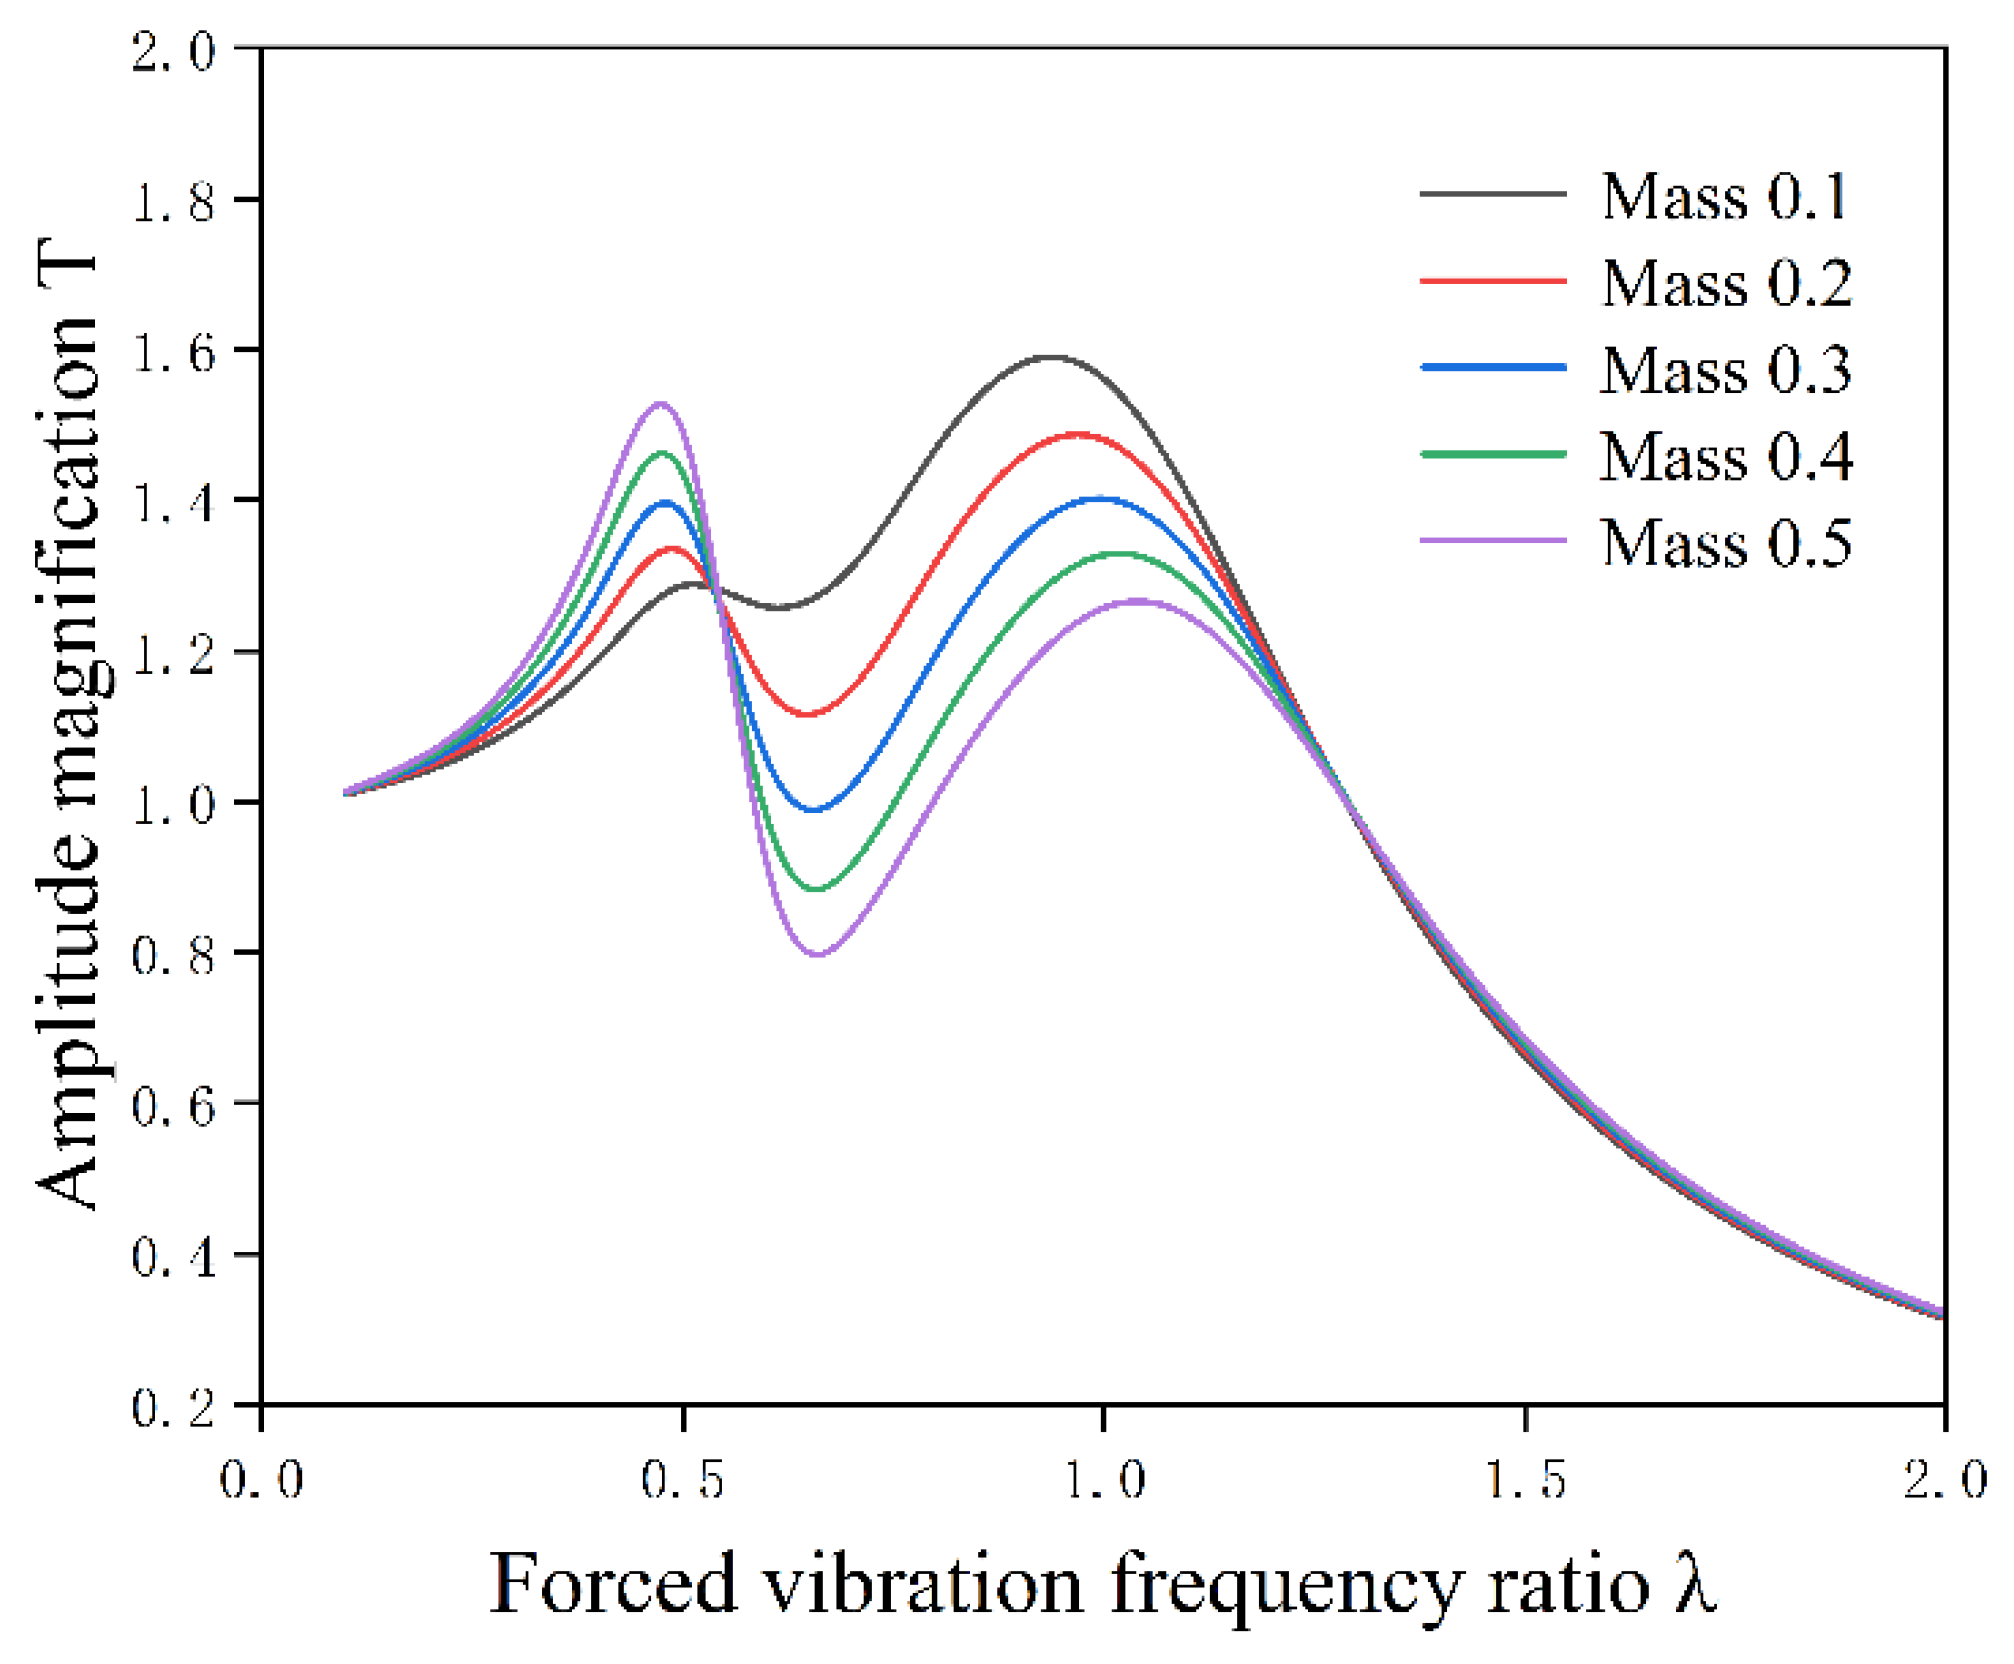
First, the influence law of different mass ratios μ on the amplitude magnification factor curve of the pipeline vibration system is analyzed, and the results are shown in Figure 4. It can be clearly observed from the figure that the mass ratio has a significant regulatory effect on the curve shape and the vibration characteristics of the main system. Specifically, as the mass ratio μ increases, the vibration reduction effect of the isolator on the main system within the vibration reduction bandwidth shows an increasing trend, which is manifested in the further reduction in the vibration amplitude of the main system in this bandwidth and the corresponding expansion of the width of the vibration reduction bandwidth. From the perspective of the variation law of resonance peaks, the peak corresponding to the first-order natural frequency increases with the increase of μ , while the peak corresponding to the second-order natural frequency shows a decreasing trend as μ increases. However, when the mass ratio μ is small, especially when it is less than 0.3, it can be seen that no vibration reduction bandwidth appears between the first-order and second-order natural frequencies, indicating that the isolator has no vibration reduction effect in this frequency range under this condition. Therefore, the mass ratio between the isolator and the pipeline vibration system should be focused on in the design of the isolator. In practical applications, however, it is impossible to infinitely increase the mass ratio μ to pursue a wider vibration reduction bandwidth. This is because the design under actual working conditions needs to consider multiple constraints: on the one hand, it is necessary to balance the vibration reduction effect within the vibration reduction bandwidth and the suppression requirement of resonance peaks; on the other hand, it is also necessary to take into account the physical limitations of specific application scenarios, such as the installation space capacity of the vibration isolator, and the impact of its own mass on the bearing performance and dynamic characteristics of the overall vibration reduction structure. Therefore, the selection of the mass ratio μ needs to be targeted optimized in combination with the actual working conditions of the vibration reduction object, so as to achieve a balance between technical performance and engineering practicality.
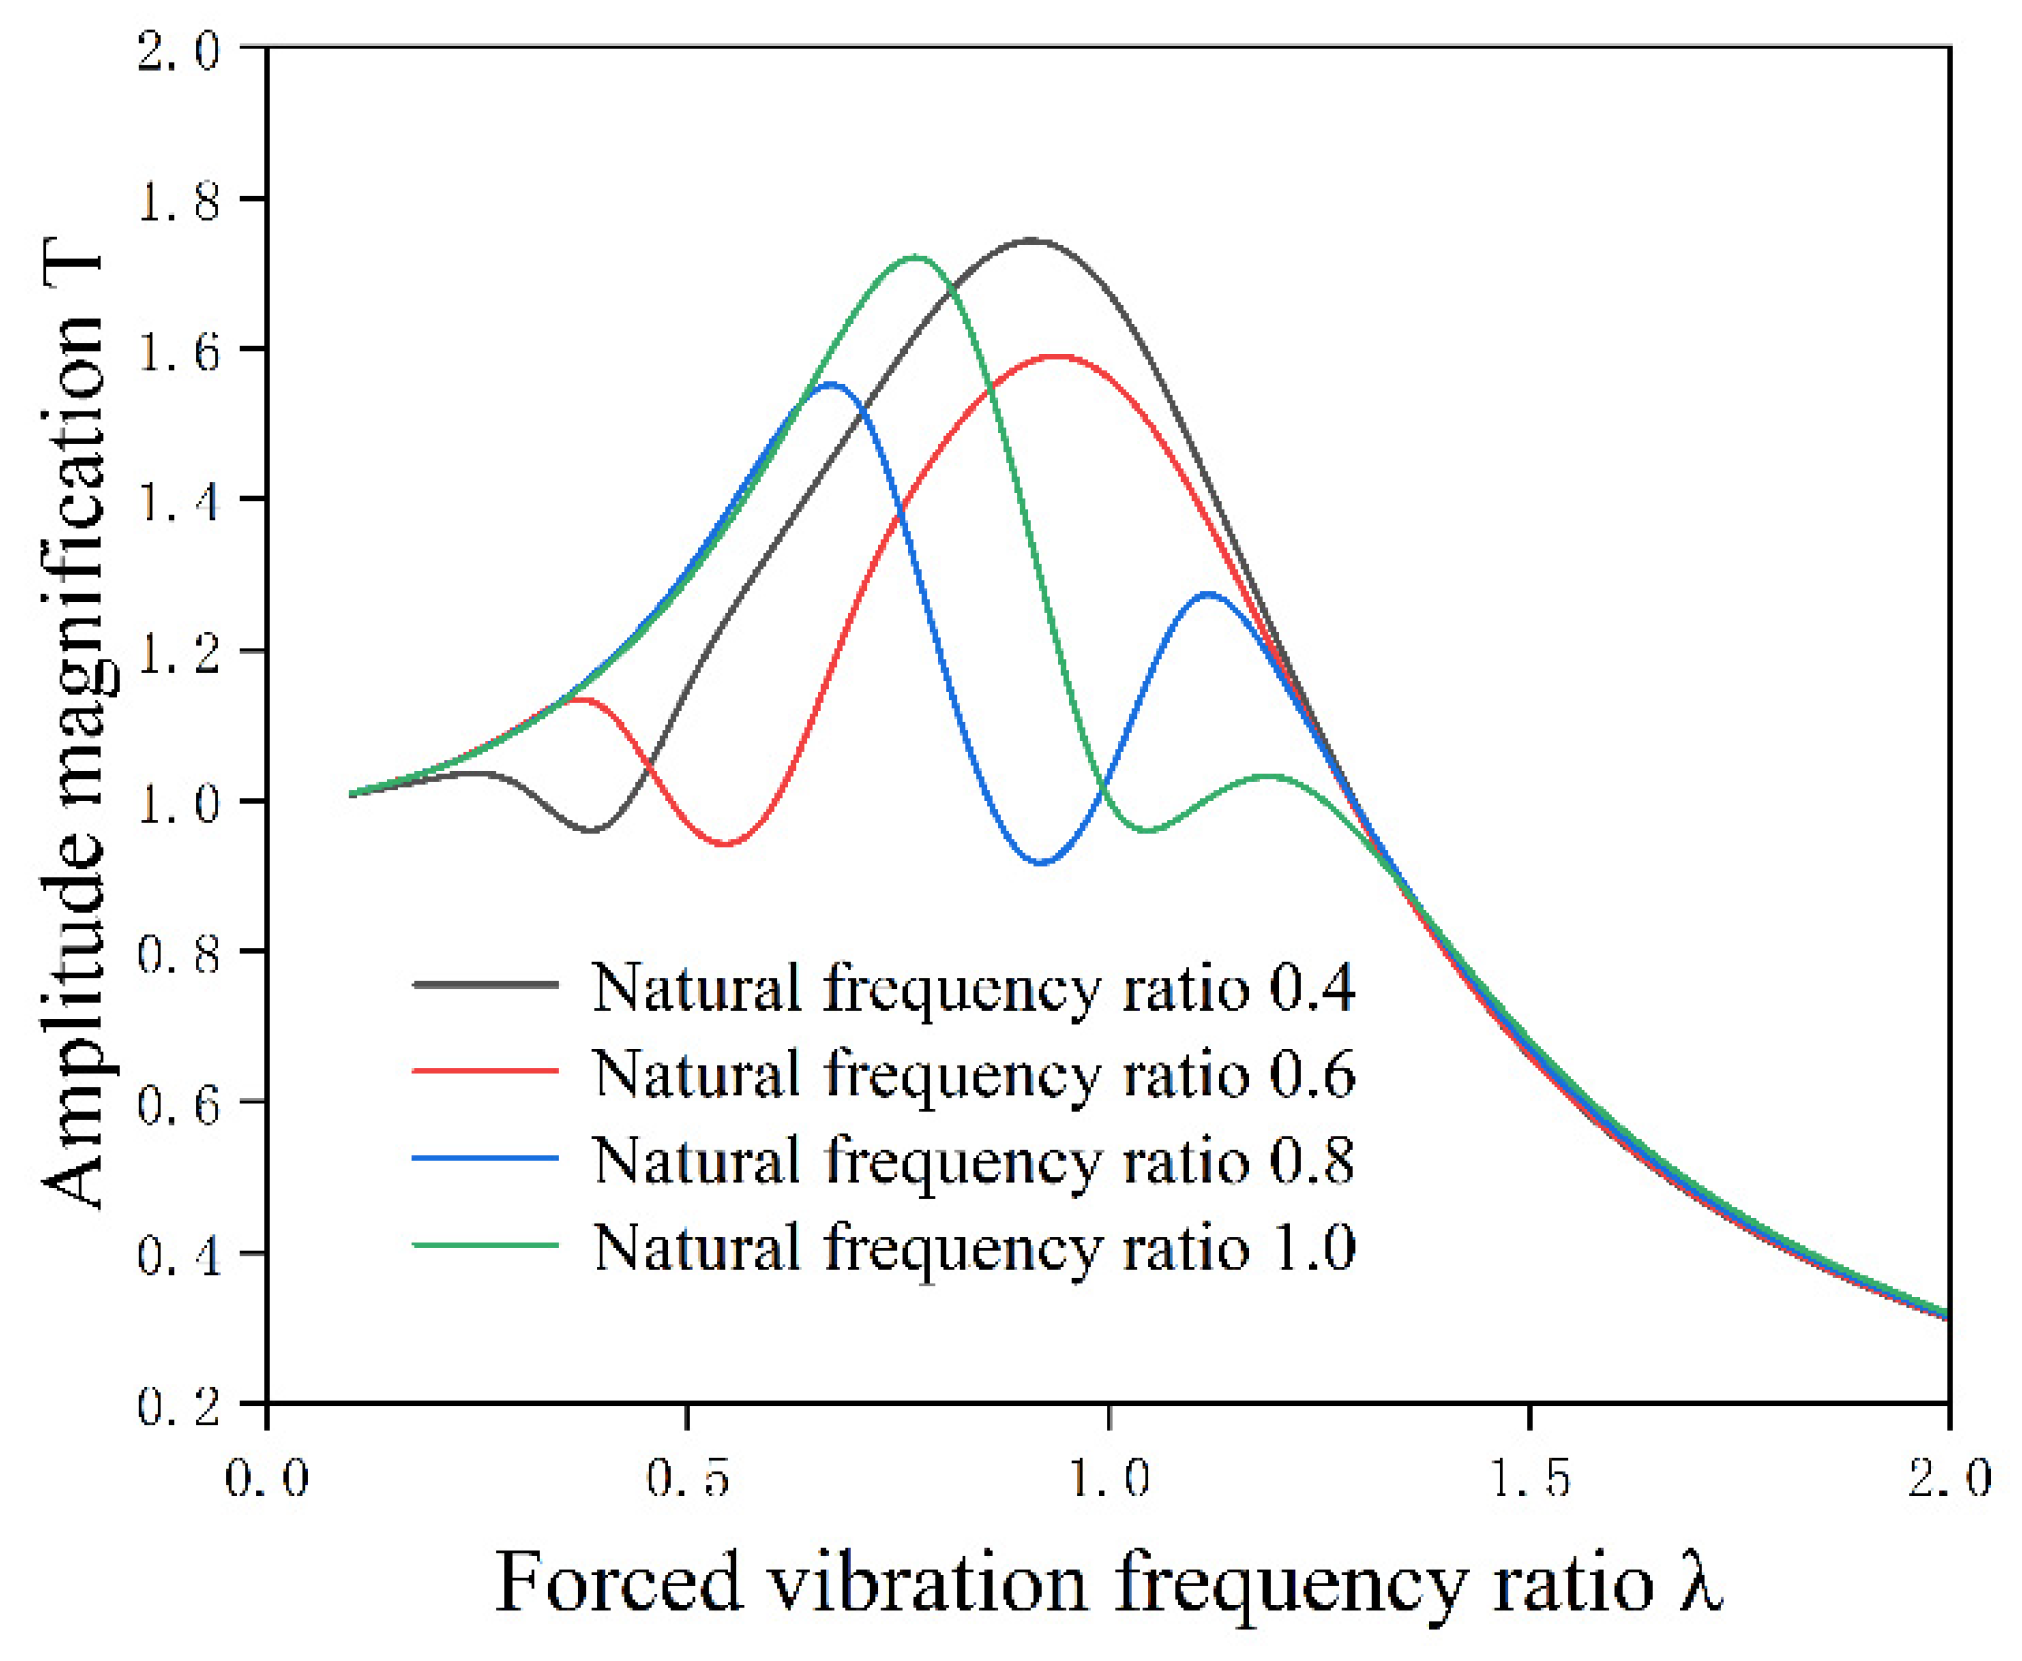
Figure 5 presents the amplitude magnification factor curves of the pipeline vibration system under different natural frequency ratios γ . It can be observed from the figure that the natural frequency ratio γ exerts a significant influence on the curve characteristics and the vibration response of the pipeline system. From the perspective of the variation law of resonance peaks, the peak corresponding to the first-order natural frequency shows an increasing trend with the increase of γ , while the peak corresponding to the second-order natural frequency gradually decreases as γ increases. At the same time, the overall range of the vibration reduction bandwidth shifts toward the high-frequency direction with the increase of γ , and the bandwidth center exhibits a significant correlation with the variation in the natural frequency ratio.
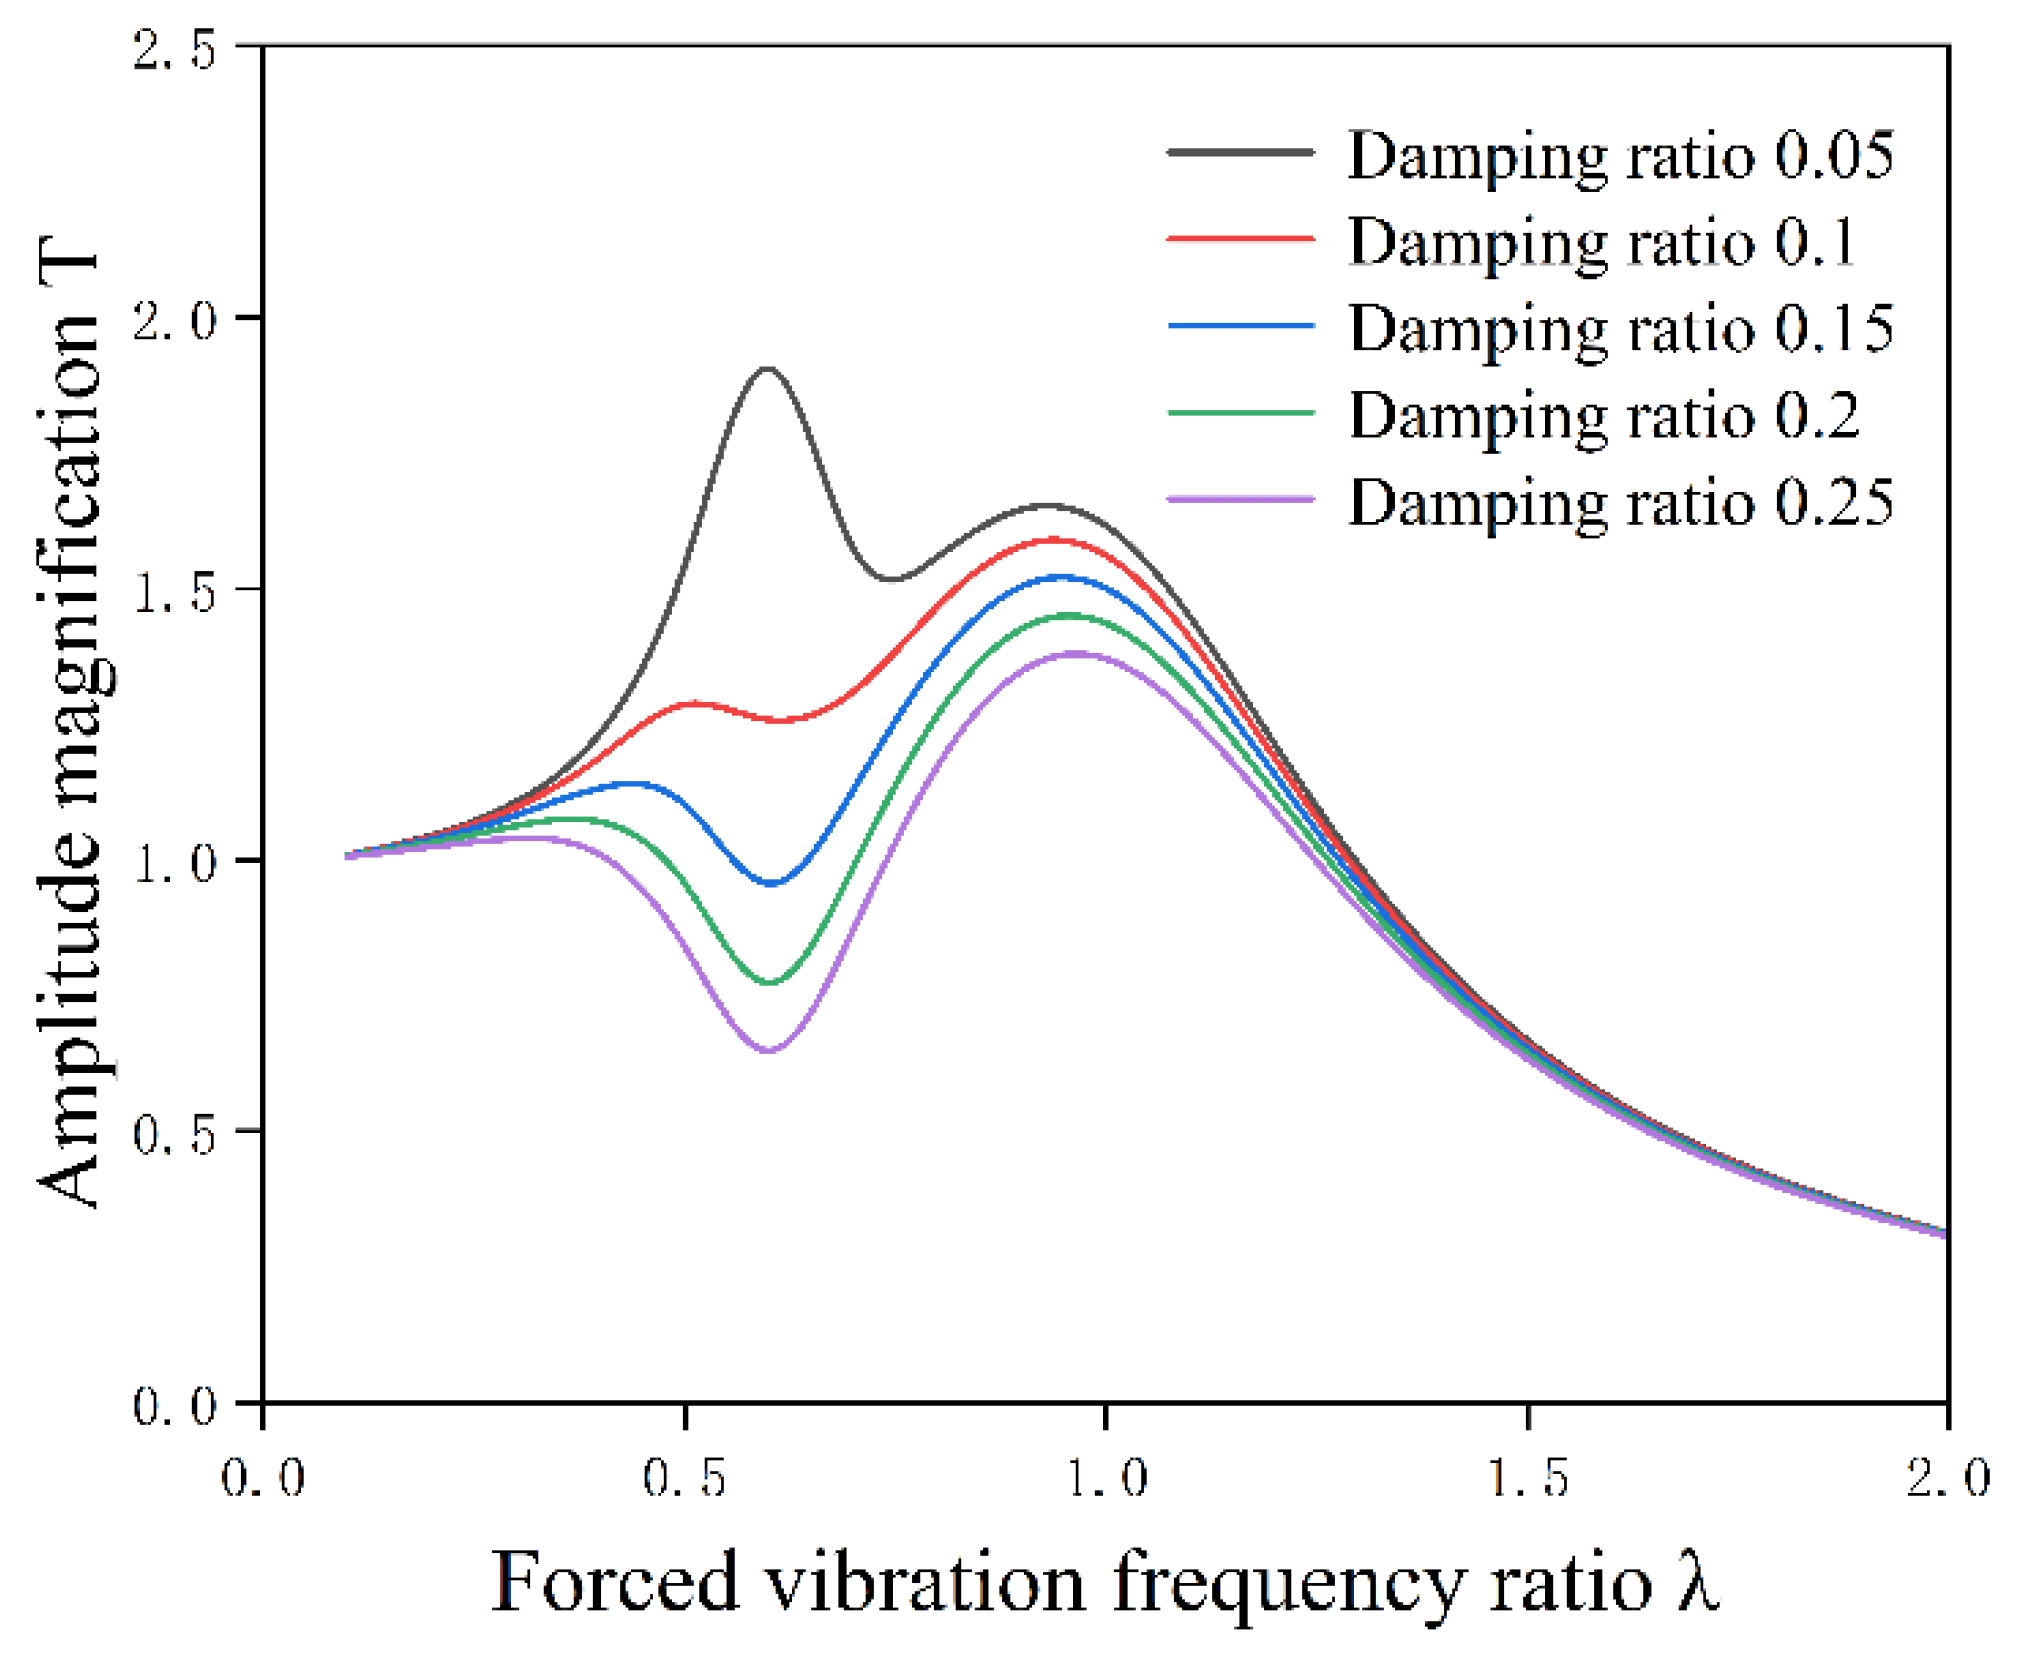
Figure 6 presents the amplitude magnification factor curves of the pipeline vibration system under different damping ratios ξ 2 . It can be observed from the figure that as the damping ratio ξ 2 increases, the peak corresponding to the first-order natural frequency decreases, and the natural frequency also decreases with a leftward shift; the peak corresponding to the second-order natural frequency also decreases, while the natural frequency remains essentially unchanged. Within the vibration reduction bandwidth, the vibration reduction effect of the isolator exhibits a significant positive correlation with its own damping ratio: as ξ 2 increases, the vibration suppression effect of the isolator on the pipeline vibration system is rapidly enhanced, which is manifested in the reduction in the amplitude magnification factor of the pipeline system within this bandwidth and a significant improvement in vibration reduction performance. Based on the above laws, to ensure that the isolator can achieve a stable and excellent vibration reduction effect within the target vibration reduction bandwidth, the damping ratio ξ 2 should be prioritized to be controlled at a relatively high level during the parameter design phase of the isolator.

3. Research on the Fuzzy Feedback Control Strategy for the Fiber-Reinforced MRE Vibration Isolator

Ordinary MRE vibration isolators mostly adopt the ON–OFF switch control strategy; however, the isolator system using switch control has obvious shortcomings, specifically manifested in low control accuracy, which can only output two types of fixed control outputs, and is prone to “chattering” due to frequent switching near the threshold, making it difficult to stably control the target; sudden state changes will cause stepwise impacts, which may excite additional vibrations of the system and impose extra stress on the structure; it relies on fixed thresholds, resulting in weak adaptability to external disturbances and changes in operating conditions, and its application scenarios are limited to simple systems with stable parameters. Furthermore, it cannot dynamically match system requirements, often leading to over-control or under-control, resulting in low energy utilization efficiency. To improve the control effect of the fiber-reinforced MRE vibration isolator, this section introduces fuzzy feedback control and optimizes the input signals of the isolator through a genetic algorithm, thereby achieving a better vibration isolation effect.

3.1. Fuzzy Feedback Control Theory

In scenarios where disturbance characteristics and system interference are unknown, feedback control strategies demonstrate significant effectiveness. As an important branch of intelligent control, fuzzy control does not rely on accurate mathematical models of the system or disturbance models. It is supported by core theoretical foundations including fuzzy set theory, fuzzy judgment rules, and fuzzy logic reasoning, enabling high-precision control for complex nonlinear time-varying systems [35,36]. By simulating the gray-scale fuzzy thinking mechanism of the human brain, this control method first converts continuously varying input signals in the system into discretized fuzzy variables; then, it performs operations on these fuzzy variables based on preset fuzzy control rules and logical reasoning algorithms to generate decision variables; finally, it converts the decision variables back into continuous control drive signals through specific algorithms to act on the controlled object.
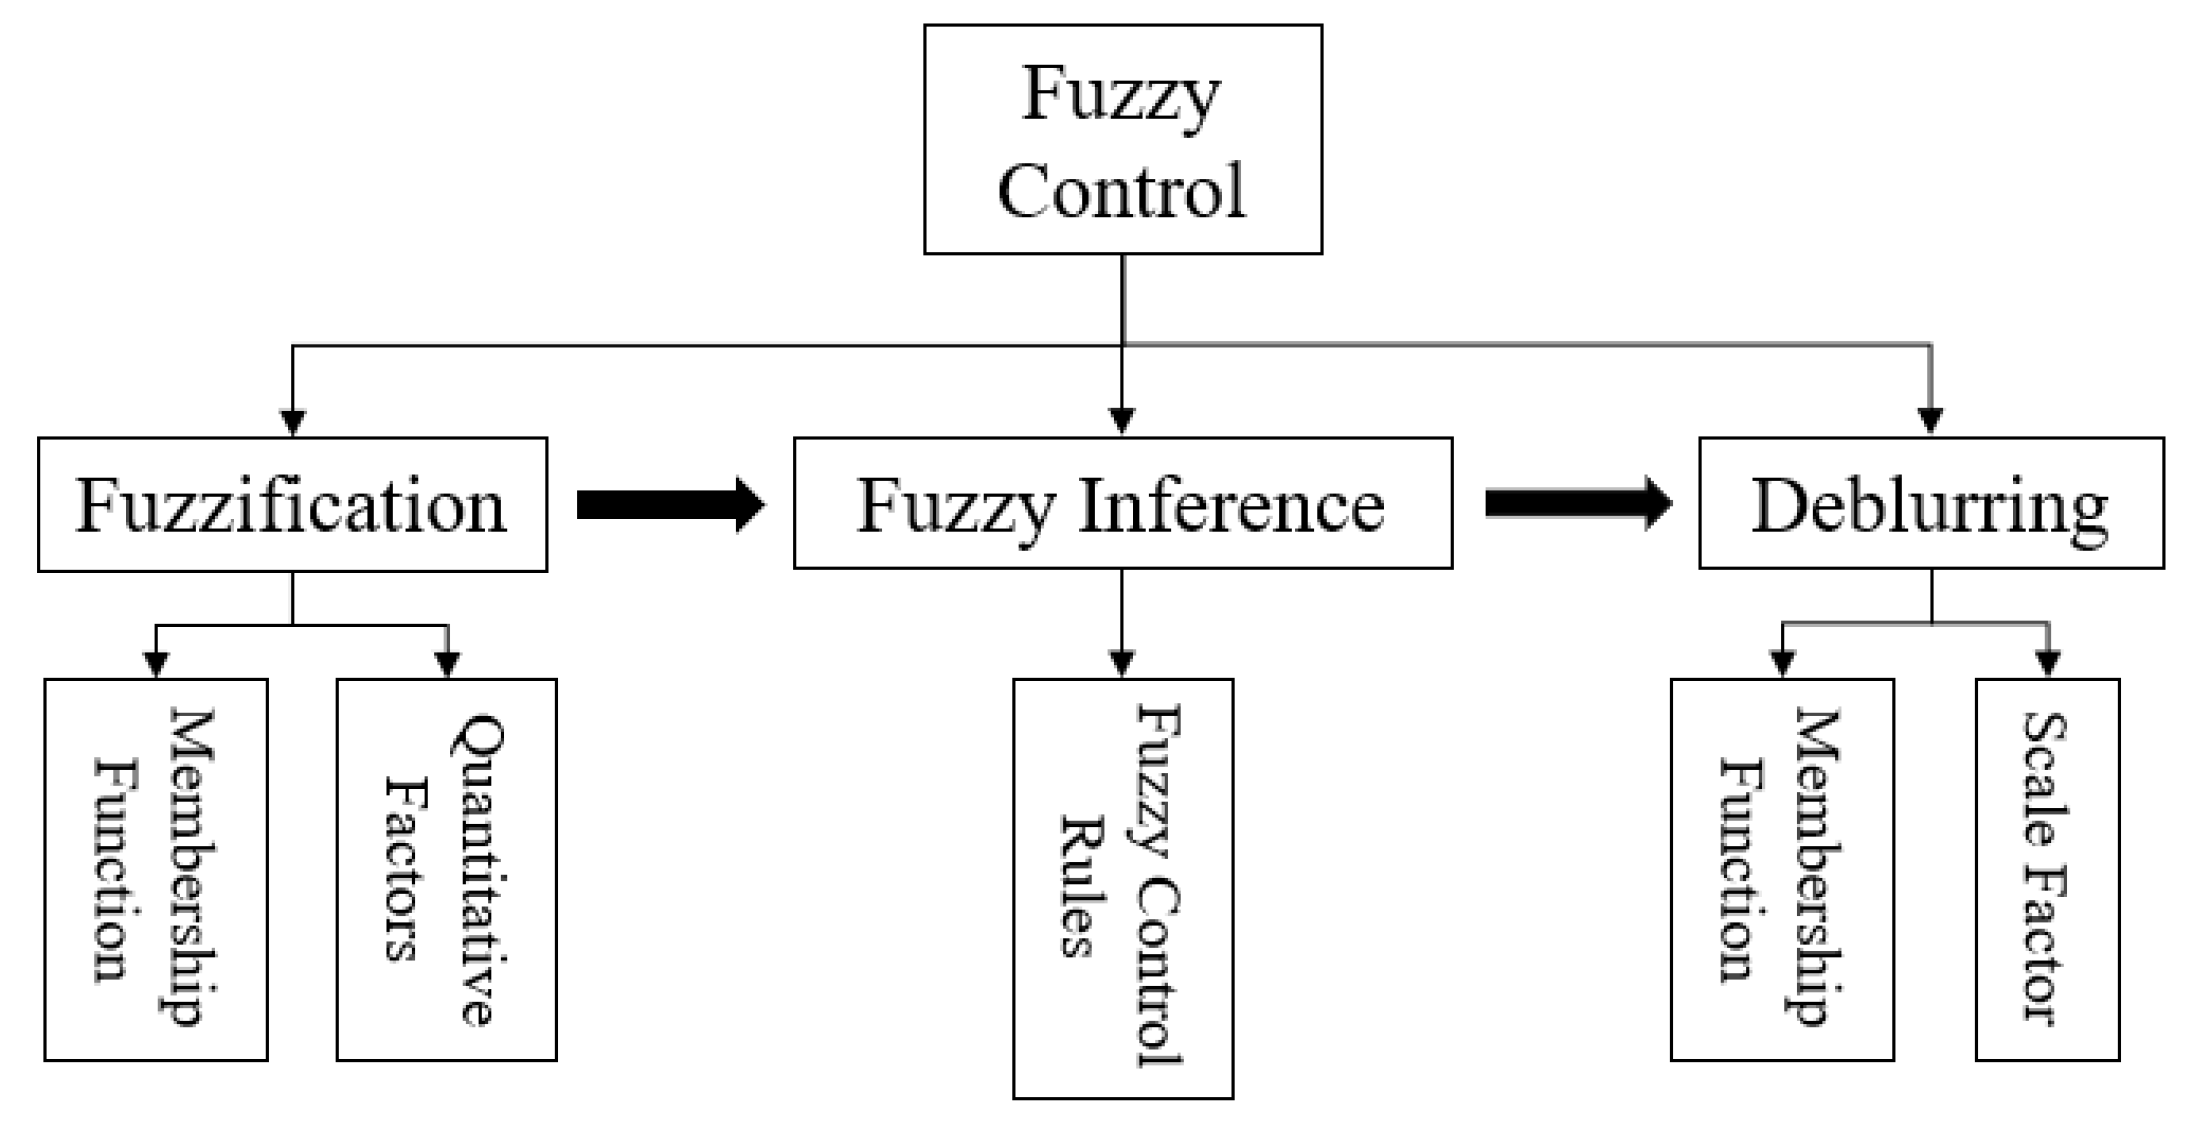
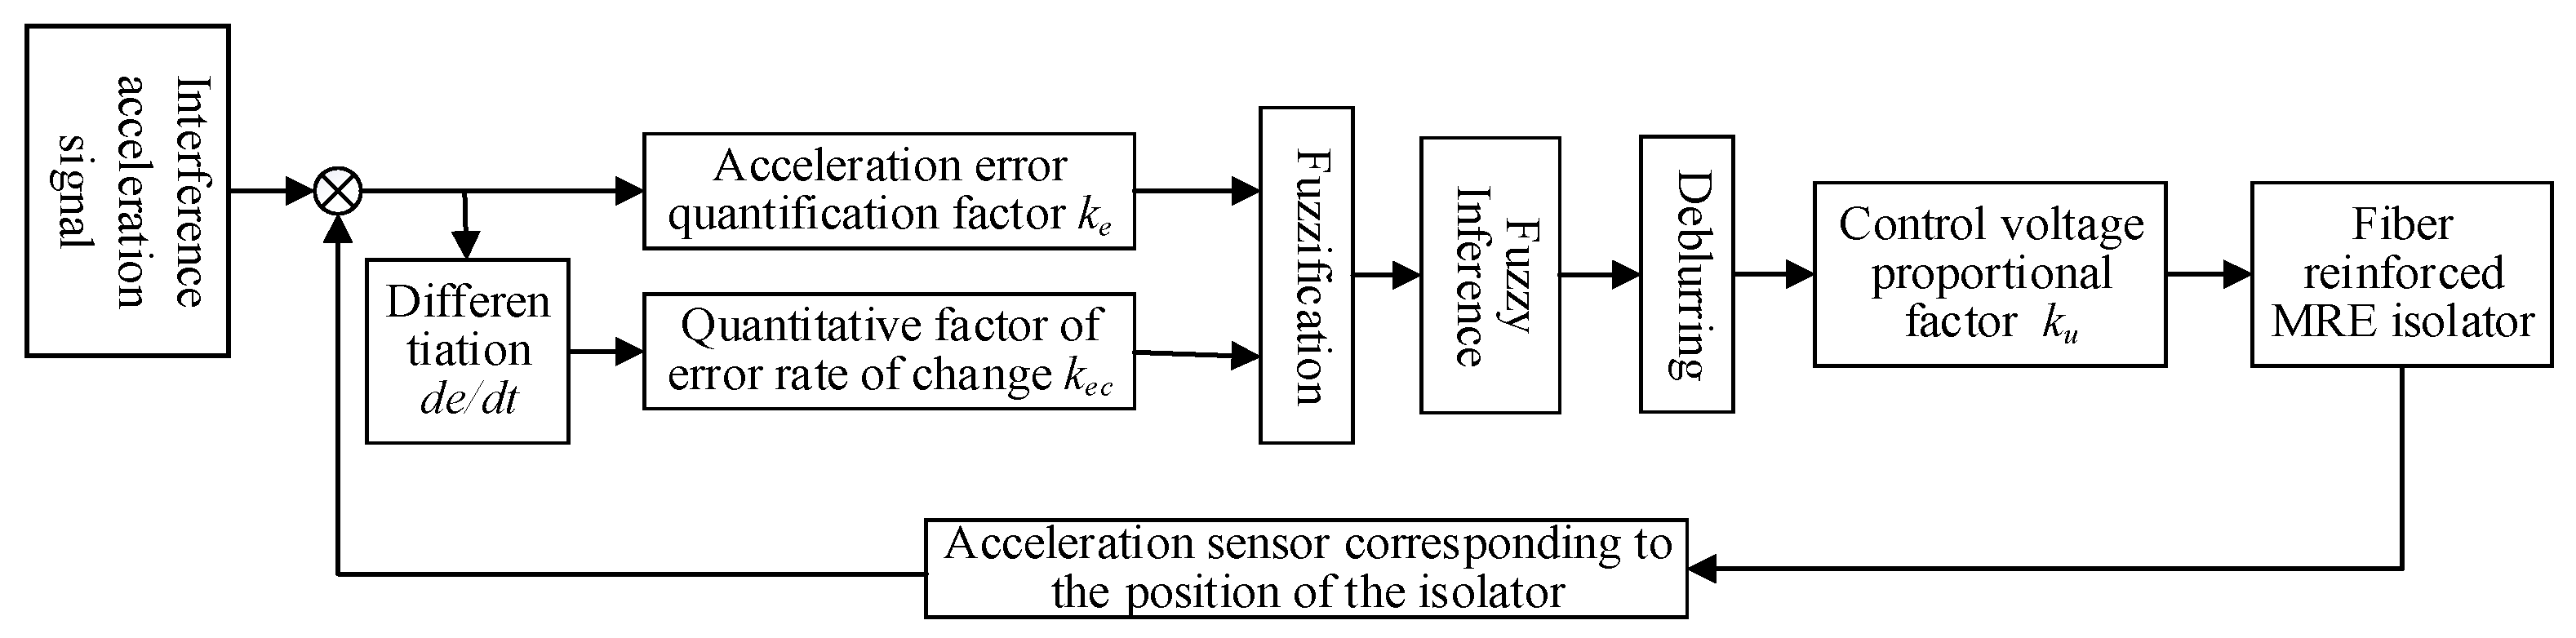
The principle of fuzzy control is illustrated in Figure 7. The implementation process of fuzzy control mainly consists of three core stages: fuzzification, fuzzy reasoning, and defuzzification, and its performance depends on the construction quality of the fuzzy knowledge base. The knowledge base mainly comprises membership functions, quantization factors, fuzzy control rules, and scaling factors. Among these, the quantization factor is responsible for discretizing input signals, while the scaling factor realizes the continuous conversion of output control signals; the two together ensure the accurate mapping of signals between the fuzzy domain and the crisp domain. As the core mathematical tool in the fuzzification and defuzzification processes, the shape and parameters of the membership functions directly determine the accuracy of the fuzzy classification of input signals. Fuzzy control rules are decision criteria constructed based on domain knowledge and control experience, while the fuzzy reasoning method is an algorithmic framework for generating decision variables based on these rules; the two together form the core of the fuzzy reasoning stage.

3.2. Fuzzy Feedback Control Model for the Fiber-Reinforced MRE Vibration Isolation System

Herein, in the field of fuzzy control, the input variables of two-dimensional controllers are often selected as error and error rate. These two components can effectively characterize the dynamic response characteristics of the output variables of the controlled object, thus being widely used in practical applications. Taking the fiber-reinforced MRE vibration isolation system as an example, the acceleration error signal e at the vibration isolation position and the rate of change (derivative) ec of the acceleration error signal are adopted as the two input variables of the fuzzy controller. The control voltage u, which can adjust the input current of the vibration isolator, is set as the output variable of the fuzzy controller. This study employs a Mamdani-type two-input single-output (TISO) fuzzy control structure, where the input variables are defined as acceleration error and acceleration error rate (denoted by symbols E, EC respectively), and the output variable is control voltage (denoted by symbol U). The fuzzy states of these three variables are each described by five fuzzy subsets, specifically Positive Big (PB), Positive Small (PS), Zero (ZE), Negative Small (NS), and Negative Big (NB). During the domain transformation process, the quantization factors for acceleration error and acceleration error rate are set as Ke and Kec respectively, while the scaling factor for the output control voltage is set as Ku. In the defuzzification stage following fuzzy reasoning, the centroid method is selected as the defuzzification strategy. In addition, to ensure the simplicity and practicality of membership degree calculation for fuzzy variables, triangular membership functions are adopted for E, EC, and U. Meanwhile, this study establishes fuzzy control rules using if-then conditional statements, as presented in Table 1. Based on the above configurations, the fuzzy controller for the fiber-reinforced MRE vibration isolator is illustrated in Figure 8.
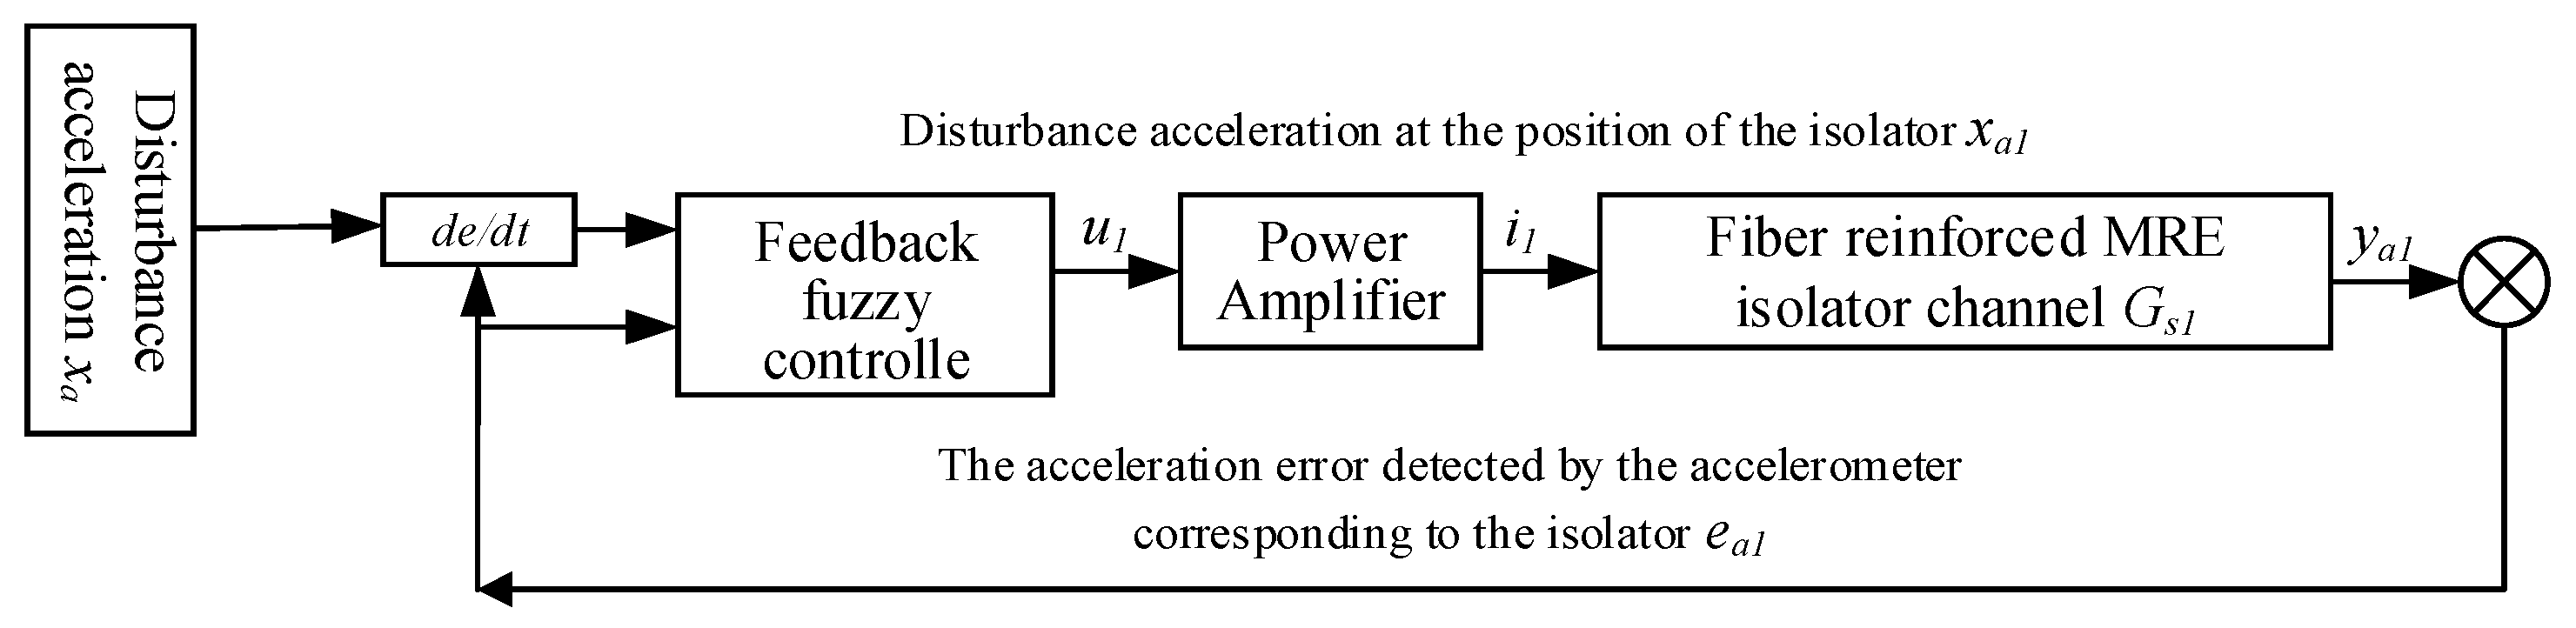
The feedback fuzzy control system model for the fiber-reinforced MRE vibration isolator is illustrated in Figure 9. The acceleration error signal measured by the acceleration sensor corresponding to each vibration isolator serves as the input signal of the controller, while the voltage signal is adopted as the control output. Subsequently, the voltage signal is converted into the control current signal of the vibration isolator through a power amplifier.

3.3. Simulation Analysis of Fuzzy Feedback Control for the Fiber-Reinforced MRE Vibration Isolation System

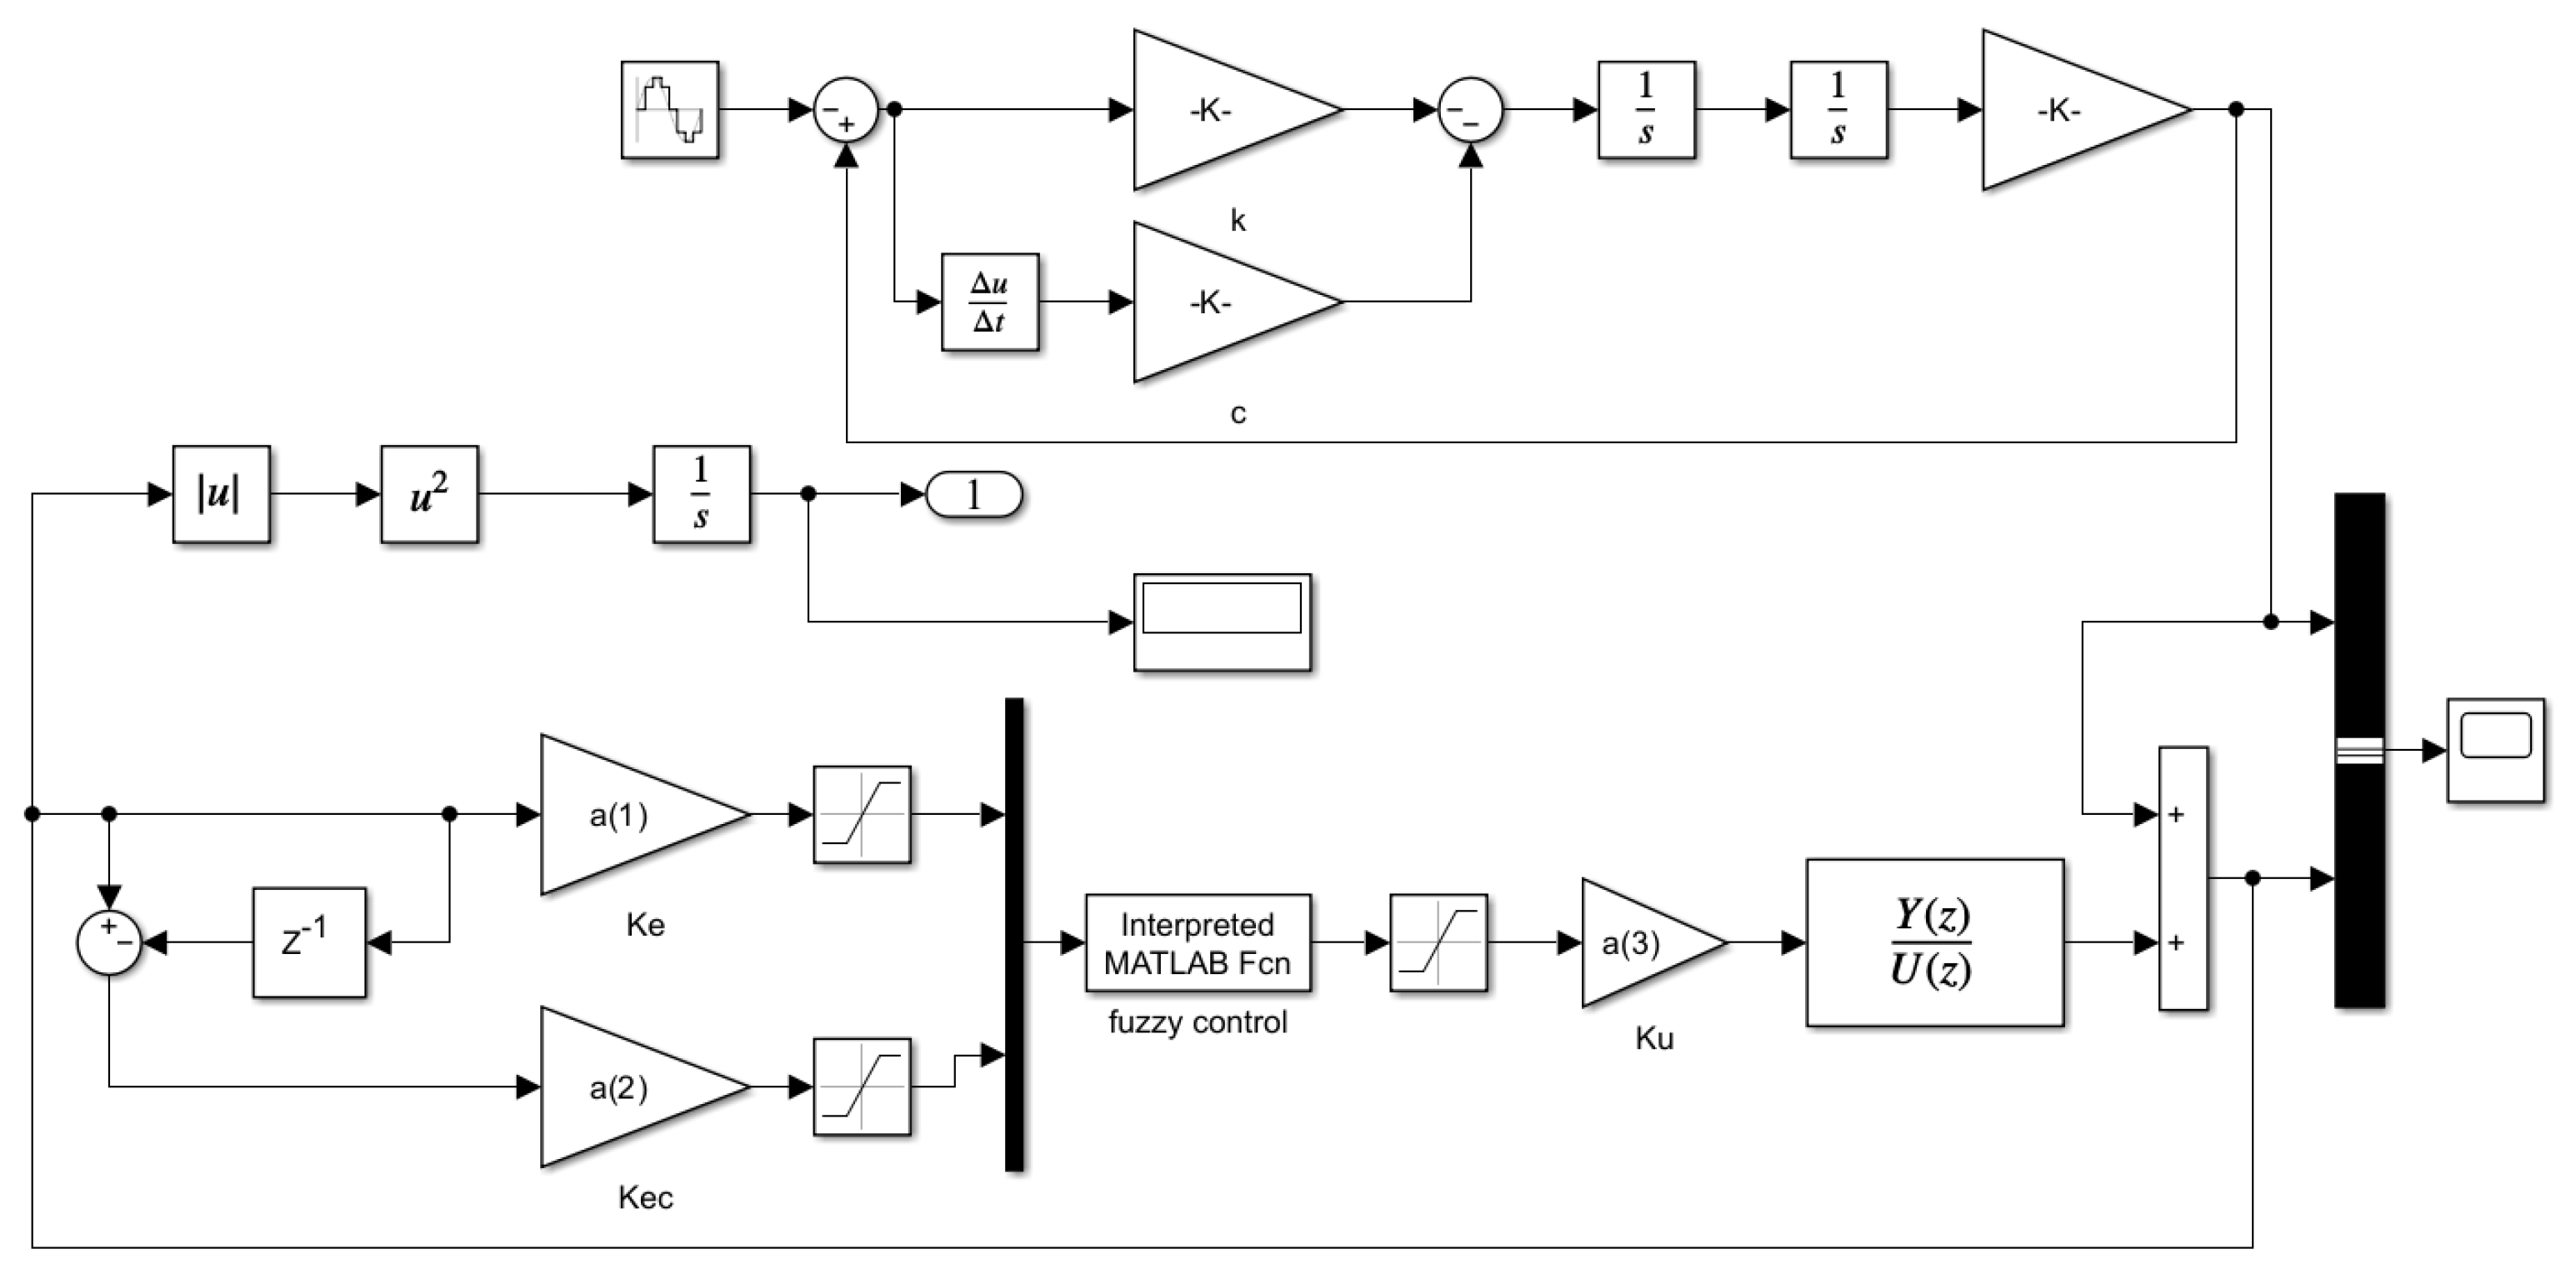
The vibration signal generated by the large-scale marine hydraulic pipeline system under sinusoidal excitation is a periodic sinusoidal disturbance. Herein, an electromagnetic exciter is used to excite the pipeline bearing platform to simulate the periodic sinusoidal disturbance of the pipeline. The vibration reduction effect of the fiber-reinforced MRE vibration isolator under different excitation frequencies is analyzed, and the vibration isolation effect is evaluated by the amplitude variation in the acceleration signal before and after control. A fuzzy control simulation model is established using the Simulink module built in MATLAB software (Matlab R2022b version). The simulation is carried out with sinusoidal excitation signals with an amplitude of 1 m/s2 and excitation frequencies of 25 Hz, 30 Hz, and 35 Hz for the acceleration signal, with a sampling time of 1/750 s and a simulation duration of 2.5 s. The simulation block diagram established in the Simulink module is illustrated in Figure 10.
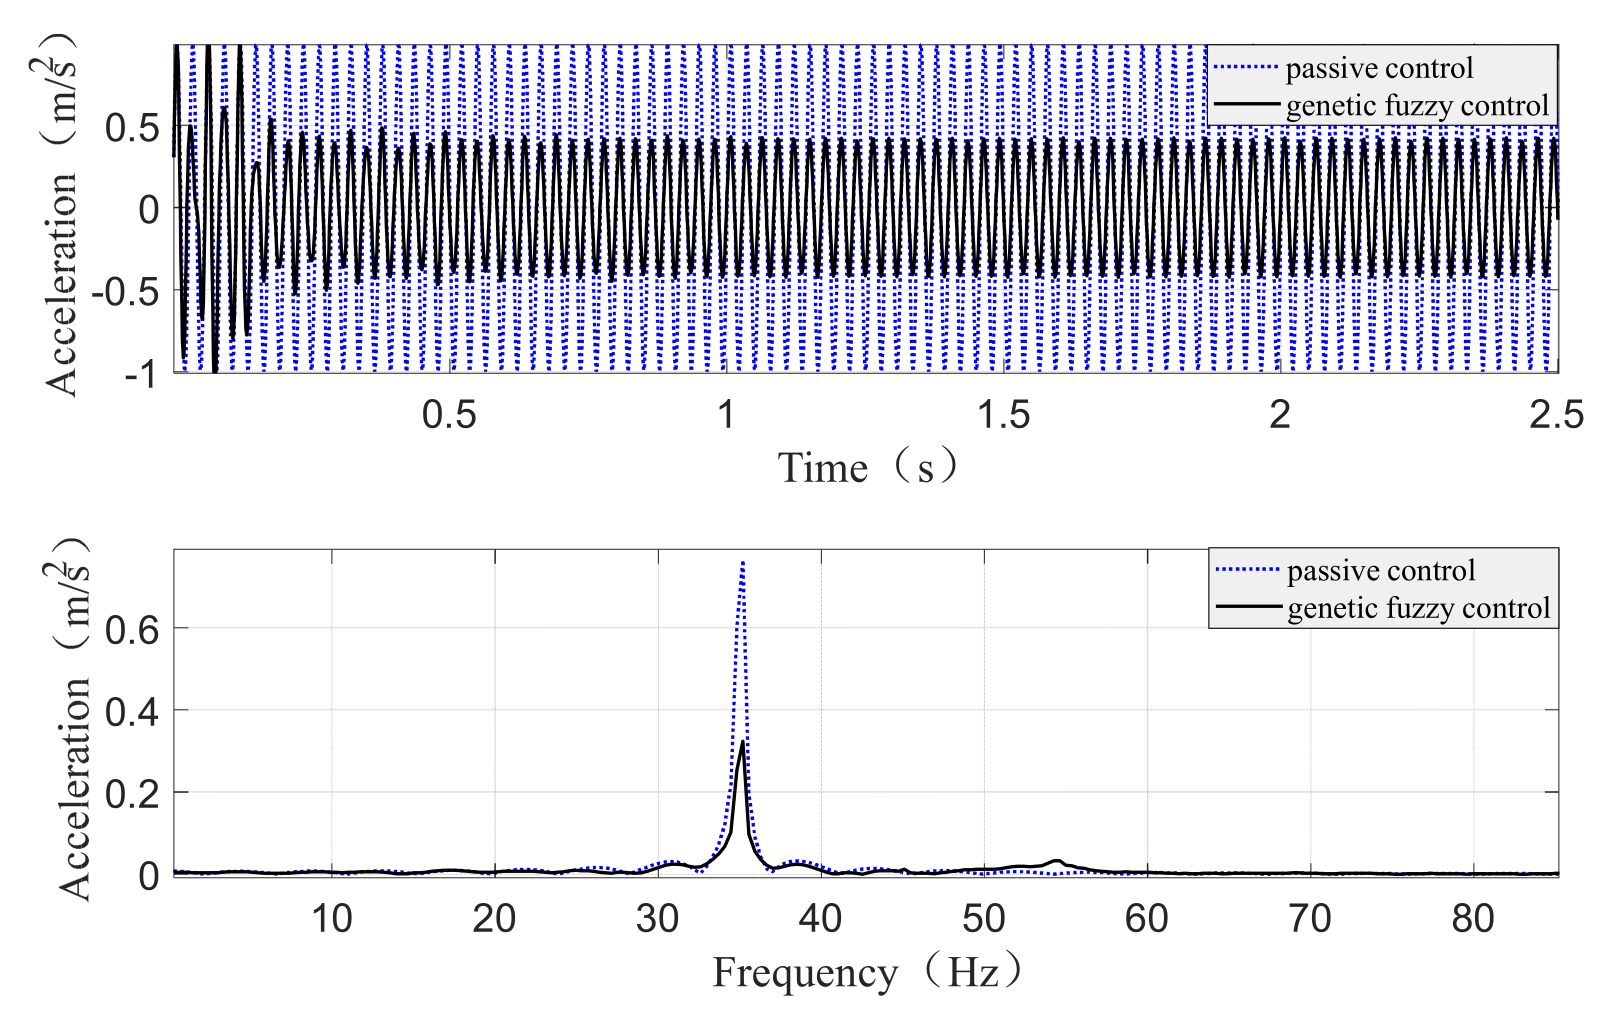
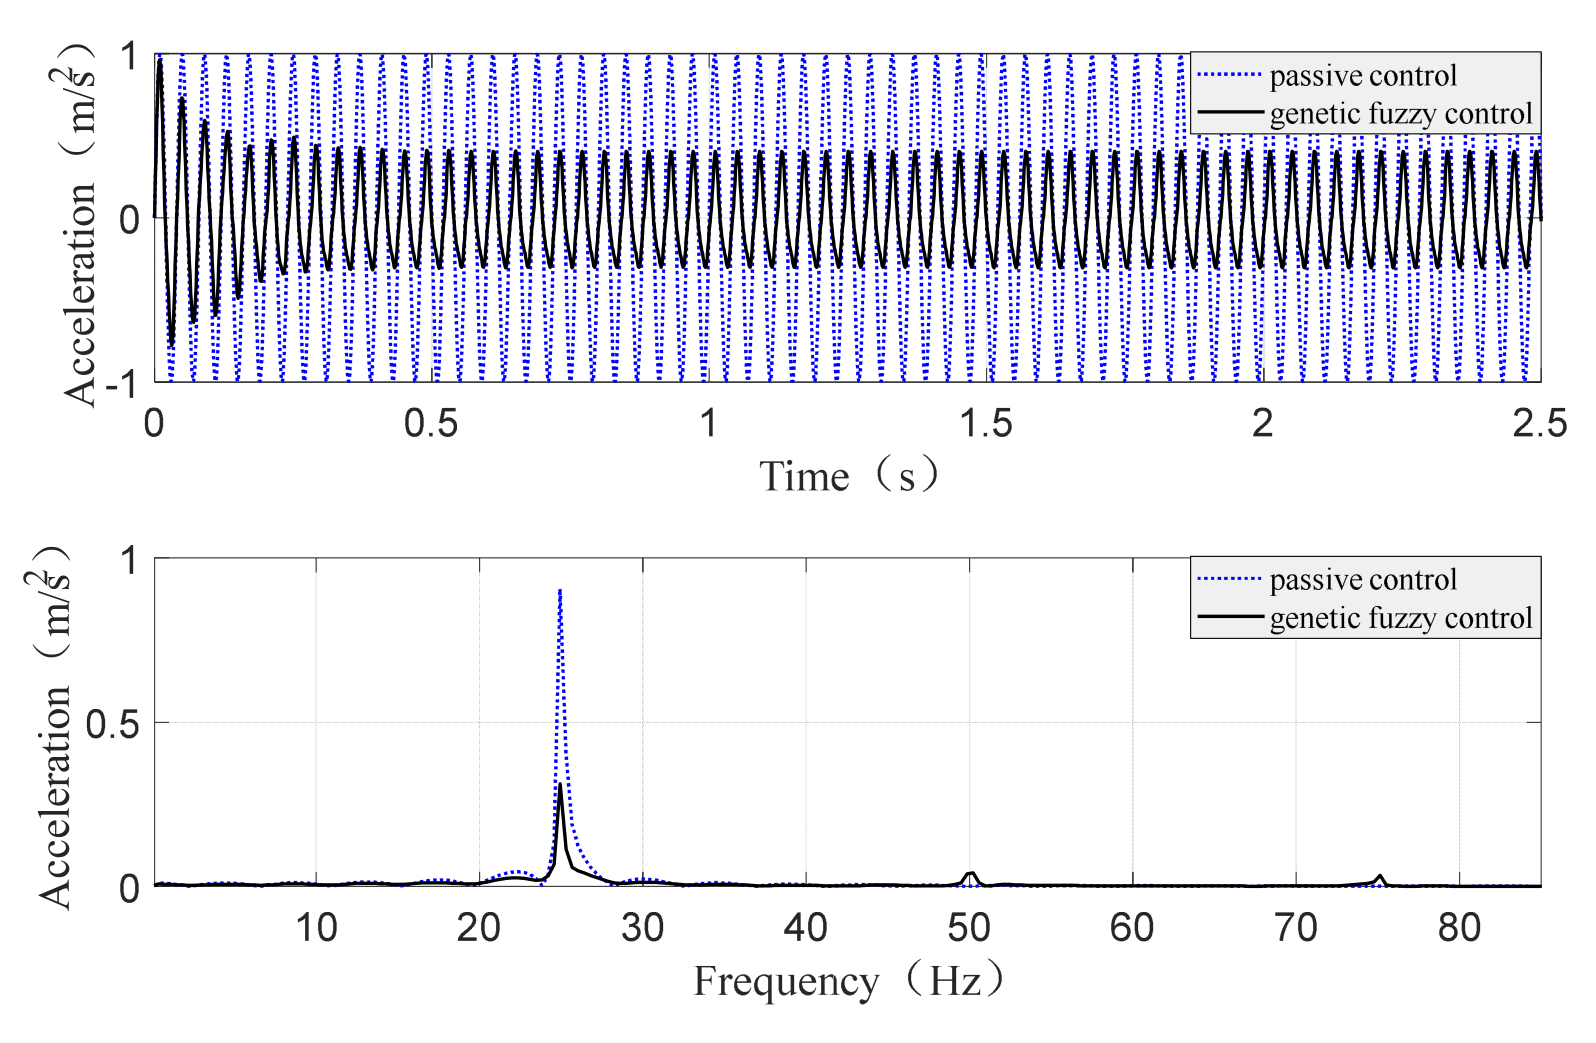
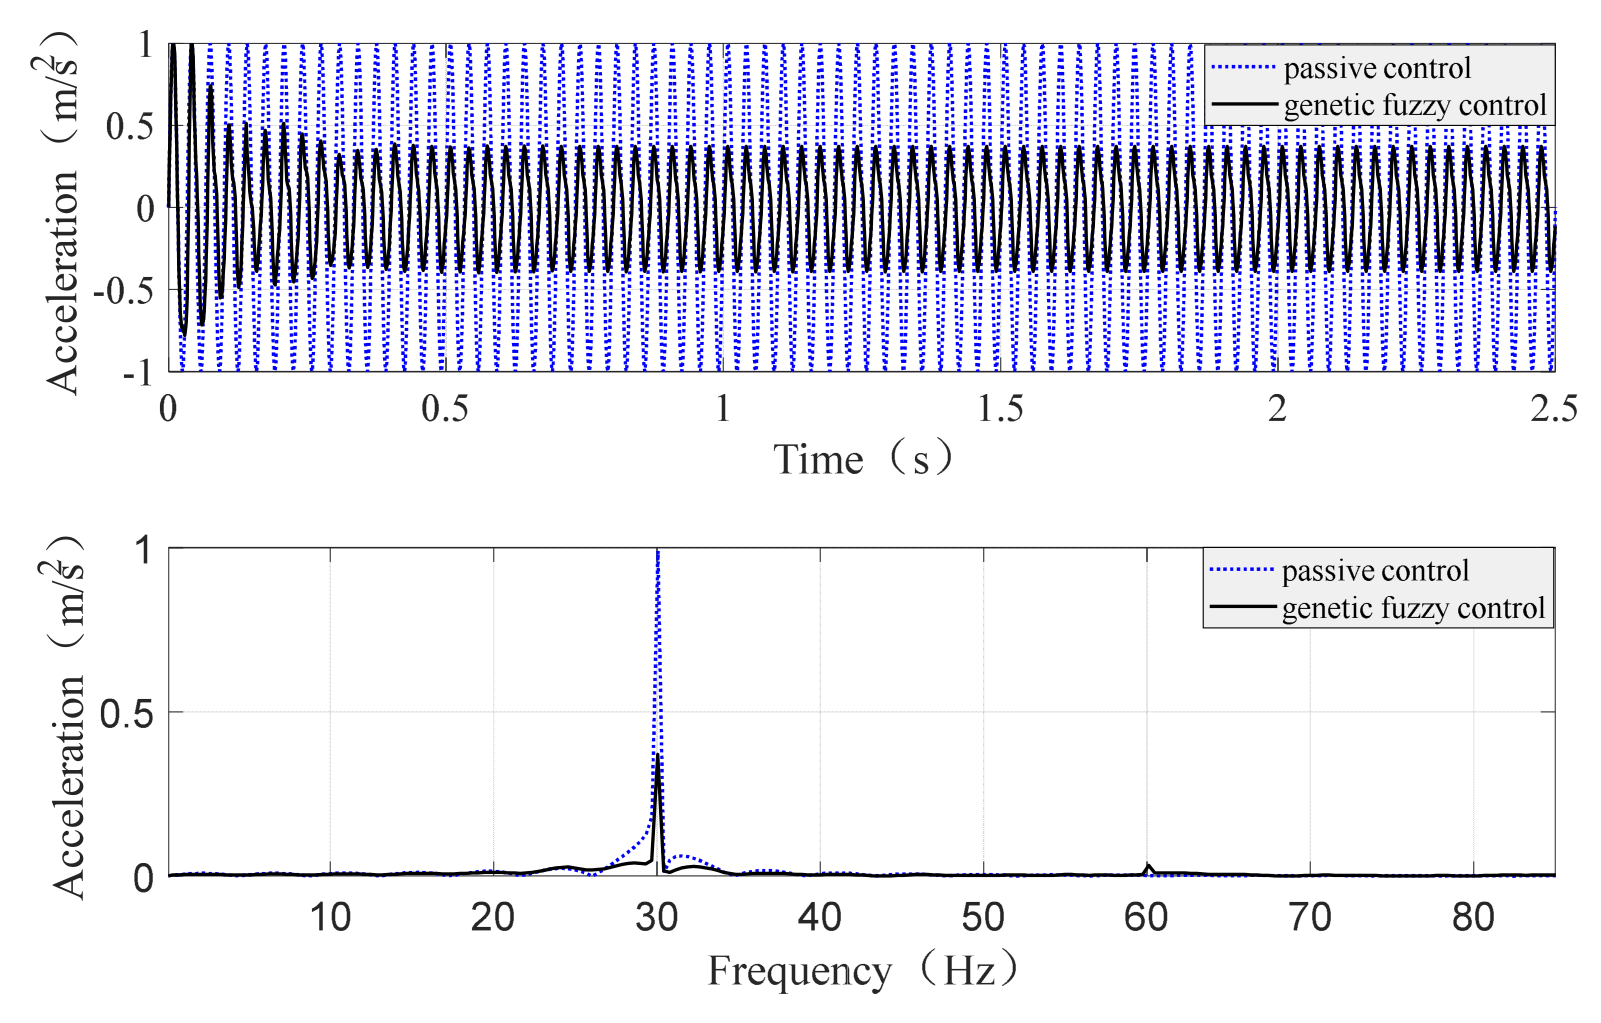
In Figure 10, E denotes the error signal, representing the acceleration value collected by the acceleration sensor; ISE is the fitness function, FLC refers to the conventional fuzzy controller, Ke and Kec are quantization factors, Ku is the scaling factor, and Saturation represents the saturation module. A single-input single-output (SISO) control simulation was conducted with this conventional fuzzy controller as the core, and the simulation results are presented in Figure 11, Figure 12 and Figure 13. All these figures adopt a presentation structure of “the upper diagram for the time domain and the lower diagram for the frequency domain”. Specifically, the upper diagram is the time-domain diagram of the error signal, where the vertical axis represents the response amplitude of the error signal and the horizontal axis represents time; the dashed line corresponds to the response curve of the error signal before control, while the solid line corresponds to that after control by the conventional fuzzy controller. The lower diagram is the frequency-domain diagram of the error signal, where the vertical axis represents the amplitude of the error signal and the horizontal axis represents frequency, with the curve labeling rules consistent with those of the upper diagram.
There are deviations in the amplitude of the discrete frequency spectrum in Figure 11, Figure 12 and Figure 13, and the errors in discrete frequency spectrum analysis mainly stem from two factors: the first is time-domain windowing truncation and frequency-domain discretization processing—when the signal fails to meet the periodic sampling condition, deviations will occur in the analysis results; the second is frequency interference between multi-frequency signals. Among these, the effect of window truncation will broaden a single spectral line of an infinite-length single-frequency signal in the time domain into continuous spectral lines in the frequency domain. Taking the rectangular window as an example, these continuous spectral lines follow a sinc-type function distribution, with the peak frequency corresponding to the actual frequency of the single-frequency signal. This process will cause frequency leakage, leading to the deviation of the amplitude of the single-frequency signal at the corresponding frequency from the true value. To address this issue, more accurate frequency amplitudes can be obtained by correcting various parameters of the discrete frequency spectrum analysis. It should be noted that this study takes the variation in vibration acceleration amplitude before and after control as the evaluation criterion for the vibration isolation effect, without focusing on the actual numerical value of acceleration; if the relative errors between the time-domain fluctuation amplitude and the dominant frequency amplitude are at a similar level, and the acceleration signals before and after control undergo FFT transformation under the same conditions, the errors generated during the numerical processing can be neglected.
It can be observed from Figure 11 that, in the time-domain diagram, the fluctuation amplitude of the error signal is reduced from 1.00 m/s2 before control to 0.5075 m/s2 after control, a reduction of nearly 50%. Meanwhile, in the frequency-domain diagram, due to the deviations in the amplitude of the discrete frequency spectrum mentioned earlier, the error signal amplitude is smaller than the preset value (1 m/s2) at the initial detection, being approximately 0.92 m/s2 with an attenuation of nearly 8%. After vibration reduction by the fiber-reinforced MRE vibration isolator under genetic fuzzy control, the response amplitude of the error signal E is reduced from 0.92 m/s2 to 0.4 m/s2, representing an amplitude reduction of 56.5%.
It can be observed from the time-domain diagram of Figure 12 that the fluctuation amplitude of the error signal is significantly reduced after control, decreasing from 1.00 m/s2 before control to 0.66 m/s2 after control, with a reduction of nearly 35%. Combined with the analysis of its frequency-domain diagram, at the dominant frequency of 30 Hz, the response amplitude of the error signal also shows a significant downward trend, which is reduced from 0.99 m/s2 before control to 0.6 m/s2 after control, representing an amplitude reduction ratio of 39.3%.
It can be observed from Figure 13 that the fluctuation amplitude of the error signal is effectively suppressed, decreasing from 1.00 m/s2 before control to 0.59 m/s2 after control, with a reduction of nearly 40%. Meanwhile, as indicated in the frequency-domain diagram, due to the deviations in the amplitude of the discrete frequency spectrum mentioned earlier, the error signal amplitude is smaller than the preset value (1 m/s2) at the initial detection, being approximately 0.77 m/s2 with an attenuation of nearly 23%. After vibration reduction by the fiber-reinforced MRE vibration isolator under genetic fuzzy control, the response amplitude of the error signal E is reduced from 0.77 m/s2 to 0.42 m/s2, representing an amplitude reduction of 48%.

4. Experimental Analysis of the Fiber-Reinforced MRE Vibration Isolation System

Based on the fiber-reinforced MRE vibration isolator designed above, an experimental platform for the large-scale marine hydraulic pipeline system is established to verify the vibration reduction effect of the fiber-reinforced MRE vibration isolator under the working conditions of single-frequency disturbance and no external excitation. The evaluation of the vibration isolation effect is represented by the vibration transmissibility T:
T = 20 log 10 a o u t a i n p u t

4.1. Fuzzy Control Experiment Under Single-Frequency Disturbance

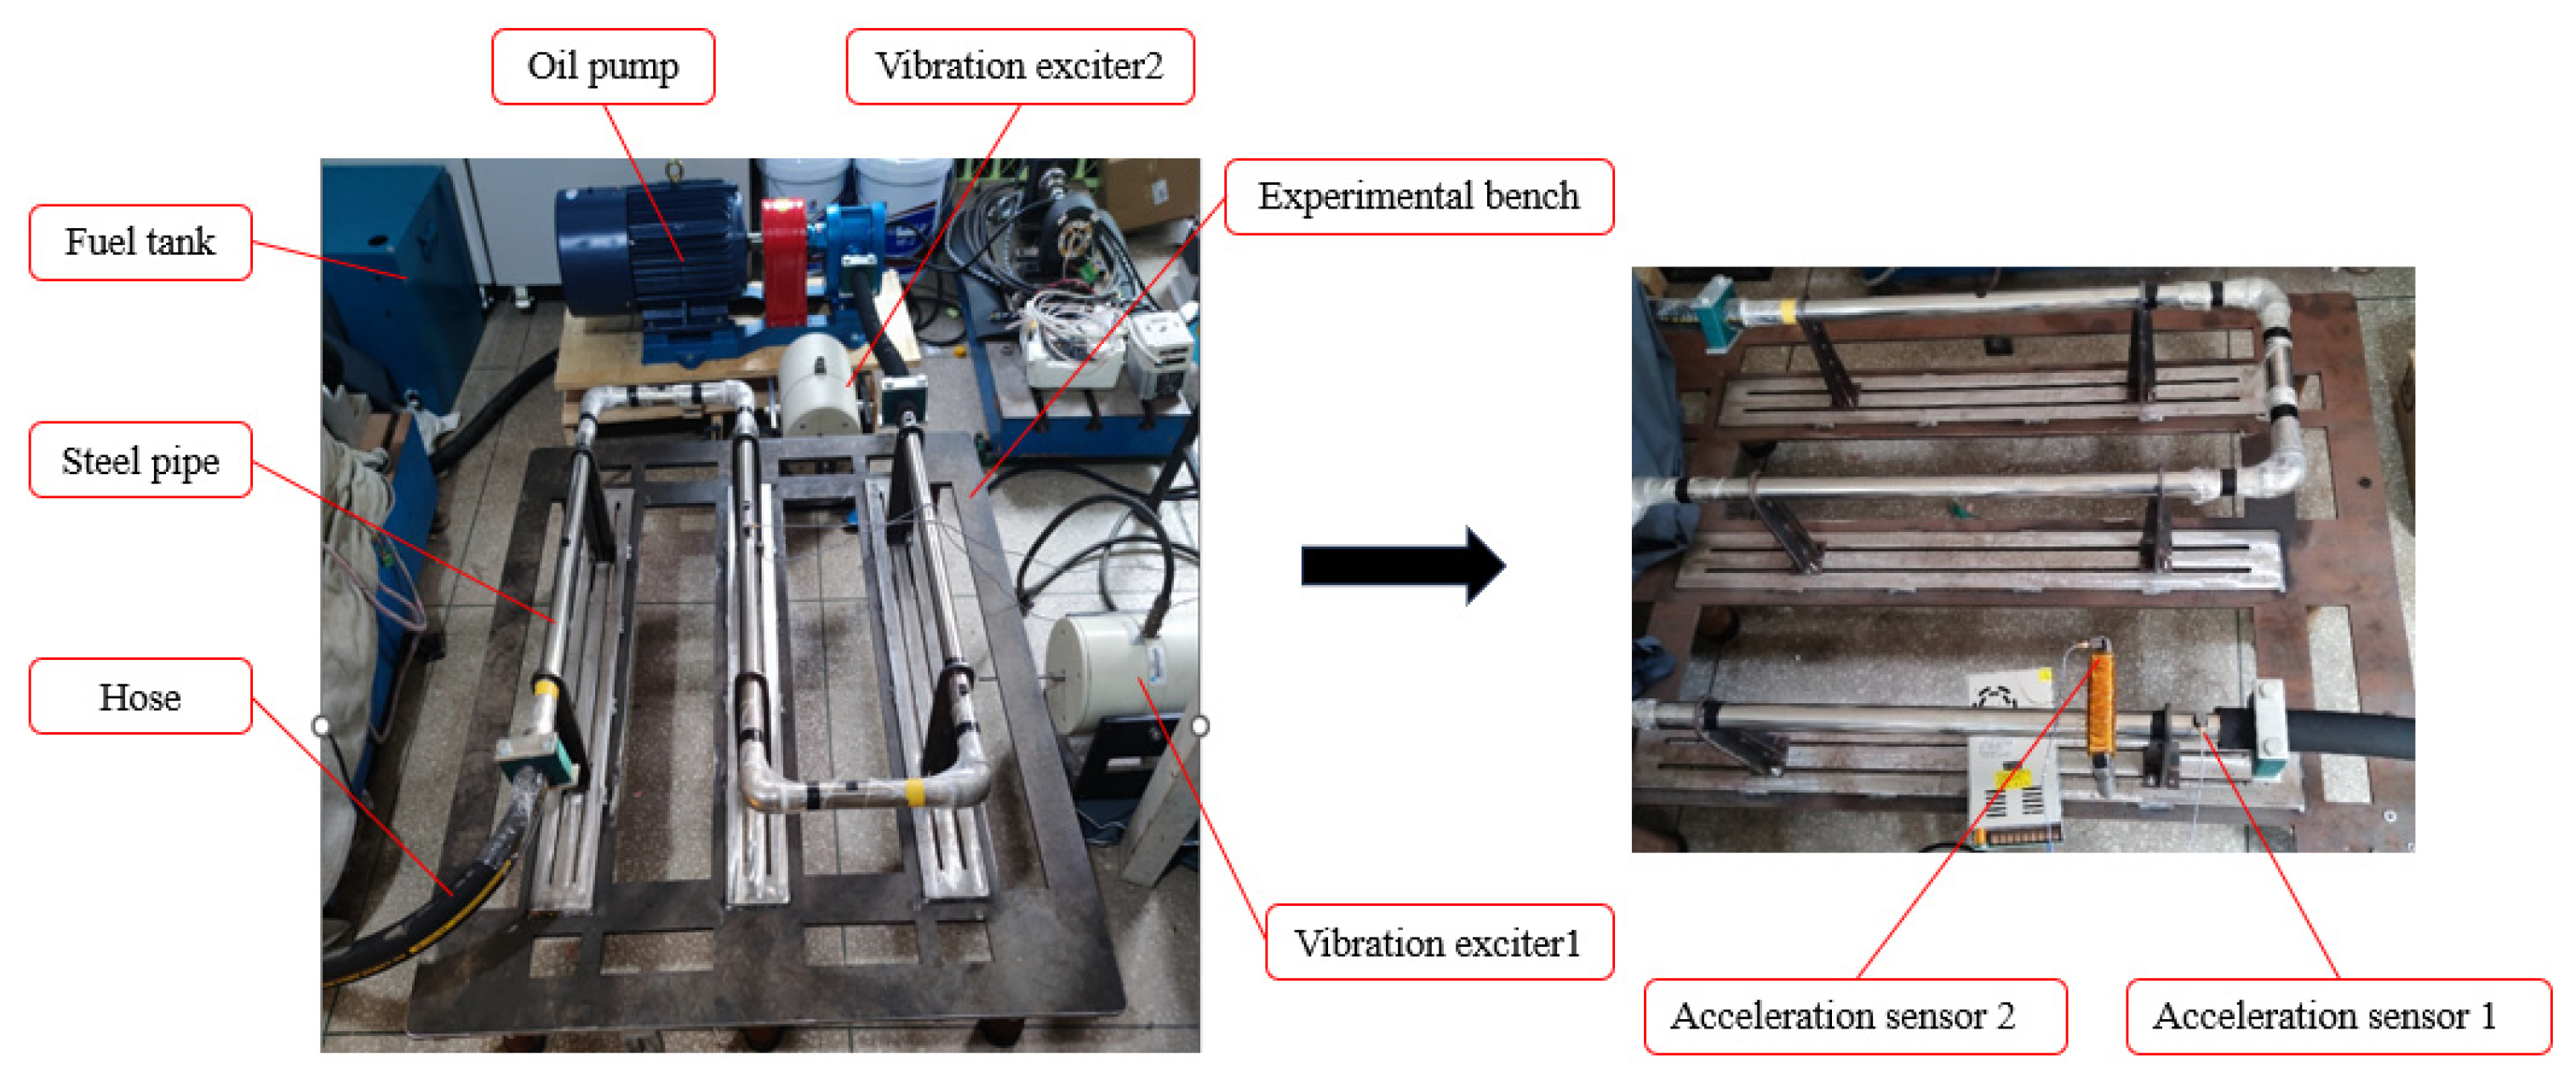
The layout of the single-frequency disturbance fuzzy control experimental platform is shown in Figure 14, mainly including the experimental platform base, electromagnetic exciter 1, electromagnetic exciter 2, gear-type hydraulic oil pump, oil tank, steel pipe and hose. This simplified mechanical pipeline experimental system can effectively characterize and verify the core characteristics of ship servo pipeline systems to a certain extent. This type of simplified design is also a commonly used paradigm in academic research and engineering verification related to pipeline vibration. The basic units of the system configuration, such as hydraulic oil tank, oil pump, stainless steel pipeline, and flexible hose, can simulate typical working conditions such as basic medium transportation and fluid pulsation in the hydraulic pipeline of ship servo control. The matched electromagnetic exciter can also reproduce core vibration input scenarios such as pump-source vibration and base environment excitation experienced by ship pipelines. The basic pipeline unit composed of straight pipes, bent pipes, and flexible pipes is the core foundation of the complex pipeline system of ships. Based on the relevant experiments carried out by this system, it can provide valuable experimental support for the analysis of vibration characteristics and verification of vibration control strategies of ship pipelines, without the need to replicate the complex layout of ship pipelines. It can also achieve a certain degree of equivalent mapping in the core research dimensions. The fiber-reinforced MRE isolator is fixed at the input end of the pipeline with bolts, and the experimental platform base is connected to the electromagnetic exciter through a screw. Single-frequency sine excitation interference of 25 Hz, 30 Hz, and 35 Hz is excited by the electromagnetic exciter. Two acceleration sensors are attached to the upper surface of the fiber-reinforced MRE isolator and the pipeline to collect the acceleration vibration signals before and after isolation. The connection of other equipment is referred to in reference [31].
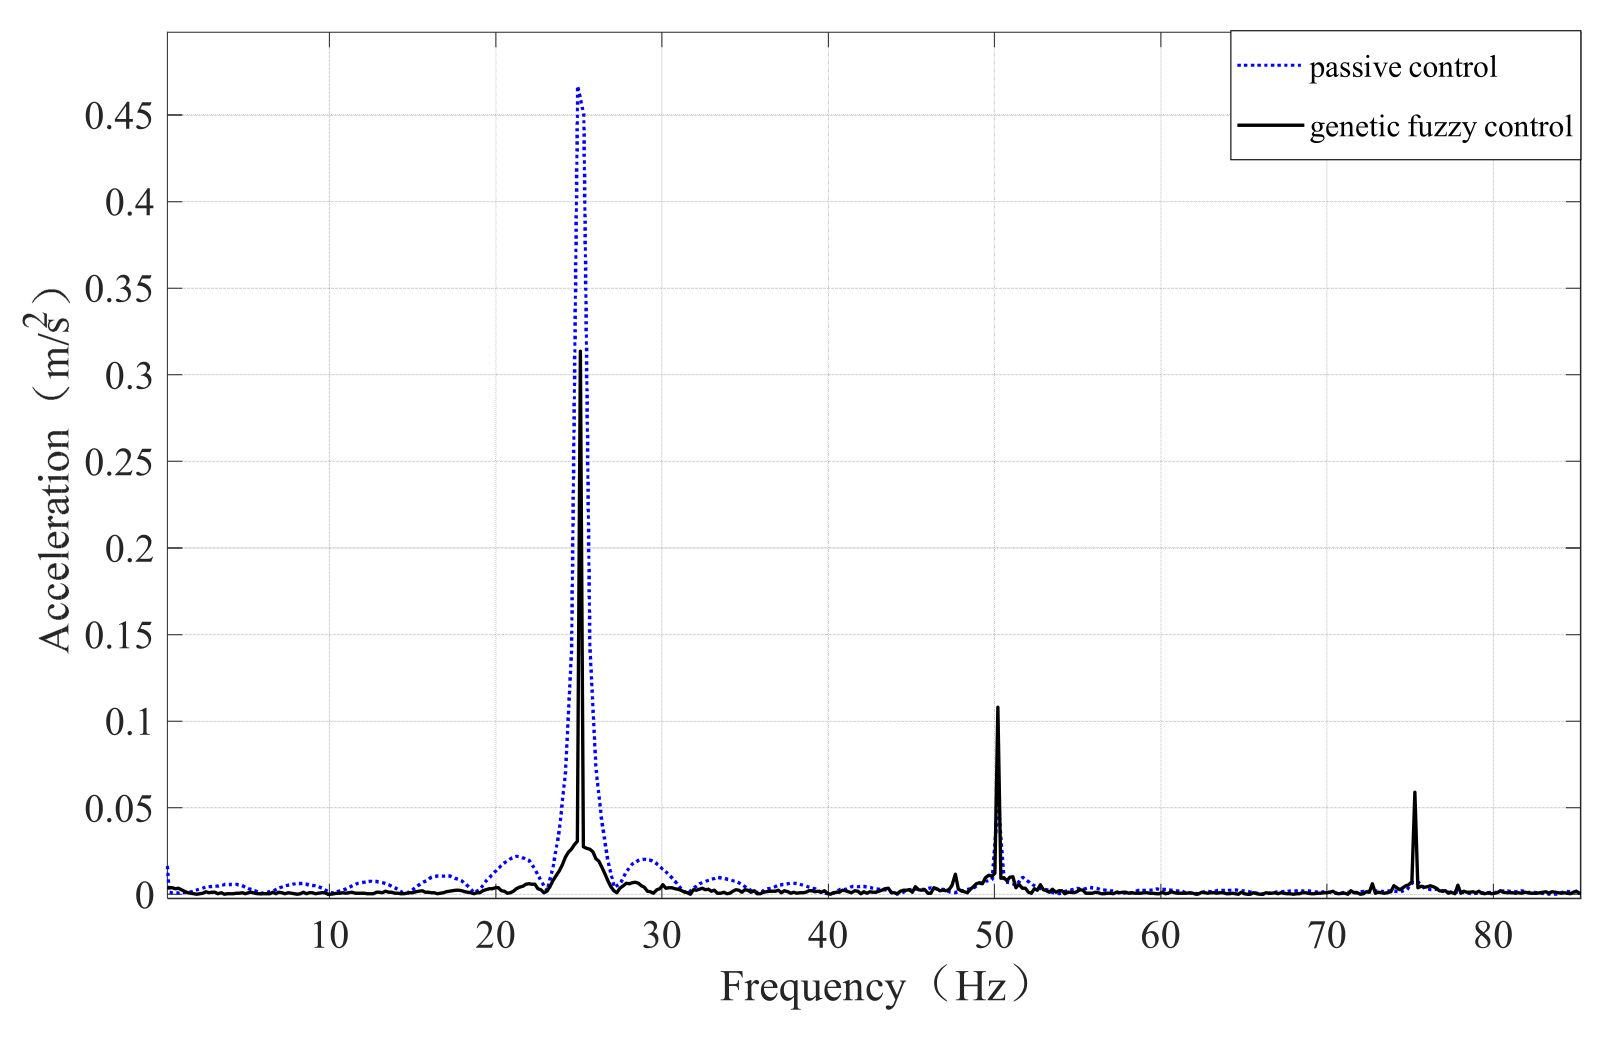
The HBK system was used to control the electromagnetic exciter via a power amplifier to generate sinusoidal waveforms with frequencies of 25 Hz, 30 Hz, and 35 Hz in sequence, with the amplitude of the sinusoidal waveforms set to 1 m/s2. The acceleration amplitudes on the surface of the pipeline and the surface of the fiber-reinforced MRE vibration isolator were measured using the installed acceleration sensors, yielding complete time-frequency data. The collected time-frequency data were then imported into MATLAB software and processed via Fast Fourier Transform (FFT) to obtain vibration amplitude-frequency curves. The amplitude-frequency vibration curves corresponding to the three excitation frequencies are illustrated in Figure 15, Figure 16 and Figure 17.
It can be observed from Figure 15 that under the excitation of a sinusoidal wave with a frequency of 25 Hz and an amplitude of 1 m/s2 generated by the electromagnetic exciter, the acceleration measured by the acceleration sensor on the pipeline surface is approximately 0.46 m/s2, showing a significant decrease compared with the preset excitation amplitude of 1 m/s2. This indicates that the base of the experimental platform for the large-scale marine hydraulic pipeline system exhibits a certain passive vibration reduction effect at 25 Hz, resulting in the attenuation of the vibration generated by the electromagnetic exciter during its transmission to the pipeline surface, with an attenuation rate exceeding 50%. After the action of the fiber-reinforced MRE vibration isolator under the genetic fuzzy control strategy, the vibration amplitude is reduced from 0.46 m/s2 to 0.31 m/s2, representing a reduction of approximately 32%.
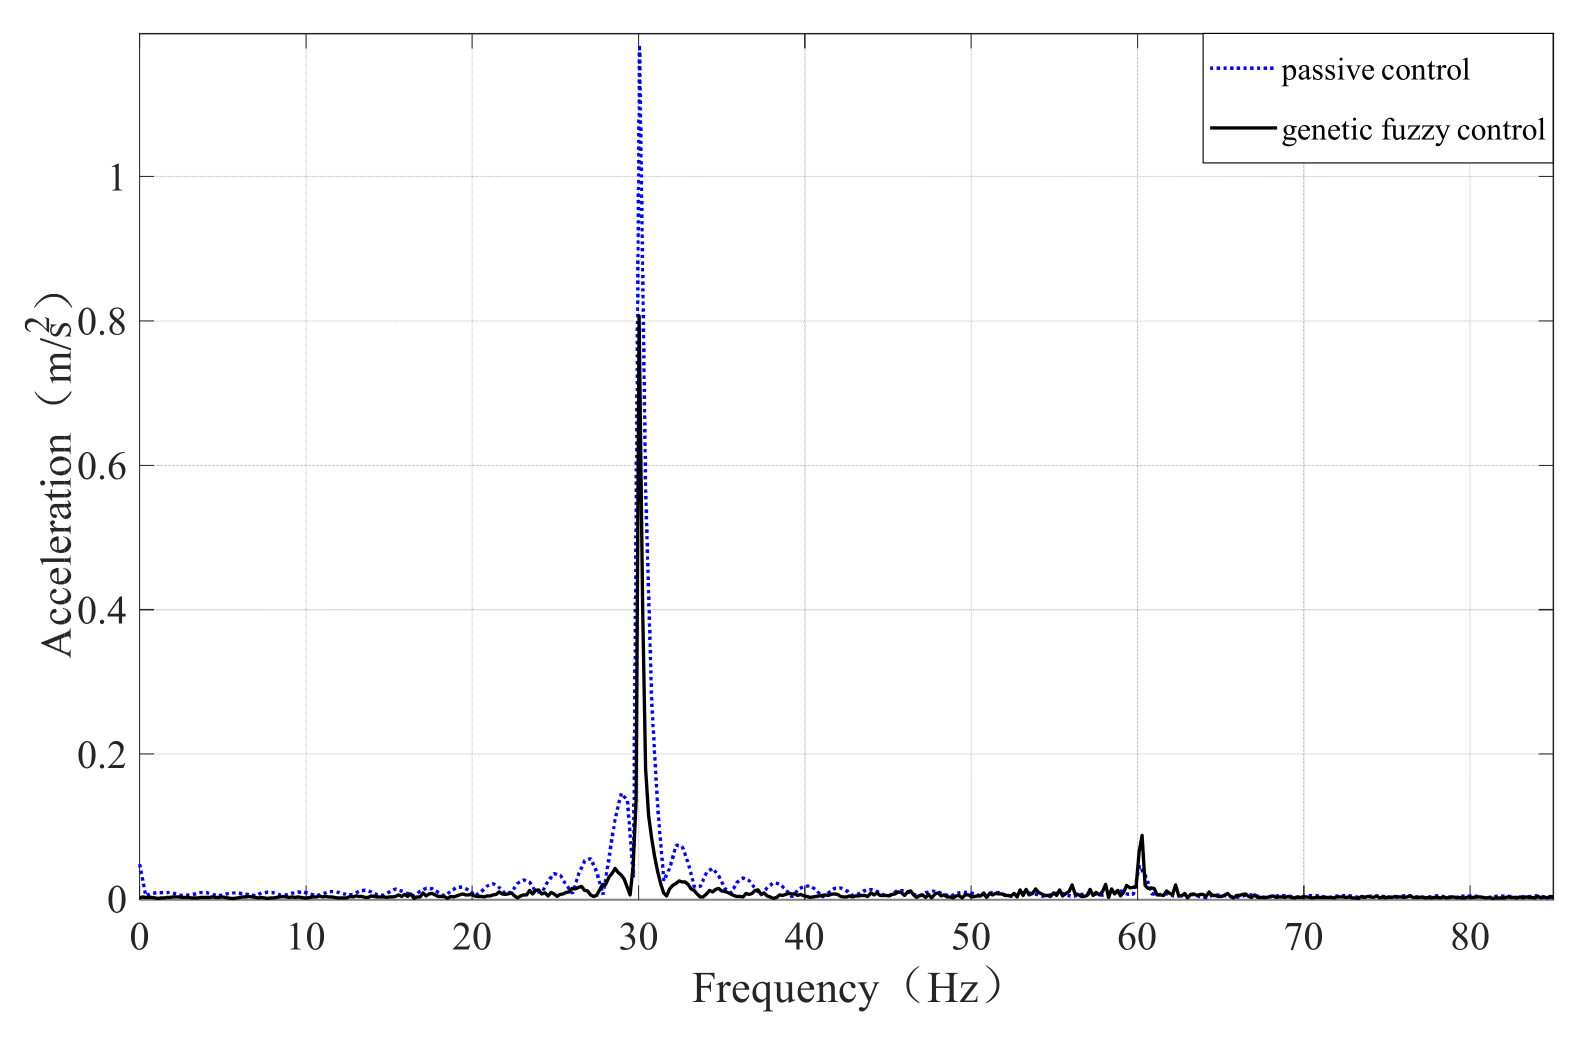
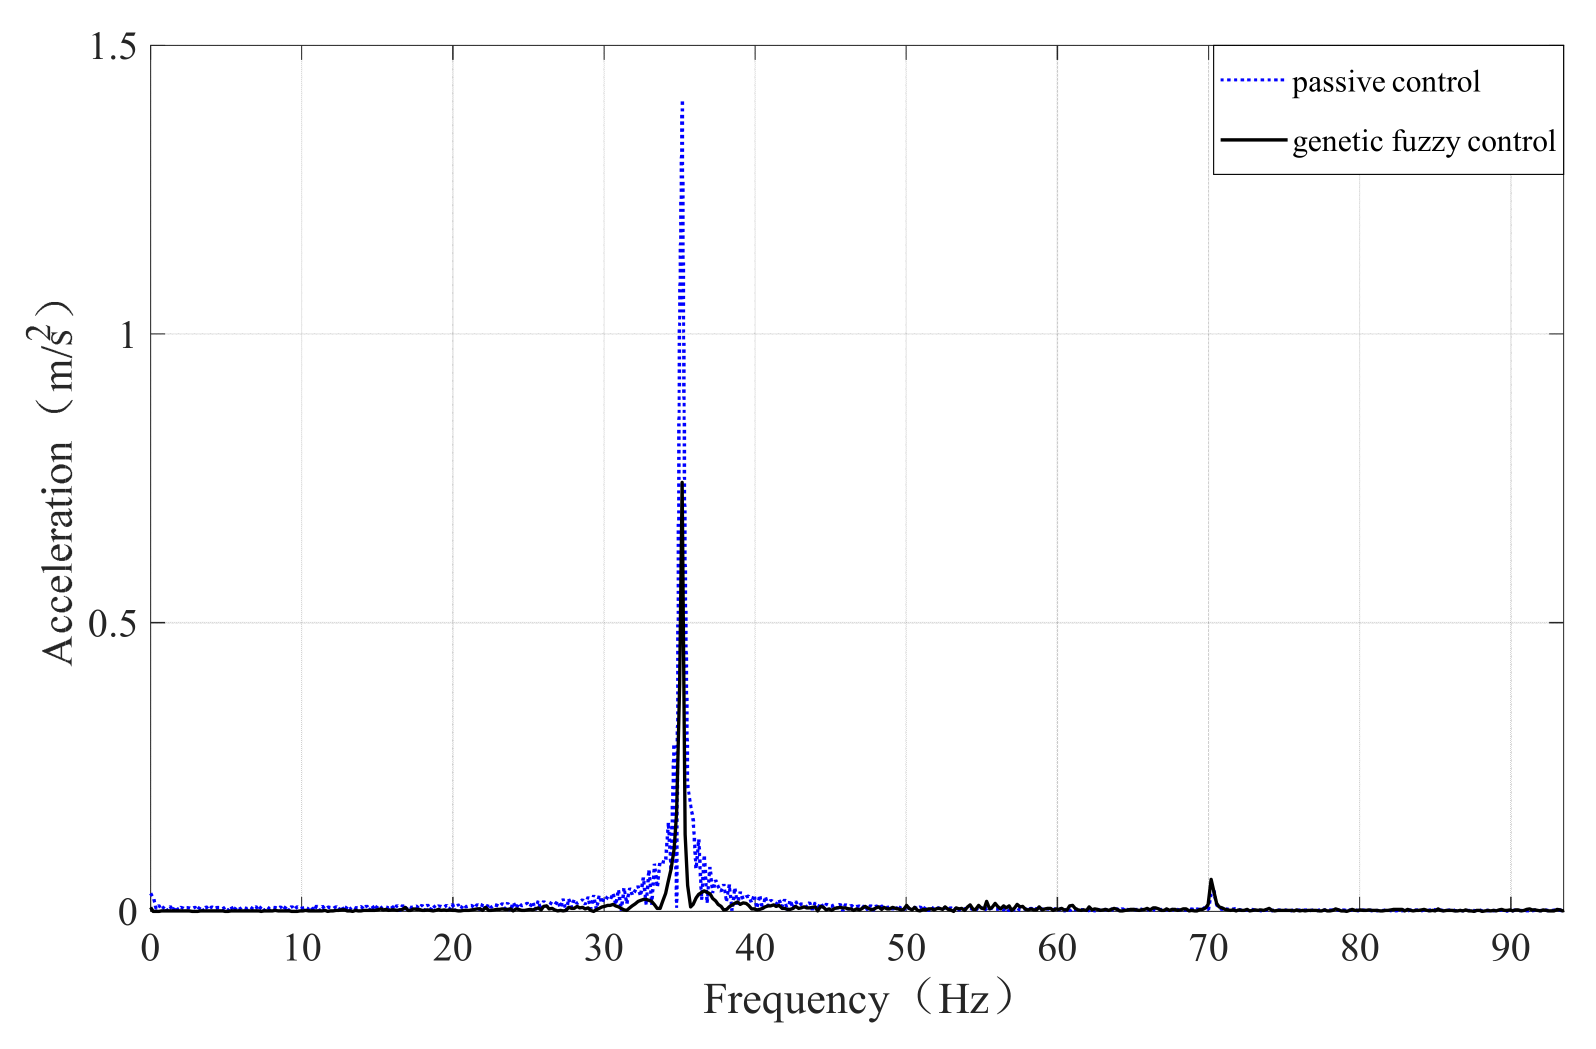
It can be observed from Figure 16 and Figure 17 that a different trend emerges: as the frequency of the sinusoidal excitation generated by the electromagnetic exciter increases from 30 Hz to 35 Hz (with a constant amplitude of 1 m/s2), the acceleration amplitude measured by the acceleration sensor on the pipeline surface continuously rises, from 1.18 m/s2 to 1.73 m/s2, showing a significant increase compared with the preset excitation amplitude of 1 m/s2. This indicates that the base of the experimental platform for the large-scale marine hydraulic pipeline system undergoes a certain degree of resonance at 30 Hz, 35 Hz, resulting in the enhancement of the corresponding vibration amplitude. Nevertheless, the vibration amplitude still shows a significant reduction after the action of the fiber-reinforced MRE vibration isolator under the genetic fuzzy control strategy: at 30 Hz, the amplitude is reduced from 1.18 m/s2 to 0.81 m/s2, representing a reduction of approximately 31%; at 35 Hz, the amplitude is reduced from 1.41 m/s2 to 0.74 m/s2, with a reduction ratio of approximately 47%.

4.2. Experiment on Vibration Isolation Performance of the Fiber-Reinforced MRE Vibration Isolator Under No External Excitation

When ignoring the influence of the marine environment on the marine, the vibration borne by the large-scale marine hydraulic pipeline system mainly stems from two sources: one is the vibration caused by fluid–structure interaction) induced by the collision between the flowing fluid in the pipeline and the pipe wall, and the other is the vibration transmitted to the hydraulic pipeline system during the operation of the marine’s power equipment. Due to the limitations of the experimental environment, in the experiment designed in this study, the vibration of the large-scale marine hydraulic pipeline system under no external excitation mainly considers the fluid–structure interaction and the vibration transmitted from the hydraulic oil pump to the experimental pipeline.
As an excellent vibration damping material, the fiber-reinforced MRE smart material exhibits superior passive vibration damping performance due to the high damping characteristics of its matrix material without an external magnetic field. Meanwhile, its adjustable stiffness and damping properties enable it to possess outstanding vibration reduction capabilities in the field of active vibration isolation. First, the passive vibration damping performance of the fiber-reinforced MRE installed at the input end is analyzed, and the experimental results are illustrated in Figure 18 and Figure 19.
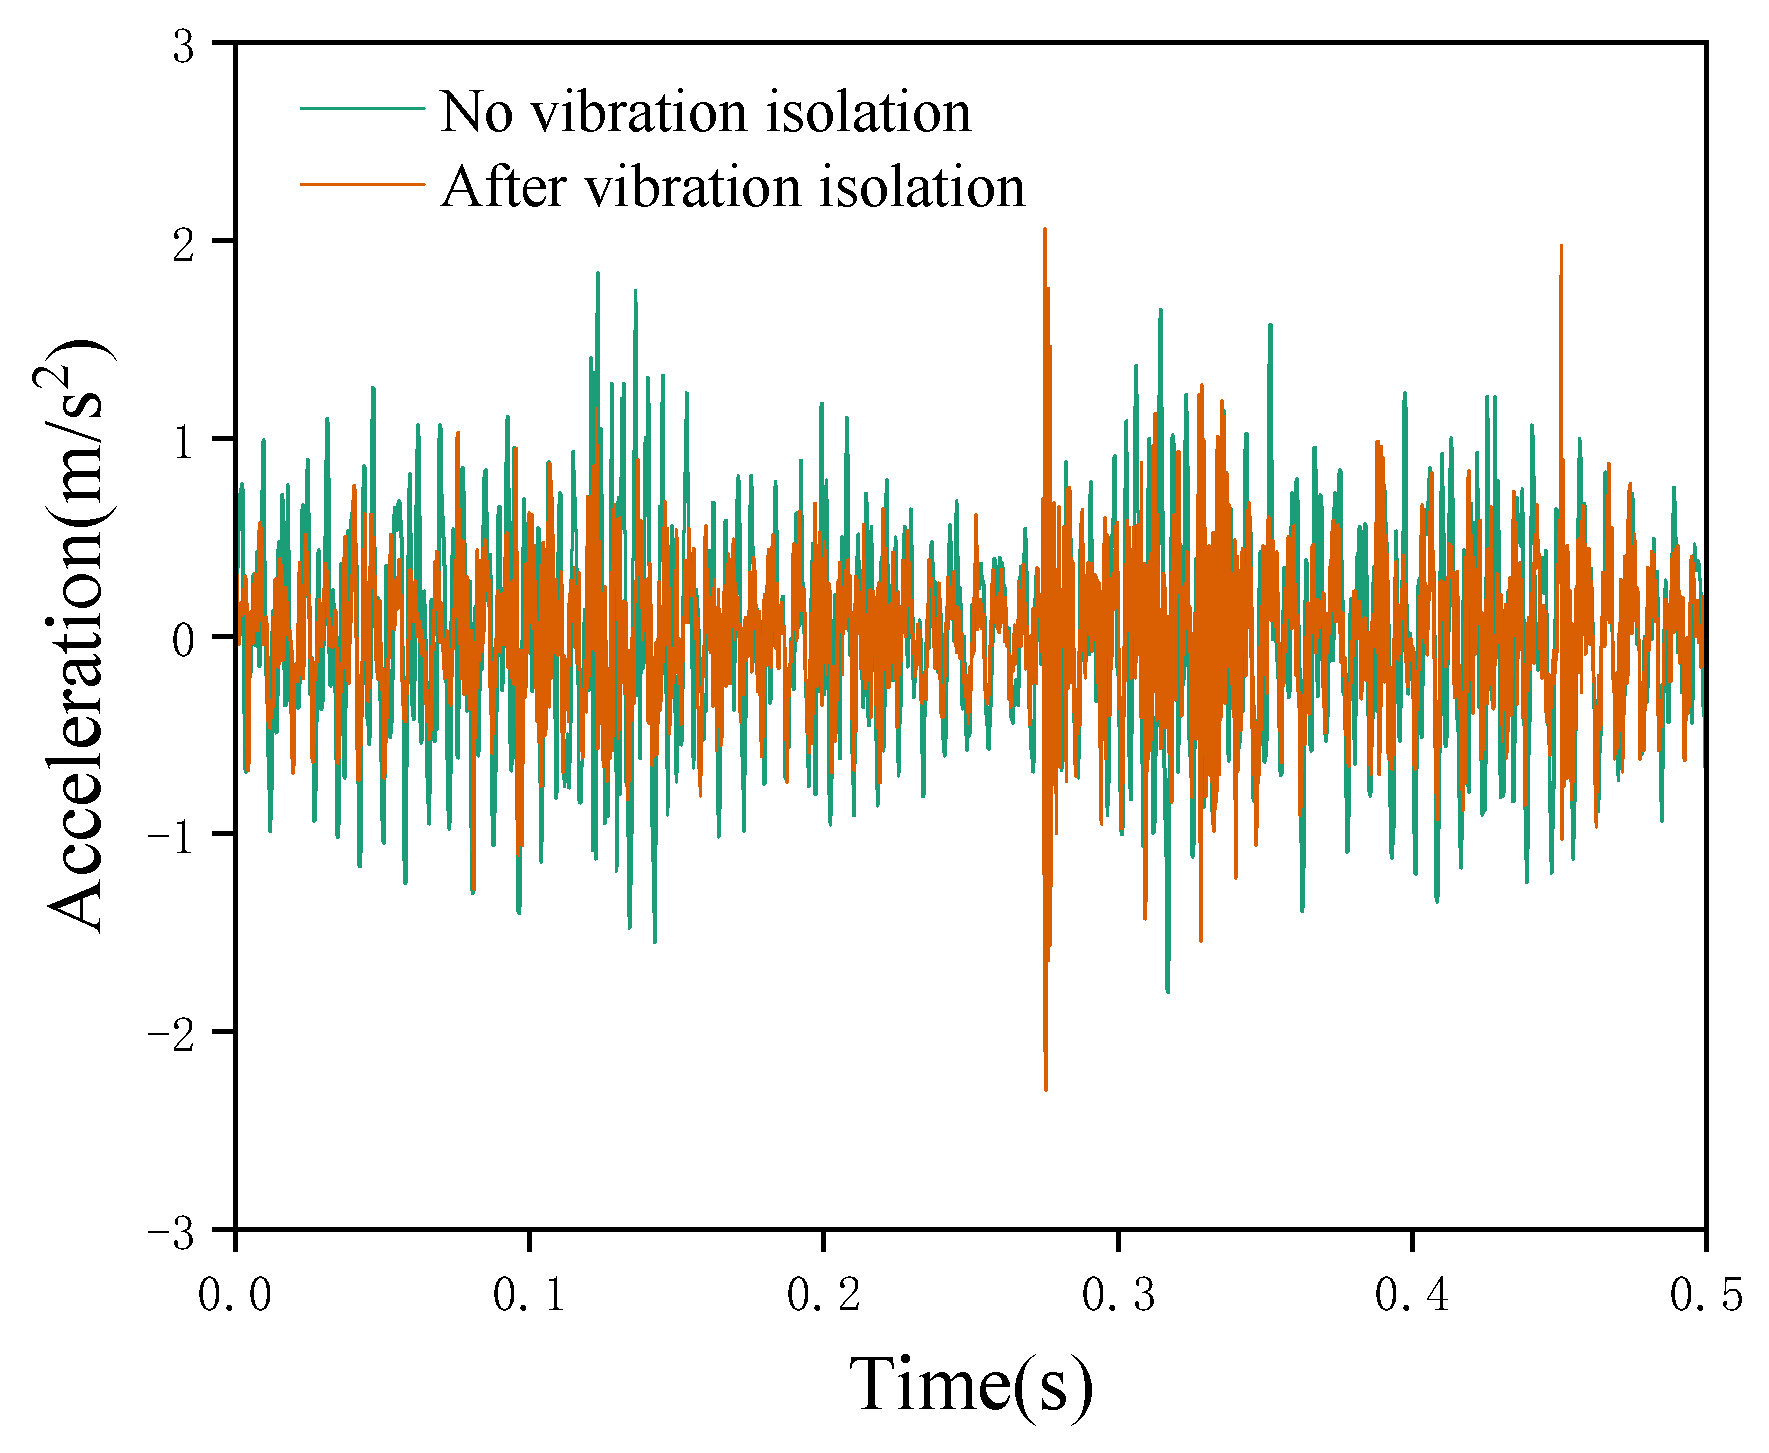
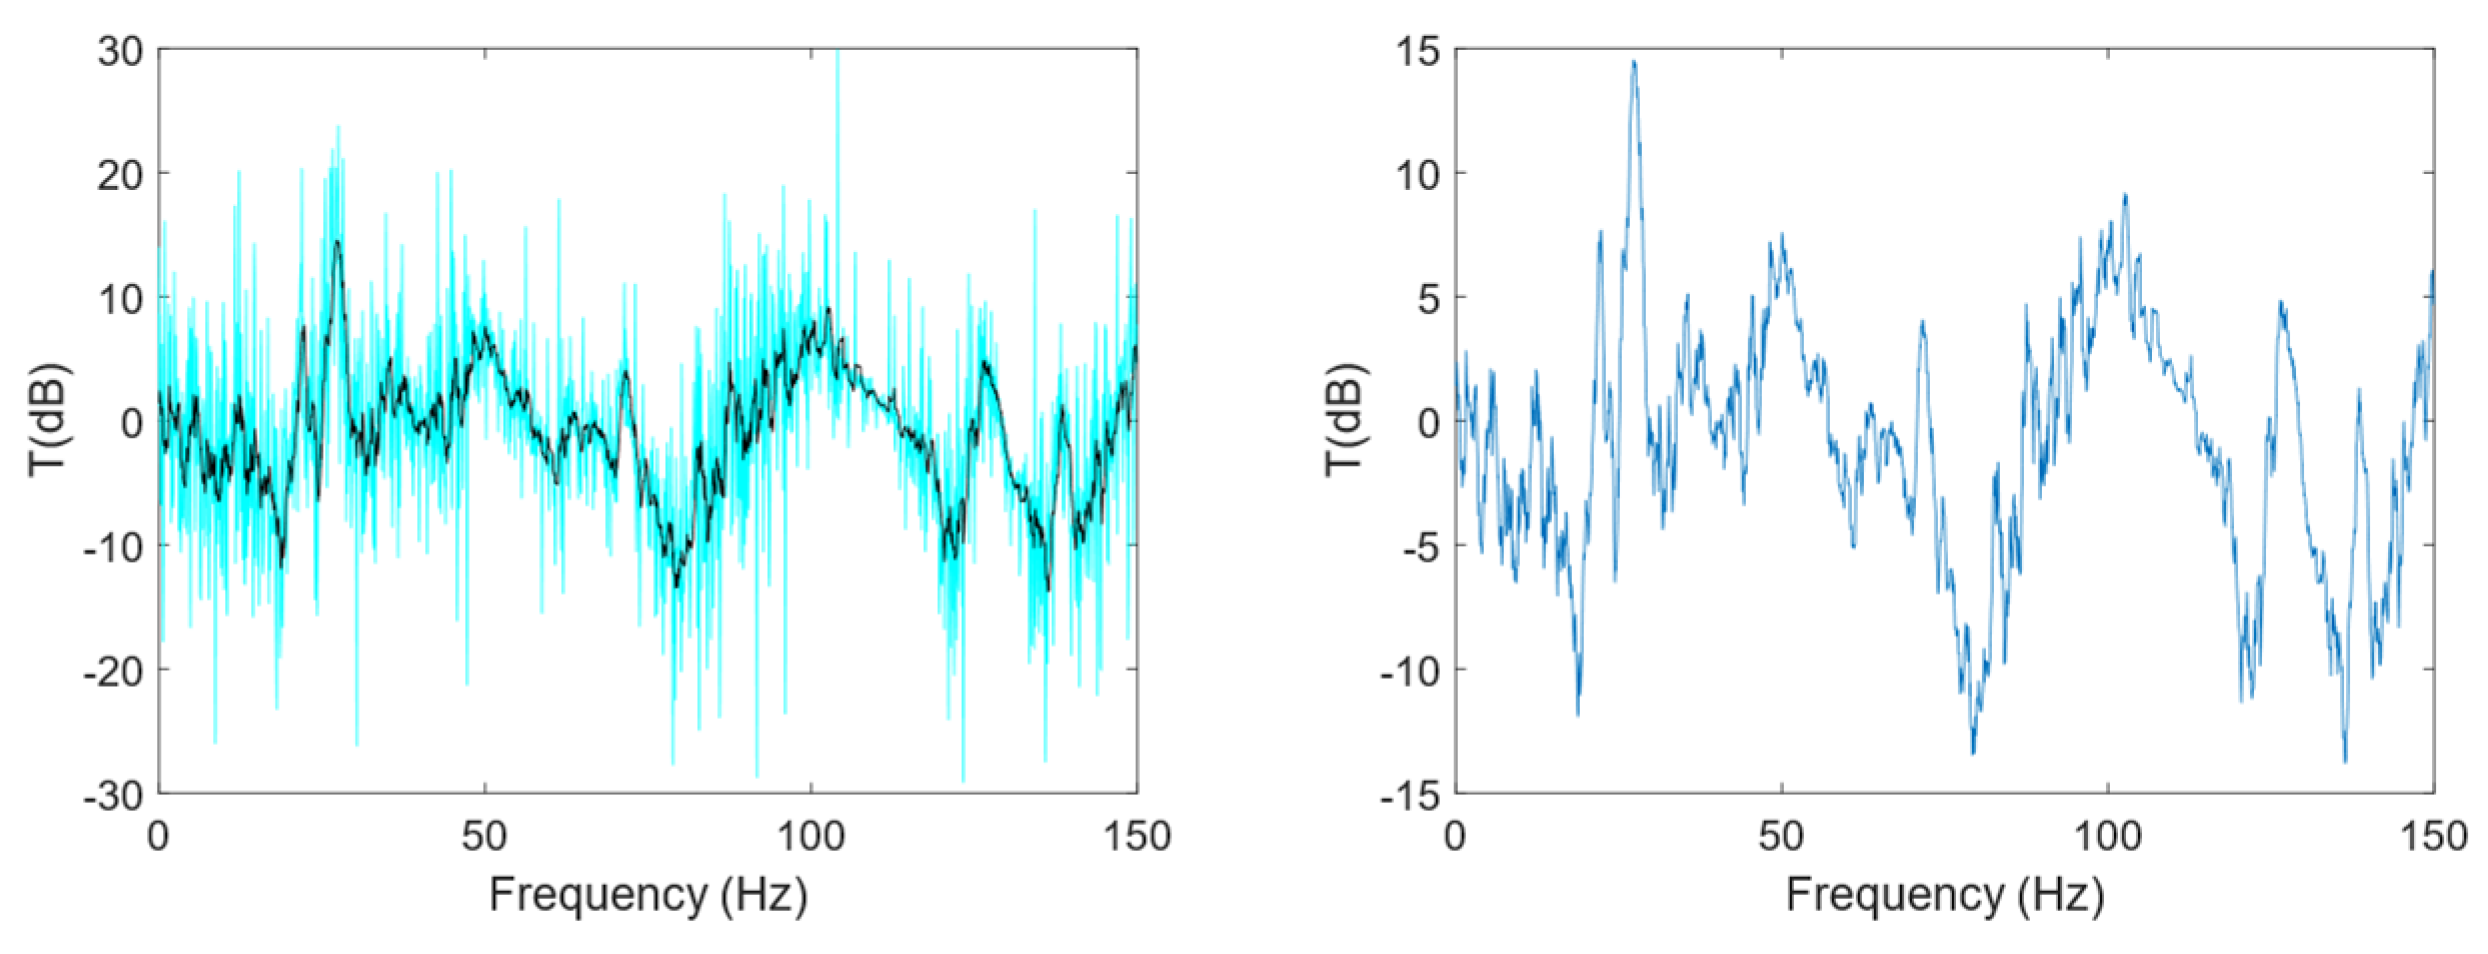
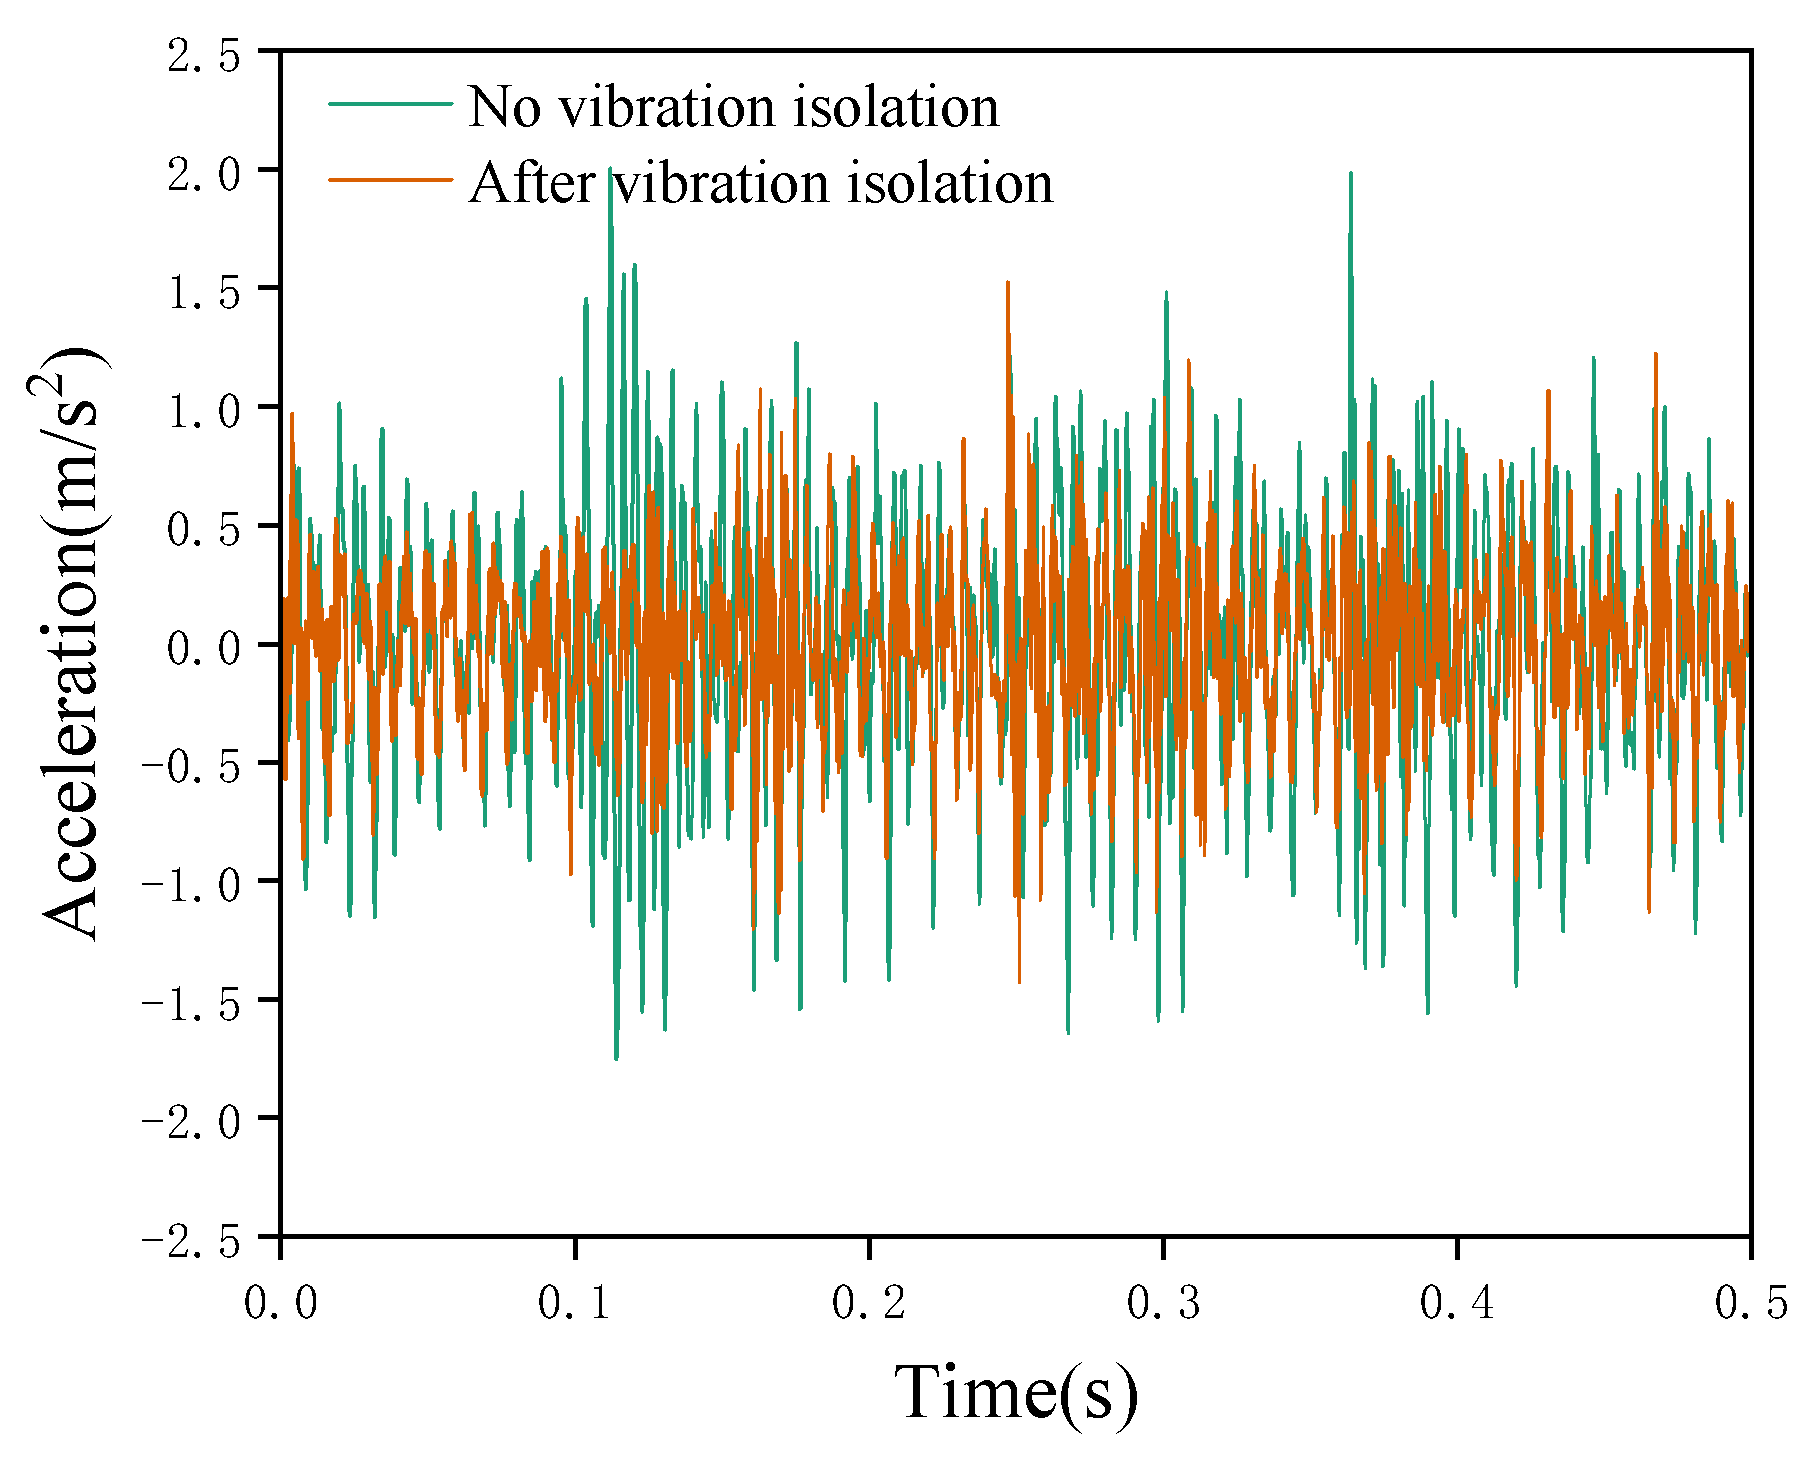
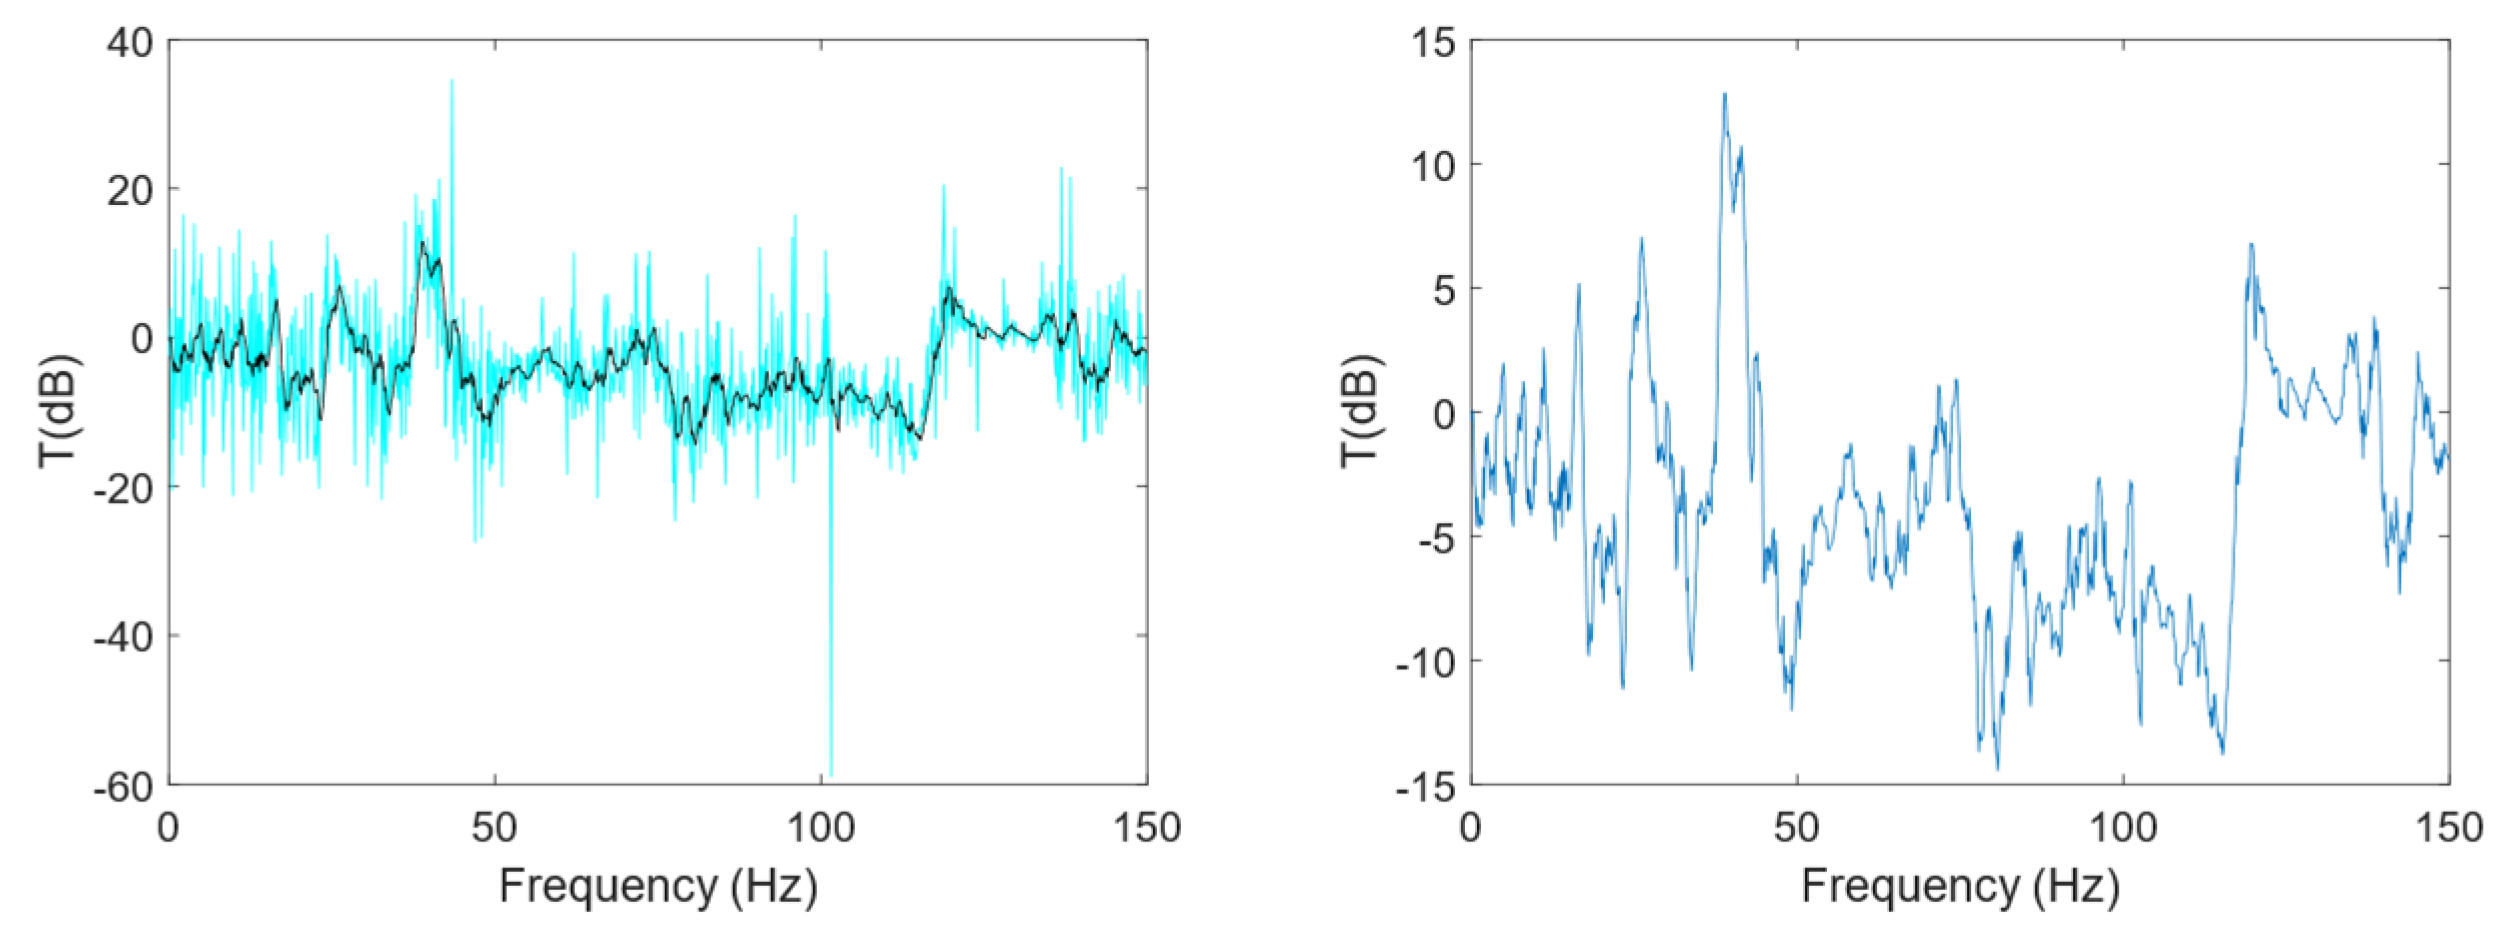
It can be observed from Figure 18 that the acceleration of the vibration isolator measured by the acceleration sensor attached to the pipeline surface is approximately 0.8 m/s2 after stabilization, while the data obtained by the sensor attached to the surface of the fiber-reinforced MRE vibration isolator is relatively smaller, around 0.6 m/s2, representing a reduction of approximately 25%. After filtering the measured acceleration sensor data, the vibration transmissibility was calculated using the processed data, yielding the results illustrated in Figure 19. The fiber-reinforced MRE vibration isolator exhibits favorable vibration isolation performance in the low-frequency range of 5–23 Hz, with a maximum attenuation of approximately 12 dB, though the effective vibration isolation frequency range is relatively narrow.
The passive vibration damping performance of the fiber-reinforced MRE installed at the suspended section is analyzed below, and the experimental results are presented in Figure 20 and Figure 21.
It can be observed from Figure 20 that the acceleration of the vibration isolator measured by the acceleration sensor attached to the pipeline surface is approximately 0.75 m/s2 after stabilization, while the data obtained by the sensor attached to the surface of the fiber-reinforced MRE vibration isolator is relatively smaller, around 0.42 m/s2, representing a reduction of approximately 44%. Compared with the input end, the vibration reduction efficiency has a relatively significant decrease. The possible reasons for this are that the vibration generated at this suspended section is inherently larger, and, in addition, the lack of support makes it more prone to resonance. After filtering the measured acceleration sensor data, the vibration transmissibility was calculated using the processed data, yielding the results illustrated in Figure 21. The fiber-reinforced MRE vibration isolator exhibits favorable vibration isolation performance in multiple frequency bands, including 5–23 Hz, 28–37 Hz, and 44–71 Hz, with a maximum attenuation of approximately 15 dB.
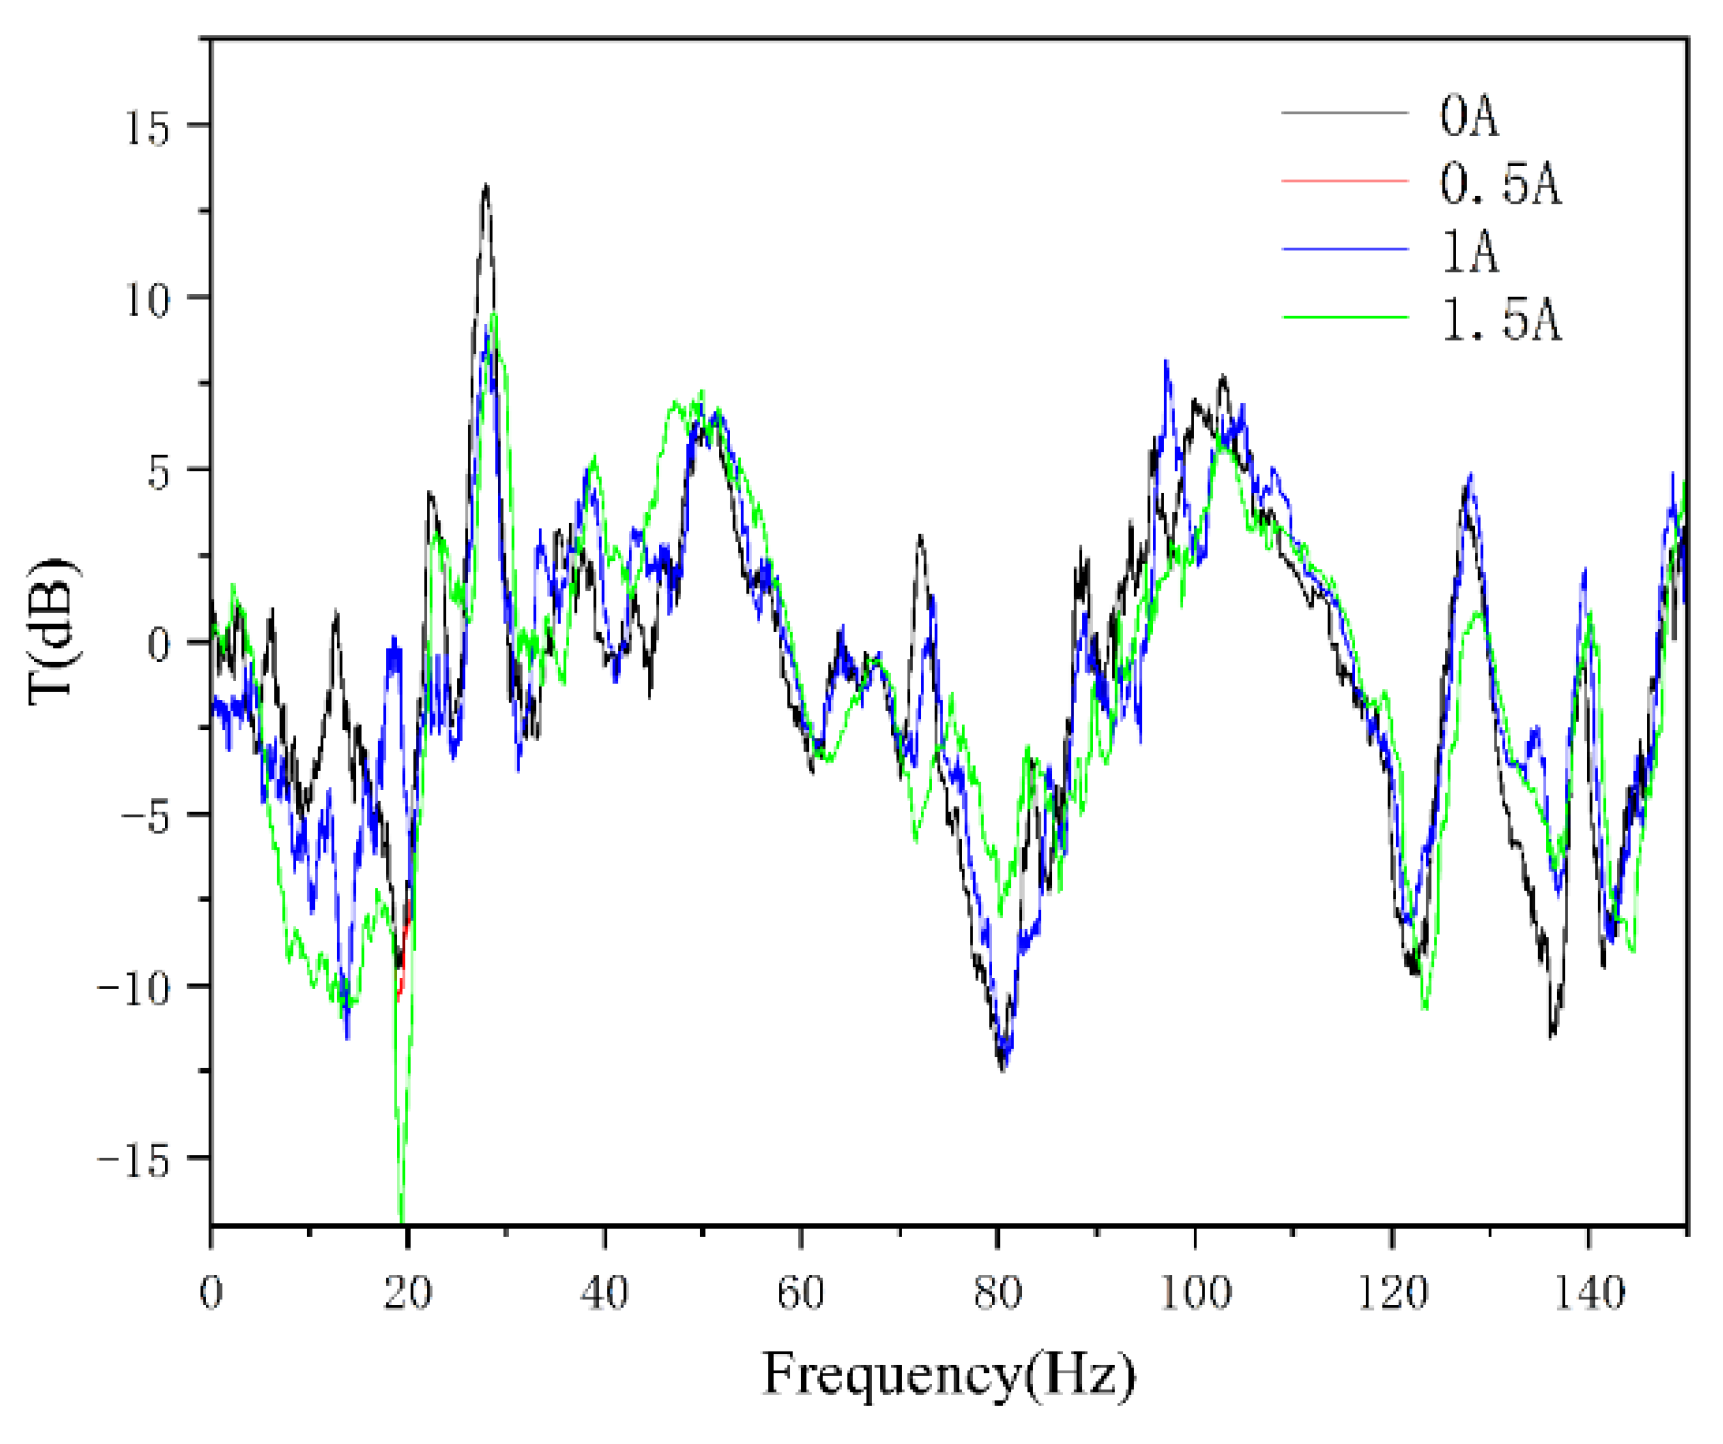
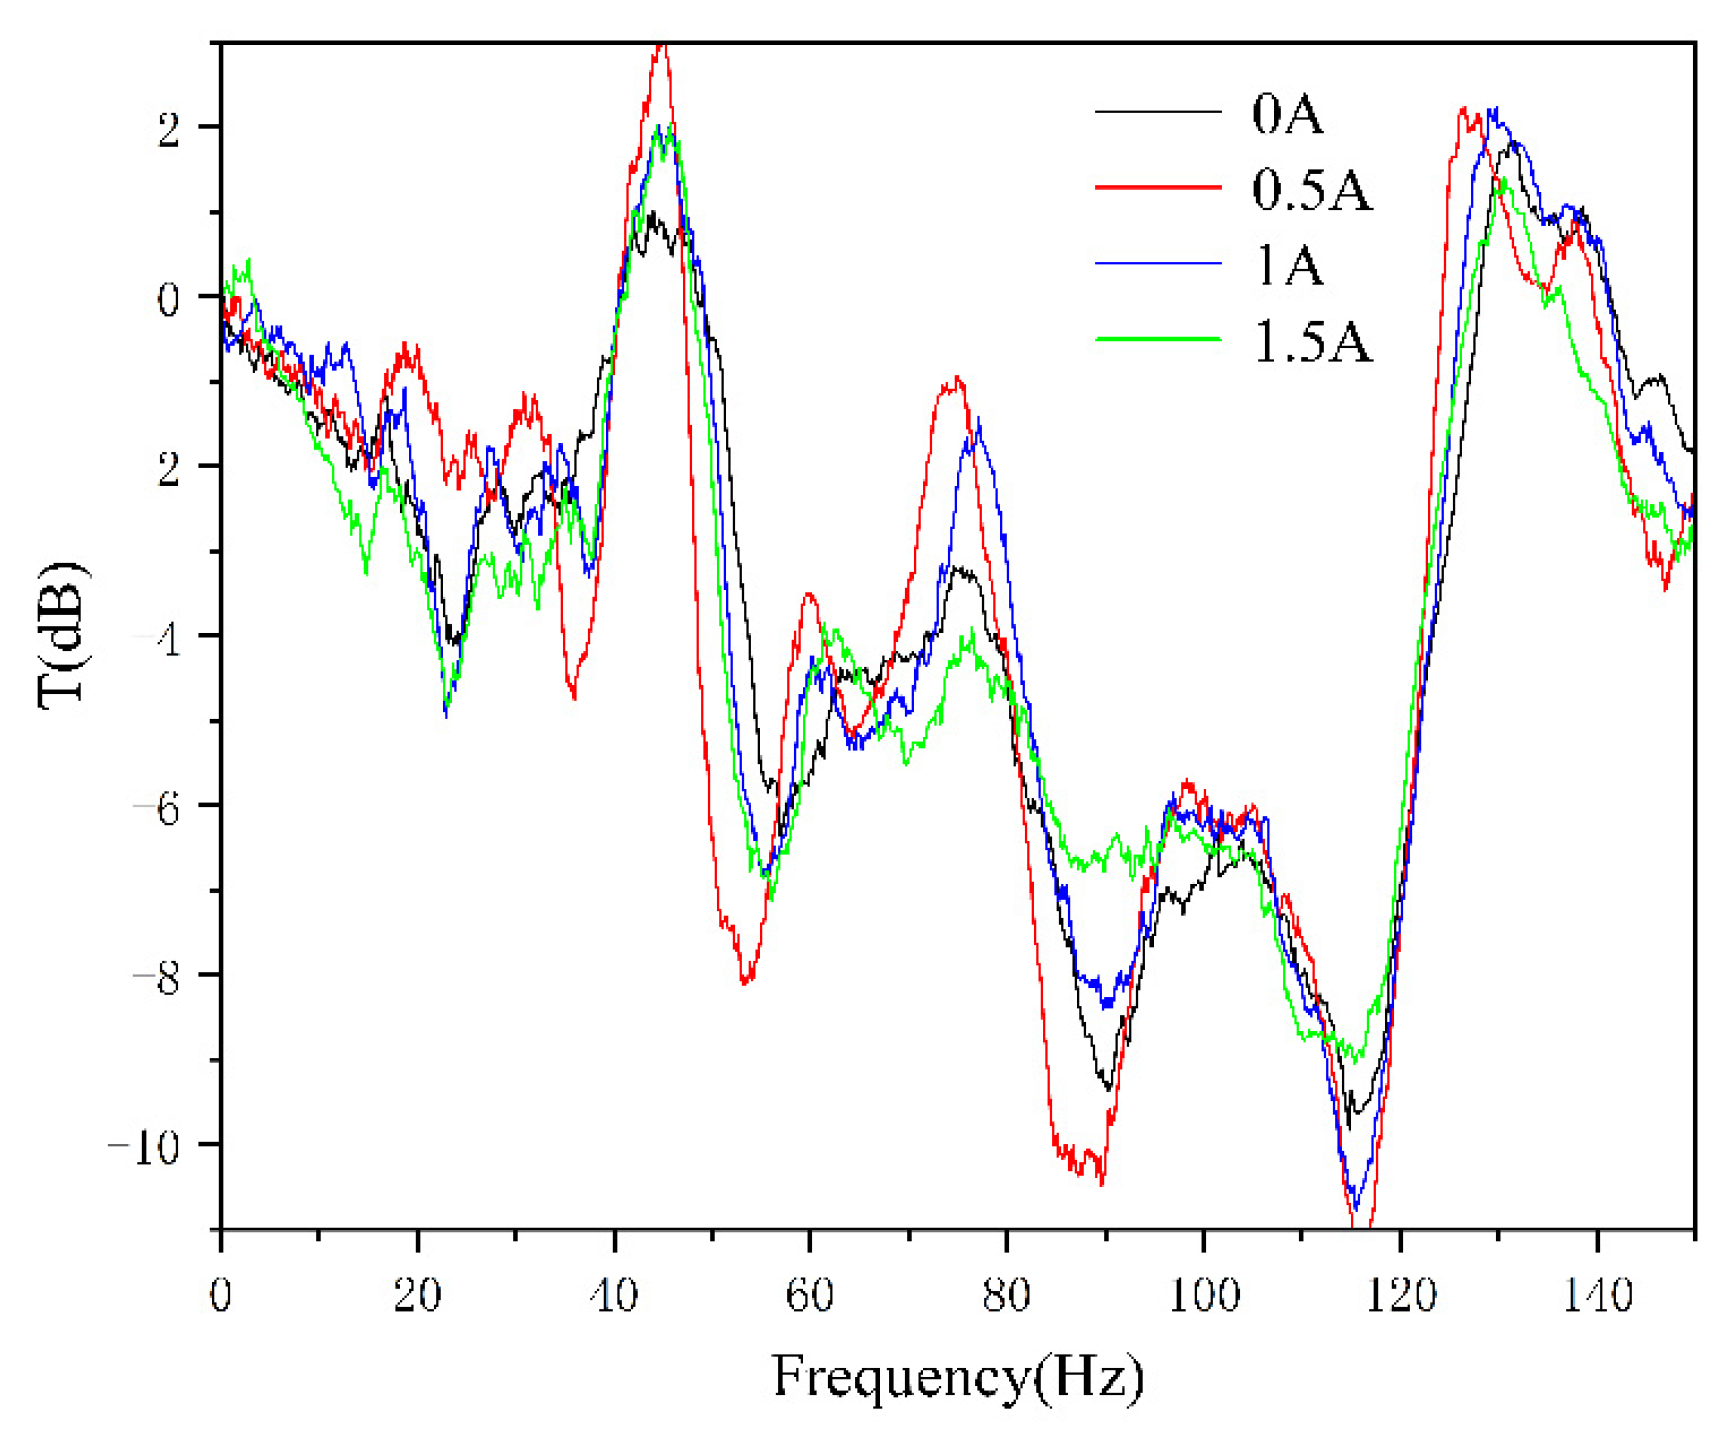
As the fiber-reinforced MRE material possesses adjustable stiffness and damping properties, it can achieve better vibration reduction effects in the field of vibration control by matching the corresponding stiffness and damping according to the actual vibration conditions. Herein, the vibration reduction effects of the fiber-reinforced MRE vibration isolator installed at the pipeline input end and the suspended section under different current conditions are analyzed, and the experimental results are presented in Figure 22 and Figure 23.
It can be inferred from the experimental analysis results in Figure 22 that, from the perspective of vibration reduction frequency, the vibration reduction bandwidth of the MRE vibration isolator has been enhanced, enabling effective vibration reduction within the frequency range of 5–25 Hz. Furthermore, as the operating current increases, the bandwidth is further expanded: when the current reaches 1.5 A, full-band vibration reduction is basically achieved even within the range of 0–50 Hz. However, when the applied current exceeds 1.5 A, the vibration reduction effect shows a downward trend—the vibration reduction amplitude increases while the bandwidth contracts. It can be inferred by referring to relevant literature that the MRE approaches its magnetic saturation intensity at a current of 1.5 A.
Tests were conducted on the single-layer MRE vibration isolator to evaluate its vibration isolation performance at the suspended section of the straight pipe, and the results are illustrated in Figure 23. From the perspective of vibration reduction frequency, the vibration reduction bandwidth of the MRE vibration isolator has been improved, enabling effective vibration reduction within the frequency range of 2–36 Hz. Furthermore, as the operating current increases, the bandwidth is further expanded: when the current reaches 1.5 A, full-band vibration reduction is basically achieved even within the range of 0–100 Hz, with only slight vibration amplification near 50 Hz and the frequency range of this amplification being relatively narrow. However, when the applied current exceeds 1.5 A, the vibration reduction effect shows a downward trend—the vibration reduction amplitude increases while the bandwidth contracts. It can be inferred by referring to relevant literature that the MRE approaches its magnetic saturation intensity at a current of 1.5 A.

4.3. Results and Discussion

In order to verify the vibration reduction advantages of the fiber-reinforced MRE absorber designed in this paper under genetic fuzzy control, the experimental results of this paper were compared with the vibration reduction performance of the absorber in the reference literature, mainly comparing its vibration reduction ability in the low-frequency stage within 100 Hz. The results are shown in Table 2. The results show that although traditional piezoelectric vibration reduction structures can achieve multi-frequency band vibration reduction, they all have wide vibration reduction blind spots (43–64 Hz, 50–63 Hz), and the effective vibration reduction starting frequency is relatively high (≥18 Hz). Electromagnetic actuators can only cover the mid-to-high frequency range of 52–100 Hz and cannot suppress low-frequency vibrations below 52 Hz. Although the MRE absorber achieves continuous vibration reduction of 16~88 Hz, there is still a vibration reduction gap in the ultra-low frequency range below 16 Hz and the 88~100 Hz frequency range, with a total vibration reduction bandwidth of 72 Hz. In contrast, the vibration reduction structure proposed in this paper shows significant advantages in two core performance indicators: firstly, it greatly expands the minimum frequency of effective vibration reduction to 2 Hz, solving the common problem of poor vibration reduction effect in the ultra-low frequency range (<10 Hz) of traditional technology; secondly, the total effective damping bandwidth reaches 86 Hz, which is 19.4% higher than the MRE absorber with the best performance, and 70~83% higher than the piezoelectric and electromagnetic solutions; In addition, the structure only has a narrowband damping blind zone of 11 Hz between 37 and 47 Hz, almost covering the entire low-frequency range of 2–100 Hz. The above results indicate that the vibration reduction structure proposed in this paper is superior to existing mainstream technologies in terms of ultra-low frequency coverage capability and broadband vibration reduction characteristics, and has important application value in engineering scenarios such as ship hydraulic pipelines where there are a large number of low-frequency line spectrum vibrations.

5. Conclusions

Based on the vibration characteristics of large-scale marine hydraulic pipeline systems, this study designed a pipeline-specific fiber-reinforced MRE vibration isolator using fiber-reinforced MRE smart materials. Meanwhile, a fuzzy control strategy with parameter optimization via genetic algorithms was proposed. The vibration isolation effect of the fiber-reinforced MRE vibration isolator on the pipeline experimental platform was systematically investigated through simulations and experiments. The specific conclusions are as follows:
(1) Under single-frequency excitation conditions, the fiber-reinforced MRE vibration isolator exhibits a certain level of passive vibration isolation capability due to the excellent mechanical properties of the smart material itself, but its vibration isolation performance is relatively limited with an amplitude attenuation of approximately 17%. However, under the action of the genetic fuzzy control strategy, the vibration isolation capability of the fiber-reinforced MRE vibration isolator is significantly improved under 25 Hz, 30 Hz, and 35 Hz single-frequency excitations, achieving an average amplitude attenuation of 35%—representing a twofold improvement compared with its passive vibration isolation performance.
(2) Due to the different vibration characteristics between the input end and the suspended section of the hydraulic pipeline, the fiber-reinforced MRE vibration isolator exhibits certain differences in vibration isolation performance at these two positions. At the input end, the fiber-reinforced MRE vibration isolator achieves favorable vibration isolation performance in the low-frequency range of 5–23 Hz, with a maximum attenuation of approximately 12 dB, though the effective vibration isolation frequency range is relatively narrow. In contrast, at the suspended section, the fiber-reinforced MRE vibration isolator demonstrates excellent vibration isolation performance across multiple frequency bands, including 5–23 Hz, 28–37 Hz, and 44–71 Hz, with a maximum attenuation of around 15 dB. Notably, it exhibits a significant improvement in vibration isolation performance at the position with intense vibration.
(3) Based on the characteristic that the stiffness and damping properties of fiber-reinforced MRE can be adjusted with the application of an external magnetic field, this study investigated the variations in the vibration isolation performance of the fiber-reinforced MRE vibration isolator under different current conditions. As the operating current increases, the vibration isolation effect is improved and the vibration isolation bandwidth is further expanded. When the current reaches 1.5 A, full-band vibration isolation is basically achieved even within the range of 0–100 Hz.

Author Contributions

X.M.: Laboratory bench construction Data Curation, Writing—Original Draft; C.S.: Conceptualization, Methodology, Investigation. Y.J. (Youliang Jiang) is responsible for supervising the completion of the paper and revising the manuscript, while Y.J. (Yang Jiang) assists in completing the experiments and writing the manuscript. All authors have read and agreed to the published version of the manuscript.

Funding

The author(s) disclosed receipt of the following financial support for the research, author, and/or publication of this article: This work was supported by the National Key Research and Development Program Project of China (No.2024YFB3410002).

Institutional Review Board Statement

Not applicable.

Informed Consent Statement

Not applicable.

Data Availability Statement

The data that were generated and analyzed in this paper are available from the corresponding author upon request.

Acknowledgments

The authors declare that they have no known competing financial interests or personal relationships that could have appeared to influence the work reported in this paper.

Conflicts of Interest

The authors declare no conflicts of interest.

References

  1. Sayfullin, I.S.; Ukrainskii, L.E. Protecting Pipeline Systems from Vibration and Hydraulic Shocks. J. Mach. Manuf. Reliab. 2018, 47, 495–499. [Google Scholar] [CrossRef] [Scilit]
  2. Liu, W.; Zhu, H.; Li, W. Dynamic characteristics analysis of complex aircraft pipeline system using MDSMA algorithm. Multidiscip. Model. Mater. Struct. 2022, 18, 537–561. [Google Scholar] [CrossRef] [Scilit]
  3. Ty, P.; Pavel, A.T.; Avshalom, G. An Analytical Expression for the Fundamental Frequency of a Long Free-Spanning Submarine Pipeline. Mathematics 2023, 11, 4481. [Google Scholar] [CrossRef] [Scilit]
  4. Ty, P.; Pavel, A.T.; Alon, U.; Avshalom, G. Computational Investigation of Long Free-Span Submarine Pipelines with Buoyancy Modules Using an Automated Python—Abaqus Framework. Mathematics 2025, 13, 1387. [Google Scholar] [CrossRef] [Scilit]
  5. Ma, H.; Long, Y.; Li, X.; Zhong, M.; Yin, Q.; Xie, Q. Attenuation and Time-Frequency Characteristics of Explosion Ground Vibration of Shallow Buried OD1422-X80mm-12 MPa Pipeline Based on Prototype Experiment. J. Perform. Constr. Facil. 2020, 34, 04019092. [Google Scholar] [CrossRef] [Scilit]
  6. Wang, X.; Zhou, Z.; Liu, X. Numerical Analysis of the Vibration of Pipes Conveying Fluid under the Influence of Vertical Branch. Adv. Mater. Res. 2013, 2300, 620–624. [Google Scholar] [CrossRef] [Scilit]
  7. Lu, G.; Wang, Z.; Fan, L.; Gu, Y.; Xu, J.; Wu, Y.; Xiao, Y. Research on the pressure fluctuations and hydraulic resonance phenomena in the high-pressure pipelines of marine common rail systems. Energy 2024, 313, 133975. [Google Scholar] [CrossRef] [Scilit]
  8. Shoaib, M.; Pang, W.; Li, F. Vibration reduction of pipes conveying fluid with periodic inertial amplification mechanisms. Waves Random Complex Media 2024, 34, 2089–2104. [Google Scholar] [CrossRef] [Scilit]
  9. Cheer, J.D.S. Broadband active control of noise and vibration in a fluid-filled pipeline using an array of non-intrusive structural actuators. In Proceedings of the 15th INTER—NOISE and NOISE—CON Congress and Conference Proceedings, San Francisco, CA, USA; Institute of Noise Control Engineering: Wakefield, MA, USA, 2015; Volume 250, pp. 3492–3501. Available online: https://ince.publisher.ingentaconnect.com/contentone/ince/incecp/2015/00000250/00000003/art00017 (accessed on 5 May 2026).
  10. Jiao, Z.; Chen, P.; Hua, Q.; Wang, S. Theoretical Study on Active Vibration Control of Hydraulic Energy Pipeline System. J. Beijing Univ. Aeronaut. Astronaut. 2002, 4, 465–469. [Google Scholar] [CrossRef]
  11. Shuai, Z. Experimental Study on Active Control of Pressure Pulsation in Liquid Filled Pipelines. Master’s Thesis, Harbin Engineering University, Harbin, China, 2006. [Google Scholar]
  12. Li, W.; Zhang, H.; Liu, Z.; Mo, X.; Yang, T. Experimental study on active vibration absorption technology for marine pipeline vibration. Noise Vib. Control 1998, 6, 10–13. [Google Scholar]
  13. Li, W.; Zhang, H.; Yang, T.; Liu, Z.; Zhang, T. Experimental study on semi-active control technology for marine pipeline vibration. J. Harbin Eng. Univ. 1999, 3, 11–15. [Google Scholar]
  14. Wang, Y.; Liu, Q.; Yu, W.; Cheng, G. A Vibration Signal-Based Active Noise Control Method for Liquid-Filled Pipelines. Sensors 2025, 25, 463. [Google Scholar] [CrossRef] [Scilit] [PubMed]
  15. Tian, R. Research on Control Method of Magnetorheological Elastic Pipeline Absorber. Master’s Thesis, Chongqing University, Chongqing, China, 2022. [Google Scholar]
  16. Paul, M. Interior Point Methods in Optimal Control Problems of Affine Systems: Convergence Results and Solving Algorithms. SIAM J. Control Optim. 2023, 61, 3390–3414. [Google Scholar] [CrossRef] [Scilit]
  17. Kowalewski, E.K.; Preisser, J.S.; Koch, G.G. Methods for Comparing Two Treatments for a Dichotomous Outcome for a Two-Period Design with Treatment Switching of Control Group Period 1 Nonresponders. In Biostatistics in Biopharmaceutical Research and Development; Springer Nature: Cham, Switzerland, 2024; pp. 317–361. [Google Scholar] [CrossRef] [Scilit] [PubMed]
  18. Zhang, Y.; Sun, W.; Zhang, H.; Du, D.; Xu, K. Active vibration control of fluid-conveying pipelines: Theoretical and experimental studies. Int. J. Mech. Sci. 2024, 270, 109106. [Google Scholar] [CrossRef] [Scilit]
  19. Bathaei, A.; Zahrai, S.M. Improving semi-active vibration control of an 11-story structure with non-linear behavior and floating fuzzy logic algorithm. Structures 2022, 39, 132–146. [Google Scholar] [CrossRef] [Scilit]
  20. Song, C.; Hu, Y. Optimized Fuzzy Neural Networks Control of a Magnetic Suspension Vibration Isolation System. Appl. Mech. Mater. 2012, 2031, 328–334. [Google Scholar] [CrossRef] [Scilit]
  21. Mostafa, K.; Markazi, A.H.D. Control of input delayed pneumatic vibration isolation table using adaptive fuzzy sliding mode. Lat. Am. J. Solids Struct. 2019, 12, 1525–1539. [Google Scholar] [CrossRef] [Scilit]
  22. Xing, X.; Chen, Z.; Feng, Z. A Variable Stiffness and Damping Control Strategy for Improving Vibration Isolation Performances in Low-Frequency Excitation. J. Vib. Eng. Technol. 2022, 11, 1595–1608. [Google Scholar] [CrossRef] [Scilit]
  23. Shin, Y.; Moon, S.; Jung, W.; Bae, S. Experimental Approach to Active Mounts Using Electromagnetic Actuator and Rubber with Consideration of Shock Resistance for Naval Marineboard Equipment. Shock Vib. 2019, 2019, 3958359. [Google Scholar] [CrossRef] [Scilit]
  24. Metered, H.; Elsawaf, A. Active vibration control of agriculture tractor suspension using optimised feedback controller. Int. J. Heavy Veh. Syst. 2019, 26, 790–804. [Google Scholar] [CrossRef] [Scilit]
  25. Gao, Z.; Shao, M.; Wang, Y.; Zhu, X. Hybrid DE-Jaya Optimized Variable Step-Size and Tap-Length Adaptive Filtering Control Algorithm Active Micro-vibration Control with Piezoelectric Stack Actuator. J. Vib. Eng. Technol. 2021, 10, 887–896. [Google Scholar] [CrossRef] [Scilit]
  26. Uyar, M.; Malgaca, L. Implementation of Active and Passive Vibration Control of Flexible Smart Composite Manipulators with Genetic Algorithm. Arab. J. Sci. Eng. 2022, 48, 3843–3862. [Google Scholar] [CrossRef] [Scilit]
  27. Yang, J.; Jiao, S.; Long, X. Research on Active Vibration Isolation Platform Based on Feedback FxLMS Robust Hybrid Control Algorithm. Vib. Shock 2024, 43, 59–67. [Google Scholar] [CrossRef]
  28. Zhong, C.; Huang, Z.; Li, W.; Fu, J.; Han, J. Research on adaptive PI control of precision platform magnetic sensitive intelligent isolation system. Vib. Shock 2024, 43, 232–237+302. [Google Scholar] [CrossRef]
  29. Hazim, A.; Edina, K.; Károly, J.; Luay, S.; Zaid, A. Hybrid fertilized particle swarm optimization for engineering design with application to vibration control. Appl. Soft Comput. 2026, 198, 115270. [Google Scholar] [CrossRef] [Scilit]
  30. Hameury, C.; Amabili, M. Active vibration control of a curved sandwich beam using a nonlinear PPF algorithm. Compos. Struct. 2025, 367, 119271. [Google Scholar] [CrossRef] [Scilit]
  31. Ma, X.; Song, C. Design and Vibration Characteristics Analysis of Marine Hydraulic Pipelines Under Multi-Source Excitation. Machines 2025, 13, 859. [Google Scholar] [CrossRef] [Scilit]
  32. Ma, X.; Song, C.; Jiang, Y.; Jiang, Y. A pre-magnetized carbon fiber reinforced magnetorheological elastomer. J. Magn. Magn. Mater. 2025, 629, 173263. [Google Scholar] [CrossRef] [Scilit]
  33. Wang, J.; Dong, X.; Barry, O.R.; Okwudire, C. Friction-induced instability and vibration in a precision motion stage with a friction isolator. J. Vib. Control 2022, 28, 1879–1893. [Google Scholar] [CrossRef] [Scilit]
  34. Qi, S.; Yu, M.; Fu, J.; Zhu, M. Stress relaxation behavior of magnetorheological elastomer: Experimental and modeling study. J. Intell. Mater. Syst. Struct. 2018, 29, 205–213. [Google Scholar] [CrossRef] [Scilit]
  35. Dong, L.; Hu, Y. Self-tuning control of steam sterilizer temperature based on fuzzy PID and IPSO algorithm. J. Meas. Eng. 2024, 12, 638–655. [Google Scholar] [CrossRef] [Scilit]
  36. Siavashi, M. Experimental optimal control of servo-pneumatic with sliding mode and GA-fuzzy-PID-PWM. J. Mechatron. Artif. Intell. Eng. 2024, 5, 199–214. [Google Scholar] [CrossRef] [Scilit]
Figure 1. Structural schematic of the fiber-reinforced MRE vibration isolator.
Jmse 14 01147 g001
Figure 2. Mechanical model of the fiber-reinforced MRE vibration isolator.
Jmse 14 01147 g002
Figure 3. Relationship of curve between amplitude ratio and forced vibration frequency ratio.
Jmse 14 01147 g003
Figure 4. Influence of quality ratio on amplitude ratio curve.
Jmse 14 01147 g004
Figure 5. Influence of natural frequency ratio on amplitude ratio curve.
Jmse 14 01147 g005
Figure 6. Influence of damping ratio on amplitude ratio curve.
Jmse 14 01147 g006
Figure 7. Fuzzy control principle diagram.
Jmse 14 01147 g007
Figure 8. Fuzzy controller design for fiber-reinforced MRE isolator.
Jmse 14 01147 g008
Figure 9. Feedback fuzzy control system model of fiber-reinforced MRE isolator.
Jmse 14 01147 g009
Figure 10. Simulation diagram of genetic fuzzy control.
Jmse 14 01147 g010
Figure 11. 25 Hz simulation results.
Jmse 14 01147 g011
Figure 12. 30 Hz simulation results.
Jmse 14 01147 g012
Figure 13. 35 Hz simulation results.
Jmse 14 01147 g013
Figure 14. Layout of single-frequency disturbance fuzzy control experimental platform.
Jmse 14 01147 g014
Figure 15. The 25 Hz amplitude frequency vibration curve.
Jmse 14 01147 g015
Figure 16. The 30 Hz amplitude frequency vibration curve.
Jmse 14 01147 g016
Figure 17. The 35 Hz amplitude frequency vibration curve.
Jmse 14 01147 g017
Figure 18. Time domain diagram of fiber-reinforced MRE isolator before and after vibration isolation.
Jmse 14 01147 g018
Figure 19. Vibration isolation effect of fiber-reinforced MRE isolator.
Jmse 14 01147 g019
Figure 20. Time domain diagram of fiber-reinforced MRE isolator before and after vibration isolation.
Jmse 14 01147 g020
Figure 21. Vibration isolation effect of fiber-reinforced MRE isolator.
Jmse 14 01147 g021
Figure 22. Vibration transmission curve of input fiber-reinforced MRE isolator.
Jmse 14 01147 g022
Figure 23. Vibration transmission curve of suspended section fiber-reinforced MRE isolator.
Jmse 14 01147 g023
Table 1. Fuzzy controller control rules table.
TheEC
NBNSZEPSPB
ENBPBPBPSZEZE
NSPBPSPSZEZE
ZEPSPSZENSNS
PSPSZENSNSNB
PBZEZENSNBNB
Table 2. Comparison of vibration reduction performance of different structures.
Structural TypeVibration Reduction Frequency (<100 Hz)Vibration Reduction Bandwidth
Piezoelectric actuator [9]18~42 Hz, 65~93 Hz52 Hz
piezoelectric ceramic [10]23~49 Hz, 64~85 HZ47 Hz
Electromagnetic actuator [12,13]52~100 Hz48 Hz
MRE absorber [15]16~88 Hz72 Hz
This paper2~36 Hz, 48~100 Hz86 Hz
Disclaimer/Publisher’s Note: The statements, opinions and data contained in all publications are solely those of the individual author(s) and contributor(s) and not of MDPI and/or the editor(s). MDPI and/or the editor(s) disclaim responsibility for any injury to people or property resulting from any ideas, methods, instructions or products referred to in the content.